User login
Answers to Your Questions About Flu and Flu Vaccine
Although the 2011-2012 influenza season was milder than usual and associated with fewer outpatient visits, lower hospitalization rates, and fewer pediatric deaths, practitioners should be aware that this virus is still the leading cause of vaccine-preventable deaths in children. Hopefully, practitioners are already providing influenza immunization utilizing the 2012-2013 vaccine, which contains the same influenza A (H1N1) antigen as the 2011-2012 seasonal vaccine but new influenza A (H3N2) and B antigens: These are A/California/7/2009 (H1N1)–like antigen, A/Victoria/361/2011(H3N2)–like antigen, and B/Wisconsin/1/2010–like antigen.
Here are the answers to some of the most common questions related to this year’s influenza season:
• How many doses are recommended this year for children between 6 months through 8 years of age?
For a child in this age group who had two or more doses of seasonal vaccine since July 1, 2010, or in whom you can document one dose of a pandemic H1N1–containing vaccine and at least two seasonal vaccines from any season, only one dose is needed. All others in this age group should receive two doses. As always, those 9 years of age and older receive one dose of vaccine.
• Given recent data that suggested a slight increased risk of a febrile seizure following trivalent inactivated vaccine (TIV) in children less than 4 years, have vaccine recommendations changed?
A suggestion of an increased risk for febrile seizures in young children after TIV was noted in the United States in 2010-2011. This followed enhanced monitoring after the observation in Australia in 2010 of an association with an increased risk of febrile seizures (greater than or equal to nine per 1,000 doses) that were related to a particular influenza vaccine. (Afluria vaccine is approved for use in those greater than age 5 years, but current recommendations from the American Academy of Pediatrics and the Centers for Disease Control and Prevention’s Advisory Committee on Immunization Practices (ACIP) state this vaccine should not be used in those less than 9 years of age. It could be considered for a high-risk patient between 5 through 8 years if no alternative TIV is available and after discussion of the seizure risk with parents.)
To further study this potential association, the CDC tracked more than 200,000 children in the United States who received TIV or PCV13 (Prevnar) vaccine at different visits or both together at the same visit. Rarely, a febrile seizure was noted in children less than 5 years who got TIV or PCV13 vaccine given at separate visits. Those 12- to 23-month-olds who received both at the same visit had a slightly increased risk for an uncomplicated febrile seizure in the 24 hours following vaccine receipt. This is the age group where febrile seizures peak in general and is equivalent to one excess seizure for every 2,000-3,000 vaccine doses. Based on this low risk and the uncomplicated course in such patients, coupled with the benefits of immunization, both the AAP and ACIP recommended no change in either the TIV or PCV13 vaccine policies. And remember that neither a prior febrile seizure history nor a preexisting seizure disorder is considered a contraindication for influenza vaccine.
• Who can get the intradermal formulation of influenza vaccine?
Fluzone Intradermal, which made its debut in the 2011-2012 season, is licensed for those 18-64 years of age, and is a preservative-free, trivalent inactivated influenza vaccine. It comes in a prefilled microinjection syringe, which for those who require TIV and are needle averse, may be preferred. Local reactions seen with intramuscular TIV (with the exception of pain), including redness, swelling, and itching at the site seem to be a bit more common with the intradermal product, but such reactions abate in 3-7 days. This vaccine could be utilized in an older adolescent who might opt for a vaccine that has a needle that is 90% shorter than the needle used for intramuscular injection of TIV.
• Is oseltamivir still the drug of choice to treat influenza?
Last year only 1.4% of strains were resistant to oseltamivir, and this year is expected to be the same. Treatment and prophylaxis dosing is the same as last year. The AAP and ACIP continue to emphasize early treatment for all children in high-risk groups who develop influenza, regardless of influenza immunization status. Treatment is also recommended for all who are ill enough to require hospitalization. For patients with influenzalike illness, the decision to treat should not be based on rapid antigen testing results. A negative test does not "rule out" influenza as commercially available tests are not sufficiently sensitive. You might want to check with your hospital to find out what other influenza testing is available in your locale.
• Which of my "egg-allergic" patients can receive influenza vaccine?
Decision making related to TIV depends on the type of prior reaction the patient had. Those with mild reactions, defined as hives alone, may receive TIV followed by a 30-minute observation period. Use the same vaccine for those who require a second dose, if at all possible. Consult an allergist for those with severe reactions including cardiovascular changes, respiratory and/or gastrointestinal tract symptoms, or reactions that required the use of epinephrine. An algorithm is available from the CDC that can be used to guide decision making in such cases.
Dr. Jackson is the chief of infectious diseases at Children’s Mercy Hospitals and Clinics in Kansas City, Mo., and professor of pediatrics at the University of Missouri–Kansas City. She said she has no relevant financial disclosures. E-mail her at [email protected].
Development of the PRIS Network
Since the term hospitalist was coined in 1996,1 the field of hospital medicine has grown exponentially. Hospitalists are caring for increasing numbers of adultsincluding Medicare beneficiaries in hospitals across the United States.2 Pediatric hospital medicine has grown in parallel. By 1998, 50% of pediatric department chairs across the US and Canada had implemented hospitalist programs, with another 27% reporting they were soon to do so.3 A bit more than a decade later, pediatric hospitalists can be found in nearly every major academic medical center, and in a large proportion of community hospitals throughout the US and Canada.
In the past several years, major advances have begun to occur in the manner in which hospital medicine research is conducted. In this article, we will describe the manner in which pediatric hospital medicine research has advanced over the past several years, culminating in the conduct of several large multicenter research projects through the Pediatric Research in Inpatient Settings (PRIS) Network. We believe that lessons learned in the development of PRIS could help foster the growth of other current and future networks of hospitalist researchers, and lay the groundwork for national improvement efforts.
HOSPITAL MEDICINE RESEARCH: GROWTH AND DEVELOPMENT
In 2001, a small group of thought leaders in pediatric hospital medicine (see Acknowledgements) conceived the notion of starting a hospitalist research network, which they named the Pediatric Research in Inpatient Settings (PRIS) Network.4 PRIS was modeled in part after a successful pediatric primary care network.5 Since hospitalists in institutions across the country were being tasked to improve the care of hospitalized patients, and to lead diverse quality and safety initiatives, why not create a network to facilitate identification of high priority problems and evidence‐based approaches to them, and coordinate improvement efforts? The ambitious goal of the fledgling network was to conduct transformative research into inpatient healthcare delivery and discover both condition‐dependent and condition‐independent processes of care that were linked to patient outcomes.
PRIS began as (and remains) an open research networkfrom the outset, any hospitalist could join. The notion of this network, even in its earliest stages, was sufficiently appealing to professional societies that the Society of Hospital Medicine (SHM), the Academic Pediatric Association (APA), and the American Academy of Pediatrics (AAP) agreed to cosponsor the network, fostering its early growth. The community of pediatric hospitalists was tremendously supportive as well; over 300 hospitalists initially signed up to participate. Initial studies were generated through surveys of members, through which variability in systemic organization and variation in the management of clinical conditions and systems‐based issues across inpatient settings was identified and quantified.68
In the 2000s, as PRIS grew as a network, the research capacity of individuals within the field also grew. An increasing number of hospitalists began dedicating their academic careers to pursuing rigorous methodological training and conducting pediatric hospital medicine research. A series of studies began to emerge analyzing data from large administrative datasets that described the variation in hospital care (but lack clinical results and clinical outcomes outside of the hospital setting), such as the Pediatric Health Information Systems (PHIS) database operated by the Children's Hospital Association (formerly known as the Child Health Corporation of America).913 Pediatric hospital medicine fellowships began to appear,14 and over time, a cohort of hospitalist investigators with sufficient independence to mentor others arose.
THE REDESIGN OF PRIS
In 2009, a Pediatric Hospital Medicine Roundtable of 22 international leaders was convened under the guidance of SHM, APA, and AAP.15 This initiative, roughly a decade after the inception of the field, was critical to bringing pediatric hospitalist research and PRIS to the next level. It was recognized in that meeting that while PRIS had made a good start, it would not be possible to grow the network to the point of conducting top quality multicenter studies without the active involvement of a larger number of rigorously trained hospitalist researchers. To stimulate the network's growth, the existing PRIS Steering Committeea diverse group of clinical, educational, administrative, and research leaders in the fieldfacilitated the transfer of leadership to a new Executive Council led entirely by trained researchers (see Table 1), with the support of the APA. The Executive Council subsequently developed a series of standard operating procedures (see Table 2) that have created a transparent process to deal with important, but often difficult, academic issues that networks face.
|
| Published papers, total number of papers: 150 |
| Grants awarded, funding $3.7 million |
| Grants pending, funding $3.3 million |
| Research positions included director of research center, NIH study sections, national research committees, journal editorial experience |
| Mentors to junior faculty, fellows, and housestaff |
| However, no division chief or professor rank at the time of the executive council creation (this has since changed) |
|
| Mission |
| Vision |
| Values |
| Objectives (first 5 years) |
| Organizational structure (executive council, ex officio members, advisory group, staff and participant organizations/member hospitalist groups) |
| Authorship and publication |
| Institutional review board approval |
| Protocol selection and review |
| Network funding |
| Ancillary studies |
| Adverse event reporting |
| Site monitoring |
DEVELOPMENT OF MULTICENTER RESEARCH PROJECTS
The redesign of PRIS did not alter its objective: to build the evidence base regarding the optimal inpatient management of children. Evidence on how best to care for many pediatric conditions remains lacking, largely due to the facts that: a) death, the most definitive and readily measured of outcomes, is rare in pediatric hospitals; b) many pediatric conditions are relatively uncommon in any single hospital; and c) few validated, well‐developed metrics of inpatient pediatric quality exist.
As PRIS sought to launch multicenter studies of inpatient care quality, it continued to receive strong support from the APA, SHM, and AAP, and gained the support of a new partner, the Children's Hospital Association, which is comprised of a large group of children's hospitals across Canada and the US. The membership of PRIS grew to involve over 600 pediatric hospitalists from more than 75 hospitals.4 With a core group of funded hospitalist investigators, and strong support from partner organizations, the network sought and received funding for 3 major studies that are currently underway. Release of the federal government's Affordable Care Act and Comparative Effectiveness Research portfolio stimulated much of this work, stimulating the network to reach out to existing and new stakeholders and successfully compete for several multicenter studies.
Prioritization Project
Through its Prioritization Project ($1.6 million over 3 years, Children's Hospital Association), PRIS is using data on over 3.5 million hospitalizations in the PHIS database to identify conditions that are prevalent and costly, and whose management varies highly across institutions.16 After identifying the top ranked medical and surgical conditions for further study, the project is conducting drill downs in which the reasons for variation are being sought. By partnering with hospital and clinical leadership at these hospitals, and producing a data‐driven approach to prioritization, PRIS aims to conduct collaborative research and improvement work across hospitals that aim to understand and reduce the unwarranted variation in resource utilization for several of these conditions, and measure the impact of such efforts on patient and cost outcomes.
PHIS+
PHIS+ ($9 million over 3 years, Agency for Healthcare Research and Quality) is a project that is taking electronically stored laboratory, microbiology, and radiology data from 6 children's hospitals, with diverse electronic health record systems, to build a robust new database.17 The project also funds several comparative effectiveness projects (several of which are either high prevalence, high cost, or exhibit high variation in resource utilization, as demonstrated in the Prioritization Project) that are being carried out using this new database. This PHIS+ database will serve as an ongoing resource for hospitalist and subspecialist investigators interested in evaluating and improving the care of hospitalized children across multiple medical centers at once.
I‐PASS
Innovation in Pediatric Education (IIPE)‐PRIS Accelerating Safe Sign‐outs (I‐PASS) ($3 million over 3 years, Department of Health and Human Services) is a research and improvement project that is evaluating the effects on patient safety, resident experience, and diverse care processes of implementing a bundle of interventions designed to improve handoffs at change of shift.18, 19 It is one of the first multicenter educational improvement projects of its kind. Given the commonalities between change‐of‐shift handoffs in pediatrics and other fields, and the commonalities between different types of handoffs in the inpatient and outpatient setting, I‐PASS may yield communication and improvement lessons that extend beyond the confines of the study population itself.
The strategic focus of these 3 grants was to develop studies that are relevant for both the membership of practicing hospitalists and appealing to the stakeholders of the network. PRIS intends that these 3 projects will be but the first few in a long series of studies led by investigators nationwide who are interested in better understanding, and advancing the care of hospitalized children.
RELEVANCE TO OTHER NETWORKS
We believe that the story of PRIS' development, current studies, and future plans has relevance to other adult, as well as pediatric, hospital medicine networks (see Table 3). As in pediatrics, a growing group of midcareer adult hospital medicine investigators has emerged, with proven track records in attracting federal funding and conducting research germane to our field. Some have previously worked together on large‐scale multisite studies.2023 A core group have come together to form the HOspital MEdicine Reengineering Network (HOMERUN).24 HOMERUN has recently secured funding from the Association of American Medical Colleges (AAMC) for a project that is linking clinical data from several hospitals to a centralized database, a project analogous to PHIS+, and will allow for Comparative Effectiveness Research studies that have more accurate case ascertainment (by using clinical data to build cohorts) and ensuring additional power by securing a larger number of cases. Defining which clinical questions to address first will help establish this new entity as a leader in hospital medicine research. Attracting stakeholder involvement will help make these endeavors successful. In recent months, PRIS and HOMERUN jointly collaborated on the submission of a large Centers for Medicare and Medicaid Innovation (CMMI) proposal to extend the work of I‐PASS to include several internal medicine and additional pediatric resident and hospitalist care settings. Future collaborations between networks may help foster more rapid advances in care.
| Governance involves hospitalist investigators |
| In‐person governance meetings to ensure/gauge buy‐in |
| Stable infrastructure critical for success |
| Mentoring important for succession |
| Grants to fund large‐scale projects demonstrate track record for network |
| MembershipWhat do members want/need? |
Another pediatric hospitalist network has also emerged in the past few years, with a focus on quality improvement across inpatient pediatric settings, the Value in Pediatrics (VIP) Network.25 Although still early in its development, VIP has already successfully engaged in national quality improvement work regarding benchmarking care provided for children with bronchiolitis, reducing patient identification (ID) band errors, and improving discharge communications. VIP recently became part of the AAP's Quality Improvement Innovation Network (QuINN) group through which it is receiving infrastructure support.
As they develop, hospital medicine research and improvement networks will seek to systematically design and rigorously execute multicenter projects that provide answers to those clinical questions which practicing hospitalists face on a daily basis. As they do so, mentoring of both junior investigators and novice investigators will be necessary for the longevity of networks. To foster junior investigators, PRIS has undertaken a series of workshops presented at various national conferences, in addition to working with junior investigators directly on its currently funded studies.
CONCLUSION
Hospitalists' engagement in research and quality improvement networks builds upon their already successful engagement in clinical care, education, and quality improvement at a local level. A research and improvement mission that is tightly coupled with the day‐to‐day needs of these other important hospitalist activities creates a synergy with the potential to lead to transformative advances in patient care. If hospitalists can discover how best to deliver care, train the next generation of providers, and work to implement needed improvements at a local and national level, they will have an unprecedented opportunity to improve the care and health of children and adults.
Acknowledgements
The authors acknowledge the PRIS Network. They offer profound thanks to the members of the PRIS Steering Committee who founded the network and served throughout its initial 8 years (20012009), without whom the network would never have been launched: Mary Ottolini, Jack Percelay, Dan Rauch, Erin Stucky, and David Zipes (in addition to C.P.L.); and the current PRIS Executive Council who are leading the network: Patrick Conway, Ron Keren, Sanjay Mahant, Samir Shah, Tamara Simon, Joel Tieder, and Karen Wilson (in addition to C.P.L. and R.S.).
Note Added in Proof
Disclosures: I‐PASS is funded by grant 1R18AE00002901, from the Department of Health and Human Resources (DHHR). PHIS+ is funded by grant 1R01HSO986201, from the Agency for Healthcare Research and Quality (AHRQ). The Prioritization Project is funded by a grant from the Children's Hospital Association (CHA). The PRIS Network has received support from CHA, APA, AAP, and SHM. C.P.L. and R.S. are both Executive Council members of the PRIS Network and receive support from CHA.
- ,.The emerging role of “hospitalists” in the American health care system.N Engl J Med.1996;335(7):514–517.
- ,,,.Growth in the care of older patients by hospitalists in the United States.N Engl J Med.2009;360(11):1102–1112.
- ,,,,,.Pediatric hospitalists in Canada and the United States: a survey of pediatric academic department chairs.Ambul Pediatr.2001;1(6):338–339.
- Pediatric Research in Inpatient Settings. Available at: http://www.prisnetwork.org. Accessed June 21, 2012.
- ,,, et al.Pediatric research in office settings (PROS): a national practice‐based research network to improve children's health care.Pediatrics.1998;102(6):1350–1357.
- ,,,,.Variation in pediatric hospitalists' use of proven and unproven therapies: a study from the Pediatric Research in Inpatient Settings (PRIS) network.J Hosp Med.2008;3(4):292–298.
- ,,,,,.Variations in management of common inpatient pediatric illnesses: hospitalists and community pediatricians.Pediatrics.2006;118(2):441–447.
- ,,, et al.Family‐centered rounds on pediatric wards: a PRIS network survey of US and Canadian hospitalists.Pediatrics.2010;126(1):37–43.
- ,,,,.Primary early thoracoscopy and reduction in length of hospital stay and additional procedures among children with complicated pneumonia: results of a multicenter retrospective cohort study.Arch Pediatr Adolesc Med.2008;162(7):675–681.
- ,,, et al.Infection rates following initial cerebrospinal fluid shunt placement across pediatric hospitals in the United States. Clinical article.J Neurosurg Pediatr.2009;4(2):156–165.
- ,,, et al.Reflux related hospital admissions after fundoplication in children with neurological impairment: retrospective cohort study.BMJ.2009;339:b4411.
- ,,.Pediatric hospital adherence to the standard of care for acute gastroenteritis.Pediatrics.2009;124(6):e1081–1087.
- ,,,,,.Prolonged intravenous therapy versus early transition to oral antimicrobial therapy for acute osteomyelitis in children.Pediatrics.2009;123(2):636–642.
- ,.Characteristics of pediatric hospital medicine fellowships and training programs.J Hosp Med.2009;4(3):157–163.
- ,,, et al.Pediatric hospital medicine: a strategic planning roundtable to chart the future.J Hosp Med.2012;7(4):329–334.
- ,,, et al.A novel method for prioritizating comparative effectiveness research topics.Arch Pediatr Adolesc Med. In press.
- ,,, et al.Federating clinical data from six pediatric hospitals: process and initial results from the PHIS+ Consortium. In:Improving Health: Informatics and IT Changing the World. Proceedings of the AMIA 2011 Annual Symposium,Washington, DC, October 22–26,2011:994–1003. Epub 2011 October 22.
- ,,,.Establishing a multisite education and research project requires leadership, expertise, collaboration, and an important aim.Pediatrics.2010;126(4):619–622.
- ,,,,,.I‐PASS, a mnemonic to standardize verbal handoffs.Pediatrics.2012;129(2):201–204.
- ,,, et al.Factors associated with discussion of care plans and code status at the time of hospital admission: results from the Multicenter Hospitalist Study.J Hosp Med.2008;3(6):437–445.
- ,,, et al.Do hospitalists affect clinical outcomes and efficiency for patients with acute upper gastrointestinal hemorrhage (UGIH)?J Hosp Med.2010;5(3):133–139.
- ,,, et al.Hospital readmission in general medicine patients: a prediction model.J Gen Intern Med.2010;25(3):211–219.
- ,,, et al.Code status discussions at hospital admission are not associated with patient and surrogate satisfaction with hospital care: results from the Multicenter Hospitalist Study.Am J Hosp Palliat Care.2011;28(2):102–108.
- HOMERUN. i2b2 Wiki, HOMERUN page. Available at: https://community.i2b2.org/wiki/display/HOMERUN/HOMERUN+Home. Accessed March 9, 2011.
- Value in Pediatrics Network Homepage. Available at: http://www.phm‐vipnetwork.com. Accessed June 21, 2012.
Since the term hospitalist was coined in 1996,1 the field of hospital medicine has grown exponentially. Hospitalists are caring for increasing numbers of adultsincluding Medicare beneficiaries in hospitals across the United States.2 Pediatric hospital medicine has grown in parallel. By 1998, 50% of pediatric department chairs across the US and Canada had implemented hospitalist programs, with another 27% reporting they were soon to do so.3 A bit more than a decade later, pediatric hospitalists can be found in nearly every major academic medical center, and in a large proportion of community hospitals throughout the US and Canada.
In the past several years, major advances have begun to occur in the manner in which hospital medicine research is conducted. In this article, we will describe the manner in which pediatric hospital medicine research has advanced over the past several years, culminating in the conduct of several large multicenter research projects through the Pediatric Research in Inpatient Settings (PRIS) Network. We believe that lessons learned in the development of PRIS could help foster the growth of other current and future networks of hospitalist researchers, and lay the groundwork for national improvement efforts.
HOSPITAL MEDICINE RESEARCH: GROWTH AND DEVELOPMENT
In 2001, a small group of thought leaders in pediatric hospital medicine (see Acknowledgements) conceived the notion of starting a hospitalist research network, which they named the Pediatric Research in Inpatient Settings (PRIS) Network.4 PRIS was modeled in part after a successful pediatric primary care network.5 Since hospitalists in institutions across the country were being tasked to improve the care of hospitalized patients, and to lead diverse quality and safety initiatives, why not create a network to facilitate identification of high priority problems and evidence‐based approaches to them, and coordinate improvement efforts? The ambitious goal of the fledgling network was to conduct transformative research into inpatient healthcare delivery and discover both condition‐dependent and condition‐independent processes of care that were linked to patient outcomes.
PRIS began as (and remains) an open research networkfrom the outset, any hospitalist could join. The notion of this network, even in its earliest stages, was sufficiently appealing to professional societies that the Society of Hospital Medicine (SHM), the Academic Pediatric Association (APA), and the American Academy of Pediatrics (AAP) agreed to cosponsor the network, fostering its early growth. The community of pediatric hospitalists was tremendously supportive as well; over 300 hospitalists initially signed up to participate. Initial studies were generated through surveys of members, through which variability in systemic organization and variation in the management of clinical conditions and systems‐based issues across inpatient settings was identified and quantified.68
In the 2000s, as PRIS grew as a network, the research capacity of individuals within the field also grew. An increasing number of hospitalists began dedicating their academic careers to pursuing rigorous methodological training and conducting pediatric hospital medicine research. A series of studies began to emerge analyzing data from large administrative datasets that described the variation in hospital care (but lack clinical results and clinical outcomes outside of the hospital setting), such as the Pediatric Health Information Systems (PHIS) database operated by the Children's Hospital Association (formerly known as the Child Health Corporation of America).913 Pediatric hospital medicine fellowships began to appear,14 and over time, a cohort of hospitalist investigators with sufficient independence to mentor others arose.
THE REDESIGN OF PRIS
In 2009, a Pediatric Hospital Medicine Roundtable of 22 international leaders was convened under the guidance of SHM, APA, and AAP.15 This initiative, roughly a decade after the inception of the field, was critical to bringing pediatric hospitalist research and PRIS to the next level. It was recognized in that meeting that while PRIS had made a good start, it would not be possible to grow the network to the point of conducting top quality multicenter studies without the active involvement of a larger number of rigorously trained hospitalist researchers. To stimulate the network's growth, the existing PRIS Steering Committeea diverse group of clinical, educational, administrative, and research leaders in the fieldfacilitated the transfer of leadership to a new Executive Council led entirely by trained researchers (see Table 1), with the support of the APA. The Executive Council subsequently developed a series of standard operating procedures (see Table 2) that have created a transparent process to deal with important, but often difficult, academic issues that networks face.
|
| Published papers, total number of papers: 150 |
| Grants awarded, funding $3.7 million |
| Grants pending, funding $3.3 million |
| Research positions included director of research center, NIH study sections, national research committees, journal editorial experience |
| Mentors to junior faculty, fellows, and housestaff |
| However, no division chief or professor rank at the time of the executive council creation (this has since changed) |
|
| Mission |
| Vision |
| Values |
| Objectives (first 5 years) |
| Organizational structure (executive council, ex officio members, advisory group, staff and participant organizations/member hospitalist groups) |
| Authorship and publication |
| Institutional review board approval |
| Protocol selection and review |
| Network funding |
| Ancillary studies |
| Adverse event reporting |
| Site monitoring |
DEVELOPMENT OF MULTICENTER RESEARCH PROJECTS
The redesign of PRIS did not alter its objective: to build the evidence base regarding the optimal inpatient management of children. Evidence on how best to care for many pediatric conditions remains lacking, largely due to the facts that: a) death, the most definitive and readily measured of outcomes, is rare in pediatric hospitals; b) many pediatric conditions are relatively uncommon in any single hospital; and c) few validated, well‐developed metrics of inpatient pediatric quality exist.
As PRIS sought to launch multicenter studies of inpatient care quality, it continued to receive strong support from the APA, SHM, and AAP, and gained the support of a new partner, the Children's Hospital Association, which is comprised of a large group of children's hospitals across Canada and the US. The membership of PRIS grew to involve over 600 pediatric hospitalists from more than 75 hospitals.4 With a core group of funded hospitalist investigators, and strong support from partner organizations, the network sought and received funding for 3 major studies that are currently underway. Release of the federal government's Affordable Care Act and Comparative Effectiveness Research portfolio stimulated much of this work, stimulating the network to reach out to existing and new stakeholders and successfully compete for several multicenter studies.
Prioritization Project
Through its Prioritization Project ($1.6 million over 3 years, Children's Hospital Association), PRIS is using data on over 3.5 million hospitalizations in the PHIS database to identify conditions that are prevalent and costly, and whose management varies highly across institutions.16 After identifying the top ranked medical and surgical conditions for further study, the project is conducting drill downs in which the reasons for variation are being sought. By partnering with hospital and clinical leadership at these hospitals, and producing a data‐driven approach to prioritization, PRIS aims to conduct collaborative research and improvement work across hospitals that aim to understand and reduce the unwarranted variation in resource utilization for several of these conditions, and measure the impact of such efforts on patient and cost outcomes.
PHIS+
PHIS+ ($9 million over 3 years, Agency for Healthcare Research and Quality) is a project that is taking electronically stored laboratory, microbiology, and radiology data from 6 children's hospitals, with diverse electronic health record systems, to build a robust new database.17 The project also funds several comparative effectiveness projects (several of which are either high prevalence, high cost, or exhibit high variation in resource utilization, as demonstrated in the Prioritization Project) that are being carried out using this new database. This PHIS+ database will serve as an ongoing resource for hospitalist and subspecialist investigators interested in evaluating and improving the care of hospitalized children across multiple medical centers at once.
I‐PASS
Innovation in Pediatric Education (IIPE)‐PRIS Accelerating Safe Sign‐outs (I‐PASS) ($3 million over 3 years, Department of Health and Human Services) is a research and improvement project that is evaluating the effects on patient safety, resident experience, and diverse care processes of implementing a bundle of interventions designed to improve handoffs at change of shift.18, 19 It is one of the first multicenter educational improvement projects of its kind. Given the commonalities between change‐of‐shift handoffs in pediatrics and other fields, and the commonalities between different types of handoffs in the inpatient and outpatient setting, I‐PASS may yield communication and improvement lessons that extend beyond the confines of the study population itself.
The strategic focus of these 3 grants was to develop studies that are relevant for both the membership of practicing hospitalists and appealing to the stakeholders of the network. PRIS intends that these 3 projects will be but the first few in a long series of studies led by investigators nationwide who are interested in better understanding, and advancing the care of hospitalized children.
RELEVANCE TO OTHER NETWORKS
We believe that the story of PRIS' development, current studies, and future plans has relevance to other adult, as well as pediatric, hospital medicine networks (see Table 3). As in pediatrics, a growing group of midcareer adult hospital medicine investigators has emerged, with proven track records in attracting federal funding and conducting research germane to our field. Some have previously worked together on large‐scale multisite studies.2023 A core group have come together to form the HOspital MEdicine Reengineering Network (HOMERUN).24 HOMERUN has recently secured funding from the Association of American Medical Colleges (AAMC) for a project that is linking clinical data from several hospitals to a centralized database, a project analogous to PHIS+, and will allow for Comparative Effectiveness Research studies that have more accurate case ascertainment (by using clinical data to build cohorts) and ensuring additional power by securing a larger number of cases. Defining which clinical questions to address first will help establish this new entity as a leader in hospital medicine research. Attracting stakeholder involvement will help make these endeavors successful. In recent months, PRIS and HOMERUN jointly collaborated on the submission of a large Centers for Medicare and Medicaid Innovation (CMMI) proposal to extend the work of I‐PASS to include several internal medicine and additional pediatric resident and hospitalist care settings. Future collaborations between networks may help foster more rapid advances in care.
| Governance involves hospitalist investigators |
| In‐person governance meetings to ensure/gauge buy‐in |
| Stable infrastructure critical for success |
| Mentoring important for succession |
| Grants to fund large‐scale projects demonstrate track record for network |
| MembershipWhat do members want/need? |
Another pediatric hospitalist network has also emerged in the past few years, with a focus on quality improvement across inpatient pediatric settings, the Value in Pediatrics (VIP) Network.25 Although still early in its development, VIP has already successfully engaged in national quality improvement work regarding benchmarking care provided for children with bronchiolitis, reducing patient identification (ID) band errors, and improving discharge communications. VIP recently became part of the AAP's Quality Improvement Innovation Network (QuINN) group through which it is receiving infrastructure support.
As they develop, hospital medicine research and improvement networks will seek to systematically design and rigorously execute multicenter projects that provide answers to those clinical questions which practicing hospitalists face on a daily basis. As they do so, mentoring of both junior investigators and novice investigators will be necessary for the longevity of networks. To foster junior investigators, PRIS has undertaken a series of workshops presented at various national conferences, in addition to working with junior investigators directly on its currently funded studies.
CONCLUSION
Hospitalists' engagement in research and quality improvement networks builds upon their already successful engagement in clinical care, education, and quality improvement at a local level. A research and improvement mission that is tightly coupled with the day‐to‐day needs of these other important hospitalist activities creates a synergy with the potential to lead to transformative advances in patient care. If hospitalists can discover how best to deliver care, train the next generation of providers, and work to implement needed improvements at a local and national level, they will have an unprecedented opportunity to improve the care and health of children and adults.
Acknowledgements
The authors acknowledge the PRIS Network. They offer profound thanks to the members of the PRIS Steering Committee who founded the network and served throughout its initial 8 years (20012009), without whom the network would never have been launched: Mary Ottolini, Jack Percelay, Dan Rauch, Erin Stucky, and David Zipes (in addition to C.P.L.); and the current PRIS Executive Council who are leading the network: Patrick Conway, Ron Keren, Sanjay Mahant, Samir Shah, Tamara Simon, Joel Tieder, and Karen Wilson (in addition to C.P.L. and R.S.).
Note Added in Proof
Disclosures: I‐PASS is funded by grant 1R18AE00002901, from the Department of Health and Human Resources (DHHR). PHIS+ is funded by grant 1R01HSO986201, from the Agency for Healthcare Research and Quality (AHRQ). The Prioritization Project is funded by a grant from the Children's Hospital Association (CHA). The PRIS Network has received support from CHA, APA, AAP, and SHM. C.P.L. and R.S. are both Executive Council members of the PRIS Network and receive support from CHA.
- ,.The emerging role of “hospitalists” in the American health care system.N Engl J Med.1996;335(7):514–517.
- ,,,.Growth in the care of older patients by hospitalists in the United States.N Engl J Med.2009;360(11):1102–1112.
- ,,,,,.Pediatric hospitalists in Canada and the United States: a survey of pediatric academic department chairs.Ambul Pediatr.2001;1(6):338–339.
- Pediatric Research in Inpatient Settings. Available at: http://www.prisnetwork.org. Accessed June 21, 2012.
- ,,, et al.Pediatric research in office settings (PROS): a national practice‐based research network to improve children's health care.Pediatrics.1998;102(6):1350–1357.
- ,,,,.Variation in pediatric hospitalists' use of proven and unproven therapies: a study from the Pediatric Research in Inpatient Settings (PRIS) network.J Hosp Med.2008;3(4):292–298.
- ,,,,,.Variations in management of common inpatient pediatric illnesses: hospitalists and community pediatricians.Pediatrics.2006;118(2):441–447.
- ,,, et al.Family‐centered rounds on pediatric wards: a PRIS network survey of US and Canadian hospitalists.Pediatrics.2010;126(1):37–43.
- ,,,,.Primary early thoracoscopy and reduction in length of hospital stay and additional procedures among children with complicated pneumonia: results of a multicenter retrospective cohort study.Arch Pediatr Adolesc Med.2008;162(7):675–681.
- ,,, et al.Infection rates following initial cerebrospinal fluid shunt placement across pediatric hospitals in the United States. Clinical article.J Neurosurg Pediatr.2009;4(2):156–165.
- ,,, et al.Reflux related hospital admissions after fundoplication in children with neurological impairment: retrospective cohort study.BMJ.2009;339:b4411.
- ,,.Pediatric hospital adherence to the standard of care for acute gastroenteritis.Pediatrics.2009;124(6):e1081–1087.
- ,,,,,.Prolonged intravenous therapy versus early transition to oral antimicrobial therapy for acute osteomyelitis in children.Pediatrics.2009;123(2):636–642.
- ,.Characteristics of pediatric hospital medicine fellowships and training programs.J Hosp Med.2009;4(3):157–163.
- ,,, et al.Pediatric hospital medicine: a strategic planning roundtable to chart the future.J Hosp Med.2012;7(4):329–334.
- ,,, et al.A novel method for prioritizating comparative effectiveness research topics.Arch Pediatr Adolesc Med. In press.
- ,,, et al.Federating clinical data from six pediatric hospitals: process and initial results from the PHIS+ Consortium. In:Improving Health: Informatics and IT Changing the World. Proceedings of the AMIA 2011 Annual Symposium,Washington, DC, October 22–26,2011:994–1003. Epub 2011 October 22.
- ,,,.Establishing a multisite education and research project requires leadership, expertise, collaboration, and an important aim.Pediatrics.2010;126(4):619–622.
- ,,,,,.I‐PASS, a mnemonic to standardize verbal handoffs.Pediatrics.2012;129(2):201–204.
- ,,, et al.Factors associated with discussion of care plans and code status at the time of hospital admission: results from the Multicenter Hospitalist Study.J Hosp Med.2008;3(6):437–445.
- ,,, et al.Do hospitalists affect clinical outcomes and efficiency for patients with acute upper gastrointestinal hemorrhage (UGIH)?J Hosp Med.2010;5(3):133–139.
- ,,, et al.Hospital readmission in general medicine patients: a prediction model.J Gen Intern Med.2010;25(3):211–219.
- ,,, et al.Code status discussions at hospital admission are not associated with patient and surrogate satisfaction with hospital care: results from the Multicenter Hospitalist Study.Am J Hosp Palliat Care.2011;28(2):102–108.
- HOMERUN. i2b2 Wiki, HOMERUN page. Available at: https://community.i2b2.org/wiki/display/HOMERUN/HOMERUN+Home. Accessed March 9, 2011.
- Value in Pediatrics Network Homepage. Available at: http://www.phm‐vipnetwork.com. Accessed June 21, 2012.
South American Hospitalist Conference Draws Record Attendance
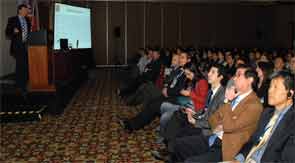
A record number of hospitalists attended the combined biannual conference of the Chilean Society of Hospitalists and the Pan American Society of Hospitalists (PASHA) July 19-20 in Santiago, Chile. The meeting sold out with more than 250 attendees, and the energy of the South American hospitalist movement could be felt inside as hospitalists from across the Americas packed into the conference center.
It was the third such combined meeting, and hospitalists from Argentina, Colombia, the United States, and all parts of Chile were present. The first national meeting of hospitalists in Chile was held in 2008, and meetings have occurred every other year since 2008. PASHA was established in 2010 to unite hospitalists in South America and build collaborations with hospitalists in North America. PASHA’s past meetings were held in Brazil and Argentina, and organizers plan to continue it annually.
Hospitalists and subspecialists gathered to update their clinical knowledge and share ideas on patient safety, quality improvement (QI), and transitions of care.
“All of our countries have different challenges, but hospitalists everywhere are trying to do the same thing—provide quality healthcare as efficiently as possible. This central goal of hospitalists allows us to share ideas and learn from each other,” said Andres Aizman, MD, director of the division of hospital medicine at Pontificia Universidad Católica de Chile in Santiago.
Lectures were translated into multiple languages, including English, to engage not only local physicians, but also those from abroad.
“This has been an incredible experience,” said Dr. Eddie Greene, a nephrologist from the Mayo Clinic in Rochester, Minn., who presented a lecture on hypertensive crises. “Getting so many talented people from different backgrounds in the same place exchanging ideas on diverse topics has been an amazing experience. This is something special, and I hope to see it continue to grow.”
Two internists at Pontificia Universidad Católica de Chile founded its first HM division in 2004. The division has grown to include nine physicians, and there is a second, five-physician group of hospitalists at Universidad de Chile, a neighboring teaching hospital. The actual number of practicing hospitalists in Chile is hard to estimate because there are many hospital-based internists that have yet to be recognized as hospitalists; however, the most active academic hospitalists in the Chilean Society of Hospitalists are at the two universities.
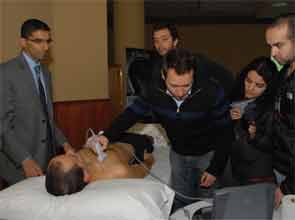
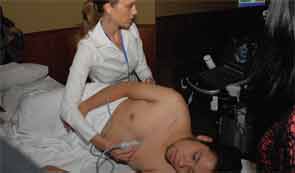
One of the highlights of this year’s conference was a workshop on bedside applications of portable ultrasound for hospitalists. Lectures on procedural and diagnostic applications of portable ultrasound were presented to the general assembly, and a hands-on workshop with limited seating was sold out.
The workshop included brief lectures, simulation-based training, and scanning of live models.
“This meeting has enlightened me on so many topics and tools that I can easily use in my hospital,” said Ofelia Leiva, MD, a hospitalist from Curico, a city of 250,000 in southern Chile. “There are so many ways we can use ultrasound in the hospital. I’m grateful that I was able to attend.”
Nilam Soni, MD, of the University of Texas Health Science Center at San Antonio, spearheaded the ultrasound workshop in collaboration with Dr. Ricardo Franco from John H. Stroger Hospital in Chicago and Dr. Carolina Candotti from Penn State Hershey Medical Center.
Faculty from the Mayo Clinic, including Drs. Jamie Newman, Fernando Rivera, John Park, and Eddie Greene, attended the meeting for a second consecutive time. Their contributions made the event even more attractive to local hospitalists.
—Ofelia Leiva, hospitalist, Curico, Chile
Although HM continues to grow in South America, barriers still exist. Each country has a different healthcare system, and the economic and political forces that drive these systems affect hospitalists and their patients. Certain metrics that are often used to gauge hospitalists’ impact in North America, such as length of stay, are less meaningful in Chile and other countries. Additionally, hospitalists’ ability to participate in conferences and exchange ideas is limited by distance and circumstance; the average hospitalist in Chile earns the equivalent of about $70,000 a year. Lastly, many hospitalists in South America aspire to develop research programs, but obtaining research training is challenging. Such opportunities are limited in South America, and physicians often encounter cost and immigration issues when they seek training abroad.
Despite the challenges, the enthusiasm to advance HM in South America and build international collaborations continues to grow. Hospitalists from different institutions in the U.S. have returned every year to participate in the conference. The opportunity to meet hospitalists from different countries, exchange ideas, and be part of the hospitalist movement abroad draws people back. The energy of the hospitalist movement is still alive.
Dr. Abbott and Dr. Rodriguez are adjunct professors and Dr. Aizman is an assistant professor in the department of internal medicine at Pontificia Universidad Católica de Chile School of Medicine in Santiago; Dr. Newman is an assistant professor in the division of hospital medicine at Mayo Clinic in Rochester, Minn.; and Dr. Soni is an assistant professor of medicine in the division of hospital medicine at the University of Texas Health Science Center at San Antonio.
A record number of hospitalists attended the combined biannual conference of the Chilean Society of Hospitalists and the Pan American Society of Hospitalists (PASHA) July 19-20 in Santiago, Chile. The meeting sold out with more than 250 attendees, and the energy of the South American hospitalist movement could be felt inside as hospitalists from across the Americas packed into the conference center.
It was the third such combined meeting, and hospitalists from Argentina, Colombia, the United States, and all parts of Chile were present. The first national meeting of hospitalists in Chile was held in 2008, and meetings have occurred every other year since 2008. PASHA was established in 2010 to unite hospitalists in South America and build collaborations with hospitalists in North America. PASHA’s past meetings were held in Brazil and Argentina, and organizers plan to continue it annually.
Hospitalists and subspecialists gathered to update their clinical knowledge and share ideas on patient safety, quality improvement (QI), and transitions of care.
“All of our countries have different challenges, but hospitalists everywhere are trying to do the same thing—provide quality healthcare as efficiently as possible. This central goal of hospitalists allows us to share ideas and learn from each other,” said Andres Aizman, MD, director of the division of hospital medicine at Pontificia Universidad Católica de Chile in Santiago.
Lectures were translated into multiple languages, including English, to engage not only local physicians, but also those from abroad.
“This has been an incredible experience,” said Dr. Eddie Greene, a nephrologist from the Mayo Clinic in Rochester, Minn., who presented a lecture on hypertensive crises. “Getting so many talented people from different backgrounds in the same place exchanging ideas on diverse topics has been an amazing experience. This is something special, and I hope to see it continue to grow.”
Two internists at Pontificia Universidad Católica de Chile founded its first HM division in 2004. The division has grown to include nine physicians, and there is a second, five-physician group of hospitalists at Universidad de Chile, a neighboring teaching hospital. The actual number of practicing hospitalists in Chile is hard to estimate because there are many hospital-based internists that have yet to be recognized as hospitalists; however, the most active academic hospitalists in the Chilean Society of Hospitalists are at the two universities.
One of the highlights of this year’s conference was a workshop on bedside applications of portable ultrasound for hospitalists. Lectures on procedural and diagnostic applications of portable ultrasound were presented to the general assembly, and a hands-on workshop with limited seating was sold out.
The workshop included brief lectures, simulation-based training, and scanning of live models.
“This meeting has enlightened me on so many topics and tools that I can easily use in my hospital,” said Ofelia Leiva, MD, a hospitalist from Curico, a city of 250,000 in southern Chile. “There are so many ways we can use ultrasound in the hospital. I’m grateful that I was able to attend.”
Nilam Soni, MD, of the University of Texas Health Science Center at San Antonio, spearheaded the ultrasound workshop in collaboration with Dr. Ricardo Franco from John H. Stroger Hospital in Chicago and Dr. Carolina Candotti from Penn State Hershey Medical Center.
Faculty from the Mayo Clinic, including Drs. Jamie Newman, Fernando Rivera, John Park, and Eddie Greene, attended the meeting for a second consecutive time. Their contributions made the event even more attractive to local hospitalists.
—Ofelia Leiva, hospitalist, Curico, Chile
Although HM continues to grow in South America, barriers still exist. Each country has a different healthcare system, and the economic and political forces that drive these systems affect hospitalists and their patients. Certain metrics that are often used to gauge hospitalists’ impact in North America, such as length of stay, are less meaningful in Chile and other countries. Additionally, hospitalists’ ability to participate in conferences and exchange ideas is limited by distance and circumstance; the average hospitalist in Chile earns the equivalent of about $70,000 a year. Lastly, many hospitalists in South America aspire to develop research programs, but obtaining research training is challenging. Such opportunities are limited in South America, and physicians often encounter cost and immigration issues when they seek training abroad.
Despite the challenges, the enthusiasm to advance HM in South America and build international collaborations continues to grow. Hospitalists from different institutions in the U.S. have returned every year to participate in the conference. The opportunity to meet hospitalists from different countries, exchange ideas, and be part of the hospitalist movement abroad draws people back. The energy of the hospitalist movement is still alive.
Dr. Abbott and Dr. Rodriguez are adjunct professors and Dr. Aizman is an assistant professor in the department of internal medicine at Pontificia Universidad Católica de Chile School of Medicine in Santiago; Dr. Newman is an assistant professor in the division of hospital medicine at Mayo Clinic in Rochester, Minn.; and Dr. Soni is an assistant professor of medicine in the division of hospital medicine at the University of Texas Health Science Center at San Antonio.
Debate Rages Over Hospitalists' Role in ICU Physician Shortage
The long-simmering debate over whether and how hospitalists might help solve the worsening shortage of critical-care physicians is beginning to boil over.
In June, SHM and the Society of Critical Care Medicine (SCCM) issued a joint position paper proposing an expedited, one-year, critical-care fellowship for hospitalists with at least three years of clinical job experience, in lieu of the two-year fellowship now required for board certification.1
“Bringing qualified hospitalists into the critical-care workforce through rigorous sanctioned and accredited one-year training programs,” the paper asserted, “will open a new intensivist training pipeline and potentially offer more critically ill patients the benefits of providers who are unequivocally qualified to care for them.”
The backlash was swift and sharp. In a strongly worded editorial response published in July, the American College of Chest Physicians (ACCP) and the American Association of Critical-Care Nurses (AACN) declared that one year of fellowship training is inadequate for HM physicians to achieve competence in critical-care medicine.2 “No, the perfect should not be the enemy of the good in our efforts to craft solutions,” the editorial stated. “But the current imperfect SCCM/SHM proposal is an enemy of the existing good training processes already in place.”
HM leaders counter that the current strategies for bolstering the ranks of board-certified intensivists simply aren’t working, and that creative, outside-the-box thinking is required to solve the dilemma.

“Hospitalists are rapidly becoming a dominant, if not the dominant, block of physicians who are providing critical care in the United States. You can decide, if you want, whether that’s good or bad, but that’s the reality,” says Eric Siegal, MD, SFHM, lead author of the SHM/SCCM position paper, director of critical-care medicine at Aurora St. Luke’s Medical Center in Milwaukee, and an SHM board member. Given the escalating shortage of intensivists, he says, he believes that concerned stakeholders can either try to help develop the skills and knowledge of those hospitalists already in the ICU or “hope that a whole bunch of hospitalists suddenly decide to abandon their practices and complete two-year medical
critical-care fellowships.”
Intensivist leaders say that less training will do nothing to improve patient outcomes. “The reality is that hospitalists are doing it. The question should be, ‘Are they doing it well or at the detriment of the patient?’” asks Michael Baumann, MD, MS, FCCP, professor of medicine in the division of pulmonary, critical-care, and sleep medicine at the University of Mississippi Medical Center in Jackson. “The patient is the one who loses if we have somebody pinch-hitting, which is really what we’re talking about here,” adds Dr. Baumann, lead author of the ACCP/AACN editorial.
Staffing Shortfall
Despite the heated rhetoric, interviews with leaders on both sides suggest an eagerness to move forward in trying to collectively solve a problem that has vexed the entire medical community.
In 2000, the Leapfrog Group, a Washington, D.C.-based consortium of major healthcare purchasers focused on improving the safety, quality, and value of care, recommended that all ICUs should be staffed with physicians certified in critical-care medicine.3 As part of its rationale, the group cited research suggesting that greater intensivist use can yield better patient outcomes.
But a seminal study published the same year hinted at just how difficult meeting Leapfrog’s ambitious goal might be. Based on the trajectory of supply and demand, the authors forecast a 22% shortfall in intensivist hours by 2020, and a 35% shortfall by 2030, mainly due to a surge in demand from an aging U.S. population.4 A follow-up report in 2006 estimated that 53% of the nation’s ICU units had no intensivist coverage at all, and that only 4% of adult ICUs were meeting the full Leapfrog standards of high-intensity ICU staffing, dedicated attending physician coverage during the day, and dedicated coverage by any physician at night.5

—Timothy Buchman, PhD, MD, director, Emory University Center for Critical Care, Atlanta
Given the recent push for more outpatient treatment of less-critically-ill patients, many observers say the increased acuity of hospitalized patients—with more comorbidities—only exacerbates the mismatch between supply and demand. Making matters worse, providers are not evenly distributed throughout the country, with many smaller and rural hospitals already facing an acute shortage of intensivist services.
As a result, many hospitalists have been forced to step into the breach. According to SHM’s 2012 State of Hospital Medicine survey, 83.5% of responding nonacademic adult medicine groups said they routinely provide care for patients in an ICU setting, along with 27.9% of academic HM groups.
“So we have hospitalists who, either by choice or by default, care for patients who they may or may not be fully qualified to manage,” Dr. Siegal says. Practically speaking, he and his coauthors assert, the question of whether hospitalists should be in the ICU is now moot. The real question is how to ensure that those providers can deliver safe and effective care.
Experience vs. Training
Currently, internists who have completed fellowships in such specialties as pulmonary medicine, nephrology, and infectious disease can complete a one-year critical-care fellowship to obtain board certification. Experienced hospitalists have questioned the requirement that they instead complete a two-year fellowship, with no consideration given to the relevant clinical experience and maturity gained after years of hospitalist practice. In addition, they argue, it is logistically and financially unrealistic to expect a large cadre of experienced hospitalists to abandon their practices for two years to pursue critical-care training.
But Dr. Baumann says subpar internal-medicine residency requirements deserve much of the blame for offering inadequate training. “Critical care is a blend of critical thinking skills and procedural skills. Both of those are diminished tremendously in the current programs for internal medicine,” he says. “It’s really an indictment of our current training of internal-medicine residents now.”
SCCM, for its part, is sticking to its guns, albeit more quietly. When asked for comment, a spokesman issued a carefully worded statement that reads, “The paper reflects the society’s concerns regarding workforce shortages and the realities of today’s environment.”
The SHM/SCCM proposal makes sense provided that hospitalists are realistic about the types of patients they’ll see, says Timothy Buchman, PhD, MD, director of Emory University’s Center for Critical Care in Atlanta. “No one in their right mind will say one year is as good as two years. That would be folly,” he says. “On the other hand, that’s not the question. The question is, ‘Can we structure training that is competency-focused, so that the majority of people who enter the training will achieve the necessary levels of competency within a year?’”

Derek Angus, MD, chair of critical-care medicine at the University of Pittsburgh Medical Center and lead author of the 2000 study chronicling the intensivist shortfall, is more ambivalent. “Hospitalists and intensivists have to work hand in hand. In many ways, they are the two groups that run inpatient hospital medicine,” he says. In that respect, sorting out and streamlining training pathways might be a good idea.
“On the other hand, all of intensive-care training in the United States is a little thin in comparison to what goes on in many other countries,” Dr. Angus adds. “If anything, I would like to be seeing more vigorous training. So creating one more pathway that helps reinforce pretty light training feels like accreditation, in general, may be moving slightly in the wrong direction.”
Dr. Buchman and other observers view the debate as a difference in opinion among well-meaning people who are passionate about patient care. And they concede that no one knows yet who may be right.
“We do know that advanced training is required. We do know that it should be competency-focused,” Dr. Buchman says. “But what we don’t know is how long it’s really going to take to get to the competency levels that we believe are necessary to care for the patients.”
That point may provide one important opening for further discussions. Dr. Baumann agrees that the real issues are how to define critical-care competencies, how to measure them, and how to ensure that trainees prove their mettle as competent providers. “It really shouldn’t be time-based; it should be outcome-based,” he says.
The SHM/SCCM proposal, Dr. Siegal says, should be viewed as a conversation-starter. The true test will be whether everyone can reach an agreement on how to evaluate whether an ICU caregiver has attained the necessary knowledge, skills, and attitudes—and how relevant professional experience should factor into discussions over the length of training required for intensivist certification.
A Tiered Solution
The concept of tiered ICU care—already used in neonatal ICUs—might offer another opening for productive debate. “Can patients who are not that critically ill be managed by someone who hasn’t done that much critical-care training?” Dr. Angus asks. He believes it’s possible, provided patients are properly sorted and that hospitalists aren’t put in the uncomfortable position of managing medical conditions that they see only rarely. He has no problem, though, envisioning a tiered system in which fully trained intensivists spend most of their time managing the sickest patients, while other providers—including hospitalists—care for patients at intermediate risk.
Hospitalists have greeted the idea cautiously, noting that a two-tiered model might be difficult to define and standardize, and that it could present logistical challenges around transferring patients. However, Daniel D. Dressler, MD, MSc, SFHM, FACP, associate professor of internal medicine at Emory University School of Medicine and coauthor of the SHM/SCCM position paper, led a recent study that offers at least some support for a risk-based system.6
Overall, the study found no statistically significant difference in the length of stay or inpatient mortality rates for ICU patients cared for by hospitalist-led or intensivist-led teams. Among mechanically ventilated patients with intermediate illness severity, though, the study suggested that intensivist-led care resulted in a lower length of stay in both the hospital and ICU, as well as in a trend toward reduced inpatient mortality. “There may be some value in designing or developing a stratification system,” Dr. Dressler says, “but it definitely needs more study.”
In the meantime, Dr. Dressler says, more rapid solutions are needed. And although he says he understands and respects many of the doubts expressed about the SHM/SCCM proposal, he also believes some of the fear might be based on anecdotes about individual hospitalists who were deemed unlikely to thrive in an ICU environment. “For each person like that, we also know 10 or 20 people who might do really well” with just a year of additional training, says Dr. Dressler, a former SHM board member.
Now that both sides clearly have the attention of the other, leaders say they hope the opening salvos give way to more temperate discussions about how to move more skilled providers to the front lines.
“Health professionals are a smart and clever lot,” says Mary Stahl, RN, MSN, ACNS-BC, CCNS-CMC, CCRN, immediate past president of AACN and a clinical nurse specialist at the Mid America Heart Institute at Saint Luke’s Hospital in Kansas City, Mo. “I’m confident we’ll develop an effective solution—maybe several—by focusing on the fundamental belief that patients’ needs must drive caregivers’ knowledge and skills.”
Bryn Nelson is a freelance medical writer in Seattle.
References
- Siegal EM, Dressler DD, Dichter JR, Gorman MJ, Lipsett PA. Training a hospitalist workforce to address the intensivist shortage in American hospitals: a position paper from the Society of Hospital Medicine and the Society of Critical Care Medicine. J Hosp Med. 2012;7:359-364.
- Baumann MH, Simpson SQ, Stahl M, et al. First, do no harm: less training ≠ quality care. Chest. 2012;142:5-7.
- Milstein A, Galvin RS, Delbanco SF, et al. Improving the safety of health care: the Leapfrog initiative. Eff Clin Pract. 2000;3:313-316.
- Angus DC, Kelley MA, Schmitz RJ, et al. Caring for the critically ill patient. Current and projected workforce requirements for care of the critically ill and patients with pulmonary disease: can we meet the requirements of an aging population? JAMA. 2000;284:2762-2770.
- Angus DC, Shorr AF, White A, et al. Critical care delivery in the United States: distribution of services and compliance with Leapfrog recommendations. Crit Care Med. 2006;34:1016-1024.
- Wise KR, Akopov VA, Williams BR Jr., Ido MS, Leeper KV, Dressler DD. Hospitalists and intensivists in the medical ICU: a prospective observational study comparing mortality and length of stay between two staffing models. J Hosp Med. 2012;7:183-189.
The long-simmering debate over whether and how hospitalists might help solve the worsening shortage of critical-care physicians is beginning to boil over.
In June, SHM and the Society of Critical Care Medicine (SCCM) issued a joint position paper proposing an expedited, one-year, critical-care fellowship for hospitalists with at least three years of clinical job experience, in lieu of the two-year fellowship now required for board certification.1
“Bringing qualified hospitalists into the critical-care workforce through rigorous sanctioned and accredited one-year training programs,” the paper asserted, “will open a new intensivist training pipeline and potentially offer more critically ill patients the benefits of providers who are unequivocally qualified to care for them.”
The backlash was swift and sharp. In a strongly worded editorial response published in July, the American College of Chest Physicians (ACCP) and the American Association of Critical-Care Nurses (AACN) declared that one year of fellowship training is inadequate for HM physicians to achieve competence in critical-care medicine.2 “No, the perfect should not be the enemy of the good in our efforts to craft solutions,” the editorial stated. “But the current imperfect SCCM/SHM proposal is an enemy of the existing good training processes already in place.”
HM leaders counter that the current strategies for bolstering the ranks of board-certified intensivists simply aren’t working, and that creative, outside-the-box thinking is required to solve the dilemma.
“Hospitalists are rapidly becoming a dominant, if not the dominant, block of physicians who are providing critical care in the United States. You can decide, if you want, whether that’s good or bad, but that’s the reality,” says Eric Siegal, MD, SFHM, lead author of the SHM/SCCM position paper, director of critical-care medicine at Aurora St. Luke’s Medical Center in Milwaukee, and an SHM board member. Given the escalating shortage of intensivists, he says, he believes that concerned stakeholders can either try to help develop the skills and knowledge of those hospitalists already in the ICU or “hope that a whole bunch of hospitalists suddenly decide to abandon their practices and complete two-year medical
critical-care fellowships.”
Intensivist leaders say that less training will do nothing to improve patient outcomes. “The reality is that hospitalists are doing it. The question should be, ‘Are they doing it well or at the detriment of the patient?’” asks Michael Baumann, MD, MS, FCCP, professor of medicine in the division of pulmonary, critical-care, and sleep medicine at the University of Mississippi Medical Center in Jackson. “The patient is the one who loses if we have somebody pinch-hitting, which is really what we’re talking about here,” adds Dr. Baumann, lead author of the ACCP/AACN editorial.
Staffing Shortfall
Despite the heated rhetoric, interviews with leaders on both sides suggest an eagerness to move forward in trying to collectively solve a problem that has vexed the entire medical community.
In 2000, the Leapfrog Group, a Washington, D.C.-based consortium of major healthcare purchasers focused on improving the safety, quality, and value of care, recommended that all ICUs should be staffed with physicians certified in critical-care medicine.3 As part of its rationale, the group cited research suggesting that greater intensivist use can yield better patient outcomes.
But a seminal study published the same year hinted at just how difficult meeting Leapfrog’s ambitious goal might be. Based on the trajectory of supply and demand, the authors forecast a 22% shortfall in intensivist hours by 2020, and a 35% shortfall by 2030, mainly due to a surge in demand from an aging U.S. population.4 A follow-up report in 2006 estimated that 53% of the nation’s ICU units had no intensivist coverage at all, and that only 4% of adult ICUs were meeting the full Leapfrog standards of high-intensity ICU staffing, dedicated attending physician coverage during the day, and dedicated coverage by any physician at night.5
—Timothy Buchman, PhD, MD, director, Emory University Center for Critical Care, Atlanta
Given the recent push for more outpatient treatment of less-critically-ill patients, many observers say the increased acuity of hospitalized patients—with more comorbidities—only exacerbates the mismatch between supply and demand. Making matters worse, providers are not evenly distributed throughout the country, with many smaller and rural hospitals already facing an acute shortage of intensivist services.
As a result, many hospitalists have been forced to step into the breach. According to SHM’s 2012 State of Hospital Medicine survey, 83.5% of responding nonacademic adult medicine groups said they routinely provide care for patients in an ICU setting, along with 27.9% of academic HM groups.
“So we have hospitalists who, either by choice or by default, care for patients who they may or may not be fully qualified to manage,” Dr. Siegal says. Practically speaking, he and his coauthors assert, the question of whether hospitalists should be in the ICU is now moot. The real question is how to ensure that those providers can deliver safe and effective care.
Experience vs. Training
Currently, internists who have completed fellowships in such specialties as pulmonary medicine, nephrology, and infectious disease can complete a one-year critical-care fellowship to obtain board certification. Experienced hospitalists have questioned the requirement that they instead complete a two-year fellowship, with no consideration given to the relevant clinical experience and maturity gained after years of hospitalist practice. In addition, they argue, it is logistically and financially unrealistic to expect a large cadre of experienced hospitalists to abandon their practices for two years to pursue critical-care training.
But Dr. Baumann says subpar internal-medicine residency requirements deserve much of the blame for offering inadequate training. “Critical care is a blend of critical thinking skills and procedural skills. Both of those are diminished tremendously in the current programs for internal medicine,” he says. “It’s really an indictment of our current training of internal-medicine residents now.”
SCCM, for its part, is sticking to its guns, albeit more quietly. When asked for comment, a spokesman issued a carefully worded statement that reads, “The paper reflects the society’s concerns regarding workforce shortages and the realities of today’s environment.”
The SHM/SCCM proposal makes sense provided that hospitalists are realistic about the types of patients they’ll see, says Timothy Buchman, PhD, MD, director of Emory University’s Center for Critical Care in Atlanta. “No one in their right mind will say one year is as good as two years. That would be folly,” he says. “On the other hand, that’s not the question. The question is, ‘Can we structure training that is competency-focused, so that the majority of people who enter the training will achieve the necessary levels of competency within a year?’”
Derek Angus, MD, chair of critical-care medicine at the University of Pittsburgh Medical Center and lead author of the 2000 study chronicling the intensivist shortfall, is more ambivalent. “Hospitalists and intensivists have to work hand in hand. In many ways, they are the two groups that run inpatient hospital medicine,” he says. In that respect, sorting out and streamlining training pathways might be a good idea.
“On the other hand, all of intensive-care training in the United States is a little thin in comparison to what goes on in many other countries,” Dr. Angus adds. “If anything, I would like to be seeing more vigorous training. So creating one more pathway that helps reinforce pretty light training feels like accreditation, in general, may be moving slightly in the wrong direction.”
Dr. Buchman and other observers view the debate as a difference in opinion among well-meaning people who are passionate about patient care. And they concede that no one knows yet who may be right.
“We do know that advanced training is required. We do know that it should be competency-focused,” Dr. Buchman says. “But what we don’t know is how long it’s really going to take to get to the competency levels that we believe are necessary to care for the patients.”
That point may provide one important opening for further discussions. Dr. Baumann agrees that the real issues are how to define critical-care competencies, how to measure them, and how to ensure that trainees prove their mettle as competent providers. “It really shouldn’t be time-based; it should be outcome-based,” he says.
The SHM/SCCM proposal, Dr. Siegal says, should be viewed as a conversation-starter. The true test will be whether everyone can reach an agreement on how to evaluate whether an ICU caregiver has attained the necessary knowledge, skills, and attitudes—and how relevant professional experience should factor into discussions over the length of training required for intensivist certification.
A Tiered Solution
The concept of tiered ICU care—already used in neonatal ICUs—might offer another opening for productive debate. “Can patients who are not that critically ill be managed by someone who hasn’t done that much critical-care training?” Dr. Angus asks. He believes it’s possible, provided patients are properly sorted and that hospitalists aren’t put in the uncomfortable position of managing medical conditions that they see only rarely. He has no problem, though, envisioning a tiered system in which fully trained intensivists spend most of their time managing the sickest patients, while other providers—including hospitalists—care for patients at intermediate risk.
Hospitalists have greeted the idea cautiously, noting that a two-tiered model might be difficult to define and standardize, and that it could present logistical challenges around transferring patients. However, Daniel D. Dressler, MD, MSc, SFHM, FACP, associate professor of internal medicine at Emory University School of Medicine and coauthor of the SHM/SCCM position paper, led a recent study that offers at least some support for a risk-based system.6
Overall, the study found no statistically significant difference in the length of stay or inpatient mortality rates for ICU patients cared for by hospitalist-led or intensivist-led teams. Among mechanically ventilated patients with intermediate illness severity, though, the study suggested that intensivist-led care resulted in a lower length of stay in both the hospital and ICU, as well as in a trend toward reduced inpatient mortality. “There may be some value in designing or developing a stratification system,” Dr. Dressler says, “but it definitely needs more study.”
In the meantime, Dr. Dressler says, more rapid solutions are needed. And although he says he understands and respects many of the doubts expressed about the SHM/SCCM proposal, he also believes some of the fear might be based on anecdotes about individual hospitalists who were deemed unlikely to thrive in an ICU environment. “For each person like that, we also know 10 or 20 people who might do really well” with just a year of additional training, says Dr. Dressler, a former SHM board member.
Now that both sides clearly have the attention of the other, leaders say they hope the opening salvos give way to more temperate discussions about how to move more skilled providers to the front lines.
“Health professionals are a smart and clever lot,” says Mary Stahl, RN, MSN, ACNS-BC, CCNS-CMC, CCRN, immediate past president of AACN and a clinical nurse specialist at the Mid America Heart Institute at Saint Luke’s Hospital in Kansas City, Mo. “I’m confident we’ll develop an effective solution—maybe several—by focusing on the fundamental belief that patients’ needs must drive caregivers’ knowledge and skills.”
Bryn Nelson is a freelance medical writer in Seattle.
References
- Siegal EM, Dressler DD, Dichter JR, Gorman MJ, Lipsett PA. Training a hospitalist workforce to address the intensivist shortage in American hospitals: a position paper from the Society of Hospital Medicine and the Society of Critical Care Medicine. J Hosp Med. 2012;7:359-364.
- Baumann MH, Simpson SQ, Stahl M, et al. First, do no harm: less training ≠ quality care. Chest. 2012;142:5-7.
- Milstein A, Galvin RS, Delbanco SF, et al. Improving the safety of health care: the Leapfrog initiative. Eff Clin Pract. 2000;3:313-316.
- Angus DC, Kelley MA, Schmitz RJ, et al. Caring for the critically ill patient. Current and projected workforce requirements for care of the critically ill and patients with pulmonary disease: can we meet the requirements of an aging population? JAMA. 2000;284:2762-2770.
- Angus DC, Shorr AF, White A, et al. Critical care delivery in the United States: distribution of services and compliance with Leapfrog recommendations. Crit Care Med. 2006;34:1016-1024.
- Wise KR, Akopov VA, Williams BR Jr., Ido MS, Leeper KV, Dressler DD. Hospitalists and intensivists in the medical ICU: a prospective observational study comparing mortality and length of stay between two staffing models. J Hosp Med. 2012;7:183-189.
CORRECTION
A dosage recommendation in the August 2012 article “What is the Optimal Therapy for Acute DVT” (p. 17) should have read: The 2012 American College of Chest Physicians (ACCP) guidelines on antithrombotic therapy for VTE recommends initial therapy with LMWH or fondaparinux (rather than IV or SC UFH). The guidelines suggest that LMWH once-daily dosing is favored over twice-daily dosing, based mainly on patient convenience, although this is a weak recommendation (2C) based on the overall quality of the data. The recommendation applies only if the daily dosing of the LMWH, including tinzaparin, dalteparin, and nadroparin, is equivalent to the twice-daily dosing (i.e. dalteparin may be dosed at 100 units/kg BID vs. 200 units/kg daily). Of importance, enoxaparin has not been studied at a once-daily dose (2 mg/kg), which is equivalent to the twice-daily dosing regimen (1 mg/kg twice daily). Additionally, one study suggests that once-daily dosing of enoxaparin 1.5 mg/kg might be inferior to 1 mg/kg twice daily dosing; therefore, caution must be exercised in applying this recommendation to the LMWH enoxaparin.3,27,28
A dosage recommendation in the August 2012 article “What is the Optimal Therapy for Acute DVT” (p. 17) should have read: The 2012 American College of Chest Physicians (ACCP) guidelines on antithrombotic therapy for VTE recommends initial therapy with LMWH or fondaparinux (rather than IV or SC UFH). The guidelines suggest that LMWH once-daily dosing is favored over twice-daily dosing, based mainly on patient convenience, although this is a weak recommendation (2C) based on the overall quality of the data. The recommendation applies only if the daily dosing of the LMWH, including tinzaparin, dalteparin, and nadroparin, is equivalent to the twice-daily dosing (i.e. dalteparin may be dosed at 100 units/kg BID vs. 200 units/kg daily). Of importance, enoxaparin has not been studied at a once-daily dose (2 mg/kg), which is equivalent to the twice-daily dosing regimen (1 mg/kg twice daily). Additionally, one study suggests that once-daily dosing of enoxaparin 1.5 mg/kg might be inferior to 1 mg/kg twice daily dosing; therefore, caution must be exercised in applying this recommendation to the LMWH enoxaparin.3,27,28
A dosage recommendation in the August 2012 article “What is the Optimal Therapy for Acute DVT” (p. 17) should have read: The 2012 American College of Chest Physicians (ACCP) guidelines on antithrombotic therapy for VTE recommends initial therapy with LMWH or fondaparinux (rather than IV or SC UFH). The guidelines suggest that LMWH once-daily dosing is favored over twice-daily dosing, based mainly on patient convenience, although this is a weak recommendation (2C) based on the overall quality of the data. The recommendation applies only if the daily dosing of the LMWH, including tinzaparin, dalteparin, and nadroparin, is equivalent to the twice-daily dosing (i.e. dalteparin may be dosed at 100 units/kg BID vs. 200 units/kg daily). Of importance, enoxaparin has not been studied at a once-daily dose (2 mg/kg), which is equivalent to the twice-daily dosing regimen (1 mg/kg twice daily). Additionally, one study suggests that once-daily dosing of enoxaparin 1.5 mg/kg might be inferior to 1 mg/kg twice daily dosing; therefore, caution must be exercised in applying this recommendation to the LMWH enoxaparin.3,27,28
Rules of Engagement Necessary for Comanagement of Orthopedic Patients

One of our providers wants to use adult hospitalists for coverage of inpatient orthopedic surgery patients. Is this acceptable practice? Are there qualifiers?
–Libby Gardner
Dr. Hospitalist responds:
Let’s see how far we can tackle this open-ended question. There has been lots of discussion on the topic of comanagement in the past by people eminently more qualified than I am. Still, it never hurts to take a fresh look at things.
For one, on the subject of admissions, I am a firm believer that hospitalists should admit all adult hip fractures. The overwhelming majority of the time, these patients are elderly with comorbid conditions. Sure, they are going to get their hip fixed, because the alternative is usually unacceptable, but some thought needs to go into the process. The orthopedic surgeon sees a hip that needs fixing and not much else. When issues like renal failure, afib, CHF, prior DVT, or dementia are present, hospitalists should take charge of the case. It is the best way to ensure that the patient receives optimal medical care and the documentation that goes along with it. I love our orthopedic surgeons, but I don’t want them primarily admitting, managing, and discharging my elderly patients. Let the surgeon do what they do best, which is operate, and leave the rest to us.
On the subject of orthopedic trauma, I take the exact opposite tack—this is not something for which I or most of my colleagues have expertise. A young, healthy patient with trauma should be admitted by the orthopedic service; that patient population’s complications are much more likely to be directly related to their trauma.
When it comes to elective surgery, when the admitting surgeon (orthopedic or otherwise) wants the help of a hospitalist, then I think it is of paramount importance to have clear “rules of engagement.” I think with good expectations, you can have a fantastic working relationship with your surgeons. Without them, it becomes a nightmare.
Here are my HM group’s rules for elective orthopedic surgery:
- Orthopedics handles all pain medications and VTE prophylaxis, including discharge prescriptions.
- Medicine handles all admit and discharge medication reconciliation (“med rec”).
- There is shared discussion on:
- Need for transfusion; and
- The VTE prophylaxis when a patient already is on chronic anticoagulation.
We do not vary from this protocol. I never adjust a patient’s pain medications. Even the floor nurses know this. Because I’m doing the admit med rec, it also means that the patient doesn’t have their HCTZ continued after 600cc of EBL and spinal anesthesia.
The system works because the rules are clear and the communication is consistent. This does not mean that we cover the orthopedic service at night. They are equally responsible for their patients under the items outlined above. In my view—and this might sound simplistic—the surgeon caused the post-op pain, so they should be responsible for managing it. On VTE prophylaxis, I might take a more nuanced view, but for our surgeons, they own the wound and the post-op follow-up, so they get the choice on what agent to use.
Would I accept an arrangement in which I covered all the orthopedic issues out of regular hours? Nope—not when they have primary responsibility for the case; they should always be directly available to the nurse. I think that anything else would be a system ripe for abuse.
Our exact rules will not work for every situation, but I would strongly encourage the two basic tenets from above: No. 1, the hospitalist should primarily admit and manage elderly hip fractures, and No. 2, clear rules of engagement should be established with your orthopedic or surgery group. It’s a discussion worth having during daylight hours, because trying to figure out the rules at 3 in the morning rarely ends well.
Society of Hospital Medicine Seeks to Connect Hospitalists Far and Wide
Hospitalists join SHM for lots of reasons, but the ability to network with hospitalists across the country is among the top motivators. In an emerging medical specialty, being able to collaborate and connect with peers is critical to career development and improving care.
Now, SHM has made connecting and collaborating easier than ever with Hospital Medicine Exchange (HMX), the first online community exclusively for hospitalists and hot topics in HM. Using HMX, hospitalists can start public discussions, post responses, and share files in one location.
For fast-moving issues, such as healthcare reform and hospitalist program management, HMX enables hospitalists to go straight to the source of some of the most important innovations: other hospitalists.
Using HMX is easy. Hospitalists log in to HMX using their SHM member username and password at HMXchange.org (automated assistance is available for those who don’t know their usernames or passwords). Once logged into HMX, hospitalists can browse communities, check out recent discussion threads, and update their profiles. Members can browse contacts to connect with thousands of other HMX users.
In addition to being the new home for conversations in hospital medicine, communities within HMX are replacing an array of legacy programs (e.g. the email listservs for practice management and SHM’s Leadership Academy alumni). HMX provides new flexibility not available in older systems like the listservs. Users can now opt into communities easily and decide how often they receive updates via email.
Conversation-Starters
Some hospitalists began collaborating with the HMX platform nearly a year ago. At the time, the platform was known as Higher Logic and supported SHM’s CODE-H, an educational program for hospital coding, along with SHM’s Hospital Value-Based Purchasing Toolkit (HVBP), a set of online resources and a community for hospitalists preparing their hospitals for value-based purchasing.
Patrick Torcson, MD, MMM, FACP, SFHM, led the HVBP community and sees the promise that HMX offers hospitalists. “It’s a nice synthesis of both content and resources because of the networking element,” he says. “It has a very real personal element as well.”
The HVBP community used HMX as equal parts educational session, networking, and library. Dr. Torcson and community members presented webinars, then followed up with discussions. Community members also shared resources about value-based purchasing through the discussion threads and the online library.
The immediate online interaction proved to be especially valuable when discussing a topic that was anything but static, he says.
“Because hospital value-based purchasing was unfolding over a timeline from [the Centers for Medicare & Medicaid Services (CMS)], we were able to add content as the program unfolded, including policy papers from Washington, webinars, and other relevant information,” Dr. Torcson explains. “For something like value-based purchasing, there’s no definitive source, so the collaboration was helpful. It’s true for a lot of topics in hospital medicine.
“To have a community tool like this that can accommodate for all the different inputs is really very valuable,” he adds.

—Patrick Torcson, MD, MMM, FACP, SFHM, chair, SHM’s Performance Measuring and Reporting Committee
Something for Every Member
In addition to a community for general issues affecting hospitalists, HMX also features specific communities designed to facilitate conversations on particular issues. As the communities evolve and conversations develop, SHM will add new communities.
Because so many hospitalists access the Internet from mobile devices, HMX is available for iPhones, iPads, and Android platforms through a third-party mobile application. Instructions for downloading and using the app are available at the HMX website.
SHM notified certain listserv users and others about the HMX introduction in August and September. Users quickly took to the new platform. Within a week of introducing HMX, nearly 100 hospitalists logged in for the first time.
The early interest in HMX isn’t surprising to Dr. Torcson, who says he “definitely” will use HMX in the future.
“It’s a great way to share best practices and case studies,” he says. “The personal dimension was really nice to connect so easily with the hospital medicine community. It’s nice to get the perspectives from other colleagues around the country and in different settings.”
Brendon Shank is SHM’s associate vice president of communications.
Hospitalists join SHM for lots of reasons, but the ability to network with hospitalists across the country is among the top motivators. In an emerging medical specialty, being able to collaborate and connect with peers is critical to career development and improving care.
Now, SHM has made connecting and collaborating easier than ever with Hospital Medicine Exchange (HMX), the first online community exclusively for hospitalists and hot topics in HM. Using HMX, hospitalists can start public discussions, post responses, and share files in one location.
For fast-moving issues, such as healthcare reform and hospitalist program management, HMX enables hospitalists to go straight to the source of some of the most important innovations: other hospitalists.
Using HMX is easy. Hospitalists log in to HMX using their SHM member username and password at HMXchange.org (automated assistance is available for those who don’t know their usernames or passwords). Once logged into HMX, hospitalists can browse communities, check out recent discussion threads, and update their profiles. Members can browse contacts to connect with thousands of other HMX users.
In addition to being the new home for conversations in hospital medicine, communities within HMX are replacing an array of legacy programs (e.g. the email listservs for practice management and SHM’s Leadership Academy alumni). HMX provides new flexibility not available in older systems like the listservs. Users can now opt into communities easily and decide how often they receive updates via email.
Conversation-Starters
Some hospitalists began collaborating with the HMX platform nearly a year ago. At the time, the platform was known as Higher Logic and supported SHM’s CODE-H, an educational program for hospital coding, along with SHM’s Hospital Value-Based Purchasing Toolkit (HVBP), a set of online resources and a community for hospitalists preparing their hospitals for value-based purchasing.
Patrick Torcson, MD, MMM, FACP, SFHM, led the HVBP community and sees the promise that HMX offers hospitalists. “It’s a nice synthesis of both content and resources because of the networking element,” he says. “It has a very real personal element as well.”
The HVBP community used HMX as equal parts educational session, networking, and library. Dr. Torcson and community members presented webinars, then followed up with discussions. Community members also shared resources about value-based purchasing through the discussion threads and the online library.
The immediate online interaction proved to be especially valuable when discussing a topic that was anything but static, he says.
“Because hospital value-based purchasing was unfolding over a timeline from [the Centers for Medicare & Medicaid Services (CMS)], we were able to add content as the program unfolded, including policy papers from Washington, webinars, and other relevant information,” Dr. Torcson explains. “For something like value-based purchasing, there’s no definitive source, so the collaboration was helpful. It’s true for a lot of topics in hospital medicine.
“To have a community tool like this that can accommodate for all the different inputs is really very valuable,” he adds.
—Patrick Torcson, MD, MMM, FACP, SFHM, chair, SHM’s Performance Measuring and Reporting Committee
Something for Every Member
In addition to a community for general issues affecting hospitalists, HMX also features specific communities designed to facilitate conversations on particular issues. As the communities evolve and conversations develop, SHM will add new communities.
Because so many hospitalists access the Internet from mobile devices, HMX is available for iPhones, iPads, and Android platforms through a third-party mobile application. Instructions for downloading and using the app are available at the HMX website.
SHM notified certain listserv users and others about the HMX introduction in August and September. Users quickly took to the new platform. Within a week of introducing HMX, nearly 100 hospitalists logged in for the first time.
The early interest in HMX isn’t surprising to Dr. Torcson, who says he “definitely” will use HMX in the future.
“It’s a great way to share best practices and case studies,” he says. “The personal dimension was really nice to connect so easily with the hospital medicine community. It’s nice to get the perspectives from other colleagues around the country and in different settings.”
Brendon Shank is SHM’s associate vice president of communications.
Hospitalists On the Move

Susan D. Hutchins, MD, has been named medical director of hospitalist services at Memorial Hermann The Woodlands Hospital in The Woodlands, Texas. Dr. Hutchins’ new responsibilities include managing nine hospitalists, two nurse practitioners, and one registered nurse as part of Memorial Hermann’s inpatient hospitalist program.

Lewis L. Low, MD, FCCM, FACP, has been promoted to senior vice president and chief medical officer of Legacy Health System in the Portland, Ore., and Vancouver, Wash., areas. Dr. Low has been commended by his colleagues for his supervision of several of Legacy’s hospitalist programs within the Portland metropolitan area.
Business Moves

Helena Regional Medical Center in Helena, Ark., began offering hospitalist services in September. Hospitalists will staff the 155-bed facility 24 hours a day in order to further the hospital’s mission of “Quality Care, Right Here.”
Inpatient Physicians of Southwest Florida (ISSF), a newly formed hospitalist group, has begun offering HM services in the Lee Memorial Health System’s Fort Myers, Fla.-area hospitals. ISSF is a collaborative between Brentwood, Tenn.-based Cogent HMG and the Hospitalist Group of Southwest Florida.

The Mauldin, S.C.-based OB Hospitalist Group has expanded its services to include the Owensboro Medical Health System’s 477-bed flagship facility in Owensboro, Ky., which serves northwestern Kentucky and southwestern Indiana.
—Michael O’Neal
Susan D. Hutchins, MD, has been named medical director of hospitalist services at Memorial Hermann The Woodlands Hospital in The Woodlands, Texas. Dr. Hutchins’ new responsibilities include managing nine hospitalists, two nurse practitioners, and one registered nurse as part of Memorial Hermann’s inpatient hospitalist program.
Lewis L. Low, MD, FCCM, FACP, has been promoted to senior vice president and chief medical officer of Legacy Health System in the Portland, Ore., and Vancouver, Wash., areas. Dr. Low has been commended by his colleagues for his supervision of several of Legacy’s hospitalist programs within the Portland metropolitan area.
Business Moves
Helena Regional Medical Center in Helena, Ark., began offering hospitalist services in September. Hospitalists will staff the 155-bed facility 24 hours a day in order to further the hospital’s mission of “Quality Care, Right Here.”
Inpatient Physicians of Southwest Florida (ISSF), a newly formed hospitalist group, has begun offering HM services in the Lee Memorial Health System’s Fort Myers, Fla.-area hospitals. ISSF is a collaborative between Brentwood, Tenn.-based Cogent HMG and the Hospitalist Group of Southwest Florida.
The Mauldin, S.C.-based OB Hospitalist Group has expanded its services to include the Owensboro Medical Health System’s 477-bed flagship facility in Owensboro, Ky., which serves northwestern Kentucky and southwestern Indiana.
—Michael O’Neal
Fellow in Hospital Medicine Spotlight: Kenric Maynor, MD, MPH, FHM

CAREER: Prior to joining Geisinger, Dr. Maynor served as a Robert Wood Johnson Clinical Scholar in Internal Medicine at Johns Hopkins Medical Center, Baltimore.
Education: University of North Carolina School of Medicine, internal medicine residency at Yale-New Haven Hospital; and internal medicine fellowship at Johns Hopkins Medical Center.
Notable: Dr. Maynor’s responsibilities at Geisinger will include oversight of eight medical centers, as well as leading the implementation of a new hospitalist program at Geisinger Community Medical Center in Scranton, Pa., which is planned to be operational by fall.
FYI: A Native American member of the Lumbee Tribe in southeastern North Carolina, Dr. Maynor is an avid Baltimore Orioles fan.
Quotable: “Being designated as a Fellow in the Society of Hospital Medicine has confirmed to my institution my commitment to the growth and the development of hospitalists’ principles of quality improvement, innovation, and patient safety. It has given me instant access to other Fellows with similar interests to allow for networking and collaboration.”
We Welcome the Newest SHM Members
Enter text here
Enter text here
Enter text here