User login
Hospitalists Focus on Matters of the Heart
LAS VEGAS—Hospitalist Michael Hoftiezer, MD, has been to pre-courses at annual meetings before HM14, but yesterday’s lineup offered a new option: “Cardiology: What Hospitalists Need to Know as Front-Line Providers.”
The eight-hour seminar was one of three new pre-courses at SHM’s annual meeting, along with “Efficient High-Value Evidence-Based Medicine for the Practicing Hospitalist” and “NP/PA Playbook for Hospital Medicine.” The offerings drew hundreds of hospitalists to the unofficial first day of HM14 at Mandalay Bay Resort and Casino.
“It’s nice to have an extra day of learning,” says Dr. Hoftiezer, who practices at Holy Family Memorial Medical Center in Manitowoc, Wis. And “it’s concentrated on one subject. It’s a good overview of a single subject, rather than bouncing around different things.” Course director Matthews Chacko, MD, of Johns Hopkins Hospital in Baltimore, says the time is right for hospitalists to devote a full-day pre-course focused on cardiology. “Cardiovascular disease is the most common reason we die,” he says.
“It’s something hospital-based practitioners see often. Providing a comprehensive but yet simplified overview of the way to manage some of these diseases with talks given by some of the leading experts in the field seemed very appropriate for this meeting.”
The course covered such topics as arrhythmia, heart failure, peripheral artery disease, and unstable myocardial infarction. Dr. Hoftiezer says he gleaned tips he can take back to his hospital—including the mechanisms of atrial fibrillation and when to measure rhythm versus rate—and that’s what made the pre-course valuable.
“The more relevant, the better,” he adds. “My favorite lectures are the ones that change something I do.”
Relevance Fuels HM14 Schedule Decisions
LAS VEGAS—For the next two and a half days at the Mandalay Bay Resort and Casino, some 3,000 hospitalists attending SHM’s annual meeting will have 10 learning tracks and 115 educational sessions to choose from. Which raises a good question: How does a hospitalist make the difficult choice between two sessions of interest that are scheduled at the same time?
“What’s guiding me is: What’s more relevant to what I’m doing?” says hospitalist and first-time attendee Uzoeshi Anukam, MD, of Methodist Mansfield Medical Center in Texas. “What’s more relevant to my patient care? I see a lot of chest pain, so I’m going to jump on chest pain [sessions]. It’s relevant for me.”

The smorgasbord of educational tracks, rapid-fire sessions, and small-group workshops is a recipe for conflict, though. Multiple sessions could offer similar relevance.
“It’s pick your poison, sort of,” says Curt Lawrence, MD, a hospitalist who does locums tenens work in Miami. “To me, most of the topics are pretty interesting and informative. It’s a good problem to have, wanting to go to multiple things.”
Dr. Lawrence says SHM’s online repository of presentations, podcasts, and on-demand videos helps to fill the gaps when he misses a session. And Dr. Anukam says the HM14 At Hand application for smartphones and tablets assists in winnowing down choices and setting goals for which sessions to attend.
“Objectives put things in perspective and guide what things to go to,” Dr. Lawrence says. “My goal is to get as much as information as you can. As a hospitalist, it’s go-go-go-go. I want to spend this time to just stop and get information.”
LAS VEGAS—For the next two and a half days at the Mandalay Bay Resort and Casino, some 3,000 hospitalists attending SHM’s annual meeting will have 10 learning tracks and 115 educational sessions to choose from. Which raises a good question: How does a hospitalist make the difficult choice between two sessions of interest that are scheduled at the same time?
“What’s guiding me is: What’s more relevant to what I’m doing?” says hospitalist and first-time attendee Uzoeshi Anukam, MD, of Methodist Mansfield Medical Center in Texas. “What’s more relevant to my patient care? I see a lot of chest pain, so I’m going to jump on chest pain [sessions]. It’s relevant for me.”
The smorgasbord of educational tracks, rapid-fire sessions, and small-group workshops is a recipe for conflict, though. Multiple sessions could offer similar relevance.
“It’s pick your poison, sort of,” says Curt Lawrence, MD, a hospitalist who does locums tenens work in Miami. “To me, most of the topics are pretty interesting and informative. It’s a good problem to have, wanting to go to multiple things.”
Dr. Lawrence says SHM’s online repository of presentations, podcasts, and on-demand videos helps to fill the gaps when he misses a session. And Dr. Anukam says the HM14 At Hand application for smartphones and tablets assists in winnowing down choices and setting goals for which sessions to attend.
“Objectives put things in perspective and guide what things to go to,” Dr. Lawrence says. “My goal is to get as much as information as you can. As a hospitalist, it’s go-go-go-go. I want to spend this time to just stop and get information.”
HM14 Special Report: Research in Medical Education
“Stare at who you want to become,” Scott Wright, MD, at Johns Hopkins Bayview Medical Center told hospitalists at SHM’s annual meeting HM14. Look to others who have found success in researching medical education and “learn to steal without apology,” he added. Build upon the work of these mentors and then be sure to give them credit when due. To quote famed painter Pablo Picasso, Dr. Wright said, “Good artists copy, great artists steal.”
Key Takeaways
- Perform a self-assessment. Many of us start our careers with low competency in research skills. It is important to begin with an accurate self-assessment to find areas of weakness and then work with a research mentor to focus improvement on those areas;
- Expand your potential area of research. Medical education has traditionally been concerned with the education and training of residents, but it can also apply to younger clinical faculty and their acquisition of knowledge through continuing medical education;
- Understand how quality will be assessed. Learn how reviewers for journals judge quality and try to increase the quality of the study during the design stage, not the write-up stage; and
- Research new things to determine whether they can work, rather than big, already-implemented things to determine if they did work.
Dr. O’Callaghan is a Clinical Assistant Professor of Pediatrics at the University of Washington and a member of Team Hospitalist.
VIDEO: Battlefield lessons improve treatment of traumatic scars
DENVER – Military dermatologists have played an active role in helping wounded warriors with their scars, and those physicians’ practices, including the use of ablative fractional resurfacing, are now entering the civilian world to treat injuries from fire, car crashes, or blasts.
Earlier this year, a group of dermatologists published a consensus report to highlight best practices for laser treatment of traumatic scars. The groups, which included several military dermatologists, concluded that "laser treatment, particularly ablative fractional resurfacing, deserves a prominent role in future scar treatment paradigms, with the possible inclusion of early intervention for contracture avoidance and assistance with wound healing."
In a video interview at the American Academy of Dermatology’s annual meeting, Lt. Col. Chad M. Hivnor, USAF, MC, FS, USA, a staff dermatologist for the San Antonio (Tex.) Military Health System, discussed the use of lasers in treating traumatic scars, talked about the psychology of scars, and shared a few of his own practice pearls.
The video associated with this article is no longer available on this site. Please view all of our videos on the MDedge YouTube channel
On Twitter @naseemmiller
AT THE AAD ANNUAL MEETING
HM14 Special Report: SHM Leadership Committee Meeting
This year’s SHM leadership committee meeting brought together a great group of thought leaders passionate about developing strong leaders for tomorrow. Hospitalists with an interest in leadership have at their disposal three SHM Leadership Academies. These academies build the foundations of effective leadership, teach team building and conflict resolution, and help leaders better understand finances in hospital medicine. In addition, the Certificate of Leadership in Hospital Medicine (CLHM) is a program through which hospitalists are recognized by SHM for their leadership skills and training.
Hospitalists receive expert consultation and guidance for a hospital system project that they would like to implement in their home institution and upon completion, receive a Certificate of Leadership in Hospital Medicine. One of the committee members also pointed out that as a certified leader himself, he has had more success with recruiting quality, career-oriented hospitalists.
Another exciting endeavor this year is our book club. Look for a definitive date in the near future for our second online book club meeting. I am most certainly excited about this meeting because our book of choice is one of my personal favorites: Lean in: women, work and the will to lead.
As an active community on HMX, we would like to hear from our SHM members, leaders and frontline hospitalists alike, about the kind of resources that you might need to help you become better hospitalist leaders at your institution.
Key Takeaways
- Explore SHM Leadership Academies: foundation of leadership, personal excellence and team building, advanced leadership;
- Receive mentorship from experts in our field for a project that you would like to implement at your hospital through SHM’s Certificate of Leadership in Hospital Medicine;
- Let us know what resources you need to help you lead more effectively; and
- Join in on the conversation at our next book club meeting where we will discuss Lean in: women, work, and the will to lead.
Dr. Kanikkannan is Hospitalist Medical Director and Assistant Professor of Medicine Rowan University School of Osteopathic Medicine and serves on the SHM Leadership Committee. She is a member of Team Hospitalist.
Revascularization saves limbs, costs in elderly
In older, frailer patients, limb revascularization appeared to preserve both limbs and ambulation longer ? and cost less ? than either amputation or a program of local wound care. Although these patients had worse clinical outcomes than did healthy patients who had revascularization, the benefits were still evident, Dr. Neal R. Barshes and his colleagues wrote in the January issue of Annals of Vascular Surgery.
"We believe that major amputation should be reserved for patients who develop life-threatening foot infections that cannot be controlled with foot drainage or minor amputations and subsequent palliative wound care," wrote Dr. Barshes of the Michael E. DeBakey Veterans Affairs Medical Center, Houston, and his coauthors.

They conducted a clinical outcomes and cost model that ran 1,000 simulated trials of 1,000 patients each. The parameters were drawn from the landmark MOVIE (Model to Optimize Healthcare Value in Ischemic Extremities) study. The study was modified to simulate a patient population older than 80 years, or who had undergone a prior major amputation of the contralateral lower limb, as these two groups have poorer postop outcomes than the usual population undergoing revascularization for lower limb ischemia. The analysis examined outcomes associated with six procedures:
? Primary amputation.
? Local wound care.
? Surgical revascularization followed if needed by surgical revision.
? Surgical revascularization followed if needed by endovascular revision.
? Initial endo revascularization followed if needed by surgical revision.
? Endo revascularization followed if needed by endovascular revision.
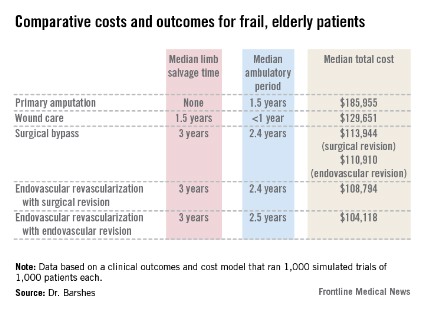
Primary amputation was the least clinically beneficial and the most expensive, with no limb salvage, a median ambulatory period of 1.5 years, and a total 10-year cost of $185,955. Much of the cost was for nursing and long-term care due to loss of independence.
Wound care also produced less desirable outcomes. The median 5-year limb salvage rate was 28%. See costs, salvage period, below.
Surgical bypass with either surgical or endo revision produced a limb salvage rate of 80%. Endo revascularization followed by surgical revision produced a 5-year limb salvage rate of 80%. Endo revascularization with endovascular revision produced a 5-year limb salvage rate of 80.5%, with a median salvage period of 3 years and a median ambulatory period of 2.5 years. This was the least expensive.
These outcomes were worse than those seen in the population of younger, healthier patients. The median 10-year cost for revascularization was up to $35,000 more. Clinical outcomes of the older population were also worse, with a 3-year period of limb preservation compared with more than 4 years in a healthier population, and about 2.5 ambulatory years compared with 4.6 years.
"In spite of these findings, revascularization still appears to be the most cost-effective alternative to wound care and primary amputation," the team noted.
The paper did not note any conflicts.
Dr. Barshes and colleagues suggest that an aggressive approach to limb revascularization, both endovascular and open bypass, may be appropriate and cost effective in older, frailer patients.
Certainly, in today?s era of cost-effective care, it is incumbent upon all of us, as health care providers, to further examine these types of issues. However, the studies necessary are not necessarily easy to perform. We must take into account not only the costs of the actual procedures and hospital stays, which are relatively easy to determine, but also the costs of rehabilitation, outpatient nursing care, wound care, and long-term care for those with loss of functional independence. Even this type of study does not assess all aspects that are important, including how much it is worth to maintain a limb and functional independence per year for each patient. What is not so easy to do is to put a value on limb salvage.
Hopefully we will be able to cull out the factors that may impact upon our decisions to re-intervene for critical limb ischemia, versus offering amputation when the patient presents with inadequate perfusion to the limb after initial attempts at limb salvage.
Dr. Linda Harris is an ACS Fellow and division chief, vascular surgery, State University of New York at Buffalo. She has no disclosures.
In older, frailer patients, limb revascularization appeared to preserve both limbs and ambulation longer ? and cost less ? than either amputation or a program of local wound care. Although these patients had worse clinical outcomes than did healthy patients who had revascularization, the benefits were still evident, Dr. Neal R. Barshes and his colleagues wrote in the January issue of Annals of Vascular Surgery.
"We believe that major amputation should be reserved for patients who develop life-threatening foot infections that cannot be controlled with foot drainage or minor amputations and subsequent palliative wound care," wrote Dr. Barshes of the Michael E. DeBakey Veterans Affairs Medical Center, Houston, and his coauthors.
They conducted a clinical outcomes and cost model that ran 1,000 simulated trials of 1,000 patients each. The parameters were drawn from the landmark MOVIE (Model to Optimize Healthcare Value in Ischemic Extremities) study. The study was modified to simulate a patient population older than 80 years, or who had undergone a prior major amputation of the contralateral lower limb, as these two groups have poorer postop outcomes than the usual population undergoing revascularization for lower limb ischemia. The analysis examined outcomes associated with six procedures:
? Primary amputation.
? Local wound care.
? Surgical revascularization followed if needed by surgical revision.
? Surgical revascularization followed if needed by endovascular revision.
? Initial endo revascularization followed if needed by surgical revision.
? Endo revascularization followed if needed by endovascular revision.
Primary amputation was the least clinically beneficial and the most expensive, with no limb salvage, a median ambulatory period of 1.5 years, and a total 10-year cost of $185,955. Much of the cost was for nursing and long-term care due to loss of independence.
Wound care also produced less desirable outcomes. The median 5-year limb salvage rate was 28%. See costs, salvage period, below.
Surgical bypass with either surgical or endo revision produced a limb salvage rate of 80%. Endo revascularization followed by surgical revision produced a 5-year limb salvage rate of 80%. Endo revascularization with endovascular revision produced a 5-year limb salvage rate of 80.5%, with a median salvage period of 3 years and a median ambulatory period of 2.5 years. This was the least expensive.
These outcomes were worse than those seen in the population of younger, healthier patients. The median 10-year cost for revascularization was up to $35,000 more. Clinical outcomes of the older population were also worse, with a 3-year period of limb preservation compared with more than 4 years in a healthier population, and about 2.5 ambulatory years compared with 4.6 years.
"In spite of these findings, revascularization still appears to be the most cost-effective alternative to wound care and primary amputation," the team noted.
The paper did not note any conflicts.
Major finding: In older, more frail patients, lower limb revascularization cost up to $90,000 less over 10 years, and yielded better clinical outcomes, than did primary amputation.
Data source: The clinical and cost outcomes model simulated 1,000 trials of 1,000 patients each.
Disclosures: The paper did not note any potential financial conflicts of interest or the study?s sponsor.
Some docs are wary of multiplex genomic testing

General Medical Sciences
Results of a survey suggest that some physicians aren’t ready to embrace multiplex genomic testing in cancer patients, while others plan to offer the testing to most of their patients.
The variation in attitudes is, in part, associated with physician confidence.
Physicians who reported having a lot of confidence in their ability to use and explain genomic findings were more likely to want to prescribe tests and consider using test results when making treatment recommendations.
But physicians with lower levels of confidence were more reluctant to offer such testing.
Researchers were surprised by these findings because the survey was carried out at the Dana-Farber/Brigham and Women’s Cancer Center, which has a research program that allows all consenting patients to undergo tests to reveal mutations and other DNA changes that drive their cancer.
The team was perplexed by another finding as well. Forty-two percent of responding oncologists approved of telling patients about test results even when their significance for the patient’s outlook and treatment is uncertain.
This issue comes with the growing use of multiplex testing, which can hunt for tens or hundreds of mutant genes simultaneously and often detects rare DNA variants that may or may not be relevant to an individual’s cancer.
“Some oncologists said we shouldn’t return these results to the patient, and others say, ‘Of course, we should give them to the patient,’” said study author Stacy W. Gray, MD, of the Dana-Farber Cancer Institute in Boston.
“The fact that we found so much variation in physicians’ confidence about their ability to use genetic data at a tertiary care National Cancer Institute-designated Comprehensive Cancer Center makes us pause and wonder about how confident physicians in the community are about dealing with this. It begs the question at a national level: how are we going to make sure that this technology for cancer care is adequately delivered?”
The survey was conducted in 2011 and early 2012 as a baseline assessment of physicians’ attitudes prior to the rollout of a tumor profiling project called Profile. The Profile technology platform includes complete DNA sequencing of more than 300 genomic regions to detect known and unknown cancer-related mutations.
The technology can also examine those regions for gains and losses of DNA sequences and rearrangements of DNA on chromosomes. The results are entered into a database for research purposes, but, if patients agree, the clinically important findings can also be returned to their doctor for use in the clinic.
A total of 160 cancer physicians—including medical oncologists, surgeons, and radiation oncologists—participated in the survey.
They were asked about their current use of somatic testing, their attitudes about multiplex testing, and their confidence in their ability to understand and use genomic data. The survey did not include a direct test of the physicians’ knowledge.
Respondents said they ordered tumor genomic testing on an average of 24% of patients. Twenty-two percent of the doctors reported low confidence in their knowledge about genomics.
Fourteen percent lacked knowledge in explaining these concepts to patients, and 26% doubted their ability to make treatment recommendations based on genomic data. Perhaps for these reasons, 18% of the physicians said they planned to use multiplex tumor testing infrequently.
Dr Gray and her colleagues concluded that there is “little consensus” on how physicians plan to use this technology for personalized cancer care and suggested the need for evidence-based guidelines to help doctors determine when testing is indicated.
The researchers reported their findings in the Journal of Clinical Oncology. A related editorial is available in the journal as well. ![]()
Endothelial cells seem to support lymphoma growth
Credit: NIH
Researchers have found evidence to suggest that endothelial cells produce proteins that nurture lymphoma, thereby turning a slow-growing malignancy into an aggressive, treatment-resistant disease.
Their findings, published in Cancer Cell, challenge previous theories about cancer growth and development.
The research suggests it is not simply the number of genetic mutations in cancer cells that determines the aggressiveness of the disease.
Rather, lethality occurs when the cancer hijacks the reparative function of blood vessels, a step that ensures tumor cells’ ability to spread and resist treatment.
The researchers also found the crucial nurturing molecules that cancer co-opts from tumor blood vessels to promote invasiveness and resistance to chemotherapy. Experiments in mice showed that shutting down these previously unrecognized biological signals makes lymphoma less aggressive and improves survival.
“The endothelial cells that line the vessels orchestrate a wide variety of biological processes, good and bad,” said study author Shahin Rafii, MD, of Weill Cornell Medical College in New York.
“The understanding and control of blood vessel function and how this changes the malignant behaviors of cancer cells is a transformative concept and will pave the way for designing innovative treatments that disrupt signals from the local environment housing the tumor cells—a strategy that has been unappreciated.”
Dr Rafii and his colleagues studied human B-cell lymphoma cells in vitro and in mice. The team found that although the lymphoma cells harbor the same mutations, it is their interaction with and support from endothelial cells that dictates the fate and features of the disease.
Specifically, when slow-growing tumor cells come into contact with endothelial cells expressing the protein Jagged1 (Jag1), they become more aggressive and resistant to chemotherapy. However, when Jag1 is not available from surrounding blood vessels, the lethal features of the tumor cells are absent.
The researchers also found that when Jag1 binds to and activates the receptor Notch2 on tumor cells, the lymphoma becomes more tolerant of chemotherapy.
“We think signals from these abnormally stimulated tumor endothelial cells modulate the malignant features of lymphoma cells,” said Joseph Scandura, MD, PhD, of Weill Cornell. “This is a reversible process dictated by the location of the tumor cells rather than their genetics.”
“This is a critical finding because it suggests that targeting the endothelial cells with agents that disrupt their specific pro-tumorigenic signals can transform aggressive cancers into slow-growing cancers that are more sensitive to chemotherapy.”
The researchers found, for example, that blocking the Notch2 receptor in lymphoma cells or Jag1 on blood vessels made the lymphoma cells significantly more vulnerable to chemotherapy.
“This new approach to treatment would interfere with the nurturing proteins produced by tumor blood vessels,” said Bi-Sen Ding, PhD, of Weill Cornell. “It is different from traditional anti-angiogenic therapy that aims to eradicate all blood vessels in the tumor and prevent them from bringing oxygen and nutrients to the cancer.”
Dr Ding noted that conventional anti-angiogenic therapy can sometimes increase tumor cell aggressiveness by enhancing the expansion of tumor blood vessels.
But blocking specific proteins produced by the tumor blood vessels, such as Jag1, without altering oxygen and nutrient delivery, can circumvent this problem. And this approach could be translated to the clinical setting.
“[W]e can target tumor blood vessels by delivering biological cruise missiles loaded with inhibitory agents for specific cancer-promoting proteins,” Dr Ding said. This could halt tumor growth and increase sensitivity to chemotherapy.
The researchers also believe this study suggests that screening for anticancer drugs may be more effective if tumor cells are assayed in the context of signals derived from the subverted blood vessels. ![]()
Anticancer drugs might promote lymphoma

Agents that inhibit tumor growth by targeting the regulatory protein CDK4 might actually promote the growth of B-cell lymphomas, a new study indicates.
Researchers found that inhibiting CDK4 promotes genetic instability and the development or progression of B-cell lymphomas driven by the Myc oncogene.
The team said this suggests that CDK4 inhibitors should be used cautiously, particularly in patients with B-cell lymphomas.
The findings also raise the possibility that these inhibitors work through off-target effects and require further investigation.
The research was published in The Journal of Clinical Investigation.
“Anti-CDK4 strategies are being widely tested as broad-spectrum anticancer therapies,” said study author Xianghong Zou, PhD, of The Ohio State University Comprehensive Cancer Center.
“Our findings indicate that anti-CDK4 strategies must be carefully tailored because they might have unexpected lymphoma-promoting effects.”
Dr Zou and his colleagues used an Eμ-Myc transgenic mouse model of B-cell lymphoma to study the role of CDK4 in lymphoma. And they found that loss of CDK4 accelerates Myc-driven lymphomagenesis, augments the genomic instability of MYC-expressing B cells, and enhances the tumorigenic potential of Myc-driven lymphoma.
The researchers also assessed the role of CDK4 in 2 human Burkitt lymphoma cell lines, Ramos and CA46, which expressed modest levels of CDK4. The team found that silencing CDK4 augmented the cell lines’ tumorigenic potential when they were injected into mice.
“It was quite striking,” Dr Zou said. “Silencing CDK4 in our mouse model and in human B-cell lymphoma cells had the opposite effect of small-molecule inhibitors that are touted as selective inhibitors of CDK4 and CDK6.”
“Given that these agents have undergone limited profiling, it might be that these agents inhibit kinases other than CDK4 and that, in lymphoma cells, they promote critical factors that support cell growth and survival.”
Additional experiments showed that the lymphoma-promoting effects of CDK4 deficiency were associated with genomic instability provoked by dysregulation of a FOXO1/RAG1/RAG2 pathway. CDK4 deficiency induced Rag1 and Rag2 transcription via FOXO1.
To confirm these findings, Dr Zou and his colleagues evaluated the role of CDK4 in human B-cell lymphoma samples.
They tested 125 samples and found little to no expression of the CDK4 protein in about 90% of them. Suppression of CDK4 levels was evident in MALT lymphoma, follicular lymphoma, diffuse large B-cell lymphoma, and Burkitt lymphoma.
On the other hand, FOXO1 levels were highly elevated in nearly 70% of the samples. Elevated levels of RAG1 were concordant with high levels of FOXO1 and associated with reduced levels of CDK4.
According to the researchers, this suggests a CDK4/FOXO1 pathway is disabled in a “significant proportion” of non-Hodgkin B-cell lymphomas. The results also support the idea that inhibitors targeting CDK4 may promote the development and progression of lymphoma. ![]()
Proteins appear necessary for stem cell formation
Credit: James Thomson
Proteins that regulate energy metabolism are essential for stem cell formation, according to a study published in Cell Stem Cell.
The researchers showed that hypoxia-induced factor 1α and 2α (HIF1α and HIF2α)—2 proteins that control how cells metabolize glucose—play a key role in the formation of stem cells.
The findings may advance our understanding of stem cell development, but they also suggest the proteins might be targets for new cancer therapies.
Julie Mathieu, PhD, of the University of Washington in Seattle, and her colleagues conducted this research, creating induced pluripotent stem cells (iPSCs) by reprogramming mature human tissue fibroblasts.
During reprogramming, the cells must go through a stage in which they shut down the metabolic pathway they use to generate energy from glucose that requires the presence of oxygen in mitochondria. The cells shift over to the glycolytic pathway, which generates less energy but does not require the presence of oxygen.
This shift may take place because in nature, embryonic and tissue stem cells often must survive in hypoxic conditions. This transition to a glycolytic state is of particular interest to cancer researchers because, as normal cells are transformed into cancer cells, they too go through a glycolytic phase.
For their study, Dr Mathieu and her colleagues focused on the function of HIF1α and HIF2α in this process. The researchers showed that each protein is required for iPSC generation.
To tease out the impact of HIF1α and 2α on cellular processes in more detail, the team stabilized the proteins in an active form and tested what each protein could do alone.
They found that when HIF1α was stabilized, the cells went into the glycolytic state and produced more iPSCs than normal. However, when the researchers activated HIF2α, the cells failed to develop into stem cells.
“This was a big surprise,” Dr Mathieu said. “These proteins are very similar, but HIF1α gives you lots of stem cells [and] HIF2α, none.”
If stabilized together, HIF2α won the battle, repressing all stem cell formation.
Further investigation revealed that HIF2α does indeed promote the shift to glycolysis in an early stage of the cells’ reprogramming. But if it persists too long, it has the opposite effect, blocking the progression to the stem cell state.
“HIF2α is like Darth Vader, originally a Jedi who falls to the dark side,” said study author Hannele Ruohola-Baker, PhD, also of the University of Washington.
“While HIF1α, the good guy, is beneficial for reprogramming throughout the process, HIF2α, if not eliminated, turns bad in the middle and represses pluripotency.”
HIF2α does this, in part, by upregulating production of the protein TRAIL, which is known to, among other things, induce apoptosis.
These findings suggest there may be proteins of other families that are playing alternating “good guy/bad guy” roles during stem cell development, according to study author Wenyu Zhou, PhD, of Stanford University in California.
“It is very intriguing that HIF2α has the capacity to both promote and repress pluripotency, doing so at different stages in a cellular reprogramming process,” she said.
The findings have implications for stem cell research, Dr Mathieu said. First, they indicate that it may be possible to use HIF1α to greatly increase the number of stem cells in a culture.
And second, they suggest it may be possible to induce stem cell formation with HIF proteins alone or in combination with other stimulating factors without inserting genes at the start of the reprogramming process.
But the findings may also have implications for cancer research. Both HIF1α and 2α are known to play a role in normal cells’ transformation to cancer stem cells. And the presence of activated HIF1α is known to be a marker for aggressive disease.
So the researchers believe it might be possible to interfere with cancer development by either blocking the effect of HIF1α in malignant cells early in the process or stimulating the effect of HIF2 at a later stage. ![]()