User login
USPSTF: Evidence still ‘insufficient’ to back cognitive impairment screening
Citing an ongoing lack of data about the benefits and harms of screening, the U.S. Preventive Services Task Force has left unchanged the recommendations of its 2003 guidelines on cognitive impairment screening in older adults, according to an update published March 24.
"The USPSTF concludes that the current evidence is insufficient to assess the balance of benefits and harms of screening for cognitive impairment," Dr. Virginia A. Moyer said in a report on behalf of the USPSTF.
"Evidence on the effect of screening and early detection of mild to moderate dementia on decision making, planning, or other important patient outcomes is a critical gap in the evidence," she added. Other research needs include further study of the harms of screening, new interventions that address the changing needs of patients and families, and interventions that affect the long-term clinical direction of mild to moderate dementia.
In its review, the USPSTF evaluated 55 studies on instruments that screen for cognitive impairment, of which 46 provided evidence on the sensitivity of dementia screening and 27 provided evidence on mild cognitive impairment. Screening tests included a variety of tasks to assess at least one cognitive function, such as memory, attention, language, and visuospatial/executive functioning. The USPSTF looked at studies that used the Mini-Mental State Examination (MMSE), Clock Drawing Test, verbal fluency tests, Informant Questionnaire on Cognitive Decline in the Elderly, Memory Impairment Screen, Mini-Cog Test, Abbreviated Mental Test, and Short Portable Mental Status Questionnaire.
The MMSE was the most evaluated screening tool, with 25 published studies. Mean age of participants ranged from 69 to 95 years, and the mean prevalence of dementia ranged from 1.2% to 38%. The pooled sensitivity from 14 studies for the most commonly reported cut points was 88.3% (95% confidence interval, 81.3%-92.9%), and specificity was 86.2% (CI, 81.8%-89.7%).
Other screening tools that were evaluated "were studied in far fewer studies (four to seven studies each), had limited reproducibility in primary care relevant populations, and had unknown optimum cut points," Dr. Moyer wrote.
In addition, no trials studied the "direct effect of screening" by comparing screened and unscreened patients and reporting important clinical and decision-making outcomes, the report’s authors said. And no studies reported on direct or indirect harms from false-positive or false-negative screening results, psychological harms, unnecessary diagnostic testing, or labeling.
Dementia affects about 2.4 to 5.5 million Americans. Types of dementia in older adults include Alzheimer’s disease, vascular dementia, frontotemporal dementia, dementia with Lewy bodies, Parkinson’s disease with dementia, and mixed-cause dementia. The USPSTF distinguishes between dementia and mild cognitive impairment, which is less severe and does not considerably interfere with day-to-day activities.
The prevalence of dementia is estimated to be 5% in adults aged 71-79 years of age, 24% in those aged 80-89 years, and 37% in those aged 90 years and older. The prevalence of mild cognitive impairment is more uncertain, and estimates range from 3% to 42% in adults aged 65 years and older.
Although this report differs from the 2003 recommendation because it considers screening and treatment for mild cognitive impairment in addition to dementia, and it includes additional information about the test performance of screening instruments, "the overall evidence is insufficient to make a recommendation on screening," Dr. Moyer said.
Disclosure forms from USPSTF members can be viewed here.
FROM A USPSTF REPORT

Anatomy of an independent primary care ACO, part 2
In our last column, we highlighted the Rio Grande Valley Health Alliance, an accountable care organization in McAllen, Tex., composed of 14 independent primary care physicians in 11 practices. As primary care physicians, the RGVHA providers realized the potential for a primary care ACO to generate savings from value-based care.
Because RGVHA is a network model ACO – the physicians stay in their separate independent practices but participate in the ACO through contracts – RGVHA needed a way to manage the ACO data collection, sorting, and reporting requirements in an efficient and effective manner.
Fortunately, Dr. Gretchen Hoyle of MD Online Solutions was able to tailor a data management solution for RGVHA. In addition, Dr. Hoyle helps interpret the data and leads a weekly data-driven staff conference call with the ACO’s nurse care coordinators.
Through Dr. Hoyle’s data collection and interpretation work with RGVHA, the ACO now has concrete data showing utilization trends and patterns. The most positive result has been the demonstrated benefit of nurse care coordinators, who work with patients in the post–acute care settings between their office visits.
In fact, care coordinators have proved to be RGVHA’s secret weapon, because their work has been invaluable in managing patients with chronic conditions between provider appointments.
Conversely, the data have revealed a pattern of overuse of home health care services, which helps contribute to higher care costs overall, making home health the biggest disappointment.
The secret weapon
As Dr. Hoyle so aptly said, "To become a fully functioning ACO, an organization must be able to address both sides of the ACO ‘coin’: quality improvement and cost control." Care coordinators have the capacity to address both concerns.
Within RGVHA, care coordinators have performed chart reviews that identify the ACO’s current performance according to the Centers for Medicare and Medicaid Services’ quality standards. This is the first secret weapon for a small primary care ACO.
This data collection helps RGVHA fill in knowledge gaps as it works toward having a fully integrated electronic health records system. In turn, it helps the care coordinators identify the strengths and weaknesses of each of the participating ACO providers. This ensures that weaknesses can be addressed in a timely fashion. In addition, the chart reviews help identify documentation issues. Documentation is critical to meeting CMS benchmarks, which ultimately helps determine the amount of shared savings for an ACO.
In addition, the data have proved crucial to being able to rank patients by cost. That has allowed RGVHA to identify the top 10% of patients whose care accounts for 50% of the total care costs in the ACO. This information allows providers to understand which patients and types of patients are more expensive, and who can benefit most from intense care coordination and/or longer visits with RGVHA’s primary care doctors.
Claims data show that even a small amount of additional time and care coordination outside of the clinic setting curbs utilization for the most complex patients and saves money. Most important, care coordinators help providers focus their time and energy where it can have the most impact.
The biggest disappointment
Shortly after RGVHA began reviewing patient claims data, home health care costs per patient emerged as one of the greatest cost outliers. The data revealed that providers outside of the ACO were prescribing home health at much higher rates than providers within the ACO. A subsequent gap analysis showed that home health was a prime opportunity target for RGVHA.
As RGVHA developed a strategy to address the overutilization and extremely high home health costs for their patient population, the providers faced their biggest disappointment to date: The Medicare Shared Savings Program regulations only permit ACOs to "ask" that providers outside the ACO coordinate patient care with doctors inside the ACO, not "tell" the providers that they must collaborate in delivering evidence-based, high-value care.
So, RGVHA decided to use those data as the starting point to reach out to those providers.
Dr. Hoyle helped RGVHA identify the amount of home health care generated by each specific agency and ordering physician. That information was used to craft a targeted letter to each provider outside the ACO requesting and encouraging their collaboration and cooperation in the development of a care plan for each home health patient.
Now, several months later, home health care overutilization and costs are beginning to decline, as patient care is monitored by RGVHA and appropriately coordinated among each ACO patient’s team of care providers.
RGVHA’s biggest concern has now become one of its biggest assets. The ACO doctors finally feel empowered in their ability to impact the quality and costs of patient care. Furthermore, they are excited they are getting paid for doing what they are trained to do: provide high-value care to their patients.
The good news is that, when properly informed and invited to help shape high-value patient care, providers want to and will do the right thing.
Mr. Bobbitt is a senior partner and head of the health law group at the Smith Anderson law firm in Raleigh, N.C. He has spoken and written nationally to primary care physicians on the strategies and practicalities of forming or joining ACOs. Mr. Bobbitt is grateful for the excellent lead research and drafting of this article by Ms. Poe. This article is meant to be educational and does not constitute legal advice. For additional information, readers may contact the author at [email protected] or at 919-821-6612.

In Memoriam
Professor Edouard Kieffer, a preeminent figure in French vascular surgery, died in February 2014, at the age of 72. He was Professor of Vascular Surgery and former Head of the Department of Vascular Surgery at the Hôpital Pitié-Salpêtrière, in Paris, and served as Chairman of the French National Board of Vascular Surgery between 1986 and 1994, and as President of the European Society for Cardiovascular Surgery between 2004 and 2006. He was cofounder of the Annals of Vascular Surgery in 1986 with his good friend and past-President of the Society for Vascular Surgery, Dr. Ramon Berguer.
Professor Edouard Kieffer, a preeminent figure in French vascular surgery, died in February 2014, at the age of 72. He was Professor of Vascular Surgery and former Head of the Department of Vascular Surgery at the Hôpital Pitié-Salpêtrière, in Paris, and served as Chairman of the French National Board of Vascular Surgery between 1986 and 1994, and as President of the European Society for Cardiovascular Surgery between 2004 and 2006. He was cofounder of the Annals of Vascular Surgery in 1986 with his good friend and past-President of the Society for Vascular Surgery, Dr. Ramon Berguer.
Professor Edouard Kieffer, a preeminent figure in French vascular surgery, died in February 2014, at the age of 72. He was Professor of Vascular Surgery and former Head of the Department of Vascular Surgery at the Hôpital Pitié-Salpêtrière, in Paris, and served as Chairman of the French National Board of Vascular Surgery between 1986 and 1994, and as President of the European Society for Cardiovascular Surgery between 2004 and 2006. He was cofounder of the Annals of Vascular Surgery in 1986 with his good friend and past-President of the Society for Vascular Surgery, Dr. Ramon Berguer.
AAN calls oral cannabinoids effective for MS pain, spasticity
An expert panel organized by the American Academy of Neurology called oral cannabis extract the only complementary and alternative medicine unequivocally effective for helping patients with multiple sclerosis, specifically easing their pain and symptoms of spasticity, possibly for as long as 1 year of treatment.
The academy’s Guideline Development Subcommittee also found existing evidence "insufficient to support or refute the effectiveness" of 25 other complementary and alternative medicine (CAM) treatments, including acupuncture, chelation therapy, mindfulness training, and muscle-relaxation therapy. The panel noted that two of these inadequately assessed treatments – dental amalgam removal and transdermal histamine – have received substantial media attention despite having "little or no evidence to support recommendations."

Aside from various forms and delivery methods for cannabinoids, the nine-member panel found six other treatments with adequate evidence to develop practice recommendations that either endorsed their efficacy or lack of effect. Ginkgo biloba, reflexology, and magnetic therapy all had some proven level of efficacy, while bee venom, low-fat diet with omega-3 supplementation, and lofepramine plus L-phenylalanine with B12 were all found ineffective, the subcommittee said in guidelines released on March 24 (Neurology 2014;82:1083-92).
The efficacy of CAM therapies in patients with multiple sclerosis (MS) is an important clinical issue. Ten reports cited by the subcommittee and published during 1999-2009 documented that anywhere from a third to 80% of MS patients – particularly women, patients with higher education levels, and patients who report poorer health – used one or more CAM therapies, according to the panel, which was led by Dr. Vijayshree Yadav of the department of neurology at Oregon Health and Science University, Portland, and the Portland VA Medical Center.
The group also determined that oral cannabis extract and another orally delivered cannabinoid, synthetic tetrahydrocannabinol (THC), were possibly effective for reducing symptoms and objective measures of spasticity during treatment beyond 1 year, and that THC is probably effective for reducing symptoms of spasticity and pain during the first year of treatment. The panel decided that, based on existing evidence, both of these oral agents are "probably ineffective" for reducing both objective spasticity measures and MS-related tremor symptoms.
The subcommittee reviewed two other delivery forms of cannabinoids. The members concluded that Sativex oromucosal cannabinoid spray is probably effective for improving subjective spasticity symptoms for periods of 5-10 weeks and possibly ineffective when used for longer periods or for reducing MS-related tremor. When it came to smoked cannabis, the panel decided that the data were inadequate to draw any conclusions on safety or efficacy.
It also deemed the evidence inadequate to draw conclusions about oral cannabis extract or THC for bladder-urge incontinence or for treating overall symptoms; synthetic THC for central neuropathic pain; and Sativex spray for overall bladder symptoms, anxiety, sleep problems, cognitive symptoms, quality of life, or fatigue.
In addition, cannabinoid studies have been of short duration (6-15 weeks), and central side effects may have caused unblinding in studies. The panel cautioned clinicians to counsel patients about potential psychopathologic effects, cognitive effects, or both with cannabinoid use, and cautioned against extrapolating from findings with standardized oral cannabis extract to other, nonstandardized cannabis extracts.
For other treatments with an adequate evidence base, the panel concluded that magnetic therapy is probably effective for reducing fatigue and probably ineffective for reducing depression, with inadequate data to support or refute other effects in MS patients.
The subcommittee said that study findings established Ginkgo biloba as ineffective for improving cognitive function in patients with MS but possibly effective during 4 weeks of treatment to reduce fatigue. The members also warned that Ginkgo biloba and other supplements not regulated by the Food and Drug Administration may vary considerably in efficacy and adverse effects and may interact with other medications, especially disease-modifying therapies for MS.
The panel called low-fat diet with omega-3 fatty acid supplementation probably ineffective for reducing MS relapses, disability, or MRI lesions, or for improving fatigue or quality of life. It found lofepramine plus L-phenylalanine and vitamin B12 possibly ineffective for treating disability, symptoms, depression, or fatigue, and bee-sting therapy possibly ineffective for reducing relapses, disability, fatigue, total MRI-lesion burden, and gadolinium-enhancing lesion volume, or for improving health-related quality of life.
The subcommittee said that reflexology is possibly effective for reducing MS-associated paresthesia during 11 weeks of treatment, but that data were inadequate to support or refute its use for pain, spasticity, fatigue, anxiety, or several other MS manifestations.
The guidelines were funded by the American Academy of Neurology. Most of the panel members reported some potential conflicts of interest in relationships with pharmaceutical companies that market drugs for MS as well as ties to MS medical societies.
On Twitter @mitchelzoler
An expert panel organized by the American Academy of Neurology called oral cannabis extract the only complementary and alternative medicine unequivocally effective for helping patients with multiple sclerosis, specifically easing their pain and symptoms of spasticity, possibly for as long as 1 year of treatment.
The academy’s Guideline Development Subcommittee also found existing evidence "insufficient to support or refute the effectiveness" of 25 other complementary and alternative medicine (CAM) treatments, including acupuncture, chelation therapy, mindfulness training, and muscle-relaxation therapy. The panel noted that two of these inadequately assessed treatments – dental amalgam removal and transdermal histamine – have received substantial media attention despite having "little or no evidence to support recommendations."
Aside from various forms and delivery methods for cannabinoids, the nine-member panel found six other treatments with adequate evidence to develop practice recommendations that either endorsed their efficacy or lack of effect. Ginkgo biloba, reflexology, and magnetic therapy all had some proven level of efficacy, while bee venom, low-fat diet with omega-3 supplementation, and lofepramine plus L-phenylalanine with B12 were all found ineffective, the subcommittee said in guidelines released on March 24 (Neurology 2014;82:1083-92).
The efficacy of CAM therapies in patients with multiple sclerosis (MS) is an important clinical issue. Ten reports cited by the subcommittee and published during 1999-2009 documented that anywhere from a third to 80% of MS patients – particularly women, patients with higher education levels, and patients who report poorer health – used one or more CAM therapies, according to the panel, which was led by Dr. Vijayshree Yadav of the department of neurology at Oregon Health and Science University, Portland, and the Portland VA Medical Center.
The group also determined that oral cannabis extract and another orally delivered cannabinoid, synthetic tetrahydrocannabinol (THC), were possibly effective for reducing symptoms and objective measures of spasticity during treatment beyond 1 year, and that THC is probably effective for reducing symptoms of spasticity and pain during the first year of treatment. The panel decided that, based on existing evidence, both of these oral agents are "probably ineffective" for reducing both objective spasticity measures and MS-related tremor symptoms.
The subcommittee reviewed two other delivery forms of cannabinoids. The members concluded that Sativex oromucosal cannabinoid spray is probably effective for improving subjective spasticity symptoms for periods of 5-10 weeks and possibly ineffective when used for longer periods or for reducing MS-related tremor. When it came to smoked cannabis, the panel decided that the data were inadequate to draw any conclusions on safety or efficacy.
It also deemed the evidence inadequate to draw conclusions about oral cannabis extract or THC for bladder-urge incontinence or for treating overall symptoms; synthetic THC for central neuropathic pain; and Sativex spray for overall bladder symptoms, anxiety, sleep problems, cognitive symptoms, quality of life, or fatigue.
In addition, cannabinoid studies have been of short duration (6-15 weeks), and central side effects may have caused unblinding in studies. The panel cautioned clinicians to counsel patients about potential psychopathologic effects, cognitive effects, or both with cannabinoid use, and cautioned against extrapolating from findings with standardized oral cannabis extract to other, nonstandardized cannabis extracts.
For other treatments with an adequate evidence base, the panel concluded that magnetic therapy is probably effective for reducing fatigue and probably ineffective for reducing depression, with inadequate data to support or refute other effects in MS patients.
The subcommittee said that study findings established Ginkgo biloba as ineffective for improving cognitive function in patients with MS but possibly effective during 4 weeks of treatment to reduce fatigue. The members also warned that Ginkgo biloba and other supplements not regulated by the Food and Drug Administration may vary considerably in efficacy and adverse effects and may interact with other medications, especially disease-modifying therapies for MS.
The panel called low-fat diet with omega-3 fatty acid supplementation probably ineffective for reducing MS relapses, disability, or MRI lesions, or for improving fatigue or quality of life. It found lofepramine plus L-phenylalanine and vitamin B12 possibly ineffective for treating disability, symptoms, depression, or fatigue, and bee-sting therapy possibly ineffective for reducing relapses, disability, fatigue, total MRI-lesion burden, and gadolinium-enhancing lesion volume, or for improving health-related quality of life.
The subcommittee said that reflexology is possibly effective for reducing MS-associated paresthesia during 11 weeks of treatment, but that data were inadequate to support or refute its use for pain, spasticity, fatigue, anxiety, or several other MS manifestations.
The guidelines were funded by the American Academy of Neurology. Most of the panel members reported some potential conflicts of interest in relationships with pharmaceutical companies that market drugs for MS as well as ties to MS medical societies.
On Twitter @mitchelzoler
FROM NEUROLOGY

Failure to rescue drives AAA repair mortality
CHICAGO -- Failure to rescue patients from major complications drives much of the variation in hospital mortality for abdominal aortic aneurysm repair, an award-winning study suggests.
"Careful attention to early recognition and management of postoperative complications could be the key to improving mortality," Dr. Seth Waits reported at the annual meeting of the Midwestern Vascular Surgical Society.
Failure to rescue (FTR), or death after a complication, is increasing being recognized as a source of differences in hospital mortality. A recent study reported that women who experienced a major complication after ovarian cancer treatment at a low-volume hospital were 48% more likely to die than were their counterparts at a high-volume hospital. Complication rates, long thought to be the culprit behind higher hospital mortality, were similar at the hospitals, while FTR rates were almost double at the low-volume hospitals (J. Clin. Oncol. 2012;30:3976-82).
For the current analysis, Dr. Waits and his colleagues at the University of Michigan Frankel Cardiovascular Center in Ann Arbor, calculated risk-adjusted mortality rates for 3,215 patients who underwent open or endovascular abdominal aortic aneurysm (AAA) repair at 40 hospitals participating in the Michigan Surgical Quality Collaborative between 2007 and 2012.
For 2,440 patients undergoing endovascular repair, hospital mortality ranged from a low of 0.07% to a high of 6.14%.
Though low- and high-mortality hospitals had similar major complication rates (11.6% vs. 10.6%), FTR rates were 45 times greater in high-mortality hospitals (0.83% vs. 37.5%), Dr. Waits reported.
For 775 patients who underwent open AAA repair, hospital mortality ranged from 4.5% to 16.4%.
Once again, despite low- and high-mortality hospitals having nearly identical complication rates (45.1% vs. 45.8%), but FTR rates were three times higher at the high-mortality hospitals (10.3% vs. 33%), according to Dr. Waits.
An average of 2.85 and 2.66 severe complications occurred per FTR event for open and endovascular repair, respectively.
Transfusion was the most common postoperative complication leading to a FTR event for endovascular and open repair (5.8% and 29.8%, respectively), followed by prolonged intubation (2.4%; 18.2%) and reintubation (9.2%; 2%), according to the meeting’s best poster presentation.
No significant difference was seen in rupture/emergent repair between low- and high-mortality hospitals.
Dr. Waits called for preoperative identification of high-risk patients and use of FTR countermeasures, such as improved ICU admission, anesthesia alerts, and nurse/physician awareness to improve AAA mortality.
"Understanding the mechanisms that underlie failure to rescue offers the opportunity to move from a reactive to proactive approach in our management of complications following abdominal aortic aneurysm repair," he said in an interview.
Dr. Waits and his coauthors reported that they had no financial disclosures.
AT MIDWESTERN VASCULAR 2013
Major finding: FTR rates were 45 times higher in high AAA-mortality hospitals vs. low AAA-mortality hospitals (0.83% vs. 37.5%).
Data source: Retrospective study of 3,215 patients with abdominal aortic aneurysm repair.
Disclosures: Dr. Waits and his coauthors reported having no financial disclosures.

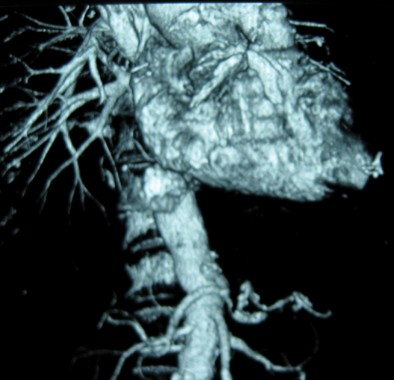
Anatomy dictates endo PAA repair
CHICAGO - Endovascular repair of popliteal artery aneurysms is a relatively safe and viable off-label alternative to open repair, but appropriate anatomy is essential. This includes a landing zone of at least 2 cm above and below the aneurysm, minimal discrepancy in size between the proximal and distal landing zones, and lack of extensive vessel tortuosity due to potential kinking of the endograft, Dr. Neal S. Cayne said at a symposium on vascular surgery sponsored by Northwestern University.
The risk of kinking and graft thrombosis also excludes patients who frequently flex their knee more than 90 degrees, such as carpenters and gardeners.
Patients with a contraindication to antiplatelet medication are also off limits, as clopidogrel (Plavix) has been shown to be a predictor of success, said Dr. Cayne, director of endovascular surgery at New York University Langone Medical Center.
In 2012, his team reported technical success in 25 of 26 endovascular popliteal artery aneurysm (PAA) repairs performed in 21 consecutive patients between January 2004 and January 2011, with the one technical failure due to stent graft infolding (J. Vasc. Surg. 2012;55:1647-53).
Primary and secondary patency rates were both 91.2% at 1 year, and were 85.5% and 91.2%, respectively, at 2 years. All patients were maintained on aspirin or clopidogrel.
No limb loss was reported, but three occlusions occurred during follow-up at 4, 14, and 26 months. One patient required a tibial artery bypass for a nonhealing wound, and two were successfully repaired with open thrombectomy. All three occlusion patients had single-vessel runoff.
Based on our data, in general, I will not stent someone "with single-vessel outflow, and I also will not stent someone who, for some reason, can't take antiplatelet agents," Dr. Cayne said.
Even when patients present urgently and the PAA has thrombosed, endovascular repair is not an option if there is only one outflow vessel. "I would do a bypass; there's nothing wrong with open surgery," he said.
A recent unpublished review of 79 PAAs treated at Langone from 1998 to 2012 with both approaches found 5-year primary patencies of 67% for open repair and 80% for endovascular repair (P less than .05). Secondary patency was 90% in both groups.
One amputation occurred in the open group, but occlusion rates were higher using endovascular repair with one-vessel runoff (P = .003), Dr. Cayne said.
As expected, length of stay was shorter with endovascular repair (1.9 vs. 6.4 days; P less than .001).
Follow-up was longer for the 36 open PAAs than the 43 endovascular PAAs (75 vs. 34 months), but patients in both groups were similar with respect to age, comorbidities, PAA size, runoff, and symptoms, he said.
During a discussion following the presentation, some attendees said they still prefer to use bypass for all patients with PAA, and asked how candidates are selected for stent placement.
"Number one and most important is the anatomy," Dr. Cayne said. "The one advantage of endovascular repair is that if you have a patient too sick to get general or even regional anesthesia, you can do it under local [anesthesia] almost all the time with a small cutdown or puncture. But you do have that long discussion with the patient that this is a non-FDA-approved, off-label use. We provide them with the data, but some patients in New York will come in with pages and pages of literature and say, 'Nope, I want a stent, I want this particular stent, and this is the way I want you to do it.'"
The stent of choice at Langone has been Gore's Viabahn covered stent graft, which is FDA approved for treating occlusive disease rather than PAA. The device is usually oversized by 10%-15%, but no more than that, because of the risk of graft infolding, Dr. Cayne said.
If more than one graft is needed, a maximum of no more than 1-mm size differential between grafts is suggested. A minimum overlap of 2-3 cm between grafts is also preferred.
Last year, surgeons reported a dismal 50% occlusion rate within just 6 weeks in the endovascular treatment of six PAAs using a novel, multilayer stent (Cardiatis's Multilayer Aneurysm Repair System) (J. Endovasc. Ther. 2013;20:381-8), he observed.
Dr. Cayne reported receiving honoraria as a consultant from Cook Medical.
AT THE NORTHWESTERN VASCULAR SYMPOSIUM
Major finding: Five-year primary patency was 67% for open repair and 80% for endovascular repair (P less than .05).
Data source: Expert opinion and retrospective study of 79 popliteal artery aneurysm repairs.
Disclosures: Dr. Cayne reported receiving honoraria as a consultant from Cook Medical.
HM14 Lineup Packed with Learning, Networking Opportunities
LAS VEGAS—Welcome to HM14! Now, let's get to work.
While most visitors that arrive at Mandalay Bay Resort and Casino are up for fun and frolicking, the nearly 3,000 hospitalists expected to attend this year’s HM confab are here for education and inspiration. And the meeting's slate of sessions, speakers, and mental stimulation is expected to provide both.
"What you're getting are those thought leaders, as well as the academics, as well as real-life business education, all in one area," says Darren Swenson MD, a regional medical advisor for IPC The Hospitalist Co. in Las Vegas and founder of the city's SHM chapter. "And when you're able to choose your tracks to identify those programs that are of interest to you at that point in your career, it makes it very attractive."
Here are five tips to get the most out of your meeting:
- Think ahead and design a daily itinerary to take advantage of courses applicable back home, but don't be a slave to a schedule. Be open to changing course when opportunities for a meeting or event arise.
- Don't skip the keynotes. Whether it's a new panel discussion on Obamacare, an address by health strategist Ian Morrison, PhD, or the annual crowd pleaser from hospital medicine dean and blogger Bob Wachter, MD, MHM, the plenary sessions feature industry leaders’ views on important and compelling topics.
- Step outside your comfort zone. Reinforcing knowledge is certainly important, but course directors always encourage attendees to seize the opportunity to learn new skills.
- Network, network, network. There is no larger gathering of your colleagues than the annual meeting, so take advantage.
- Don't forget the Town Hall. For those planning to attend the meeting’s final session, the Town Hall is a chance to talk directly to SHM’s top staff and its board of directors.
Visit our website for more on making the most of HM14.
Bright Lights, Big City: Las Vegas Is More Than the Strip
LAS VEGAS – Now that you're here, focus on the valuable opportunities that HM14 offers. Well, until dusk. Then get out of the hotel and focus on the opportunities that are Las Vegas.
The fun isn't just the famed Strip, says Zubin Damania, MD, founder of Turntable Health in Las Vegas, who might be better known for his comedic alter ego, ZDoggMD. It's the lesser-known side of Las Vegas, known locally as "downtown."
"When I have friends in town, I tell them not to go to the Strip and to come hang out with me downtown or in the suburbs of Vegas—where the real fun is to be had," says Dr. Damania, even though he realizes he can't tell that to 3,000 "rabid hospitalists looking to relive 'The Hangover 3.'"
His recommendations include:
- Chinatown. The district is along Spring Mountain Road, about four miles north of Mandalay Bay, and includes several enclosed shopping malls. Restaurants to try include Raku, which specializes in Japanese food, and Kabuto, which has "the best sushi" ZDoggMD's ever had.
- Red Rock Canyon National Conservation Area. Breathtaking views and hiking opportunities abound in natural Nevada.
- The Zappos factory. A tour of the firm’s downtown headquarters showcases the mindset of the millennial generation and potential lessons on workplace attitude that can be applied to HM.
- Turntable Health. Dr. Damania’s clinic is open to any hospitalists curious to visit. If you want to set up a tour, or want more personalized advice on what to do while in town, e-mail him at [email protected].
Visit our website for more of ZDoggMD's recommendations.
Health Canada approves therapy for hemophilia B
Health Canada has approved a recombinant factor IX Fc fusion protein (rFIXFc, Alprolix), for adults and children aged 12 and older with hemophilia B.
The product is intended to prevent or reduce the frequency of bleeding episodes via prophylactic infusions, starting at once weekly or once every 10 to 14 days.
This is the first regulatory approval of rFIXFc, which is under review by regulatory authorities in several other countries.
Health Canada’s approval of the product is based on results from the phase 3 B-LONG study, which was funded by Biogen Idec and Sobi, the companies developing rFIXFc.
Results of the B-LONG study
In this multicenter, open-label trial, researchers evaluated the efficacy, safety, and pharmacokinetics of rFIXFc in 123 males aged 12 years and older with hemophilia B.
Patients were assigned to 1 of 4 treatment arms: weekly prophylaxis, individualized-interval prophylaxis, on-demand treatment to control bleeding, and perioperative management.
The overall median annualized bleeding rates were 2.95 for the weekly prophylaxis arm, 1.38 for the individualized-interval prophylaxis arm, and 17.69 in the on-demand treatment arm.
The overall median dosing interval with individualized-interval prophylaxis was 12.5 days. During the last 6 months of the study, the median dosing interval was 13.8 days.
Of the patients who received rFIXFc for perioperative management, 85.7% required a single injection of the product to maintain hemostasis during their operation. The median dose was 90.9 IU/kg per injection.
Most patients required 1 to 2 injections of the product the day before and the day of surgery. And most required 2 to 3 injections from days 1 to 3 after surgery.
The most common adverse events associated with rFIXFc (incidence of ≥ 5% in a pooled analysis of treatment arms 1, 2, and 3) were nasopharyngitis, influenza, arthralgia, upper respiratory tract infection, hypertension, and headache.
Results of this study were released by Biogen Idec and Sobi in September 2012, presented at ISTH 2013, and published in NEJM in December 2013. ![]()
Abnormality increases risk of ALL subtype

Credit: Beth A. Sullivan
Individuals with a rare chromosomal abnormality have a 2700-fold increased risk of developing a type of acute lymphoblastic leukemia (ALL), according to a study published in Nature.
Previous research showed that a small subset of ALL patients have recurrent amplification of megabase regions of chromosome 21.
In the current study, investigators decided to reconstruct the sequence of genetic events that lead to this type of leukemia, iAMP21 ALL.
They found that some patients with iAMP21 ALL had an abnormality in which chromosome 15 and chromosome 21 are fused together, known as a Robertsonian translocation.
And the joining of these 2 chromosomes increased a person’s risk of developing iAMP21 ALL 2700-fold, when compared to the general population.
“Although rare, people who carry this specific joining together of chromosomes 15 and 21 are specifically and massively predisposed to iAMP21 ALL,” said study author Christine Harrison, PhD, of Newcastle University in the UK.
“We have been able to map the roads the cells follow in their transition from a normal genome to a leukemia genome.”
To do this, the investigators sequenced 9 samples from patients with iAMP21 ALL, 4 with the rare Robertsonian translocation and 5 without it.
For the 4 patients with the translocation, their leukemia was initiated by chromothripsis. This event shatters a chromosome—in this case, the joined chromosomes 15 and 21—and then the DNA repair machinery pastes the chromosome back together in a highly flawed and inaccurate order.
In the 5 other patients, the cancer was initiated by 2 copies of chromosome 21 being fused together, head-to-head, usually followed by chromothripsis.
The investigators found a consistent sequence of genetic events across the patients studied. Although the events seem random and chaotic at first, the end result is a new chromosome 21 in which the numbers and arrangement of genes are optimized to drive leukemia.
“What is striking about our findings is that this type of leukemia could develop incredibly quickly—potentially in just a few rounds of cell division,” said study author Peter Campbell, PhD, of the Wellcome Trust Sanger Institute in Hinxton, UK.
“We now want to understand why the abnormally fused chromosomes are so susceptible to this catastrophic shattering.” ![]()