User login
In reply: The role of sentinel lymph node biopsy after excision of melanomas
In Reply: Thank you for your important question. Examination of the excision specimen of the patient’s primary cutaneous melanoma lesion demonstrated a Breslow depth of 1.92 mm. He did indeed undergo sentinel lymph node biopsy at the time of excision. Histologic examination of the biopsy specimen was negative for evidence of metastatic melanoma. Despite this, he obviously developed metastatic disease several years later.
As you allude to, sentinel lymph node biopsy is an important minimally invasive procedure in patients with melanoma. Morton et al1 compared it with nodal observation and found that in patients with at least intermediate-thickness cutaneous melanoma, sentinel node biopsy significantly prolonged disease-free survival for all patients and improved melanoma-specific survival rates for patients with nodal metastases from intermediate-thickness melanomas (1.2–3.5 mm).1 However, it remains an imperfect procedure, and a percentage of patients develop recurrence or metastasis despite a negative biopsy. In a recent study by Jones et al,2 16% of melanoma patients in a cohort with a negative sentinel node biopsy developed recurrence.2 In these unfortunate patients, medications such as CTLA-4 inhibitors and PD-1 inhibitors now offer hope for prolonged survival.
- Morton DL, Thompson JF, Cochran AJ, et al, for the MSLT Group. Final trial report of sentinel-node biopsy versus nodal observation in melanoma. N Engl J Med 2014; 370:599–609.
- Jones EL, Jones TS, Nathan Pearlman NW, et al. Long-term follow-up and survival of patients following a recurrence of melanoma after a negative sentinel lymph node biopsy result. JAMA Surg 2013; 148:456–461.
In Reply: Thank you for your important question. Examination of the excision specimen of the patient’s primary cutaneous melanoma lesion demonstrated a Breslow depth of 1.92 mm. He did indeed undergo sentinel lymph node biopsy at the time of excision. Histologic examination of the biopsy specimen was negative for evidence of metastatic melanoma. Despite this, he obviously developed metastatic disease several years later.
As you allude to, sentinel lymph node biopsy is an important minimally invasive procedure in patients with melanoma. Morton et al1 compared it with nodal observation and found that in patients with at least intermediate-thickness cutaneous melanoma, sentinel node biopsy significantly prolonged disease-free survival for all patients and improved melanoma-specific survival rates for patients with nodal metastases from intermediate-thickness melanomas (1.2–3.5 mm).1 However, it remains an imperfect procedure, and a percentage of patients develop recurrence or metastasis despite a negative biopsy. In a recent study by Jones et al,2 16% of melanoma patients in a cohort with a negative sentinel node biopsy developed recurrence.2 In these unfortunate patients, medications such as CTLA-4 inhibitors and PD-1 inhibitors now offer hope for prolonged survival.
- Morton DL, Thompson JF, Cochran AJ, et al, for the MSLT Group. Final trial report of sentinel-node biopsy versus nodal observation in melanoma. N Engl J Med 2014; 370:599–609.
- Jones EL, Jones TS, Nathan Pearlman NW, et al. Long-term follow-up and survival of patients following a recurrence of melanoma after a negative sentinel lymph node biopsy result. JAMA Surg 2013; 148:456–461.
Long-acting reversible contraception: Who, what, when, and how
› Suggest long-acting reversible contraception (LARC), including intrauterine devices (IUDs), as a first-line method of contraception to most women, including adolescents and nulliparous women. A
› Offer immediate post-placental insertion of LARC when counseling women who have barriers to seeking contraception at a postpartum visit or are unlikely to return for a postpartum visit. B
› Treat sexually transmitted infections in most cases without removing an IUD that is already in place. Consider removing the IUD, however, if there is no clinical improvement after 2 to 3 days of antibiotics. A
Strength of recommendation (SOR)
A Good-quality patient-oriented evidence
B Inconsistent or limited-quality patient-oriented evidence
C Consensus, usual practice, opinion, disease-oriented evidence, case series
The number of women using long-acting reversible contraception (LARC) in the United States has been increasing, with current use accounting for approximately 18% of reversible contraception, according to the National Survey of Family Growth.1,2 LARC includes any method of contraception that lasts ≥3 years, is easily reversed, and does not rely on the user to maintain efficacy. Five LARC devices are available in the United States: 4 intrauterine devices (IUDs) and one subdermal implant.
The number of women using LARC is surprisingly low, given that it is considered a first-line contraceptive method for most women and adolescents,3 and when compared with other forms of reversible contraception, is more efficacious,4-6 has higher satisfaction rates,7-9 and higher rates of continuation.9 In fact, the Contraceptive CHOICE Project—a St. Louis community-based research program promoting and enabling access to reversible contraceptive methods—has shown that when appropriate counseling is provided and cost barriers are removed, up to 79% of women choose LARC as their preferred method of contraception.10
CASES › Jenny, who is 16 years old, comes to your office with her mother to discuss contraceptive options. She is nulliparous, has regular menses, and, aside from a body mass index (BMI) of 28, has no medical problems. Her mother is concerned about Jenny becoming pregnant while she is still in high school.
Maria D, a 32-year-old G2P1, comes in for a prenatal visit with her husband. She tells you that after delivery she is interested in a long-acting contraceptive, but is planning on breastfeeding and does not want anything to interfere with that.
What LARC options do these and other patients have?
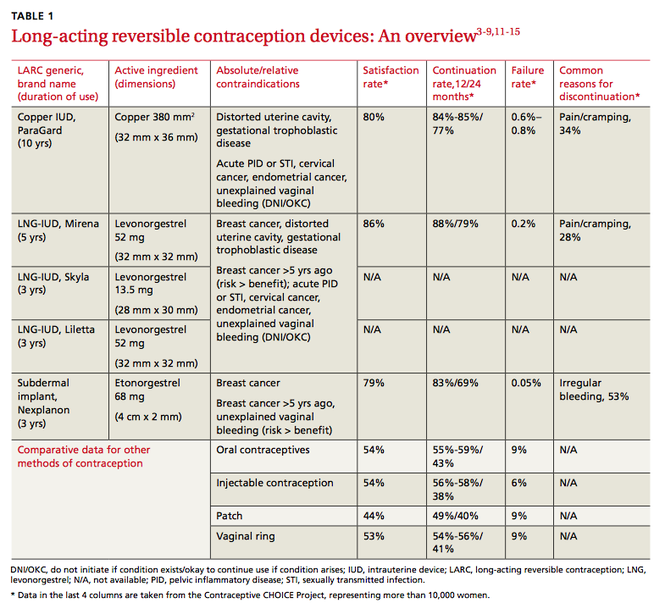
The 4 IUDs and one implant approved for use are all viable options depending on a patient’s preference and comorbidities (TABLE 1).3-9,11-15 The copper IUD is the oldest method of LARC available and the only one that is nonhormonal. It is approved by the Food and Drug Administration (FDA) for use up to 10 years,11 but studies support its effectiveness for up to 12 years.16
The remaining IUDs (Skyla, Liletta, Mirena) contain varying amounts of the progestin levonorgestrel (LNG), released by each device at a slightly different rate that declines over time. Skyla releases a significantly lower dose of hormone than Liletta or Mirena.12-14 Skyla and Liletta are FDA-approved for up to 3 years of use,12,13 and Liletta is currently undergoing trials to gain approval for use up to 5 years. Mirena is FDA-approved for use up to 5 years,14 but studies have shown that it can be effective for 7 years.4,16
The only implant available in the US is Nexplanon, a plastic rod containing 68 mg of etonorgestrel. It is inserted subdermally and is FDA-approved for use up to 3 years.15
Through systemic hormonal effects, the primary mechanism of action of the implant is prevention of ovulation. Additionally, the implant has been shown to inhibit endometrial proliferation and cervical mucus thickening, both of which may contribute to the implant’s overall effectiveness.17 In contrast, both the copper IUD and the LNG-IUDs work primarily by preventing fertilization. The LNG-IUDs also exhibit local hormonal effects (endometrial atrophy and thickened cervical mucus) that contribute to their effectiveness.17
Who is eligible for LARC?
LARC is suitable for the vast majority of women of reproductive age. For most multiparous women ≥20 years, all LARC devices are classified as category 1 (use without restriction) in the Centers for Disease Control and Prevention’s (CDC) US Medical Eligibility Criteria (US MEC).3 For women <20 years, the implant is also considered category 1, but IUDs in this age group are classified as category 2 (recommended with the caution that advantages usually outweigh risks) because of concerns about an increased risk of IUD expulsion and the increased prevalence of sexually transmitted infections (STIs) in adolescents.3 Contraindications to use of LARC vary depending on the method chosen (TABLE 1).3
There has been concern about the efficacy of implants in overweight women because the original trials of subdermal implants excluded women >130% of ideal body weight. However, according to the Contraceptive CHOICE Project, overweight and obese women enrolled in its program did not experience reduced contraceptive efficacy when using the implant when compared with normal-weight women.18
When can LARC devices be inserted?
LARC device insertion is possible at any time during the menstrual cycle. An algorithm to guide initiation of LARC is available through the Reproductive Health Access Project’s Web site at http://www.reproductiveaccess.org/wp-content/uploads/2014/12/quickstart_algorithm.pdf.
Rule out pregnancy before placing any LARC device. The copper IUD can be inserted at any time during the menstrual cycle without the need for back-up contraception.11,19 In contrast, for LNG-IUDs, back-up contraception is recommended for 7 days unless the insertion is done during the first 7 days of the menstrual cycle.12-14,19
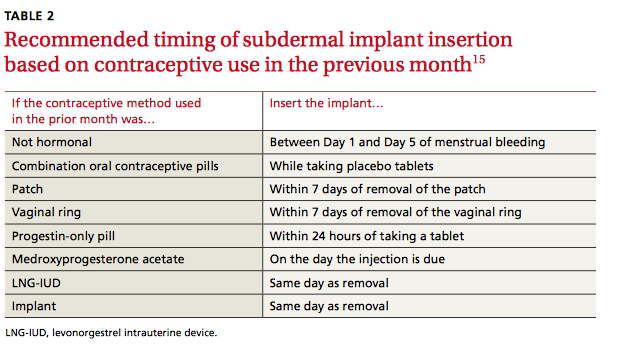
For the implant, recommendations about when to insert are based on a woman’s previous method of contraception (TABLE 2).15 If insertion is done at a time other than when recommended, advise patients to use barrier protection for 7 days after insertion.4,15,19
Other issues often arise and cause concern about whether and when a LARC device can be inserted, including the possibility of undiagnosed STI, time elapsed since delivery, and advisability of use when breastfeeding.
Sexually transmitted infections and IUDs
Whether or not a woman chooses to receive an IUD, follow routine CDC guidelines in determining if a patient is a candidate for STI screening.20 If a woman wants an IUD and routine screening is recommended, you can perform screening on the day of IUD insertion.4,19 For women with an IUD already in place who are diagnosed with an STI, treat the infection while leaving the IUD in place.19 For women with a known or suspected STI who do not have an IUD already, treat the STI before inserting the IUD. The American Congress of Obstetricians and Gynecologists (ACOG) advises postponing insertion of an IUD until a negative STI test result is obtained 3 to 4 weeks after treatment completion.4
Breastfeeding concerns and timing of insertion postpartum
The US MEC classifies insertion of the copper IUD as category 1 for all postpartum women, regardless of breastfeeding status, if placed >4 weeks postpartum or immediately postpartum (defined as within 10 minutes of the delivery of the placenta). IUD placement is category 2 (recommended with the caution that advantages usually outweigh risks) if placed ≥10 minutes after placental delivery (until 4 weeks postpartum) because of an increased risk of expulsion.3
The US MEC also considers use of the implant and LNG-IUDs in breastfeeding women as category 1 if the device is placed at ≥4 weeks postpartum. Insertion at <4 weeks postpartum is considered category 2 because of concerns for decreased breast milk supply.3 However, studies on whether progestin-containing LARC devices affect breastfeeding have yielded varying results. In one randomized controlled trial (RCT) of 69 breastfeeding women using the implant, breastfeeding duration and milk production were not dependent on the timing of insertion after delivery.21 Another RCT of 96 women using LNG-IUDs showed fewer women continued to breastfeed at 6 months when their LNG-IUD was inserted immediately postpartum, compared with waiting 6 weeks.22
In addition to a concern about breast milk supply, breastfeeding women have a higher risk for uterine perforation from IUDs, especially during the first 36 weeks after delivery.23
Several studies have shown that there is a lower repeat pregnancy rate among women who receive immediate postpartum LARC placement.24 However, even if IUD insertion is performed immediately postpartum, there is a higher expulsion rate than when the IUD is inserted ≥4 weeks postpartum. The expulsion rates for insertion <10 minutes after vaginal delivery range from 9.5% to 15% for the copper IUD to as high as 24% for the LNG-IUDs. Expulsion rates for all IUDs are slightly lower for cesarean delivery.4,25,26 ACOG supports immediate post-placental placement for women with barriers to postpartum care or limited access to contraception.4
How can I help my patients make an informed choice?
Provide counseling on efficacy, common adverse effects, risks, and complications.
Efficacy is high
The failure rate of LARC is equal to, or lower than, that of female sterilization and is significantly lower than that of oral contraceptives (TABLE 1).4-6 Not only are LARC devices extremely effective, they have a higher rate of satisfaction than any other reversible contraceptive (TABLE 1).7,8
Common adverse effects
The most common adverse effect seen with all LARC devices is an alteration in menstrual bleeding, and a frequent adverse effect with IUDs is pain. Vaginitis is less common and can be seen with any of the devices. The progestin-containing LARC devices are associated with hormonal effects: vaginitis, headache, weight gain, acne, breast pain, hair loss, and emotional lability.12-15
Copper IUD. Many women using the copper IUD experience either a transient increase in menstrual bleeding lasting for a few months or inter-menstrual bleeding that tends to continue for the duration of use.4,17 However, according to data from the Contraceptive CHOICE Project, the most common reason cited for early discontinuation of the copper IUD is pain and cramping.9
LNG-IUDs. Like the copper IUD, many users of LNG-IUDs experience an initial increase in menstrual bleeding. However, unlike the other LARC devices, 20% to 33% of Mirena users are likely to experience amenorrhea after one year of use and 70% at 2 years.4,14 According to package inserts, amenorrhea after 3 years is less common with both Skyla (12%) and Liletta (38%).12,13 As with the copper IUD, based on data from the Contraceptive CHOICE Project, the most common reason cited for early discontinuation of LNG-IUDs is pain and cramping.9
Subdermal implant. Changes in menses in women using the subdermal implant range from amenorrhea (22%) to prolonged bleeding (18%).15,17 Although it is difficult to predict which pattern a particular woman will experience, heavier women are more likely to have heavier bleeding patterns, and initial bleeding patterns are predictive of future ones.4 The most common reason women choose to discontinue use of the implant is abnormal bleeding.4,9,27,28
Newer IUDs do not increase risk of STIs
Many patients and clinicians erroneously believe that IUDs increase the risk of STIs and therefore assume that patients with a history of STI are not appropriate candidates for an IUD.29 There is a slightly increased risk of pelvic inflammatory disease (PID) in the first 21 days after insertion of an IUD. However, in contrast to older IUDs, currently available IUDs do not increase the general risk for STIs.17,30
Risk of infertility is nil
There is no risk of infertility from use of currently available LARCs. For those who want to become pregnant, fertility typically returns immediately after removal of the device, regardless of which method of LARC is used.11-15,30
Complications of IUD insertion
Uterine perforation. Uterine perforation occurs in 0.8 to 2.1 per 1000 women, usually at the time of IUD placement. If IUD strings are not visible during a speculum examination, locate the IUD with ultrasound.4,17,30 If the IUD is in the abdomen, refer to a gynecologist for laparoscopic removal and select another form of contraception for use in the interim.30
Expulsion. Rates of expulsion are low, occurring in less than 10% of women4,17 and are not affected by parity or BMI.31 Expulsion rates are higher when the IUD is inserted immediately postpartum.4,25,26 Adolescents also have a 2-fold higher risk of uterine expulsion than older women.31
Ectopic pregnancy. Although a woman’s overall risk of ectopic pregnancy is not increased by using an IUD,4 it is true that if a woman becomes pregnant with an IUD in place, the pregnancy is more likely to be ectopic. Thus, if pregnancy is confirmed in a woman with an IUD in place, rule out ectopic pregnancy.
The FDA and the World Health Organization recommend that if an intrauterine pregnancy is confirmed with an IUD in place and the strings are visible, the IUD should be removed.4 Although removing the IUD increases the risk of spontaneous abortion (SAB) as compared with pregnancies without an IUD in place, the risk of SAB is still lower than if the IUD is left in place.4 Additional risks of continuing a pregnancy with an IUD in place include increased risks of preterm labor, chorioamnionitis, and septic abortion.4,30
Complications of subdermal implant insertion
After insertion of the implant, women usually experience temporary bruising and soreness at the insertion site. Less than 1% of women develop an infection or hematoma.17 There is a low risk of nerve damage if the implant is inserted too deeply.15 Removal of the subdermal implant is recommended if pregnancy occurs.15
CASE DECISIONS › Jenny has been using oral contraceptive pills, but not regularly. You suggest that LARC may be a better option and counsel her that if she does choose an IUD or the implant, it is likely that her menses will change. You provide information and reassurance that LARC is safe to use in adolescents. Jenny says she would like to try an implant. Six months later, Jenny returns and says the implant is working well. She has some irregular bleeding, but it is not bothersome.
You review with Ms. D the types of LARC devices available and reassure her that all are safe to use once breastfeeding is established. Ms. D says she would like to use an IUD and elects to wait until her postpartum visit to have an IUD inserted. Ms. D returns 6 months after IUD insertion; breastfeeding is going well, and she has not had any menstrual bleeding since delivery.
CORRESPONDENCE
Karyn Kolman, MD, 2800 East Ajo Way, Room 3006, Tucson, AZ 85713; [email protected]
1. Daniels K, Daugherty J, Jones J. Current contraceptive status among women aged 15-44: United States 2011-2013. NCHS data brief, no. 173. Hyattsville, MD: National Center for Health Statistics, 2014.
2. Branum AM, Jones J. Trends in long-acting reversible contraception use among US women aged 15-44. NCHS data brief, no. 188. Hyattsville, MD: National Center for Health Statistics, 2015.
3. Centers for Disease Control and Prevention (CDC). US medical eligibility criteria for contraceptive use, 2010. MMWR Recomm Rep. 2010;59:1-86.
4. American College of Obstetricians and Gynecologists. ACOG Practice Bulletin No 121: Long-acting reversible contraception: Implants and intrauterine devices. Obstet Gynecol. 2011;118:184-196.
5. Pickle S, Wu J, Burbank-Schmitt E. Prevention of unintended pregnancy: a focus on long-acting reversible contraception. Prim Care. 2014;41:239-260.
6. Winner B, Peipert JF, Zhao Q, et al. Effectiveness of long-acting reversible contraception. N Engl J Med. 2012;366:1998-2007.
7. Peipert JF, Zhao Q, Allsworth JE, et al. Continuation and satisfaction of reversible contraception. Obstet Gynecol. 2011;117:1105-1113.
8. O’Neil-Callahan M, Peipert JF, Zhao Q, et al. Twenty-four-month continuation of reversible contraception. Obstet Gynecol. 2013;122:1083-1091.
9. Grunloh DS, Casner T, Secura GM, et al. Characteristics associated with discontinuation of long-acting reversible contraception within the first 6 months of use. Obstet Gynecol. 2011;117:705-719.
10. Birgisson NE, Zhao Q, Secura GM, et al. Preventing unintended pregnancy: the contraceptive CHOICE project in review. J Womens Health (Larchmt). 2015;24:349-353.
11. ParaGard T 380A. (intrauterine copper contraceptive) [package insert]. Sellersville, PA : Teva Pharmaceuticals USA, Inc., 2013.
12. Skyla (levonorgestrel-releasing intrauterine system) [package insert]. Wayne, NJ : Bayer HealthCare Pharmaceuticals, Inc., 2013.
13. Liletta (levonorgestrel-releasing intrauterine system) [package insert]. Parsippany, NJ : Actavis Pharma, Inc., 2015.
14. Mirena (levonorgestrel-releasing intrauterine system) [package insert]. Whippany, NJ : Bayer HealthCare Pharmaceuticals, Inc., 2014.
15. Nexplanon (etongestrel implant) [package insert]. Whitehouse Station, NJ: Merck & Co Inc.; 2014.
16. Wu JP, Pickle S. Extended use of the intrauterine device: a literature review and recommendations for clinical practice. Contraception. 2014;89:495-503.
17. Stoddard A, McNicholas C, Peipert JF. Efficacy and safety of long-acting reversible contraception. Drugs. 2011;71:969-980.
18. Xu H, Wade JA, Peipert JF, et al. Contraceptive failure rates of etonogestrel subdermal implants in overweight and obese women. Obstet Gynecol. 2012;120:21-26.
19. Centers for Disease Control and Prevention (CDC). US selected practice recommendations for contraceptive use. MMWR Recomm Rep. 2013;62:1-60.
20. Centers for Disease Control and Prevention (CDC). Sexually transmitted disease treatment guidelines. MMWR Recomm Rep. 2010;59:1-110.
21. Gurtcheff SE, Turok DK, Stoddard G, et al. Lactogenesis after early postpartum use of the contraceptive implant: a randomized controlled trial. Obstet Gynecol. 2011;117:1114-1121.
22. Chen BA, Reeves MF, Creinin MD, et al. Postplacental or delayed levonorgestrel intrauterine device insertion and breast-feeding duration. Contraception. 2011;84:499-504.
23. Heinemann K, Reed S, Moehner S, et al. Risk of uterine perforation with levonorgestrel-releasing and copper intrauterine devices in the European Active Surveillance Study on Intrauterine Devices. Contraception. 2015;91:274-279.
24. Tocce K, Sheeder J, Python J, et al. Long acting reversible contraception in postpartum adolescents: early initiation of etonogestrel implant is superior to IUDs in the outpatient setting. J Pediatr Adolesc Gynecol. 2012;25:59-63.
25. Mwalwanda CS, Black KI. Immediate post-partum initiation of intrauterine contraception and implants: a review of the safety and guidelines for use. Aust N Z J Obstet Gynaecol. 2013;53:331-337.
26. Sober, S, Schreiber CA. Postpartum contraception. Clin Obstet Gynecol. 2014;57:763-776.
27. Dickerson LM, Diaz VA, Jordon J, et al. Satisfaction, early removal, and side effects associated with long-acting reversible contraception. Fam Med. 2013;45:701-707.
28. Berenson AB, Tan A, Hirth JM. Complications and continuation rates associated with 2 types of long-acting contraception. Am J Obstet Gynecol. 2015;212:e1-e8.
29. Kavanaugh ML, Frowirth L, Jerman J, et al. Long-acting reversible contraception for adolescents and young adults: patient and provider perspectives. J Pediatr Adolesc Gynecol. 2013;86:86-95.
30. Espey E, Ogburn T. Long-acting reversible contraceptives: intrauterine devices and the contraceptive implant. Obstet Gynecol. 2011;117:705-719.
31. Madden T, McNicholas C, Zhao Q, et al. Association of age and parity with intrauterine device expulsion. Obstet Gynecol. 2014;124:718-726.
› Suggest long-acting reversible contraception (LARC), including intrauterine devices (IUDs), as a first-line method of contraception to most women, including adolescents and nulliparous women. A
› Offer immediate post-placental insertion of LARC when counseling women who have barriers to seeking contraception at a postpartum visit or are unlikely to return for a postpartum visit. B
› Treat sexually transmitted infections in most cases without removing an IUD that is already in place. Consider removing the IUD, however, if there is no clinical improvement after 2 to 3 days of antibiotics. A
Strength of recommendation (SOR)
A Good-quality patient-oriented evidence
B Inconsistent or limited-quality patient-oriented evidence
C Consensus, usual practice, opinion, disease-oriented evidence, case series
The number of women using long-acting reversible contraception (LARC) in the United States has been increasing, with current use accounting for approximately 18% of reversible contraception, according to the National Survey of Family Growth.1,2 LARC includes any method of contraception that lasts ≥3 years, is easily reversed, and does not rely on the user to maintain efficacy. Five LARC devices are available in the United States: 4 intrauterine devices (IUDs) and one subdermal implant.
The number of women using LARC is surprisingly low, given that it is considered a first-line contraceptive method for most women and adolescents,3 and when compared with other forms of reversible contraception, is more efficacious,4-6 has higher satisfaction rates,7-9 and higher rates of continuation.9 In fact, the Contraceptive CHOICE Project—a St. Louis community-based research program promoting and enabling access to reversible contraceptive methods—has shown that when appropriate counseling is provided and cost barriers are removed, up to 79% of women choose LARC as their preferred method of contraception.10
CASES › Jenny, who is 16 years old, comes to your office with her mother to discuss contraceptive options. She is nulliparous, has regular menses, and, aside from a body mass index (BMI) of 28, has no medical problems. Her mother is concerned about Jenny becoming pregnant while she is still in high school.
Maria D, a 32-year-old G2P1, comes in for a prenatal visit with her husband. She tells you that after delivery she is interested in a long-acting contraceptive, but is planning on breastfeeding and does not want anything to interfere with that.
What LARC options do these and other patients have?
The 4 IUDs and one implant approved for use are all viable options depending on a patient’s preference and comorbidities (TABLE 1).3-9,11-15 The copper IUD is the oldest method of LARC available and the only one that is nonhormonal. It is approved by the Food and Drug Administration (FDA) for use up to 10 years,11 but studies support its effectiveness for up to 12 years.16
The remaining IUDs (Skyla, Liletta, Mirena) contain varying amounts of the progestin levonorgestrel (LNG), released by each device at a slightly different rate that declines over time. Skyla releases a significantly lower dose of hormone than Liletta or Mirena.12-14 Skyla and Liletta are FDA-approved for up to 3 years of use,12,13 and Liletta is currently undergoing trials to gain approval for use up to 5 years. Mirena is FDA-approved for use up to 5 years,14 but studies have shown that it can be effective for 7 years.4,16
The only implant available in the US is Nexplanon, a plastic rod containing 68 mg of etonorgestrel. It is inserted subdermally and is FDA-approved for use up to 3 years.15
Through systemic hormonal effects, the primary mechanism of action of the implant is prevention of ovulation. Additionally, the implant has been shown to inhibit endometrial proliferation and cervical mucus thickening, both of which may contribute to the implant’s overall effectiveness.17 In contrast, both the copper IUD and the LNG-IUDs work primarily by preventing fertilization. The LNG-IUDs also exhibit local hormonal effects (endometrial atrophy and thickened cervical mucus) that contribute to their effectiveness.17
Who is eligible for LARC?
LARC is suitable for the vast majority of women of reproductive age. For most multiparous women ≥20 years, all LARC devices are classified as category 1 (use without restriction) in the Centers for Disease Control and Prevention’s (CDC) US Medical Eligibility Criteria (US MEC).3 For women <20 years, the implant is also considered category 1, but IUDs in this age group are classified as category 2 (recommended with the caution that advantages usually outweigh risks) because of concerns about an increased risk of IUD expulsion and the increased prevalence of sexually transmitted infections (STIs) in adolescents.3 Contraindications to use of LARC vary depending on the method chosen (TABLE 1).3
There has been concern about the efficacy of implants in overweight women because the original trials of subdermal implants excluded women >130% of ideal body weight. However, according to the Contraceptive CHOICE Project, overweight and obese women enrolled in its program did not experience reduced contraceptive efficacy when using the implant when compared with normal-weight women.18
When can LARC devices be inserted?
LARC device insertion is possible at any time during the menstrual cycle. An algorithm to guide initiation of LARC is available through the Reproductive Health Access Project’s Web site at http://www.reproductiveaccess.org/wp-content/uploads/2014/12/quickstart_algorithm.pdf.
Rule out pregnancy before placing any LARC device. The copper IUD can be inserted at any time during the menstrual cycle without the need for back-up contraception.11,19 In contrast, for LNG-IUDs, back-up contraception is recommended for 7 days unless the insertion is done during the first 7 days of the menstrual cycle.12-14,19
For the implant, recommendations about when to insert are based on a woman’s previous method of contraception (TABLE 2).15 If insertion is done at a time other than when recommended, advise patients to use barrier protection for 7 days after insertion.4,15,19
Other issues often arise and cause concern about whether and when a LARC device can be inserted, including the possibility of undiagnosed STI, time elapsed since delivery, and advisability of use when breastfeeding.
Sexually transmitted infections and IUDs
Whether or not a woman chooses to receive an IUD, follow routine CDC guidelines in determining if a patient is a candidate for STI screening.20 If a woman wants an IUD and routine screening is recommended, you can perform screening on the day of IUD insertion.4,19 For women with an IUD already in place who are diagnosed with an STI, treat the infection while leaving the IUD in place.19 For women with a known or suspected STI who do not have an IUD already, treat the STI before inserting the IUD. The American Congress of Obstetricians and Gynecologists (ACOG) advises postponing insertion of an IUD until a negative STI test result is obtained 3 to 4 weeks after treatment completion.4
Breastfeeding concerns and timing of insertion postpartum
The US MEC classifies insertion of the copper IUD as category 1 for all postpartum women, regardless of breastfeeding status, if placed >4 weeks postpartum or immediately postpartum (defined as within 10 minutes of the delivery of the placenta). IUD placement is category 2 (recommended with the caution that advantages usually outweigh risks) if placed ≥10 minutes after placental delivery (until 4 weeks postpartum) because of an increased risk of expulsion.3
The US MEC also considers use of the implant and LNG-IUDs in breastfeeding women as category 1 if the device is placed at ≥4 weeks postpartum. Insertion at <4 weeks postpartum is considered category 2 because of concerns for decreased breast milk supply.3 However, studies on whether progestin-containing LARC devices affect breastfeeding have yielded varying results. In one randomized controlled trial (RCT) of 69 breastfeeding women using the implant, breastfeeding duration and milk production were not dependent on the timing of insertion after delivery.21 Another RCT of 96 women using LNG-IUDs showed fewer women continued to breastfeed at 6 months when their LNG-IUD was inserted immediately postpartum, compared with waiting 6 weeks.22
In addition to a concern about breast milk supply, breastfeeding women have a higher risk for uterine perforation from IUDs, especially during the first 36 weeks after delivery.23
Several studies have shown that there is a lower repeat pregnancy rate among women who receive immediate postpartum LARC placement.24 However, even if IUD insertion is performed immediately postpartum, there is a higher expulsion rate than when the IUD is inserted ≥4 weeks postpartum. The expulsion rates for insertion <10 minutes after vaginal delivery range from 9.5% to 15% for the copper IUD to as high as 24% for the LNG-IUDs. Expulsion rates for all IUDs are slightly lower for cesarean delivery.4,25,26 ACOG supports immediate post-placental placement for women with barriers to postpartum care or limited access to contraception.4
How can I help my patients make an informed choice?
Provide counseling on efficacy, common adverse effects, risks, and complications.
Efficacy is high
The failure rate of LARC is equal to, or lower than, that of female sterilization and is significantly lower than that of oral contraceptives (TABLE 1).4-6 Not only are LARC devices extremely effective, they have a higher rate of satisfaction than any other reversible contraceptive (TABLE 1).7,8
Common adverse effects
The most common adverse effect seen with all LARC devices is an alteration in menstrual bleeding, and a frequent adverse effect with IUDs is pain. Vaginitis is less common and can be seen with any of the devices. The progestin-containing LARC devices are associated with hormonal effects: vaginitis, headache, weight gain, acne, breast pain, hair loss, and emotional lability.12-15
Copper IUD. Many women using the copper IUD experience either a transient increase in menstrual bleeding lasting for a few months or inter-menstrual bleeding that tends to continue for the duration of use.4,17 However, according to data from the Contraceptive CHOICE Project, the most common reason cited for early discontinuation of the copper IUD is pain and cramping.9
LNG-IUDs. Like the copper IUD, many users of LNG-IUDs experience an initial increase in menstrual bleeding. However, unlike the other LARC devices, 20% to 33% of Mirena users are likely to experience amenorrhea after one year of use and 70% at 2 years.4,14 According to package inserts, amenorrhea after 3 years is less common with both Skyla (12%) and Liletta (38%).12,13 As with the copper IUD, based on data from the Contraceptive CHOICE Project, the most common reason cited for early discontinuation of LNG-IUDs is pain and cramping.9
Subdermal implant. Changes in menses in women using the subdermal implant range from amenorrhea (22%) to prolonged bleeding (18%).15,17 Although it is difficult to predict which pattern a particular woman will experience, heavier women are more likely to have heavier bleeding patterns, and initial bleeding patterns are predictive of future ones.4 The most common reason women choose to discontinue use of the implant is abnormal bleeding.4,9,27,28
Newer IUDs do not increase risk of STIs
Many patients and clinicians erroneously believe that IUDs increase the risk of STIs and therefore assume that patients with a history of STI are not appropriate candidates for an IUD.29 There is a slightly increased risk of pelvic inflammatory disease (PID) in the first 21 days after insertion of an IUD. However, in contrast to older IUDs, currently available IUDs do not increase the general risk for STIs.17,30
Risk of infertility is nil
There is no risk of infertility from use of currently available LARCs. For those who want to become pregnant, fertility typically returns immediately after removal of the device, regardless of which method of LARC is used.11-15,30
Complications of IUD insertion
Uterine perforation. Uterine perforation occurs in 0.8 to 2.1 per 1000 women, usually at the time of IUD placement. If IUD strings are not visible during a speculum examination, locate the IUD with ultrasound.4,17,30 If the IUD is in the abdomen, refer to a gynecologist for laparoscopic removal and select another form of contraception for use in the interim.30
Expulsion. Rates of expulsion are low, occurring in less than 10% of women4,17 and are not affected by parity or BMI.31 Expulsion rates are higher when the IUD is inserted immediately postpartum.4,25,26 Adolescents also have a 2-fold higher risk of uterine expulsion than older women.31
Ectopic pregnancy. Although a woman’s overall risk of ectopic pregnancy is not increased by using an IUD,4 it is true that if a woman becomes pregnant with an IUD in place, the pregnancy is more likely to be ectopic. Thus, if pregnancy is confirmed in a woman with an IUD in place, rule out ectopic pregnancy.
The FDA and the World Health Organization recommend that if an intrauterine pregnancy is confirmed with an IUD in place and the strings are visible, the IUD should be removed.4 Although removing the IUD increases the risk of spontaneous abortion (SAB) as compared with pregnancies without an IUD in place, the risk of SAB is still lower than if the IUD is left in place.4 Additional risks of continuing a pregnancy with an IUD in place include increased risks of preterm labor, chorioamnionitis, and septic abortion.4,30
Complications of subdermal implant insertion
After insertion of the implant, women usually experience temporary bruising and soreness at the insertion site. Less than 1% of women develop an infection or hematoma.17 There is a low risk of nerve damage if the implant is inserted too deeply.15 Removal of the subdermal implant is recommended if pregnancy occurs.15
CASE DECISIONS › Jenny has been using oral contraceptive pills, but not regularly. You suggest that LARC may be a better option and counsel her that if she does choose an IUD or the implant, it is likely that her menses will change. You provide information and reassurance that LARC is safe to use in adolescents. Jenny says she would like to try an implant. Six months later, Jenny returns and says the implant is working well. She has some irregular bleeding, but it is not bothersome.
You review with Ms. D the types of LARC devices available and reassure her that all are safe to use once breastfeeding is established. Ms. D says she would like to use an IUD and elects to wait until her postpartum visit to have an IUD inserted. Ms. D returns 6 months after IUD insertion; breastfeeding is going well, and she has not had any menstrual bleeding since delivery.
CORRESPONDENCE
Karyn Kolman, MD, 2800 East Ajo Way, Room 3006, Tucson, AZ 85713; [email protected]
1. Daniels K, Daugherty J, Jones J. Current contraceptive status among women aged 15-44: United States 2011-2013. NCHS data brief, no. 173. Hyattsville, MD: National Center for Health Statistics, 2014.
2. Branum AM, Jones J. Trends in long-acting reversible contraception use among US women aged 15-44. NCHS data brief, no. 188. Hyattsville, MD: National Center for Health Statistics, 2015.
3. Centers for Disease Control and Prevention (CDC). US medical eligibility criteria for contraceptive use, 2010. MMWR Recomm Rep. 2010;59:1-86.
4. American College of Obstetricians and Gynecologists. ACOG Practice Bulletin No 121: Long-acting reversible contraception: Implants and intrauterine devices. Obstet Gynecol. 2011;118:184-196.
5. Pickle S, Wu J, Burbank-Schmitt E. Prevention of unintended pregnancy: a focus on long-acting reversible contraception. Prim Care. 2014;41:239-260.
6. Winner B, Peipert JF, Zhao Q, et al. Effectiveness of long-acting reversible contraception. N Engl J Med. 2012;366:1998-2007.
7. Peipert JF, Zhao Q, Allsworth JE, et al. Continuation and satisfaction of reversible contraception. Obstet Gynecol. 2011;117:1105-1113.
8. O’Neil-Callahan M, Peipert JF, Zhao Q, et al. Twenty-four-month continuation of reversible contraception. Obstet Gynecol. 2013;122:1083-1091.
9. Grunloh DS, Casner T, Secura GM, et al. Characteristics associated with discontinuation of long-acting reversible contraception within the first 6 months of use. Obstet Gynecol. 2011;117:705-719.
10. Birgisson NE, Zhao Q, Secura GM, et al. Preventing unintended pregnancy: the contraceptive CHOICE project in review. J Womens Health (Larchmt). 2015;24:349-353.
11. ParaGard T 380A. (intrauterine copper contraceptive) [package insert]. Sellersville, PA : Teva Pharmaceuticals USA, Inc., 2013.
12. Skyla (levonorgestrel-releasing intrauterine system) [package insert]. Wayne, NJ : Bayer HealthCare Pharmaceuticals, Inc., 2013.
13. Liletta (levonorgestrel-releasing intrauterine system) [package insert]. Parsippany, NJ : Actavis Pharma, Inc., 2015.
14. Mirena (levonorgestrel-releasing intrauterine system) [package insert]. Whippany, NJ : Bayer HealthCare Pharmaceuticals, Inc., 2014.
15. Nexplanon (etongestrel implant) [package insert]. Whitehouse Station, NJ: Merck & Co Inc.; 2014.
16. Wu JP, Pickle S. Extended use of the intrauterine device: a literature review and recommendations for clinical practice. Contraception. 2014;89:495-503.
17. Stoddard A, McNicholas C, Peipert JF. Efficacy and safety of long-acting reversible contraception. Drugs. 2011;71:969-980.
18. Xu H, Wade JA, Peipert JF, et al. Contraceptive failure rates of etonogestrel subdermal implants in overweight and obese women. Obstet Gynecol. 2012;120:21-26.
19. Centers for Disease Control and Prevention (CDC). US selected practice recommendations for contraceptive use. MMWR Recomm Rep. 2013;62:1-60.
20. Centers for Disease Control and Prevention (CDC). Sexually transmitted disease treatment guidelines. MMWR Recomm Rep. 2010;59:1-110.
21. Gurtcheff SE, Turok DK, Stoddard G, et al. Lactogenesis after early postpartum use of the contraceptive implant: a randomized controlled trial. Obstet Gynecol. 2011;117:1114-1121.
22. Chen BA, Reeves MF, Creinin MD, et al. Postplacental or delayed levonorgestrel intrauterine device insertion and breast-feeding duration. Contraception. 2011;84:499-504.
23. Heinemann K, Reed S, Moehner S, et al. Risk of uterine perforation with levonorgestrel-releasing and copper intrauterine devices in the European Active Surveillance Study on Intrauterine Devices. Contraception. 2015;91:274-279.
24. Tocce K, Sheeder J, Python J, et al. Long acting reversible contraception in postpartum adolescents: early initiation of etonogestrel implant is superior to IUDs in the outpatient setting. J Pediatr Adolesc Gynecol. 2012;25:59-63.
25. Mwalwanda CS, Black KI. Immediate post-partum initiation of intrauterine contraception and implants: a review of the safety and guidelines for use. Aust N Z J Obstet Gynaecol. 2013;53:331-337.
26. Sober, S, Schreiber CA. Postpartum contraception. Clin Obstet Gynecol. 2014;57:763-776.
27. Dickerson LM, Diaz VA, Jordon J, et al. Satisfaction, early removal, and side effects associated with long-acting reversible contraception. Fam Med. 2013;45:701-707.
28. Berenson AB, Tan A, Hirth JM. Complications and continuation rates associated with 2 types of long-acting contraception. Am J Obstet Gynecol. 2015;212:e1-e8.
29. Kavanaugh ML, Frowirth L, Jerman J, et al. Long-acting reversible contraception for adolescents and young adults: patient and provider perspectives. J Pediatr Adolesc Gynecol. 2013;86:86-95.
30. Espey E, Ogburn T. Long-acting reversible contraceptives: intrauterine devices and the contraceptive implant. Obstet Gynecol. 2011;117:705-719.
31. Madden T, McNicholas C, Zhao Q, et al. Association of age and parity with intrauterine device expulsion. Obstet Gynecol. 2014;124:718-726.
Treating pain in a patient with addiction

Delayed cancer diagnosis tied to care dissatisfaction

Photo courtesy of NIH
Patients who make 3 or more trips to the general practitioner (GP) before they are referred for cancer tests are more likely to be dissatisfied with subsequent care, according to research published in the European Journal of Cancer Care.
Researchers analyzed survey responses from nearly 60,000 cancer patients and found that about 23% had visited their GP 3 or more times before they were referred for cancer tests.
These patients were more likely than patients with 1 or 2 GP visits to report negative experiences with regard to many different aspects of their care.
“This research shows that first impressions go a long way in determining how cancer patients view their experience of cancer treatment,” said study author Georgios Lyratzopoulos, MD, of University College London in the UK.
“A negative experience of diagnosis can trigger loss of confidence in their care throughout the cancer journey. When they occur, diagnostic delays are largely due to cancer symptoms being extremely hard to distinguish from other diseases, combined with a lack of accurate and easy-to-use tests. New diagnostic tools to help doctors decide which patients need referring are vital to improve the care experience for even more cancer patients.”
Dr Lyratzopoulos and his colleagues initially analyzed survey data from 73,462 cancer patients, but 15,355 of those patients (21%) had not seen a GP prior to their cancer diagnosis.
Of the 58,107 patients who had at least 1 primary care consultation, 44,827 (77%) had seen their GP once or twice before referral for cancer tests, and 13,280 (23%) had seen the GP 3 or more times.
The researchers analyzed patients’ responses to 12 survey questions that assessed satisfaction with various aspects of their cancer care.
And results showed that patients who had seen their GP 3 or more times before referral were significantly more likely than patients with 1 to 2 GP visits to report negative experiences across 10 of the 12 aspects of care.
The 12 aspects of care and patient responses (for 3+ GP visits and 1-2 visits, respectively) were as follows:
- Dissatisfied with overall care: 16% vs 9% (adjusted* odds ratio [aOR]=1.44, P<0.001)
- Dissatisfied with the way they were informed of their cancer: 22% vs 14% (aOR=1.38, P<0.001)
- Dissatisfied with their involvement in decision-making: 32% vs 25% (aOR=1.13, P<0.001)
- Lack of confidence/trust in their doctors: 19% vs 12% (aOR=1.22, P<0.001)
- Lack of confidence/trust in their nurses: 36% vs 27% (aOR=1.22, P<0.001)
- Thought doctors/nurses deliberately withheld information: 16% vs 10% (aOR=1.27, P<0.001)
- Dissatisfied with staff support: 41% vs 27% (aOR=1.68, P<0.001)
- Dissatisfied with integration of various caregivers (GP, hospital doctors/nurses, specialist nurses, etc): 45% vs 32% (aOR=1.48, P<0.001)
- Dissatisfied with the amount of time they had to wait at appointments with their hospital doctor: 31% vs 28% (aOR=1.10, P=0.007)
- Said their GP did not receive enough information about their condition or hospital treatment: 8% vs 5% (aOR=1.36, P<0.001)
- Said they did not receive clear written information about what they should or should not do after leaving the hospital: 20% vs 14% (aOR=1.06, P=0.100)
- Said they did not receive the name of a Clinical Nurse Specialist who would be in charge of their care: 11% vs 9% (aOR=1.00, P=0.894).
“This is the first time we’ve had direct feedback from patients on such a large scale to show how the timeliness of their diagnosis colors their experience of the care they later receive,” said Sara Hiom, of Cancer Research UK, which supported this study.
“It’s another good reason to highlight the importance of diagnosing cancer as quickly as possible, not just to give patients the best chances of survival, but also to improve their experience of the care they receive throughout their cancer journey.” ![]()
*The odds ratio was adjusted for patient age, sex, ethnicity, cancer diagnosis, and response tendency (likelihood of giving a positive or negative response to questions).
Pentoxifylline beat placebo in acute pancreatitis trial
Patients with acute pancreatitis who received pentoxifylline had fewer ICU admissions and shorter ICU and hospital stays than placebo-treated controls, according to a small, randomized double-blind trial reported in Gastroenterology.
“We showed that a single-institution drug trial for acute pancreatitis is feasible and that pentoxifylline is safe, cheap, and might have efficacy,” wrote Dr. Santhi Vege and his associates at the Mayo Clinic in Rochester, Minn. “This sets the stage for a larger trial of this drug in all patients with acute pancreatitis, to realize the goal of finding an effective drug that can be given within 24 hours of diagnosis in any setting.”
Tumor necrosis factor–alpha is a key culprit in severe acute pancreatitis, including pancreatic and peripancreatic necrosis, systemic inflammatory response syndrome, and persistent organ failure, the researchers noted. Pentoxifylline is a nonselective phosphodiesterase inhibitor that has been found safe and effective in other TNF-alpha–mediated diseases such as acute alcoholic hepatitis, but few studies in humans have evaluated the drug for acute pancreatitis, they said (Gastroenterology 2015 June 22 [doi:10.1053/j.gastro.2015.04.019]). For their study, the investigators randomized 28 patients with predicted severe acute pancreatitis to either placebo or 400 mg pentoxifylline given orally at enrollment and then three times a day for 72 hours. Both groups also received standard of care treatments such as antibiotics and fluid therapy, and had comparable baseline characteristics including age, sex, body mass index, Acute Physiology and Chronic Health Evaluation scores, systemic inflammatory response syndrome scores, and inflammatory marker levels, the researchers said.
Significantly fewer patients who received pentoxifylline needed to stay in the hospital for more than 4 days (14% vs. 57% for the placebo group; P = .046), and the maximum length of ICU stay was 0 days for the intervention group, compared with 13 days for the control group (P = .03), the investigators reported. Analyses of several other outcome measures also favored pentoxifylline over placebo, but did not reach statistical significance in the small study, including the need for ICU transfer (0% for pentoxifylline patients vs. 28% of the placebo group; P = .098) and the median length of hospitalization (for pentoxifylline: 3 days, range 1-5 days; for placebo: 5 days; range 1-30 days; P = .06).
The treatment and control groups did not significantly differ in terms of levels of inflammatory markers, including circulating TNF-alpha, said the investigators. Differences in levels of TNF-alpha, interleukin-6, IL-8, and C-reactive protein “may be significant if the sample size is larger,” they added.
The exact mechanism by which pentoxifylline affects acute pancreatitis is unclear, but the production of pancreatic TNF-alpha peaks about 24-36 hours into an episode of the disease, so patients might benefit from receiving pentoxifylline sooner than the 72-hour window dictated by the study protocol, said Dr. Vege and his associates. “Initiating drug therapy within a few hours is challenging, although a 24-hour cutoff time may be feasible in appropriate settings,” they wrote.
A scholarly opportunity award from the Mayo Clinic helped fund the work. The investigators reported having no relevant financial conflicts of interest.
The study of acute pancreatitis (AP) is economically and scientifically essential because acute pancreatitis is the most common reason for hospitalization among patients with GI diseases, consumes considerable resources, and is treated primarily with supportive measures. The pilot study by Dr. Vege and his colleagues reports that pentoxifylline treatment is safe for patients with severe acute pancreatitis and is associated with a promising reduction in ICU utilization and duration in patients requiring a hospital stay >4 days.

|
| Dr. Matthew J. DiMagno |
This study is not only provocative but also raises the hypothesis-generating question of how pentoxifylline might exert a salutary effect without reducing blood tumor necrosis factor–alpha levels (or IL-6, IL-8, or C-reactive protein levels). The authors ascribe this discordance to the timing of administering pentoxifylline and to potential TNF-alpha independent effects. Biologically, pancreatic TNF-alpha levels increase within the first 30-60 minutes of onset of acute pancreatitis (Am. J. Surg. 1998;175:76-83). In experimental AP, pentoxifylline ameliorates severity, but data are conflicting about whether prophylactic or delayed (Surgery 1996;120:515-21) antagonism of TNF-alpha signaling is more protective. Clinically relevant data suggest that prophylactic administration of pentoxifylline does not prevent postendoscopic retrograde cholangiopancreatography pancreatitis (Gastrointest. Endosc. 2007;66:513-8), but nonprophylactic administration of pentoxifylline improves short-term survival in alcoholic hepatitis without significantly reducing blood TNF-alpha levels (Gastroenterology 2000;119:1637-48). Hence, pentoxifylline appears to ameliorate AP and alcoholic hepatitis through TNF-alpha independent signaling, conceivably by targeting the microcirculation, as described for patients with claudication (Angiology 1994;45:339-45).
Future studies might test this hypothesis by determining whether pentoxifylline blunts increases in deleterious vascular factors (for example, angiopoietin-2) [Am. J. Gastroenterol. 2010;105:2287-92; J. Am. Coll. Surg. 2014;218:26-32; Am. J. Gastroenterol. 2011;106:1859-61]) and reduces vascular complications that correlate with the need for ICU care and more severe AP.
Dr. Matthew J. DiMagno is in the division of gastroenterology and hepatology, department of internal medicine, University of Michigan, Ann Arbor. He serves as chair of the American Gastroenterological Association Institute Council Section on Pancreatic Disorders. He declared no relevant financial conflicts of interest.
The study of acute pancreatitis (AP) is economically and scientifically essential because acute pancreatitis is the most common reason for hospitalization among patients with GI diseases, consumes considerable resources, and is treated primarily with supportive measures. The pilot study by Dr. Vege and his colleagues reports that pentoxifylline treatment is safe for patients with severe acute pancreatitis and is associated with a promising reduction in ICU utilization and duration in patients requiring a hospital stay >4 days.
|
|
| Dr. Matthew J. DiMagno |
This study is not only provocative but also raises the hypothesis-generating question of how pentoxifylline might exert a salutary effect without reducing blood tumor necrosis factor–alpha levels (or IL-6, IL-8, or C-reactive protein levels). The authors ascribe this discordance to the timing of administering pentoxifylline and to potential TNF-alpha independent effects. Biologically, pancreatic TNF-alpha levels increase within the first 30-60 minutes of onset of acute pancreatitis (Am. J. Surg. 1998;175:76-83). In experimental AP, pentoxifylline ameliorates severity, but data are conflicting about whether prophylactic or delayed (Surgery 1996;120:515-21) antagonism of TNF-alpha signaling is more protective. Clinically relevant data suggest that prophylactic administration of pentoxifylline does not prevent postendoscopic retrograde cholangiopancreatography pancreatitis (Gastrointest. Endosc. 2007;66:513-8), but nonprophylactic administration of pentoxifylline improves short-term survival in alcoholic hepatitis without significantly reducing blood TNF-alpha levels (Gastroenterology 2000;119:1637-48). Hence, pentoxifylline appears to ameliorate AP and alcoholic hepatitis through TNF-alpha independent signaling, conceivably by targeting the microcirculation, as described for patients with claudication (Angiology 1994;45:339-45).
Future studies might test this hypothesis by determining whether pentoxifylline blunts increases in deleterious vascular factors (for example, angiopoietin-2) [Am. J. Gastroenterol. 2010;105:2287-92; J. Am. Coll. Surg. 2014;218:26-32; Am. J. Gastroenterol. 2011;106:1859-61]) and reduces vascular complications that correlate with the need for ICU care and more severe AP.
Dr. Matthew J. DiMagno is in the division of gastroenterology and hepatology, department of internal medicine, University of Michigan, Ann Arbor. He serves as chair of the American Gastroenterological Association Institute Council Section on Pancreatic Disorders. He declared no relevant financial conflicts of interest.
Patients with acute pancreatitis who received pentoxifylline had fewer ICU admissions and shorter ICU and hospital stays than placebo-treated controls, according to a small, randomized double-blind trial reported in Gastroenterology.
“We showed that a single-institution drug trial for acute pancreatitis is feasible and that pentoxifylline is safe, cheap, and might have efficacy,” wrote Dr. Santhi Vege and his associates at the Mayo Clinic in Rochester, Minn. “This sets the stage for a larger trial of this drug in all patients with acute pancreatitis, to realize the goal of finding an effective drug that can be given within 24 hours of diagnosis in any setting.”
Tumor necrosis factor–alpha is a key culprit in severe acute pancreatitis, including pancreatic and peripancreatic necrosis, systemic inflammatory response syndrome, and persistent organ failure, the researchers noted. Pentoxifylline is a nonselective phosphodiesterase inhibitor that has been found safe and effective in other TNF-alpha–mediated diseases such as acute alcoholic hepatitis, but few studies in humans have evaluated the drug for acute pancreatitis, they said (Gastroenterology 2015 June 22 [doi:10.1053/j.gastro.2015.04.019]). For their study, the investigators randomized 28 patients with predicted severe acute pancreatitis to either placebo or 400 mg pentoxifylline given orally at enrollment and then three times a day for 72 hours. Both groups also received standard of care treatments such as antibiotics and fluid therapy, and had comparable baseline characteristics including age, sex, body mass index, Acute Physiology and Chronic Health Evaluation scores, systemic inflammatory response syndrome scores, and inflammatory marker levels, the researchers said.
Significantly fewer patients who received pentoxifylline needed to stay in the hospital for more than 4 days (14% vs. 57% for the placebo group; P = .046), and the maximum length of ICU stay was 0 days for the intervention group, compared with 13 days for the control group (P = .03), the investigators reported. Analyses of several other outcome measures also favored pentoxifylline over placebo, but did not reach statistical significance in the small study, including the need for ICU transfer (0% for pentoxifylline patients vs. 28% of the placebo group; P = .098) and the median length of hospitalization (for pentoxifylline: 3 days, range 1-5 days; for placebo: 5 days; range 1-30 days; P = .06).
The treatment and control groups did not significantly differ in terms of levels of inflammatory markers, including circulating TNF-alpha, said the investigators. Differences in levels of TNF-alpha, interleukin-6, IL-8, and C-reactive protein “may be significant if the sample size is larger,” they added.
The exact mechanism by which pentoxifylline affects acute pancreatitis is unclear, but the production of pancreatic TNF-alpha peaks about 24-36 hours into an episode of the disease, so patients might benefit from receiving pentoxifylline sooner than the 72-hour window dictated by the study protocol, said Dr. Vege and his associates. “Initiating drug therapy within a few hours is challenging, although a 24-hour cutoff time may be feasible in appropriate settings,” they wrote.
A scholarly opportunity award from the Mayo Clinic helped fund the work. The investigators reported having no relevant financial conflicts of interest.
FROM GASTROENTEROLOGY
Key clinical point: Pentoxifylline topped placebo for several outcome measures among patients with severe acute pancreatitis.
Major finding: Significantly fewer patients who received pentoxifylline needed to stay in the hospital for more than 4 days (14% vs. 57% for the placebo group; P = .046).
Data source: A single-center, randomized placebo-controlled trial of 28 patients with predicted severe acute pancreatitis.
Disclosures: A scholarly opportunity award from the Mayo Clinic supported the work. The investigators reported having no relevant financial conflicts of interest.

Case Studies in Toxicology: Managing Missed Methadone
A 53-year-old woman presented to the ED after experiencing a fall. Her medical history was significant for chronic obstructive pulmonary disease, hepatitis, and a remote history of intravenous drug use, for which she had been maintained on methadone for the past 20 years. She reported that she had suffered several “fainting episodes” over the past month, and the morning prior to arrival, had sustained what she thought was a mechanical fall outside of the methadone program she attended. She complained of tenderness on her head but denied any other injuries.

The methadone program had referred the patient to the ED for evaluation, noting to the ED staff that her daily methadone dose of 185 mg had not been dispensed prior to transfer. During evaluation, the patient requested that the emergency physician (EP) provide the methadone dose since the clinic would close prior to her discharge from the ED.
How can requests for methadone be managed in the ED?
Methadone is a long-acting oral opioid that is used for both opioid replacement therapy and pain management. When used to reduce craving in opioid-dependent patients, methadone is administered daily through federally sanctioned methadone maintenance treatment (MMT) programs. Patients who consistently adhere to the required guidelines are given “take home” doses. When used for pain management, methadone is typically administered several times daily and may be prescribed by any provider with an appropriate DEA registration.
When given for MMT, methadone saturates the µ-opioid receptors and hinders their binding and agonism by other opioids such as heroin or oxycodone. Patients in MMT programs are started on a low initial dose and slowly titrated upward as tolerance to the adverse effects (eg, sedation) develop.
How are symptomatic patients with methadone withdrawal treated?
Most methadone programs have limited hours and require that patients who miss a dose wait until the following day to return to the program. This is typically without medical consequence because the high dose dispensed by these programs maintains a therapeutic blood concentration for far longer than the expected delay. Although the half-life of methadone exhibits wide interindividual variability, it generally ranges from 12 hours to more than 40 hours.1 Regardless, patients may feel anxious about potential opioid withdrawal, and this often leads them to access the ED for a missed dose.
The neuropsychiatric symptoms attending withdrawal may precede the objective signs of opioid withdrawal. Patients with objective signs of opioid withdrawal (eg, piloerection, vomiting, diarrhea, dilated pupils) may be sufficiently treated with supportive care alone, using antiemetics, hydration, and sometimes clonidine.
Administration of substitute opioids is problematic due to the patient’s underlying tolerance necessitating careful dose titration. Therefore, direct replacement of methadone in the ED remains controversial, and some EDs have strict policies prohibiting the administration of methadone to patients who have missed an MMT dose. Such policies, which are intended to discourage patients from using the ED as a convenience, may be appropriate given the generally benign—though uncomfortable—course of opioid withdrawal due to abstinence.
Other EDs provide replacement methadone for asymptomatic, treat-and-release patients confirmed to be enrolled in an MMT program when the time to the next dose is likely to be 24 hours or greater from the missed dose. Typically, a dose of no more than 10 mg orally or 10 mg intramuscularly (IM) is recommended, and patients should be advised that they will be receiving only a low dose to sufficient to prevent withdrawal—one that may not have the equivalent effects of the outpatient dose.
Whenever possible, a patient’s MMT program should be contacted and informed of the ED visit. For patients who display objective signs of withdrawal and who cannot be confirmed or who do not participate in an MMT program, 10 mg of methadone IM will prevent uncertainty of drug absorption in the setting of nausea or vomiting. All patients receiving oral methadone should be observed for 1 hour, and those receiving IM methadone should be observed for at least 90 minutes to assess for unexpected sedation.2
Patients encountering circumstances that prevent opioid access (eg, incarceration) and who are not in withdrawal but have gone without opioids for more than 5 days may have a loss of tolerance to their usual doses—whether the medication was obtained through an MMT program or illicitly. Harm-reduction strategies aimed at educating patients on the potential vulnerability to their familiar dosing regimens are warranted to avert inadvertent overdoses in chronic opioid users who are likely to resume illicit opoiod use.
Does this patient need syncope evaluation?
Further complicating the decision regarding ED dispensing of methadone are the effects of the drug on myocardial repolarization. Methadone affects conduction across the hERG potassium rectifier current and can prolong the QTc interval on the surface electrocardiogram (ECG), predisposing a patient to torsade de pointes (TdP). Although there is controversy regarding the role of ECG screening during the enrollment of patients in methadone maintenance clinics, doses above 60 mg, underlying myocardial disease, female sex, and electrolyte disturbances may increase the risk of QT prolongation and TdP.3
Whether there is value in obtaining a screening ECG in a patient receiving an initial dose of methadone in the ED is unclear, and this practice is controversial even among methadone clinics. However, some of the excess death in patients taking methadone may be explained by the dysrhythmogenic potential of methadone.4 An ECG therefore may elucidate a correctable cause in methadone patients presenting with syncope.
Administering methadone to patients with documented QT prolongation must weigh the risk of methadone’s conduction effects against the substantial risks of illicit opioid self-administration. For some patients at-risk for TdP, it may be preferable to use buprenorphine if possible, since it does not carry the same cardiac effects as methadone.1,5 Such therapy requires referral to a physician licensed to prescribe this medication.
How should admitted patients be managed?
While administration of methadone for withdrawal or maintenance therapy in the ED is acceptable, outpatient prescribing of methadone for these reasons is not legal, and only federally regulated clinics may engage in this practice. Hospitalized patients who are enrolled in an MMT program should have their daily methadone dose confirmed and continued—as long as the patient has not lost tolerance. Patients not participating in an MMT program can receive up to 3 days of methadone in the hospital, even if the practitioner is not registered to provide methadone.6 For these patients, it is recommended that the physician order a low dose of methadone and also consult with an addiction specialist to determine whether the patient should continue on MMT maintenance or undergo detoxification.
It is important to note that methadone may be prescribed for pain, but its use in the ED for this purpose is strongly discouraged, especially in patients who have never received methadone previously. For admitted patients requiring such potent opioid analgesia, consultation with a pain service or, when indicated, a palliative care/hospice specialist is warranted as the dosing intervals are different in each setting, and the risk of respiratory depression is high.
Case Conclusion
As requested by the MMT clinic, the patient was administered methadone 185 mg orally in the ED, though a dose of 10 mg would have been sufficient to prevent withdrawal. Unfortunately, the EP did not appreciate the relationship of the markedly prolonged QTc and the methadone, which should have prompted a dose reduction.
Evaluation of the patient’s electrolyte levels, which included magnesium and potassium, were normal. An ECG was repeated 24 hours later and revealed a persistent, but improved, QT interval at 505 ms. The remainder of the syncope workup was negative. Because the patient had no additional symptoms or events during her stay, she was discharged. At discharge, the EP followed up with the MMT clinic to discuss lowering the patient’s daily methadone dose, as well as close cardiology follow-up.
Dr Rao is the chief of the division of medical toxicology at New York Presbyterian Hospital/Weill Cornell Medical Center, New York. Dr Nelson, editor of “Case Studies in Toxicology,” is a professor in the department of emergency medicine and director of the medical toxicology fellowship program at the New York University School of Medicine and the New York City Poison Control Center. He is also associate editor, toxicology, of the EMERGENCY MEDICINE editorial board.
- Chou R, Weimer MB, Dana T. Methadone overdose and cardiac arrhythmia potential: findings from a review of the evidence for an American Pain Society and College on Problems of Drug Dependence clinical practice guideline. J Pain. 2014;15(4):338-365.
- National Highway Traffic Safety Administration Web site. Methadone. http://www.nhtsa.gov/people/injury/research/job185drugs/methadone.htm. Accessed August 3, 2015.
- Martin JA, Campbell A, Killip T, et al; Substance Abuse and Mental Health Services Administration. QT interval screening in methadone maintenance treatment: report of a SAMHSA expert panel. J Addict Dis. 2011;30(4):283-306. Erratum in: J Addict Dis. 2012;31(1):91.
- Ray WA, Chung CP, Murray KT, Cooper WO, Hall K, Stein CM. Out-of-hospital mortality among patients receiving methadone for noncancer pain. JAMA Intern Med. 2015;175(3):420-427.
- Davis MP. Twelve reasons for considering buprenorphine as a frontline analgesic in the management of pain. J Support Oncol. 2012;10(6):209-219.
- US Government Printing Office. Federal Digital System. Administering or dispensing of narcotic drugs. Code of Federal Regulations. Title 21 CFR §1306.07. http://www.gpo.gov/fdsys/pkg/CFR-1998-title21-vol9/pdf/CFR-1998-title21-vol9-sec1306-07.pdf. Accessed August 4, 2015.
A 53-year-old woman presented to the ED after experiencing a fall. Her medical history was significant for chronic obstructive pulmonary disease, hepatitis, and a remote history of intravenous drug use, for which she had been maintained on methadone for the past 20 years. She reported that she had suffered several “fainting episodes” over the past month, and the morning prior to arrival, had sustained what she thought was a mechanical fall outside of the methadone program she attended. She complained of tenderness on her head but denied any other injuries.
The methadone program had referred the patient to the ED for evaluation, noting to the ED staff that her daily methadone dose of 185 mg had not been dispensed prior to transfer. During evaluation, the patient requested that the emergency physician (EP) provide the methadone dose since the clinic would close prior to her discharge from the ED.
How can requests for methadone be managed in the ED?
Methadone is a long-acting oral opioid that is used for both opioid replacement therapy and pain management. When used to reduce craving in opioid-dependent patients, methadone is administered daily through federally sanctioned methadone maintenance treatment (MMT) programs. Patients who consistently adhere to the required guidelines are given “take home” doses. When used for pain management, methadone is typically administered several times daily and may be prescribed by any provider with an appropriate DEA registration.
When given for MMT, methadone saturates the µ-opioid receptors and hinders their binding and agonism by other opioids such as heroin or oxycodone. Patients in MMT programs are started on a low initial dose and slowly titrated upward as tolerance to the adverse effects (eg, sedation) develop.
How are symptomatic patients with methadone withdrawal treated?
Most methadone programs have limited hours and require that patients who miss a dose wait until the following day to return to the program. This is typically without medical consequence because the high dose dispensed by these programs maintains a therapeutic blood concentration for far longer than the expected delay. Although the half-life of methadone exhibits wide interindividual variability, it generally ranges from 12 hours to more than 40 hours.1 Regardless, patients may feel anxious about potential opioid withdrawal, and this often leads them to access the ED for a missed dose.
The neuropsychiatric symptoms attending withdrawal may precede the objective signs of opioid withdrawal. Patients with objective signs of opioid withdrawal (eg, piloerection, vomiting, diarrhea, dilated pupils) may be sufficiently treated with supportive care alone, using antiemetics, hydration, and sometimes clonidine.
Administration of substitute opioids is problematic due to the patient’s underlying tolerance necessitating careful dose titration. Therefore, direct replacement of methadone in the ED remains controversial, and some EDs have strict policies prohibiting the administration of methadone to patients who have missed an MMT dose. Such policies, which are intended to discourage patients from using the ED as a convenience, may be appropriate given the generally benign—though uncomfortable—course of opioid withdrawal due to abstinence.
Other EDs provide replacement methadone for asymptomatic, treat-and-release patients confirmed to be enrolled in an MMT program when the time to the next dose is likely to be 24 hours or greater from the missed dose. Typically, a dose of no more than 10 mg orally or 10 mg intramuscularly (IM) is recommended, and patients should be advised that they will be receiving only a low dose to sufficient to prevent withdrawal—one that may not have the equivalent effects of the outpatient dose.
Whenever possible, a patient’s MMT program should be contacted and informed of the ED visit. For patients who display objective signs of withdrawal and who cannot be confirmed or who do not participate in an MMT program, 10 mg of methadone IM will prevent uncertainty of drug absorption in the setting of nausea or vomiting. All patients receiving oral methadone should be observed for 1 hour, and those receiving IM methadone should be observed for at least 90 minutes to assess for unexpected sedation.2
Patients encountering circumstances that prevent opioid access (eg, incarceration) and who are not in withdrawal but have gone without opioids for more than 5 days may have a loss of tolerance to their usual doses—whether the medication was obtained through an MMT program or illicitly. Harm-reduction strategies aimed at educating patients on the potential vulnerability to their familiar dosing regimens are warranted to avert inadvertent overdoses in chronic opioid users who are likely to resume illicit opoiod use.
Does this patient need syncope evaluation?
Further complicating the decision regarding ED dispensing of methadone are the effects of the drug on myocardial repolarization. Methadone affects conduction across the hERG potassium rectifier current and can prolong the QTc interval on the surface electrocardiogram (ECG), predisposing a patient to torsade de pointes (TdP). Although there is controversy regarding the role of ECG screening during the enrollment of patients in methadone maintenance clinics, doses above 60 mg, underlying myocardial disease, female sex, and electrolyte disturbances may increase the risk of QT prolongation and TdP.3
Whether there is value in obtaining a screening ECG in a patient receiving an initial dose of methadone in the ED is unclear, and this practice is controversial even among methadone clinics. However, some of the excess death in patients taking methadone may be explained by the dysrhythmogenic potential of methadone.4 An ECG therefore may elucidate a correctable cause in methadone patients presenting with syncope.
Administering methadone to patients with documented QT prolongation must weigh the risk of methadone’s conduction effects against the substantial risks of illicit opioid self-administration. For some patients at-risk for TdP, it may be preferable to use buprenorphine if possible, since it does not carry the same cardiac effects as methadone.1,5 Such therapy requires referral to a physician licensed to prescribe this medication.
How should admitted patients be managed?
While administration of methadone for withdrawal or maintenance therapy in the ED is acceptable, outpatient prescribing of methadone for these reasons is not legal, and only federally regulated clinics may engage in this practice. Hospitalized patients who are enrolled in an MMT program should have their daily methadone dose confirmed and continued—as long as the patient has not lost tolerance. Patients not participating in an MMT program can receive up to 3 days of methadone in the hospital, even if the practitioner is not registered to provide methadone.6 For these patients, it is recommended that the physician order a low dose of methadone and also consult with an addiction specialist to determine whether the patient should continue on MMT maintenance or undergo detoxification.
It is important to note that methadone may be prescribed for pain, but its use in the ED for this purpose is strongly discouraged, especially in patients who have never received methadone previously. For admitted patients requiring such potent opioid analgesia, consultation with a pain service or, when indicated, a palliative care/hospice specialist is warranted as the dosing intervals are different in each setting, and the risk of respiratory depression is high.
Case Conclusion
As requested by the MMT clinic, the patient was administered methadone 185 mg orally in the ED, though a dose of 10 mg would have been sufficient to prevent withdrawal. Unfortunately, the EP did not appreciate the relationship of the markedly prolonged QTc and the methadone, which should have prompted a dose reduction.
Evaluation of the patient’s electrolyte levels, which included magnesium and potassium, were normal. An ECG was repeated 24 hours later and revealed a persistent, but improved, QT interval at 505 ms. The remainder of the syncope workup was negative. Because the patient had no additional symptoms or events during her stay, she was discharged. At discharge, the EP followed up with the MMT clinic to discuss lowering the patient’s daily methadone dose, as well as close cardiology follow-up.
Dr Rao is the chief of the division of medical toxicology at New York Presbyterian Hospital/Weill Cornell Medical Center, New York. Dr Nelson, editor of “Case Studies in Toxicology,” is a professor in the department of emergency medicine and director of the medical toxicology fellowship program at the New York University School of Medicine and the New York City Poison Control Center. He is also associate editor, toxicology, of the EMERGENCY MEDICINE editorial board.
- Chou R, Weimer MB, Dana T. Methadone overdose and cardiac arrhythmia potential: findings from a review of the evidence for an American Pain Society and College on Problems of Drug Dependence clinical practice guideline. J Pain. 2014;15(4):338-365.
- National Highway Traffic Safety Administration Web site. Methadone. http://www.nhtsa.gov/people/injury/research/job185drugs/methadone.htm. Accessed August 3, 2015.
- Martin JA, Campbell A, Killip T, et al; Substance Abuse and Mental Health Services Administration. QT interval screening in methadone maintenance treatment: report of a SAMHSA expert panel. J Addict Dis. 2011;30(4):283-306. Erratum in: J Addict Dis. 2012;31(1):91.
- Ray WA, Chung CP, Murray KT, Cooper WO, Hall K, Stein CM. Out-of-hospital mortality among patients receiving methadone for noncancer pain. JAMA Intern Med. 2015;175(3):420-427.
- Davis MP. Twelve reasons for considering buprenorphine as a frontline analgesic in the management of pain. J Support Oncol. 2012;10(6):209-219.
- US Government Printing Office. Federal Digital System. Administering or dispensing of narcotic drugs. Code of Federal Regulations. Title 21 CFR §1306.07. http://www.gpo.gov/fdsys/pkg/CFR-1998-title21-vol9/pdf/CFR-1998-title21-vol9-sec1306-07.pdf. Accessed August 4, 2015.

Universal precautions to reduce stimulant misuse in treating adult ADHD
Children are not the only people affected by attention-deficit/hyperactivity disorder (ADHD). Characterized by high levels of inattention, overactivity, and impulsivity, ADHD affects 5% of school-aged children, but also 4% of adults.1–3 Adults with untreated ADHD are likely to develop serious psychosocial problems that manifest as unemployment, arrests, divorce, underachievement, and psychiatric comorbidities.4,5
However, many clinicians are reluctant to manage adults with ADHD, partly because of concerns about misuse of the stimulant drugs they must prescribe to treat it.
Here, we outline an approach whereby clinicians can diagnose and treat adult ADHD while taking “universal precautions” to discourage misuse of the medications involved.
RECOGNIZING ADHD IN ADULTS
ADHD is characterized by developmentally inappropriate levels of inattention, impulsiveness, and hyperactivity that arise in childhood and result in impairments that often persist.
The presentation of ADHD in adults may be influenced by the longevity of their ADHD, associated sequelae (eg, low self-esteem and interpersonal, educational, and occupational difficulties), and comorbid disorders.6 There are neither reliable biomarkers nor neuropsychological tests for diagnosis, and persons with ADHD typically have a complex presentation with at least one comorbidity.6,7
In patients diagnosed in childhood, difficulties with organization as well as initiating, maintaining, and completing tasks become more prominent in adulthood and hyperactivity tends to subside. Adult impulsivity may present as edginess, shopping sprees, quitting jobs, and risky behaviors.6
Overall, the clinical manifestations of ADHD in adolescents and adults include inattention, difficulties with task completion, disorganization, and executive dysfunction—all skills critical to managing the various roles of adult life.
OBSTACLES TO EFFECTIVE TREATMENT
In the past, ADHD treatment was routinely discontinued during adolescence, as it was unclear whether adults still had significant symptoms or benefited from treatment.8,9 Now, available ADHD guidelines suggest that children and adults who respond to pharmacotherapy should continue it for as long as it remains effective. In this context, there is increasing recognition of adult ADHD as a valid and treatable disorder.10
One of the challenges clinicians face is the reliability of adult recall of childhood ADHD. A controlled, prospective 16-year follow-up study found that of all adults retrospectively given a diagnosis of childhood ADHD, only 27% actually had the disorder.11 This study suggests that retrospective diagnoses of childhood ADHD made solely on the basis of self-reports are unlikely to be valid.
Another obstacle is that traditional medical education has seldom included training in adult ADHD.8,12 In a UK study, clinicians felt that they lacked training and knowledge to assess and manage adult ADHD patients.9
Even if adult ADHD is recognized, diagnosis is just the first step of care.13 These patients require ongoing management and follow-up assessments.
Although practice patterns vary, efforts to encourage doctors to provide adult ADHD care may be hindered by the fact that the gold standard of treatment is stimulant medication.4,10 Medications approved by the US Food and Drug Administration for adult ADHD include the stimulants lisdexamfetamine, osmotic-release methylphenidate, mixed amphetamine salts extended release, dexmethylphenidate extended release, and the nonstimulant atomoxetine.6 While stimulants are generally more efficacious for ADHD symptoms than nonstimulants, they are associated with misuse and diversion.14
UNIVERSAL PRECAUTIONS: A SIMPLIFIED APPROACH
The universal-precautions approach to prescribing stimulants aims to allay physician concerns and promote appropriate medication use to allow for proper management of this disorder.15 These precautions, to be applied to all adult ADHD patients for whom stimulants are being considered, include careful diagnosis and consideration of comorbidities, baseline risk stratification, informed consent processes, treatment agreements, periodic reassessments of treatment response, and meticulous documentation.
DIAGNOSIS
A frequently used screening assessment for adult ADHD is the ADHD Rating Scale (ADHD RS), which consists of two subscales for assessing hyperactivity/impulsivity and inattentiveness.16 ADHD can be classified into one of three subtypes based on symptoms: inattentive, hyperactive, or combined type. Symptoms must persist for at least 6 months for a diagnosis to be made. Other ADHD scales include the Conners Adult ADHD Rating Scales and the Brown Attention-Deficit Disorder Scales.4
High scores on screening scales must be interpreted within the clinical context. Clinicians need to ask about ADHD symptoms, establish their presence in various settings, and determine if these symptoms interfere with functioning. A diagnosis of adult ADHD also requires evidence of symptoms beginning in childhood.17 According to the Diagnostic and Statistical Manual of Mental Disorders, Fifth Edition, inattentive or hyperactive-impulsive symptoms must be present before age 12 in two or more settings and interfere with function and development.
Although self-reporting screening tools are helpful, these tests are not reliable for diagnostic purposes, and collateral information is also required.
Neuropsychological testing may detect impairments in persons with ADHD. The most consistently employed neuropsychological tests to evaluate ADHD include the Conners Continuous Performance Test, Stroop Color and Word Test, Trail-making Test, verbal fluency tests, Controlled Oral Word Association Test, and the Weschler Adult Intelligence Scale.6
COMORBIDITY
Epidemiologic studies suggest that adults with ADHD develop many psychiatric problems including anxiety, depression, and substance use disorders.7,16 Table 1 illustrates common comorbidities and their associated prevalence in the ADHD patient.7
Comorbid psychiatric disorders may affect the presentation of adult ADHD. For instance, adults with comorbid depression and ADHD are more likely to present with heightened irritability and difficulties concentrating on tasks than those with either condition alone.18 Similarly, antisocial personality disorder is more common in adults with ADHD.19 Such patients exhibit stable antisocial behavior (lying, stealing, and aggression) as well as medication misuse.5,14,19
While these comorbid disorders may obscure the ADHD diagnosis, their recognition is essential to effectively manage adult ADHD. In sum, a careful evaluation of the adult, including elucidating both ADHD and comorbid symptoms, functionality in several domains, and the degree of impairment, should precede initiating pharmacotherapy for adult ADHD.
BASELINE RISK STRATIFICATION: RISK FACTORS FOR STIMULANT MISUSE
After diagnosing ADHD, the prescriber must assess the risk for misuse of stimulant medications.20
One study revealed that nonmedical use of stimulant medications occurred in only 2% of the 4,300 people surveyed.21 Among the misusers, 66% had obtained medication from family or friends. Another 34% had stolen medication, and 20% had obtained prescriptions from a physician by falsely reporting symptoms. The study also assessed motivation for misuse. In this sample, 40% of misuse was to enhance performance, 34% was for recreation, and 23% was to stay awake.21
Other studies show that misuse of stimulant medications is common among youth in the United States, reporting that 18% of college students use some formulation of prescription stimulants.22
Still more research suggests that childhood conduct disorder or illicit drug use results in a higher risk of stimulant medication misuse.20 Additional risk factors for misuse include male sex, white ethnicity, upper-class background, Jewish or no religious affiliation, affiliation with a sorority or fraternity, off-campus housing, and a low grade-point average.23
Table 2 illustrates clinical interventions providers can use, once they have risk-stratified their patients, to monitor for stimulant misuse.
HOW SHOULD THESE RISK FACTORS AFFECT TREATMENT?
Although no formal scoring system exists to help clinicians risk-stratify these patients, the presence of multiple risk factors suggests the need for vigilance.14 Physicians should prescribe agents with less potential for abuse and monitor these patients more intensely.
Short-acting stimulant medications are the most likely to be abused, as phasic dopamine increase is more reinforcing than therapeutic dopamine release.24 Longer-acting stimulant medications are less likely to be abused, and they provide better symptom relief, as tonic dopamine release maintains a steady state and increases the therapeutic efficacy of these medications.25 For example, methylphenidate extended-release tablets have an osmotic oral controlled-release system and are less likely to be crushed for recreational inhalation.6,14
Lisdexamfetamine is a prodrug therapeutically inert until converted to d-amphetamine when lysine is cleaved from the molecule. This medication may be a good option for patients at high risk of misuse because it is tamper-resistant. However, it still may be subject to misuse for performance enhancement.26,27
The nonstimulant atomoxetine is also approved for ADHD, has no abuse potential, and may be particularly useful when anxiety, mood, and substance use disorders co-occur with ADHD.6 Rarely, atomoxetine can damage the liver, and liver function tests should be monitored if right upper quadrant pain develops.4,10
Other nonapproved agents such as bupropion and desipramine also have been used empirically and off-label for ADHD.4,10
Overall, treatment should be selected according to the risk of misuse of stimulant medication and the patient’s comorbidities.
INFORMED CONSENT
Informed consent may help patients appreciate the risks and benefits of the treatment options and develop realistic expectations about treatment.26 Patients are instructed to take their stimulant medications as prescribed and are informed of the risks of combining stimulants with other substances, particularly those that may interact with stimulants (eg, cocaine) and raise the risk of seizures and cardiovascular complications.
Stimulant medications lead to elevations in blood pressure and heart rate, although large-scale studies have shown no increase in the rate of serious cardiovascular events when these drugs are used appropriately.6 Less serious side effects associated with stimulant medications include insomnia, weight loss, decreased appetite, dry mouth, headache, and rarely, depression and anxiety.6
Patients need to be warned about diversion and abuse liability of stimulant medications, as well as alternative treatments.
The nonstimulant atomoxetine has no reinforcing properties but also raises the blood pressure and heart rate.6 As with stimulants, these elevations are generally minimal, time-limited, and of minor clinical significance.4,10 Frequent reasons to prescribe atomoxetine include poor tolerability of stimulants and a history of substance abuse. In addition, women with ADHD and high levels of emotional dysregulation or social anxiety appear to be particularly responsive to atomoxetine.6
Another consideration is cognitive behavioral therapy, which can augment the effects of pharmacotherapy.4 Cognitive behavioral therapy focuses on time management, prioritization, organization, problem-solving, motivation, and emotional regulation.4
Finally, patients also need to understand the possible consequences of nontreatment.5 Adults with untreated ADHD have high rates of academic and occupational difficulties, anti-social behaviors, and other forms of psychosocial adversity.4,5
Overall, this process should involve discussing risks and benefits of treatment options with the patient and promoting joint decision-making.
TREATMENT AGREEMENTS
Stimulant medications are classified by the US Drug Enforcement Administration as schedule II substances due to their abuse potential.20
It is important to inform patients of the addictive nature of the medication and to instruct them on how to store stimulants safely.27 Patients need to know that giving away or selling these medications is illegal.27
Treatment agreements establish rules for prescribing and are signed by the patient before initiating therapy.28,29 Patients are expected to attend all of their appointments, receive their prescriptions from one doctor, and obtain their medication from one pharmacy. These agreements may also require patients to submit to monitoring with random urine drug screens.29 Overall, they underscore the need for patients to follow a treatment plan in order to continue therapy with controlled substances.29
Manning27 recommends using agreements for high-risk college students prescribed stimulant medications. Red flags for misuse include signs of active substance use (eg, intoxication, a pattern of “lost” prescriptions, and doctor-shopping).27
The effectiveness in reducing risk of misuse in the adult ADHD population has not yet been investigated. Nonetheless, a method of communicating the seriousness of stimulant misuse to adult patients is essential to ADHD care.
STAYING ON TRACK
In the clinical setting, treatment response is measured not just by symptom reduction, but also by functional improvement. Thus, clinicians and patients must set functional goals whenever possible.27 Successful progress toward these goals justifies continuation of therapy, whereas lack of improvement signals the need to reconsider stimulant therapy.27
MONITORING AND DOCUMENTATION
Adults with ADHD present with varying levels of functional impairment and comorbidities, which may require different levels of monitoring.30 Not all patients with ADHD respond optimally to stimulant medications or tolerate them well.31,32 Hence, monitoring parameters for therapeutic change and adverse outcomes are important in that they guide the alteration or even discontinuation of pharmacotherapy.4,6,14
Documenting the decision-making process to continue stimulant medications under certain circumstances is also essential. Documentation should include discussion of goals and expectations, risks and benefits, and alternatives to stimulant use.
In adults, risk of stimulant medication misuse adds a new layer of complexity to monitoring.13,14 Adults may get multiple prescriptions from multiple providers, seek early refills, fill prescriptions at different pharmacies, or alter formulations. Many states track stimulant prescription use, and prescribers can use this information to determine if patients are refilling their prescriptions appropriately or obtaining stimulants from more than one provider.
Although these monitoring strategies are useful,6 it is prudent to structure the level of monitoring according to the patient’s risk of adverse events or medication misuse.14,27 Gourlay and Heit15 proposed the following “four-A” mnemonic for four domains to be explored at each visit in patients receiving pain medicine. This mnemonic can be applied to adult ADHD patients to more accurately monitor the patient throughout treatment.
THE ‘FOUR-A’ MNEMONIC
ADHD symptoms
Several ADHD scales can be used to track symptom changes over time.33 However, these self-report scales may be subject to positive illusory bias, a phenomenon observed in individuals with ADHD in which they tend to overrate their functioning,34 which may limit the accuracy of self-report scales.35
Activities of daily living
Since patients with ADHD tend to overrate their functioning in various aspects of living, collateral information should be gathered to corroborate patient self-reports whenever possible.
Adverse events
Blood pressure, heart rate, and weight should be assessed at baseline and monitored during stimulant treatment. Other symptoms to monitor include gastrointestinal distress, headache, aggression, depression, appetite, and sleeping habits.4,6 More intensive monitoring (eg, electrocardiography) may be indicated for those with hypertension and cardiovascular risk factors.
Aberrant behavior
Monitoring for misuse and diversion of stimulant medications is essential, as ADHD itself is a risk factor for addiction.20,21 Pill counts, prescription monitoring programs, urine drug screens, and collateral informants have all been proposed but not studied in monitoring for the misuse of stimulant medications.27 Before prescribing, it is prudent to check the prescription monitoring program, get a urine drug screen, and discuss any positive findings with the patient.36,37
Treatment agreements ensure that patients are aware of the consequences of misuse and allow the clinician to reference prior discussion when terminating treatment with stimulants.
LIVES CAN BE ENHANCED
ADHD is a common disorder that arises in childhood and can persist throughout life. Adults with untreated ADHD are at risk of severe impairments in various domains of functioning. Stimulant medications are an effective treatment but may be diverted into the street market. Using the universal-precautions model may reduce the risks of both nontreatment of ADHD and misuse of stimulants.
Accordingly, clinicians need to confirm the ADHD diagnosis, assess comorbidities, estimate risk of misuse, and provide informed consent prior to prescribing. Subsequent monitoring should involve the use of treatment agreements and evaluating treatment response, paying particular attention to ADHD symptom control but also to level of function, adverse effects, and aberrant behavior.
With these principles in mind, clinicians can address the risks of misuse and potentially enhance the lives of people who may have been suffering substantially due to lack of appropriate care.
- Polanczyk G, de Lima MS, Horta BL, Biederman J, Rohde LA. The worldwide prevalence of ADHD: a systematic review and metaregression analysis. Am J Psychiatry 2007; 164:942–948.
- Polanczyk GV, Wilcutt EG, Salum GA, Kieling C, Rohde LA. ADHD prevalence estimates across three decades: an updated systematic review and meta-regression analysis. Int J Epidemiol 2014; 43:434–442.
- Wilens TE. ADHD: Prevalence, diagnosis, and issues of comorbidity. CNS Spectr 2007; 12(suppl 6):1–5.
- Kooij SJ, Bejerot S, Blackwell A, et al. European consensus statement on diagnosis and treatment of adult ADHD: the European Network Adult ADHD. BMC Psychiatry 2010; 10:67.
- Shaw M, Hodgkins P, Caci H, et al. A systematic review and analysis of long-term outcomes in attention deficit hyperactivity disorder: effects of treatment and non-treatment. BMC Med 2012;10:99.
- Modesto-Lowe V, Meyer A, Soovajian V. A clinician’s guide to adult attention-deficit hyperactivity disorder. Conn Med 2012; 76:517–523.
- Kessler RC, Adler L, Barkley R, et al. The prevalence and correlates of adult ADHD in the United States: results from the National Comorbidity Survey Replication. Am J Psychiatry 2006; 163:716–723.
- Goodman DW, Surman CB, Scherer PB, Salinas GD, Brown JJ. Assessment of physician practices in adult attention-deficit/hyperactivity disorder. Prim Care Companion CNS Disord 2012; 14(4).
- Hall CL, Newell K, Taylor J, Sayal K, Swift KD, Hollis C. ‘Mind the gap’—mapping services for young people with ADHD transitioning from child to adult mental health services. BMC Psychiatry 2013; 13:186.
- National Institute for Health and Care Excellence. Attention deficit hyperactivity disorder: diagnosis and management of ADHD in children, young people and adults. The British Psychological Society and The Royal College of Psychiatrists: United Kingdom; 2009.
- Mannuzza S, Klein RG, Klein DF, Bessler A, Shrout P. Accuracy of adult recall of childhood attention deficit hyperactivity disorder. Am J Psychiatry 2002; 159:1882–1888.
- Wetzel MW. Medical student participation in an adult ADHD outpatient clinic: an ideal setting for education in outpatient psychiatry. Acad Psychiatry 2009; 33:80–81.
- Culpepper L, Mattingly G. Challenges in identifying and managing attention-deficit/hyperactivity disorder in adults in the primary care setting: a review of the literature. Prim Care Companion J Clin Psychiatry 2010; 12(6).
- Rabiner DL. Stimulant prescription cautions: addressing misuse, diversion and malingering. Curr Psychiatry Rep 2013; 15:375.
- Gourlay D, Heit H. Universal precautions: a matter of mutual trust and responsibility. Pain Med 2006; 7:210–211.
- Kessler RC, Adler L, Ames M, et al. The World Health Organization Adult ADHD Self-Report Scale (ASRS): a short screening scale for use in the general population. Psychol Med 2005; 35:245–256.
- American Psychiatric Association. Diagnostic and Statistical Manual of Mental Disorders, 5th ed. Arlington, VA: American Psychiatric Association; 2013.
- CADDRA Guidelines Steering Committee. Canadian ADHD practice guidelines: CADDRA 2008. http://www.naceonline.com/AdultADHDtoolkit/professionalresources/caddraguidelines.pdf. Accessed July 10, 2015.
- Mannuzza S, Klein RG, Bessler A, Malloy P, LaPadula M. Adult psychiatric status of hyperactive boys grown up. Am J Psychiatry 1998; 155:493–498.
- Kaye S, Darke S. The diversion and misuse of pharmaceutical stimulants: what do we know and why should we care? Addiction 2012; 107:467–477.
- Novak SP, Kroutil LA, Williams RL, Van Brunt DL. The nonmedical use of prescription ADHD medications: results from a national Internet panel. Subst Abuse Treat Prev Policy 2007; 2:32.
- Bavarian N, Flay BR, Ketcham P, et al. Using structural equation modeling to understand prescription stimulant misuse: a test of the Theory of Triadic Influence. Drug Alcohol Depend 2014; 138:193–201.
- McCabe SE, Teter CJ, Boyd CJ. Medical use, illicit use and diversion of prescription stimulant medication. J Psychoactive Drugs 2006; 38:43–56.
- Volkow ND. Stimulant medications: how to minimize their reinforcing effects? Am J Psychiatry 2006; 163:359–361.
- Kolar D, Keller A, Golfinopoulos M, Cumyn L, Syer C, Hechtman L. Treatment of adults with attention-deficit/hyperactivity disorder. Neuropsychiatr Dis Treat 2008; 4:107–121.
- Schachter D, Tharmalingam S, Kleinman I. Informed consent and stimulant medication: adolescents’ and parents’ ability to understand information about benefits and risks of stimulant medication for the treatment of attention-deficit/hyperactivity disorder. J Child Adolesc Psychopharmacol 2011; 21:139–148.
- Manning JS. Strategies for managing the risks associated with ADHD medications. J Clin Psychiatry 2013; 74:e19.
- Deep K. Use of narcotics contracts. Virtual Mentor 2013; 15:416–420.
- Cheatle MD, Savage SR. Informed consent in opioid therapy: a potential obligation and opportunity. J Pain Symptom Manage 2012; 44:105–116.
- Dias TG, Kieling C, Graeff-Martins AS, Moriyama TS, Rohde LA, Polanczyk GV. Developments and challenges in the diagnosis and treatment of ADHD. Rev Bras Psiquiatr 2013; 35(suppl 1):S40–S50.
- Mattingly GW, Weisler RH, Young J, et al. Clinical response and symptomatic remission in short- and long-term trials of lisdexamfetamine dimesylate in adults with attention-deficit/hyperactivity disorder. BMC Psychiatry 2013; 13:39.
- Contini V, Victor MM, Bertuzzi GP, et al. No significant association between genetic variants in 7 candidate genes and response to methylphenidate treatment in adult patients with ADHD. J Clin Psychopharmacol 2012; 32:820–823.
- Rösler M, Retz W, Thome J, Schneider M, Stieglitz RD, Falkai P. Psychopathological rating scales for diagnostic use in adults with attention-deficit/hyperactivity disorder (ADHD). Eur Arch Psychiatry Clin Neurosci 2006; 256(suppl 1):i3–i11.
- Prevatt F, Proctor B, Best L, Baker L, Van Walker J, Taylor NW. The positive illusory bias: does it explain self-evaluations in college students with ADHD? J Atten Disord 2012; 16:235–243.
- Jiang Y, Johnston C. The relationship between ADHD symptoms and competence as reported by both self and others. J Atten Disord 2012; 16:418–426.
- Darredeau C, Barrett SP, Jardin B, Pihl RO. Patterns and predictors of medication compliance, diversion, and misuse in adult prescribed methylphenidate users. Hum Psychopharmacol 2007; 22:529–536.
- Worley J. Prescription drug monitoring programs, a response to doctor shopping: purpose, effectiveness, and directions for future research. Issues Ment Health Nurs 2012; 33:319–328.
Children are not the only people affected by attention-deficit/hyperactivity disorder (ADHD). Characterized by high levels of inattention, overactivity, and impulsivity, ADHD affects 5% of school-aged children, but also 4% of adults.1–3 Adults with untreated ADHD are likely to develop serious psychosocial problems that manifest as unemployment, arrests, divorce, underachievement, and psychiatric comorbidities.4,5
However, many clinicians are reluctant to manage adults with ADHD, partly because of concerns about misuse of the stimulant drugs they must prescribe to treat it.
Here, we outline an approach whereby clinicians can diagnose and treat adult ADHD while taking “universal precautions” to discourage misuse of the medications involved.
RECOGNIZING ADHD IN ADULTS
ADHD is characterized by developmentally inappropriate levels of inattention, impulsiveness, and hyperactivity that arise in childhood and result in impairments that often persist.
The presentation of ADHD in adults may be influenced by the longevity of their ADHD, associated sequelae (eg, low self-esteem and interpersonal, educational, and occupational difficulties), and comorbid disorders.6 There are neither reliable biomarkers nor neuropsychological tests for diagnosis, and persons with ADHD typically have a complex presentation with at least one comorbidity.6,7
In patients diagnosed in childhood, difficulties with organization as well as initiating, maintaining, and completing tasks become more prominent in adulthood and hyperactivity tends to subside. Adult impulsivity may present as edginess, shopping sprees, quitting jobs, and risky behaviors.6
Overall, the clinical manifestations of ADHD in adolescents and adults include inattention, difficulties with task completion, disorganization, and executive dysfunction—all skills critical to managing the various roles of adult life.
OBSTACLES TO EFFECTIVE TREATMENT
In the past, ADHD treatment was routinely discontinued during adolescence, as it was unclear whether adults still had significant symptoms or benefited from treatment.8,9 Now, available ADHD guidelines suggest that children and adults who respond to pharmacotherapy should continue it for as long as it remains effective. In this context, there is increasing recognition of adult ADHD as a valid and treatable disorder.10
One of the challenges clinicians face is the reliability of adult recall of childhood ADHD. A controlled, prospective 16-year follow-up study found that of all adults retrospectively given a diagnosis of childhood ADHD, only 27% actually had the disorder.11 This study suggests that retrospective diagnoses of childhood ADHD made solely on the basis of self-reports are unlikely to be valid.
Another obstacle is that traditional medical education has seldom included training in adult ADHD.8,12 In a UK study, clinicians felt that they lacked training and knowledge to assess and manage adult ADHD patients.9
Even if adult ADHD is recognized, diagnosis is just the first step of care.13 These patients require ongoing management and follow-up assessments.
Although practice patterns vary, efforts to encourage doctors to provide adult ADHD care may be hindered by the fact that the gold standard of treatment is stimulant medication.4,10 Medications approved by the US Food and Drug Administration for adult ADHD include the stimulants lisdexamfetamine, osmotic-release methylphenidate, mixed amphetamine salts extended release, dexmethylphenidate extended release, and the nonstimulant atomoxetine.6 While stimulants are generally more efficacious for ADHD symptoms than nonstimulants, they are associated with misuse and diversion.14
UNIVERSAL PRECAUTIONS: A SIMPLIFIED APPROACH
The universal-precautions approach to prescribing stimulants aims to allay physician concerns and promote appropriate medication use to allow for proper management of this disorder.15 These precautions, to be applied to all adult ADHD patients for whom stimulants are being considered, include careful diagnosis and consideration of comorbidities, baseline risk stratification, informed consent processes, treatment agreements, periodic reassessments of treatment response, and meticulous documentation.
DIAGNOSIS
A frequently used screening assessment for adult ADHD is the ADHD Rating Scale (ADHD RS), which consists of two subscales for assessing hyperactivity/impulsivity and inattentiveness.16 ADHD can be classified into one of three subtypes based on symptoms: inattentive, hyperactive, or combined type. Symptoms must persist for at least 6 months for a diagnosis to be made. Other ADHD scales include the Conners Adult ADHD Rating Scales and the Brown Attention-Deficit Disorder Scales.4
High scores on screening scales must be interpreted within the clinical context. Clinicians need to ask about ADHD symptoms, establish their presence in various settings, and determine if these symptoms interfere with functioning. A diagnosis of adult ADHD also requires evidence of symptoms beginning in childhood.17 According to the Diagnostic and Statistical Manual of Mental Disorders, Fifth Edition, inattentive or hyperactive-impulsive symptoms must be present before age 12 in two or more settings and interfere with function and development.
Although self-reporting screening tools are helpful, these tests are not reliable for diagnostic purposes, and collateral information is also required.
Neuropsychological testing may detect impairments in persons with ADHD. The most consistently employed neuropsychological tests to evaluate ADHD include the Conners Continuous Performance Test, Stroop Color and Word Test, Trail-making Test, verbal fluency tests, Controlled Oral Word Association Test, and the Weschler Adult Intelligence Scale.6
COMORBIDITY
Epidemiologic studies suggest that adults with ADHD develop many psychiatric problems including anxiety, depression, and substance use disorders.7,16 Table 1 illustrates common comorbidities and their associated prevalence in the ADHD patient.7
Comorbid psychiatric disorders may affect the presentation of adult ADHD. For instance, adults with comorbid depression and ADHD are more likely to present with heightened irritability and difficulties concentrating on tasks than those with either condition alone.18 Similarly, antisocial personality disorder is more common in adults with ADHD.19 Such patients exhibit stable antisocial behavior (lying, stealing, and aggression) as well as medication misuse.5,14,19
While these comorbid disorders may obscure the ADHD diagnosis, their recognition is essential to effectively manage adult ADHD. In sum, a careful evaluation of the adult, including elucidating both ADHD and comorbid symptoms, functionality in several domains, and the degree of impairment, should precede initiating pharmacotherapy for adult ADHD.
BASELINE RISK STRATIFICATION: RISK FACTORS FOR STIMULANT MISUSE
After diagnosing ADHD, the prescriber must assess the risk for misuse of stimulant medications.20
One study revealed that nonmedical use of stimulant medications occurred in only 2% of the 4,300 people surveyed.21 Among the misusers, 66% had obtained medication from family or friends. Another 34% had stolen medication, and 20% had obtained prescriptions from a physician by falsely reporting symptoms. The study also assessed motivation for misuse. In this sample, 40% of misuse was to enhance performance, 34% was for recreation, and 23% was to stay awake.21
Other studies show that misuse of stimulant medications is common among youth in the United States, reporting that 18% of college students use some formulation of prescription stimulants.22
Still more research suggests that childhood conduct disorder or illicit drug use results in a higher risk of stimulant medication misuse.20 Additional risk factors for misuse include male sex, white ethnicity, upper-class background, Jewish or no religious affiliation, affiliation with a sorority or fraternity, off-campus housing, and a low grade-point average.23
Table 2 illustrates clinical interventions providers can use, once they have risk-stratified their patients, to monitor for stimulant misuse.
HOW SHOULD THESE RISK FACTORS AFFECT TREATMENT?
Although no formal scoring system exists to help clinicians risk-stratify these patients, the presence of multiple risk factors suggests the need for vigilance.14 Physicians should prescribe agents with less potential for abuse and monitor these patients more intensely.
Short-acting stimulant medications are the most likely to be abused, as phasic dopamine increase is more reinforcing than therapeutic dopamine release.24 Longer-acting stimulant medications are less likely to be abused, and they provide better symptom relief, as tonic dopamine release maintains a steady state and increases the therapeutic efficacy of these medications.25 For example, methylphenidate extended-release tablets have an osmotic oral controlled-release system and are less likely to be crushed for recreational inhalation.6,14
Lisdexamfetamine is a prodrug therapeutically inert until converted to d-amphetamine when lysine is cleaved from the molecule. This medication may be a good option for patients at high risk of misuse because it is tamper-resistant. However, it still may be subject to misuse for performance enhancement.26,27
The nonstimulant atomoxetine is also approved for ADHD, has no abuse potential, and may be particularly useful when anxiety, mood, and substance use disorders co-occur with ADHD.6 Rarely, atomoxetine can damage the liver, and liver function tests should be monitored if right upper quadrant pain develops.4,10
Other nonapproved agents such as bupropion and desipramine also have been used empirically and off-label for ADHD.4,10
Overall, treatment should be selected according to the risk of misuse of stimulant medication and the patient’s comorbidities.
INFORMED CONSENT
Informed consent may help patients appreciate the risks and benefits of the treatment options and develop realistic expectations about treatment.26 Patients are instructed to take their stimulant medications as prescribed and are informed of the risks of combining stimulants with other substances, particularly those that may interact with stimulants (eg, cocaine) and raise the risk of seizures and cardiovascular complications.
Stimulant medications lead to elevations in blood pressure and heart rate, although large-scale studies have shown no increase in the rate of serious cardiovascular events when these drugs are used appropriately.6 Less serious side effects associated with stimulant medications include insomnia, weight loss, decreased appetite, dry mouth, headache, and rarely, depression and anxiety.6
Patients need to be warned about diversion and abuse liability of stimulant medications, as well as alternative treatments.
The nonstimulant atomoxetine has no reinforcing properties but also raises the blood pressure and heart rate.6 As with stimulants, these elevations are generally minimal, time-limited, and of minor clinical significance.4,10 Frequent reasons to prescribe atomoxetine include poor tolerability of stimulants and a history of substance abuse. In addition, women with ADHD and high levels of emotional dysregulation or social anxiety appear to be particularly responsive to atomoxetine.6
Another consideration is cognitive behavioral therapy, which can augment the effects of pharmacotherapy.4 Cognitive behavioral therapy focuses on time management, prioritization, organization, problem-solving, motivation, and emotional regulation.4
Finally, patients also need to understand the possible consequences of nontreatment.5 Adults with untreated ADHD have high rates of academic and occupational difficulties, anti-social behaviors, and other forms of psychosocial adversity.4,5
Overall, this process should involve discussing risks and benefits of treatment options with the patient and promoting joint decision-making.
TREATMENT AGREEMENTS
Stimulant medications are classified by the US Drug Enforcement Administration as schedule II substances due to their abuse potential.20
It is important to inform patients of the addictive nature of the medication and to instruct them on how to store stimulants safely.27 Patients need to know that giving away or selling these medications is illegal.27
Treatment agreements establish rules for prescribing and are signed by the patient before initiating therapy.28,29 Patients are expected to attend all of their appointments, receive their prescriptions from one doctor, and obtain their medication from one pharmacy. These agreements may also require patients to submit to monitoring with random urine drug screens.29 Overall, they underscore the need for patients to follow a treatment plan in order to continue therapy with controlled substances.29
Manning27 recommends using agreements for high-risk college students prescribed stimulant medications. Red flags for misuse include signs of active substance use (eg, intoxication, a pattern of “lost” prescriptions, and doctor-shopping).27
The effectiveness in reducing risk of misuse in the adult ADHD population has not yet been investigated. Nonetheless, a method of communicating the seriousness of stimulant misuse to adult patients is essential to ADHD care.
STAYING ON TRACK
In the clinical setting, treatment response is measured not just by symptom reduction, but also by functional improvement. Thus, clinicians and patients must set functional goals whenever possible.27 Successful progress toward these goals justifies continuation of therapy, whereas lack of improvement signals the need to reconsider stimulant therapy.27
MONITORING AND DOCUMENTATION
Adults with ADHD present with varying levels of functional impairment and comorbidities, which may require different levels of monitoring.30 Not all patients with ADHD respond optimally to stimulant medications or tolerate them well.31,32 Hence, monitoring parameters for therapeutic change and adverse outcomes are important in that they guide the alteration or even discontinuation of pharmacotherapy.4,6,14
Documenting the decision-making process to continue stimulant medications under certain circumstances is also essential. Documentation should include discussion of goals and expectations, risks and benefits, and alternatives to stimulant use.
In adults, risk of stimulant medication misuse adds a new layer of complexity to monitoring.13,14 Adults may get multiple prescriptions from multiple providers, seek early refills, fill prescriptions at different pharmacies, or alter formulations. Many states track stimulant prescription use, and prescribers can use this information to determine if patients are refilling their prescriptions appropriately or obtaining stimulants from more than one provider.
Although these monitoring strategies are useful,6 it is prudent to structure the level of monitoring according to the patient’s risk of adverse events or medication misuse.14,27 Gourlay and Heit15 proposed the following “four-A” mnemonic for four domains to be explored at each visit in patients receiving pain medicine. This mnemonic can be applied to adult ADHD patients to more accurately monitor the patient throughout treatment.
THE ‘FOUR-A’ MNEMONIC
ADHD symptoms
Several ADHD scales can be used to track symptom changes over time.33 However, these self-report scales may be subject to positive illusory bias, a phenomenon observed in individuals with ADHD in which they tend to overrate their functioning,34 which may limit the accuracy of self-report scales.35
Activities of daily living
Since patients with ADHD tend to overrate their functioning in various aspects of living, collateral information should be gathered to corroborate patient self-reports whenever possible.
Adverse events
Blood pressure, heart rate, and weight should be assessed at baseline and monitored during stimulant treatment. Other symptoms to monitor include gastrointestinal distress, headache, aggression, depression, appetite, and sleeping habits.4,6 More intensive monitoring (eg, electrocardiography) may be indicated for those with hypertension and cardiovascular risk factors.
Aberrant behavior
Monitoring for misuse and diversion of stimulant medications is essential, as ADHD itself is a risk factor for addiction.20,21 Pill counts, prescription monitoring programs, urine drug screens, and collateral informants have all been proposed but not studied in monitoring for the misuse of stimulant medications.27 Before prescribing, it is prudent to check the prescription monitoring program, get a urine drug screen, and discuss any positive findings with the patient.36,37
Treatment agreements ensure that patients are aware of the consequences of misuse and allow the clinician to reference prior discussion when terminating treatment with stimulants.
LIVES CAN BE ENHANCED
ADHD is a common disorder that arises in childhood and can persist throughout life. Adults with untreated ADHD are at risk of severe impairments in various domains of functioning. Stimulant medications are an effective treatment but may be diverted into the street market. Using the universal-precautions model may reduce the risks of both nontreatment of ADHD and misuse of stimulants.
Accordingly, clinicians need to confirm the ADHD diagnosis, assess comorbidities, estimate risk of misuse, and provide informed consent prior to prescribing. Subsequent monitoring should involve the use of treatment agreements and evaluating treatment response, paying particular attention to ADHD symptom control but also to level of function, adverse effects, and aberrant behavior.
With these principles in mind, clinicians can address the risks of misuse and potentially enhance the lives of people who may have been suffering substantially due to lack of appropriate care.
- Polanczyk G, de Lima MS, Horta BL, Biederman J, Rohde LA. The worldwide prevalence of ADHD: a systematic review and metaregression analysis. Am J Psychiatry 2007; 164:942–948.
- Polanczyk GV, Wilcutt EG, Salum GA, Kieling C, Rohde LA. ADHD prevalence estimates across three decades: an updated systematic review and meta-regression analysis. Int J Epidemiol 2014; 43:434–442.
- Wilens TE. ADHD: Prevalence, diagnosis, and issues of comorbidity. CNS Spectr 2007; 12(suppl 6):1–5.
- Kooij SJ, Bejerot S, Blackwell A, et al. European consensus statement on diagnosis and treatment of adult ADHD: the European Network Adult ADHD. BMC Psychiatry 2010; 10:67.
- Shaw M, Hodgkins P, Caci H, et al. A systematic review and analysis of long-term outcomes in attention deficit hyperactivity disorder: effects of treatment and non-treatment. BMC Med 2012;10:99.
- Modesto-Lowe V, Meyer A, Soovajian V. A clinician’s guide to adult attention-deficit hyperactivity disorder. Conn Med 2012; 76:517–523.
- Kessler RC, Adler L, Barkley R, et al. The prevalence and correlates of adult ADHD in the United States: results from the National Comorbidity Survey Replication. Am J Psychiatry 2006; 163:716–723.
- Goodman DW, Surman CB, Scherer PB, Salinas GD, Brown JJ. Assessment of physician practices in adult attention-deficit/hyperactivity disorder. Prim Care Companion CNS Disord 2012; 14(4).
- Hall CL, Newell K, Taylor J, Sayal K, Swift KD, Hollis C. ‘Mind the gap’—mapping services for young people with ADHD transitioning from child to adult mental health services. BMC Psychiatry 2013; 13:186.
- National Institute for Health and Care Excellence. Attention deficit hyperactivity disorder: diagnosis and management of ADHD in children, young people and adults. The British Psychological Society and The Royal College of Psychiatrists: United Kingdom; 2009.
- Mannuzza S, Klein RG, Klein DF, Bessler A, Shrout P. Accuracy of adult recall of childhood attention deficit hyperactivity disorder. Am J Psychiatry 2002; 159:1882–1888.
- Wetzel MW. Medical student participation in an adult ADHD outpatient clinic: an ideal setting for education in outpatient psychiatry. Acad Psychiatry 2009; 33:80–81.
- Culpepper L, Mattingly G. Challenges in identifying and managing attention-deficit/hyperactivity disorder in adults in the primary care setting: a review of the literature. Prim Care Companion J Clin Psychiatry 2010; 12(6).
- Rabiner DL. Stimulant prescription cautions: addressing misuse, diversion and malingering. Curr Psychiatry Rep 2013; 15:375.
- Gourlay D, Heit H. Universal precautions: a matter of mutual trust and responsibility. Pain Med 2006; 7:210–211.
- Kessler RC, Adler L, Ames M, et al. The World Health Organization Adult ADHD Self-Report Scale (ASRS): a short screening scale for use in the general population. Psychol Med 2005; 35:245–256.
- American Psychiatric Association. Diagnostic and Statistical Manual of Mental Disorders, 5th ed. Arlington, VA: American Psychiatric Association; 2013.
- CADDRA Guidelines Steering Committee. Canadian ADHD practice guidelines: CADDRA 2008. http://www.naceonline.com/AdultADHDtoolkit/professionalresources/caddraguidelines.pdf. Accessed July 10, 2015.
- Mannuzza S, Klein RG, Bessler A, Malloy P, LaPadula M. Adult psychiatric status of hyperactive boys grown up. Am J Psychiatry 1998; 155:493–498.
- Kaye S, Darke S. The diversion and misuse of pharmaceutical stimulants: what do we know and why should we care? Addiction 2012; 107:467–477.
- Novak SP, Kroutil LA, Williams RL, Van Brunt DL. The nonmedical use of prescription ADHD medications: results from a national Internet panel. Subst Abuse Treat Prev Policy 2007; 2:32.
- Bavarian N, Flay BR, Ketcham P, et al. Using structural equation modeling to understand prescription stimulant misuse: a test of the Theory of Triadic Influence. Drug Alcohol Depend 2014; 138:193–201.
- McCabe SE, Teter CJ, Boyd CJ. Medical use, illicit use and diversion of prescription stimulant medication. J Psychoactive Drugs 2006; 38:43–56.
- Volkow ND. Stimulant medications: how to minimize their reinforcing effects? Am J Psychiatry 2006; 163:359–361.
- Kolar D, Keller A, Golfinopoulos M, Cumyn L, Syer C, Hechtman L. Treatment of adults with attention-deficit/hyperactivity disorder. Neuropsychiatr Dis Treat 2008; 4:107–121.
- Schachter D, Tharmalingam S, Kleinman I. Informed consent and stimulant medication: adolescents’ and parents’ ability to understand information about benefits and risks of stimulant medication for the treatment of attention-deficit/hyperactivity disorder. J Child Adolesc Psychopharmacol 2011; 21:139–148.
- Manning JS. Strategies for managing the risks associated with ADHD medications. J Clin Psychiatry 2013; 74:e19.
- Deep K. Use of narcotics contracts. Virtual Mentor 2013; 15:416–420.
- Cheatle MD, Savage SR. Informed consent in opioid therapy: a potential obligation and opportunity. J Pain Symptom Manage 2012; 44:105–116.
- Dias TG, Kieling C, Graeff-Martins AS, Moriyama TS, Rohde LA, Polanczyk GV. Developments and challenges in the diagnosis and treatment of ADHD. Rev Bras Psiquiatr 2013; 35(suppl 1):S40–S50.
- Mattingly GW, Weisler RH, Young J, et al. Clinical response and symptomatic remission in short- and long-term trials of lisdexamfetamine dimesylate in adults with attention-deficit/hyperactivity disorder. BMC Psychiatry 2013; 13:39.
- Contini V, Victor MM, Bertuzzi GP, et al. No significant association between genetic variants in 7 candidate genes and response to methylphenidate treatment in adult patients with ADHD. J Clin Psychopharmacol 2012; 32:820–823.
- Rösler M, Retz W, Thome J, Schneider M, Stieglitz RD, Falkai P. Psychopathological rating scales for diagnostic use in adults with attention-deficit/hyperactivity disorder (ADHD). Eur Arch Psychiatry Clin Neurosci 2006; 256(suppl 1):i3–i11.
- Prevatt F, Proctor B, Best L, Baker L, Van Walker J, Taylor NW. The positive illusory bias: does it explain self-evaluations in college students with ADHD? J Atten Disord 2012; 16:235–243.
- Jiang Y, Johnston C. The relationship between ADHD symptoms and competence as reported by both self and others. J Atten Disord 2012; 16:418–426.
- Darredeau C, Barrett SP, Jardin B, Pihl RO. Patterns and predictors of medication compliance, diversion, and misuse in adult prescribed methylphenidate users. Hum Psychopharmacol 2007; 22:529–536.
- Worley J. Prescription drug monitoring programs, a response to doctor shopping: purpose, effectiveness, and directions for future research. Issues Ment Health Nurs 2012; 33:319–328.
KEY POINTS
- Untreated adult ADHD is associated with negative outcomes that include unemployment, arrests, divorce, and psychiatric comorbidities.
- Available ADHD guidelines suggest that children and adults who respond to pharmacotherapy should continue it for as long as it remains effective. In this context, there is increasing recognition of adult ADHD as a valid and treatable disorder.
- Following the guidelines of universal precautions in the diagnosis and treatment of adult ADHD can alleviate clinicians’ concerns when diagnosing and treating this disorder.

Comprehensive wound malodor management: Win the RACE
Wounds that fail to heal become more than mere skin lesions. Pain, malodor, and the accompanying psychological distress often complicate nonhealing wounds and impair quality of life.1 Management of malodor requires perseverance, sensitivity, and familiarity with tools and procedures that range from surgical debridement to medical-grade honey.
Chronic, nonhealing wounds are defined as persisting for more than 6 months.2 These lesions are incapable of undergoing anatomic and functional repair on their own. Commonly encountered nonhealing wounds include pressure ulcers, venous stasis ulcers, arterial insufficiency ulcers, and malignant cutaneous wounds.
Typically, the patient with a nonhealing wound is frail, debilitated, medically complex, and often faced with one or more life-limiting illnesses. Complete wound healing may therefore be unrealistic, and optimal wound management becomes the goal of care.3,4
Healthcare providers encounter nonhealing wounds in varied settings—acute inpatient, outpatient, long-term, and home care. For instance, in the home care setting, a study of 383 patients enrolled in hospice found that 35% had skin ulcers and wounds.3 Half of those affected had pressure ulcers, 20% had ischemic ulcers, and 30% had other skin disorders such as stasis ulcers, burns, skin tears, and tumors. A larger study, also in hospice patients, found that 26% had pressure ulcers and 10% more developed them within 6 months.5
While pressure ulcers are the most common nonhealing wounds, malignant or fungating wounds are found in 5% to 10% of patients with metastatic disease, usually with cancers of the breast, head, and neck.6
Maximizing wound care provides comfort, relieves suffering, and promotes quality of life.3,7 To achieve these goals, clinicians must be familiar with strategies to manage complications associated with nonhealing wounds such as pain, malodor, and psychosocial adverse effects. Of these complications, malodor has been pointed out by both patients and caregivers as the most distressing.8
This article focuses on wound malodor, discusses the processes that cause wounds to emit an offensive smell, and outlines a comprehensive management approach.
MRS. A., AGE 61, WITH STAGE IV BREAST CANCER
Mrs. A., 61 years old, had a fungating mass in her left breast, which began as a small nodule and progressively enlarged to deform her breast over several months. Her oncologist subsequently staged the extent of her cancer as stage IV after workup revealed lung metastasis. Mrs. A. and her family decided to forgo cancer treatment, including radiotherapy, and to transition to hospice care after discussions with the oncologist.
Mrs. A. lived at home with her husband. Her daughter and three grandchildren all lived nearby.
When her hospice physician arrived at her home to meet her, a strong, pungent, and nauseating smell greeted him as he entered her bedroom. The patient said that for the past few months she had been increasingly distressed by the revolting odor. She rarely left home and had been ashamed to have people visit her, including her family.
On examination, the physician noticed a large fungating mass with yellowish discharge and necrotic tissue in her left breast. In addition to mild pain, she was immensely bothered by the strong odor coming from her breast.
THE IMPACT OF MALODOR
As seen in the case of Mrs. A., malodor has grave effects, both physical and psychological. Patients experience impaired or socially unacceptable body image, social rejection, personal shame, and embarrassment.9,10 Feelings of fear, anxiety, and depression are common. If left uncontrolled, malodor results in social isolation, reluctance to engage in social activities, diminished appetite, and nausea. In addition, malodor is a constant reminder of patients’ pain and cancer, and it results in further suffering.11
Reactions of family members and caregivers can worsen the situation.9,12 Expressions of revulsion limit contact and inhibit intimacy, especially near the end of life. Caregivers are often frustrated and distressed over their inability to control the malodor. The environment becomes uninhabitable, and the malodor can permeate clothing, furniture, and living quarters.
Managing malodor can be emotionally draining, physically daunting, and frustrating for healthcare professionals, as several methods are usually employed, often in a trial-and-error approach, to achieve an acceptable degree of odor control. In addition, clinicians must face the challenge of treating malodorous wounds at very close distance without reacting in a way that offends or alarms patients and family members.13
MALODOR PRODUCTION: WHERE IS THAT SMELL COMING FROM?
All wounds can produce an odor.14 Wounds that are expected to heal typically emit a faint but not unpleasant odor, akin to fresh blood. Wounds colonized by Pseudomonas aeruginosa produce a fruity or grapelike odor that is tolerable. Malodor occurs with wounds infected by other gram-negative organisms or anaerobic bacteria.15 Similarly, wounds covered by necrotic tissue smell like decaying flesh.
Three major causes
The three major causes of wound malodor are slough, infection, and exudate (Figure 1).
Slough is dead or necrotic tissue, usually resulting from vascular compromise. Arterial ulcers, pressure ulcers, and malignant wounds all form slough from capillary occlusion, subsequent ischemia, and tissue necrosis.
Infection. Devitalized tissue, an ideal medium in which bacteria thrive, becomes the source of infection. Anaerobic bacteria are usually implicated in malodor. These include Bacteroides fragilis, Bacteroides prevotella, Clostridium perfringens, and Fusobacterium nucleatum.16,17 Anaerobic organisms produce putrescine and cadaverine, which are largely responsible for the offensive odor.16,18 Volatile fatty acids such as propionic, butyric, isovaleric, and valeric acid are formed from lipid catabolism by anaerobes and add to malodor.17 Aerobic bacteria such as Proteus, Klebsiella, and Pseudomonas species supercolonize necrotic tissue as well and contribute to malodor.17,18
Exudate. Since nonhealing wounds undergo repeated cycles of inflammation, infection, and necrosis, accumulation of exudate becomes inevitable. Exudate typically is a pus-like fluid containing serum, fibrin, and white blood cells, which leak from blood vessels. In addition, bacteria that colonize chronic wounds filled with necrotic tissue activate proteases that degrade and liquefy dead tissue, thereby forming extensive amounts of exudate.19
Apart from slough, infection, and exudate, poor general hygiene and dressings left on for too long may contribute to malodor.16 Moisture-retentive dressings such as hydrocolloids leave an odor after removal. Dressings that liquefy upon contact with the wound surface leave a pus-like, potentially malodorous material.
MALODOR ASSESSMENT: DO YOU SMELL SOMETHING?
Various ways to document wound malodor can prove useful in guiding assessment and treatment. Descriptions such as “foul,” “putrid,” “fishy,” or “filled the room” vividly portray the initial presentation. A 10-point numerical scale similar to a numerical pain scale or a visual analogue scale can be used as a subjective measure.
Other grading methods, which to the authors’ knowledge are not validated, may be helpful. In a study that focused on patients suffering from malodorous gynecologic malignancies, von Gruenigen et al20 used a 0-to-3 scale:
- 0 Absent
- 1 Not offensive
- 2 Offensive but tolerable
- 3 Offensive and intolerable.
A scale often adapted by other authors was devised by Baker and Haig,21 which clearly defines four classes:
- 1 Strong—odor is evident upon entering the room (6 to 10 feet from the patient) with the dressing intact
- 2 Moderate—odor is evident upon entering the room with dressing removed
- 3 Slight—odor is evident at close proximity to the patient when the dressing is removed
- 4 No odor—no odor is evident, even at the patient’s bedside with the dressing removed.
COMPREHENSIVE MANAGEMENT: HOW DO WE WIN THE ‘RACE’?

The acronym RACE outlines an approach to dealing with malodor. It stands for removal of necrotic tissue; antibacterials; odor concealers; and education and support (Table 1).
Remove necrotic tissue
An important step in eliminating malodor is to remove necrotic tissue. This starts with debridement, which decreases the incidence of infection and hastens wound closure.22,23 Table 2 compares the different types of debridement.
Sharp or surgical debridement involves the use of a scalpel or scissors. This type of debridement may increase the risk of bleeding, pain, and malignant cell seeding in fungating wounds.4,24
Enzymatic debridement employs chemicals with proteolytic action (eg, collagenase) to digest extracellular proteins in wounds.18,25
Mechanical debridement involves aggressive therapies such as forceful irrigation and hydrotherapy, which may fail to discriminate between necrotic and viable tissues.18,26
Biological debridement using maggots, which ingest bacteria and devitalized tissue, may cause increased wound bleeding and may be unacceptable for patients and families.24,27
Autolytic debridement is often recommended, particularly if complete healing is not the primary goal.17,24,28,29 Autolysis uses proteolytic enzymes and phagocytic cells present in the wound bed and wound fluid to clear devitalized tissue. It is easy, inexpensive, noninvasive, and painless,4 and it requires less frequent dressing changes relative to standard dressing or wet-to-dry dressing.
Autolytic debridement is commonly accomplished using hydrocolloid and hydrogel dressings.15,29 Hydrocolloids are adhesive, occlusive, and conformable dressings that are suitable for wounds with low to moderate amounts of exudate. Upon contact with the wound surface, the dressing absorbs the exudate, forms a gel layer, and maintains a moist environment. Hydrocolloids are not recommended for infected wounds or for those with copious exudate as they may lead to maceration around the wound. A disadvantage of hydrocolloid dressings is their tendency to generate brown, often malodorous exudate when removed.
On the other hand, hydrogels in amorphous gel, dressing, sheet, or impregnated gauze form are water-based products that create a moist environment similar to hydrocolloids. Aside from causing minimal trauma to the wound bed when removed, the dressing’s cooling effect may bring some pain relief. Hydrogels are appropriate for dry wounds and for those with minimal exudate.
After debridement, the wound is cleansed and irrigated. A number of cleansers and solutions are available, but normal saline is a cheap alternative. To irrigate, experts recommend an 18- or 20-gauge intravenous catheter attached to a 30- or 60-mL syringe.15 This technique provides 8 to 15 psi of pressure, enough to cleanse the wound without causing tissue trauma.
Antibacterials and absorption
Antibacterials. Topical antibiotics have several advantages over systemic antibiotics in treating chronic wounds.30,31 These include a high and sustained concentration of the antimicrobial at the site of infection, limited potential for systemic absorption and toxicity, reduced potential for antibiotic resistance, and drawing of the patient’s and caregiver’s attention to the wound.
Metronidazole is the most widely used topical antibacterial for malodor management. Its efficacy is likely due to the predominant involvement of anaerobic bacteria in foul-smelling wounds. Topical metronidazole is available as a gel and as a cream. A systematic review showed that on average, topical metronidazole was used once daily for 14 consecutive days.19 The layer of topical metronidazole is typically covered with a nonadherent primary dressing followed by an absorbent secondary dressing.
The best clinical evidence for topical metronidazole consists of case reports and series.32–35 The largest of these studies was done by Finlay et al, who treated 47 patients with malodorous benign and malignant cutaneous wounds with 0.75% metronidazole gel daily.32 Forty-five (96%) of the patients reported significantly decreased odor by 14 days, as well as decreased pain, discharge, and surrounding cellulitis.
A randomized, placebo-controlled trial conducted by Bale et al had equivocal findings.9 All 41 patients who received metronidazole gel reported a decrease in malodor within 3 days of starting it. However, 76% of patients who received placebo also reported malodor control; in the final analysis, no significant difference was noted in the success rate between the two groups.
Metronidazole tablets can be crushed and sprinkled over the wound. As with metronidazole gel or cream, the crushed tablets are applied daily and covered by a primary nonadherent dressing and an absorbent secondary dressing. This off-label use of metronidazole serves as a cheaper alternative to commercially available topical preparations. To our knowledge, there has been no head-to-head trial comparing the two topical strategies.
Systemic metronidazole, often given orally, has been recommended if evidence of deep tissue or systemic infection is noted15 and in cases of fungating wounds with fistulas invading either the gastrointestinal or genitourinary tracts.18 Side effects such as nausea, neuropathy, and alcohol intolerance (ie, disulfiram reaction) may occur, which are not seen with topical metronidazole.
Both topical and systemic metronidazole can be used together on a time-limited basis for extensive malodorous wounds, such as fungating malignant wounds or stage IV sacral pressure ulcers.
Other antimicrobial agents used to treat malodor include silver-containing products, iodine-containing topical agents, mupirocin, bacitracin, neomycin, and polymyxin B.
Honey was used for wound care by the ancient Egyptians, and it is still used.36 Its beneficial effects include antimicrobial, debriding, deodorizing, anti-inflammatory, and granulation tissue-stimulating. Honey has even been shown to significantly decrease skin colonization with various kinds of bacteria, including methicillin-resistant Staphylococcus aureus.37 Medical-grade honey is preferred over table honey, as the latter is nonsterile and can contain Clostridium spores, which contaminate the wound.38
Yogurt and buttermilk lower the pH of the wound and control bacterial proliferation to control malodor.39,40 Either is applied for 10 to 15 minutes after the wound is cleansed and is then washed off thoroughly.
Absorbent dressings are used either over a layer of topical metronidazole and a nonadherent primary dressing or as a primary dressing itself. An absorbent dressing containing activated charcoal is used for rapid improvement, although cost may be prohibitive, especially in developing countries.13,19 Another type of absorbent dressing, composed of polyester impregnated with sodium chloride, has been found to be useful in malodor control.41 An important pointer is to maintain a tight seal around the absorbent dressing to prevent leakage of exudate.
Concealers
Aromatics used to conceal malodor include scented candles, incense, fragrant flowers and plants, and air-freshener sprays. When circumstances allow, candles are good options since they conceal malodor by emitting fragrance, and the flame burns off foul-smelling chemicals. Aromatics such as coffee beans, vanilla beans, and cider vinegar can be placed in a pan and left under the patient’s bed or close to it. Drops of peppermint oil or oil of wintergreen can be placed on wound dressings.
Other odor concealers are adsorbent materials that attract and cause ions and molecules to adhere to their surface. Examples are charcoal, baking soda, and cat litter. As with other aromatics, these materials are placed in pans and left under the bed or near the patient.
Aromatics can have disadvantages, as certain scents, especially strong ones, can be nauseating for patients. Some fragrances trigger asthma or skin irritation. Patients and caregivers can be left with an unpleasant association of certain fragrances with malodor by conditioning.15,17,18
Education and support
Concerns of the patient and family members need to be heard, addressed promptly, and reassessed with each visit, since uncontrolled malodor can be a chief source of caregiver fatigue.
Foremost in formulating a patient- and family-centered malodor management strategy is to commit to controlling malodor as much as possible. Regular follow-up appointments should be made, whether in the office or at home, to check on the patient’s progress and address new and ongoing concerns. Symptoms accompanying malodor, such as pain, bleeding, and sleep disturbance, need to be addressed, as they all affect quality of life.1 Audience-appropriate educational materials should be made available.26 Online resources that patients and families can explore include the websites of the Wound Ostomy and Continence Nurses Society (www.wocn.org) and the Association for the Advancement of Wound Care (aawconline.org).
Healthcare professionals need to be prepared to deal with problems and complications involving patients and family members that may arise in the course of treatment.12 Problems include the cost and local unavailability of dressing supplies, insurance coverage for dressings and topical agents, lack of assistance at home, and fear of changing dressings. A cardinal rule for healthcare providers is to avoid expressing distress at odors in front of or within hearing of patients and families.
OTHER STRATEGIES: WHAT ELSE CAN WE DO?
Curcumin, the main biologically active compound in the herb turmeric, applied directly to wounds three times daily as an ointment, has been shown to have odor-controlling properties.42
Sugar paste has been reported to control malodor by drawing out exudative and tissue fluid osmotically, and inhibiting bacterial growth.16,17 Water is mixed with sugar (ie, granulated, caster, or powdered) to form a paste, with additives like glycerin and polyethylene glycol used to alter the consistency. Thick clay-like paste is good for wounds with large cavities, while thin paste is useful for wounds with small or superficial openings. The paste is applied twice daily and is covered by an absorbent dressing.
Pressure relief is vital in managing pressure ulcers.18,43 Repositioning every 2 hours and using special devices, such as mattress overlays, alternating pressure mattresses, and low air loss mattresses, are frequently employed techniques.
If circumstances permit and when congruent with the patient’s goals of care, intra-arterial chemotherapy and radiotherapy can be contemplated for malignant fungating wounds.44,45
Other strategies include opening the windows during dressing changes, increasing the frequency of dressing changes, promptly removing used dressings from the house, and ensuring good general hygiene.
CASE RESOLUTION
After telling her that he was committed to control the malodor or, if possible, eliminate it, Mrs. A.’s doctor prepared two lists of materials—one for himself and one for Mrs. A.’s husband. He returned the next day, brought out his supplies, asked Mrs. A. to lie in bed, and invited her husband to assist him.
He cleansed and irrigated the breast lesion with normal saline, making sure to remove as much dead tissue as he could. He applied a layer of metronidazole cream to the wound cavity, then covered it with a nonadherent dressing. He then covered the wound with gauze, sealed the edges with medical adhesive tape, and applied a few drops of oil of wintergreen to the surface. A pan of charcoal briquettes was put under the bed, and a candle with Mrs. A.’s favorite scent was lit by the bedside. The physician then instructed Mrs. A.’s husband to repeat the procedure once daily for 1 week.
After 2 weeks, Mrs. A. and her husband said the foul odor had greatly decreased. She appeared more cheerful and energetic, especially after her grandchildren visited a few days earlier. The physician then instructed the husband to stop using metronidazole cream and to apply a hydrocolloid dressing every 3 days instead. He advised them to continue the rest of the process of applying a few drops of oil of wintergreen on the dressing surface, placing a pan of charcoal briquettes under the bed, and lighting a scented candle by the bedside.
FINISH THE RACE!
Complex nonhealing wounds are encountered across various healthcare settings. Wound malodor is an important component of nonhealing wounds, which adversely affects patients, families, and healthcare providers. Infection, slough, and exudate are the major causes of wound malodor. The essential steps to reduce malodor are to remove necrotic tissue, use antibacterial and odor-absorbing agents, apply appropriate odor “concealers,” educate families, and formulate a patient- and family-centered strategy (Table 1).
Acknowledgment: The authors would like to thank Sue Reif, CNP, for her assistance in completing the manuscript.
- Lo SF, Hayter M, Hu WY, Tai CY, Hsu MY, Li YF. Symptom burden and quality of life in patients with malignant fungating wounds. J Adv Nurs 2012; 68:1312–1321.
- Lazarus GS, Cooper DM, Knighton DR, et al. Definitions and guidelines for assessment of wounds and evaluation of healing. Arch Dermatol 1994; 130:489–493.
- Tippett AW. Wounds at the end of life. Wounds 2005; 17:91–98.
- Burt T. Palliative care of pressure ulcers in long-term care. Ann Long-Term Care 2013; 21:20–28.
- Reifsnyder J, Magee HS. Development of pressure ulcers in patients receiving home hospice care. Wounds 2005; 17:74–79.
- Haisfield-Wolfe ME, Rund C. Malignant cutaneous wounds: a management protocol. Ostomy Wound Manage 1997; 43:56–66.
- O’Brien C. Malignant wounds: managing odour. Can Fam Physician 2012; 58:272–274.
- Gethin G, Grocott P, Probst S, Clarke E. Current practice in the management of wound odour: an international survey. Int J Nurs Stud 2014; 51:865–874.
- Bale S, Tebble N, Price P. A topical metronidazole gel used to treat malodorous wounds. Br J Nurs 2004; 13:S4–S11.
- Hack A. Malodorous wounds—taking the patient’s perspective into account. J Wound Care 2003; 12:319–321.
- Price E. Wound care. The stigma of smell. Nurs Times 1996; 92:71–72.
- Paul JC, Pieper BA. Topical metronidazole for the treatment of wound odor: a review of the literature. Ostomy Wound Manage 2008; 54:18–27.
- Lee G, Anand SC, Rajendran S, Walker I. Overview of current practice and future trends in the evaluation of dressings for malodorous wounds. J Wound Care 2006; 15:344–346.
- Cutting K, Harding K. Criteria for identifying wound infection. J Wound Care 1994; 3:198–201.
- McDonald A, Lesage P. Palliative management of pressure ulcers and malignant wounds in patients with advanced illness. J Palliat Med 2006; 9:285–295.
- Holloway S. Recognising and treating the causes of chronic malodorous wounds. Prof Nurse 2004; 19:380–384.
- Haughton W, Young T. Common problems in wound care: malodorous wounds. Br J Nurs 1995; 4:959–963.
- Alvarez OM, Kalinski C, Nusbaum J, et al. Incorporating wound healing strategies to improve palliation (symptom management) in patients with chronic wounds. J Palliat Med 2007; 10:1161–1189.
- da Costa Santos CM, de Mattos Pimenta CA, Nobre MR. A systematic review of topical treatments to control the odor of malignant fungating wounds. J Pain Symptom Manage 2010; 39:1065–1076.
- Von Gruenigen VE, Coleman RL, et al. Bacteriology and treatment of malodorous lower reproductive tract in gynecologic cancer patients. Obstet Gynecol 2000; 96:23–27.
- Baker PG, Haig G. Metronidazole in the treatment of chronic pressure sores and ulcers: a comparison with standard treatment in general practice. Practitioner 1981; 225:569–573.
- Whitney J, Phillips L, Aslam R, et al. Guidelines for the treatment of pressure ulcers. Wound Repair Regen 2006; 14:663–679.
- Williams D, Enoch S, Miller D, Harris K, Price P, Harding KG. Effect of sharp debridement using curette on recalcitrant nonhealing venous ulcers: a concurrently controlled, prospective cohort study. Wound Repair Regen 2005; 13:131–137.
- Bergstrom KJ. Assessment and management of fungating wounds. J Wound Ostomy Continence Nurs 2011: 38:31–37.
- Sinclair RD, Ryan TJ. Proteolytic enzymes in wound healing: the role of enzymatic debridement. Australas J Dermatol 1994; 35:35–41.
- Enoch S, Harding KG. Wound bed preparation: the science behind the removal of barriers to healing. Wounds 2003;15:213–229.
- Mumcuoglu KY. Clinical applications for maggots in wound care. Am J Clin Dermatol 2001; 2:219–227.
- Langemo DK, Black J; National Pressure Ulcer Advisory Panel. Pressure ulcers in individuals receiving palliative care: a National Pressure Ulcer Advisory Panel white paper. Adv Skin Wound Care 2010; 23:59–72.
- Fonder MA, Lazarus GS, Cowan DA, Aronson-Cook B, Kohli AR, Mamelak AJ. Treating the chronic wound: a practical approach to the care of nonhealing wounds and wound care dressings. J Am Acad Dermatol 2008; 58:185–206.
- Lio PA, Kaye ET. Topical antibacterial agents. Infect Dis Clin North Am 2004; 18:717–733.
- Gelmetti C. Local antibiotics in dermatology. Dermatol Ther 2008; 21:187–195.
- Finlay IG, Bowszyc J, Ramlau C, Gwiezdzinski Z. The effect of topical 0.75% metronidazole gel on malodorous cutaneous ulcers. J Pain Symptom Manage 1996; 11:158–162.
- Bower M, Stein R, Evans TR, Hedley A, Pert P, Coombes RC. A double-blind study of the efficacy of metronidazole gel in the treatment of malodorous fungating tumours. Eur J Cancer 1992; 28A:888–889.
- Kalinski C, Schnepf M, Laboy D, et al. Effectiveness of a topical formulation containing metronidazole for wound odor and exudate control. Wounds 2005; 17:84–90.
- Kuge S, Tokuda Y, Ohta M, et al. Use of metronidazole gel to control malodor in advanced and recurrent breast cancer. Jpn J Clin Oncol 1996; 26:207–210.
- Belcher J. A review of medical-grade honey in wound care. Br J Nurs 2012: 21:S4–S9.
- Kwakman PH, Van den Akker JP, Güçlü A, et al. Medical-grade honey kills antibiotic-resistant bacteria in vitro and eradicates skin colonization. Clin Infect Dis 2008; 46:1677–1682.
- Cooper RA, Jenkins L. A comparison between medical grade honey and table honeys in relation to antimicrobial efficacy. Wounds 2009; 21:29–36.
- Patel B, Cox-Hayley D. Managing wound odor #218. J Palliat Med 2010; 13:1286–1287.
- Schulte MJ. Yogurt helps to control wound odor. Oncol Nurs Forum 1993; 20:1262.
- Upright CA, Salton C, Roberts F, Murphy J. Evaluation of Mesalt dressings and continuous wet saline dressings in ulcerating metastatic skin lesions. Cancer Nurs 1994; 17:149–155.
- Kuttan R, Sudheeran PC, Josph CD. Turmeric and curcumin as topical agents in cancer therapy. Tumori 1987; 73:29–31.
- Bass MJ, Phillips LG. Pressure sores. Curr Probl Surg 2007; 44:101–143.
- Bufill JA, Grace WR, Neff R. Intra-arterial chemotherapy for palliation of fungating breast cancer: a case report and review of the literature. Am J Clin Oncol 1994; 17:118–124.
- Murakami M, Kuroda Y, Sano A, et al. Validity of local treatment including intraarterial infusion chemotherapy and radiotherapy for fungating adenocarcinoma of the breast: case report of more than 8-year survival. Am J Clin Oncol 2001; 24:388–391.
Wounds that fail to heal become more than mere skin lesions. Pain, malodor, and the accompanying psychological distress often complicate nonhealing wounds and impair quality of life.1 Management of malodor requires perseverance, sensitivity, and familiarity with tools and procedures that range from surgical debridement to medical-grade honey.
Chronic, nonhealing wounds are defined as persisting for more than 6 months.2 These lesions are incapable of undergoing anatomic and functional repair on their own. Commonly encountered nonhealing wounds include pressure ulcers, venous stasis ulcers, arterial insufficiency ulcers, and malignant cutaneous wounds.
Typically, the patient with a nonhealing wound is frail, debilitated, medically complex, and often faced with one or more life-limiting illnesses. Complete wound healing may therefore be unrealistic, and optimal wound management becomes the goal of care.3,4
Healthcare providers encounter nonhealing wounds in varied settings—acute inpatient, outpatient, long-term, and home care. For instance, in the home care setting, a study of 383 patients enrolled in hospice found that 35% had skin ulcers and wounds.3 Half of those affected had pressure ulcers, 20% had ischemic ulcers, and 30% had other skin disorders such as stasis ulcers, burns, skin tears, and tumors. A larger study, also in hospice patients, found that 26% had pressure ulcers and 10% more developed them within 6 months.5
While pressure ulcers are the most common nonhealing wounds, malignant or fungating wounds are found in 5% to 10% of patients with metastatic disease, usually with cancers of the breast, head, and neck.6
Maximizing wound care provides comfort, relieves suffering, and promotes quality of life.3,7 To achieve these goals, clinicians must be familiar with strategies to manage complications associated with nonhealing wounds such as pain, malodor, and psychosocial adverse effects. Of these complications, malodor has been pointed out by both patients and caregivers as the most distressing.8
This article focuses on wound malodor, discusses the processes that cause wounds to emit an offensive smell, and outlines a comprehensive management approach.
MRS. A., AGE 61, WITH STAGE IV BREAST CANCER
Mrs. A., 61 years old, had a fungating mass in her left breast, which began as a small nodule and progressively enlarged to deform her breast over several months. Her oncologist subsequently staged the extent of her cancer as stage IV after workup revealed lung metastasis. Mrs. A. and her family decided to forgo cancer treatment, including radiotherapy, and to transition to hospice care after discussions with the oncologist.
Mrs. A. lived at home with her husband. Her daughter and three grandchildren all lived nearby.
When her hospice physician arrived at her home to meet her, a strong, pungent, and nauseating smell greeted him as he entered her bedroom. The patient said that for the past few months she had been increasingly distressed by the revolting odor. She rarely left home and had been ashamed to have people visit her, including her family.
On examination, the physician noticed a large fungating mass with yellowish discharge and necrotic tissue in her left breast. In addition to mild pain, she was immensely bothered by the strong odor coming from her breast.
THE IMPACT OF MALODOR
As seen in the case of Mrs. A., malodor has grave effects, both physical and psychological. Patients experience impaired or socially unacceptable body image, social rejection, personal shame, and embarrassment.9,10 Feelings of fear, anxiety, and depression are common. If left uncontrolled, malodor results in social isolation, reluctance to engage in social activities, diminished appetite, and nausea. In addition, malodor is a constant reminder of patients’ pain and cancer, and it results in further suffering.11
Reactions of family members and caregivers can worsen the situation.9,12 Expressions of revulsion limit contact and inhibit intimacy, especially near the end of life. Caregivers are often frustrated and distressed over their inability to control the malodor. The environment becomes uninhabitable, and the malodor can permeate clothing, furniture, and living quarters.
Managing malodor can be emotionally draining, physically daunting, and frustrating for healthcare professionals, as several methods are usually employed, often in a trial-and-error approach, to achieve an acceptable degree of odor control. In addition, clinicians must face the challenge of treating malodorous wounds at very close distance without reacting in a way that offends or alarms patients and family members.13
MALODOR PRODUCTION: WHERE IS THAT SMELL COMING FROM?
All wounds can produce an odor.14 Wounds that are expected to heal typically emit a faint but not unpleasant odor, akin to fresh blood. Wounds colonized by Pseudomonas aeruginosa produce a fruity or grapelike odor that is tolerable. Malodor occurs with wounds infected by other gram-negative organisms or anaerobic bacteria.15 Similarly, wounds covered by necrotic tissue smell like decaying flesh.
Three major causes
The three major causes of wound malodor are slough, infection, and exudate (Figure 1).
Slough is dead or necrotic tissue, usually resulting from vascular compromise. Arterial ulcers, pressure ulcers, and malignant wounds all form slough from capillary occlusion, subsequent ischemia, and tissue necrosis.
Infection. Devitalized tissue, an ideal medium in which bacteria thrive, becomes the source of infection. Anaerobic bacteria are usually implicated in malodor. These include Bacteroides fragilis, Bacteroides prevotella, Clostridium perfringens, and Fusobacterium nucleatum.16,17 Anaerobic organisms produce putrescine and cadaverine, which are largely responsible for the offensive odor.16,18 Volatile fatty acids such as propionic, butyric, isovaleric, and valeric acid are formed from lipid catabolism by anaerobes and add to malodor.17 Aerobic bacteria such as Proteus, Klebsiella, and Pseudomonas species supercolonize necrotic tissue as well and contribute to malodor.17,18
Exudate. Since nonhealing wounds undergo repeated cycles of inflammation, infection, and necrosis, accumulation of exudate becomes inevitable. Exudate typically is a pus-like fluid containing serum, fibrin, and white blood cells, which leak from blood vessels. In addition, bacteria that colonize chronic wounds filled with necrotic tissue activate proteases that degrade and liquefy dead tissue, thereby forming extensive amounts of exudate.19
Apart from slough, infection, and exudate, poor general hygiene and dressings left on for too long may contribute to malodor.16 Moisture-retentive dressings such as hydrocolloids leave an odor after removal. Dressings that liquefy upon contact with the wound surface leave a pus-like, potentially malodorous material.
MALODOR ASSESSMENT: DO YOU SMELL SOMETHING?
Various ways to document wound malodor can prove useful in guiding assessment and treatment. Descriptions such as “foul,” “putrid,” “fishy,” or “filled the room” vividly portray the initial presentation. A 10-point numerical scale similar to a numerical pain scale or a visual analogue scale can be used as a subjective measure.
Other grading methods, which to the authors’ knowledge are not validated, may be helpful. In a study that focused on patients suffering from malodorous gynecologic malignancies, von Gruenigen et al20 used a 0-to-3 scale:
- 0 Absent
- 1 Not offensive
- 2 Offensive but tolerable
- 3 Offensive and intolerable.
A scale often adapted by other authors was devised by Baker and Haig,21 which clearly defines four classes:
- 1 Strong—odor is evident upon entering the room (6 to 10 feet from the patient) with the dressing intact
- 2 Moderate—odor is evident upon entering the room with dressing removed
- 3 Slight—odor is evident at close proximity to the patient when the dressing is removed
- 4 No odor—no odor is evident, even at the patient’s bedside with the dressing removed.
COMPREHENSIVE MANAGEMENT: HOW DO WE WIN THE ‘RACE’?
The acronym RACE outlines an approach to dealing with malodor. It stands for removal of necrotic tissue; antibacterials; odor concealers; and education and support (Table 1).
Remove necrotic tissue
An important step in eliminating malodor is to remove necrotic tissue. This starts with debridement, which decreases the incidence of infection and hastens wound closure.22,23 Table 2 compares the different types of debridement.
Sharp or surgical debridement involves the use of a scalpel or scissors. This type of debridement may increase the risk of bleeding, pain, and malignant cell seeding in fungating wounds.4,24
Enzymatic debridement employs chemicals with proteolytic action (eg, collagenase) to digest extracellular proteins in wounds.18,25
Mechanical debridement involves aggressive therapies such as forceful irrigation and hydrotherapy, which may fail to discriminate between necrotic and viable tissues.18,26
Biological debridement using maggots, which ingest bacteria and devitalized tissue, may cause increased wound bleeding and may be unacceptable for patients and families.24,27
Autolytic debridement is often recommended, particularly if complete healing is not the primary goal.17,24,28,29 Autolysis uses proteolytic enzymes and phagocytic cells present in the wound bed and wound fluid to clear devitalized tissue. It is easy, inexpensive, noninvasive, and painless,4 and it requires less frequent dressing changes relative to standard dressing or wet-to-dry dressing.
Autolytic debridement is commonly accomplished using hydrocolloid and hydrogel dressings.15,29 Hydrocolloids are adhesive, occlusive, and conformable dressings that are suitable for wounds with low to moderate amounts of exudate. Upon contact with the wound surface, the dressing absorbs the exudate, forms a gel layer, and maintains a moist environment. Hydrocolloids are not recommended for infected wounds or for those with copious exudate as they may lead to maceration around the wound. A disadvantage of hydrocolloid dressings is their tendency to generate brown, often malodorous exudate when removed.
On the other hand, hydrogels in amorphous gel, dressing, sheet, or impregnated gauze form are water-based products that create a moist environment similar to hydrocolloids. Aside from causing minimal trauma to the wound bed when removed, the dressing’s cooling effect may bring some pain relief. Hydrogels are appropriate for dry wounds and for those with minimal exudate.
After debridement, the wound is cleansed and irrigated. A number of cleansers and solutions are available, but normal saline is a cheap alternative. To irrigate, experts recommend an 18- or 20-gauge intravenous catheter attached to a 30- or 60-mL syringe.15 This technique provides 8 to 15 psi of pressure, enough to cleanse the wound without causing tissue trauma.
Antibacterials and absorption
Antibacterials. Topical antibiotics have several advantages over systemic antibiotics in treating chronic wounds.30,31 These include a high and sustained concentration of the antimicrobial at the site of infection, limited potential for systemic absorption and toxicity, reduced potential for antibiotic resistance, and drawing of the patient’s and caregiver’s attention to the wound.
Metronidazole is the most widely used topical antibacterial for malodor management. Its efficacy is likely due to the predominant involvement of anaerobic bacteria in foul-smelling wounds. Topical metronidazole is available as a gel and as a cream. A systematic review showed that on average, topical metronidazole was used once daily for 14 consecutive days.19 The layer of topical metronidazole is typically covered with a nonadherent primary dressing followed by an absorbent secondary dressing.
The best clinical evidence for topical metronidazole consists of case reports and series.32–35 The largest of these studies was done by Finlay et al, who treated 47 patients with malodorous benign and malignant cutaneous wounds with 0.75% metronidazole gel daily.32 Forty-five (96%) of the patients reported significantly decreased odor by 14 days, as well as decreased pain, discharge, and surrounding cellulitis.
A randomized, placebo-controlled trial conducted by Bale et al had equivocal findings.9 All 41 patients who received metronidazole gel reported a decrease in malodor within 3 days of starting it. However, 76% of patients who received placebo also reported malodor control; in the final analysis, no significant difference was noted in the success rate between the two groups.
Metronidazole tablets can be crushed and sprinkled over the wound. As with metronidazole gel or cream, the crushed tablets are applied daily and covered by a primary nonadherent dressing and an absorbent secondary dressing. This off-label use of metronidazole serves as a cheaper alternative to commercially available topical preparations. To our knowledge, there has been no head-to-head trial comparing the two topical strategies.
Systemic metronidazole, often given orally, has been recommended if evidence of deep tissue or systemic infection is noted15 and in cases of fungating wounds with fistulas invading either the gastrointestinal or genitourinary tracts.18 Side effects such as nausea, neuropathy, and alcohol intolerance (ie, disulfiram reaction) may occur, which are not seen with topical metronidazole.
Both topical and systemic metronidazole can be used together on a time-limited basis for extensive malodorous wounds, such as fungating malignant wounds or stage IV sacral pressure ulcers.
Other antimicrobial agents used to treat malodor include silver-containing products, iodine-containing topical agents, mupirocin, bacitracin, neomycin, and polymyxin B.
Honey was used for wound care by the ancient Egyptians, and it is still used.36 Its beneficial effects include antimicrobial, debriding, deodorizing, anti-inflammatory, and granulation tissue-stimulating. Honey has even been shown to significantly decrease skin colonization with various kinds of bacteria, including methicillin-resistant Staphylococcus aureus.37 Medical-grade honey is preferred over table honey, as the latter is nonsterile and can contain Clostridium spores, which contaminate the wound.38
Yogurt and buttermilk lower the pH of the wound and control bacterial proliferation to control malodor.39,40 Either is applied for 10 to 15 minutes after the wound is cleansed and is then washed off thoroughly.
Absorbent dressings are used either over a layer of topical metronidazole and a nonadherent primary dressing or as a primary dressing itself. An absorbent dressing containing activated charcoal is used for rapid improvement, although cost may be prohibitive, especially in developing countries.13,19 Another type of absorbent dressing, composed of polyester impregnated with sodium chloride, has been found to be useful in malodor control.41 An important pointer is to maintain a tight seal around the absorbent dressing to prevent leakage of exudate.
Concealers
Aromatics used to conceal malodor include scented candles, incense, fragrant flowers and plants, and air-freshener sprays. When circumstances allow, candles are good options since they conceal malodor by emitting fragrance, and the flame burns off foul-smelling chemicals. Aromatics such as coffee beans, vanilla beans, and cider vinegar can be placed in a pan and left under the patient’s bed or close to it. Drops of peppermint oil or oil of wintergreen can be placed on wound dressings.
Other odor concealers are adsorbent materials that attract and cause ions and molecules to adhere to their surface. Examples are charcoal, baking soda, and cat litter. As with other aromatics, these materials are placed in pans and left under the bed or near the patient.
Aromatics can have disadvantages, as certain scents, especially strong ones, can be nauseating for patients. Some fragrances trigger asthma or skin irritation. Patients and caregivers can be left with an unpleasant association of certain fragrances with malodor by conditioning.15,17,18
Education and support
Concerns of the patient and family members need to be heard, addressed promptly, and reassessed with each visit, since uncontrolled malodor can be a chief source of caregiver fatigue.
Foremost in formulating a patient- and family-centered malodor management strategy is to commit to controlling malodor as much as possible. Regular follow-up appointments should be made, whether in the office or at home, to check on the patient’s progress and address new and ongoing concerns. Symptoms accompanying malodor, such as pain, bleeding, and sleep disturbance, need to be addressed, as they all affect quality of life.1 Audience-appropriate educational materials should be made available.26 Online resources that patients and families can explore include the websites of the Wound Ostomy and Continence Nurses Society (www.wocn.org) and the Association for the Advancement of Wound Care (aawconline.org).
Healthcare professionals need to be prepared to deal with problems and complications involving patients and family members that may arise in the course of treatment.12 Problems include the cost and local unavailability of dressing supplies, insurance coverage for dressings and topical agents, lack of assistance at home, and fear of changing dressings. A cardinal rule for healthcare providers is to avoid expressing distress at odors in front of or within hearing of patients and families.
OTHER STRATEGIES: WHAT ELSE CAN WE DO?
Curcumin, the main biologically active compound in the herb turmeric, applied directly to wounds three times daily as an ointment, has been shown to have odor-controlling properties.42
Sugar paste has been reported to control malodor by drawing out exudative and tissue fluid osmotically, and inhibiting bacterial growth.16,17 Water is mixed with sugar (ie, granulated, caster, or powdered) to form a paste, with additives like glycerin and polyethylene glycol used to alter the consistency. Thick clay-like paste is good for wounds with large cavities, while thin paste is useful for wounds with small or superficial openings. The paste is applied twice daily and is covered by an absorbent dressing.
Pressure relief is vital in managing pressure ulcers.18,43 Repositioning every 2 hours and using special devices, such as mattress overlays, alternating pressure mattresses, and low air loss mattresses, are frequently employed techniques.
If circumstances permit and when congruent with the patient’s goals of care, intra-arterial chemotherapy and radiotherapy can be contemplated for malignant fungating wounds.44,45
Other strategies include opening the windows during dressing changes, increasing the frequency of dressing changes, promptly removing used dressings from the house, and ensuring good general hygiene.
CASE RESOLUTION
After telling her that he was committed to control the malodor or, if possible, eliminate it, Mrs. A.’s doctor prepared two lists of materials—one for himself and one for Mrs. A.’s husband. He returned the next day, brought out his supplies, asked Mrs. A. to lie in bed, and invited her husband to assist him.
He cleansed and irrigated the breast lesion with normal saline, making sure to remove as much dead tissue as he could. He applied a layer of metronidazole cream to the wound cavity, then covered it with a nonadherent dressing. He then covered the wound with gauze, sealed the edges with medical adhesive tape, and applied a few drops of oil of wintergreen to the surface. A pan of charcoal briquettes was put under the bed, and a candle with Mrs. A.’s favorite scent was lit by the bedside. The physician then instructed Mrs. A.’s husband to repeat the procedure once daily for 1 week.
After 2 weeks, Mrs. A. and her husband said the foul odor had greatly decreased. She appeared more cheerful and energetic, especially after her grandchildren visited a few days earlier. The physician then instructed the husband to stop using metronidazole cream and to apply a hydrocolloid dressing every 3 days instead. He advised them to continue the rest of the process of applying a few drops of oil of wintergreen on the dressing surface, placing a pan of charcoal briquettes under the bed, and lighting a scented candle by the bedside.
FINISH THE RACE!
Complex nonhealing wounds are encountered across various healthcare settings. Wound malodor is an important component of nonhealing wounds, which adversely affects patients, families, and healthcare providers. Infection, slough, and exudate are the major causes of wound malodor. The essential steps to reduce malodor are to remove necrotic tissue, use antibacterial and odor-absorbing agents, apply appropriate odor “concealers,” educate families, and formulate a patient- and family-centered strategy (Table 1).
Acknowledgment: The authors would like to thank Sue Reif, CNP, for her assistance in completing the manuscript.
- Lo SF, Hayter M, Hu WY, Tai CY, Hsu MY, Li YF. Symptom burden and quality of life in patients with malignant fungating wounds. J Adv Nurs 2012; 68:1312–1321.
- Lazarus GS, Cooper DM, Knighton DR, et al. Definitions and guidelines for assessment of wounds and evaluation of healing. Arch Dermatol 1994; 130:489–493.
- Tippett AW. Wounds at the end of life. Wounds 2005; 17:91–98.
- Burt T. Palliative care of pressure ulcers in long-term care. Ann Long-Term Care 2013; 21:20–28.
- Reifsnyder J, Magee HS. Development of pressure ulcers in patients receiving home hospice care. Wounds 2005; 17:74–79.
- Haisfield-Wolfe ME, Rund C. Malignant cutaneous wounds: a management protocol. Ostomy Wound Manage 1997; 43:56–66.
- O’Brien C. Malignant wounds: managing odour. Can Fam Physician 2012; 58:272–274.
- Gethin G, Grocott P, Probst S, Clarke E. Current practice in the management of wound odour: an international survey. Int J Nurs Stud 2014; 51:865–874.
- Bale S, Tebble N, Price P. A topical metronidazole gel used to treat malodorous wounds. Br J Nurs 2004; 13:S4–S11.
- Hack A. Malodorous wounds—taking the patient’s perspective into account. J Wound Care 2003; 12:319–321.
- Price E. Wound care. The stigma of smell. Nurs Times 1996; 92:71–72.
- Paul JC, Pieper BA. Topical metronidazole for the treatment of wound odor: a review of the literature. Ostomy Wound Manage 2008; 54:18–27.
- Lee G, Anand SC, Rajendran S, Walker I. Overview of current practice and future trends in the evaluation of dressings for malodorous wounds. J Wound Care 2006; 15:344–346.
- Cutting K, Harding K. Criteria for identifying wound infection. J Wound Care 1994; 3:198–201.
- McDonald A, Lesage P. Palliative management of pressure ulcers and malignant wounds in patients with advanced illness. J Palliat Med 2006; 9:285–295.
- Holloway S. Recognising and treating the causes of chronic malodorous wounds. Prof Nurse 2004; 19:380–384.
- Haughton W, Young T. Common problems in wound care: malodorous wounds. Br J Nurs 1995; 4:959–963.
- Alvarez OM, Kalinski C, Nusbaum J, et al. Incorporating wound healing strategies to improve palliation (symptom management) in patients with chronic wounds. J Palliat Med 2007; 10:1161–1189.
- da Costa Santos CM, de Mattos Pimenta CA, Nobre MR. A systematic review of topical treatments to control the odor of malignant fungating wounds. J Pain Symptom Manage 2010; 39:1065–1076.
- Von Gruenigen VE, Coleman RL, et al. Bacteriology and treatment of malodorous lower reproductive tract in gynecologic cancer patients. Obstet Gynecol 2000; 96:23–27.
- Baker PG, Haig G. Metronidazole in the treatment of chronic pressure sores and ulcers: a comparison with standard treatment in general practice. Practitioner 1981; 225:569–573.
- Whitney J, Phillips L, Aslam R, et al. Guidelines for the treatment of pressure ulcers. Wound Repair Regen 2006; 14:663–679.
- Williams D, Enoch S, Miller D, Harris K, Price P, Harding KG. Effect of sharp debridement using curette on recalcitrant nonhealing venous ulcers: a concurrently controlled, prospective cohort study. Wound Repair Regen 2005; 13:131–137.
- Bergstrom KJ. Assessment and management of fungating wounds. J Wound Ostomy Continence Nurs 2011: 38:31–37.
- Sinclair RD, Ryan TJ. Proteolytic enzymes in wound healing: the role of enzymatic debridement. Australas J Dermatol 1994; 35:35–41.
- Enoch S, Harding KG. Wound bed preparation: the science behind the removal of barriers to healing. Wounds 2003;15:213–229.
- Mumcuoglu KY. Clinical applications for maggots in wound care. Am J Clin Dermatol 2001; 2:219–227.
- Langemo DK, Black J; National Pressure Ulcer Advisory Panel. Pressure ulcers in individuals receiving palliative care: a National Pressure Ulcer Advisory Panel white paper. Adv Skin Wound Care 2010; 23:59–72.
- Fonder MA, Lazarus GS, Cowan DA, Aronson-Cook B, Kohli AR, Mamelak AJ. Treating the chronic wound: a practical approach to the care of nonhealing wounds and wound care dressings. J Am Acad Dermatol 2008; 58:185–206.
- Lio PA, Kaye ET. Topical antibacterial agents. Infect Dis Clin North Am 2004; 18:717–733.
- Gelmetti C. Local antibiotics in dermatology. Dermatol Ther 2008; 21:187–195.
- Finlay IG, Bowszyc J, Ramlau C, Gwiezdzinski Z. The effect of topical 0.75% metronidazole gel on malodorous cutaneous ulcers. J Pain Symptom Manage 1996; 11:158–162.
- Bower M, Stein R, Evans TR, Hedley A, Pert P, Coombes RC. A double-blind study of the efficacy of metronidazole gel in the treatment of malodorous fungating tumours. Eur J Cancer 1992; 28A:888–889.
- Kalinski C, Schnepf M, Laboy D, et al. Effectiveness of a topical formulation containing metronidazole for wound odor and exudate control. Wounds 2005; 17:84–90.
- Kuge S, Tokuda Y, Ohta M, et al. Use of metronidazole gel to control malodor in advanced and recurrent breast cancer. Jpn J Clin Oncol 1996; 26:207–210.
- Belcher J. A review of medical-grade honey in wound care. Br J Nurs 2012: 21:S4–S9.
- Kwakman PH, Van den Akker JP, Güçlü A, et al. Medical-grade honey kills antibiotic-resistant bacteria in vitro and eradicates skin colonization. Clin Infect Dis 2008; 46:1677–1682.
- Cooper RA, Jenkins L. A comparison between medical grade honey and table honeys in relation to antimicrobial efficacy. Wounds 2009; 21:29–36.
- Patel B, Cox-Hayley D. Managing wound odor #218. J Palliat Med 2010; 13:1286–1287.
- Schulte MJ. Yogurt helps to control wound odor. Oncol Nurs Forum 1993; 20:1262.
- Upright CA, Salton C, Roberts F, Murphy J. Evaluation of Mesalt dressings and continuous wet saline dressings in ulcerating metastatic skin lesions. Cancer Nurs 1994; 17:149–155.
- Kuttan R, Sudheeran PC, Josph CD. Turmeric and curcumin as topical agents in cancer therapy. Tumori 1987; 73:29–31.
- Bass MJ, Phillips LG. Pressure sores. Curr Probl Surg 2007; 44:101–143.
- Bufill JA, Grace WR, Neff R. Intra-arterial chemotherapy for palliation of fungating breast cancer: a case report and review of the literature. Am J Clin Oncol 1994; 17:118–124.
- Murakami M, Kuroda Y, Sano A, et al. Validity of local treatment including intraarterial infusion chemotherapy and radiotherapy for fungating adenocarcinoma of the breast: case report of more than 8-year survival. Am J Clin Oncol 2001; 24:388–391.
KEY POINTS
- Necrotic tissue is a substrate for bacterial growth and should be debrided. A variety of methods can be used.
- Malodor is most often from infection with anaerobic organisms, which topical metronidazole and other agents can help control.
- An absorbent dressing should be used either as a primary dressing, or over a layer of topical metronidazole and a nonadherent primary dressing.
- Foremost in formulating a patient- and family-centered malodor management strategy is to commit to controlling it as much as possible.

E-cigarettes: Safe to recommend to patients?
Most people assume that electronic cigarettes (e-cigarettes) are safer than conventional tobacco products. Nevertheless, we should not encourage addicted smokers to try “vaping” as an alternative to nicotine replacement therapy, and we should discourage never-smokers from taking up vaping as vigorously as we try to discourage them from taking up smoking.
This article examines the prevailing assumptions and the evidence regarding the safety of e-cigarettes and traditional nicotine replacement therapy.
SMOKING IS DECLINING BUT FAR FROM GONE
While smoking rates have been declining over the past 50 years, the burden of disease attributable to tobacco use remains high. In the United States, it is estimated that nearly 6 million of those currently under the age of 18 will die of tobacco-related illnesses.1 In the 50 years since the US surgeon general first reported on the health concerns related to tobacco, smoking has claimed the lives of nearly 21 million Americans1 and continues to kill more than 400,000 every year.2
Even though the risks of smoking are well known, smoking remains one of the most difficult habits to quit. Indeed, about half of all smokers attempt to quit each year, but very few succeed.3
NICOTINE REPLACEMENT: GUM, PATCHES…E-CIGARETTES?
Nicotine replacement therapy was born out of the thought that, though nicotine is responsible for tobacco’s addictive quality, most tobacco-related disease is attributable to the 7,000 other substances found in tobacco smoke.4 Nicotine polacrilex gum was approved by the US Food and Drug Administration (FDA) in 1984, and nicotine transdermal film was approved in 1991.5
Nicotine replacement therapy, in the form of patches and gum, has been shown to improve the odds of successfully quitting smoking by a factor of nearly 1.5 to 2.6 Nicotine patches and gum were initially prescription medications but became available over the counter in 1996.7 They quickly became first-line agents for smoking cessation, and their over-the-counter availability softened any potential concerns about the possible deleterious health consequences of nicotine itself.
E-cigarettes—devices that generate a nicotine vapor that can be inhaled in a fashion that mimics the experience of smoking—were introduced in China in 2004.8 By 2012, sales of these devices in the United States had reached $500 million and in 2013 were expected to top $1 billion.9,10
E-cigarette manufacturers make no therapeutic claims about their products, thus allowing them to escape regulation by the FDA as nicotine replacement therapy. A recent FDA proposal, however, is likely to change their “protected” status.11 Despite the lack of regulation up to this point, patients generally assume that e-cigarettes are just another form of nicotine replacement therapy, even though they contain substances other than nicotine.
WHAT’S IN E-CIGARETTES?
Nicotine, which is bad in itself
E-cigarettes contain nicotine in varying amounts (some cartridges contain none at all). Though nicotine replacement therapy is less harmful than tobacco, nicotine by itself is associated with its own health problems, notably cancer, cardiovascular disease, birth defects (possibly), and poisoning.
Carcinogenesis. Nicotine plays a direct role in carcinogenesis through a variety of mechanisms, including increasing the activity of tumor growth-promoting transcription factors, decreasing apoptosis, and increasing angiogenesis in tumors.12 Additionally, specific types of nicotinic acetylcholine receptors— eg, alpha 7 receptors, which are stimulated by nicotine—are found in many malignant tumors and are thought to play a role in tumor progression.12 Blockade of alpha 7 nicotinic acetylcholine receptors has been shown to decrease the growth of certain cancers.12
However, these findings were from in vitro studies, and the concerns they raised have not been reflected in in vivo studies. Despite having been on the market for 30 years, nicotine replacement therapy has as yet not been associated with any “real world” increase in cancer risk.
Smoking is one of the leading risk factors for cervical cancer, and nicotine itself may play a contributing role. Nicotine has been shown to increase cellular proliferation in cervical cancer.13 Some evidence suggests that it may also play a role in the lymphogenic metastasis of cervical cancer.13
Cardiovascular disease. Nicotine has been linked to cardiovascular disease. It directly affects the heart’s rate and rhythm via nicotinic acetylcholine receptors in the peripheral autonomic nervous system. It impairs endothelial-dependent dilation of blood vessels in response to nitric oxide, and this inhibition in the coronary arteries may contribute to smoking-related heart disease.14,15 Nicotine has also been shown to raise serum cholesterol levels, increase clot formation, and contribute to plaque formation by increasing vascular smooth muscle.14
Possible teratogenic effect. There is some theoretical concern regarding exposure to nicotine in utero, as nicotinic acetylcholine receptors develop before neurons, and nicotine may therefore interfere with the natural influence of acetylcholine on the development of this system.14
Direct toxicity. Nicotine is toxic at high levels. The overdose potential associated with nicotine is particularly worrisome with e-cigarettes, as the nicotine solution they use is typically supplied in 5-mL, 10-mL, or 20-mL vials that range in concentration from 8.5 to 22.2 mg of nicotine per mL.16 The fatal single dose range of nicotine has been reported at 30 to 60 mg in adults and 10 mg in children and can be achieved by oral, intravenous, or transdermal absorption,16 so one vial, if consumed orally, could be fatal.
The number of calls to US poison control centers regarding e-cigarettes has increased, closely paralleling their rise in popularity. In 2010, there were only 30 e-cigarette related calls to poison control centers; in 2011 the number increased to 269, and in 2012 it had reached 459 and included one fatality that was deemed a suicide.17–19 Even though such toxic nicotine overdoses are rare, physicians should exercise caution and avoid recommending e-cigarettes to individuals with mental confusion, psychotic disorders, or suicidality, who might consume an entire vial.
Possible positive effects? Smoking is one of the worst things that people can do to their body, but the picture is complicated by a few possible positive effects. In the brain, although smoking increases the risk of Alzheimer disease, it is associated with a lower risk of Parkinson disease. In the bowel, it increases the risk of Crohn disease but may decrease the risk of ulcerative colitis. Gahring and Rogers20 pointed out that neuronal nicotinic receptors are present in nonneuronal cells throughout the body and proposed that expression of these receptors may play a role in mediating the consequences of nicotine use, both good and bad. The lesson may be that nicotine is very active in the body, its effects are complicated and still incompletely understood, and therefore we should not encourage people to inhale nicotine products ad lib.
Additives
E-cigarettes typically contain propylene glycol, flavorings, and glycerine. One study that analyzed the additive contents of e-cigarettes found that propylene glycol accounted for 66% of the fluid, glycerine 24%, and flavorings less than 0.1%.21 Propylene glycol is the substance typically used in theater fog machines and is used to generate the vapor in e-cigarettes. Other substances such as tobacco-specific nitrosamines and diethylene glycol have also been found in e-cigarettes in small amounts.22
Propylene glycol, ‘generally recognized as safe’
Propylene glycol has been used in theater fog machines for years—think Phantom of the Opera. It is also widely used as a solvent in many consumer products and pharmaceuticals. The FDA classified it as “generally recognized as safe” on the basis of one study conducted in rats and monkeys over 60 years ago.23 As other authors have noted, however, a major manufacturer of propylene glycol recommends that exposure to propylene glycol mist be avoided.24,25 Potential concern over propylene glycol mist was heightened when it was discovered that of all industries, the entertainment business ranked first in terms of work-related asthma symptoms and had the fifth-highest rate of wheezing.26,27
Studies conducted over the last several decades have raised numerous health concerns about the safety of propylene glycol (Table 1).26,28–36 The studies of propylene glycol fog are particularly important, as they most closely resemble the route of exposure in e-cigarette users.
Wieslander et al28 exposed 27 volunteers to propylene glycol mist for 1 minute in an aircraft simulator under training conditions. Exposures were high, ranging from 176 to 851 mg/m3 (mean = 309 mg/m3). Four volunteers who developed a cough exhibited evidence of airway obstruction as indicated by a 5% decrease in forced expiratory volume in 1 second (FEV1), while the rest did not exhibit any change in FEV1.
Moline et al29 conducted a non-peer-reviewed study for the Actors Equity Association and the League of American Theaters and Producers of 439 actors exposed to theater fog. They found statistically significant evidence of throat and vocal cord inflammation with prolonged peak exposure to glycols and recommended that actors not be exposed to glycol concentrations exceeding 40 mg/m3.
Varughese et al26 conducted a study in 101 volunteers at 19 sites. The mean concentration of glycol-based fog was much lower than that in the studies by Wieslander et al28 and Moline et al,29 at 0.49 mg/m3 (the maximum was 3.22 mg/m3). The investigators concluded that glycol-based fog was associated with deleterious respiratory effects and that employees’ exposure should be limited.
The health issues related to propylene glycol are unique to e-cigarettes compared with nicotine replacement therapy. Unfortunately, the most applicable data available are from studies of persons exposed to theater fog, which involved periodic exposure and likely do not emulate the deep inhalation, multiple times daily, of propylene glycol by e-cigarette smokers. A 2014 review of the chemistry of contaminants in e-cigarettes37 concluded that estimated levels of propylene glycol exposure in e-cigarette users come close to the threshold limit value set by the American Conference of Governmental Industrial Hygienists, and should merit concern.
These studies and real-life experience in the theater, while limited in scope, should give physicians pause and should cause increased awareness of the possibility of e-cigarette-induced pulmonary and upper airway complications. If such complications should occur, discontinuation of vaping should be advised.
Contaminants
The issue of adulterants is common to both e-cigarettes and nicotine replacement therapy. Several unlisted substances have been found in analyzed samples of e-cigarette fluid, including tobacco-specific nitrosamines (TSNAs), diethylene glycol (found in only one e-cigarette cartridge), cotinine, anabasine, myosmine, and beta-nicotyrine.22 The tobacco-specific nitrosamines N´-nitrosonornicotine (NNN), 4-(methylnitrosamino)-1-(3-pyridyl)-1-butanone (NNK), N-nitrosoanabasine, and nitrosoanatabine have been found in five e-cigarette cartridge samples from two manufacturers in amounts similar to those found in nicotine replacement products.22
Goniewicz et al38 tested the vapor generated by 12 e-cigarette brands and found trace amounts of TSNAs. NNN was present in the vapor of eight of the samples in concentrations ranging from 0.8 to 4.3 ng per 150 puffs, and NNK in the vapor of nine of the samples in concentrations ranging from 1.1 to 28.3 ng per 150 puffs. Neither NNN nor NNK was found in blank samples nor with the Nicorette inhalator tested in the same study.38
Because TNSAs can be formed from nicotine and its metabolites, there is also concern that cancer-causing nitrosamines may be formed from nicotine after it is absorbed into the body (ie, endogenously). While endogenous formation of NNK from nicotine has never been demonstrated, endogenous formation of NNN has been seen in some nicotine patch users.39 The presence of these nitrosamines has raised concern that e-cigarettes and nicotine replacement therapy may have carcinogenic potential. The amounts of tobacco-specific nitrosamines found in e-cigarettes are also found in some nicotine replacement products.40
Investigators have examined a possible connection between e-cigarettes and potentially carcinogenic carbonyl compounds, including formaldehyde, acetaldehyde, and acrolein. Formaldehyde (a known carcinogen) and acetaldehyde (a potential carcinogen) have been detected in e-cigarette cartridges and vapor.38,41–43 Acrolein, a mucosal irritant, has been found in e-cigarette vapor.38,43 Goniewicz et al38 suggested that acrolein may be formed by the heating of the glycerin contained in the e-cigarette solution.
An extensive review of the studies of possible contaminant exposures (including polycylic aromatic hydrocarbons, TSNAs, volatile organic compounds, diethylene glycol, and inorganic compounds) with e-cigarette use according to occupational hygiene standards concluded that there was no cause for concern about increased health risk.37 The study by Goniewicz et al also concluded that using e-cigarettes instead of traditional cigarettes may significantly reduce exposure to some tobacco-specific toxins.38
E-CIGARETTES VS NICOTINE REPLACEMENT
Traditional nicotine replacement therapy products are regulated by the FDA and therefore standardized in terms of their contents. E-cigarettes, on the other hand, are unregulated vehicles for supplying nicotine, and may pose other health risks. One such risk is related to exposure to propylene glycol, which has never been studied under conditions (in terms of mode of delivery, frequency of dosing, and total duration of exposure) that approximate the exposure associated with e-cigarettes. Furthermore, the high concentration of nicotine in e-cigarette fluid poses a real risk of toxicity and potentially fatal overdose.
Nicotine replacement therapy and e-cigarettes both maintain addiction to nicotine if used in a harm-reduction strategy as a maintenance medication. Whether the ongoing nicotine addiction makes it more likely that individuals would switch back and forth between nicotine replacement and tobacco-based products is not clear. Also not known is whether e-cigarettes may serve as the “gateway drug” by which teens enter into nicotine addiction, but we believe that the potential exists, as these products are potentially more appealing in terms of the lack of pungent smell, the perception of safety, and the variety of flavors of e-cigarettes.
The efficacy of nicotine replacement therapy in improving smoking cessation has been reviewed extensively elsewhere37 and is beyond the scope of this article. E-cigarettes may be appealing to many cigarette smokers because they deliver smokeless nicotine, and they more closely emulate the actual experience of smoking compared with traditional nicotine replacement therapy. Though some evidence suggests that e-cigarettes may be modestly effective in helping tobacco smokers quit nicotine, they are not FDA-approved for smoking cessation and are not marketed for that indication.44 Medical practitioners should see them for what they are: a new nicotine product with a novel delivery system that is not approved as treatment. Because of the inherent risks involved with e-cigarettes, medical practitioners are best advised to remain neutral on the relative value of e-cigarettes and should continue to motivate patients to discontinue nicotine use altogether.
- US Department of Health and Human Services, Centers for Disease Control and Prevention, National Center for Chronic Disease Prevention and Health Promotion, Office on Smoking and Health. The health consequences of smoking—50 years of progress: a report of the Surgeon General. Atlanta, GA; 2014.
- Batra A, Klingler K, Landfeldt B, Friederich HM, Westin A, Danielsson T. Smoking reduction treatment with 4-mg nicotine gum: a double-blind, randomized, placebo-controlled study. Clin Pharmacol Ther 2005; 78:689–696.
- Blondal T, Gudmundsson LJ, Olafsdottir I, Gustavsson G, Westin A. Nicotine nasal spray with nicotine patch for smoking cessation: randomised trial with six year follow up. BMJ 1999; 318:285–288.
- US Department of Health and Human Services, Centers for Disease Control and Prevention, National Center for Chronic Disease Prevention and Health Promotion, Office on Smoking and Health. How tobacco smoke causes disease: the biology and behavioral basis for smoking-attributable disease: a report of the Surgeon General. Atlanta, GA; 2010.
- US Food and Drug Administration (FDA). Drugs@FDA. FDA approved drug products. www.accessdata.fda.gov/scripts/cder/drugsatfda/. Accessed May 31, 2015.
- Stead LF, Perera R, Bullen C, et al. Nicotine replacement therapy for smoking cessation. Cochrane Database Syst Rev 2012; 11:CD000146.
- US Department of Health and Human Services, Food and Drug Administration. Now available without a prescription. www.fda.gov/Drugs/ResourcesForYou/Consumers/ucm143547.htm. Accessed May 31, 2015.
- McQueen A, Tower S, Sumner W. Interviews with “vapers”: implications for future research with electronic cigarettes. Nicotine Tob Res 2011; 13:860–867.
- Kamerow D. Big Tobacco lights up e-cigarettes. BMJ 2013; 346:f3418.
- Robehmed N. E-cigarette sales surpass $1 billion as big tobacco moves in. Forbes. www.forbes.com/sites/natalierobehmed/2013/09/17/e-cigarette-sales-surpass-1-billion-as-big-tobacco-moves-in/. Accessed May 31, 2015.
- US Department of Health and Human Services, Food and Drug Administration. Deeming tobacco products to be subject to the Federal Food, Drug, and Cosmetic Act, as amended by the family smoking prevention and tobacco control act; regulations on the sale and distribution of tobacco products and required warning statements for tobacco products; proposed rule. Federal Register 2014; 79:23141–23207.
- Petros WP, Younis IR, Ford JN, Weed SA. Effects of tobacco smoking and nicotine on cancer treatment. Pharmacotherapy 2012; 32:920–931.
- Lane D, Gray EA, Mathur RS, Mathur SP. Up-regulation of vascular endothelial growth factor-C by nicotine in cervical cancer cell lines. Am J Reprod Immunol 2005; 53:153–158.
- Ginzel KH, Maritz GS, Marks DF, et al. Critical review: nicotine for the fetus, the infant and the adolescent? J Health Psychol 2007; 12:215–224.
- Neunteufl T, Heher S, Kostner K, et al. Contribution of nicotine to acute endothelial dysfunction in long-term smokers. J Am Coll Cardiol 2002; 39:251–256.
- Cameron JM, Howell DN, White JR, Andrenyak DM, Layton ME, Roll JM. Variable and potentially fatal amounts of nicotine in e-cigarette nicotine solutions. Tob Control 2014; 23:77–78.
- Bronstein AC, Spyker DA, Cantilena LR Jr, Green JL, Rumack BH, Dart RC. 2010 Annual Report of the American Association of Poison Control Centers’ National Poison Data System (NPDS): 28th Annual Report. Clin Toxicol (Phila) 2011; 49:910–941.
- Bronstein AC, Spyker DA, Cantilena LR Jr, Rumack BH, Dart RC. 2011 Annual Report of the American Association of Poison Control Centers’ National Poison Data System (NPDS): 29th Annual Report. Clin Toxicol (Phila) 2012; 50:911–1164.
- Mowry JB, Spyker DA, Cantilena LR Jr, Bailey JE, Ford M. 2012 Annual Report of the American Association of Poison Control Centers’ National Poison Data System (NPDS): 30th Annual Report. Clin Toxicol (Phila) 2013; 51:949–1229.
- Gahring LC, Rogers SW. Neuronal nicotinic acetylcholine receptor expression and function on nonneuronal cells. AAPS J 2006; 7:E885–E894.
- Pellegrino RM, Tinghino B, Mangiaracina G, et al. Electronic cigarettes: an evaluation of exposure to chemicals and fine particulate matter (PM). Ann Ig 2012; 24:279–288.
- Westenberger BJ. Evaluation of e-cigarettes. St. Louis, MO: Department of Health and Human Services, Food and Drug Administration, Center for Drug Evaluation and Research, Division of Pharmaceutical Analysis, 2009. www.fda.gov/downloads/drugs/scienceresearch/ucm173250.pdf. Accessed May 31, 2015.
- Robertson OH, Loosli CG, Puck TT, et al. Tests for the chronic toxicity of propylene glycol and triethylene glycol on monkeys and rats by vapor inhalation and oral administration. J Pharmacol Exp Ther 1947; 91:52–76.
- Riker CA, Lee K, Darville A, Hahn EJ. E-cigarettes: promise or peril? Nurs Clin North Am 2012; 47:159–171.
- Dow Chemical Company. A Guide to Glycols. http://msdssearch.dow.com/PublishedLiteratureDOWCOM/dh_091b/0901b8038091b508.pdf?filepath=propyleneglycol/pdfs/noreg/117-01682.pdf&fromPage=GetDoc. Accessed May 31, 2015.
- Varughese S, Teschke K, Brauer M, Chow Y, van Netten C, Kennedy SM. Effects of theatrical smokes and fogs on respiratory health in the entertainment industry. Am J Ind Med 2005; 47:411–418.
- Arif AA, Whitehead LW, Delclos GL, Tortolero SR, Lee ES. Prevalence and risk factors of work related asthma by industry among United States workers: data from the third national health and nutrition examination survey (1988-94). Occup Environ Med 2002; 59:505–511.
- Wieslander G, Norbäck D, Lindgren T. Experimental exposure to propylene glycol mist in aviation emergency training: acute ocular and respiratory effects. Occup Environ Med 2001; 58:649–655.
- Moline JM, Golden Al, Highland JH, Wilmarth KR, Kao AS. Health effects evaluation of theatrical smoke, haze and pyrotechnics. Prepared for Actor’s Equity Pension and Health Trust Funds. www.equityleague.org/PDF/smokehaze/execsummary.pdf. Accessed May 31, 2015.
- Funk JO, Maibach HI. Propylene glycol dermatitis: re-evaluation of an old problem. Contact Dermatitis 1994; 31:236–241.
- Connolly M, Buckley DA. Contact dermatitis from propylene glycol in ECG electrodes, complicated by medicament allergy. Contact Dermatitis 2004; 50:42.
- Skaare A, Kjaerheim V, Barkvoll P, Rølla G. Skin reactions and irritation potential of four commercial toothpastes. Acta Odontol Scand 1997; 55:133–136.
- Peleg O, Bar-Oz B, Arad I. Coma in a premature infant associated with the transdermal absorption of propylene glycol. Acta Paediatr 1998; 87:1195–1196.
- Fisher AA. Systemic contact dermatitis caused by ingestion of certain foods in propylene glycol-sensitive patients. Am J Contact Dermat 1996; 7:259.
- Demey HE, Daelemans RA, Verpooten GA, et al. Propylene glycol-induced side effects during intravenous nitroglycerin therapy. Intensive Care Med 1988; 14:221–226.
- Demey H, Daelemans R, De Broe ME, Bossaert L. Propyleneglycol intoxication due to intravenous nitroglycerin. Lancet 1984; 1:1360.
- Burstyn I. Peering through the mist: systematic review of what the chemistry of contaminants in electronic cigarettes tells us about health risks. BMC Public Health 2014;14:18.
- Goniewicz ML, Knysak J, Gawron M, et al. Levels of selected carcinogens and toxicants in vapour from electronic cigarettes. Tob Control 2014; 23:133–139.
- Stepanov I, Carmella SG, Han S, et al. Evidence for endogenous formation of N’-nitrosonornicotine in some long-term nicotine patch users. Nicotine Tob Res 2009; 11:99–105.
- Cahn Z, Siegel M. Electronic cigarettes as a harm reduction strategy for tobacco control: a step forward or a repeat of past mistakes? J Public Health Policy 2011; 32:16–31.
- Coulson H. Analysis of components from Gamucci electronic cigarette cartridges, tobacco flavor regular smoking liquid 2009. Report number: E98D. LPD Lab Service. March 3, 2009. http://truthaboutecigs.com/science/7.pdf. Accessed May 31, 2015.
- Laugesen M. Safety report on the Ruyan e-cigarette cartridge and inhaled aerosol. Christchurch, New Zealand: Health New Zealand Ltd., October 30, 2008. www.healthnz.co.nz/RuyanCartridgeReport30-Oct-08.pdf. Accessed May 31, 2015.
- Uchiyama S, Inaba Y, Kunugita N. Determination of acrolein and other carbonyls in cigarette smoke using coupled silica cartridges impregnated with hydroquinone and 2,4-dinitrophenylhydrazine. J Chromatogr A 2010; 1217:4383–4388.
- Bhatnagar A, Whitsel LP, Ribisl KM, et al; American Heart Association Advocacy Coordinating Committee, Council on Cardiovascular and Stroke Nursing, Council on Clinical Cardiology, and Council on Quality of Care and Outcomes Research. Electronic cigarettes: a policy statement from the American Heart Association. Circulation 2014; 130:1418–1436.
Most people assume that electronic cigarettes (e-cigarettes) are safer than conventional tobacco products. Nevertheless, we should not encourage addicted smokers to try “vaping” as an alternative to nicotine replacement therapy, and we should discourage never-smokers from taking up vaping as vigorously as we try to discourage them from taking up smoking.
This article examines the prevailing assumptions and the evidence regarding the safety of e-cigarettes and traditional nicotine replacement therapy.
SMOKING IS DECLINING BUT FAR FROM GONE
While smoking rates have been declining over the past 50 years, the burden of disease attributable to tobacco use remains high. In the United States, it is estimated that nearly 6 million of those currently under the age of 18 will die of tobacco-related illnesses.1 In the 50 years since the US surgeon general first reported on the health concerns related to tobacco, smoking has claimed the lives of nearly 21 million Americans1 and continues to kill more than 400,000 every year.2
Even though the risks of smoking are well known, smoking remains one of the most difficult habits to quit. Indeed, about half of all smokers attempt to quit each year, but very few succeed.3
NICOTINE REPLACEMENT: GUM, PATCHES…E-CIGARETTES?
Nicotine replacement therapy was born out of the thought that, though nicotine is responsible for tobacco’s addictive quality, most tobacco-related disease is attributable to the 7,000 other substances found in tobacco smoke.4 Nicotine polacrilex gum was approved by the US Food and Drug Administration (FDA) in 1984, and nicotine transdermal film was approved in 1991.5
Nicotine replacement therapy, in the form of patches and gum, has been shown to improve the odds of successfully quitting smoking by a factor of nearly 1.5 to 2.6 Nicotine patches and gum were initially prescription medications but became available over the counter in 1996.7 They quickly became first-line agents for smoking cessation, and their over-the-counter availability softened any potential concerns about the possible deleterious health consequences of nicotine itself.
E-cigarettes—devices that generate a nicotine vapor that can be inhaled in a fashion that mimics the experience of smoking—were introduced in China in 2004.8 By 2012, sales of these devices in the United States had reached $500 million and in 2013 were expected to top $1 billion.9,10
E-cigarette manufacturers make no therapeutic claims about their products, thus allowing them to escape regulation by the FDA as nicotine replacement therapy. A recent FDA proposal, however, is likely to change their “protected” status.11 Despite the lack of regulation up to this point, patients generally assume that e-cigarettes are just another form of nicotine replacement therapy, even though they contain substances other than nicotine.
WHAT’S IN E-CIGARETTES?
Nicotine, which is bad in itself
E-cigarettes contain nicotine in varying amounts (some cartridges contain none at all). Though nicotine replacement therapy is less harmful than tobacco, nicotine by itself is associated with its own health problems, notably cancer, cardiovascular disease, birth defects (possibly), and poisoning.
Carcinogenesis. Nicotine plays a direct role in carcinogenesis through a variety of mechanisms, including increasing the activity of tumor growth-promoting transcription factors, decreasing apoptosis, and increasing angiogenesis in tumors.12 Additionally, specific types of nicotinic acetylcholine receptors— eg, alpha 7 receptors, which are stimulated by nicotine—are found in many malignant tumors and are thought to play a role in tumor progression.12 Blockade of alpha 7 nicotinic acetylcholine receptors has been shown to decrease the growth of certain cancers.12
However, these findings were from in vitro studies, and the concerns they raised have not been reflected in in vivo studies. Despite having been on the market for 30 years, nicotine replacement therapy has as yet not been associated with any “real world” increase in cancer risk.
Smoking is one of the leading risk factors for cervical cancer, and nicotine itself may play a contributing role. Nicotine has been shown to increase cellular proliferation in cervical cancer.13 Some evidence suggests that it may also play a role in the lymphogenic metastasis of cervical cancer.13
Cardiovascular disease. Nicotine has been linked to cardiovascular disease. It directly affects the heart’s rate and rhythm via nicotinic acetylcholine receptors in the peripheral autonomic nervous system. It impairs endothelial-dependent dilation of blood vessels in response to nitric oxide, and this inhibition in the coronary arteries may contribute to smoking-related heart disease.14,15 Nicotine has also been shown to raise serum cholesterol levels, increase clot formation, and contribute to plaque formation by increasing vascular smooth muscle.14
Possible teratogenic effect. There is some theoretical concern regarding exposure to nicotine in utero, as nicotinic acetylcholine receptors develop before neurons, and nicotine may therefore interfere with the natural influence of acetylcholine on the development of this system.14
Direct toxicity. Nicotine is toxic at high levels. The overdose potential associated with nicotine is particularly worrisome with e-cigarettes, as the nicotine solution they use is typically supplied in 5-mL, 10-mL, or 20-mL vials that range in concentration from 8.5 to 22.2 mg of nicotine per mL.16 The fatal single dose range of nicotine has been reported at 30 to 60 mg in adults and 10 mg in children and can be achieved by oral, intravenous, or transdermal absorption,16 so one vial, if consumed orally, could be fatal.
The number of calls to US poison control centers regarding e-cigarettes has increased, closely paralleling their rise in popularity. In 2010, there were only 30 e-cigarette related calls to poison control centers; in 2011 the number increased to 269, and in 2012 it had reached 459 and included one fatality that was deemed a suicide.17–19 Even though such toxic nicotine overdoses are rare, physicians should exercise caution and avoid recommending e-cigarettes to individuals with mental confusion, psychotic disorders, or suicidality, who might consume an entire vial.
Possible positive effects? Smoking is one of the worst things that people can do to their body, but the picture is complicated by a few possible positive effects. In the brain, although smoking increases the risk of Alzheimer disease, it is associated with a lower risk of Parkinson disease. In the bowel, it increases the risk of Crohn disease but may decrease the risk of ulcerative colitis. Gahring and Rogers20 pointed out that neuronal nicotinic receptors are present in nonneuronal cells throughout the body and proposed that expression of these receptors may play a role in mediating the consequences of nicotine use, both good and bad. The lesson may be that nicotine is very active in the body, its effects are complicated and still incompletely understood, and therefore we should not encourage people to inhale nicotine products ad lib.
Additives
E-cigarettes typically contain propylene glycol, flavorings, and glycerine. One study that analyzed the additive contents of e-cigarettes found that propylene glycol accounted for 66% of the fluid, glycerine 24%, and flavorings less than 0.1%.21 Propylene glycol is the substance typically used in theater fog machines and is used to generate the vapor in e-cigarettes. Other substances such as tobacco-specific nitrosamines and diethylene glycol have also been found in e-cigarettes in small amounts.22
Propylene glycol, ‘generally recognized as safe’
Propylene glycol has been used in theater fog machines for years—think Phantom of the Opera. It is also widely used as a solvent in many consumer products and pharmaceuticals. The FDA classified it as “generally recognized as safe” on the basis of one study conducted in rats and monkeys over 60 years ago.23 As other authors have noted, however, a major manufacturer of propylene glycol recommends that exposure to propylene glycol mist be avoided.24,25 Potential concern over propylene glycol mist was heightened when it was discovered that of all industries, the entertainment business ranked first in terms of work-related asthma symptoms and had the fifth-highest rate of wheezing.26,27
Studies conducted over the last several decades have raised numerous health concerns about the safety of propylene glycol (Table 1).26,28–36 The studies of propylene glycol fog are particularly important, as they most closely resemble the route of exposure in e-cigarette users.
Wieslander et al28 exposed 27 volunteers to propylene glycol mist for 1 minute in an aircraft simulator under training conditions. Exposures were high, ranging from 176 to 851 mg/m3 (mean = 309 mg/m3). Four volunteers who developed a cough exhibited evidence of airway obstruction as indicated by a 5% decrease in forced expiratory volume in 1 second (FEV1), while the rest did not exhibit any change in FEV1.
Moline et al29 conducted a non-peer-reviewed study for the Actors Equity Association and the League of American Theaters and Producers of 439 actors exposed to theater fog. They found statistically significant evidence of throat and vocal cord inflammation with prolonged peak exposure to glycols and recommended that actors not be exposed to glycol concentrations exceeding 40 mg/m3.
Varughese et al26 conducted a study in 101 volunteers at 19 sites. The mean concentration of glycol-based fog was much lower than that in the studies by Wieslander et al28 and Moline et al,29 at 0.49 mg/m3 (the maximum was 3.22 mg/m3). The investigators concluded that glycol-based fog was associated with deleterious respiratory effects and that employees’ exposure should be limited.
The health issues related to propylene glycol are unique to e-cigarettes compared with nicotine replacement therapy. Unfortunately, the most applicable data available are from studies of persons exposed to theater fog, which involved periodic exposure and likely do not emulate the deep inhalation, multiple times daily, of propylene glycol by e-cigarette smokers. A 2014 review of the chemistry of contaminants in e-cigarettes37 concluded that estimated levels of propylene glycol exposure in e-cigarette users come close to the threshold limit value set by the American Conference of Governmental Industrial Hygienists, and should merit concern.
These studies and real-life experience in the theater, while limited in scope, should give physicians pause and should cause increased awareness of the possibility of e-cigarette-induced pulmonary and upper airway complications. If such complications should occur, discontinuation of vaping should be advised.
Contaminants
The issue of adulterants is common to both e-cigarettes and nicotine replacement therapy. Several unlisted substances have been found in analyzed samples of e-cigarette fluid, including tobacco-specific nitrosamines (TSNAs), diethylene glycol (found in only one e-cigarette cartridge), cotinine, anabasine, myosmine, and beta-nicotyrine.22 The tobacco-specific nitrosamines N´-nitrosonornicotine (NNN), 4-(methylnitrosamino)-1-(3-pyridyl)-1-butanone (NNK), N-nitrosoanabasine, and nitrosoanatabine have been found in five e-cigarette cartridge samples from two manufacturers in amounts similar to those found in nicotine replacement products.22
Goniewicz et al38 tested the vapor generated by 12 e-cigarette brands and found trace amounts of TSNAs. NNN was present in the vapor of eight of the samples in concentrations ranging from 0.8 to 4.3 ng per 150 puffs, and NNK in the vapor of nine of the samples in concentrations ranging from 1.1 to 28.3 ng per 150 puffs. Neither NNN nor NNK was found in blank samples nor with the Nicorette inhalator tested in the same study.38
Because TNSAs can be formed from nicotine and its metabolites, there is also concern that cancer-causing nitrosamines may be formed from nicotine after it is absorbed into the body (ie, endogenously). While endogenous formation of NNK from nicotine has never been demonstrated, endogenous formation of NNN has been seen in some nicotine patch users.39 The presence of these nitrosamines has raised concern that e-cigarettes and nicotine replacement therapy may have carcinogenic potential. The amounts of tobacco-specific nitrosamines found in e-cigarettes are also found in some nicotine replacement products.40
Investigators have examined a possible connection between e-cigarettes and potentially carcinogenic carbonyl compounds, including formaldehyde, acetaldehyde, and acrolein. Formaldehyde (a known carcinogen) and acetaldehyde (a potential carcinogen) have been detected in e-cigarette cartridges and vapor.38,41–43 Acrolein, a mucosal irritant, has been found in e-cigarette vapor.38,43 Goniewicz et al38 suggested that acrolein may be formed by the heating of the glycerin contained in the e-cigarette solution.
An extensive review of the studies of possible contaminant exposures (including polycylic aromatic hydrocarbons, TSNAs, volatile organic compounds, diethylene glycol, and inorganic compounds) with e-cigarette use according to occupational hygiene standards concluded that there was no cause for concern about increased health risk.37 The study by Goniewicz et al also concluded that using e-cigarettes instead of traditional cigarettes may significantly reduce exposure to some tobacco-specific toxins.38
E-CIGARETTES VS NICOTINE REPLACEMENT
Traditional nicotine replacement therapy products are regulated by the FDA and therefore standardized in terms of their contents. E-cigarettes, on the other hand, are unregulated vehicles for supplying nicotine, and may pose other health risks. One such risk is related to exposure to propylene glycol, which has never been studied under conditions (in terms of mode of delivery, frequency of dosing, and total duration of exposure) that approximate the exposure associated with e-cigarettes. Furthermore, the high concentration of nicotine in e-cigarette fluid poses a real risk of toxicity and potentially fatal overdose.
Nicotine replacement therapy and e-cigarettes both maintain addiction to nicotine if used in a harm-reduction strategy as a maintenance medication. Whether the ongoing nicotine addiction makes it more likely that individuals would switch back and forth between nicotine replacement and tobacco-based products is not clear. Also not known is whether e-cigarettes may serve as the “gateway drug” by which teens enter into nicotine addiction, but we believe that the potential exists, as these products are potentially more appealing in terms of the lack of pungent smell, the perception of safety, and the variety of flavors of e-cigarettes.
The efficacy of nicotine replacement therapy in improving smoking cessation has been reviewed extensively elsewhere37 and is beyond the scope of this article. E-cigarettes may be appealing to many cigarette smokers because they deliver smokeless nicotine, and they more closely emulate the actual experience of smoking compared with traditional nicotine replacement therapy. Though some evidence suggests that e-cigarettes may be modestly effective in helping tobacco smokers quit nicotine, they are not FDA-approved for smoking cessation and are not marketed for that indication.44 Medical practitioners should see them for what they are: a new nicotine product with a novel delivery system that is not approved as treatment. Because of the inherent risks involved with e-cigarettes, medical practitioners are best advised to remain neutral on the relative value of e-cigarettes and should continue to motivate patients to discontinue nicotine use altogether.
- US Department of Health and Human Services, Centers for Disease Control and Prevention, National Center for Chronic Disease Prevention and Health Promotion, Office on Smoking and Health. The health consequences of smoking—50 years of progress: a report of the Surgeon General. Atlanta, GA; 2014.
- Batra A, Klingler K, Landfeldt B, Friederich HM, Westin A, Danielsson T. Smoking reduction treatment with 4-mg nicotine gum: a double-blind, randomized, placebo-controlled study. Clin Pharmacol Ther 2005; 78:689–696.
- Blondal T, Gudmundsson LJ, Olafsdottir I, Gustavsson G, Westin A. Nicotine nasal spray with nicotine patch for smoking cessation: randomised trial with six year follow up. BMJ 1999; 318:285–288.
- US Department of Health and Human Services, Centers for Disease Control and Prevention, National Center for Chronic Disease Prevention and Health Promotion, Office on Smoking and Health. How tobacco smoke causes disease: the biology and behavioral basis for smoking-attributable disease: a report of the Surgeon General. Atlanta, GA; 2010.
- US Food and Drug Administration (FDA). Drugs@FDA. FDA approved drug products. www.accessdata.fda.gov/scripts/cder/drugsatfda/. Accessed May 31, 2015.
- Stead LF, Perera R, Bullen C, et al. Nicotine replacement therapy for smoking cessation. Cochrane Database Syst Rev 2012; 11:CD000146.
- US Department of Health and Human Services, Food and Drug Administration. Now available without a prescription. www.fda.gov/Drugs/ResourcesForYou/Consumers/ucm143547.htm. Accessed May 31, 2015.
- McQueen A, Tower S, Sumner W. Interviews with “vapers”: implications for future research with electronic cigarettes. Nicotine Tob Res 2011; 13:860–867.
- Kamerow D. Big Tobacco lights up e-cigarettes. BMJ 2013; 346:f3418.
- Robehmed N. E-cigarette sales surpass $1 billion as big tobacco moves in. Forbes. www.forbes.com/sites/natalierobehmed/2013/09/17/e-cigarette-sales-surpass-1-billion-as-big-tobacco-moves-in/. Accessed May 31, 2015.
- US Department of Health and Human Services, Food and Drug Administration. Deeming tobacco products to be subject to the Federal Food, Drug, and Cosmetic Act, as amended by the family smoking prevention and tobacco control act; regulations on the sale and distribution of tobacco products and required warning statements for tobacco products; proposed rule. Federal Register 2014; 79:23141–23207.
- Petros WP, Younis IR, Ford JN, Weed SA. Effects of tobacco smoking and nicotine on cancer treatment. Pharmacotherapy 2012; 32:920–931.
- Lane D, Gray EA, Mathur RS, Mathur SP. Up-regulation of vascular endothelial growth factor-C by nicotine in cervical cancer cell lines. Am J Reprod Immunol 2005; 53:153–158.
- Ginzel KH, Maritz GS, Marks DF, et al. Critical review: nicotine for the fetus, the infant and the adolescent? J Health Psychol 2007; 12:215–224.
- Neunteufl T, Heher S, Kostner K, et al. Contribution of nicotine to acute endothelial dysfunction in long-term smokers. J Am Coll Cardiol 2002; 39:251–256.
- Cameron JM, Howell DN, White JR, Andrenyak DM, Layton ME, Roll JM. Variable and potentially fatal amounts of nicotine in e-cigarette nicotine solutions. Tob Control 2014; 23:77–78.
- Bronstein AC, Spyker DA, Cantilena LR Jr, Green JL, Rumack BH, Dart RC. 2010 Annual Report of the American Association of Poison Control Centers’ National Poison Data System (NPDS): 28th Annual Report. Clin Toxicol (Phila) 2011; 49:910–941.
- Bronstein AC, Spyker DA, Cantilena LR Jr, Rumack BH, Dart RC. 2011 Annual Report of the American Association of Poison Control Centers’ National Poison Data System (NPDS): 29th Annual Report. Clin Toxicol (Phila) 2012; 50:911–1164.
- Mowry JB, Spyker DA, Cantilena LR Jr, Bailey JE, Ford M. 2012 Annual Report of the American Association of Poison Control Centers’ National Poison Data System (NPDS): 30th Annual Report. Clin Toxicol (Phila) 2013; 51:949–1229.
- Gahring LC, Rogers SW. Neuronal nicotinic acetylcholine receptor expression and function on nonneuronal cells. AAPS J 2006; 7:E885–E894.
- Pellegrino RM, Tinghino B, Mangiaracina G, et al. Electronic cigarettes: an evaluation of exposure to chemicals and fine particulate matter (PM). Ann Ig 2012; 24:279–288.
- Westenberger BJ. Evaluation of e-cigarettes. St. Louis, MO: Department of Health and Human Services, Food and Drug Administration, Center for Drug Evaluation and Research, Division of Pharmaceutical Analysis, 2009. www.fda.gov/downloads/drugs/scienceresearch/ucm173250.pdf. Accessed May 31, 2015.
- Robertson OH, Loosli CG, Puck TT, et al. Tests for the chronic toxicity of propylene glycol and triethylene glycol on monkeys and rats by vapor inhalation and oral administration. J Pharmacol Exp Ther 1947; 91:52–76.
- Riker CA, Lee K, Darville A, Hahn EJ. E-cigarettes: promise or peril? Nurs Clin North Am 2012; 47:159–171.
- Dow Chemical Company. A Guide to Glycols. http://msdssearch.dow.com/PublishedLiteratureDOWCOM/dh_091b/0901b8038091b508.pdf?filepath=propyleneglycol/pdfs/noreg/117-01682.pdf&fromPage=GetDoc. Accessed May 31, 2015.
- Varughese S, Teschke K, Brauer M, Chow Y, van Netten C, Kennedy SM. Effects of theatrical smokes and fogs on respiratory health in the entertainment industry. Am J Ind Med 2005; 47:411–418.
- Arif AA, Whitehead LW, Delclos GL, Tortolero SR, Lee ES. Prevalence and risk factors of work related asthma by industry among United States workers: data from the third national health and nutrition examination survey (1988-94). Occup Environ Med 2002; 59:505–511.
- Wieslander G, Norbäck D, Lindgren T. Experimental exposure to propylene glycol mist in aviation emergency training: acute ocular and respiratory effects. Occup Environ Med 2001; 58:649–655.
- Moline JM, Golden Al, Highland JH, Wilmarth KR, Kao AS. Health effects evaluation of theatrical smoke, haze and pyrotechnics. Prepared for Actor’s Equity Pension and Health Trust Funds. www.equityleague.org/PDF/smokehaze/execsummary.pdf. Accessed May 31, 2015.
- Funk JO, Maibach HI. Propylene glycol dermatitis: re-evaluation of an old problem. Contact Dermatitis 1994; 31:236–241.
- Connolly M, Buckley DA. Contact dermatitis from propylene glycol in ECG electrodes, complicated by medicament allergy. Contact Dermatitis 2004; 50:42.
- Skaare A, Kjaerheim V, Barkvoll P, Rølla G. Skin reactions and irritation potential of four commercial toothpastes. Acta Odontol Scand 1997; 55:133–136.
- Peleg O, Bar-Oz B, Arad I. Coma in a premature infant associated with the transdermal absorption of propylene glycol. Acta Paediatr 1998; 87:1195–1196.
- Fisher AA. Systemic contact dermatitis caused by ingestion of certain foods in propylene glycol-sensitive patients. Am J Contact Dermat 1996; 7:259.
- Demey HE, Daelemans RA, Verpooten GA, et al. Propylene glycol-induced side effects during intravenous nitroglycerin therapy. Intensive Care Med 1988; 14:221–226.
- Demey H, Daelemans R, De Broe ME, Bossaert L. Propyleneglycol intoxication due to intravenous nitroglycerin. Lancet 1984; 1:1360.
- Burstyn I. Peering through the mist: systematic review of what the chemistry of contaminants in electronic cigarettes tells us about health risks. BMC Public Health 2014;14:18.
- Goniewicz ML, Knysak J, Gawron M, et al. Levels of selected carcinogens and toxicants in vapour from electronic cigarettes. Tob Control 2014; 23:133–139.
- Stepanov I, Carmella SG, Han S, et al. Evidence for endogenous formation of N’-nitrosonornicotine in some long-term nicotine patch users. Nicotine Tob Res 2009; 11:99–105.
- Cahn Z, Siegel M. Electronic cigarettes as a harm reduction strategy for tobacco control: a step forward or a repeat of past mistakes? J Public Health Policy 2011; 32:16–31.
- Coulson H. Analysis of components from Gamucci electronic cigarette cartridges, tobacco flavor regular smoking liquid 2009. Report number: E98D. LPD Lab Service. March 3, 2009. http://truthaboutecigs.com/science/7.pdf. Accessed May 31, 2015.
- Laugesen M. Safety report on the Ruyan e-cigarette cartridge and inhaled aerosol. Christchurch, New Zealand: Health New Zealand Ltd., October 30, 2008. www.healthnz.co.nz/RuyanCartridgeReport30-Oct-08.pdf. Accessed May 31, 2015.
- Uchiyama S, Inaba Y, Kunugita N. Determination of acrolein and other carbonyls in cigarette smoke using coupled silica cartridges impregnated with hydroquinone and 2,4-dinitrophenylhydrazine. J Chromatogr A 2010; 1217:4383–4388.
- Bhatnagar A, Whitsel LP, Ribisl KM, et al; American Heart Association Advocacy Coordinating Committee, Council on Cardiovascular and Stroke Nursing, Council on Clinical Cardiology, and Council on Quality of Care and Outcomes Research. Electronic cigarettes: a policy statement from the American Heart Association. Circulation 2014; 130:1418–1436.
KEY POINTS
- Although the vapor from e-cigarettes does not contain any tobacco combustion products, which are believed to be responsible for most of the adverse health effects of smoking, it does contain nicotine, which is addictive and poses health risks by itself.
- E-cigarette vapor also contains propylene glycol, which has not been adequately studied with regard to its safety when inhaled deeply and repeatedly. Also present are a variety of additives and contaminants.
- E-cigarette manufacturers make no therapeutic claims about their products, and therefore the US Food and Drug Administration does not regulate them as it does nicotine replacement therapy.

Starting insulin in patients with type 2 diabetes: An individualized approach
Insulin therapy is one of the most effective tools clinicians can use to help patients reach their individualized hemoglobin A1c target. However, decisions about when and how to start insulin therapy have to be individualized to the needs and goals of each patient. Many insulin options are available, one of the most common being the addition of basal insulin to oral antidiabetic drugs. Although patients are often reluctant to start insulin, this reluctance can be overcome through patient education and hands-on training.
Here, we review hemoglobin A1c targets, factors that determine when to start insulin therapy, and the different regimens that can be used.
MOST PATIENTS EVENTUALLY NEED INSULIN
Type 2 diabetes mellitus is a chronic progressive disease associated with insulin resistance, beta-cell dysfunction, and decreased insulin secretion. Consequently, most patients eventually require insulin therapy to reduce the risk of long-term complications.

The efficacy of therapy can be assessed by measuring hemoglobin A1c, an important marker of the chronic hyperglycemic state. The hemoglobin A1c value can be reported as a ratio (%) standardized against the results of the Diabetes Control and Complications Trial,1 or as International Federation of Clinical Chemistry units (mmol/mol).2 Table 1 shows the relationship between hemoglobin A1c and average glucose values.3
WHAT IS AN APPROPRIATE HEMOGLOBIN A1c TARGET?
The short answer is, “It depends.”
Currently, the American Association of Clinical Endocrinologists (AACE) supports a hemoglobin A1c goal of less than 6.5% for otherwise healthy patients but states that the goal should be individualized for patients with concurrent illnesses or at risk of hypoglycemia.4
On the other hand, the American Diabetes Association (ADA) recommends a higher hemoglobin A1c target of less than 7% for most adults with type 2 diabetes mellitus.5 This value was shown to be associated with a reduction in the microvascular and macrovascular complications of diabetes.
Yet when three large trials6–8 recently compared intensive and standard glucose control regimens, tighter glucose control failed to improve cardiovascular outcomes. Moreover, in one of the trials,7 patients receiving intensive treatment had a higher rate of all-cause mortality. Details:
- Action in Diabetes and Vascular Disease (ADVANCE): 11,140 patients; average hemoglobin A1c levels 6.5% vs 7.3%6
- Action to Control Cardiovascular Risk in Diabetes (ACCORD): 10,251 patients; average hemoglobin A1c levels 6.4% vs 7.5%7
- Veterans Affairs Diabetes Trial (VADT): 1,791 patients; average hemoglobin A1c levels 6.9% vs 8.4%.8
Similarly, a 2013 Cochrane review9 that included 28 randomized controlled trials concluded that intensive control (in 18,717 patients) did not decrease all-cause and cardiovascular mortality rates compared with traditional glucose control (in 16,195 patients), and it increased the risk of hypoglycemia and serious adverse events.
As a result, the ADA5 states that a hemoglobin A1c target less than 6.5% is optional for patients with a long life expectancy, short duration of diabetes, low risk of hypoglycemia, and no significant cardiovascular disease. The ADA further defines a hemoglobin A1c goal of less than 8% for patients with a history of severe hypoglycemia, limited life expectancy, advanced microvascular or macrovascular complications, extensive comorbid conditions, and long-standing diabetes.
Therefore, the AACE and ADA are moving away from “one-size-fits-all” goals and toward individualizing their recommendations.
WHEN SHOULD INSULIN BE STARTED?
Physicians should consider the needs and preferences of each patient and individualize the treatment. The most recent recommendations from the ADA5 stress the importance of a patient-centered approach, with multiple factors taken into account. These include the patient’s attitude, expected compliance with treatment, risk of hypoglycemia, disease duration, life expectancy, and comorbidities, and the side effects of oral medications and insulin.
Compared with previous guidelines, there are fewer rules on how and when to start insulin therapy. But absolute and relative indications for insulin therapy should be considered in patients with the following:
Absolute indications for insulin
- Ketoacidosis or catabolic symptoms, including ketonuria
- Newly diagnosed type 2 diabetes with pronounced hyperglycemia (glucose ≥ 300 mg/dL or hemoglobin A1c ≥ 10.0%) with or without severe symptoms, including weight loss, polyuria, or polydipsia10
- Uncontrolled type 2 diabetes mellitus despite using one, two, or more oral antidiabetic drugs or glucagon-like peptide 1 (GLP-1) receptor agonists
- Gestational diabetes
- Preference for insulin.
Relative indications for insulin
- Hospitalized for surgery or acute illnesses
- Advanced renal or hepatic disease
- Inability to afford the cost or tolerate the side effects of oral antidiabetic drugs and GLP-1 receptor agonists.

Depending on the situation, blood glucose is measured fasting, before meals, or after meals after initiating or adjusting insulin regimens (Table 2).
WHAT ARE THE INSULIN REGIMENS?
Basal insulin
In the early stages of type 2 diabetes, metformin alone or in combination with another oral antidiabetic drug or with a GLP-1 receptor agonist is often used along with healthy eating, weight control, and increased physical activity.
When the target hemoglobin A1c cannot be achieved with one or two noninsulin drugs, the ADA suggests basal insulin be added to metformin or a two-medication regimen that includes metformin (Table 3). However, recent evidence suggests that combining a GLP-1 receptor agonist with basal insulin, in a regimen without metformin, is safe and improves glycemic control without hypoglycemia or weight gain.11
While a total daily dose of insulin of 0.1 to 0.2 units/kg could be initially used in patients with a hemoglobin A1c level less than 8%, a higher dose of 0.2 to 0.3 units/kg is required if the hemoglobin A1c level is between 8% and 10%. The dose can be titrated once or twice weekly if the fasting glucose is above the target level (usually < 130 mg/dL). If hypoglycemia develops (glucose < 70 mg/dL), the insulin dose should be reduced by 10% to 20%.10
Available basal insulins include glargine, detemir, and neutral protamine Hagedorn (NPH) (Table 4).12–14 Because glargine and detemir offer better pharmacokinetic properties, less variability in response, and less risk of hypoglycemia, they are preferred over NPH. Glargine has a relatively constant plasma concentration over 24 hours, allowing once-daily dosing at any time during the day (Figure 1).15 The dose should be taken at the same time every day. Detemir and NPH are usually taken once or twice daily.

Patients treated once daily should take the dose with the evening meal or at bedtime. Patients who require a twice-daily regimen can take the first dose with breakfast and the second one with the evening meal, at bedtime, or 12 hours after the morning dose.
The randomized Treat-to-Target trial,16 in 756 patients, showed that both glargine and NPH, when added to oral therapy in patients with type 2 diabetes, achieve the target hemoglobin A1c, but NPH is associated with more episodes of nocturnal hypoglycemia. Similar results were found when NPH was compared with detemir insulin.17
A Cochrane review18 suggested that glargine and detemir are similar in efficacy and safety. However, detemir often needs to be injected twice daily, in a higher dose, and is associated with less weight gain. Furthermore, a meta-analysis of 46 randomized clinical trials19 showed that the weight increase at 1 year is less in patients treated with basal than with twice-daily or prandial regimens.
A noninterventional longitudinal study20 in 2,179 patients newly started on insulin showed that the mean weight increase at 1 year was 1.78 kg, and 24% of patients gained more than 5 kg. However, the factors independently associated with the weight gain were a higher hemoglobin A1c at baseline, a higher insulin dose at baseline and at 1 year, and a lower baseline body mass index, but not the type of insulin regimen.
Currently, a new class of ultralong-acting basal insulins is being studied. Insulins in this class are approved in other countries, but the US Food and Drug Administration requires additional data for approval. Ultralong-acting insulins are expected to reduce the risk of hypoglycemia, specifically the risk of nocturnal episodes. Also, given their longer duration of action and stable steady-state pharmacokinetics, they will offer flexibility in the dose timing.21
Basal-bolus regimens
Basal insulin often does not control postprandial hyperglycemia. The need for multiple doses of insulin (including one or more preprandial doses) is suggested by postprandial glucose values above target (usually > 180 mg/dL) or by a hemoglobin A1c above goal despite well-controlled fasting glucose levels. This usually becomes evident when the total daily dose of basal insulin exceeds 0.5 units/kg. Patients newly diagnosed with diabetes who have a hemoglobin A1c higher than 10% may also respond better to an initial basal-bolus regimen.
Available bolus insulins include lispro, aspart, glulisine, regular insulin, and the newly approved Technosphere inhaled regular insulin (Table 4).12–14 They can be taken before each meal, and the total bolus dose usually represents 50% of the total daily dose.22 Rapid-acting insulins have faster onset, shorter duration of action, and more predictable pharmacokinetics, which makes them preferable to regular insulin (Figure 1).15 Inhaled insulin is another option, but it is contraindicated in patients with chronic obstructive pulmonary disease or asthma because of the increased risk of acute bronchospasm.12
Alternatively, the transition to a basal-bolus regimen can be accomplished with a single dose of bolus insulin before the main meal, using a dose that represents approximately 10% of the total daily dose. Additional bolus doses can be added later based on the glycemic control. The adjustment of the preprandial insulin dose is done once or twice weekly, based on the postprandial glucose levels.10
Premixed combinations of long- and short-acting insulins in ratios of 50% to 50%, 70% to 30%, or 75% to 25% can be considered in patients who cannot adhere to a complex insulin regimen. A propensity-matched comparison of different insulin regimens (basal, premixed, mealtime plus basal, and mealtime) in patients with type 2 diabetes revealed that the hemoglobin A1c reduction was similar between the different groups.23 However, the number of hypoglycemic episodes was higher in the premixed insulin group, and the weight gain was less in the basal insulin group.
While premixed insulins require fewer injections, they do not provide dosing flexibility. In other words, dose adjustments for premixed insulins lead to increases in both basal and bolus amounts even though a dose adjustment is needed for only one insulin type. Thus, this is a common reason for increased hypoglycemic episodes.
Continuous subcutaneous insulin infusion
A meta-analysis showed that continuous subcutaneous insulin infusion (ie, use of an insulin pump) was similar to intensive therapy with multiple daily insulin injections in terms of glycemic control and hypoglycemia.24 Since both options can lead to similar glucose control, additional factors to consider when initiating insulin infusion include lifestyle and technical expertise. Some patients may or may not prefer having a pump attached for nearly all daily activities. Additionally, this type of therapy is complex and requires significant training to ensure efficacy and safety.25
WHAT IS THE COST OF INSULIN THERAPY?
A final factor to keep in mind when initiating insulin is cost (Table 4).12–14 Asking patients to check their prescription insurance formulary is important to ensure that an affordable option is selected. If patients do not have prescription insurance, medication assistance programs could be an option. However, if a patient is considering an insulin pump, insurance coverage is essential. Depending on the manufacturer, insulin pumps cost about $6,000 to $7,000, and the additional monthly supplies for the pump are also expensive.
If patients are engaged when considering and selecting insulin therapy, the likelihood of treatment success is greater.26–28
- The Diabetes Control and Complications Trial Research Group. The effect of intensive treatment of diabetes on the development and progression of long-term complications in insulin-dependent diabetes mellitus. N Engl J Med 1993; 329:977–986.
- Hanas R, John WG; International HbA1c Consensus Committee. 2013 Update on the worldwide standardization of the hemoglobin A1c measurement. Pediatr Diabetes 2014; 15:e1–e2.
- Nathan DM, Kuenen J, Borg R, Zheng H, Schoenfeld D, Heine RJ; A1c-Derived Average Glucose Study Group. Translating the A1C assay into estimated average glucose values. Diabetes Care 2008; 31:1473–1478.
- Garber AJ, Abrahamson MJ, Barzilay JI, et al; American Association of Clinical Endocrinologists. AACE comprehensive diabetes management algorithm 2013. Endocr Pract 2013; 19:327–336.
- American Diabetes Association. Standards of medical care in diabetes—2014. Diabetes Care 2014; 37(suppl 1):S14–S80.
- ADVANCE Collaborative Group; Patel A, MacMahon S, Chalmers J, et al. Intensive blood glucose control and vascular outcomes in patients with type 2 diabetes. N Engl J Med 2008; 358:2560–2572.
- Action to Control Cardiovascular Risk in Diabetes Study Group; Gerstein HC, Miller ME, Byington RP, et al. Effects of intensive glucose lowering in type 2 diabetes. N Engl J Med 2008; 358:2545–2559.
- Duckworth W, Abraira C, Moritz T, et al; VADT Investigators. Glucose control and vascular complications in veterans with type 2 diabetes. N Engl J Med 2009; 360:129–139.
- Hemmingsen B, Lund SS, Gluud C, et al. Targeting intensive glycaemic control versus targeting conventional glycaemic control for type 2 diabetes mellitus. Cochrane Database Syst Rev 2013; 11:CD008143.
- Inzucchi SE, Bergenstal RM, Buse JB, et al; American Diabetes Association (ADA); European Association for the Study of Diabetes (EASD). Management of hyperglycemia in type 2 diabetes: a patient-centered approach: position statement of the American Diabetes Association (ADA) and the European Association for the Study of Diabetes (EASD). Diabetes Care 2012; 35:1364–1379.
- Vora J, Bain SC, Damci T, et al. Incretin-based therapy in combination with basal insulin: a promising tactic for the treatment of type 2 diabetes. Diabetes Metab 2013; 39:6–15.
- Nuffer W, Trujillo JM, Ellis SL. Technosphere insulin (Afrezza): a new, inhaled prandial insulin. Ann Pharmacother 2015; 49:99–106.
- Pharmacist’s Letter/Prescriber’s Letter. Comparison of insulins and injectable diabetes meds. PL Detail-Document #281107 November 2012. www.PharmacistsLetter.com. Accessed July 2, 2015
- Lexicomp Online. www.wolterskluwercdi.com/lexicomp-online/. Accessed July 2, 2015.
- Hirsch IB. Insulin analogues. N Engl J Med 2005; 352:174-183.
- Riddle MC, Rosenstock J, Gerich J; Insulin Glargine 4002 Study Investigators. The treat-to-target trial: randomized addition of glargine or human NPH insulin to oral therapy of type 2 diabetic patients. Diabetes Care 2003; 26:3080–3086.
- Hermansen K, Davies M, Derezinski T, Martinez Ravn G, Clauson P, Home P. A 26-week, randomized, parallel, treat-to-target trial comparing insulin detemir with NPH insulin as add-on therapy to oral glucose-lowering drugs in insulin-naive people with type 2 diabetes. Diabetes Care 2006; 29:1269–1274.
- Swinnen SG, Simon AC, Holleman F, Hoekstra JB, Devries JH. Insulin detemir versus insulin glargine for type 2 diabetes mellitus. Cochrane Database Syst Rev 2011; 7:CD006383.
- Pontiroli AE, Miele L, Morabito A. Increase of body weight during the first year of intensive insulin treatment in type 2 diabetes: systematic review and meta-analysis. Diabetes Obes Metab 2011; 13:1008–1019.
- Balkau B, Home PD, Vincent M, Marre M, Freemantle N. Factors associated with weight gain in people with type 2 diabetes starting on insulin. Diabetes Care 2014; 37:2108–2113.
- Garber AJ. Will the next generation of basal insulins offer clinical advantages? Diabetes Obes Metab 2014; 16:483–491.
- Tamaki M, Shimizu T, Kanazawa A, et al. Effects of changes in basal/total daily insulin ratio in type 2 diabetes patients on intensive insulin therapy including insulin glargine (JUN-LAN Study 6). Diabetes Res Clin Pract 2008; 81:e1–e3.
- Freemantle N, Balkau B, Home PD. A propensity score matched comparison of different insulin regimens 1 year after beginning insulin in people with type 2 diabetes. Diabetes Obes Metab 2013; 15:1120–1127.
- Yeh HC, Brown TT, Maruthur N, et al. Comparative effectiveness and safety of methods of insulin delivery and glucose monitoring for diabetes mellitus: a systematic review and meta-analysis. Ann Intern Med 2012; 157:336–347.
- Schade DS, Valentine V. To pump or not to pump. Diabetes Care 2002; 25:2100–2102.
- Liu L, Lee MJ, Brateanu A. Improved A1C and lipid profile in patients referred to diabetes education programs in a wide health care network: a retrospective study. Diabetes Spectr 2014; 27:297–303.
- Funnell MM, Kruger DF, Spencer M. Self-management support for insulin therapy in type 2 diabetes. Diabetes Educ 2004; 30:274–280.
- Norris SL, Engelgau MM, Narayan KM. Effectiveness of self-management training in type 2 diabetes: a systematic review of randomized controlled trials. Diabetes Care 2001; 24:561–587.
Insulin therapy is one of the most effective tools clinicians can use to help patients reach their individualized hemoglobin A1c target. However, decisions about when and how to start insulin therapy have to be individualized to the needs and goals of each patient. Many insulin options are available, one of the most common being the addition of basal insulin to oral antidiabetic drugs. Although patients are often reluctant to start insulin, this reluctance can be overcome through patient education and hands-on training.
Here, we review hemoglobin A1c targets, factors that determine when to start insulin therapy, and the different regimens that can be used.
MOST PATIENTS EVENTUALLY NEED INSULIN
Type 2 diabetes mellitus is a chronic progressive disease associated with insulin resistance, beta-cell dysfunction, and decreased insulin secretion. Consequently, most patients eventually require insulin therapy to reduce the risk of long-term complications.
The efficacy of therapy can be assessed by measuring hemoglobin A1c, an important marker of the chronic hyperglycemic state. The hemoglobin A1c value can be reported as a ratio (%) standardized against the results of the Diabetes Control and Complications Trial,1 or as International Federation of Clinical Chemistry units (mmol/mol).2 Table 1 shows the relationship between hemoglobin A1c and average glucose values.3
WHAT IS AN APPROPRIATE HEMOGLOBIN A1c TARGET?
The short answer is, “It depends.”
Currently, the American Association of Clinical Endocrinologists (AACE) supports a hemoglobin A1c goal of less than 6.5% for otherwise healthy patients but states that the goal should be individualized for patients with concurrent illnesses or at risk of hypoglycemia.4
On the other hand, the American Diabetes Association (ADA) recommends a higher hemoglobin A1c target of less than 7% for most adults with type 2 diabetes mellitus.5 This value was shown to be associated with a reduction in the microvascular and macrovascular complications of diabetes.
Yet when three large trials6–8 recently compared intensive and standard glucose control regimens, tighter glucose control failed to improve cardiovascular outcomes. Moreover, in one of the trials,7 patients receiving intensive treatment had a higher rate of all-cause mortality. Details:
- Action in Diabetes and Vascular Disease (ADVANCE): 11,140 patients; average hemoglobin A1c levels 6.5% vs 7.3%6
- Action to Control Cardiovascular Risk in Diabetes (ACCORD): 10,251 patients; average hemoglobin A1c levels 6.4% vs 7.5%7
- Veterans Affairs Diabetes Trial (VADT): 1,791 patients; average hemoglobin A1c levels 6.9% vs 8.4%.8
Similarly, a 2013 Cochrane review9 that included 28 randomized controlled trials concluded that intensive control (in 18,717 patients) did not decrease all-cause and cardiovascular mortality rates compared with traditional glucose control (in 16,195 patients), and it increased the risk of hypoglycemia and serious adverse events.
As a result, the ADA5 states that a hemoglobin A1c target less than 6.5% is optional for patients with a long life expectancy, short duration of diabetes, low risk of hypoglycemia, and no significant cardiovascular disease. The ADA further defines a hemoglobin A1c goal of less than 8% for patients with a history of severe hypoglycemia, limited life expectancy, advanced microvascular or macrovascular complications, extensive comorbid conditions, and long-standing diabetes.
Therefore, the AACE and ADA are moving away from “one-size-fits-all” goals and toward individualizing their recommendations.
WHEN SHOULD INSULIN BE STARTED?
Physicians should consider the needs and preferences of each patient and individualize the treatment. The most recent recommendations from the ADA5 stress the importance of a patient-centered approach, with multiple factors taken into account. These include the patient’s attitude, expected compliance with treatment, risk of hypoglycemia, disease duration, life expectancy, and comorbidities, and the side effects of oral medications and insulin.
Compared with previous guidelines, there are fewer rules on how and when to start insulin therapy. But absolute and relative indications for insulin therapy should be considered in patients with the following:
Absolute indications for insulin
- Ketoacidosis or catabolic symptoms, including ketonuria
- Newly diagnosed type 2 diabetes with pronounced hyperglycemia (glucose ≥ 300 mg/dL or hemoglobin A1c ≥ 10.0%) with or without severe symptoms, including weight loss, polyuria, or polydipsia10
- Uncontrolled type 2 diabetes mellitus despite using one, two, or more oral antidiabetic drugs or glucagon-like peptide 1 (GLP-1) receptor agonists
- Gestational diabetes
- Preference for insulin.
Relative indications for insulin
- Hospitalized for surgery or acute illnesses
- Advanced renal or hepatic disease
- Inability to afford the cost or tolerate the side effects of oral antidiabetic drugs and GLP-1 receptor agonists.
Depending on the situation, blood glucose is measured fasting, before meals, or after meals after initiating or adjusting insulin regimens (Table 2).
WHAT ARE THE INSULIN REGIMENS?
Basal insulin
In the early stages of type 2 diabetes, metformin alone or in combination with another oral antidiabetic drug or with a GLP-1 receptor agonist is often used along with healthy eating, weight control, and increased physical activity.
When the target hemoglobin A1c cannot be achieved with one or two noninsulin drugs, the ADA suggests basal insulin be added to metformin or a two-medication regimen that includes metformin (Table 3). However, recent evidence suggests that combining a GLP-1 receptor agonist with basal insulin, in a regimen without metformin, is safe and improves glycemic control without hypoglycemia or weight gain.11
While a total daily dose of insulin of 0.1 to 0.2 units/kg could be initially used in patients with a hemoglobin A1c level less than 8%, a higher dose of 0.2 to 0.3 units/kg is required if the hemoglobin A1c level is between 8% and 10%. The dose can be titrated once or twice weekly if the fasting glucose is above the target level (usually < 130 mg/dL). If hypoglycemia develops (glucose < 70 mg/dL), the insulin dose should be reduced by 10% to 20%.10
Available basal insulins include glargine, detemir, and neutral protamine Hagedorn (NPH) (Table 4).12–14 Because glargine and detemir offer better pharmacokinetic properties, less variability in response, and less risk of hypoglycemia, they are preferred over NPH. Glargine has a relatively constant plasma concentration over 24 hours, allowing once-daily dosing at any time during the day (Figure 1).15 The dose should be taken at the same time every day. Detemir and NPH are usually taken once or twice daily.
Patients treated once daily should take the dose with the evening meal or at bedtime. Patients who require a twice-daily regimen can take the first dose with breakfast and the second one with the evening meal, at bedtime, or 12 hours after the morning dose.
The randomized Treat-to-Target trial,16 in 756 patients, showed that both glargine and NPH, when added to oral therapy in patients with type 2 diabetes, achieve the target hemoglobin A1c, but NPH is associated with more episodes of nocturnal hypoglycemia. Similar results were found when NPH was compared with detemir insulin.17
A Cochrane review18 suggested that glargine and detemir are similar in efficacy and safety. However, detemir often needs to be injected twice daily, in a higher dose, and is associated with less weight gain. Furthermore, a meta-analysis of 46 randomized clinical trials19 showed that the weight increase at 1 year is less in patients treated with basal than with twice-daily or prandial regimens.
A noninterventional longitudinal study20 in 2,179 patients newly started on insulin showed that the mean weight increase at 1 year was 1.78 kg, and 24% of patients gained more than 5 kg. However, the factors independently associated with the weight gain were a higher hemoglobin A1c at baseline, a higher insulin dose at baseline and at 1 year, and a lower baseline body mass index, but not the type of insulin regimen.
Currently, a new class of ultralong-acting basal insulins is being studied. Insulins in this class are approved in other countries, but the US Food and Drug Administration requires additional data for approval. Ultralong-acting insulins are expected to reduce the risk of hypoglycemia, specifically the risk of nocturnal episodes. Also, given their longer duration of action and stable steady-state pharmacokinetics, they will offer flexibility in the dose timing.21
Basal-bolus regimens
Basal insulin often does not control postprandial hyperglycemia. The need for multiple doses of insulin (including one or more preprandial doses) is suggested by postprandial glucose values above target (usually > 180 mg/dL) or by a hemoglobin A1c above goal despite well-controlled fasting glucose levels. This usually becomes evident when the total daily dose of basal insulin exceeds 0.5 units/kg. Patients newly diagnosed with diabetes who have a hemoglobin A1c higher than 10% may also respond better to an initial basal-bolus regimen.
Available bolus insulins include lispro, aspart, glulisine, regular insulin, and the newly approved Technosphere inhaled regular insulin (Table 4).12–14 They can be taken before each meal, and the total bolus dose usually represents 50% of the total daily dose.22 Rapid-acting insulins have faster onset, shorter duration of action, and more predictable pharmacokinetics, which makes them preferable to regular insulin (Figure 1).15 Inhaled insulin is another option, but it is contraindicated in patients with chronic obstructive pulmonary disease or asthma because of the increased risk of acute bronchospasm.12
Alternatively, the transition to a basal-bolus regimen can be accomplished with a single dose of bolus insulin before the main meal, using a dose that represents approximately 10% of the total daily dose. Additional bolus doses can be added later based on the glycemic control. The adjustment of the preprandial insulin dose is done once or twice weekly, based on the postprandial glucose levels.10
Premixed combinations of long- and short-acting insulins in ratios of 50% to 50%, 70% to 30%, or 75% to 25% can be considered in patients who cannot adhere to a complex insulin regimen. A propensity-matched comparison of different insulin regimens (basal, premixed, mealtime plus basal, and mealtime) in patients with type 2 diabetes revealed that the hemoglobin A1c reduction was similar between the different groups.23 However, the number of hypoglycemic episodes was higher in the premixed insulin group, and the weight gain was less in the basal insulin group.
While premixed insulins require fewer injections, they do not provide dosing flexibility. In other words, dose adjustments for premixed insulins lead to increases in both basal and bolus amounts even though a dose adjustment is needed for only one insulin type. Thus, this is a common reason for increased hypoglycemic episodes.
Continuous subcutaneous insulin infusion
A meta-analysis showed that continuous subcutaneous insulin infusion (ie, use of an insulin pump) was similar to intensive therapy with multiple daily insulin injections in terms of glycemic control and hypoglycemia.24 Since both options can lead to similar glucose control, additional factors to consider when initiating insulin infusion include lifestyle and technical expertise. Some patients may or may not prefer having a pump attached for nearly all daily activities. Additionally, this type of therapy is complex and requires significant training to ensure efficacy and safety.25
WHAT IS THE COST OF INSULIN THERAPY?
A final factor to keep in mind when initiating insulin is cost (Table 4).12–14 Asking patients to check their prescription insurance formulary is important to ensure that an affordable option is selected. If patients do not have prescription insurance, medication assistance programs could be an option. However, if a patient is considering an insulin pump, insurance coverage is essential. Depending on the manufacturer, insulin pumps cost about $6,000 to $7,000, and the additional monthly supplies for the pump are also expensive.
If patients are engaged when considering and selecting insulin therapy, the likelihood of treatment success is greater.26–28
- The Diabetes Control and Complications Trial Research Group. The effect of intensive treatment of diabetes on the development and progression of long-term complications in insulin-dependent diabetes mellitus. N Engl J Med 1993; 329:977–986.
- Hanas R, John WG; International HbA1c Consensus Committee. 2013 Update on the worldwide standardization of the hemoglobin A1c measurement. Pediatr Diabetes 2014; 15:e1–e2.
- Nathan DM, Kuenen J, Borg R, Zheng H, Schoenfeld D, Heine RJ; A1c-Derived Average Glucose Study Group. Translating the A1C assay into estimated average glucose values. Diabetes Care 2008; 31:1473–1478.
- Garber AJ, Abrahamson MJ, Barzilay JI, et al; American Association of Clinical Endocrinologists. AACE comprehensive diabetes management algorithm 2013. Endocr Pract 2013; 19:327–336.
- American Diabetes Association. Standards of medical care in diabetes—2014. Diabetes Care 2014; 37(suppl 1):S14–S80.
- ADVANCE Collaborative Group; Patel A, MacMahon S, Chalmers J, et al. Intensive blood glucose control and vascular outcomes in patients with type 2 diabetes. N Engl J Med 2008; 358:2560–2572.
- Action to Control Cardiovascular Risk in Diabetes Study Group; Gerstein HC, Miller ME, Byington RP, et al. Effects of intensive glucose lowering in type 2 diabetes. N Engl J Med 2008; 358:2545–2559.
- Duckworth W, Abraira C, Moritz T, et al; VADT Investigators. Glucose control and vascular complications in veterans with type 2 diabetes. N Engl J Med 2009; 360:129–139.
- Hemmingsen B, Lund SS, Gluud C, et al. Targeting intensive glycaemic control versus targeting conventional glycaemic control for type 2 diabetes mellitus. Cochrane Database Syst Rev 2013; 11:CD008143.
- Inzucchi SE, Bergenstal RM, Buse JB, et al; American Diabetes Association (ADA); European Association for the Study of Diabetes (EASD). Management of hyperglycemia in type 2 diabetes: a patient-centered approach: position statement of the American Diabetes Association (ADA) and the European Association for the Study of Diabetes (EASD). Diabetes Care 2012; 35:1364–1379.
- Vora J, Bain SC, Damci T, et al. Incretin-based therapy in combination with basal insulin: a promising tactic for the treatment of type 2 diabetes. Diabetes Metab 2013; 39:6–15.
- Nuffer W, Trujillo JM, Ellis SL. Technosphere insulin (Afrezza): a new, inhaled prandial insulin. Ann Pharmacother 2015; 49:99–106.
- Pharmacist’s Letter/Prescriber’s Letter. Comparison of insulins and injectable diabetes meds. PL Detail-Document #281107 November 2012. www.PharmacistsLetter.com. Accessed July 2, 2015
- Lexicomp Online. www.wolterskluwercdi.com/lexicomp-online/. Accessed July 2, 2015.
- Hirsch IB. Insulin analogues. N Engl J Med 2005; 352:174-183.
- Riddle MC, Rosenstock J, Gerich J; Insulin Glargine 4002 Study Investigators. The treat-to-target trial: randomized addition of glargine or human NPH insulin to oral therapy of type 2 diabetic patients. Diabetes Care 2003; 26:3080–3086.
- Hermansen K, Davies M, Derezinski T, Martinez Ravn G, Clauson P, Home P. A 26-week, randomized, parallel, treat-to-target trial comparing insulin detemir with NPH insulin as add-on therapy to oral glucose-lowering drugs in insulin-naive people with type 2 diabetes. Diabetes Care 2006; 29:1269–1274.
- Swinnen SG, Simon AC, Holleman F, Hoekstra JB, Devries JH. Insulin detemir versus insulin glargine for type 2 diabetes mellitus. Cochrane Database Syst Rev 2011; 7:CD006383.
- Pontiroli AE, Miele L, Morabito A. Increase of body weight during the first year of intensive insulin treatment in type 2 diabetes: systematic review and meta-analysis. Diabetes Obes Metab 2011; 13:1008–1019.
- Balkau B, Home PD, Vincent M, Marre M, Freemantle N. Factors associated with weight gain in people with type 2 diabetes starting on insulin. Diabetes Care 2014; 37:2108–2113.
- Garber AJ. Will the next generation of basal insulins offer clinical advantages? Diabetes Obes Metab 2014; 16:483–491.
- Tamaki M, Shimizu T, Kanazawa A, et al. Effects of changes in basal/total daily insulin ratio in type 2 diabetes patients on intensive insulin therapy including insulin glargine (JUN-LAN Study 6). Diabetes Res Clin Pract 2008; 81:e1–e3.
- Freemantle N, Balkau B, Home PD. A propensity score matched comparison of different insulin regimens 1 year after beginning insulin in people with type 2 diabetes. Diabetes Obes Metab 2013; 15:1120–1127.
- Yeh HC, Brown TT, Maruthur N, et al. Comparative effectiveness and safety of methods of insulin delivery and glucose monitoring for diabetes mellitus: a systematic review and meta-analysis. Ann Intern Med 2012; 157:336–347.
- Schade DS, Valentine V. To pump or not to pump. Diabetes Care 2002; 25:2100–2102.
- Liu L, Lee MJ, Brateanu A. Improved A1C and lipid profile in patients referred to diabetes education programs in a wide health care network: a retrospective study. Diabetes Spectr 2014; 27:297–303.
- Funnell MM, Kruger DF, Spencer M. Self-management support for insulin therapy in type 2 diabetes. Diabetes Educ 2004; 30:274–280.
- Norris SL, Engelgau MM, Narayan KM. Effectiveness of self-management training in type 2 diabetes: a systematic review of randomized controlled trials. Diabetes Care 2001; 24:561–587.
KEY POINTS
- In deciding a patient’s hemoglobin A1c goal and whether it is time to start insulin therapy, one should take into account the patient’s age, life expectancy, concurrent illnesses, risk of hypoglycemia, and other factors.
- When the target hemoglobin A1c is not achieved with metformin or a two-drug regimen that includes metformin, the American Diabetes Association recommends adding a daily dose of basal insulin.
- Eventually, preprandial bolus doses may need to be added to the insulin regimen to control postprandial blood glucose levels and hemoglobin A1c.