User login
Medically Unlikely Edits
Medically Unlikely Edits (MUEs) are benchmarks recognized by the Centers for Medicare & Medicaid Services (CMS) that are designed to prevent incorrect or excessive coding. Specifically, an MUE is an edit that tests medical claims for services billed in excess of the maximum number of units of service permitted for a single beneficiary on the same date of service from the same provider (eg, multiples of the same Healthcare Common Procedure Coding System [HCPCS] code listed on different claim lines).1
The MUE System
If the number of units of service billed by the same physician for the same patient on the same day exceeds the maximum number permitted by the CMS, the Medicare Administrative Contractor (MAC) will deny the code or return the claim to the provider for correction (return to provider [RTP]). Units of service billed in excess of the MUE will not be paid, but other services billed on the same claim form may still be paid. In the case of an MUE-associated RTP, the provider should resubmit a corrected claim, not an appeal; however, an appeal is possible in the case of an MUE-associated denial. An MUE-associated denial is a coding denial, not a medical necessity denial; therefore, the provider cannot use an Advance Beneficiary Notice to transfer liability for claim payment to the patient.
MUE Adjudication Indicators
In 2013, the CMS modified the MUE process to include 3 different MUE adjudication indicators (MAIs) with a value of 1, 2, or 3 so that some MUE values would be date of service edits rather than claim line edits.2 Medically Unlikely Edits for HCPCS codes with an MAI of 1 are identical to the prior claim line edits. If a provider needs to report excess units of service with an MAI of 1, appropriate modifiers should be used to report them on separate lines of a claim. Current Procedural Terminology (CPT) modifiers such as -76 (repeat procedure or service by the same physician) and -91 (repeat clinical diagnostic laboratory test) as well as anatomic modifiers (eg, RT, LT, F1, F2) may be used, with modifier -59 (distinct procedural service) used only if no other modifier suffices. An example of an MUE with an MAI of 1 is CPT code 17264 (destruction, malignant lesion [eg, laser surgery, electrosurgery, cryosurgery, chemosurgery, surgical curettement], trunk, arms or legs; lesion diameter 3.1–4.0 cm), for which the MUE threshold is 3, meaning no more than 3 destructions can be submitted per claim line without triggering an edit-based rejection or RTP.
An MAI of 2 denotes absolute date of service edits, or so-called “per day edits based on policy.” Such edits are in place because units of service billed in excess of the MUE value on the same date of service are considered to be impossible by the CMS based on regulatory guidance or anatomic considerations.2 For instance, although the same physician may destroy multiple actinic keratoses in a single patient on the same date of service, it would not be possible to code more than one unit of service as
CPT code 17000, which specifically and exclusively
refers to the first lesion destroyed. Similarly,
CPT code 13101 (repair, complex, trunk; lesion diameter 2.6–7.5 cm) could only be reported once that day, as all complex repairs at that anatomic site must be summed and smaller or larger totals would be reported with another code.
Anatomic limitations are sometimes obvious and do not require specific coding rules. For example, only 1 gallbladder can be removed per patient. Although Qualified Independent Contractors and Administrative Law Judges are not bound by MAIs, they do give particular deference to an MAI of
2 given its definitive nature.2 Because ambulatory surgical center providers (Medicare specialty code 49) cannot report modifier -50 for bilateral
procedures, the MUE value used for editing is doubled for HCPCS codes with an MAI of 2 or 3 if the bilateral surgery indicator for the HCPCS code is 1.3
An MAI of 3 describes less strict date of service edits, so-called “per day edits based on clinical benchmarks.”2 Similar to MAIs of 1, MUEs for MAIs of 3 are based on medically likely daily frequencies of services provided in most settings. To determine if an MUE with an MAI of 3 has been reached, the MAC sums the units of service billed on all claim lines of the current claim as well as all prior paid claims for the same patient billed by the same provider on the same date of service. If the total units of service obtained in this manner exceeds the MUE value, then all claim lines with the relevant code for the current claim will be denied, but prior paid claims will not be adjusted. Denials based on MUEs for codes with an MAI of 3 can be appealed to the local MAC. Successful appeals require documentation that the units of service in excess of the MUE value were actually delivered and demonstration of medical necessity.2 An example of a CPT code with an MAI of 3 is 40490 (biopsy of lip) for which the MUE value is 3.
Complications With MUE and MAI
Because MUEs are based on current coding guidelines as well as current clinical practice, they are only applicable for the time period in which they are in effect. A change made to an MUE value for a particular code is not retroactive; however, in exceptional circumstances when a retroactive effective date is applied, MACs are not directed to examine prior claims but only “claims that are brought to their attention.”2
It also is important to realize that not all MUEs are publicly available and many are confidential. When claim denials occur, particularly in the context of multiple units of a particular code, automated MUE edits should be among the issues that are suspected. Physicians may resubmit RTP claims on separate lines if a claim line edit (MAI of 1) is operative. An MAI of 2 suggests a coding error that needs to be corrected, as these coding approaches are generally impossible based on definitional issues or anatomy. If an MUE with an MAI of 3 is the reason for denial, an appeal is possible, provided there is documentation to show that the service was actually provided and that it was medically necessary.
Final Thoughts
Dermatologists should be vigilant for unexpected payment denials, which may coincide with the implementation of new MUE values. When such denials occur and MUE values are publicly available, dermatologists should consider filing an appeal if the relevant MUEs were associated with an MAI of 1 or 3. Overall, dermatologists should be aware that many MUEs that were formerly claim line edits (MAI of 1) have been recently transitioned to date of service edits (MAI of 3), which are more restrictive.
1. American Academy of Dermatology. Medicare’s expanded medically unlikely edits. https://www.aad.org/members
/practice-and-advocacy-resource-center/coding-resources
/derm-coding-consult-library/winter-2014/medicare-
s-expanded-medically-unlikely-edits. Published Winter 2014. Accessed August 6, 2015.
2. Centers for Medicare & Medicaid Services. Revised modification to the Medically Unlikely Edit (MUE) program. MLN Matters. Number MM8853. https://www.cms.gov
/Outreach-and-Education/Medicare-Learning-Network-MLN/MLNMattersArticles/downloads/MM8853.pdf. Published January 1, 2015. Accessed August 6, 2015.
3. Centers for Medicare & Medicaid Services.
Medically Unlikely Edits (MUE) and bilateral procedures. MLN Matters. Number SE1422.
https://www.cms.gov/Regulations-and-Guidance
/Guidance/Transmittals/2014-Transmittals-Items/SE1422.html?DLPage=2&DLEntries=10&DLSort=1&DLSort
Dir=ascending. Accessed July 28, 2015.
Medically Unlikely Edits (MUEs) are benchmarks recognized by the Centers for Medicare & Medicaid Services (CMS) that are designed to prevent incorrect or excessive coding. Specifically, an MUE is an edit that tests medical claims for services billed in excess of the maximum number of units of service permitted for a single beneficiary on the same date of service from the same provider (eg, multiples of the same Healthcare Common Procedure Coding System [HCPCS] code listed on different claim lines).1
The MUE System
If the number of units of service billed by the same physician for the same patient on the same day exceeds the maximum number permitted by the CMS, the Medicare Administrative Contractor (MAC) will deny the code or return the claim to the provider for correction (return to provider [RTP]). Units of service billed in excess of the MUE will not be paid, but other services billed on the same claim form may still be paid. In the case of an MUE-associated RTP, the provider should resubmit a corrected claim, not an appeal; however, an appeal is possible in the case of an MUE-associated denial. An MUE-associated denial is a coding denial, not a medical necessity denial; therefore, the provider cannot use an Advance Beneficiary Notice to transfer liability for claim payment to the patient.
MUE Adjudication Indicators
In 2013, the CMS modified the MUE process to include 3 different MUE adjudication indicators (MAIs) with a value of 1, 2, or 3 so that some MUE values would be date of service edits rather than claim line edits.2 Medically Unlikely Edits for HCPCS codes with an MAI of 1 are identical to the prior claim line edits. If a provider needs to report excess units of service with an MAI of 1, appropriate modifiers should be used to report them on separate lines of a claim. Current Procedural Terminology (CPT) modifiers such as -76 (repeat procedure or service by the same physician) and -91 (repeat clinical diagnostic laboratory test) as well as anatomic modifiers (eg, RT, LT, F1, F2) may be used, with modifier -59 (distinct procedural service) used only if no other modifier suffices. An example of an MUE with an MAI of 1 is CPT code 17264 (destruction, malignant lesion [eg, laser surgery, electrosurgery, cryosurgery, chemosurgery, surgical curettement], trunk, arms or legs; lesion diameter 3.1–4.0 cm), for which the MUE threshold is 3, meaning no more than 3 destructions can be submitted per claim line without triggering an edit-based rejection or RTP.
An MAI of 2 denotes absolute date of service edits, or so-called “per day edits based on policy.” Such edits are in place because units of service billed in excess of the MUE value on the same date of service are considered to be impossible by the CMS based on regulatory guidance or anatomic considerations.2 For instance, although the same physician may destroy multiple actinic keratoses in a single patient on the same date of service, it would not be possible to code more than one unit of service as
CPT code 17000, which specifically and exclusively
refers to the first lesion destroyed. Similarly,
CPT code 13101 (repair, complex, trunk; lesion diameter 2.6–7.5 cm) could only be reported once that day, as all complex repairs at that anatomic site must be summed and smaller or larger totals would be reported with another code.
Anatomic limitations are sometimes obvious and do not require specific coding rules. For example, only 1 gallbladder can be removed per patient. Although Qualified Independent Contractors and Administrative Law Judges are not bound by MAIs, they do give particular deference to an MAI of
2 given its definitive nature.2 Because ambulatory surgical center providers (Medicare specialty code 49) cannot report modifier -50 for bilateral
procedures, the MUE value used for editing is doubled for HCPCS codes with an MAI of 2 or 3 if the bilateral surgery indicator for the HCPCS code is 1.3
An MAI of 3 describes less strict date of service edits, so-called “per day edits based on clinical benchmarks.”2 Similar to MAIs of 1, MUEs for MAIs of 3 are based on medically likely daily frequencies of services provided in most settings. To determine if an MUE with an MAI of 3 has been reached, the MAC sums the units of service billed on all claim lines of the current claim as well as all prior paid claims for the same patient billed by the same provider on the same date of service. If the total units of service obtained in this manner exceeds the MUE value, then all claim lines with the relevant code for the current claim will be denied, but prior paid claims will not be adjusted. Denials based on MUEs for codes with an MAI of 3 can be appealed to the local MAC. Successful appeals require documentation that the units of service in excess of the MUE value were actually delivered and demonstration of medical necessity.2 An example of a CPT code with an MAI of 3 is 40490 (biopsy of lip) for which the MUE value is 3.
Complications With MUE and MAI
Because MUEs are based on current coding guidelines as well as current clinical practice, they are only applicable for the time period in which they are in effect. A change made to an MUE value for a particular code is not retroactive; however, in exceptional circumstances when a retroactive effective date is applied, MACs are not directed to examine prior claims but only “claims that are brought to their attention.”2
It also is important to realize that not all MUEs are publicly available and many are confidential. When claim denials occur, particularly in the context of multiple units of a particular code, automated MUE edits should be among the issues that are suspected. Physicians may resubmit RTP claims on separate lines if a claim line edit (MAI of 1) is operative. An MAI of 2 suggests a coding error that needs to be corrected, as these coding approaches are generally impossible based on definitional issues or anatomy. If an MUE with an MAI of 3 is the reason for denial, an appeal is possible, provided there is documentation to show that the service was actually provided and that it was medically necessary.
Final Thoughts
Dermatologists should be vigilant for unexpected payment denials, which may coincide with the implementation of new MUE values. When such denials occur and MUE values are publicly available, dermatologists should consider filing an appeal if the relevant MUEs were associated with an MAI of 1 or 3. Overall, dermatologists should be aware that many MUEs that were formerly claim line edits (MAI of 1) have been recently transitioned to date of service edits (MAI of 3), which are more restrictive.
1. American Academy of Dermatology. Medicare’s expanded medically unlikely edits. https://www.aad.org/members
/practice-and-advocacy-resource-center/coding-resources
/derm-coding-consult-library/winter-2014/medicare-
s-expanded-medically-unlikely-edits. Published Winter 2014. Accessed August 6, 2015.
2. Centers for Medicare & Medicaid Services. Revised modification to the Medically Unlikely Edit (MUE) program. MLN Matters. Number MM8853. https://www.cms.gov
/Outreach-and-Education/Medicare-Learning-Network-MLN/MLNMattersArticles/downloads/MM8853.pdf. Published January 1, 2015. Accessed August 6, 2015.
3. Centers for Medicare & Medicaid Services.
Medically Unlikely Edits (MUE) and bilateral procedures. MLN Matters. Number SE1422.
https://www.cms.gov/Regulations-and-Guidance
/Guidance/Transmittals/2014-Transmittals-Items/SE1422.html?DLPage=2&DLEntries=10&DLSort=1&DLSort
Dir=ascending. Accessed July 28, 2015.
Practice Points
- Medically Unlikely Edits (MUEs) are designed to prevent incorrect or excessive coding. Units of service billed in excess of the MUE will not be paid.
- Three different MUE adjudication indicators (MAIs) were added so that some MUE values would be date of service edits.
- Dermatologists should be vigilant for unexpected payment denials.

Electronic Brachytherapy: Overused and Overpriced?
The introduction of high-density radiation electronic brachytherapy (eBX) for the treatment of nonmelanoma skin cancers has induced great angst within the dermatology community.1 The Current Procedural Terminology (CPT) code 0182T (high dose rate eBX) reimburses at an extraordinarily high rate, which has drawn a substantial amount of attention. Some critics see it as another case of overutilization, of sucking more money out of a bleeding Medicare system. The financial opportunity afforded by eBX has even led some entrepreneurs to purchase dermatology clinics so that skin cancer patients can be treated via this modality instead of more traditional and less costly techniques (personal communication, 2014).
Among radiation oncologists, high-density radiation eBX is considered to be an important treatment option for select patients who have skin cancers staged as T1 or T2 tumors that are 4 cm or smaller in diameter and 5 mm or less in depth.2 Additionally, ideal candidates for nonsurgical treatment options such as eBX include patients with lesions in cosmetically challenging areas (eg, ears, nose), those who may experience problematic wound healing due to tumor location (eg, lower extremities) or medical conditions (eg, diabetes mellitus, peripheral vascular disease), those with medical comorbidities that may preclude them from surgery, those currently taking anticoagulants, and those who are not interested in undergoing surgery.
A common criticism of eBX is that there is little data on long-term treatment outcomes, which will soon be addressed by a 5-year multicenter, prospective, randomized study of 720 patients with basal cell carcinoma and squamous cell carcinoma led by the University of California, Irvine, and the University of California, San Diego (study protocol currently with institutional review board). Another criticism is that some manufacturers of eBX devices gained the less rigorous US Food and Drug Administration Premarket Notification 510(k) certification; however, this certification is quite commonplace in the United States, and an examination of the data actually shows a lower recall rate with this method when compared to the longer premarket approval application process.3 A more important criticism of eBX might be that radiation therapy is associated with a substantial increase in skin cancers that may occur decades later in irradiated areas; however, there remains a paucity of studies examining the safety data on eBX during the posttreatment period when such effects would be expected.
In practice, the forces for good and evil are not only limited to those who utilize eBX. It is widely known that CPT codes for Mohs micrographic surgery also have been abused—that is, the procedure has been used in circumstances where it was not absolutely necessary4—which led to an effort by dermatologic surgery organizations to agree on appropriate use criteria for Mohs surgery.5 These criteria are not perfect but should help curb the misuse of a valuable technique, which is one that is recognized as being optimal for the treatment of complex skin cancers. One might suggest forming similar appropriate use criteria for eBX and limiting this treatment to patients who either are older than 65 years, have serious medical issues, are currently taking anticoagulants, are immobile, or simply cannot handle further dermatologic surgeries.
The American Medical Association has developed new Category III CPT codes for treatment of the skin with eBX that will become effective January 2016.6 These codes take into consideration the need for a radiation oncologist and a physicist to be present for planning, dosimetry, simulation, and selection of parameters for the appropriate depth. Although I do not know the reimbursement rates for these new codes yet, they will likely be substantially less than the current payment for treatment with eBX. That said, the gravy train has left the station, and those who have invested in the devices for eBX will either see the benefit of continued treatment for their patients or divest themselves of eBX now that the reimbursement will be more modest.
Some of my dermatology colleagues, who also are some of my very good friends, have a visceral and absolute objection to the use of any form of radiation therapy, and I respect their opinions. However, eBX does play a role in treating cutaneous malignancies, and our radiation oncology colleagues—many who treat patients with extensive, aggressive, and recurrent skin cancers—also have a place at the table.
Speaking as a fellowship-trained dermatologic surgeon and a department chair, I am very aware that the teaching we provide today for our dermatology residents and fellows is likely to be their modus operandi for the future, a future in which the Patient Protection and Affordable Care Act will force physicians to carefully choose quality of care over personal gain and where financial rewards will be based on appropriate utilization and measurable outcomes. Electronic brachytherapy is one tool amongst many. I have a plethora of patients in their 70s and 80s who have given up on surgery for skin cancer and who would prefer painless treatment with eBX, which allows for the appropriate use of such a controversial therapy.
Acknowledgments—I would like to thank Janellen Smith, MD (Irvine, California), Joshua Spanogle, MD (Saint Augustine, Florida), and Jordan V. Wang, MBE (Philadelphia, Pennsylvania), for their constructive comments.
1. Linos E, VanBeek M, Resneck JS Jr. A sudden and concerning increase in the use of electronic brachytherapy for skin cancer. JAMA Dermatol. 2015;151:699-700.
2. Bhatnagar A. Nonmelanoma skin cancer treated with electronic brachytherapy: results at 1 year [published online ahead of print January 9, 2013]. Brachytherapy. 2013;12:134-140.
3. Connor JT, Lewis RJ, Berry DA, et al. FDA recalls not as alarming as they seem. Arch Intern Med. 2011;171:1044-1046.
4. Goldman G. Mohs surgery comes under the microscope. Member to Member American Academy of Dermatology E-newsletter. https://www.aad.org/members/publications /member-to-member/2013-archive/november-8-2013 /mohs-surgery-comes-under-the-microscope. Published November 8, 2013. Accessed August 10, 2015.
5. Ad Hoc Task Force, Connolly SM, Baker DR, et al. AAD/ACMS/ASDSA/ASMS 2012 appropriate use criteria for Mohs micrographic surgery: a report of the American Academy of Dermatology, American College of Mohs Surgery, American Society for Dermatologic Surgery Association, and the American Society for Mohs Surgery [published online ahead of print September 5, 2012]. J Am Acad Dermatol. 2012;67:531-550.
6. ACR Radiology Coding Source: CPT 2016 anticipated code changes. American College of Radiology Web site. http://www.acr.org/Advocacy/Economics-Health-Policy /Billing-Coding/Coding-Source-List/2015/Mar-Apr-2015 /CPT-2016-Anticipated-Code-Changes. Published March 2015. Accessed August 21, 2015.
The introduction of high-density radiation electronic brachytherapy (eBX) for the treatment of nonmelanoma skin cancers has induced great angst within the dermatology community.1 The Current Procedural Terminology (CPT) code 0182T (high dose rate eBX) reimburses at an extraordinarily high rate, which has drawn a substantial amount of attention. Some critics see it as another case of overutilization, of sucking more money out of a bleeding Medicare system. The financial opportunity afforded by eBX has even led some entrepreneurs to purchase dermatology clinics so that skin cancer patients can be treated via this modality instead of more traditional and less costly techniques (personal communication, 2014).
Among radiation oncologists, high-density radiation eBX is considered to be an important treatment option for select patients who have skin cancers staged as T1 or T2 tumors that are 4 cm or smaller in diameter and 5 mm or less in depth.2 Additionally, ideal candidates for nonsurgical treatment options such as eBX include patients with lesions in cosmetically challenging areas (eg, ears, nose), those who may experience problematic wound healing due to tumor location (eg, lower extremities) or medical conditions (eg, diabetes mellitus, peripheral vascular disease), those with medical comorbidities that may preclude them from surgery, those currently taking anticoagulants, and those who are not interested in undergoing surgery.
A common criticism of eBX is that there is little data on long-term treatment outcomes, which will soon be addressed by a 5-year multicenter, prospective, randomized study of 720 patients with basal cell carcinoma and squamous cell carcinoma led by the University of California, Irvine, and the University of California, San Diego (study protocol currently with institutional review board). Another criticism is that some manufacturers of eBX devices gained the less rigorous US Food and Drug Administration Premarket Notification 510(k) certification; however, this certification is quite commonplace in the United States, and an examination of the data actually shows a lower recall rate with this method when compared to the longer premarket approval application process.3 A more important criticism of eBX might be that radiation therapy is associated with a substantial increase in skin cancers that may occur decades later in irradiated areas; however, there remains a paucity of studies examining the safety data on eBX during the posttreatment period when such effects would be expected.
In practice, the forces for good and evil are not only limited to those who utilize eBX. It is widely known that CPT codes for Mohs micrographic surgery also have been abused—that is, the procedure has been used in circumstances where it was not absolutely necessary4—which led to an effort by dermatologic surgery organizations to agree on appropriate use criteria for Mohs surgery.5 These criteria are not perfect but should help curb the misuse of a valuable technique, which is one that is recognized as being optimal for the treatment of complex skin cancers. One might suggest forming similar appropriate use criteria for eBX and limiting this treatment to patients who either are older than 65 years, have serious medical issues, are currently taking anticoagulants, are immobile, or simply cannot handle further dermatologic surgeries.
The American Medical Association has developed new Category III CPT codes for treatment of the skin with eBX that will become effective January 2016.6 These codes take into consideration the need for a radiation oncologist and a physicist to be present for planning, dosimetry, simulation, and selection of parameters for the appropriate depth. Although I do not know the reimbursement rates for these new codes yet, they will likely be substantially less than the current payment for treatment with eBX. That said, the gravy train has left the station, and those who have invested in the devices for eBX will either see the benefit of continued treatment for their patients or divest themselves of eBX now that the reimbursement will be more modest.
Some of my dermatology colleagues, who also are some of my very good friends, have a visceral and absolute objection to the use of any form of radiation therapy, and I respect their opinions. However, eBX does play a role in treating cutaneous malignancies, and our radiation oncology colleagues—many who treat patients with extensive, aggressive, and recurrent skin cancers—also have a place at the table.
Speaking as a fellowship-trained dermatologic surgeon and a department chair, I am very aware that the teaching we provide today for our dermatology residents and fellows is likely to be their modus operandi for the future, a future in which the Patient Protection and Affordable Care Act will force physicians to carefully choose quality of care over personal gain and where financial rewards will be based on appropriate utilization and measurable outcomes. Electronic brachytherapy is one tool amongst many. I have a plethora of patients in their 70s and 80s who have given up on surgery for skin cancer and who would prefer painless treatment with eBX, which allows for the appropriate use of such a controversial therapy.
Acknowledgments—I would like to thank Janellen Smith, MD (Irvine, California), Joshua Spanogle, MD (Saint Augustine, Florida), and Jordan V. Wang, MBE (Philadelphia, Pennsylvania), for their constructive comments.
1. Linos E, VanBeek M, Resneck JS Jr. A sudden and concerning increase in the use of electronic brachytherapy for skin cancer. JAMA Dermatol. 2015;151:699-700.
2. Bhatnagar A. Nonmelanoma skin cancer treated with electronic brachytherapy: results at 1 year [published online ahead of print January 9, 2013]. Brachytherapy. 2013;12:134-140.
3. Connor JT, Lewis RJ, Berry DA, et al. FDA recalls not as alarming as they seem. Arch Intern Med. 2011;171:1044-1046.
4. Goldman G. Mohs surgery comes under the microscope. Member to Member American Academy of Dermatology E-newsletter. https://www.aad.org/members/publications /member-to-member/2013-archive/november-8-2013 /mohs-surgery-comes-under-the-microscope. Published November 8, 2013. Accessed August 10, 2015.
5. Ad Hoc Task Force, Connolly SM, Baker DR, et al. AAD/ACMS/ASDSA/ASMS 2012 appropriate use criteria for Mohs micrographic surgery: a report of the American Academy of Dermatology, American College of Mohs Surgery, American Society for Dermatologic Surgery Association, and the American Society for Mohs Surgery [published online ahead of print September 5, 2012]. J Am Acad Dermatol. 2012;67:531-550.
6. ACR Radiology Coding Source: CPT 2016 anticipated code changes. American College of Radiology Web site. http://www.acr.org/Advocacy/Economics-Health-Policy /Billing-Coding/Coding-Source-List/2015/Mar-Apr-2015 /CPT-2016-Anticipated-Code-Changes. Published March 2015. Accessed August 21, 2015.
Sept. JVS: Vascular surgeons do higher percentage of AAA repairs
The impact of endovascular repair on specialties performing abdominal aortic aneurysm repair.
Klaas H. J. Ultee, BSc,Rob Hurks, MD, PhD, Dominique B. Buck, MD, George S. DaSilva, BS, Peter A. Soden, MD,Joost A. van Herwaarden, MD, PhD, Hence J. M. Verhagen, MD, PhD, and Marc L. Schermerhorn, MD
Due to the increased use of EVAR for both intact and ruptured AAA repair, vascular surgeons are performing an increasing majority of AAA repairs, according to a new study reported in the September edition of Journal of Vascular Surgery.
The study examined the years 2001 through 2009 using the Nationwide Inpatient Sample, the largest national administrative database, which is maintained by the Agency for Healthcare Research and Quality as part of the Healthcare Cost and Utilization Project.
After 2009 the surgeon identification variables in the database were discontinued so more recent data were unavailable for the study.
“We do plan to analyze (this same subject) using Medicare data,” according to Dr. Marc L. Schermerhorn, “but our access to it lags several years behind. It will allow better risk adjustment as well.”
The study was interested in AAA repairs by the following types of physicians: vascular surgeons, general surgeons, cardiac surgeons, as well as nonsurgical specialists such as interventional cardiologists and interventional radiologists.
Overall, 108,587 EVARS and 85,080 open AAA repairs were identified. Of all repairs, 61 percent were performed by vascular surgeons, 20 percent by general surgeons, and 16 percent by cardiac surgeons. ICs and IRs performed the remaining 3 percent.
Significantly, the absolute number of vascular surgeons performing AAA repair increased 30 percent during the study period, whereas the number of GS and CS repairs decreased 46 and 30 percent, respectively.
AAA repairs are still done by general surgeons and cardiovascular surgeons; however, in those cases, patients are less likely to receive EVAR.
Researchers also found that whether patients received open or endovascular repair varied with the type of surgeon, but also by the patient’s gender, emergent admission, and race.
Other influencing factors were age of patient, treatment in a teaching hospital, year, and whether or not the hospital was in an urban area.
“The big question,” Schermerhorn noted, “is whether specialty has an influence on outcomes. We chose not to try to analyze this using this database because we did not think we could adequately do risk adjustment. It is difficult to distinguish a pre-existing condition from a post-op complication, for example, renal failure.”

EMA recommends orphan designation for CAR T-cell therapy

The European Medicines Agency’s (EMA’s) Committee for Orphan Medicinal Products has adopted a positive opinion recommending that KTE-C19 receive orphan designation to treat primary mediastinal B-cell lymphoma (PMBCL) and mantle cell lymphoma.
KTE-C19 is an investigational chimeric antigen receptor (CAR) T-cell therapy designed to target CD19, a protein expressed on the cell surface of B-cell lymphomas and leukemias.
No other product candidate currently has orphan drug designation for the treatment of PMBCL in the European Union (EU).
KTE-C19 already has orphan drug designation to treat diffuse large B-cell lymphoma (DLBCL) in the US and the EU.
“We are conducting a phase 1/2 clinical trial of KTE-C19 in patients with refractory, aggressive non-Hodgkin lymphoma, including DLBCL and PMBCL, and plan to report initial topline results from the phase 1 portion of the trial later this year [at the ASH Annual Meeting],” said Arie Belldegrun, MD, Chairman, President, and Chief Executive Officer of Kite Pharmaceuticals, the company developing KTE-C19.
Trial results
Last year, researchers reported results with KTE-C19 in the Journal of Clinical Oncology. The study included 15 patients with advanced B-cell malignancies.
The patients received a conditioning regimen of cyclophosphamide and fludarabine, followed 1 day later by a single infusion of KTE-C19. The researchers noted that the conditioning regimen is known to be active against B-cell malignancies and could have made a direct contribution to patient responses.
Thirteen patients were evaluable for response. Eight patients achieved a complete response (CR), and 4 had a partial response (PR).
Of the 7 patients with chemotherapy-refractory DLBCL, 4 achieved a CR, 2 achieved a PR, and 1 had stable disease. Of the 4 patients with chronic lymphocytic leukemia, 3 had a CR, and 1 had a PR. Among the 2 patients with indolent lymphomas, 1 achieved a CR, and 1 had a PR.
KTE-C19 was associated with fever, low blood pressure, focal neurological deficits, and delirium. Toxicities largely occurred in the first 2 weeks after infusion.
All but 2 patients experienced grade 3/4 adverse events. Four patients had grade 3/4 hypotension.
All patients had elevations in serum interferon gamma and/or interleukin 6 around the time of peak toxicity, but most did not develop elevations in serum tumor necrosis factor.
Neurologic toxicities included confusion and obtundation, which have been reported in previous studies. However, 3 patients developed unexpected neurologic abnormalities.
About orphan designation
The EMA’s Committee for Orphan Medicinal Products adopts an opinion on the granting of orphan designation, and that opinion is submitted to the European Commission for endorsement.
In the EU, orphan designation is granted to therapies intended to treat a life-threatening or chronically debilitating condition that affects no more than 5 in 10,000 persons and where no satisfactory treatment is available.
Companies that obtain orphan designation for a drug benefit from a number of incentives, including protocol assistance, a type of scientific advice specific for designated orphan medicines, and 10 years of market exclusivity once the medicine is approved. Fee reductions are also available, depending on the status of the sponsor and the type of service required. ![]()
Tiering dermatologists without the benefit of true quality measures
Tiering is the “ranking” of physicians by insurance companies. These rankings are used to decide who gets to participate in the networks, how you get paid, the patient’s copay, and on and on. The rankings are also published. Insurance companies want to save money, and are attempting to do this under the guise of enhancing quality.
Fine, you say, I am an efficient dermatologist and ready to be ranked against anyone.
No, it is not fine, because there are no validated quality measures for dermatologists.

Well great, you say, then dermatologists can’t be ranked.
No, unfortunately, dermatologists are getting ranked anyway, and the process is little more than just making up a ranking.
Let me give you an example. Cigna has a two star system and ranks specialists according to “practice of evidence-based medicine” and “quality of care.” (See “How are specialists chosen for Cigna Care Designation” on Frequently Asked Questions on the Cigna web site). If there aren’t any quality measures for dermatologists, how can they do it? Well, they give the first star to a dermatologist if primary care doctors in their medical group check glycosylated hemoglobins and blood pressures.
Yes, some dermatologists get credit and a star for something that has nothing to do with them.
The second measure of quality is even more preposterous. Cigna uses cost-per-patient software, and the least expensive dermatologist gets the second star – no matter who or what they are treating, or what procedures they are performing.
This approach introduces multiple perversions into the system. First, the primary care doctors are under huge pressure to get their patients to comply with testing measures. Consequently, the systems they work for are insisting that they “fire” patients who do not come in for their checkups and get their blood checks.
Closer to home, dermatologists who do Mohs surgery full time, or who are in solo or small practices, or who prescribe expensive medications are penalized.
Cigna is one of six health insurers tiering dermatologists, but soon all insurers will be doing the same. Representatives from the American Academy of Dermatology, including myself, have met with Cigna and pointed out how meaningless it is to rank dermatologists without having specialty-specific quality parameters. The less-than-adequate response has been that “the lack of quality measures is a problem with several specialties.”
Given the lack of validated quality measures for dermatology, I find it bizarre that Health and Human Services Secretary Sylvia M. Burwell has set the goal of tying 85% of all traditional Medicare payments to quality or value by 2016 and 90% by 2018. I’m afraid this is going to be a very blunt axe resulting in splintered health care.
The AAD is doing its best to delay this deadline, at least until there are some relevant quality measures for dermatology, and has launched a major data collection initiative – DataDerm. Amassing that information should give us some decent benchmarks in a few years. DataDerm will ultimately provide benchmark reports, access to clinically relevant data, quality measurement, and information to improve patient care.
Until then we will argue, reason, and cajole as best we can. Meanwhile, the AAD will need your help with DataDerm, and it won’t do any good for you to stomp your feet and just say ‘no.’ In future columns, I will discuss the impacts of UnitedHealth Group’s misguided “lab benefit program” and the unfortunate Optum360 physician profiling software.
Dr. Coldiron is a past president of the American Academy of Dermatology. He is currently in private practice, but maintains a clinical assistant professorship at the University of Cincinnati. He cares for patients, teaches medical students and residents, and has several active clinical research projects. Dr. Coldiron is the author of more than 80 scientific letters, papers, and several book chapters, and he speaks frequently on a variety of topics. Reach him at [email protected]
Tiering is the “ranking” of physicians by insurance companies. These rankings are used to decide who gets to participate in the networks, how you get paid, the patient’s copay, and on and on. The rankings are also published. Insurance companies want to save money, and are attempting to do this under the guise of enhancing quality.
Fine, you say, I am an efficient dermatologist and ready to be ranked against anyone.
No, it is not fine, because there are no validated quality measures for dermatologists.
Well great, you say, then dermatologists can’t be ranked.
No, unfortunately, dermatologists are getting ranked anyway, and the process is little more than just making up a ranking.
Let me give you an example. Cigna has a two star system and ranks specialists according to “practice of evidence-based medicine” and “quality of care.” (See “How are specialists chosen for Cigna Care Designation” on Frequently Asked Questions on the Cigna web site). If there aren’t any quality measures for dermatologists, how can they do it? Well, they give the first star to a dermatologist if primary care doctors in their medical group check glycosylated hemoglobins and blood pressures.
Yes, some dermatologists get credit and a star for something that has nothing to do with them.
The second measure of quality is even more preposterous. Cigna uses cost-per-patient software, and the least expensive dermatologist gets the second star – no matter who or what they are treating, or what procedures they are performing.
This approach introduces multiple perversions into the system. First, the primary care doctors are under huge pressure to get their patients to comply with testing measures. Consequently, the systems they work for are insisting that they “fire” patients who do not come in for their checkups and get their blood checks.
Closer to home, dermatologists who do Mohs surgery full time, or who are in solo or small practices, or who prescribe expensive medications are penalized.
Cigna is one of six health insurers tiering dermatologists, but soon all insurers will be doing the same. Representatives from the American Academy of Dermatology, including myself, have met with Cigna and pointed out how meaningless it is to rank dermatologists without having specialty-specific quality parameters. The less-than-adequate response has been that “the lack of quality measures is a problem with several specialties.”
Given the lack of validated quality measures for dermatology, I find it bizarre that Health and Human Services Secretary Sylvia M. Burwell has set the goal of tying 85% of all traditional Medicare payments to quality or value by 2016 and 90% by 2018. I’m afraid this is going to be a very blunt axe resulting in splintered health care.
The AAD is doing its best to delay this deadline, at least until there are some relevant quality measures for dermatology, and has launched a major data collection initiative – DataDerm. Amassing that information should give us some decent benchmarks in a few years. DataDerm will ultimately provide benchmark reports, access to clinically relevant data, quality measurement, and information to improve patient care.
Until then we will argue, reason, and cajole as best we can. Meanwhile, the AAD will need your help with DataDerm, and it won’t do any good for you to stomp your feet and just say ‘no.’ In future columns, I will discuss the impacts of UnitedHealth Group’s misguided “lab benefit program” and the unfortunate Optum360 physician profiling software.
Dr. Coldiron is a past president of the American Academy of Dermatology. He is currently in private practice, but maintains a clinical assistant professorship at the University of Cincinnati. He cares for patients, teaches medical students and residents, and has several active clinical research projects. Dr. Coldiron is the author of more than 80 scientific letters, papers, and several book chapters, and he speaks frequently on a variety of topics. Reach him at [email protected]

HIT risk rises with obesity
LAS VEGAS – High body mass index is strongly associated with increased rates of heparin-induced thrombocytopenia, based on findings from a review of prospectively collected data from surgical and cardiac intensive care unit patients presumed to have the condition.
Of 304 patients included in the review, 36 (12%) were positive for heparin-induced thrombocytopenia (HIT). The rates increased in tandem with BMI. For example, the rate was 0% among 9 underweight individuals (BMI less than 18.5 kg/m2), 8% among 119 normal-weight individuals (BMI of 18.5-24.9 kg/m2), 11% among 98 overweight individuals (BMI of 25-29.9 kg/m2), 18% among 67 obese individuals (BMI of 30-39.9 kg/m2), and 36% among 11 morbidly obese individuals (BMI of 40 kg/m2 or greater), Dr. Matthew B. Bloom reported at the annual meeting of the American Association for the Surgery of Trauma.

The odds of HIT were 170% greater among obese patients, compared with normal-weight patients (odds ratio, 2.67), and 600% greater among morbidly obese patients, compared with normal-weight patient (odds ratio, 6.98), said Dr. Bloom of Cedars-Sinai Medical Center, Los Angeles.
Logistic regression showed that each 1 unit increase in BMI was associated with a 7.7% increase in the odds of developing HIT, he noted.
Additionally, an anti-heparin/PF4 (platelet factor 4) antibody OD (optical density) value of 2.0 or greater, but not of 0.4 or greater or 0.8 or greater, was also significantly increased with BMI, and in-hospital mortality increased significantly with BMI above normal, he said.
Warkentin 4T scores used to differentiate HIT from other types of thrombocytopenia were not found to correlate with changes in BMI in this study, nor were deep vein thrombosis, pulmonary embolism, or stroke.
The increase in PF4 with increasing BMI may be a marker for overall increasing levels of circulating antibodies in the obese ICU population, but more biochemical studies are needed to tease this out, he said.
Patients included in the review were all those admitted to the surgical and cardiac ICUs at Cedars-Sinai over a more than 7 year period. They had a mean age of 62.1 years, 59% were men, and their mean BMI was 27 kg/m2.
The findings are among the first to show a strong association between BMI and HIT in ICU patients, Dr. Bloom said, noting that several other studies have shown that obesity is linked with increased incidence and increased severity of immune-mediated diseases, including rheumatoid arthritis, systemic lupus erythematosus, and inflammatory bowel disease.
“And HIT is an immune-mediated disease,” he added.
“BMI may be an important new clinical variable for estimating the pre-test probability of HIT, and perhaps, in the future, patient ‘thickness’ could be considered a new ‘T’ in the 4T score, he concluded.
Dr. Bloom reported having no disclosures.
LAS VEGAS – High body mass index is strongly associated with increased rates of heparin-induced thrombocytopenia, based on findings from a review of prospectively collected data from surgical and cardiac intensive care unit patients presumed to have the condition.
Of 304 patients included in the review, 36 (12%) were positive for heparin-induced thrombocytopenia (HIT). The rates increased in tandem with BMI. For example, the rate was 0% among 9 underweight individuals (BMI less than 18.5 kg/m2), 8% among 119 normal-weight individuals (BMI of 18.5-24.9 kg/m2), 11% among 98 overweight individuals (BMI of 25-29.9 kg/m2), 18% among 67 obese individuals (BMI of 30-39.9 kg/m2), and 36% among 11 morbidly obese individuals (BMI of 40 kg/m2 or greater), Dr. Matthew B. Bloom reported at the annual meeting of the American Association for the Surgery of Trauma.
The odds of HIT were 170% greater among obese patients, compared with normal-weight patients (odds ratio, 2.67), and 600% greater among morbidly obese patients, compared with normal-weight patient (odds ratio, 6.98), said Dr. Bloom of Cedars-Sinai Medical Center, Los Angeles.
Logistic regression showed that each 1 unit increase in BMI was associated with a 7.7% increase in the odds of developing HIT, he noted.
Additionally, an anti-heparin/PF4 (platelet factor 4) antibody OD (optical density) value of 2.0 or greater, but not of 0.4 or greater or 0.8 or greater, was also significantly increased with BMI, and in-hospital mortality increased significantly with BMI above normal, he said.
Warkentin 4T scores used to differentiate HIT from other types of thrombocytopenia were not found to correlate with changes in BMI in this study, nor were deep vein thrombosis, pulmonary embolism, or stroke.
The increase in PF4 with increasing BMI may be a marker for overall increasing levels of circulating antibodies in the obese ICU population, but more biochemical studies are needed to tease this out, he said.
Patients included in the review were all those admitted to the surgical and cardiac ICUs at Cedars-Sinai over a more than 7 year period. They had a mean age of 62.1 years, 59% were men, and their mean BMI was 27 kg/m2.
The findings are among the first to show a strong association between BMI and HIT in ICU patients, Dr. Bloom said, noting that several other studies have shown that obesity is linked with increased incidence and increased severity of immune-mediated diseases, including rheumatoid arthritis, systemic lupus erythematosus, and inflammatory bowel disease.
“And HIT is an immune-mediated disease,” he added.
“BMI may be an important new clinical variable for estimating the pre-test probability of HIT, and perhaps, in the future, patient ‘thickness’ could be considered a new ‘T’ in the 4T score, he concluded.
Dr. Bloom reported having no disclosures.
AT THE AAST ANNUAL MEETING
Key clinical point: Higher body mass index is strongly associated with increased rates of heparin-induced thrombocytopenia.
Major finding: The HIT rate was 0%, 8%, 11%, 18,%, and 36% among underweight, normal-weight, overweight, obese, and morbidly obese individuals, respectively.
Data source: A review of prospectively collected data for 304 patients.
Disclosures: Dr. Bloom reported having no disclosures.
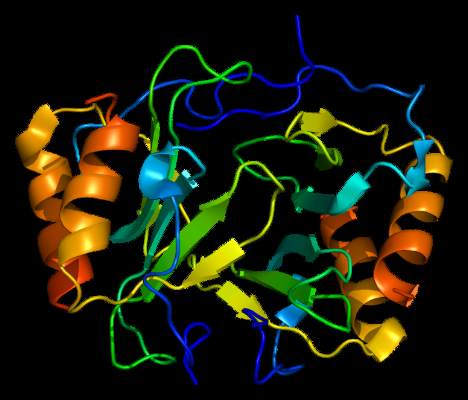
FDA grants drug orphan designation for hemophilia B
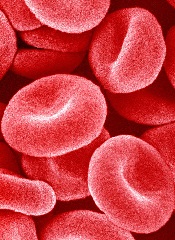
The US Food and Drug Administration (FDA) has granted orphan designation for DTX101 as a treatment for hemophilia B.
DTX101 is designed to deliver factor IX gene expression in a durable fashion to prevent the long-term complications of hemophilia B.
Preclinical studies have indicated that DTX101 has the potential to be a well-tolerated, effective therapy for hemophilia B, according to Dimension Therapeutics, Inc., the company developing DTX101.
The company said it expects to initiate a multicenter, phase 1/2 study to evaluate DTX101 in adults with moderate/severe to severe hemophilia B by the end of this year.
About orphan designation
The FDA grants orphan designation to drugs and biologics intended to treat rare diseases or conditions that affect fewer than 200,000 people in the US.
Orphan designation provides the company developing a drug with certain benefits, such as tax credits for qualified clinical trials, exemption from FDA user fees, and 7 years of market exclusivity if the drug is approved. ![]()
Troponin Test Can Predict Mortality Risk in Cardiovascular Patients
NEW YORK — An experimental, highly sensitive troponin test cannot predict when type 2 diabetics with stable ischemic heart disease will benefit from prompt coronary revascularization, but it can show which patients are more likely to die from myocardial infarction, stroke, or other cardiovascular cases, according to a new study.
Because the troponin test measures damage to heart muscle, the outcome "suggests there's ongoing injury to patients with stable heart disease and diabetes. It has a strong association with death, heart attack, stroke, heart failure," the chief author, Dr. Brendan Everett, director of inpatient general cardiology at Brigham and Women's Hospital in Boston, told Reuters Health in a telephone interview.
But when it comes to heading off a higher risk, "we need to do more research to understand where it's coming from and what therapies might be appropriate. So it does not appear in this population that opening the coronary arteries offers any long-term benefit with respect to death or heart attack," he said.
"It tells you this is not the type of disease status that can be managed by bypass or stenting," said Dr. David Zhao, chairman of cardiology at Wake Forest Baptist Medical Center in Winston-Salem, North Carolina. He was not involved in the research.
"From the patient's standpoint, it is disappointing," Dr. Zhao said. "But from a science standpoint, it all comes together nicely. These patients tend to have more small-vessel microvascular disease and the constant elevation of troponin indicates that there is more severe microvascular disease and more endomyocardial injury. I think it gives us the opportunity to look at more intensified medical management in this group of patients."
The study was an offshoot of the BARI 2D trial, conducted at 49 sites in six countries. It found that aggressive revascularization didn't reduce the risk of death or cardiovascular outcomes compared to intensive medical therapy alone in type 2 diabetics with stable heart disease.
In the new research, the team went back and used a highly sensitive troponin test sold in Europe but not available in the United States to see "if it could be used in stable patients to identify those who would benefit from having their coronary arteries opened with either angioplasty and stenting or bypass surgery," Dr. Everett said.
"There aren't many studies addressing that question and luckily BARI 2D had samples that were stored and available to us after the completion of the trial," he said. "What we did find was that there's clearly a group of patients that are at very high risk for death, heart attack, heart failure, and stroke."
The researchers found 27.1% of patients with a troponin T level of 14.0 ng/L or higher died from cardiovascular cause, or had a heart attack or stroke, compared to 12.9% of patients whose levels were lower, they reported online August 12 in the New England Journal of Medicine.
Adjusting for various factors, the risk of reaching one of those primary endpoints after five years was 85% greater with the higher troponin levels (P<0.001).
The risks for reaching individual components of the composite endpoint were also higher. Unadjusted five-year rates for patients with higher versus lower troponin levels were, respectively, 10.9% versus 3.5% for cardiovascular death, 18.7% versus 9.2% for myocardial infarction, 4.4% versus 2.3% for stroke, and 25.7% versus 11.1% for heart failure.
The Everett team also found that among the 897 volunteers whose levels had been at 14 or above, receiving a prompt intervention did not reduce their likelihood of reaching a primary endpoint compared to the 2,277 with normal concentrations.
The five-year rates of heart attack, stroke, or death from any cardiovascular cause were 26.5% in the revascularization group and 27.6% with medical therapy alone.
"We need to figure out how to better treat them, because fixing their coronary arteries doesn't seem to be giving them the benefit we thought it would, or hoped it would," said Dr. Everett. "For the time being, this is not a test that should be routinely used on stable patients."
The researchers also looked at how troponin levels changed over time.
"Despite aggressive medical therapy for type 2 diabetes and stable ischemic heart disease, the median troponin T concentration increased over one year of follow-up, and no significant reductions in troponin T concentrations were observed in patients who underwent coronary revascularization," the researchers said.
"If this type of patient has elevated troponin, I would be more aggressive in medical management, including statins, smoking cessation, and lifestyle changes," said Dr. Zhao of Wake Forest. "I think the next step would be to ideally run a clinical trial and see if, in patients with elevated troponin levels, intensified medical management reduces the number of events as compared to standard therapy.
Solitary confinement
A recent study released by the Association of State Correctional Administrators and researchers from Yale Law School has found that federal and state prisons are holding as many as 100,000 inmates in solitary confinement or isolated housing (“Large Number of Inmates in Solitary Poses Problem for Justice System, Study Says,” by Jess Bravin, Wall Street Journal, Sept. 2, 2015). This new data has turned up the volume of voices calling for abolishment of solitary confinement on the grounds that not only is it inhumane but also counterproductive.
Do you agree with abolitionists or are you sympathetic to some prison workers and administrators who say that there are situations in which social isolation is the best and maybe the only solution when a prisoner is a serious threat to the safety of his fellow inmates and staff?
While you are mulling over your answer, here is a related question more relevant to your own situation. How do you feel about solitary confinement (a.k.a., time-out) as a consequence for a misbehaving preschooler?
Do you think it is cruel and inhumane? Do you recommend it to parents as part of a comprehensive behavior-management strategy? Will many parents try it? Or, do they recoil and wonder why you would suggest that they become prison wardens in their own homes? If parents try it, is it effective?
In my experience, if done correctly in the right circumstances, time-out for a young child in his room – even if it requires latching the door – can be a safe, humane, and effective consequence for misbehavior. Sometimes, it is the only thing that works. But the devil is in the “ifs.”
First, time-out should be the last step in a comprehensive behavior-management strategy that begins with prevention – by assuring that the child is getting enough sleep and the right kind of attention from his parents who have expectations for their child that are appropriate for his age and temperament. The child’s environment and schedule should be structured to minimize the temptation to misbehave. Other less-drastic-sounding consequences must have been tried unsuccessfully. And ... both parent and child must be psychologically and developmentally normal.
Will brief episodes of solitary confinement make a young child feel insecure or unloved? Not if his parents make it clear by their behavior that she is loved and living in a stable environment, regardless of whether she is in time-out or not. Will time-out make a child hate her room? I’ve never seen it happen. If the child plays happily in her room during her sentence, does this render time-out ineffective? No, that’s a win-win situation. The misbehavior has stopped and the child is happy. Does this mean that time-out may not be a good deterrent? It might. But I have found that the only effective deterrent is consistent follow-up of every threat with the promised consequence – regardless of the consequence.
What if the child “destroys” his room during time-out? And is it safe to leave a child alone in his room? The solutions to these challenges can be found in Lowes or Home Depot.
I’m not going to take up any more of your recreational reading time describing the details of how time-out can be made more effective and palatable for parents. But it can be done and may require purchasing a latch or some kind of child-resistant door closure device. It will most likely be used briefly – if at all – but it can remain as a tangible reminder to the child that his parent follows up on his threats.
I won’t be surprised if some of you are shocked that I would advocate solitary confinement for young children. I am interested to hear what you recommend to parents who are struggling to keep their child’s behavior in bounds.
Dr. Wilkoff practiced primary care pediatrics in Brunswick, Maine, for nearly 40 years. He has authored several books on behavioral pediatrics, including “Coping With a Picky Eater.”

Lives saved with lower systolic BP: SPRINT trial
Deaths were reduced by nearly one-quarter when systolic blood pressure was treated to a target of 120 rather than 140 mm Hg, according to a large NIH-sponsored study comparing standard blood pressure treatment with more-intensive lowering of systolic blood pressure. The lower blood pressure group also saw a 30% reduction in the composite primary composite endpoint of cardiovascular events, stroke, and cardiovascular death.
The magnitude of the effect of the lower blood pressure target prompted the study’s data safety monitoring board to end the study early, said officials from several National Institutes of Health agencies at a telebriefing. The study was unblinded in August 2015, and a full report of the primary outcome measures will come in a paper due out by the end of the year, they said.

The Systolic Blood Pressure Intervention Trial, or SPRINT, is a 100-site trial that enrolled more than 9,300 people in the United States and Puerto Rico aged at least 50 years with high blood pressure and at risk for cardiovascular disease; those with diabetes were excluded. Patients were randomized to a standard treatment target of 140 mm Hg or less, or to a more intensive 120 mm Hg.
SPRINT participants received evidence-based treatment with a variety of antihypertensives, with the intervention arm requiring an average of almost three medications, compared with just under two for the less-intensive treatment arm.
Against a backdrop of uncertainty in the literature about what the target systolic blood pressure should be for those with hypertension and at risk for cardiovascular events or kidney disease, the study provides compelling evidence that more-aggressive blood pressure lowering is important. “More-intensive management of blood pressure can save lives,” said Dr. Gary Gibbons, director of the National Heart, Lung, and Blood Institute. This is good news, he said, since about one in three Americans has high blood pressure, and only about half of those 70 million currently have their blood pressure under control.
Dr. Jackson T. Wright Jr., SPRINT study lead and director of the clinical hypertension program at Case Western Reserve University in Cleveland, also emphasized that intensive blood pressure management can prevent the cardiovascular complications of hypertension. Though subgroup analysis is ongoing, the effect seems robust and consistent across age groups, sex, and ethnicity, he said. SPRINT, he said, also “offers an excellent opportunity to examine the tolerability and safety of the lower target.” The first look at the safety data shows that the more-intensive treatment is well tolerated, though data analysis is ongoing, he said.
Dr. Suzanne Oparil, director of the vascular biology and hypertension program at the University of Alabama-Birmingham, said, “This is a time of enlightenment.” The previous absence of compelling data played a part in the debate surrounding blood pressure levels that should be used in guidance documents, and Dr. Gibbons and Dr. Wright both emphasized that they would expect the forthcoming primary outcomes paper to have an impact on guideline-writing bodies. Dr. Wright said, however, “We are not providing guidance for providers or patients right now. The study was just unblinded a little less than 3 weeks ago.”
In 2014, the group of experts who had constituted the JNC 8 panel, a team assembled in 2008 by NHLBI to update official U.S. hypertension management guidelines, set the target blood pressure for the general population aged 60 years or older to less than 150/90 mm Hg, a major break from long-standing practice to treat such patients to a target systolic pressure of less than 140 mm Hg (JAMA. 2014;311[5]:507-20). These guidelines, released after SPRINT began, remain controversial.
The SPRINT MIND trial, tracking the relationship between systolic blood pressure and cognitive impairment or dementia, is ongoing. The study is also still collecting data about kidney function in study participants.
The study was funded by the National Institutes of Health. Two drug companies, Takeda and Arbor, provided some medication for the trial.
On Twitter @karioakes
Deaths were reduced by nearly one-quarter when systolic blood pressure was treated to a target of 120 rather than 140 mm Hg, according to a large NIH-sponsored study comparing standard blood pressure treatment with more-intensive lowering of systolic blood pressure. The lower blood pressure group also saw a 30% reduction in the composite primary composite endpoint of cardiovascular events, stroke, and cardiovascular death.
The magnitude of the effect of the lower blood pressure target prompted the study’s data safety monitoring board to end the study early, said officials from several National Institutes of Health agencies at a telebriefing. The study was unblinded in August 2015, and a full report of the primary outcome measures will come in a paper due out by the end of the year, they said.
The Systolic Blood Pressure Intervention Trial, or SPRINT, is a 100-site trial that enrolled more than 9,300 people in the United States and Puerto Rico aged at least 50 years with high blood pressure and at risk for cardiovascular disease; those with diabetes were excluded. Patients were randomized to a standard treatment target of 140 mm Hg or less, or to a more intensive 120 mm Hg.
SPRINT participants received evidence-based treatment with a variety of antihypertensives, with the intervention arm requiring an average of almost three medications, compared with just under two for the less-intensive treatment arm.
Against a backdrop of uncertainty in the literature about what the target systolic blood pressure should be for those with hypertension and at risk for cardiovascular events or kidney disease, the study provides compelling evidence that more-aggressive blood pressure lowering is important. “More-intensive management of blood pressure can save lives,” said Dr. Gary Gibbons, director of the National Heart, Lung, and Blood Institute. This is good news, he said, since about one in three Americans has high blood pressure, and only about half of those 70 million currently have their blood pressure under control.
Dr. Jackson T. Wright Jr., SPRINT study lead and director of the clinical hypertension program at Case Western Reserve University in Cleveland, also emphasized that intensive blood pressure management can prevent the cardiovascular complications of hypertension. Though subgroup analysis is ongoing, the effect seems robust and consistent across age groups, sex, and ethnicity, he said. SPRINT, he said, also “offers an excellent opportunity to examine the tolerability and safety of the lower target.” The first look at the safety data shows that the more-intensive treatment is well tolerated, though data analysis is ongoing, he said.
Dr. Suzanne Oparil, director of the vascular biology and hypertension program at the University of Alabama-Birmingham, said, “This is a time of enlightenment.” The previous absence of compelling data played a part in the debate surrounding blood pressure levels that should be used in guidance documents, and Dr. Gibbons and Dr. Wright both emphasized that they would expect the forthcoming primary outcomes paper to have an impact on guideline-writing bodies. Dr. Wright said, however, “We are not providing guidance for providers or patients right now. The study was just unblinded a little less than 3 weeks ago.”
In 2014, the group of experts who had constituted the JNC 8 panel, a team assembled in 2008 by NHLBI to update official U.S. hypertension management guidelines, set the target blood pressure for the general population aged 60 years or older to less than 150/90 mm Hg, a major break from long-standing practice to treat such patients to a target systolic pressure of less than 140 mm Hg (JAMA. 2014;311[5]:507-20). These guidelines, released after SPRINT began, remain controversial.
The SPRINT MIND trial, tracking the relationship between systolic blood pressure and cognitive impairment or dementia, is ongoing. The study is also still collecting data about kidney function in study participants.
The study was funded by the National Institutes of Health. Two drug companies, Takeda and Arbor, provided some medication for the trial.
On Twitter @karioakes
FROM AN NHLBI TELEBRIEFING