User login
New composite measure improves warfarin anticoagulation monitoring
A new composite measure that incorporates both time in therapeutic range and international normalized ratio variability appears to be more accurate than either of these tests alone at monitoring warfarin anticoagulation, according to a report published online Sept. 29 in Circulation: Cardiovascular Quality and Outcomes.
Time in therapeutic range (TTR) and international normalized ratio (INR) variability track two different aspects of anticoagulation control. TTR measures the percentage of time that patients spend within the therapeutic range while taking warfarin, which reflects the amount of time that treatment intensity was appropriate. INR variability measures variations in the stability of warfarin’s anticoagulation effects over time. Most clinicians monitor their patients using one or the other of these measures, usually TTR. A composite measure that combines the two “would encourage providers to focus on all components of anticoagulation control, not just those measured by the current standard of care, TTR,” said Dr. Zayd Razouki of the Center for Health Services Research in Primary Care, Durham (N.C.) Veterans Affairs Medical Center, and his associates.
It is important to note that a substantial number of patients taking warfarin could be classified as having poor control of anticoagulation by one of these measures, but good control by the other. Combining TTR with INR variability would ensure that both appropriate intensity and appropriate stability of warfarin therapy were being used to judge each patient’s anticoagulation control, they noted.
The investigators devised such a measure, a summary score they called WCM (warfarin composite measure). They then compared the performance of all three measures at predicting major warfarin-related complications, using as a sample population 40,404 participants in the Veterans Affairs Study to Improve Anticoagulation (VARIA). These study subjects were aged 65 years or older (mean age 76), had been taking warfarin for at least 6 months to treat atrial fibrillation, and were followed for an average of 14 months for the development of ischemic stroke, major bleeding, and fatal bleeding.
A total of 3.1% of these patients developed ischemic stroke, 6.4% developed major bleeding, and 0.9% developed fatal bleeding while taking warfarin. After the data were adjusted to account for numerous potential confounding factors, WCM correlated most closely with risk for adverse warfarin-related clinical events, Dr. Razouki and his associates wrote (Circ Cardiovasc Qual Outcomes. 2015 Sep 29. doi:10.1161/circoutcomes.115.001789).
Their findings also indicate that WCM may be a more accurate measure of a clinic’s or a medical system’s performance at monitoring anticoagulation than either their average TTR or INR variability alone.
The study results may not be generalizable to all populations, because this VA sample was overwhelmingly male (98%), the investigators added.
FROM CIRCULATION: CARDIOVASCULAR QUALITY AND OUTCOMES
Key clinical point: A composite measure that combines TTR with INR variability appears more accurate than either of these individual tests at monitoring warfarin anticoagulation.
Major finding: Of the participants, 3.1% developed ischemic stroke, 6.4% developed major bleeding, and 0.9% developed fatal bleeding while taking warfarin.
Data source: A secondary analysis of data from the Veterans Affairs Study to Improve Anticoagulation, involving 40,404 VA patients taking warfarin for AF during a 2-year period.
Disclosures: This study was supported by the Durham VA Medical Center and VA Health Service Research and Development. Dr. Razouki and his associates reported having no relevant financial disclosures.
Mind your ABCDs, and your Es, when caring for a ‘difficult patient’
Much has been written about “the difficult patient” in the medical literature.1,2 Also labeled as a “heartsink patient,” “hateful patient,” and “black hole,” they possess characteristics that evoke powerful, often negative, emotional responses in providers that can be counter-therapeutic. “The difficult provider” also is thought to contribute to the failure of the patient encounter,3 and providers may have limited awareness of these patient–provider characteristics that can lead to such interactions. Early identification of these characteristics is essential to implementing effective interventions for the care of a difficult patient.
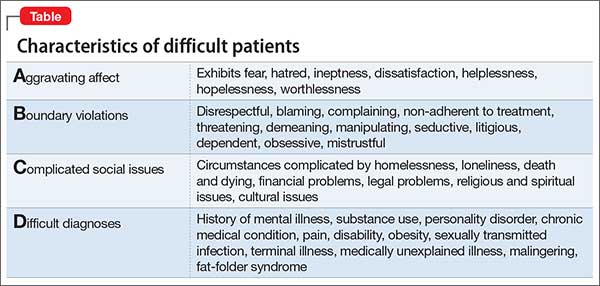
The mnemonic ABCD highlights patient characteristics that suggest you are dealing with a difficult patient (Table).
7 Negatives that affect the provider–patient relationship
The 7 Es highlight negative provider-related variables that contribute to perceived and actual difficulty providing care. As a psychiatrist doing consultation-liaison work, this memory device also can be a tool to educate physician–colleagues, nursing staff, and other members of the treatment team.
Expertise. Lack of basic knowledge or experience with your patient’s condition and circumstances, or not being familiar with available resources, could limit your confidence, be counter-productive, and lead to inappropriate care.
Experiences. Current and past life experiences could negatively color a provider’s feelings, thoughts, and interactions with the patient. Negative interpersonal experiences could manifest as countertransference.
Empathy. The inability to empathize makes it difficult to understand the patient, creating distance between you and the patient.
Engagement level. A lack of rapport and ineffective communication leads to a patient feeling misunderstood and unsatisfied with the clinical interaction.
Emotions. Feeling tired, angry, or resentful harms the provider–patient interaction.
Environment. A stressful, loud, pressured environment filled with distractions can undermine the provider–patient relationship.
Extra help. Limited access to, and the unavailability of, social services, housing, and similar resources could make an already difficult situation seem impossible to solve. Working without such help can lead to feelings of helplessness and hopelessness for you and your patient.
Disclosures
The authors report no financial relationships with any company whose products are mentioned in this article or with manufacturers of competing products. The views expressed in this publication/presentation are those of the authors and do not reflect the official policy or position of the Department of the Army, Department of Defense, or the U.S. Government.
1. Strous RD, Ulman A, Kotler M. The hateful patient revisited: relevance for 21st century medicine. Eur J Intern Med. 2006;17(6):387-393.
2. Smith S. Dealing with the difficult patient. Postgrad Med J. 1995;71(841):653-657.
3. Hawken SJ. Strategies for dealing with the challenging patient. N Z Fam Physician. 2005;32(4):266-269.
Much has been written about “the difficult patient” in the medical literature.1,2 Also labeled as a “heartsink patient,” “hateful patient,” and “black hole,” they possess characteristics that evoke powerful, often negative, emotional responses in providers that can be counter-therapeutic. “The difficult provider” also is thought to contribute to the failure of the patient encounter,3 and providers may have limited awareness of these patient–provider characteristics that can lead to such interactions. Early identification of these characteristics is essential to implementing effective interventions for the care of a difficult patient.
The mnemonic ABCD highlights patient characteristics that suggest you are dealing with a difficult patient (Table).
7 Negatives that affect the provider–patient relationship
The 7 Es highlight negative provider-related variables that contribute to perceived and actual difficulty providing care. As a psychiatrist doing consultation-liaison work, this memory device also can be a tool to educate physician–colleagues, nursing staff, and other members of the treatment team.
Expertise. Lack of basic knowledge or experience with your patient’s condition and circumstances, or not being familiar with available resources, could limit your confidence, be counter-productive, and lead to inappropriate care.
Experiences. Current and past life experiences could negatively color a provider’s feelings, thoughts, and interactions with the patient. Negative interpersonal experiences could manifest as countertransference.
Empathy. The inability to empathize makes it difficult to understand the patient, creating distance between you and the patient.
Engagement level. A lack of rapport and ineffective communication leads to a patient feeling misunderstood and unsatisfied with the clinical interaction.
Emotions. Feeling tired, angry, or resentful harms the provider–patient interaction.
Environment. A stressful, loud, pressured environment filled with distractions can undermine the provider–patient relationship.
Extra help. Limited access to, and the unavailability of, social services, housing, and similar resources could make an already difficult situation seem impossible to solve. Working without such help can lead to feelings of helplessness and hopelessness for you and your patient.
Disclosures
The authors report no financial relationships with any company whose products are mentioned in this article or with manufacturers of competing products. The views expressed in this publication/presentation are those of the authors and do not reflect the official policy or position of the Department of the Army, Department of Defense, or the U.S. Government.
1. Strous RD, Ulman A, Kotler M. The hateful patient revisited: relevance for 21st century medicine. Eur J Intern Med. 2006;17(6):387-393.
2. Smith S. Dealing with the difficult patient. Postgrad Med J. 1995;71(841):653-657.
3. Hawken SJ. Strategies for dealing with the challenging patient. N Z Fam Physician. 2005;32(4):266-269.
Postpartum preeclampsia, mother dies: $6.9M settlement

Postpartum preeclampsia, mother dies: $6.9M settlement
Four days after delivery of a healthy child, a 31-year-old mother went to the emergency department (ED) reporting tightness in her chest, difficulty breathing, and swelling in her lower extremities. Pulmonary embolism was ruled out and she was discharged. When she returned 3 days later, her legs were more swollen than before and her systolic blood pressure was 160 mm Hg. She was sent home again. Four days later, she suffered a seizure at home, in the ambulance during transport, and at the hospital. She was transferred to another facility a few days later where she died a week after transfer.
Estate’s Claim The ED physicians and hospital staff were negligent in not diagnosing and treating postpartum preeclampsia. This led to seizures, brain damage, and death. Antihypertensive and antiseizure medications would have prevented her death.
Defendant’s defense The actions taken were reasonable because she had no symptoms of preeclampsia during pregnancy or delivery.
Verdict A $6.9 million Illinois settlement was reached.
Ovary not removed; cyst develops
A 38-year-old woman underwent what was planned as total hysterectomy with bilateral salpingo-oophorectomy. The procedure was prophylactic: she had been treated for stage 3 breast cancer and her family history put her at high risk for developing ovarian cancer. Two days after surgery, the pathology report noted only 1 ovary.
Two months later, the patient went to the ED with right lower quadrant pain. It was determined that she had an ovarian cyst. She underwent additional surgery to remove the right ovary.
Patient’s claim The gynecologist was negligent in failing to remove the patient’s right ovary.
Physician’s defense Failure to remove the ovary was due to the patient’s abnormal anatomy.
Verdict A $250,000 Missouri verdict was returned.
Microcephaly not detected before birth
At 19 weeks’ gestation, an ultrasonographic anatomy scan showed that both hands of the fetus were clenched tightly. Amniocentesis results were reported as normal. No further fetal testing was ordered.
At birth, the baby was found to have Dandy Walker Variant, a severe brain malformation. The child has difficulty moving, is cognitively impaired, and requires a feeding tube and 24-hour care.
Parents’ claim Seen on ultrasonography, the fetus’ clenched fists were a sign of possible fetal abnormality. The maternal-fetal medicine (MFM) specialist who evaluated the ultrasound and amniocentesis and the ObGyn should have recommended fetal magnetic resonance imaging, which would have shown the microcephaly. If the parents had known of the abnormality, they would have terminated the pregnancy.
Defendant’s defense The case was settled during trial.
Verdict A $6 million New Jersey settlement was reached, including $5 million from the MFM and $1 million from the ObGyn.
Injury during hydrothermal ablation
When a 41-year-old woman underwent hydrothermal ablation to treat menorrhagia, her uterus was perforated and hot saline solution injured her intestines. During repair surgery, 21 inches of bowel were resected and a colostomy was created, which was reversed 8 months later.
Patient’s claim The gynecologist was negligent in performing the ablation. The manufacturer produced a poorly designed device.
Defendant’s defense The rupture was spontaneous. The procedure was properly performed. The device is safe.
Verdict A $2 million Kansas verdict was returned. The gynecologist was found 60% at fault and the manufacturer was 40% at fault. The patient’s net recovery was $322,300 due to the state cap.
In This Article
- Ovary not removed; cyst develops
- Microcephaly not detected before birth
- Injury during hydrothermal ablation

Mastering finance for your practice—without an MBA
Being a caring, knowledgeable clinician is vital for patient care, but having such skill does not necessarily mean that running a medical practice comes easy— especially if you do not have a basic background in business. Financial fundamentals are rarely taught in residency and, with administrative burdens increasingly placed on physicians in solo and small practices, it isn’t surprising that many practitioners feel underprepared.
Fortunately, it doesn’t take a master’s degree in business administration to conquer these challenges. You just need some understanding of key operating principles.
Accounting basics
It isn’t personal; it’s only business. Delineate the point at which personal finances stop and business finances begin. Make sure that you have a business checking account and credit card, and run all your business expenses through those accounts—never through your personal accounts. That policy will save you time if your practice is audited and, more important, will help you be efficient by guiding your focus to the right set of numbers by which to manage the practice.
Set up a system to track transactions. Many businesses use the accounting software QuickBooks; the program can generate sophisticated reports, and many banks can export data to it automatically. But QuickBooks might be more complicated than what you need to get started; a simple spreadsheet program, such as Excel, might suffice. By working through the numbers yourself, you gain a more intimate knowledge of the state of your finances.
Assemble a team of experts to assist you, at least in the beginning, with building a core knowledge base and good habits. Don’t think that this absolves you of responsibility, however: Ultimately, you sign off on what your advisors recommend. For example, an accountant can prepare your tax return, but you review and approve it, and a financial advisor might recommend certain investments, but only you can authorize them. You might work with a banker for a business loan or a bookkeeper to help you with your day-to-day record-keeping, but no one can give you the critical thinking you need to maximize your financial success.
The devil is in those details
Delve into your practice’s profit/loss statement, or create one if it doesn’t exist. Understanding these data is critical for maintaining financial health. Without knowing how much money you are taking in and where it is going, you cannot be confident that your business model is viable.
Revenue is easier to digest because it typically derives from only a few sources: professional fees and interest and, perhaps, speaking engagements, consultation to trainees, teaching, and rental income.
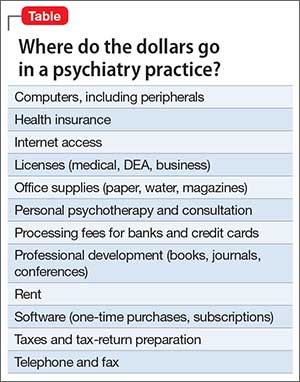
Expenses. Getting a grasp of where the money goes is more challenging. Common examples of costs of running a practice include, but aren’t limited to, the list in the Table.
By doing this basic profit/loss math, you will see how much money should be left over (profit) at the end of the month. To confirm, reconcile your numbers with your monthly business checking account statement; QuickBooks does this semi-automatically, or you can do it by hand. Reconciliation might feel uncomfortable if you are a novice to accounting, but spending a few moments to catch an error now is far less onerous than remedying what began as a small mistake and compounded to a big one over the years.
Other financial reports, such as a balance sheet and a statement of cash flow, are useful for giving you a sense of your practice’s long-term financial health. Typically, however, they are unnecessary during early stages of establishing a practice—and the work they require can be overwhelming.
After you’re done with the math
Based on your financial analysis of the practice, you will be able to pay yourself a salary based on the profit (that is, revenue minus expenses). Before you take your salary, however:
• Consider keeping enough in your business checking account to pay next month’s bills.
• Remember to adjust your monthly compensation downward by 20% to 50% to withhold for payroll and estimated federal and state taxes.
• Look into tax-advantaged business benefit plans. A retirement account, certain savings plans (eg, flexible spending accounts for dependent care or health care), a commuter plan, and life insurance paid for by the business can make your income go further. Some of these benefits are available only to employees of corporations; crunch the numbers, however, and discuss with your accountant whether the cost of incorporating is worthwhile.
• Determine whether hiring an assistant, or adding an additional one, will increase your bottom line. You incur significant expenses by hiring an employee—salary, payroll taxes, and time spent training, to name a few—but doing so might be worth it if the time that he (she) saves you opens up billable hours for seeing patients.
Good care requires a solid foundation
Caring for people who are suffering, while being financially successful, are not contradictory goals. Although you deal with a person’s private, intense feelings when you provide care, you also have an obligation to ensure the financial health of your practice.
Disclosure
Dr. Braslow is the founder of Luminello.com.
Being a caring, knowledgeable clinician is vital for patient care, but having such skill does not necessarily mean that running a medical practice comes easy— especially if you do not have a basic background in business. Financial fundamentals are rarely taught in residency and, with administrative burdens increasingly placed on physicians in solo and small practices, it isn’t surprising that many practitioners feel underprepared.
Fortunately, it doesn’t take a master’s degree in business administration to conquer these challenges. You just need some understanding of key operating principles.
Accounting basics
It isn’t personal; it’s only business. Delineate the point at which personal finances stop and business finances begin. Make sure that you have a business checking account and credit card, and run all your business expenses through those accounts—never through your personal accounts. That policy will save you time if your practice is audited and, more important, will help you be efficient by guiding your focus to the right set of numbers by which to manage the practice.
Set up a system to track transactions. Many businesses use the accounting software QuickBooks; the program can generate sophisticated reports, and many banks can export data to it automatically. But QuickBooks might be more complicated than what you need to get started; a simple spreadsheet program, such as Excel, might suffice. By working through the numbers yourself, you gain a more intimate knowledge of the state of your finances.
Assemble a team of experts to assist you, at least in the beginning, with building a core knowledge base and good habits. Don’t think that this absolves you of responsibility, however: Ultimately, you sign off on what your advisors recommend. For example, an accountant can prepare your tax return, but you review and approve it, and a financial advisor might recommend certain investments, but only you can authorize them. You might work with a banker for a business loan or a bookkeeper to help you with your day-to-day record-keeping, but no one can give you the critical thinking you need to maximize your financial success.
The devil is in those details
Delve into your practice’s profit/loss statement, or create one if it doesn’t exist. Understanding these data is critical for maintaining financial health. Without knowing how much money you are taking in and where it is going, you cannot be confident that your business model is viable.
Revenue is easier to digest because it typically derives from only a few sources: professional fees and interest and, perhaps, speaking engagements, consultation to trainees, teaching, and rental income.
Expenses. Getting a grasp of where the money goes is more challenging. Common examples of costs of running a practice include, but aren’t limited to, the list in the Table.
By doing this basic profit/loss math, you will see how much money should be left over (profit) at the end of the month. To confirm, reconcile your numbers with your monthly business checking account statement; QuickBooks does this semi-automatically, or you can do it by hand. Reconciliation might feel uncomfortable if you are a novice to accounting, but spending a few moments to catch an error now is far less onerous than remedying what began as a small mistake and compounded to a big one over the years.
Other financial reports, such as a balance sheet and a statement of cash flow, are useful for giving you a sense of your practice’s long-term financial health. Typically, however, they are unnecessary during early stages of establishing a practice—and the work they require can be overwhelming.
After you’re done with the math
Based on your financial analysis of the practice, you will be able to pay yourself a salary based on the profit (that is, revenue minus expenses). Before you take your salary, however:
• Consider keeping enough in your business checking account to pay next month’s bills.
• Remember to adjust your monthly compensation downward by 20% to 50% to withhold for payroll and estimated federal and state taxes.
• Look into tax-advantaged business benefit plans. A retirement account, certain savings plans (eg, flexible spending accounts for dependent care or health care), a commuter plan, and life insurance paid for by the business can make your income go further. Some of these benefits are available only to employees of corporations; crunch the numbers, however, and discuss with your accountant whether the cost of incorporating is worthwhile.
• Determine whether hiring an assistant, or adding an additional one, will increase your bottom line. You incur significant expenses by hiring an employee—salary, payroll taxes, and time spent training, to name a few—but doing so might be worth it if the time that he (she) saves you opens up billable hours for seeing patients.
Good care requires a solid foundation
Caring for people who are suffering, while being financially successful, are not contradictory goals. Although you deal with a person’s private, intense feelings when you provide care, you also have an obligation to ensure the financial health of your practice.
Disclosure
Dr. Braslow is the founder of Luminello.com.
How coffee and cigarettes can affect the response to psychopharmacotherapy
When a patient who smokes enters a tobacco-free medical facility and has access to caffeinated beverages, he (she) might experience toxicity to many pharmaceuticals and caffeine. Similarly, if a patient is discharged from a smoke-free environment with a newly adjusted medication regimen and resumes smoking or caffeine consumption, alterations in enzyme activity might reduce therapeutic efficacy of prescribed medicines. These effects are a result of alterations in the hepatic cytochrome P450 (CYP) enzyme system.
Taking a careful history of tobacco and caffeine use, and knowing the effects that these substances will have on specific medications, will help guide treatment and management decisions.
The role of CYP enzymes
CYP hepatic enzymes detoxify a variety of environmental agents into water-soluble compounds that are excreted in urine. CYP1A2 metabolizes 20% of drugs handled by the CYP system and comprises 13% of all the CYP enzymes expressed in the liver. The wide interindividual variation in CYP1A2 enzyme activity is influenced by a combination of genetic, epigenetic, ethnic, and environmental variables.1
Influence of tobacco on CYP
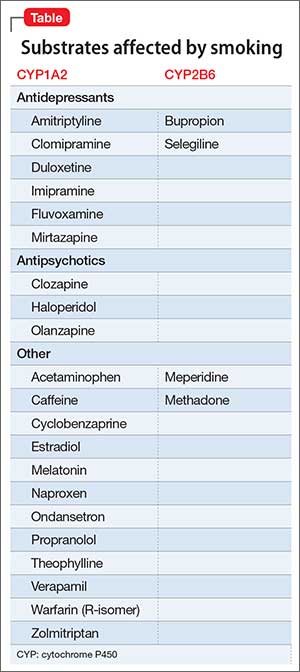
The polycyclic aromatic hydrocarbons in tobacco smoke induce CYP1A2 and CYP2B6 hepatic enzymes.2 Smokers exhibit increased activity of these enzymes, which results in faster clearance of many drugs, lower concentrations in blood, and diminished clinical response. The Table lists psychotropic medicines that are metabolized by CYP1A2 and CYP2B6. Co-administration of these substrates could decrease the elimination rate of other drugs also metabolized by CYP1A2. Nicotine in tobacco or in nicotine replacement therapies does not play a role in inducing CYP enzymes.
Psychiatric patients smoke at a higher rate than the general population.2 One study found that approximately 70% of patients with schizophrenia and as many as 45% of those with bipolar disorder smoke enough cigarettes (7 to 20 a day) to induce CYP1A2 and CYP2B6 activity.2 Patients who smoke and are given clozapine, haloperidol, or olanzapine show a lower serum concentration than non-smokers; in fact, the clozapine level can be reduced as much as 2.4-fold.2-5 Subsequently, patients can experience diminished clinical response to these 3 psychotropics.3
The turnover time for CYP1A2 is rapid— approximately 3 days—and a new CYP1A2 steady state activity is reached after approximately 1 week,4 which is important to remember when managing inpatients in a smoke-free facility. During acute hospitalization, patients could experience drug toxicity if the outpatient dosage is maintained.5
When they resume smoking after being discharged on a stabilized dosage of any of the medications listed in the Table, previous enzyme activity rebounds and might reduce the drug level, potentially leading to inadequate clinical response.
Caffeine and other substances
Asking about the patient’s caffeine intake is necessary because consumption of coffee is prevalent among smokers, and caffeine is metabolized by CYP1A2. Smokers need to consume as much as 4 times the amount of caffeine as non-smokers to achieve a similar caffeine serum concentration.2 Caffeine can form an insoluble precipitate with antipsychotic medication in the gut, which decreases absorption. The interaction between smoking-related induction of CYP1A2 enzymes and forced smoking cessation during hospitalization, with ongoing caffeine consumption, could lead to caffeine toxicity.4,5
Other common inducers of CYP1A2 are insulin, cabbage, cauliflower, broccoli, and charcoal-grilled meat. Also, cumin and turmeric inhibit CYP1A2 activity, which might explain an ethnic difference in drug tolerance across population groups. Additionally, certain genetic polymorphisms, in specific ethnic distributions, alter the potential for tobacco smoke to induce CYP1A2.6
Some of these polymorphisms can be genotyped for clinical application.3
Asking about a patient’s tobacco and caffeine use and understanding their interactions with specific medications provides guidance when prescribing antipsychotic medications and adjusting dosage for inpatients and during clinical follow-up care.
Disclosures
The authors report no financial relationships with any company whose products are mentioned in this article or with manufacturers of competing products.
1. Wang B, Zhou SF. Synthetic and natural compounds that interact with human cytochrome P450 1A2 and implications in drug development. Curr Med Chem. 2009;16(31):4066-4218.
2. Lucas C, Martin J. Smoking and drug interactions. Australian Prescriber. 2013;36(3):102-104.
3. Eap CB, Bender S, Jaquenoud Sirot E, et al. Nonresponse to clozapine and ultrarapid CYP1A2 activity: clinical data and analysis of CYP1A2 gene. J Clin Psychopharmacol. 2004; 24(2):214-209.
4. Faber MS, Fuhr U. Time response of cytochrome P450 1A2 activity on cessation of heavy smoking. Clin Pharmacol Ther. 2004;76(2):178-184.
5. Berk M, Ng F, Wang WV, et al. Going up in smoke: tobacco smoking is associated with worse treatment outcomes in mania. J Affect Disord. 2008;110(1-2):126-134.
6. Zhou SF, Yang LP, Zhou ZW, et al. Insights into the substrate specificity, inhibitors, regulation, and polymorphisms and the clinical impact of human cytochrome P450 1A2. AAPS. 2009;11(3):481-494.
When a patient who smokes enters a tobacco-free medical facility and has access to caffeinated beverages, he (she) might experience toxicity to many pharmaceuticals and caffeine. Similarly, if a patient is discharged from a smoke-free environment with a newly adjusted medication regimen and resumes smoking or caffeine consumption, alterations in enzyme activity might reduce therapeutic efficacy of prescribed medicines. These effects are a result of alterations in the hepatic cytochrome P450 (CYP) enzyme system.
Taking a careful history of tobacco and caffeine use, and knowing the effects that these substances will have on specific medications, will help guide treatment and management decisions.
The role of CYP enzymes
CYP hepatic enzymes detoxify a variety of environmental agents into water-soluble compounds that are excreted in urine. CYP1A2 metabolizes 20% of drugs handled by the CYP system and comprises 13% of all the CYP enzymes expressed in the liver. The wide interindividual variation in CYP1A2 enzyme activity is influenced by a combination of genetic, epigenetic, ethnic, and environmental variables.1
Influence of tobacco on CYP
The polycyclic aromatic hydrocarbons in tobacco smoke induce CYP1A2 and CYP2B6 hepatic enzymes.2 Smokers exhibit increased activity of these enzymes, which results in faster clearance of many drugs, lower concentrations in blood, and diminished clinical response. The Table lists psychotropic medicines that are metabolized by CYP1A2 and CYP2B6. Co-administration of these substrates could decrease the elimination rate of other drugs also metabolized by CYP1A2. Nicotine in tobacco or in nicotine replacement therapies does not play a role in inducing CYP enzymes.
Psychiatric patients smoke at a higher rate than the general population.2 One study found that approximately 70% of patients with schizophrenia and as many as 45% of those with bipolar disorder smoke enough cigarettes (7 to 20 a day) to induce CYP1A2 and CYP2B6 activity.2 Patients who smoke and are given clozapine, haloperidol, or olanzapine show a lower serum concentration than non-smokers; in fact, the clozapine level can be reduced as much as 2.4-fold.2-5 Subsequently, patients can experience diminished clinical response to these 3 psychotropics.3
The turnover time for CYP1A2 is rapid— approximately 3 days—and a new CYP1A2 steady state activity is reached after approximately 1 week,4 which is important to remember when managing inpatients in a smoke-free facility. During acute hospitalization, patients could experience drug toxicity if the outpatient dosage is maintained.5
When they resume smoking after being discharged on a stabilized dosage of any of the medications listed in the Table, previous enzyme activity rebounds and might reduce the drug level, potentially leading to inadequate clinical response.
Caffeine and other substances
Asking about the patient’s caffeine intake is necessary because consumption of coffee is prevalent among smokers, and caffeine is metabolized by CYP1A2. Smokers need to consume as much as 4 times the amount of caffeine as non-smokers to achieve a similar caffeine serum concentration.2 Caffeine can form an insoluble precipitate with antipsychotic medication in the gut, which decreases absorption. The interaction between smoking-related induction of CYP1A2 enzymes and forced smoking cessation during hospitalization, with ongoing caffeine consumption, could lead to caffeine toxicity.4,5
Other common inducers of CYP1A2 are insulin, cabbage, cauliflower, broccoli, and charcoal-grilled meat. Also, cumin and turmeric inhibit CYP1A2 activity, which might explain an ethnic difference in drug tolerance across population groups. Additionally, certain genetic polymorphisms, in specific ethnic distributions, alter the potential for tobacco smoke to induce CYP1A2.6
Some of these polymorphisms can be genotyped for clinical application.3
Asking about a patient’s tobacco and caffeine use and understanding their interactions with specific medications provides guidance when prescribing antipsychotic medications and adjusting dosage for inpatients and during clinical follow-up care.
Disclosures
The authors report no financial relationships with any company whose products are mentioned in this article or with manufacturers of competing products.
1. Wang B, Zhou SF. Synthetic and natural compounds that interact with human cytochrome P450 1A2 and implications in drug development. Curr Med Chem. 2009;16(31):4066-4218.
2. Lucas C, Martin J. Smoking and drug interactions. Australian Prescriber. 2013;36(3):102-104.
3. Eap CB, Bender S, Jaquenoud Sirot E, et al. Nonresponse to clozapine and ultrarapid CYP1A2 activity: clinical data and analysis of CYP1A2 gene. J Clin Psychopharmacol. 2004; 24(2):214-209.
4. Faber MS, Fuhr U. Time response of cytochrome P450 1A2 activity on cessation of heavy smoking. Clin Pharmacol Ther. 2004;76(2):178-184.
5. Berk M, Ng F, Wang WV, et al. Going up in smoke: tobacco smoking is associated with worse treatment outcomes in mania. J Affect Disord. 2008;110(1-2):126-134.
6. Zhou SF, Yang LP, Zhou ZW, et al. Insights into the substrate specificity, inhibitors, regulation, and polymorphisms and the clinical impact of human cytochrome P450 1A2. AAPS. 2009;11(3):481-494.
Study reveals higher than expected post-discharge mortality after trauma
LAS VEGAS – A higher-than-expected proportion of trauma-related deaths occur in the months and years after hospital discharge, according to findings from a prospective cohort study.
In 908 trauma patients followed for up to 9.8 years (median, 1.7 years), overall mortality was 27%, and in 509 patients followed for at least 2 years, overall mortality was 38%. Mortality was highest among those who were severely injured (43% at 5 years), Dr. Rachael A. Callcut reported at the annual meeting of the American Association for the Surgery of Trauma.

The median Injury Severity Scale score was 18, but for all ISS groups, survival was significantly worse than predicted actuarial survival for that group – even after exclusion of deaths that occurred within 30 days, she said.
For example, at 5 years, predicted actuarial survival was greater than 95%, but actual survival was about 90% for those with ISS less than 15, about 85% for those with ISS of 15-24, and about 57% for those with ISS greater than 24. This dose-response–like relationship between injury severity and mortality demonstrates that the deaths are not just occurring in “patients who are old and would have died from a heart attack anyway” she explained.
The 30-day mortality in the cohort was 22%, and in-hospital mortality was 22.9%, as eight patients who died after the first 30 days did so in the hospital. Forty-five of the 245 deaths (18%) occurred after 30 days, and 36 of those (80%) occurred after hospital discharge, meaning the out-of-hospital mortality rate was 5.3% overall, and 10% for the most severely injured (hazard ratio, 2.7 for the most severe vs. the least severe injuries).
“I personally found this quite striking given that when a patient leaves the hospital, we feel, to some degree, that we won – only to find out that at least 5% of these patients will go on to subsequently die,” said Dr. Callcut of the University of California San Francisco, adding that “if you look at it slightly differently, which is even more concerning, 37 of the out-of-hospital deaths of the total of 245 deaths, mean that out-of-hospital deaths account for 15% of the total mortality following trauma.”
Further, of the deaths that occurred after 30 days, 53% occurred between 31 days and 1 year after trauma, and trauma was the leading cause of postdischarge death, accounting for 41% of the late deaths, she said.
The patients included in this analysis were all highest level trauma activation patients enrolled in the ongoing study between 2005 and 2012. Comprehensive prospective data were collected, and patients were followed throughout their hospitalization and after discharge. Institutional medical records or death certificates were used to determine timing and cause of death, and survival status was determined based on the last date of care in the institution or by query of the National Death Index for 2013.
These findings provide a rare glimpse of trauma-related outcomes among patients discharged from the hospital. Most prior studies focused on 30-day outcomes, with a few extended out to 90 days, but very few studies have looked at long-term outcomes, Dr. Callcut noted.
“You could say that despite having survived to leave the hospital alive, long-term survival is actually worse than predicted actuarial survival, and this suggests to us that successful hospital discharge does not mean success for your patient,” she concluded.
Dr. Callcut was supported in part by a National Institutes of Health award.
LAS VEGAS – A higher-than-expected proportion of trauma-related deaths occur in the months and years after hospital discharge, according to findings from a prospective cohort study.
In 908 trauma patients followed for up to 9.8 years (median, 1.7 years), overall mortality was 27%, and in 509 patients followed for at least 2 years, overall mortality was 38%. Mortality was highest among those who were severely injured (43% at 5 years), Dr. Rachael A. Callcut reported at the annual meeting of the American Association for the Surgery of Trauma.
The median Injury Severity Scale score was 18, but for all ISS groups, survival was significantly worse than predicted actuarial survival for that group – even after exclusion of deaths that occurred within 30 days, she said.
For example, at 5 years, predicted actuarial survival was greater than 95%, but actual survival was about 90% for those with ISS less than 15, about 85% for those with ISS of 15-24, and about 57% for those with ISS greater than 24. This dose-response–like relationship between injury severity and mortality demonstrates that the deaths are not just occurring in “patients who are old and would have died from a heart attack anyway” she explained.
The 30-day mortality in the cohort was 22%, and in-hospital mortality was 22.9%, as eight patients who died after the first 30 days did so in the hospital. Forty-five of the 245 deaths (18%) occurred after 30 days, and 36 of those (80%) occurred after hospital discharge, meaning the out-of-hospital mortality rate was 5.3% overall, and 10% for the most severely injured (hazard ratio, 2.7 for the most severe vs. the least severe injuries).
“I personally found this quite striking given that when a patient leaves the hospital, we feel, to some degree, that we won – only to find out that at least 5% of these patients will go on to subsequently die,” said Dr. Callcut of the University of California San Francisco, adding that “if you look at it slightly differently, which is even more concerning, 37 of the out-of-hospital deaths of the total of 245 deaths, mean that out-of-hospital deaths account for 15% of the total mortality following trauma.”
Further, of the deaths that occurred after 30 days, 53% occurred between 31 days and 1 year after trauma, and trauma was the leading cause of postdischarge death, accounting for 41% of the late deaths, she said.
The patients included in this analysis were all highest level trauma activation patients enrolled in the ongoing study between 2005 and 2012. Comprehensive prospective data were collected, and patients were followed throughout their hospitalization and after discharge. Institutional medical records or death certificates were used to determine timing and cause of death, and survival status was determined based on the last date of care in the institution or by query of the National Death Index for 2013.
These findings provide a rare glimpse of trauma-related outcomes among patients discharged from the hospital. Most prior studies focused on 30-day outcomes, with a few extended out to 90 days, but very few studies have looked at long-term outcomes, Dr. Callcut noted.
“You could say that despite having survived to leave the hospital alive, long-term survival is actually worse than predicted actuarial survival, and this suggests to us that successful hospital discharge does not mean success for your patient,” she concluded.
Dr. Callcut was supported in part by a National Institutes of Health award.
AT THE AAST ANNUAL MEETING
Key clinical point: A concerning proportion of trauma-related deaths occur after hospital discharge, according to findings from a prospective cohort study.
Major finding: The out-of-hospital mortality rate was 5.3% overall, and 10% for the most severely injured (hazard ratio, 2.7 for the most vs. least severely injured).
Data source: A prospective cohort study involving 908 patients.
Disclosures: Dr. Callcut was supported in part by a National Institutes of Health award.

Brexpiprazole for schizophrenia and as adjunct for major depressive disorder
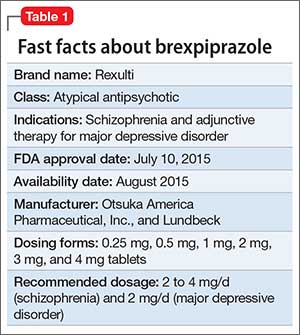
Brexpiprazole, FDA-approved in July 2015 to treat schizophrenia and as an adjunct for major depressive disorder (MDD) (Table 1), has shown efficacy in 2 phase-III acute trials for each indication.1-6 Although brexpiprazole is a dopamine D2 partial agonist, it differs from aripiprazole, the other available D2 partial agonist, because it is more potent at serotonin 5-HT1A and 5-HT2A receptors and displays less intrinsic activity at D2 receptors,7 which could mean better tolerability.
Clinical implications
Schizophrenia is heterogeneous, and individual response and tolerability to antipsychotics vary greatly8; therefore, new drug options are useful. For MDD, before the availability of brexpiprazole, only 3 antipsychotics were FDA-approved for adjunctive use with antidepressant therapy9; brexpiprazole represents another agent for patients whose depressive symptoms persist after standard antidepressant treatment.
Variables that limit the use of antipsychotics include extrapyramidal symptoms (EPS), akathisia, sedation/somnolence, weight gain, metabolic abnormalities, and hyperprolactinemia. If post-marketing studies and clinical experience confirm that brexpiprazole has an overall favorable side-effect profile regarding these tolerability obstacles, brexpiprazole would potentially have advantages over some other available agents, including aripiprazole.
How it works
In addition to a subnanomolar binding affinity (Ki < 1 nM) to dopamine D2 receptors as a partial agonist, brexpiprazole also exhibits similar binding affinities for serotonin 5-HT1A (partial agonist), 5-HT2A (antagonist), and adrenergic α1B (antagonist) and α2C (antagonist) receptors.7
Brexpiprazole also has high affinity (Ki < 5 nM) for dopamine D3 (partial ago nist), serotonin 5-HT2B (antagonist), and 5-HT7 (antagonist), and at adrenergic α1A (antagonist) and α1D (antagonist) receptors. Brexpiprazole has moderate affinity for histamine H1 receptors (Ki = 19 nM, antagonist), and low affinity for muscarinic M1 receptors (Ki > 1000 nM, antagonist).
Brexpiprazole’s pharmacodynamic profile differs from other available antipsychotics, including aripiprazole. Whether this translates to meaningful differences in efficacy and tolerability will depend on the outcomes of specifically designed clinical trials as well as “real-world” experience. Animal models have suggested amelioration of schizophrenia-like behavior, depression-like behavior, and anxiety-like behavior with brexipiprazole.6
Pharmacokinetics
At 91 hours, brexpiprazole’s half-life is relatively long; a steady-state concentration therefore is attained in approximately 2 weeks.1 In the phase-III clinical trials, brexpiprazole was titrated to target dosages, and therefore the product label recommends the same. Brexpiprazole can be administered with or without food.
In a study of brexpiprazole excretion, after a single oral dose of [14C]-labeled brexpiprazole, approximately 25% and 46% of the administered radioactivity was recovered in urine and feces, respectively. Less than 1% of unchanged brexpiprazole was excreted in the urine, and approximately 14% of the oral dose was recovered unchanged in the feces.
Exposure, as measured by maximum concentration and area under the concentration curve, is dose proportional.
Metabolism of brexpiprazole is mediated principally by cytochrome P450 (CYP) 3A4 and CYP2D6. Based on in vitro data, brexpiprazole shows little or no inhibition of CYP450 isozymes.
Efficacy
FDA approval for brexpiprazole for schizophrenia and for adjunctive use in MDD was based on 4 phase-III pivotal acute clinical trials conducted in adults, 2 studies each for each disorder.1-6 These studies are described in Table 2.2-5
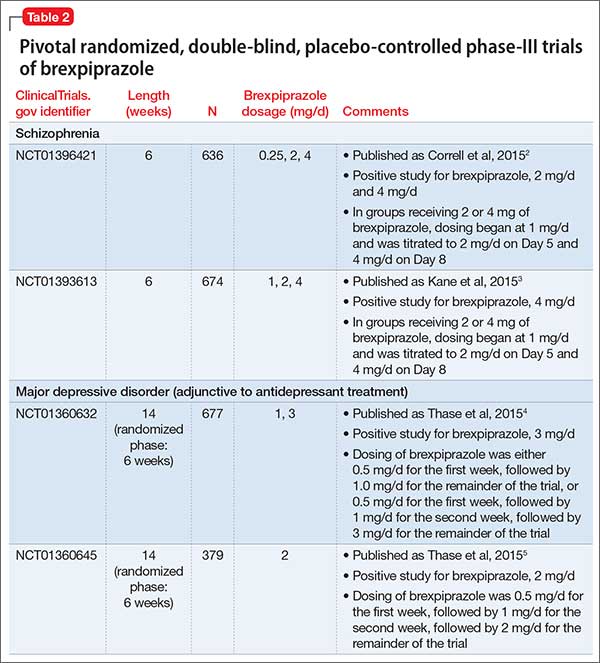
Schizophrenia. The primary outcome measure for the acute schizophrenia trials was change on the Positive and Negative Syndrome Scale (PANSS) total scores from baseline to 6-week endpoint. Statistically significant reductions in PANSS total score were observed for brexpiprazole dosages of 2 mg/d and 4 mg/d in one study,2 and 4 mg/d in another study.3 Responder rates also were measured, with response defined as a reduction of ≥30% from baseline in PANSS total score or a Clinical Global Impressions-Improvement score of 1 (very much improved) or 2 (much improved).2,3 Pooling together the available data for the recommended target dosage of brexpiprazole for schizophrenia (2 to 4 mg/d) from the 2 phase-III studies, 45.5% of patients responded to the drug, compared with 31% for the pooled placebo groups, yielding a number needed to treat (NNT) of 7 (95% CI, 5-12).6
Although not described in product labeling, a phase-III 52-week maintenance study demonstrated brexpiprazole’s efficacy in preventing exacerbation of psychotic symptoms and impending relapse in patients with schizophrenia.10 Time from randomization to exacerbation of psychotic symptoms or impending relapse showed a beneficial effect with brexpiprazole compared with placebo (log-rank test: hazard ratio = 0.292, P < .0001). Significantly fewer patients in the brexpiprazole group relapsed compared with placebo (13.5% vs 38.5%, P < .0001), resulting in a NNT of 4 (95% CI, 3-8).
Major depressive disorder. The primary outcome measure for the acute MDD studies was change in Montgomery-Åsberg Depression Rating Scale (MADRS) scores from baseline to 6-week endpoint of the randomized treatment phase. All patients were required to have a history of inadequate response to 1 to 3 treatment trials of standard antidepressants for their current depressive episode. In addition, patients entered the randomized phase only if they had an inadequate response to antidepressant therapy during an 8-week prospective treatment trial of standard antidepressant treatment plus single-blind placebo.
Participants who responded adequately to the antidepressant in the prospective single-blind phase were not randomized, but instead continued on antidepressant treatment plus single-blind placebo for 6 weeks.
The phase-III studies showed positive results for brexpiprazole, 2 mg/d and 3 mg/d, with change in MADRS from baseline to endpoint superior to that observed with placebo.4,5
When examining treatment response, defined as a reduction of ≥50% in MADRS total score from baseline, NNT vs placebo for response were 12 at all dosages tested, however, NNT vs placebo for remission (defined as MADRS total score ≤10 and ≥50% improvement from baseline) ranged from 17 to 31 and were not statistically significant.6 When the results for brexpiprazole, 1 mg/d, 2 mg/d, and 3 mg/d, from the 2 phase-III trials are pooled together, 23.2% of the patients receiving brexpiprazole were responders, vs 14.5% for placebo, yielding a NNT of 12 (95% CI, 8-26); 14.4% of the brexpiprazole-treated patients met remission criteria, vs 9.6% for placebo, resulting in a NNT of 21 (95% CI, 12-138).6
Tolerability
Overall tolerability can be evaluated by examining the percentage of patients who discontinued the clinical trials because of an adverse event (AE). In the acute schizophrenia double-blind trials for the recommended dosage range of 2 to 4 mg, the discontinuation rates were lower overall for patients receiving brexpiprazole compared with placebo.2,3 In the acute MDD trials, 32.6% of brexpiprazole-treated patients and 10.7% of placebo-treated patients discontinued because of AEs,4,5 yielding a number needed to harm (NNH) of 53 (95% CI, 30-235).6
The most commonly encountered AEs for MDD (incidence ≥5% and at least twice the rate for placebo) were akathisia (8.6% vs 1.7% for brexpiprazole vs placebo, and dose-related) and weight gain (6.7% vs 1.9%),1 with NNH values of 15 (95% CI, 11-23), and 22 (95% CI, 15-42), respectively.6 The most commonly encountered AE for schizophrenia (incidence ≥4% and at least twice the rate for placebo) was weight gain (4% vs 2%),1 with a NNH of 50 (95% CI, 26-1773).6
Of note, rates of akathisia in the schizophrenia trials were 5.5% for brexpiprazole and 4.6% for placebo,1 yielding a non-statistically significant NNH of 112.6 In a 6-week exploratory study,11 the incidence of EPS-related AEs including akathisia was lower for brexpiprazole-treated patients (14.1%) compared with those receiving aripiprazole (30.3%), for a NNT advantage for brexpiprazole of 7 (not statistically significant).
Short-term weight gain appears modest; however, outliers with an increase of ≥7% of body weight were evident in open-label long-term safety studies.1,6 Effects on glucose and lipids were small. Minimal effects on prolactin were observed, and no clinically relevant effects on the QT interval were evident.
Contraindications
The only absolute contraindication for brexpiprazole is known hypersensitivity to brexpiprazole or any of its components. Reactions have included rash, facial swelling, urticaria, and anaphylaxis.1
As with all antipsychotics and antipsychotics with an indication for a depressive disorder:
• there is a bolded boxed warning in the product label regarding increased mortality in geriatric patients with dementia-related psychosis. Brexpiprazole is not approved for treating patients with dementia-related psychosis
• there is a bolded boxed warning in the product label about suicidal thoughts and behaviors in patients age ≤24. The safety and efficacy of brexpiprazole have not been established in pediatric patients.
Dosing
Schizophrenia. The recommended starting dosage for brexpiprazole for schizophrenia is 1 mg/d on Days 1 to 4. Brexpiprazole can be titrated to 2 mg/d on Day 5 through Day 7, then to 4 mg/d on Day 8 based on the patient’s response and ability to tolerate the medication. The recommended target dosage is 2 to 4 mg/d with a maximum recommended daily dosage of 4 mg.
Major depressive disorder. The recommended starting dosage for brexpiprazole as adjunctive treatment for MDD is 0.5 mg or 1 mg/d. Brexpiprazole can be titrated to 1 mg/d, then up to the target dosage of 2 mg/d, with dosage increases occurring at weekly intervals based on the patient’s clinical response and ability to tolerate the agent, with a maximum recommended dosage of 3 mg/d.
Other considerations. For patients with moderate to severe hepatic impairment, or moderate, severe, or end-stage renal impairment, the maximum recommended dosage is 3 mg/d for patients with schizophrenia, and 2 mg/d for patients with MDD.
In general, dosage adjustments are recommended in patients who are known CYP2D6 poor metabolizers and in those taking concomitant CYP3A4 inhibitors or CYP2D6 inhibitors or strong CYP3A4 inducers1:
• for strong CYP2D6 or CYP3A4 inhibitors, administer one-half the usual dosage
• for strong/moderate CYP2D6 with strong/moderate CYP3A4 inhibitors, administer a one-quarter of the usual dosage
• for known CYP2D6 poor metabolizers taking strong/moderate CYP3A4 inhibitors, also administer a one-quarter of the usual dosage
• for strong CYP3A4 inducers, double the usual dosage and further adjust based on clinical response.
In clinical trials for MDD, brexpiprazole dosage was not adjusted for strong CYP2D6 inhibitors (eg, paroxetine, fluoxetine). Therefore, CYP considerations are already factored into general dosing recommendations and brexpiprazole could be administered without dosage adjustment in patients with MDD; however, under these circumstances, it would be prudent to start brexpiprazole at 0.5 mg, which, although “on-label,” represents a low starting dosage. (Whenever 2 drugs are co-administered and 1 agent has the ability to disturb the metabolism of the other, using smaller increments to the target dosage and possibly waiting longer between dosage adjustments could help avoid potential drug–drug interactions.)
No dosage adjustment for brexpiprazole is required on the basis of sex, race or ethnicity, or smoking status. Although clinical studies did not include patients age ≥65, the product label recommends that in general, dose selection for a geriatric patient should be cautious, usually starting at the low end of the dosing range, reflecting the greater frequency of decreased hepatic, renal, and cardiac function, concomitant diseases, and other drug therapy.
Bottom Line
Brexpiprazole, an atypical antipsychotic, is FDA-approved for schizophrenia and as an adjunct to antidepressants in major depressive disorder. For both indications, brexpiprazole demonstrated positive results compared with placebo in phase-III trials. Brexpiprazole is more potent at serotonin 5-HT1A and 5-HT2A receptors and displays less intrinsic activity at D2 receptors than aripiprazole, which could mean that the drug may be better-tolerated.
Related Resources
• Citrome L. Brexpiprazole: a new dopamine D2 receptor partial agonist for the treatment of schizophrenia and major depressive disorder. Drugs Today (Barc). 2015;51(7):397-414.
• Citrome L, Stensbøl TB, Maeda K. The preclinical profile of brexpiprazole: what is its clinical relevance for the treatment of psychiatric disorders? Expert Rev Neurother. In press.
Drug Brand Names
Aripiprazole • Abilify
Brexpiprazole • Rexulti
Fluoxetine • Prozac
Paroxetine • Paxil
Disclosure
Dr. Citrome is a consultant to Alexza Pharmaceuticals, Alkermes, Allergan, Boehringer Ingelheim, Bristol-Myers Squibb, Eli Lilly and Company, Forum Pharmaceuticals, Genentech, Janssen, Jazz Pharmaceuticals, Lundbeck, Merck, Medivation, Mylan, Novartis, Noven, Otsuka, Pfizer, Reckitt Benckiser, Reviva, Shire, Sunovion, Takeda, Teva, and Valeant Pharmaceuticals; and is a speaker for Allergan, AstraZeneca, Janssen, Jazz Pharmaceuticals, Lundbeck, Merck, Novartis, Otsuka, Pfizer, Shire, Sunovion, Takeda, and Teva.
1. Rexulti [package insert]. Rockville, MD: Otsuka; 2015.
2. Correll CU, Skuban A, Ouyang J, et al. Efficacy and safety of brexpiprazole for the treatment of acute schizophrenia: a 6-week randomized, double-blind, placebo-controlled trial. Am J Psychiatry. 2015;172(9):870-880.
3. Kane JM, Skuban A, Ouyang J, et al. A multicenter, randomized, double-blind, controlled phase 3 trial of fixed-dose brexpiprazole for the treatment of adults with acute schizophrenia. Schizophr Res. 2015;164(1-3):127-135.
4. Thase ME, Youakim JM, Skuban A, et al. Adjunctive brexpiprazole 1 and 3 mg for patients with major depressive disorder following inadequate response to antidepressants: a phase 3, randomized, double-blind study [published online August 4, 2015]. J Clin Psychiatry. doi: 10.4088/ JCP.14m09689.
5. Thase ME, Youakim JM, Skuban A, et al. Efficacy and safety of adjunctive brexpiprazole 2 mg in major depressive disorder: a phase 3, randomized, placebo-controlled study in patients with inadequate response to antidepressants [published online August 4, 2015]. J Clin Psychiatry. doi: 10.4088/JCP.14m09688.
6. Citrome L. Brexpiprazole for schizophrenia and as adjunct for major depressive disorder: a systematic review of the efficacy and safety profile for this newly approved antipsychotic—what is the number needed to treat, number needed to harm and likelihood to be helped or harmed? Int J Clin Pract. 2015;69(9):978-997.
7. Maeda K, Sugino H, Akazawa H, et al. Brexpiprazole I: in vitro and in vivo characterization of a novel serotonin-dopamine activity modulator. J Pharmacol Exp Ther. 2014;350(3):589-604.
8. Volavka J, Citrome L. Oral antipsychotics for the treatment of schizophrenia: heterogeneity in efficacy and tolerability should drive decision-making. Expert Opin Pharmacother. 2009;10(12):1917-1928.
9. Citrome L. Adjunctive aripiprazole, olanzapine, or quetiapine for major depressive disorder: an analysis of number needed to treat, number needed to harm, and likelihood to be helped or harmed. Postgrad Med. 2010;122(4):39-48.
10. Hobart M, Ouyang J, Forbes A, et al. Efficacy and safety of brexpiprazole (OPC-34712) as maintenance treatment in adults with schizophrenia: a randomized, double-blind, placebo-controlled study. Poster presented at: the American Society of Clinical Psychopharmacology Annual Meeting; June 22 to 25, 2015; Miami, FL.
11. Citrome L, Ota A, Nagamizu K, Perry P, et al. The effect of brexpiprazole (OPC‐34712) versus aripiprazole in adult patients with acute schizophrenia: an exploratory study. Poster presented at: the Society of Biological Psychiatry Annual Scientific Meeting and Convention; May 15, 2015; Toronto, Ontario, Canada.
Brexpiprazole, FDA-approved in July 2015 to treat schizophrenia and as an adjunct for major depressive disorder (MDD) (Table 1), has shown efficacy in 2 phase-III acute trials for each indication.1-6 Although brexpiprazole is a dopamine D2 partial agonist, it differs from aripiprazole, the other available D2 partial agonist, because it is more potent at serotonin 5-HT1A and 5-HT2A receptors and displays less intrinsic activity at D2 receptors,7 which could mean better tolerability.
Clinical implications
Schizophrenia is heterogeneous, and individual response and tolerability to antipsychotics vary greatly8; therefore, new drug options are useful. For MDD, before the availability of brexpiprazole, only 3 antipsychotics were FDA-approved for adjunctive use with antidepressant therapy9; brexpiprazole represents another agent for patients whose depressive symptoms persist after standard antidepressant treatment.
Variables that limit the use of antipsychotics include extrapyramidal symptoms (EPS), akathisia, sedation/somnolence, weight gain, metabolic abnormalities, and hyperprolactinemia. If post-marketing studies and clinical experience confirm that brexpiprazole has an overall favorable side-effect profile regarding these tolerability obstacles, brexpiprazole would potentially have advantages over some other available agents, including aripiprazole.
How it works
In addition to a subnanomolar binding affinity (Ki < 1 nM) to dopamine D2 receptors as a partial agonist, brexpiprazole also exhibits similar binding affinities for serotonin 5-HT1A (partial agonist), 5-HT2A (antagonist), and adrenergic α1B (antagonist) and α2C (antagonist) receptors.7
Brexpiprazole also has high affinity (Ki < 5 nM) for dopamine D3 (partial ago nist), serotonin 5-HT2B (antagonist), and 5-HT7 (antagonist), and at adrenergic α1A (antagonist) and α1D (antagonist) receptors. Brexpiprazole has moderate affinity for histamine H1 receptors (Ki = 19 nM, antagonist), and low affinity for muscarinic M1 receptors (Ki > 1000 nM, antagonist).
Brexpiprazole’s pharmacodynamic profile differs from other available antipsychotics, including aripiprazole. Whether this translates to meaningful differences in efficacy and tolerability will depend on the outcomes of specifically designed clinical trials as well as “real-world” experience. Animal models have suggested amelioration of schizophrenia-like behavior, depression-like behavior, and anxiety-like behavior with brexipiprazole.6
Pharmacokinetics
At 91 hours, brexpiprazole’s half-life is relatively long; a steady-state concentration therefore is attained in approximately 2 weeks.1 In the phase-III clinical trials, brexpiprazole was titrated to target dosages, and therefore the product label recommends the same. Brexpiprazole can be administered with or without food.
In a study of brexpiprazole excretion, after a single oral dose of [14C]-labeled brexpiprazole, approximately 25% and 46% of the administered radioactivity was recovered in urine and feces, respectively. Less than 1% of unchanged brexpiprazole was excreted in the urine, and approximately 14% of the oral dose was recovered unchanged in the feces.
Exposure, as measured by maximum concentration and area under the concentration curve, is dose proportional.
Metabolism of brexpiprazole is mediated principally by cytochrome P450 (CYP) 3A4 and CYP2D6. Based on in vitro data, brexpiprazole shows little or no inhibition of CYP450 isozymes.
Efficacy
FDA approval for brexpiprazole for schizophrenia and for adjunctive use in MDD was based on 4 phase-III pivotal acute clinical trials conducted in adults, 2 studies each for each disorder.1-6 These studies are described in Table 2.2-5
Schizophrenia. The primary outcome measure for the acute schizophrenia trials was change on the Positive and Negative Syndrome Scale (PANSS) total scores from baseline to 6-week endpoint. Statistically significant reductions in PANSS total score were observed for brexpiprazole dosages of 2 mg/d and 4 mg/d in one study,2 and 4 mg/d in another study.3 Responder rates also were measured, with response defined as a reduction of ≥30% from baseline in PANSS total score or a Clinical Global Impressions-Improvement score of 1 (very much improved) or 2 (much improved).2,3 Pooling together the available data for the recommended target dosage of brexpiprazole for schizophrenia (2 to 4 mg/d) from the 2 phase-III studies, 45.5% of patients responded to the drug, compared with 31% for the pooled placebo groups, yielding a number needed to treat (NNT) of 7 (95% CI, 5-12).6
Although not described in product labeling, a phase-III 52-week maintenance study demonstrated brexpiprazole’s efficacy in preventing exacerbation of psychotic symptoms and impending relapse in patients with schizophrenia.10 Time from randomization to exacerbation of psychotic symptoms or impending relapse showed a beneficial effect with brexpiprazole compared with placebo (log-rank test: hazard ratio = 0.292, P < .0001). Significantly fewer patients in the brexpiprazole group relapsed compared with placebo (13.5% vs 38.5%, P < .0001), resulting in a NNT of 4 (95% CI, 3-8).
Major depressive disorder. The primary outcome measure for the acute MDD studies was change in Montgomery-Åsberg Depression Rating Scale (MADRS) scores from baseline to 6-week endpoint of the randomized treatment phase. All patients were required to have a history of inadequate response to 1 to 3 treatment trials of standard antidepressants for their current depressive episode. In addition, patients entered the randomized phase only if they had an inadequate response to antidepressant therapy during an 8-week prospective treatment trial of standard antidepressant treatment plus single-blind placebo.
Participants who responded adequately to the antidepressant in the prospective single-blind phase were not randomized, but instead continued on antidepressant treatment plus single-blind placebo for 6 weeks.
The phase-III studies showed positive results for brexpiprazole, 2 mg/d and 3 mg/d, with change in MADRS from baseline to endpoint superior to that observed with placebo.4,5
When examining treatment response, defined as a reduction of ≥50% in MADRS total score from baseline, NNT vs placebo for response were 12 at all dosages tested, however, NNT vs placebo for remission (defined as MADRS total score ≤10 and ≥50% improvement from baseline) ranged from 17 to 31 and were not statistically significant.6 When the results for brexpiprazole, 1 mg/d, 2 mg/d, and 3 mg/d, from the 2 phase-III trials are pooled together, 23.2% of the patients receiving brexpiprazole were responders, vs 14.5% for placebo, yielding a NNT of 12 (95% CI, 8-26); 14.4% of the brexpiprazole-treated patients met remission criteria, vs 9.6% for placebo, resulting in a NNT of 21 (95% CI, 12-138).6
Tolerability
Overall tolerability can be evaluated by examining the percentage of patients who discontinued the clinical trials because of an adverse event (AE). In the acute schizophrenia double-blind trials for the recommended dosage range of 2 to 4 mg, the discontinuation rates were lower overall for patients receiving brexpiprazole compared with placebo.2,3 In the acute MDD trials, 32.6% of brexpiprazole-treated patients and 10.7% of placebo-treated patients discontinued because of AEs,4,5 yielding a number needed to harm (NNH) of 53 (95% CI, 30-235).6
The most commonly encountered AEs for MDD (incidence ≥5% and at least twice the rate for placebo) were akathisia (8.6% vs 1.7% for brexpiprazole vs placebo, and dose-related) and weight gain (6.7% vs 1.9%),1 with NNH values of 15 (95% CI, 11-23), and 22 (95% CI, 15-42), respectively.6 The most commonly encountered AE for schizophrenia (incidence ≥4% and at least twice the rate for placebo) was weight gain (4% vs 2%),1 with a NNH of 50 (95% CI, 26-1773).6
Of note, rates of akathisia in the schizophrenia trials were 5.5% for brexpiprazole and 4.6% for placebo,1 yielding a non-statistically significant NNH of 112.6 In a 6-week exploratory study,11 the incidence of EPS-related AEs including akathisia was lower for brexpiprazole-treated patients (14.1%) compared with those receiving aripiprazole (30.3%), for a NNT advantage for brexpiprazole of 7 (not statistically significant).
Short-term weight gain appears modest; however, outliers with an increase of ≥7% of body weight were evident in open-label long-term safety studies.1,6 Effects on glucose and lipids were small. Minimal effects on prolactin were observed, and no clinically relevant effects on the QT interval were evident.
Contraindications
The only absolute contraindication for brexpiprazole is known hypersensitivity to brexpiprazole or any of its components. Reactions have included rash, facial swelling, urticaria, and anaphylaxis.1
As with all antipsychotics and antipsychotics with an indication for a depressive disorder:
• there is a bolded boxed warning in the product label regarding increased mortality in geriatric patients with dementia-related psychosis. Brexpiprazole is not approved for treating patients with dementia-related psychosis
• there is a bolded boxed warning in the product label about suicidal thoughts and behaviors in patients age ≤24. The safety and efficacy of brexpiprazole have not been established in pediatric patients.
Dosing
Schizophrenia. The recommended starting dosage for brexpiprazole for schizophrenia is 1 mg/d on Days 1 to 4. Brexpiprazole can be titrated to 2 mg/d on Day 5 through Day 7, then to 4 mg/d on Day 8 based on the patient’s response and ability to tolerate the medication. The recommended target dosage is 2 to 4 mg/d with a maximum recommended daily dosage of 4 mg.
Major depressive disorder. The recommended starting dosage for brexpiprazole as adjunctive treatment for MDD is 0.5 mg or 1 mg/d. Brexpiprazole can be titrated to 1 mg/d, then up to the target dosage of 2 mg/d, with dosage increases occurring at weekly intervals based on the patient’s clinical response and ability to tolerate the agent, with a maximum recommended dosage of 3 mg/d.
Other considerations. For patients with moderate to severe hepatic impairment, or moderate, severe, or end-stage renal impairment, the maximum recommended dosage is 3 mg/d for patients with schizophrenia, and 2 mg/d for patients with MDD.
In general, dosage adjustments are recommended in patients who are known CYP2D6 poor metabolizers and in those taking concomitant CYP3A4 inhibitors or CYP2D6 inhibitors or strong CYP3A4 inducers1:
• for strong CYP2D6 or CYP3A4 inhibitors, administer one-half the usual dosage
• for strong/moderate CYP2D6 with strong/moderate CYP3A4 inhibitors, administer a one-quarter of the usual dosage
• for known CYP2D6 poor metabolizers taking strong/moderate CYP3A4 inhibitors, also administer a one-quarter of the usual dosage
• for strong CYP3A4 inducers, double the usual dosage and further adjust based on clinical response.
In clinical trials for MDD, brexpiprazole dosage was not adjusted for strong CYP2D6 inhibitors (eg, paroxetine, fluoxetine). Therefore, CYP considerations are already factored into general dosing recommendations and brexpiprazole could be administered without dosage adjustment in patients with MDD; however, under these circumstances, it would be prudent to start brexpiprazole at 0.5 mg, which, although “on-label,” represents a low starting dosage. (Whenever 2 drugs are co-administered and 1 agent has the ability to disturb the metabolism of the other, using smaller increments to the target dosage and possibly waiting longer between dosage adjustments could help avoid potential drug–drug interactions.)
No dosage adjustment for brexpiprazole is required on the basis of sex, race or ethnicity, or smoking status. Although clinical studies did not include patients age ≥65, the product label recommends that in general, dose selection for a geriatric patient should be cautious, usually starting at the low end of the dosing range, reflecting the greater frequency of decreased hepatic, renal, and cardiac function, concomitant diseases, and other drug therapy.
Bottom Line
Brexpiprazole, an atypical antipsychotic, is FDA-approved for schizophrenia and as an adjunct to antidepressants in major depressive disorder. For both indications, brexpiprazole demonstrated positive results compared with placebo in phase-III trials. Brexpiprazole is more potent at serotonin 5-HT1A and 5-HT2A receptors and displays less intrinsic activity at D2 receptors than aripiprazole, which could mean that the drug may be better-tolerated.
Related Resources
• Citrome L. Brexpiprazole: a new dopamine D2 receptor partial agonist for the treatment of schizophrenia and major depressive disorder. Drugs Today (Barc). 2015;51(7):397-414.
• Citrome L, Stensbøl TB, Maeda K. The preclinical profile of brexpiprazole: what is its clinical relevance for the treatment of psychiatric disorders? Expert Rev Neurother. In press.
Drug Brand Names
Aripiprazole • Abilify
Brexpiprazole • Rexulti
Fluoxetine • Prozac
Paroxetine • Paxil
Disclosure
Dr. Citrome is a consultant to Alexza Pharmaceuticals, Alkermes, Allergan, Boehringer Ingelheim, Bristol-Myers Squibb, Eli Lilly and Company, Forum Pharmaceuticals, Genentech, Janssen, Jazz Pharmaceuticals, Lundbeck, Merck, Medivation, Mylan, Novartis, Noven, Otsuka, Pfizer, Reckitt Benckiser, Reviva, Shire, Sunovion, Takeda, Teva, and Valeant Pharmaceuticals; and is a speaker for Allergan, AstraZeneca, Janssen, Jazz Pharmaceuticals, Lundbeck, Merck, Novartis, Otsuka, Pfizer, Shire, Sunovion, Takeda, and Teva.
1. Rexulti [package insert]. Rockville, MD: Otsuka; 2015.
2. Correll CU, Skuban A, Ouyang J, et al. Efficacy and safety of brexpiprazole for the treatment of acute schizophrenia: a 6-week randomized, double-blind, placebo-controlled trial. Am J Psychiatry. 2015;172(9):870-880.
3. Kane JM, Skuban A, Ouyang J, et al. A multicenter, randomized, double-blind, controlled phase 3 trial of fixed-dose brexpiprazole for the treatment of adults with acute schizophrenia. Schizophr Res. 2015;164(1-3):127-135.
4. Thase ME, Youakim JM, Skuban A, et al. Adjunctive brexpiprazole 1 and 3 mg for patients with major depressive disorder following inadequate response to antidepressants: a phase 3, randomized, double-blind study [published online August 4, 2015]. J Clin Psychiatry. doi: 10.4088/ JCP.14m09689.
5. Thase ME, Youakim JM, Skuban A, et al. Efficacy and safety of adjunctive brexpiprazole 2 mg in major depressive disorder: a phase 3, randomized, placebo-controlled study in patients with inadequate response to antidepressants [published online August 4, 2015]. J Clin Psychiatry. doi: 10.4088/JCP.14m09688.
6. Citrome L. Brexpiprazole for schizophrenia and as adjunct for major depressive disorder: a systematic review of the efficacy and safety profile for this newly approved antipsychotic—what is the number needed to treat, number needed to harm and likelihood to be helped or harmed? Int J Clin Pract. 2015;69(9):978-997.
7. Maeda K, Sugino H, Akazawa H, et al. Brexpiprazole I: in vitro and in vivo characterization of a novel serotonin-dopamine activity modulator. J Pharmacol Exp Ther. 2014;350(3):589-604.
8. Volavka J, Citrome L. Oral antipsychotics for the treatment of schizophrenia: heterogeneity in efficacy and tolerability should drive decision-making. Expert Opin Pharmacother. 2009;10(12):1917-1928.
9. Citrome L. Adjunctive aripiprazole, olanzapine, or quetiapine for major depressive disorder: an analysis of number needed to treat, number needed to harm, and likelihood to be helped or harmed. Postgrad Med. 2010;122(4):39-48.
10. Hobart M, Ouyang J, Forbes A, et al. Efficacy and safety of brexpiprazole (OPC-34712) as maintenance treatment in adults with schizophrenia: a randomized, double-blind, placebo-controlled study. Poster presented at: the American Society of Clinical Psychopharmacology Annual Meeting; June 22 to 25, 2015; Miami, FL.
11. Citrome L, Ota A, Nagamizu K, Perry P, et al. The effect of brexpiprazole (OPC‐34712) versus aripiprazole in adult patients with acute schizophrenia: an exploratory study. Poster presented at: the Society of Biological Psychiatry Annual Scientific Meeting and Convention; May 15, 2015; Toronto, Ontario, Canada.
HHS funds experimental flu drug for hospital patients
The U.S. Department of Health & Human Services’ Office of the Assistant Secretary for Preparedness and Response (ASPR) will provide “technical assistance and funding” to Janssen Pharmaceuticals for the development of an influenza antiviral drug that could be more potent and have a longer treatment window than do existing influenza drugs, according a statement from HHS.
The experimental drug, which Janssen intends to use to treat hospitalized patients with influenza, is called JNJ-872, also known as VX787, and may be the first in an entirely new class of influenza antivirals.

ASPR’s Biomedical Advanced Research and Development Authority (BARDA) specifically will provide up to $103.5 million over the next 4 years and 3 months to Janssen, and the contract leaves open the possibility of BARDA providing additional funding, capped at $131 million, for this project. BARDA’s contribution is part of its program for “advanced research and development, innovation, acquisition, and manufacturing of vaccines, drugs, diagnostic tools, and nonpharmaceutical products for public health emergency threats.”
Janssen will use the funds to conduct late stage clinical development of JNJ-872, which includes phase III studies in high-risk populations and hospitalized patients, and the final development of a validated commercial-scale manufacturing process. The pharmaceutical company will also explore the feasibility of an innovative approach to manufacturing, which allows for the continuous flow of materials throughout the manufacturing process, unlike the traditional manufacturing process, which is riddled with interruptions.
“BARDA’s goal for supporting JNJ-872 is development of a product that can be used not only to treat hospitalized influenza patients but also to treat patients for whom influenza poses high risks, such as the elderly, pediatrics, and those with chronic conditions such as COPD and heart disease ...,” the statement indicated.
The U.S. Department of Health & Human Services’ Office of the Assistant Secretary for Preparedness and Response (ASPR) will provide “technical assistance and funding” to Janssen Pharmaceuticals for the development of an influenza antiviral drug that could be more potent and have a longer treatment window than do existing influenza drugs, according a statement from HHS.
The experimental drug, which Janssen intends to use to treat hospitalized patients with influenza, is called JNJ-872, also known as VX787, and may be the first in an entirely new class of influenza antivirals.
ASPR’s Biomedical Advanced Research and Development Authority (BARDA) specifically will provide up to $103.5 million over the next 4 years and 3 months to Janssen, and the contract leaves open the possibility of BARDA providing additional funding, capped at $131 million, for this project. BARDA’s contribution is part of its program for “advanced research and development, innovation, acquisition, and manufacturing of vaccines, drugs, diagnostic tools, and nonpharmaceutical products for public health emergency threats.”
Janssen will use the funds to conduct late stage clinical development of JNJ-872, which includes phase III studies in high-risk populations and hospitalized patients, and the final development of a validated commercial-scale manufacturing process. The pharmaceutical company will also explore the feasibility of an innovative approach to manufacturing, which allows for the continuous flow of materials throughout the manufacturing process, unlike the traditional manufacturing process, which is riddled with interruptions.
“BARDA’s goal for supporting JNJ-872 is development of a product that can be used not only to treat hospitalized influenza patients but also to treat patients for whom influenza poses high risks, such as the elderly, pediatrics, and those with chronic conditions such as COPD and heart disease ...,” the statement indicated.

David Henry's JCSO podcast, September 2015
For the September podcast for The Journal of Community and Supportive Oncology, Dr David Henry discusses 3 Original Reports: one on identifying the risk factors for hospital readmission among patients who have received a hematopoietic stem cell transplant and designing preventive measures to lower those risks and related readmissions; a second that focuses on young women with breast cancer who are from diverse populations and who face specific challenges in regard to their existing support systems and unmet needs for information and support; and the third that examines the effects of a self-care education program on the quality of life of in patients with gastric cancer after they have undergone gastrectomy. Dr Henry also highlights this month’s Community Translations article on the approval of nivolumab, the first immunotherapy to receive the go-ahead from the Food and Drug Administration for the treatment of for lung cancer, specifically, squamous cell non-small-cell lung cancer, and an accompanying Commentary by Dr Kartik Konduri. The podcast is rounded off with comments on an essay about the shift from practicing oncology as a generalist to the current more prevalent tendency to subspecialize, and an argument suggesting that the generalist approach offers a potentially useful perspective to help make sense of what can seem like an overwhelming amount of data on emerging new therapies and understanding of tumor biology.
Click on the download icon at the top of this introduction to listen to the podcast.
ADA proposes new standards for students with diabetes
Every student with diabetes should have an individualized Diabetes Medical Management Plan that sets out the specifics of that student’s needs throughout the school day, including information on when and how to monitor blood glucose levels and insulin dosages and instructions on meals and snacks, according to new guidelines from the American Diabetes Association.
The position statement, published in the October issue of Diabetes Care, calls on schools to better accommodate students with diabetes (Diabetes Care. 2015;38[10]:1958-63). The guidelines suggest that school nurses and other staff members undergo training to deal with hypoglycemia and hyperglycemia. The statement also points out the need for reasonable modifications for students with diabetes during special events such as standardized testing, field trips, and school lockdowns.

Also included in the October issue of Diabetes Care is a joint scientific statement from the American Diabetes Association, JDRF, and the Endocrine Society, which proposes a new classification system that outlines three progressive stages of type 1 diabetes, beginning with an asymptomatic stage of beta-cell autoimmunity, leading to a gradual progression to glucose intolerance, and ultimately, symptomatic disease (Diabetes Care. 2015;38[10]1964-74).
A consensus report in the October issue makes the case for designing studies that account for age-related differences in type 1 diabetes (Diabetes Care. 2015;38[10]:1975-85). A perspective focuses on potential solutions to the challenges of developing and gaining marketing approval for new drugs for pediatric type 1 diabetes (Diabetes Care. 2015;38[10]1986-91).
“Given the progress to date and knowledge gained in understanding the pathophysiology of type 1 diabetes, the unique needs of children with diabetes, and the evolving therapeutic landscape, updates to guide our thinking on management and approach to this patient cohort are continually needed,” Dr. William T. Cefalu and Dr. Jane L. Chiang wrote in the issue’s editorial (Diabetes Care. 2015;38[10]1955-7).
Every student with diabetes should have an individualized Diabetes Medical Management Plan that sets out the specifics of that student’s needs throughout the school day, including information on when and how to monitor blood glucose levels and insulin dosages and instructions on meals and snacks, according to new guidelines from the American Diabetes Association.
The position statement, published in the October issue of Diabetes Care, calls on schools to better accommodate students with diabetes (Diabetes Care. 2015;38[10]:1958-63). The guidelines suggest that school nurses and other staff members undergo training to deal with hypoglycemia and hyperglycemia. The statement also points out the need for reasonable modifications for students with diabetes during special events such as standardized testing, field trips, and school lockdowns.
Also included in the October issue of Diabetes Care is a joint scientific statement from the American Diabetes Association, JDRF, and the Endocrine Society, which proposes a new classification system that outlines three progressive stages of type 1 diabetes, beginning with an asymptomatic stage of beta-cell autoimmunity, leading to a gradual progression to glucose intolerance, and ultimately, symptomatic disease (Diabetes Care. 2015;38[10]1964-74).
A consensus report in the October issue makes the case for designing studies that account for age-related differences in type 1 diabetes (Diabetes Care. 2015;38[10]:1975-85). A perspective focuses on potential solutions to the challenges of developing and gaining marketing approval for new drugs for pediatric type 1 diabetes (Diabetes Care. 2015;38[10]1986-91).
“Given the progress to date and knowledge gained in understanding the pathophysiology of type 1 diabetes, the unique needs of children with diabetes, and the evolving therapeutic landscape, updates to guide our thinking on management and approach to this patient cohort are continually needed,” Dr. William T. Cefalu and Dr. Jane L. Chiang wrote in the issue’s editorial (Diabetes Care. 2015;38[10]1955-7).
FROM DIABETES CARE