User login
Long‐term Antipsychotics in Elders
Delirium, a clinical syndrome characterized by inattention and acute cognitive dysfunction, is very common in older hospitalized patients, with a reported incidence of 18% to 35% at time of admission and overall occurrence rates of 29% to 64%.[1] Previous studies have reported that a diagnosis of delirium is not benign and is associated with other adverse outcomes including prolonged hospitalization, institutionalization, increased cost, and mortality. These outcomes occurred independent of age, prior cognitive functioning, and comorbidities.[2] Guidelines recommend that management of inpatient delirium should be focused on addressing the underlying etiology and managed with nonpharmacological interventions whenever possible.[3, 4, 5] However, implementing these recommendations can prove to be very challenging in hospital settings. Providers frequently have to resort to medical therapies, including antipsychotics (APs). Although these medications are commonly used to treat delirium in elderly patients, there is limited evidence to support their efficacy, and there are currently no proven pharmacological alternatives to these medications.[6] Furthermore, previous studies have demonstrated an increased risk of stroke, infection, cognitive impairment, and mortality in elders with dementia who receive long‐term AP therapy.[7, 8, 9] Yet as many as 48% of hospitalized elders who were newly started on APs had these drugs continued at time of discharge.[10]
There have been few studies describing the long‐term outcomes of elderly patient who are started on APs in the hospital. Most information on outcomes comes from patients with dementia. Therefore, we studied the 1‐year outcomes of a cohort of patients with and without dementia who were started on APs in the hospital and then discharged on these medications. In this cohort, we aimed to describe the number of readmissions, reasons for readmissions, duration of AP therapy, use of other sedating medications such as anxiolytics, hypnotics, and antihistamines as well as the incidence of readmission and death 1 year after the index hospital discharge.
METHODS
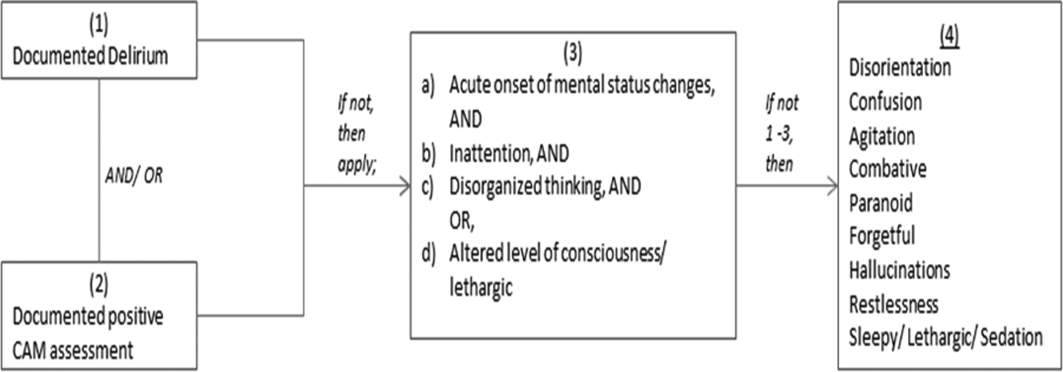
We previously described a retrospective cohort of 300 elders (65 years old) admitted to a tertiary care hospital between October 1, 2012 and September 31, 2013 who were newly prescribed APs while hospitalized.[10] Of patients alive at the time of discharge (260), 56% (146 patients) were discharged on APs. Two investigators extracted these 148 patient charts independently to identify and quantify the number of readmissions to the index hospital. We then limited the sample to only the first readmission per patient following the index admission and extracted this readmission for each patient. We first determined if APs were present on the admission medication reconciliation. If APs were not present on admission, we examined whether they were resumed during the hospitalization using the electronic medication administration summary. If they were present on admission, we looked to see if they were discontinued during the readmission and if additional new APs were started during the hospitalizations. We documented the circumstances around APs use and identified patients who died during their hospitalizations. We identified delirium using the same terms that were described in our prior study on the same cohort of patients.[10] We determined if patients were delirious using a predetermined algorithm (Figure 1). Briefly, we first determined delirium was documented. We then examined whether there was a Confusion Assessment Method (CAM) instrument included in the record. If a CAM instrument was not documented, we then looked for documentation using specific terms (eg, disorientation, confusions). We identified patients with dementia by determining whether dementia was documented along with other admission medical comorbidities. If it was not, we determined whether dementia was newly diagnosed during the hospital stay using progress notes or consultation notes. We did not objectively define criteria for diagnosis of dementia. We used the National Death Index (NDI) to determine mortality for all patients 1 year after discharge from the index hospitalization. The NDI is a national database of death records maintained by the National Center for Health Statistics. It has shown consistently high sensitivity and specificity for detection of death.[11]

We used descriptive statistics (means, standard deviations, range, and percents as appropriate to the scale of measurement) to describe the patient sample. We then used multiple logistic regression to identify significant predictors of death within 1 year of discharge.[12] Univariate analysis was used to select candidates for the logistic model (t tests for continuous factors and 2 for discrete factors). All factors with a significance level 0.2 on univariate analysis were included in the logistic regression, in addition to age and sex (regardless of significance). A maximum likelihood procedure was used to calculate the regression coefficients for the logistic model. The likelihood ratio criterion was used to determine the significance of individual factors in the regression model.[13] Factors with a significance level of 0.15 or less were retained in the final model, in addition to age and sex.
RESULTS
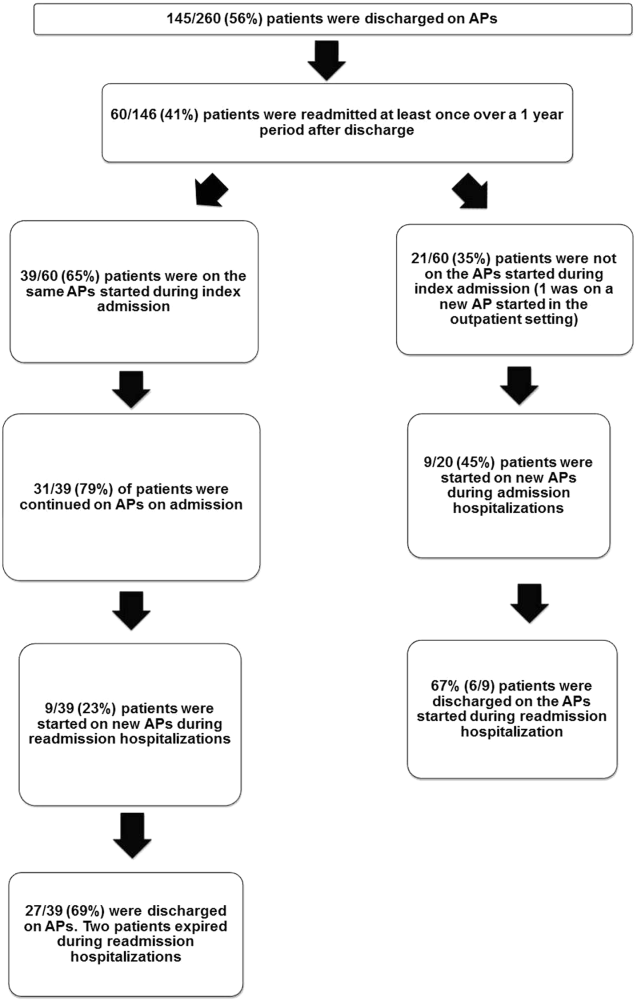
The 260 patients discharged alive from their index admissions had a 1‐year mortality rate of 29% (75/260). Of the 146/260 patients discharged on APs, 60 (41%) patients experienced at least 1 readmission (mean = 2 readmissions per patient; range, 18, with 111 total readmissions for 60 patients) within 1 year from discharge (Figure 2). Most common diagnoses at the time of readmissions were related neurological and psychiatric disorders (14%), cardiovascular and circulation disorders (13%), renal injury and electrolyte disorders (11%), and infections (6%). Among patients with at least 1 readmission, the mean age was 81.3 (range, 65.599.7), 60% were male, and 45% were admitted from a skilled nursing facility or rehabilitation facility (Table 1). Median time to readmission was 43.5 days (range, 1343 days), and 79% were readmitted to a medical service. The remaining 20% were admitted to a surgical service. Inpatient mortality during first readmissions was 8% (5/60). At the time of first readmission, 39/60 (65%) of patients were still on the same APs on which they had been discharged, and the APs were continued during the hospitalization in 79% of the patients (61% quetiapine, 19% olanzapine, and 13% risperidone). About half of patients whose APs were discontinued prior to readmission received a new AP during their hospital stays (9/20; 45%). One patient had been started on quetiapine in the outpatient setting. No patients were found to have new benzodiazepines, nonbenzodiazepine hypnotic, or antihistamines on their admission medication list.
| Variables | Value* |
|---|---|
| |
| Age, mean (range), yr | 81.3 (65.599.7) |
| Gender, no. (%) | |
| Male | 36 (60) |
| Female | 24 (40) |
| Admitted from, no. (%) | |
| Home | 33 (55) |
| Rehabilitation facilities | 5 (8) |
| SNF | 22 (37) |
| Services, no. (%) | |
| Medicine | 48 (80) |
| Surgery | 12 (20) |
| Types of APs continued on readmission (from index admission), no. (%) | |
| Quetiapine | 19 (61) |
| Olanzapine | 6 (19) |
| Risperidone | 4 (13) |
| Haloperidol | 2 (7) |
| Types of APs started during readmission, no. (%) | |
| Quetiapine | 7 (39) |
| Risperidone | 2 (11) |
| Haloperidol | 16 (89) |
| Indications for AP use, no. (%) | |
| Delirium | 14 (77) |
| Undocumented | 3 (17) |
| Other | 1 (6) |
| ECG, no. (%) | |
| Prior to APs administration | 17 (94) |
| After APs administration | 4 (22) |
| QTc prolongation >500 ms, no. (%) | |
| Prior to APs administration | 3 (18) |
| After APs administration∥ | 2 (50) |
| Discharge destination, no. (%) | |
| Home | 23 (38) |
| Rehabilitation facilities | 4 (7) |
| SNF | 28 (47) |
| Death | 5 (8) |
Eighteen patients received 1 or more new APs during the readmission hospitalizations. These included haloperidol (89%) and quetiapine (39%). Delirium was the main reported indication for starting APs (78%), but in 17% of cases no indication was documented. An electrocardiogram (ECG) was performed in 94% prior to APs administration and for 22% after APs administration. Corrected QT interval (QTc) of >500 ms was present in 18% of patients in pretreatment ECG and 50% of patients in post‐AP ECG. Of patients who survived readmission, 58% (32/55) were discharged to postacute facilities. Of the 39 patients who were on the same APs from index admission, 27 (69%) patients were eventually discharged on the same APs or new APs started during the readmission.
In the multivariable model (Table 2), predictors of death at 1 year included discharge to postacute facilities after index admission (odds ratio [OR]: 2.28; 95% confidence interval [CI]: 1.10‐4.73, P = 0.03) and QTc prolongation >500 ms during index admission (OR: 3.41; 95% CI: 1.34‐8.67, P = 0.01). Age and gender were not associated with 1‐year mortality.
| Odds Ratio | 95% Confidence Interval | P Value | |
|---|---|---|---|
| |||
| Age | 1.03 | 0.991.06 | 0.13 |
| Male sex | 0.87 | 0.501.52 | 0.63 |
| Risperdal | 3.53 | 0.6419.40 | 0.15 |
| QTc prolongation after AP administration* | 3.41 | 1.348.67 | 0.01 |
| Presence of geriatric psychiatry consult | 0.30 | 0.091.04 | 0.06 |
| Discharged to postacute facilities vs home | 2.28 | 1.104.73 | 0.03 |
DISCUSSION
In a cohort of elderly patients who were discharged on APs, nearly one‐third (29%) died within 1 year of the hospitalization in which APs were initiated. Nearly half of the survivors from the index admission (41%) experienced at least 1 admission within 1 year from discharge. Of readmitted patients, two‐thirds were taking the same APs that had been started during the index hospitalization. Half of the patients not on APs on readmission were started on an AP during the hospitalization, most often because they became delirious on return to the acute care setting. Compared to patients discharged home after an index admission, patients who were discharged to postacute facilities were almost 4 times as likely to die during the year subsequent to the admission. These data suggest that once patients are started on APs, most are continued on them until the next admission or are restarted during that readmission. Moreover, hospitalized elders who require an AP are at high risk for mortality in the coming year.
Prior studies have reported that patients with delirium have elevated 1‐year mortality rates.[14, 15, 16, 17, 18, 19] A secondary analysis of the Delirium Prevention Trial, which included 437 hospitalized older patients, revealed a 1‐year mortality rate of 20% in those who were never delirious during hospitalization, compared to 26% to 38% in patients with delirium.[19] Additionally, 1‐year mortality in hospitalized older patients with delirium (36%) was shown to be higher than patients with dementia (29%) or depression (26%).[17] Unlike these studies, not all of the patients in our study had documented delirium, but all received an AP. Still, it is notable that the 1‐year mortality rate for delirium in general is similar to what we found in this study.
The literature has also reported that long‐term AP use is associated with excess mortality in elder patients, especially those with dementia.[20, 21, 22] In a retrospective cohort study, older patients with dementia who were taking antipsychotics had significantly higher 1‐year mortality rates (23%29%) than patients not taking antipsychotic medications (15%). In a large Canadian propensity score‐matched cohort study that included over 13,000 demented older adults, the mortality was higher in the community‐dwelling elders who received atypical APs compared to no APs, with a difference of 1.1% in 180‐day mortality rate after initiation of APs.[21] The absolute mortality rate was 2.6% higher in patients who received typical compared to atypical APs. Unlike these studies, not every patient in our cohort had a diagnosis of dementia, but again, mortality rates in these studies appear similar to our cohort.
In contrast, other observational studies have not found an increased risk associated with receipt of APs. For example, a prospective study that enrolled approximately 950 patients with probable dementia showed that AP use was not associated with time to death after adjustment for comorbidities, demographic and cognitive variables.[23] These conflicting results highlight the difficulties of attributing outcomes in high‐risk populations. Although the excess mortality observed in patients taking APs may be related to the risks of APs, it is quite possible that patients who require APs (most often for delirium or agitated dementia) are at higher risk of death. This confounding by indication may be nearly impossible to adjust for retrospectively, even using techniques such as propensity matching.
Our report adds to the literature; we know of no studies to date describing a cohort of patients, most with delirium, who were started on APs in the hospital. We also attempted to identify the reasons that patients were started on APs, which have been infrequently reported. As noted above, our 1‐year mortality rate of 29% among older patients prescribed APs in the hospital was quite similar to mortality rates both for patients with delirium who were not necessarily treated with APs and patients with dementia who were treated with APs. This finding further supports the argument that risk factors for mortality, including dementia, delirium, and AP use are very difficult to tease apart. It is possible that the reasons that APs are prescribed (agitated delirium or dementia) have as much to do with the excess mortality reported in observational studies of APs as the use of APs themselves.
The high rate of continued AP use we observed (two‐thirds of readmitted patients) may reflect limited pharmacological alternatives to these medications with little evidence to support treating the symptoms of delirium with other drug classes, along with suboptimal environmental and behavioral modifications in postacute facilities and hospitals. This is unfortunate given that delirium is often preventable. Systematic implementation of well‐documented strategies to decrease delirium in hospitals and postacute facilities would likely reduce the prescription of APs and has the potential to slow the decline in this vulnerable population. A meta‐analysis incorporating both randomized and nonrandomized trials of medical and surgical patients showed that multicomponent nonpharmacologic interventions decreased delirium by 50%.[24] Thus, simple interventions such as reorientation, early mobilization, optimizing vision and hearing, sleepwake cycle preservation, and hydration might avoid roughly 1 million cases of delirium in hospitalized older adults annually.[24] The Hospital Elder Life Program and Acute Care for Elders units are examples of programs that have been shown to decrease the incidence of delirium.[25, 26]
Despite vigorous efforts to prevent delirium, a subgroup of patients still will become delirious. These patients are at high risk for death. Our mortality prediction model revealed that patients who were discharged to postacute facilities were 4 times more likely to die during the subsequent year compared to patients who were discharged home. Patients discharged to postacute facilities are likely to have a higher burden of disease, greater functional and cognitive impairment, and more frailty than those who are able to return to the community. Very ill and/or frail patients receiving APs in the hospital and requiring APs on discharge to postacute care facilities have limited survival and may benefit from expedited palliative care interventions to clarify prognosis and goals, and relieve suffering. At a minimum, our study identifies a need for further study to identify this very high‐risk group of elders. It is notable that 50% of patients were found to have a post‐treatment ECG with a QTc of >500 ms, a finding that has not been previously described. This would put these patients at higher risk of mortality, and as such we suggest that current guidelines should continue to emphasize the importance of post‐treatment ECGs and set clear criteria for discontinuation in elderly patients.
Our study is limited by its retrospective, single‐center design and small sample size, therefore limiting the interpretation and generalizability of the results to other hospitals. Quetiapine was the most common AP medication used in our hospital; therefore, our findings cannot be generalized to hospitals that utilize other AP agents. Future studies should examine antipsychotic use across hospitals to determine variation in prescribing patterns and outcomes. Nevertheless, the care of these patients were transitioned to a large number of geriatricians and primary care and nursing home physicians after discharge, and the reflected practice patterns extended beyond our hospital. Additionally, we were unable to determine when and why APs were discontinued or started in the outpatient setting. We were only able to detect readmissions to the 3 hospitals within our health system and therefore may have missed some readmissions to other institutions, although the majority of patients in our region tend to return to the same hospital. For patients who were not readmitted, we were also unable to identify whether they remained on the APs initiated during their index hospitalizations. Any retrospective study is limited by the difficulty of distinguishing delirium from the behavioral and psychiatric symptoms of dementia, but we identified delirium using standard terms described in previous literature.[10] We were unable to determine the types of delirium (hyperactive vs hypoactive) given that the documentations on behavioral symptoms were largely missing from the charts. The number of patients with preexisting diagnosis of dementia was likely underestimated, as we were only able to verify the diagnosis from the medical history. Additionally, the retrospective design based on chart review limited the factors that we could detect and grade accurately for inclusion in our mortality prediction model. Of note, our model did not contain objective measures of cognition, agitation, function, and markers for frailty such as walking speed, weak grip strength, weight loss, and low physical activity.
CONCLUSION
Initiating an AP (eg, haloperidol, quetiapine, olanzapine, and risperidone) in the hospital is likely to result in long‐term use of these medications despite the fact that AP use has been associated with multiple risks including falls, fractures, stroke, cardiovascular disease, and increased mortality in those with underlying dementia.[27] When possible, behavioral interventions to prevent delirium and slow the trajectory of decline should be implemented to reduce AP use. If patients with delirium are started on antipsychotics, it is important to monitor for prolonged QTc given the associated risk of mortality. In a subgroup of patients at high risk for death in the upcoming year, occurrence of delirium or use of APs during a hospitalization should both be considered triggers for early advance care planning and possibly palliative care and end‐of‐life discussions, with an emphasis on quality of life.
Disclosures: The research was supported by the Department of Medicine, Baystate Medical Center/Tufts University School of Medicine. Dr. Lagu is supported by the National Heart, Lung, and Blood Institute of the National Institutes of Health under award number K01HL114745. Drs. Lagu and Loh had full access to all of the data in the study. They take responsibility for the integrity of the data and the accuracy of the analysis. Drs. Loh, Brennan, Lindenauer, and Lagu conceived of the study. Drs. Loh, Ramdass, and Ms. Garb acquired the data. Ms Garb analyzed and interpreted the data. Drs. Loh, Ramdass, and Thim drafted the manuscript. Drs. Brennan, Lindenauer, and Lagu and Ms. Garb critically reviewed the manuscript for important intellectual content. Dr. Lagu has received consulting fees from the Institute for Healthcare Improvement, under contract to the Centers for Medicare and Medicaid Services, for her work on a project to help health systems achieve disability competence. Dr. Brennan is supported by a Geriatric Work Force Enhancement Grant from the US Department of Health and Human Services award number 1 U1QHP287020100. The authors report no conflicts of interest.
- , , . Delirium in elderly people. Lancet. 2014;383:911–922.
- , , , et al. Adverse outcomes after hospitalization and delirium in persons with Alzheimer disease. Ann Intern Med. 2012;156:848–856, W296.
- American Geriatrics Society Expert Panel on Postoperative Delirium in Older Adults. American Geriatrics Society abstracted clinical practice guideline for postoperative delirium in older adults. J Am Geriatr Soc. 2015;63:142–150.
- Practice guideline for the treatment of patients with delirium. American Psychiatric Association. Am J Psychiatry. 1999;156:1–20.
- , ; Guideline Development Group. The prevention, diagnosis and management of delirium in older people: concise guidelines. Clin Med (Lond). 2006;6:303–308.
- , , . Antipsychotics in the treatment of delirium: a systematic review. J Clin Psychiatry. 2007;68:11–21.
- , , , et al. Antipsychotics, other psychotropics, and the risk of death in patients with dementia: number needed to harm. JAMA Psychiatry. 2015;72:438–445.
- , . Safety and efficacy of antipsychotic drugs for the behavioral and psychological symptoms of dementia. Indian J Psychiatry. 2009;51(suppl 1):S87–S92.
- , , , . Use and safety of antipsychotics in behavioral disorders in elderly people with dementia. J Clin Psychopharmacol. 2014;34:109–123.
- , , , , , . From hospital to community: use of antipsychotics in hospitalized elders. J Hosp Med. 2014;9:802–804.
- , , . Comparison of National Death Index and World Wide Web Death Searches. Am J Epidemiol. 2000;152:107–111.
- . Analysis of Binary Data. London, United Kingdom: Methuen; 1970:76–99.
- . Statistical Methods for Survival Data Analysis. New York, NY: John Wiley 1992:233–236.
- , , , . The risk of adverse outcomes in hospitalized older patients in relation to a frailty index based on a comprehensive geriatric assessment. Age Ageing. 2014;43:127–132.
- , , , et al. Risk factors for delirium and inpatient mortality with delirium. J Postgrad Med. 2013;59:263–270.
- , , , , , . Comprehensive geriatric assessment predicts mortality and adverse outcomes in hospitalized older adults. BMC Geriatr. 2014;14:129.
- , , , , , . One‐year mortality of elderly inpatients with delirium, dementia, or depression seen by a consultation‐liaison service. Psychosomatics. 2012;53:433–438.
- , , , . Excess mortality in general hospital patients with delirium: a 5‐year follow‐up of 519 patients seen in psychiatric consultation. J Psychosom Res. 1994;38:339–346.
- , , , et al. Older adults discharged from the hospital with delirium: 1‐year outcomes. J Am Geriatr Soc. 2006;54:1245–1250.
- , , , et al. The dementia antipsychotic withdrawal trial (DART‐AD): long‐term follow‐up of a randomised placebo‐controlled trial. Lancet Neurol. 2009;8:151–157.
- , , , et al. Antipsychotic drug use and mortality in older adults with dementia. Ann Intern Med. 2007;146:775–786.
- , , , et al. Risk of death in elderly users of conventional vs. atypical antipsychotic medications. N Engl J Med. 2005;353:2335–2341.
- , , , et al. The long‐term effects of conventional and atypical antipsychotics in patients with probable Alzheimer's disease. Am J Psychiatry. 2013;170:1051–1058.
- , , , et al. Effectiveness of multicomponent nonpharmacological delirium interventions: a meta‐analysis. JAMA Intern Med. 2015;175:512–520.
- , , , , . Sustainability and scalability of the hospital elder life program at a community hospital. J Am Geriatr Soc. 2011;59:359–365.
- , , , et al. Effectiveness of acute geriatric unit care using acute care for elders components: a systematic review and meta‐analysis. J Am Geriatr Soc. 2012;60:2237–2245.
- , . Adverse effects of antipsychotic medications. Am Fam Physician. 2010;81:617–622.
Delirium, a clinical syndrome characterized by inattention and acute cognitive dysfunction, is very common in older hospitalized patients, with a reported incidence of 18% to 35% at time of admission and overall occurrence rates of 29% to 64%.[1] Previous studies have reported that a diagnosis of delirium is not benign and is associated with other adverse outcomes including prolonged hospitalization, institutionalization, increased cost, and mortality. These outcomes occurred independent of age, prior cognitive functioning, and comorbidities.[2] Guidelines recommend that management of inpatient delirium should be focused on addressing the underlying etiology and managed with nonpharmacological interventions whenever possible.[3, 4, 5] However, implementing these recommendations can prove to be very challenging in hospital settings. Providers frequently have to resort to medical therapies, including antipsychotics (APs). Although these medications are commonly used to treat delirium in elderly patients, there is limited evidence to support their efficacy, and there are currently no proven pharmacological alternatives to these medications.[6] Furthermore, previous studies have demonstrated an increased risk of stroke, infection, cognitive impairment, and mortality in elders with dementia who receive long‐term AP therapy.[7, 8, 9] Yet as many as 48% of hospitalized elders who were newly started on APs had these drugs continued at time of discharge.[10]
There have been few studies describing the long‐term outcomes of elderly patient who are started on APs in the hospital. Most information on outcomes comes from patients with dementia. Therefore, we studied the 1‐year outcomes of a cohort of patients with and without dementia who were started on APs in the hospital and then discharged on these medications. In this cohort, we aimed to describe the number of readmissions, reasons for readmissions, duration of AP therapy, use of other sedating medications such as anxiolytics, hypnotics, and antihistamines as well as the incidence of readmission and death 1 year after the index hospital discharge.
METHODS
We previously described a retrospective cohort of 300 elders (65 years old) admitted to a tertiary care hospital between October 1, 2012 and September 31, 2013 who were newly prescribed APs while hospitalized.[10] Of patients alive at the time of discharge (260), 56% (146 patients) were discharged on APs. Two investigators extracted these 148 patient charts independently to identify and quantify the number of readmissions to the index hospital. We then limited the sample to only the first readmission per patient following the index admission and extracted this readmission for each patient. We first determined if APs were present on the admission medication reconciliation. If APs were not present on admission, we examined whether they were resumed during the hospitalization using the electronic medication administration summary. If they were present on admission, we looked to see if they were discontinued during the readmission and if additional new APs were started during the hospitalizations. We documented the circumstances around APs use and identified patients who died during their hospitalizations. We identified delirium using the same terms that were described in our prior study on the same cohort of patients.[10] We determined if patients were delirious using a predetermined algorithm (Figure 1). Briefly, we first determined delirium was documented. We then examined whether there was a Confusion Assessment Method (CAM) instrument included in the record. If a CAM instrument was not documented, we then looked for documentation using specific terms (eg, disorientation, confusions). We identified patients with dementia by determining whether dementia was documented along with other admission medical comorbidities. If it was not, we determined whether dementia was newly diagnosed during the hospital stay using progress notes or consultation notes. We did not objectively define criteria for diagnosis of dementia. We used the National Death Index (NDI) to determine mortality for all patients 1 year after discharge from the index hospitalization. The NDI is a national database of death records maintained by the National Center for Health Statistics. It has shown consistently high sensitivity and specificity for detection of death.[11]
We used descriptive statistics (means, standard deviations, range, and percents as appropriate to the scale of measurement) to describe the patient sample. We then used multiple logistic regression to identify significant predictors of death within 1 year of discharge.[12] Univariate analysis was used to select candidates for the logistic model (t tests for continuous factors and 2 for discrete factors). All factors with a significance level 0.2 on univariate analysis were included in the logistic regression, in addition to age and sex (regardless of significance). A maximum likelihood procedure was used to calculate the regression coefficients for the logistic model. The likelihood ratio criterion was used to determine the significance of individual factors in the regression model.[13] Factors with a significance level of 0.15 or less were retained in the final model, in addition to age and sex.
RESULTS
The 260 patients discharged alive from their index admissions had a 1‐year mortality rate of 29% (75/260). Of the 146/260 patients discharged on APs, 60 (41%) patients experienced at least 1 readmission (mean = 2 readmissions per patient; range, 18, with 111 total readmissions for 60 patients) within 1 year from discharge (Figure 2). Most common diagnoses at the time of readmissions were related neurological and psychiatric disorders (14%), cardiovascular and circulation disorders (13%), renal injury and electrolyte disorders (11%), and infections (6%). Among patients with at least 1 readmission, the mean age was 81.3 (range, 65.599.7), 60% were male, and 45% were admitted from a skilled nursing facility or rehabilitation facility (Table 1). Median time to readmission was 43.5 days (range, 1343 days), and 79% were readmitted to a medical service. The remaining 20% were admitted to a surgical service. Inpatient mortality during first readmissions was 8% (5/60). At the time of first readmission, 39/60 (65%) of patients were still on the same APs on which they had been discharged, and the APs were continued during the hospitalization in 79% of the patients (61% quetiapine, 19% olanzapine, and 13% risperidone). About half of patients whose APs were discontinued prior to readmission received a new AP during their hospital stays (9/20; 45%). One patient had been started on quetiapine in the outpatient setting. No patients were found to have new benzodiazepines, nonbenzodiazepine hypnotic, or antihistamines on their admission medication list.
| Variables | Value* |
|---|---|
| |
| Age, mean (range), yr | 81.3 (65.599.7) |
| Gender, no. (%) | |
| Male | 36 (60) |
| Female | 24 (40) |
| Admitted from, no. (%) | |
| Home | 33 (55) |
| Rehabilitation facilities | 5 (8) |
| SNF | 22 (37) |
| Services, no. (%) | |
| Medicine | 48 (80) |
| Surgery | 12 (20) |
| Types of APs continued on readmission (from index admission), no. (%) | |
| Quetiapine | 19 (61) |
| Olanzapine | 6 (19) |
| Risperidone | 4 (13) |
| Haloperidol | 2 (7) |
| Types of APs started during readmission, no. (%) | |
| Quetiapine | 7 (39) |
| Risperidone | 2 (11) |
| Haloperidol | 16 (89) |
| Indications for AP use, no. (%) | |
| Delirium | 14 (77) |
| Undocumented | 3 (17) |
| Other | 1 (6) |
| ECG, no. (%) | |
| Prior to APs administration | 17 (94) |
| After APs administration | 4 (22) |
| QTc prolongation >500 ms, no. (%) | |
| Prior to APs administration | 3 (18) |
| After APs administration∥ | 2 (50) |
| Discharge destination, no. (%) | |
| Home | 23 (38) |
| Rehabilitation facilities | 4 (7) |
| SNF | 28 (47) |
| Death | 5 (8) |
Eighteen patients received 1 or more new APs during the readmission hospitalizations. These included haloperidol (89%) and quetiapine (39%). Delirium was the main reported indication for starting APs (78%), but in 17% of cases no indication was documented. An electrocardiogram (ECG) was performed in 94% prior to APs administration and for 22% after APs administration. Corrected QT interval (QTc) of >500 ms was present in 18% of patients in pretreatment ECG and 50% of patients in post‐AP ECG. Of patients who survived readmission, 58% (32/55) were discharged to postacute facilities. Of the 39 patients who were on the same APs from index admission, 27 (69%) patients were eventually discharged on the same APs or new APs started during the readmission.
In the multivariable model (Table 2), predictors of death at 1 year included discharge to postacute facilities after index admission (odds ratio [OR]: 2.28; 95% confidence interval [CI]: 1.10‐4.73, P = 0.03) and QTc prolongation >500 ms during index admission (OR: 3.41; 95% CI: 1.34‐8.67, P = 0.01). Age and gender were not associated with 1‐year mortality.
| Odds Ratio | 95% Confidence Interval | P Value | |
|---|---|---|---|
| |||
| Age | 1.03 | 0.991.06 | 0.13 |
| Male sex | 0.87 | 0.501.52 | 0.63 |
| Risperdal | 3.53 | 0.6419.40 | 0.15 |
| QTc prolongation after AP administration* | 3.41 | 1.348.67 | 0.01 |
| Presence of geriatric psychiatry consult | 0.30 | 0.091.04 | 0.06 |
| Discharged to postacute facilities vs home | 2.28 | 1.104.73 | 0.03 |
DISCUSSION
In a cohort of elderly patients who were discharged on APs, nearly one‐third (29%) died within 1 year of the hospitalization in which APs were initiated. Nearly half of the survivors from the index admission (41%) experienced at least 1 admission within 1 year from discharge. Of readmitted patients, two‐thirds were taking the same APs that had been started during the index hospitalization. Half of the patients not on APs on readmission were started on an AP during the hospitalization, most often because they became delirious on return to the acute care setting. Compared to patients discharged home after an index admission, patients who were discharged to postacute facilities were almost 4 times as likely to die during the year subsequent to the admission. These data suggest that once patients are started on APs, most are continued on them until the next admission or are restarted during that readmission. Moreover, hospitalized elders who require an AP are at high risk for mortality in the coming year.
Prior studies have reported that patients with delirium have elevated 1‐year mortality rates.[14, 15, 16, 17, 18, 19] A secondary analysis of the Delirium Prevention Trial, which included 437 hospitalized older patients, revealed a 1‐year mortality rate of 20% in those who were never delirious during hospitalization, compared to 26% to 38% in patients with delirium.[19] Additionally, 1‐year mortality in hospitalized older patients with delirium (36%) was shown to be higher than patients with dementia (29%) or depression (26%).[17] Unlike these studies, not all of the patients in our study had documented delirium, but all received an AP. Still, it is notable that the 1‐year mortality rate for delirium in general is similar to what we found in this study.
The literature has also reported that long‐term AP use is associated with excess mortality in elder patients, especially those with dementia.[20, 21, 22] In a retrospective cohort study, older patients with dementia who were taking antipsychotics had significantly higher 1‐year mortality rates (23%29%) than patients not taking antipsychotic medications (15%). In a large Canadian propensity score‐matched cohort study that included over 13,000 demented older adults, the mortality was higher in the community‐dwelling elders who received atypical APs compared to no APs, with a difference of 1.1% in 180‐day mortality rate after initiation of APs.[21] The absolute mortality rate was 2.6% higher in patients who received typical compared to atypical APs. Unlike these studies, not every patient in our cohort had a diagnosis of dementia, but again, mortality rates in these studies appear similar to our cohort.
In contrast, other observational studies have not found an increased risk associated with receipt of APs. For example, a prospective study that enrolled approximately 950 patients with probable dementia showed that AP use was not associated with time to death after adjustment for comorbidities, demographic and cognitive variables.[23] These conflicting results highlight the difficulties of attributing outcomes in high‐risk populations. Although the excess mortality observed in patients taking APs may be related to the risks of APs, it is quite possible that patients who require APs (most often for delirium or agitated dementia) are at higher risk of death. This confounding by indication may be nearly impossible to adjust for retrospectively, even using techniques such as propensity matching.
Our report adds to the literature; we know of no studies to date describing a cohort of patients, most with delirium, who were started on APs in the hospital. We also attempted to identify the reasons that patients were started on APs, which have been infrequently reported. As noted above, our 1‐year mortality rate of 29% among older patients prescribed APs in the hospital was quite similar to mortality rates both for patients with delirium who were not necessarily treated with APs and patients with dementia who were treated with APs. This finding further supports the argument that risk factors for mortality, including dementia, delirium, and AP use are very difficult to tease apart. It is possible that the reasons that APs are prescribed (agitated delirium or dementia) have as much to do with the excess mortality reported in observational studies of APs as the use of APs themselves.
The high rate of continued AP use we observed (two‐thirds of readmitted patients) may reflect limited pharmacological alternatives to these medications with little evidence to support treating the symptoms of delirium with other drug classes, along with suboptimal environmental and behavioral modifications in postacute facilities and hospitals. This is unfortunate given that delirium is often preventable. Systematic implementation of well‐documented strategies to decrease delirium in hospitals and postacute facilities would likely reduce the prescription of APs and has the potential to slow the decline in this vulnerable population. A meta‐analysis incorporating both randomized and nonrandomized trials of medical and surgical patients showed that multicomponent nonpharmacologic interventions decreased delirium by 50%.[24] Thus, simple interventions such as reorientation, early mobilization, optimizing vision and hearing, sleepwake cycle preservation, and hydration might avoid roughly 1 million cases of delirium in hospitalized older adults annually.[24] The Hospital Elder Life Program and Acute Care for Elders units are examples of programs that have been shown to decrease the incidence of delirium.[25, 26]
Despite vigorous efforts to prevent delirium, a subgroup of patients still will become delirious. These patients are at high risk for death. Our mortality prediction model revealed that patients who were discharged to postacute facilities were 4 times more likely to die during the subsequent year compared to patients who were discharged home. Patients discharged to postacute facilities are likely to have a higher burden of disease, greater functional and cognitive impairment, and more frailty than those who are able to return to the community. Very ill and/or frail patients receiving APs in the hospital and requiring APs on discharge to postacute care facilities have limited survival and may benefit from expedited palliative care interventions to clarify prognosis and goals, and relieve suffering. At a minimum, our study identifies a need for further study to identify this very high‐risk group of elders. It is notable that 50% of patients were found to have a post‐treatment ECG with a QTc of >500 ms, a finding that has not been previously described. This would put these patients at higher risk of mortality, and as such we suggest that current guidelines should continue to emphasize the importance of post‐treatment ECGs and set clear criteria for discontinuation in elderly patients.
Our study is limited by its retrospective, single‐center design and small sample size, therefore limiting the interpretation and generalizability of the results to other hospitals. Quetiapine was the most common AP medication used in our hospital; therefore, our findings cannot be generalized to hospitals that utilize other AP agents. Future studies should examine antipsychotic use across hospitals to determine variation in prescribing patterns and outcomes. Nevertheless, the care of these patients were transitioned to a large number of geriatricians and primary care and nursing home physicians after discharge, and the reflected practice patterns extended beyond our hospital. Additionally, we were unable to determine when and why APs were discontinued or started in the outpatient setting. We were only able to detect readmissions to the 3 hospitals within our health system and therefore may have missed some readmissions to other institutions, although the majority of patients in our region tend to return to the same hospital. For patients who were not readmitted, we were also unable to identify whether they remained on the APs initiated during their index hospitalizations. Any retrospective study is limited by the difficulty of distinguishing delirium from the behavioral and psychiatric symptoms of dementia, but we identified delirium using standard terms described in previous literature.[10] We were unable to determine the types of delirium (hyperactive vs hypoactive) given that the documentations on behavioral symptoms were largely missing from the charts. The number of patients with preexisting diagnosis of dementia was likely underestimated, as we were only able to verify the diagnosis from the medical history. Additionally, the retrospective design based on chart review limited the factors that we could detect and grade accurately for inclusion in our mortality prediction model. Of note, our model did not contain objective measures of cognition, agitation, function, and markers for frailty such as walking speed, weak grip strength, weight loss, and low physical activity.
CONCLUSION
Initiating an AP (eg, haloperidol, quetiapine, olanzapine, and risperidone) in the hospital is likely to result in long‐term use of these medications despite the fact that AP use has been associated with multiple risks including falls, fractures, stroke, cardiovascular disease, and increased mortality in those with underlying dementia.[27] When possible, behavioral interventions to prevent delirium and slow the trajectory of decline should be implemented to reduce AP use. If patients with delirium are started on antipsychotics, it is important to monitor for prolonged QTc given the associated risk of mortality. In a subgroup of patients at high risk for death in the upcoming year, occurrence of delirium or use of APs during a hospitalization should both be considered triggers for early advance care planning and possibly palliative care and end‐of‐life discussions, with an emphasis on quality of life.
Disclosures: The research was supported by the Department of Medicine, Baystate Medical Center/Tufts University School of Medicine. Dr. Lagu is supported by the National Heart, Lung, and Blood Institute of the National Institutes of Health under award number K01HL114745. Drs. Lagu and Loh had full access to all of the data in the study. They take responsibility for the integrity of the data and the accuracy of the analysis. Drs. Loh, Brennan, Lindenauer, and Lagu conceived of the study. Drs. Loh, Ramdass, and Ms. Garb acquired the data. Ms Garb analyzed and interpreted the data. Drs. Loh, Ramdass, and Thim drafted the manuscript. Drs. Brennan, Lindenauer, and Lagu and Ms. Garb critically reviewed the manuscript for important intellectual content. Dr. Lagu has received consulting fees from the Institute for Healthcare Improvement, under contract to the Centers for Medicare and Medicaid Services, for her work on a project to help health systems achieve disability competence. Dr. Brennan is supported by a Geriatric Work Force Enhancement Grant from the US Department of Health and Human Services award number 1 U1QHP287020100. The authors report no conflicts of interest.
- , , . Delirium in elderly people. Lancet. 2014;383:911–922.
- , , , et al. Adverse outcomes after hospitalization and delirium in persons with Alzheimer disease. Ann Intern Med. 2012;156:848–856, W296.
- American Geriatrics Society Expert Panel on Postoperative Delirium in Older Adults. American Geriatrics Society abstracted clinical practice guideline for postoperative delirium in older adults. J Am Geriatr Soc. 2015;63:142–150.
- Practice guideline for the treatment of patients with delirium. American Psychiatric Association. Am J Psychiatry. 1999;156:1–20.
- , ; Guideline Development Group. The prevention, diagnosis and management of delirium in older people: concise guidelines. Clin Med (Lond). 2006;6:303–308.
- , , . Antipsychotics in the treatment of delirium: a systematic review. J Clin Psychiatry. 2007;68:11–21.
- , , , et al. Antipsychotics, other psychotropics, and the risk of death in patients with dementia: number needed to harm. JAMA Psychiatry. 2015;72:438–445.
- , . Safety and efficacy of antipsychotic drugs for the behavioral and psychological symptoms of dementia. Indian J Psychiatry. 2009;51(suppl 1):S87–S92.
- , , , . Use and safety of antipsychotics in behavioral disorders in elderly people with dementia. J Clin Psychopharmacol. 2014;34:109–123.
- , , , , , . From hospital to community: use of antipsychotics in hospitalized elders. J Hosp Med. 2014;9:802–804.
- , , . Comparison of National Death Index and World Wide Web Death Searches. Am J Epidemiol. 2000;152:107–111.
- . Analysis of Binary Data. London, United Kingdom: Methuen; 1970:76–99.
- . Statistical Methods for Survival Data Analysis. New York, NY: John Wiley 1992:233–236.
- , , , . The risk of adverse outcomes in hospitalized older patients in relation to a frailty index based on a comprehensive geriatric assessment. Age Ageing. 2014;43:127–132.
- , , , et al. Risk factors for delirium and inpatient mortality with delirium. J Postgrad Med. 2013;59:263–270.
- , , , , , . Comprehensive geriatric assessment predicts mortality and adverse outcomes in hospitalized older adults. BMC Geriatr. 2014;14:129.
- , , , , , . One‐year mortality of elderly inpatients with delirium, dementia, or depression seen by a consultation‐liaison service. Psychosomatics. 2012;53:433–438.
- , , , . Excess mortality in general hospital patients with delirium: a 5‐year follow‐up of 519 patients seen in psychiatric consultation. J Psychosom Res. 1994;38:339–346.
- , , , et al. Older adults discharged from the hospital with delirium: 1‐year outcomes. J Am Geriatr Soc. 2006;54:1245–1250.
- , , , et al. The dementia antipsychotic withdrawal trial (DART‐AD): long‐term follow‐up of a randomised placebo‐controlled trial. Lancet Neurol. 2009;8:151–157.
- , , , et al. Antipsychotic drug use and mortality in older adults with dementia. Ann Intern Med. 2007;146:775–786.
- , , , et al. Risk of death in elderly users of conventional vs. atypical antipsychotic medications. N Engl J Med. 2005;353:2335–2341.
- , , , et al. The long‐term effects of conventional and atypical antipsychotics in patients with probable Alzheimer's disease. Am J Psychiatry. 2013;170:1051–1058.
- , , , et al. Effectiveness of multicomponent nonpharmacological delirium interventions: a meta‐analysis. JAMA Intern Med. 2015;175:512–520.
- , , , , . Sustainability and scalability of the hospital elder life program at a community hospital. J Am Geriatr Soc. 2011;59:359–365.
- , , , et al. Effectiveness of acute geriatric unit care using acute care for elders components: a systematic review and meta‐analysis. J Am Geriatr Soc. 2012;60:2237–2245.
- , . Adverse effects of antipsychotic medications. Am Fam Physician. 2010;81:617–622.
Inflectra becomes first FDA-approved biosimilar for inflammatory diseases
A biosimilar version of the anti–tumor necrosis factor–alpha agent Remicade has been approved by the Food and Drug Administration, making it the first biosimilar drug approved by the agency for inflammatory diseases and just the second biosimilar it has approved.
The agency said in its April 5 announcement that the biosimilar drug, to be marketed as Inflectra, will have the same indications as Remicade: moderately to severely active Crohn’s disease in patients aged 6 years and older who have had an inadequate response to conventional therapy; moderately to severely active ulcerative colitis that has inadequately responded to conventional therapy; moderately to severely active rheumatoid arthritis in combination with methotrexate; active ankylosing spondylitis; active psoriatic arthritis; and chronic, severe plaque psoriasis.

The drug, given the generic name of infliximab-dyyb under the agency’s nomenclature for biosimilar products, earned its approval as a biosimilar by showing it has no clinically meaningful differences in terms of safety and effectiveness from Remicade. According to FDA regulations, biosimilar products can have only minor differences in clinically inactive components and must have the same mechanism(s) of action (to the extent that it is known) and route(s) of administration, dosage form(s), and strength(s) as the reference product; and can be approved only for the indication(s) and condition(s) of use that have been approved for the reference product.
Inflectra’s approval is only as a biosimilar, not as an interchangeable product. The agency has yet to define the regulatory requirements for interchangeability that are necessary to meet the requirements of the Biologics Price Competition and Innovation Act of 2009. That Act states that an approved biosimilar “may be substituted for the reference product without the intervention of the health care provider who prescribed the reference product.” A statement about implementation of the Act on the FDA website explains that for interchangeability, “a sponsor must demonstrate that the biosimilar product can be expected to produce the same clinical result as the reference product in any given patient and, for a biological product that is administered more than once, that the risk of alternating or switching between use of the biosimilar product and the reference product is not greater than the risk of maintaining the patient on the reference product.”
Like Remicade, Inflectra will come with a boxed warning and a Medication Guide that describes important information about its uses and risks, which include serious infections (tuberculosis, bacterial sepsis, invasive fungal infections, and others), lymphoma and other malignancies, liver injury, blood problems, lupuslike syndrome, psoriasis, and in rare cases, nervous system disorders.
Inflectra is manufactured by Celltrion, based in South Korea, for Illinois-based Hospira. Inflectra’s label can be found here.
A biosimilar version of the anti–tumor necrosis factor–alpha agent Remicade has been approved by the Food and Drug Administration, making it the first biosimilar drug approved by the agency for inflammatory diseases and just the second biosimilar it has approved.
The agency said in its April 5 announcement that the biosimilar drug, to be marketed as Inflectra, will have the same indications as Remicade: moderately to severely active Crohn’s disease in patients aged 6 years and older who have had an inadequate response to conventional therapy; moderately to severely active ulcerative colitis that has inadequately responded to conventional therapy; moderately to severely active rheumatoid arthritis in combination with methotrexate; active ankylosing spondylitis; active psoriatic arthritis; and chronic, severe plaque psoriasis.
The drug, given the generic name of infliximab-dyyb under the agency’s nomenclature for biosimilar products, earned its approval as a biosimilar by showing it has no clinically meaningful differences in terms of safety and effectiveness from Remicade. According to FDA regulations, biosimilar products can have only minor differences in clinically inactive components and must have the same mechanism(s) of action (to the extent that it is known) and route(s) of administration, dosage form(s), and strength(s) as the reference product; and can be approved only for the indication(s) and condition(s) of use that have been approved for the reference product.
Inflectra’s approval is only as a biosimilar, not as an interchangeable product. The agency has yet to define the regulatory requirements for interchangeability that are necessary to meet the requirements of the Biologics Price Competition and Innovation Act of 2009. That Act states that an approved biosimilar “may be substituted for the reference product without the intervention of the health care provider who prescribed the reference product.” A statement about implementation of the Act on the FDA website explains that for interchangeability, “a sponsor must demonstrate that the biosimilar product can be expected to produce the same clinical result as the reference product in any given patient and, for a biological product that is administered more than once, that the risk of alternating or switching between use of the biosimilar product and the reference product is not greater than the risk of maintaining the patient on the reference product.”
Like Remicade, Inflectra will come with a boxed warning and a Medication Guide that describes important information about its uses and risks, which include serious infections (tuberculosis, bacterial sepsis, invasive fungal infections, and others), lymphoma and other malignancies, liver injury, blood problems, lupuslike syndrome, psoriasis, and in rare cases, nervous system disorders.
Inflectra is manufactured by Celltrion, based in South Korea, for Illinois-based Hospira. Inflectra’s label can be found here.

Cesarean scar defect: What is it and how should it be treated?
Cesarean delivery is one of the most common surgical procedures in women, with rates of 30% or more in the United States.1 As a result, the rate is rising for cesarean scar defect—the presence of a “niche” at the site of cesarean delivery scar—with the reported prevalence between 24% and 70% in a random population of women with at least one cesarean delivery.2 Other terms for cesarean scar defect include a niche, isthmocele, uteroperitoneal fistula, and diverticulum.1–9
Formation of cesarean scar defect
Cesarean scar defect forms after cesarean delivery, at the site of hysterotomy, on the anterior wall of the uterine isthmus (FIGURE 1). While this is the typical location, the defect has also been found at the endocervical canal and mid-uterine body. Improper healing of the cesarean incision leads to thinning of the anterior uterine wall, which creates an indentation and fluid-filled pouch at the cesarean scar site. The exact reason why a niche develops has not yet been determined; however, there are several hypotheses, broken down by pregnancy-related and patient-related factors. Surgical techniques that may increase the chance of niche development include low (cervical) hysterotomy, single-layer uterine wall closure, use of locking sutures, closure of hysterotomy with endometrial-sparing technique, and multiple cesarean deliveries.3,4 Patients with medical conditions that may impact wound healing (such as diabetes and smoking) may be at increased risk for niche formation.

Viewed hysteroscopically, the defect appears as a concave shape in the anterior uterine wall; to the inexperienced eye, it may resemble a second cavity (FIGURE 2).
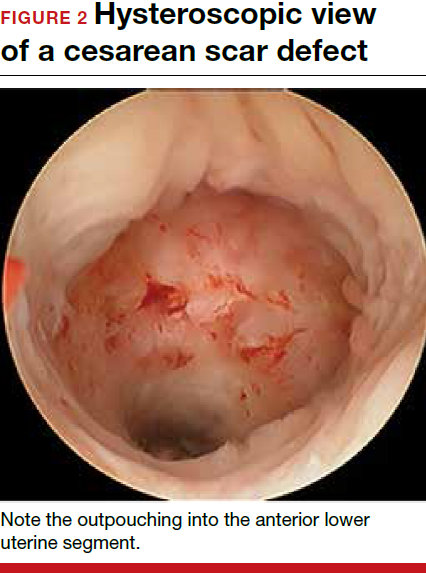
Pelvic pain and other serious consequences
The presence of fibrotic tissue in the niche acts like a valve, leading to the accumulation of blood in this reservoir-like area. A niche thus can cause delayed menstruation through the cervix, resulting in abnormal bleeding, pelvic pain, vaginal discharge, dysmenorrhea, dyspareunia, and infertility. Accumulated blood in this area can ultimately degrade cervical mucus and sperm quality, as well as inhibit sperm transport, a proposed mechanism of infertility.5,6 Women with a niche who conceive are at potential risk for cesarean scar ectopic pregnancy, with the embryo implanting in the pouch and subsequently growing and developing improperly.
Read about evaluation and treatment.
Evaluation and treatment
Patients presenting with the symptoms de-scribed above who have had a prior cesarean delivery should be evaluated for a cesarean scar defect.9 The best time to assess for the abnormality is after the patient’s menstrual cycle, when the endometrial lining is at its thinnest and recently menstruated blood has collected in the defect (this can highlight the niche on imaging). Transvaginal ultrasonography (FIGURE 3) or saline-infusion sonohysterogram serve as a first-line test for in-office diagnosis.7 Magnetic resonance imaging (MRI), 3-D ultrasonography, and hysteroscopy are additional useful imaging modalities that can aid in the diagnosis.
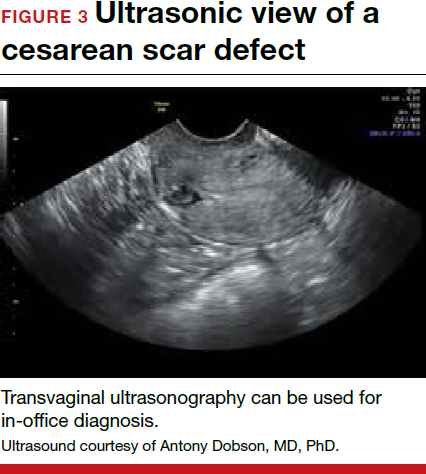
Treatments for cesarean scar defect vary dramatically and include hormonal therapy, hysteroscopic resection, vaginal or laparoscopic repair, and hysterectomy. Nonsurgical treatment should be reserved for women who desire a noninvasive approach, as the evidence for symptom resolution is limited.8
To promote fertility and decrease symptoms, the abnormal, fibrotic tissue must be removed. In our experience, since 2003, we have found that use of a laparoscopic approach is best for women desiring future fertility and that hysteroscopic resection is best for women whose childbearing is completed.9 Our management is dictated by the patient’s fertility plans, since there is concern that cesarean scar defect in a gravid uterus presents a risk for uterine rupture. The laparoscopic approach allows the defect to be repaired and the integrity of the myometrium restored.9
What are the coding options for cesarean scar defect repair?
Melanie Witt, RN, CPC, COBGC, MA
As the accompanying article discusses, the primary treatment for a cesarean scar defect depends on whether the patient wishes to preserve fertility, but assigning a procedure code for either surgical option will entail reporting an unlisted procedure code.
Under Current Procedural Terminology (CPT) guidelines (which are developed and copyrighted by the American Medical Association), procedure code selected must accurately describe the service/procedure performed rather than just approximate the service. This means that when a procedure-specific code does not exist, an unlisted procedure code that represents the type of surgery, the approach, and the anatomic site needs to be selected.
When an unlisted CPT code is reported, payment is based on the complexity of the surgery, and one way to communicate this to a payer is to provide additional documentation that not only includes the operative report but also suggests one or more existing CPT codes that have a published relative value unit (RVU) that approximates the work involved for the unlisted procedure.
The coding options for hysteroscopic and laparoscopic treatment options are listed below. The comparison codes offered will give the surgeon a range to look at, but the ultimate decision to use one of those suggested, or to choose an entirely different comparison code, is entirely within the control of the physician.
ICD-10-CM diagnostic coding
While the cesarean scar defect is a sequela of cesarean delivery, which is always reported as a secondary code, the choice of a primary diagnosis code can be either a gynecologic and/or an obstetric complication code. The choice may be determined by payer policy, as the use of an obstetric complication may not be accepted with a gynecologic procedure code. From a coding perspective, however, use of all 3 of these codes from the International Classification of Diseases, 10th Revision, Clinical Modification (ICD-10-CM) paints the most accurate description of the defect and its cause:
- N85.8 Other specified noninflammatory disorders of uterus versus
- O34.21 Maternal care for scar from previous cesarean delivery plus
- O94 Sequelae of complication of pregnancy, childbirth, and the puerperium.
Hysteroscopic resection codes:
- 58579 Unlisted hysteroscopy procedure, uterus
- The codes that may most closely approximate the physician work include 58561 (Hysteroscopy, surgical; with removal of leiomyomata) with 15.48 RVUs or 58560 (Hysteroscopy, surgical; with division or resection of intrauterine septum [any method]) with 10.92 RVUs.
Laparoscopic repair codes:
- 58578 Unlisted laparoscopy procedure, uterus
- The codes that may most closely approximate the physician work include 58520 (Hysterorrhaphy, repair of ruptured uterus [nonobstetrical] 24.25 RVUs or 58662 (Laparoscopy, surgical; with fulguration or excision of lesions of the ovary, pelvic viscera, or peritoneal surface by any method) with 20.14 RVUs.
You may also want to report a diagnostic hysteroscopy (code 58555), but keep in mind that payment will depend on documentation that clearly indicates that the use of the hysteroscope was for diagnostic purposes. Use of the hysteroscope to simply identify the surgical site to be repaired via the laparoscope will usually not be reimbursed separately.
Ms. Witt is an independent coding and documentation consultant and former program manager, department of coding and nomenclature, American Congress of Obstetricians and Gynecologists.
The author reports no financial relationships relevant to this article.
Read about techniques for repair.
Techniques for repairing cesarean scar defect
For hysteroscopic resection of a niche, the uterus is distended and the intrauterine defect is visualized hysteroscopically, as seen in FIGURE 2. Using a bipolar or unipolar resectoscope, resect the fibrotic tissue of the defect and endometrial-like glands present within the niche. The goal of this relatively quick procedure is to open up the reservoir and facilitate the complete drainage of menstrual blood, thus alleviating the patient’s symptoms.Postoperatively, follow the patient for symptom resolution, and evaluate for defect resolution with transvaginal ultrasonography.
For a laparoscopic repair, first identify the niche hysteroscopically. At the same time as hysteroscopic examination of the cavity, the defect can be evaluated laparoscopically (FIGURE 4). The light from the hysteroscope can be visualized easily laparoscopically because of the thinned myometrium in the area of the defect. Map out the niche by transvaginally passing a cervical dilator into the defect in the uterine cavity (FIGURE 5). Again, given the thinning of this segment of the uterus, the dilator can be easily visualized laparoscopically. Be cautious when placing this dilator, as there is often overlying bladder. Prevent incidental cystotomy by gently advancing the dilator into the defect only until the niche can be adequately detected.9At this point, develop a bladder flap by opening the vesicovaginal and vesicocervical space, mobilizing the bladder inferiorly (FIGURE 6). With the guide of the dilator mapping out the defect (FIGURE 7), excise the fibrotic edges of the niche with thermal energy (monopolar cautery or CO2 laser) or sharp dissection (FIGURE 8). This leaves healthy myometrial tissue margins. Reapproximate these margins with absorbable suture (2-0 polyglactin 910 [Vicryl]) in an interrupted or running fashion, in 2 layers9 (FIGURE 9). Following the laparoscopic repair, perform hysteroscopic evaluation of the uterine cavity to assure complete resolution of the defect (FIGURE 10). With the hysteroscope in place, perform concurrent laparoscopic assessment of the repair. Check for impermeability by assuring no hysteroscopic fluid escapes at the site of repaired hysterotomy.9


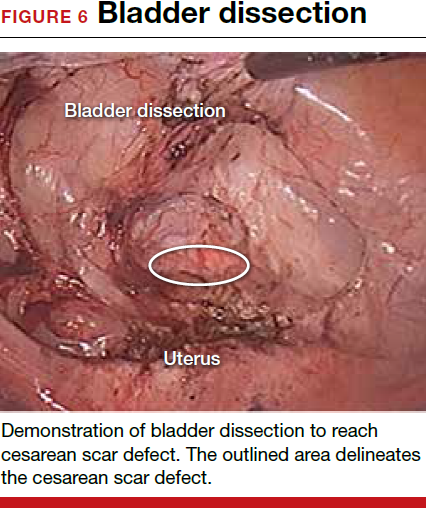
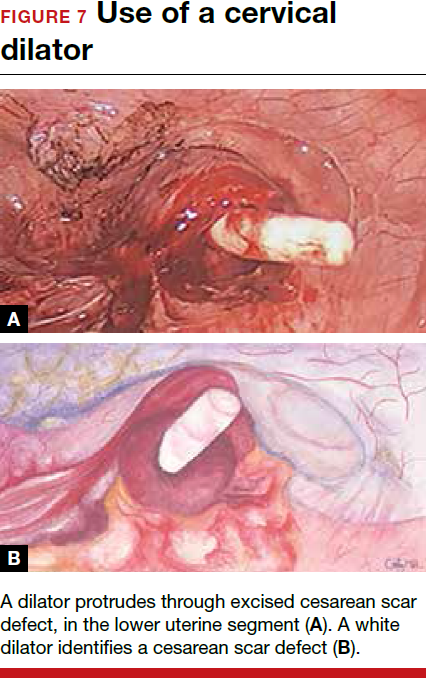
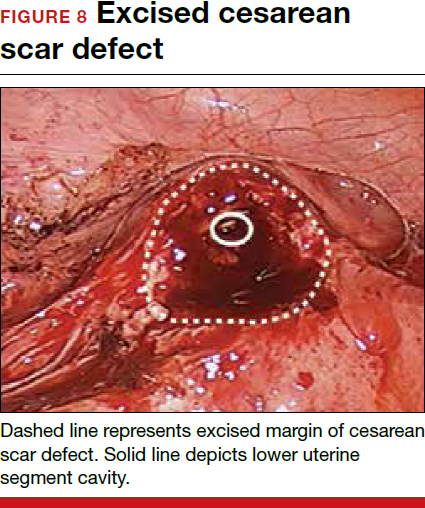
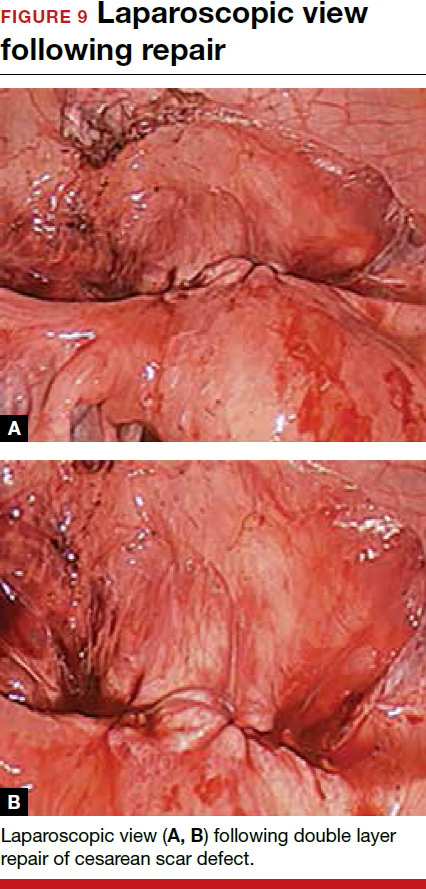
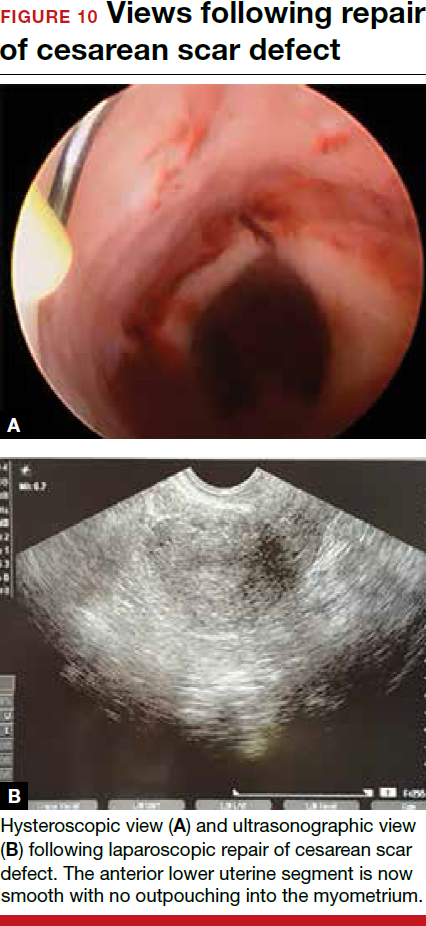
Postoperative care requires following the patient for symptom resolution and counseling regarding future fertility plans. We recommend that patients wait 6 months following the procedure before attempting conception.
When it comes to recommendations regarding preventing cesarean scar defects, additional randomized controlled trials need to be performed to evaluate various surgical techniques. At this time, there is no conclusive evidence that one method of hysterotomy closure is superior to another in preventing cesarean scar defect.
Symptoms often resolve with repair
When a patient with a prior cesarean delivery presents with symptoms of abnormal uterine bleeding, vaginal discharge, dysmenorrhea, dyspareunia, pelvic pain, or infertility that remain unexplained, consider cesarean scar defect as the culprit. Once a diagnosis of niche has been confirmed, the treatment approach should be dictated by the patient’s plans for future fertility. Hysteroscopic resection has been reported to have a 92% to 100% success rate for resolving symptoms of pain and bleeding, while 75% of patients undergoing laparoscopic niche repair for infertility achieved pregnancy.10,11 In our practice, a majority of patients experience symptom relief and go on to carry healthy pregnancies.
Share your thoughts! Send your Letter to the Editor to [email protected]. Please include your name and the city and state in which you practice.

Dr. Camran Nezhat is Director of the Center for Special Minimally Invasive and Robotic Surgery, Palo Alto, California.

Dr. Grace is a Fellow of the Society of Laparoendoscopic Surgeons at the Center for Special Minimally Invasive and Robotic Surgery, Palo Alto.

Ms. Soliemannjad is an Intern at the Center for Special Minimally Invasive and Robotic Surgery, Palo Alto.

Dr. Meshkat Razavi is Fellow at the Center for Special Minimally Invasive and Robotic Surgery, Palo Alto.

Dr. Azadeh Nezhat is Co-Director of the Center for Special Minimally Invasive and Robotic Surgery, Palo Alto.
The authors report no financial relationships relevant to this article.
Dr. Camran Nezhat is Director of the Center for Special Minimally Invasive and Robotic Surgery, Palo Alto, California.
Dr. Grace is a Fellow of the Society of Laparoendoscopic Surgeons at the Center for Special Minimally Invasive and Robotic Surgery, Palo Alto.
Ms. Soliemannjad is an Intern at the Center for Special Minimally Invasive and Robotic Surgery, Palo Alto.
Dr. Meshkat Razavi is Fellow at the Center for Special Minimally Invasive and Robotic Surgery, Palo Alto.
Dr. Azadeh Nezhat is Co-Director of the Center for Special Minimally Invasive and Robotic Surgery, Palo Alto.
The authors report no financial relationships relevant to this article.
Cesarean delivery is one of the most common surgical procedures in women, with rates of 30% or more in the United States.1 As a result, the rate is rising for cesarean scar defect—the presence of a “niche” at the site of cesarean delivery scar—with the reported prevalence between 24% and 70% in a random population of women with at least one cesarean delivery.2 Other terms for cesarean scar defect include a niche, isthmocele, uteroperitoneal fistula, and diverticulum.1–9
Formation of cesarean scar defect
Cesarean scar defect forms after cesarean delivery, at the site of hysterotomy, on the anterior wall of the uterine isthmus (FIGURE 1). While this is the typical location, the defect has also been found at the endocervical canal and mid-uterine body. Improper healing of the cesarean incision leads to thinning of the anterior uterine wall, which creates an indentation and fluid-filled pouch at the cesarean scar site. The exact reason why a niche develops has not yet been determined; however, there are several hypotheses, broken down by pregnancy-related and patient-related factors. Surgical techniques that may increase the chance of niche development include low (cervical) hysterotomy, single-layer uterine wall closure, use of locking sutures, closure of hysterotomy with endometrial-sparing technique, and multiple cesarean deliveries.3,4 Patients with medical conditions that may impact wound healing (such as diabetes and smoking) may be at increased risk for niche formation.
Viewed hysteroscopically, the defect appears as a concave shape in the anterior uterine wall; to the inexperienced eye, it may resemble a second cavity (FIGURE 2).
Pelvic pain and other serious consequences
The presence of fibrotic tissue in the niche acts like a valve, leading to the accumulation of blood in this reservoir-like area. A niche thus can cause delayed menstruation through the cervix, resulting in abnormal bleeding, pelvic pain, vaginal discharge, dysmenorrhea, dyspareunia, and infertility. Accumulated blood in this area can ultimately degrade cervical mucus and sperm quality, as well as inhibit sperm transport, a proposed mechanism of infertility.5,6 Women with a niche who conceive are at potential risk for cesarean scar ectopic pregnancy, with the embryo implanting in the pouch and subsequently growing and developing improperly.
Read about evaluation and treatment.
Evaluation and treatment
Patients presenting with the symptoms de-scribed above who have had a prior cesarean delivery should be evaluated for a cesarean scar defect.9 The best time to assess for the abnormality is after the patient’s menstrual cycle, when the endometrial lining is at its thinnest and recently menstruated blood has collected in the defect (this can highlight the niche on imaging). Transvaginal ultrasonography (FIGURE 3) or saline-infusion sonohysterogram serve as a first-line test for in-office diagnosis.7 Magnetic resonance imaging (MRI), 3-D ultrasonography, and hysteroscopy are additional useful imaging modalities that can aid in the diagnosis.
Treatments for cesarean scar defect vary dramatically and include hormonal therapy, hysteroscopic resection, vaginal or laparoscopic repair, and hysterectomy. Nonsurgical treatment should be reserved for women who desire a noninvasive approach, as the evidence for symptom resolution is limited.8
To promote fertility and decrease symptoms, the abnormal, fibrotic tissue must be removed. In our experience, since 2003, we have found that use of a laparoscopic approach is best for women desiring future fertility and that hysteroscopic resection is best for women whose childbearing is completed.9 Our management is dictated by the patient’s fertility plans, since there is concern that cesarean scar defect in a gravid uterus presents a risk for uterine rupture. The laparoscopic approach allows the defect to be repaired and the integrity of the myometrium restored.9
What are the coding options for cesarean scar defect repair?
Melanie Witt, RN, CPC, COBGC, MA
As the accompanying article discusses, the primary treatment for a cesarean scar defect depends on whether the patient wishes to preserve fertility, but assigning a procedure code for either surgical option will entail reporting an unlisted procedure code.
Under Current Procedural Terminology (CPT) guidelines (which are developed and copyrighted by the American Medical Association), procedure code selected must accurately describe the service/procedure performed rather than just approximate the service. This means that when a procedure-specific code does not exist, an unlisted procedure code that represents the type of surgery, the approach, and the anatomic site needs to be selected.
When an unlisted CPT code is reported, payment is based on the complexity of the surgery, and one way to communicate this to a payer is to provide additional documentation that not only includes the operative report but also suggests one or more existing CPT codes that have a published relative value unit (RVU) that approximates the work involved for the unlisted procedure.
The coding options for hysteroscopic and laparoscopic treatment options are listed below. The comparison codes offered will give the surgeon a range to look at, but the ultimate decision to use one of those suggested, or to choose an entirely different comparison code, is entirely within the control of the physician.
ICD-10-CM diagnostic coding
While the cesarean scar defect is a sequela of cesarean delivery, which is always reported as a secondary code, the choice of a primary diagnosis code can be either a gynecologic and/or an obstetric complication code. The choice may be determined by payer policy, as the use of an obstetric complication may not be accepted with a gynecologic procedure code. From a coding perspective, however, use of all 3 of these codes from the International Classification of Diseases, 10th Revision, Clinical Modification (ICD-10-CM) paints the most accurate description of the defect and its cause:
- N85.8 Other specified noninflammatory disorders of uterus versus
- O34.21 Maternal care for scar from previous cesarean delivery plus
- O94 Sequelae of complication of pregnancy, childbirth, and the puerperium.
Hysteroscopic resection codes:
- 58579 Unlisted hysteroscopy procedure, uterus
- The codes that may most closely approximate the physician work include 58561 (Hysteroscopy, surgical; with removal of leiomyomata) with 15.48 RVUs or 58560 (Hysteroscopy, surgical; with division or resection of intrauterine septum [any method]) with 10.92 RVUs.
Laparoscopic repair codes:
- 58578 Unlisted laparoscopy procedure, uterus
- The codes that may most closely approximate the physician work include 58520 (Hysterorrhaphy, repair of ruptured uterus [nonobstetrical] 24.25 RVUs or 58662 (Laparoscopy, surgical; with fulguration or excision of lesions of the ovary, pelvic viscera, or peritoneal surface by any method) with 20.14 RVUs.
You may also want to report a diagnostic hysteroscopy (code 58555), but keep in mind that payment will depend on documentation that clearly indicates that the use of the hysteroscope was for diagnostic purposes. Use of the hysteroscope to simply identify the surgical site to be repaired via the laparoscope will usually not be reimbursed separately.
Ms. Witt is an independent coding and documentation consultant and former program manager, department of coding and nomenclature, American Congress of Obstetricians and Gynecologists.
The author reports no financial relationships relevant to this article.
Read about techniques for repair.
Techniques for repairing cesarean scar defect
For hysteroscopic resection of a niche, the uterus is distended and the intrauterine defect is visualized hysteroscopically, as seen in FIGURE 2. Using a bipolar or unipolar resectoscope, resect the fibrotic tissue of the defect and endometrial-like glands present within the niche. The goal of this relatively quick procedure is to open up the reservoir and facilitate the complete drainage of menstrual blood, thus alleviating the patient’s symptoms.Postoperatively, follow the patient for symptom resolution, and evaluate for defect resolution with transvaginal ultrasonography.
For a laparoscopic repair, first identify the niche hysteroscopically. At the same time as hysteroscopic examination of the cavity, the defect can be evaluated laparoscopically (FIGURE 4). The light from the hysteroscope can be visualized easily laparoscopically because of the thinned myometrium in the area of the defect. Map out the niche by transvaginally passing a cervical dilator into the defect in the uterine cavity (FIGURE 5). Again, given the thinning of this segment of the uterus, the dilator can be easily visualized laparoscopically. Be cautious when placing this dilator, as there is often overlying bladder. Prevent incidental cystotomy by gently advancing the dilator into the defect only until the niche can be adequately detected.9At this point, develop a bladder flap by opening the vesicovaginal and vesicocervical space, mobilizing the bladder inferiorly (FIGURE 6). With the guide of the dilator mapping out the defect (FIGURE 7), excise the fibrotic edges of the niche with thermal energy (monopolar cautery or CO2 laser) or sharp dissection (FIGURE 8). This leaves healthy myometrial tissue margins. Reapproximate these margins with absorbable suture (2-0 polyglactin 910 [Vicryl]) in an interrupted or running fashion, in 2 layers9 (FIGURE 9). Following the laparoscopic repair, perform hysteroscopic evaluation of the uterine cavity to assure complete resolution of the defect (FIGURE 10). With the hysteroscope in place, perform concurrent laparoscopic assessment of the repair. Check for impermeability by assuring no hysteroscopic fluid escapes at the site of repaired hysterotomy.9
Postoperative care requires following the patient for symptom resolution and counseling regarding future fertility plans. We recommend that patients wait 6 months following the procedure before attempting conception.
When it comes to recommendations regarding preventing cesarean scar defects, additional randomized controlled trials need to be performed to evaluate various surgical techniques. At this time, there is no conclusive evidence that one method of hysterotomy closure is superior to another in preventing cesarean scar defect.
Symptoms often resolve with repair
When a patient with a prior cesarean delivery presents with symptoms of abnormal uterine bleeding, vaginal discharge, dysmenorrhea, dyspareunia, pelvic pain, or infertility that remain unexplained, consider cesarean scar defect as the culprit. Once a diagnosis of niche has been confirmed, the treatment approach should be dictated by the patient’s plans for future fertility. Hysteroscopic resection has been reported to have a 92% to 100% success rate for resolving symptoms of pain and bleeding, while 75% of patients undergoing laparoscopic niche repair for infertility achieved pregnancy.10,11 In our practice, a majority of patients experience symptom relief and go on to carry healthy pregnancies.
Share your thoughts! Send your Letter to the Editor to [email protected]. Please include your name and the city and state in which you practice.
In this Article
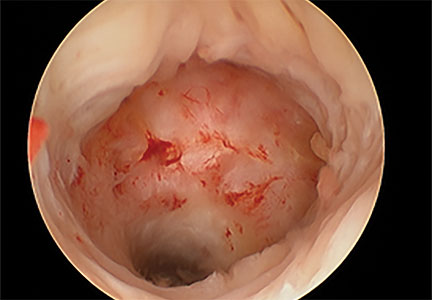
FDA adds safety warnings to certain type 2 diabetes medications
Type 2 diabetes medicines that contain saxagliptin and alogliptin may increase the risk of heart failure, especially in patients who already have heart or kidney disease, according to results from an Food and Drug Administration safety review.
The development, which was announced by MedWatch on April 5, 2016, means that the FDA will add new warnings to the drug labels about this safety issue. “Health care professionals should consider discontinuing medications containing saxagliptin and alogliptin in patients who develop heart failure and monitor their diabetes control,” the communication states. “If a patient’s blood sugar level is not well-controlled with their current treatment, other diabetes medicines may be required.”
The medications of concern include Onglyza (saxagliptin); Kombiglyze XR (saxagliptin and metformin extended release); Nesina (alogliptin); Kazano (alogliptin and metformin), and Oseni (alogliptin and pioglitazone). The move comes after two clinical trials showed that more patients who received saxagliptin- or alogliptin-containing medicines were hospitalized for heart failure, compared with patients who received placebo (for specifics, see the data summary section in the FDA Drug Safety Communication).
The communication noted that patients taking these medicines should contact their health care clinician if they develop signs and symptoms of heart failure such as: unusual shortness of breath during daily activities; trouble breathing when lying down; tiredness, weakness, or fatigue; and weight gain with swelling in the ankles, feet, legs, or stomach.
Clinicians and patients can report adverse events or side effects related to the use of these products at www.accessdata.fda.gov/scripts/medwatch/index.cfm?action=reporting.home.
VIDEO: Fire and Ice - Which catheter ablation approach is best in AF?
CHICAGO – The largest-ever randomized trial of catheter ablation for atrial fibrillation ended in a draw, but there may be a clear winner for some patients.
Safety and 1-year efficacy of radiofrequency ablation and cryoballoon ablation were roughly 65% in both treatment arms of the 769-patient Fire and Ice trial.
However, in an interview at the annual meeting of the American College of Cardiology, principal investigator Dr. Karl-Heinz Kuck of Asklepios Klinik St. Georg, Hamburg, Germany, explains why the results are actually a victory for cryoablation.
AT ACC 16

Intractable shoulder dystocia: A posterior axilla maneuver may save the day
Shoulder dystocia is an unpredictable obstetric emergency that challenges all obstetricians and midwives. In response to a shoulder dystocia emergency, most clinicians implement a sequence of well-practiced steps that begin with early recognition of the problem, clear communication of the emergency with delivery room staff, and a call for help to available clinicians. Management steps may include:
- instructing the mother to stop pushing and moving the mother's buttocks to the edge of the bed
- ensuring there is not a tight nuchal cord
- committing to avoiding the use of excessive force on the fetal head and neck
- considering performing an episiotomy
- performing the McRoberts maneuver combined with suprapubic pressure
- using a rotational maneuver, such as the Woods maneuver or the Rubin maneuver
- delivering the posterior arm
- considering the Gaskin all-four maneuver.
When initial management steps are not enoughIf this sequence of steps does not result in successful vaginal delivery, additional options include: clavicle fracture, cephalic replacement followed by cesarean delivery (Zavanelli maneuver), symphysiotomy, or fundal pressure combined with a rotational maneuver. Another simple intervention that is not discussed widely in medical textbooks or taught during training is the posterior axilla maneuver.
Posterior axilla maneuversVarying posterior axilla maneuvers have been described by many expert obstetricians, including Willughby (17th Century),1 Holman (1963),2 Schramm (1983),3 Menticoglou (2006),4 and Hofmeyr and Cluver (2009, 2015).5−7
Willughby maneuverPercival Willughby’s (1596−1685) description of a posterior axilla maneuver was brief1:
After the head is born, if the child through the greatness of the shoulders, should stick at the neck, let the midwife put her fingers under the child's armpit and give it a nudge, thrusting it to the other side with her finger, drawing the child or she may quickly bring forth the shoulders, without offering to put it forth by her hands clasped about the neck, which might endanger the breaking of the neck.
Holman maneuverHolman described a maneuver with the following steps2:
- perform an episiotomy
- place a finger in the posterior axilla and draw the posterior shoulder down along the pelvic axis
- simultaneously have an assistant perform suprapubic pressure and
- if necessary, insert two supinated fingers under the pubic arch and press and rock the anterior shoulder, tilting the anterior shoulder toward the hollow of the sacrum while simultaneously gently pulling the posterior axilla along the pelvic axis.
Schramm maneuverSchramm, working with a population enriched with women with diabetes, frequently encountered shoulder dystocia and recommended3:
If the posterior axilla can be reached—in other words, if the posterior shoulder is engaged—in my experience it can always be delivered by rotating it to the anterior position while at the same time applying traction....I normally place 1 or 2 fingers of my right hand in the posterior axilla and “scruff” the neck with my left hand, applying both rotation and traction. Because this grip is somewhat insecure, the resultant tractive force is limited and I consider this manoeuvre to be the most effective and least traumatic method of relieving moderate to severe obstruction.
Practice your shoulder dystocia maneuvers using simulation
Obstetric emergencies trigger a rush of adrenaline and great stress for the obstetrician and delivery room team. This may adversely impact motor performance, decision making, and communication skills.1 Low- and high-fidelity simulation exercises create an environment in which the obstetrics team can practice the sequence of maneuvers and seamless teamwork needed to successfully resolve a shoulder dystocia.2,3 Implementing a shoulder dystocia protocol and practicing the protocol using team-based simulation may help to reduce the adverse outcomes of shoulder dystocia.3,4
Reference
1. Wetzel CM, Kneebone RL, Woloshynowych M, et al. The effects of stress on surgical performance. Am J Surg. 2006;191(1):5−10.
2. Crofts JF, Fox R, Ellis D, Winter C, Hinshaw K, Draycott TJ. Observations from 450 shoulder dystocia simulations. Obstet Gynecol. 2008;112(4):906−912.
3. Draycott TJ, Crofts JF, Ash JP, et al. Improving neonatal outcome through practical shoulder dystocia training. Obstet Gynecol. 2008;112(1):14−20.
4. Grobman WA, Miller D, Burke C, Hornbogen A, Tam K, Costello R. Outcomes associated with introduction of a shoulder dystocia protocol. Am J Obstet Gynecol. 2011;205(6):513−517.
Manipulation of the posterior axilla |
|
The right and left third fingers are locked into the posterior axilla, one finger from the front and one from the back of the fetus. Gentle downward guidance is provided by the fingers to draw the posterior shoulder down and out along the curve of the sacrum, thus releasing the anterior shoulder.4 In this drawing, an assistant gently holds the head up. |
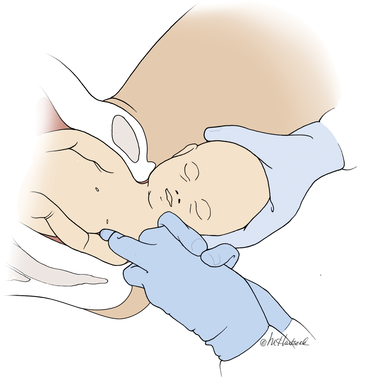
Menticoglou maneuverMenticoglou noted that delivery of the posterior arm generally resolves almost all cases of shoulder dystocia. However, if the posterior arm is extended and trapped between the fetus and maternal pelvic side-wall, it may be difficult to deliver the posterior arm. In these cases he recommended having an assistant gently hold, not pull, the fetal head upward and, at the same time, having the obstetrician get on one knee, placing the middle fingers of both hands into the posterior axilla of the fetus.4
The right middle finger is placed into the axilla from the left side of the maternal pelvis, and the left middle finger is placed into the axilla from the right side of the maternal pelvis, resulting in the two middle fingers overlapping in the fetal axilla (FIGURE).4 Gentle force is then used to pull the posterior shoulder and arm downward and outward along the curve of the sacrum. Once the shoulder has emerged from the pelvis, the posterior arm is delivered. Alternatively, if the posterior shoulder is brought well down into the pelvis, another attempt can be made at delivering the posterior arm.4
My preferred approach. The Menticoglou maneuver is my preferred posterior axilla maneuver because it can be accomplished rapidly; requires no equipment, such as a sling catheter; and the obstetrician has good tactile feedback throughout the application of gentle force.
Hofmeyr-Cluver maneuverIn cases of difficult shoulder dystocia, Dr. William Smellie (1762)8 recommended placing one or two fingers in the anterior or posterior fetal axilla and gentling pulling on the axilla to deliver the body. If the axillae were too high to reach, he recommended using a blunt hook in the axilla to draw forth the impacted child. He advised caution when using a blunt hook because the fetus might be injured or lacerated.
Instead of using a hook, Hofmeyr and Cluver5−7 have recommended using a catheter sling to deliver the posterior shoulder. In this maneuver, a loop of a suction catheter or firm urinary catheter is placed over the obstetrician’s index finger and the loop is pushed through the posterior axilla, back to front, with guidance from the index finger. The index finger of the opposite hand is used to catch the loop and pull the catheter through, creating a single-stranded sling that is positioned in the axilla. Gentle force is then applied to the sling in the axis of the pelvis to deliver the posterior shoulder.
“If the posterior arm does not follow it is then swept out easily because room has been created by delivering the posterior shoulder. If the aforementioned procedure fails, the sling can be used to rotate the shoulder. To perform a rotational maneuver, sling traction is directed laterally towards the side of the baby’s back then anteriorly while digital pressure is applied behind the anterior shoulder to assist rotation.”7
Use ACOG’s checklist for documenting a shoulder dystocia
Following the resolution of a shoulder dystocia, it is important to gather all the necessary facts to complete a detailed medical record entry describing the situation and interventions used. The checklist from the American College of Obstetricians and Gynecologists (ACOG) helps you to prepare a standardized medical record entry that is comprehensive.
My experience is that “free form” medical record entries describing the events at a shoulder dystocia event are generally not optimally organized, creating future problems when the case is reviewed.
ACOG obstetric checklists are available for download at http://www.acog.org/Resources-And-Publications, or use your web browser to search for “ACOG Shoulder Dystocia checklist.”
With scant literature, know the benefits and risksThe world’s literature on posterior axilla maneuvers to resolve shoulder dystocia consists of case series and individual case reports.2−7 Hence, the quality of the data supporting this intervention is not optimal, and risks associated with the maneuver are not well characterized. Application of a controlled and gentle force to the posterior axilla may cause fracture of the fetal humerus5 or dislocation of the fetal shoulder. The posterior axilla maneuver also may increase the risk of a maternal third- or fourth-degree perineal laceration.
As a general rule, as the number of maneuvers used to resolve a difficult shoulder dystocia increase, the risk of neonatal injury increases.9 Since the posterior axilla maneuver typically is only attempted after multiple previous maneuvers have failed, the risk of fetal injury is increased. However, as time passes and a shoulder dystocia remains unresolved for 4 or 5 minutes, the risk of neurologic injury and fetal death increases.10
In resolving a shoulder dystocia, speed and skill are essential. A posterior axilla maneuver can be performed more rapidly than a Zavanelli maneuver or a symphysiotomy. Although manipulation of the posterior axilla and arm may cause a fracture of the humerus, this complication is a modest price to pay for preventing permanent fetal brain injury or fetal death.
Share your thoughts! Send your Letter to the Editor to [email protected]. Please include your name and the city and state in which you practice.
- Willughby P. Observations in midwifery. New York, NY: MW Books; 1972:312−313.
- Holman MS. A new manoeuvre for delivery of an impacted shoulder based on a mechanical analysis. S Afr Med J. 1963;37:247−249.
- Schramm M. Impacted shoulders—a personal experience. Aust N Z J Obstet Gynaecol. 1983;23(1):28−31.
- Menticoglou SM. A modified technique to deliver the posterior arm in severe shoulder dystocia. Obstet Gynecol. 2006;108(3 pt 2):755−757.
- Cluver CA, Hofmeyr GJ. Posterior axilla sling traction: a technique for intractable shoulder dystocia. Obstet Gynecol. 2009;113(2 pt 2):486–488.
- Hofmeyr GJ, Cluver CA. Posterior axilla sling traction for intractable shoulder dystocia. BJOG. 2009;116(13):1818−1820.
- Cluver CA, Hofmeyr GJ. Posterior axilla sling traction for shoulder dystocia: case review and a new method for shoulder rotation with the sling. Am J Obstet Gynecol. 2015;212(6):784.e1−e7.
- Smellie W. A treatise on the theory and practice of midwifery. 4th ed. London, England; 1762:226−227.
- Hoffman MK, Bailit JL, Branch DW, et al; Consortium on Safe Labor. A comparison of obstetric maneuvers for the acute management of shoulder dystocia. Obstet Gynecol. 2011;117(6):1272−1278.
- Lerner H, Durlacher K, Smith S, Hamilton E. Relationship between head-to-body delivery interval in shoulder dystocia and neonatal depression. Obstet Gynecol. 2011;118(2 pt 1):318−322.

Dr. Barbieri is Editor in Chief, OBG Management; Chair, Obstetrics and Gynecology, Brigham and Women’s Hospital; and Kate Macy Ladd Professor of Obstetrics, Gynecology, and Reproductive Biology, Harvard Medical School, Boston, Massachusetts.
Dr. Barbieri reports no financial relationships relevant to this article.
Shoulder dystocia is an unpredictable obstetric emergency that challenges all obstetricians and midwives. In response to a shoulder dystocia emergency, most clinicians implement a sequence of well-practiced steps that begin with early recognition of the problem, clear communication of the emergency with delivery room staff, and a call for help to available clinicians. Management steps may include:
- instructing the mother to stop pushing and moving the mother's buttocks to the edge of the bed
- ensuring there is not a tight nuchal cord
- committing to avoiding the use of excessive force on the fetal head and neck
- considering performing an episiotomy
- performing the McRoberts maneuver combined with suprapubic pressure
- using a rotational maneuver, such as the Woods maneuver or the Rubin maneuver
- delivering the posterior arm
- considering the Gaskin all-four maneuver.
When initial management steps are not enoughIf this sequence of steps does not result in successful vaginal delivery, additional options include: clavicle fracture, cephalic replacement followed by cesarean delivery (Zavanelli maneuver), symphysiotomy, or fundal pressure combined with a rotational maneuver. Another simple intervention that is not discussed widely in medical textbooks or taught during training is the posterior axilla maneuver.
Posterior axilla maneuversVarying posterior axilla maneuvers have been described by many expert obstetricians, including Willughby (17th Century),1 Holman (1963),2 Schramm (1983),3 Menticoglou (2006),4 and Hofmeyr and Cluver (2009, 2015).5−7
Willughby maneuverPercival Willughby’s (1596−1685) description of a posterior axilla maneuver was brief1:
After the head is born, if the child through the greatness of the shoulders, should stick at the neck, let the midwife put her fingers under the child's armpit and give it a nudge, thrusting it to the other side with her finger, drawing the child or she may quickly bring forth the shoulders, without offering to put it forth by her hands clasped about the neck, which might endanger the breaking of the neck.
Holman maneuverHolman described a maneuver with the following steps2:
- perform an episiotomy
- place a finger in the posterior axilla and draw the posterior shoulder down along the pelvic axis
- simultaneously have an assistant perform suprapubic pressure and
- if necessary, insert two supinated fingers under the pubic arch and press and rock the anterior shoulder, tilting the anterior shoulder toward the hollow of the sacrum while simultaneously gently pulling the posterior axilla along the pelvic axis.
Schramm maneuverSchramm, working with a population enriched with women with diabetes, frequently encountered shoulder dystocia and recommended3:
If the posterior axilla can be reached—in other words, if the posterior shoulder is engaged—in my experience it can always be delivered by rotating it to the anterior position while at the same time applying traction....I normally place 1 or 2 fingers of my right hand in the posterior axilla and “scruff” the neck with my left hand, applying both rotation and traction. Because this grip is somewhat insecure, the resultant tractive force is limited and I consider this manoeuvre to be the most effective and least traumatic method of relieving moderate to severe obstruction.
Practice your shoulder dystocia maneuvers using simulation
Obstetric emergencies trigger a rush of adrenaline and great stress for the obstetrician and delivery room team. This may adversely impact motor performance, decision making, and communication skills.1 Low- and high-fidelity simulation exercises create an environment in which the obstetrics team can practice the sequence of maneuvers and seamless teamwork needed to successfully resolve a shoulder dystocia.2,3 Implementing a shoulder dystocia protocol and practicing the protocol using team-based simulation may help to reduce the adverse outcomes of shoulder dystocia.3,4
Reference
1. Wetzel CM, Kneebone RL, Woloshynowych M, et al. The effects of stress on surgical performance. Am J Surg. 2006;191(1):5−10.
2. Crofts JF, Fox R, Ellis D, Winter C, Hinshaw K, Draycott TJ. Observations from 450 shoulder dystocia simulations. Obstet Gynecol. 2008;112(4):906−912.
3. Draycott TJ, Crofts JF, Ash JP, et al. Improving neonatal outcome through practical shoulder dystocia training. Obstet Gynecol. 2008;112(1):14−20.
4. Grobman WA, Miller D, Burke C, Hornbogen A, Tam K, Costello R. Outcomes associated with introduction of a shoulder dystocia protocol. Am J Obstet Gynecol. 2011;205(6):513−517.
Manipulation of the posterior axilla |
|
The right and left third fingers are locked into the posterior axilla, one finger from the front and one from the back of the fetus. Gentle downward guidance is provided by the fingers to draw the posterior shoulder down and out along the curve of the sacrum, thus releasing the anterior shoulder.4 In this drawing, an assistant gently holds the head up. |
Menticoglou maneuverMenticoglou noted that delivery of the posterior arm generally resolves almost all cases of shoulder dystocia. However, if the posterior arm is extended and trapped between the fetus and maternal pelvic side-wall, it may be difficult to deliver the posterior arm. In these cases he recommended having an assistant gently hold, not pull, the fetal head upward and, at the same time, having the obstetrician get on one knee, placing the middle fingers of both hands into the posterior axilla of the fetus.4
The right middle finger is placed into the axilla from the left side of the maternal pelvis, and the left middle finger is placed into the axilla from the right side of the maternal pelvis, resulting in the two middle fingers overlapping in the fetal axilla (FIGURE).4 Gentle force is then used to pull the posterior shoulder and arm downward and outward along the curve of the sacrum. Once the shoulder has emerged from the pelvis, the posterior arm is delivered. Alternatively, if the posterior shoulder is brought well down into the pelvis, another attempt can be made at delivering the posterior arm.4
My preferred approach. The Menticoglou maneuver is my preferred posterior axilla maneuver because it can be accomplished rapidly; requires no equipment, such as a sling catheter; and the obstetrician has good tactile feedback throughout the application of gentle force.
Hofmeyr-Cluver maneuverIn cases of difficult shoulder dystocia, Dr. William Smellie (1762)8 recommended placing one or two fingers in the anterior or posterior fetal axilla and gentling pulling on the axilla to deliver the body. If the axillae were too high to reach, he recommended using a blunt hook in the axilla to draw forth the impacted child. He advised caution when using a blunt hook because the fetus might be injured or lacerated.
Instead of using a hook, Hofmeyr and Cluver5−7 have recommended using a catheter sling to deliver the posterior shoulder. In this maneuver, a loop of a suction catheter or firm urinary catheter is placed over the obstetrician’s index finger and the loop is pushed through the posterior axilla, back to front, with guidance from the index finger. The index finger of the opposite hand is used to catch the loop and pull the catheter through, creating a single-stranded sling that is positioned in the axilla. Gentle force is then applied to the sling in the axis of the pelvis to deliver the posterior shoulder.
“If the posterior arm does not follow it is then swept out easily because room has been created by delivering the posterior shoulder. If the aforementioned procedure fails, the sling can be used to rotate the shoulder. To perform a rotational maneuver, sling traction is directed laterally towards the side of the baby’s back then anteriorly while digital pressure is applied behind the anterior shoulder to assist rotation.”7
Use ACOG’s checklist for documenting a shoulder dystocia
Following the resolution of a shoulder dystocia, it is important to gather all the necessary facts to complete a detailed medical record entry describing the situation and interventions used. The checklist from the American College of Obstetricians and Gynecologists (ACOG) helps you to prepare a standardized medical record entry that is comprehensive.
My experience is that “free form” medical record entries describing the events at a shoulder dystocia event are generally not optimally organized, creating future problems when the case is reviewed.
ACOG obstetric checklists are available for download at http://www.acog.org/Resources-And-Publications, or use your web browser to search for “ACOG Shoulder Dystocia checklist.”
With scant literature, know the benefits and risksThe world’s literature on posterior axilla maneuvers to resolve shoulder dystocia consists of case series and individual case reports.2−7 Hence, the quality of the data supporting this intervention is not optimal, and risks associated with the maneuver are not well characterized. Application of a controlled and gentle force to the posterior axilla may cause fracture of the fetal humerus5 or dislocation of the fetal shoulder. The posterior axilla maneuver also may increase the risk of a maternal third- or fourth-degree perineal laceration.
As a general rule, as the number of maneuvers used to resolve a difficult shoulder dystocia increase, the risk of neonatal injury increases.9 Since the posterior axilla maneuver typically is only attempted after multiple previous maneuvers have failed, the risk of fetal injury is increased. However, as time passes and a shoulder dystocia remains unresolved for 4 or 5 minutes, the risk of neurologic injury and fetal death increases.10
In resolving a shoulder dystocia, speed and skill are essential. A posterior axilla maneuver can be performed more rapidly than a Zavanelli maneuver or a symphysiotomy. Although manipulation of the posterior axilla and arm may cause a fracture of the humerus, this complication is a modest price to pay for preventing permanent fetal brain injury or fetal death.
Share your thoughts! Send your Letter to the Editor to [email protected]. Please include your name and the city and state in which you practice.
- Willughby P. Observations in midwifery. New York, NY: MW Books; 1972:312−313.
- Holman MS. A new manoeuvre for delivery of an impacted shoulder based on a mechanical analysis. S Afr Med J. 1963;37:247−249.
- Schramm M. Impacted shoulders—a personal experience. Aust N Z J Obstet Gynaecol. 1983;23(1):28−31.
- Menticoglou SM. A modified technique to deliver the posterior arm in severe shoulder dystocia. Obstet Gynecol. 2006;108(3 pt 2):755−757.
- Cluver CA, Hofmeyr GJ. Posterior axilla sling traction: a technique for intractable shoulder dystocia. Obstet Gynecol. 2009;113(2 pt 2):486–488.
- Hofmeyr GJ, Cluver CA. Posterior axilla sling traction for intractable shoulder dystocia. BJOG. 2009;116(13):1818−1820.
- Cluver CA, Hofmeyr GJ. Posterior axilla sling traction for shoulder dystocia: case review and a new method for shoulder rotation with the sling. Am J Obstet Gynecol. 2015;212(6):784.e1−e7.
- Smellie W. A treatise on the theory and practice of midwifery. 4th ed. London, England; 1762:226−227.
- Hoffman MK, Bailit JL, Branch DW, et al; Consortium on Safe Labor. A comparison of obstetric maneuvers for the acute management of shoulder dystocia. Obstet Gynecol. 2011;117(6):1272−1278.
- Lerner H, Durlacher K, Smith S, Hamilton E. Relationship between head-to-body delivery interval in shoulder dystocia and neonatal depression. Obstet Gynecol. 2011;118(2 pt 1):318−322.
In this article
- Menticoglou maneuver
- Importance of simulation
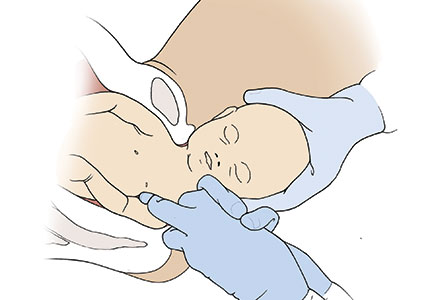
Hepatitis Outlook: March 2016
If you work on the front lines of medical care treating patients with hepatitis, you may not have time to review all the hepatitis research that enters the medical literature every month. Here’s a quick look at some notable news items and journal articles published over the past month, covering a variety of the major hepatitis viruses.
In the United States, hepatitis C virus (HCV)-associated mortality is increasing. From 2003-2013, the number of deaths associated with HCV has now surpassed 60 other nationally notifiable infectious conditions combined.

Chronic hepatitis B infection increased mortality and complexity among a cohort of HIV-coinfected patients in South Africa, according to a study in HIV Medicine. Researchers found that mortality was increased for chronic hepatitis B patients with hepatitis B virus DNA levels greater than 10,000 copies/mL, compared with non-coinfected patients.
A study in the Journal of Infectious Diseases found that Interferon Lambda (IFNL) genotypes were individually linked to higher rates of fibrosis in HIV–hepatitis C co-infection. Investigators said IFNL genotypes may be useful to target hepatitis C virus treatments to those who are at higher risk of liver disease.
A phase I study of a new NS3/4A protease inhibitor for treatment of chronic hepatitis C virus genotype 1-4 infection yielded positive tolerability, efficacy, and pharmacokinetic results, indicating further evaluation is warranted. The drug, GS-9857, produced by Gilead Sciences, achieved mean and median maximum reductions in HCV RNA of greater than or equal to 3 log10 IU/mL following administration of a 100-mg dose in patients with HCV genotype 1a, 1b, 2, 3, or 4 infection.
High baseline bilirubin and low albumin predict liver decompensation and serious adverse events in hepatitis C-infected patients treated with sofosbuvir-containing regimens, according to a study in the Journal of Viral Hepatitis. Among 499 previously stable patients in the cohort, the incidence of decompensation/events was 4.5%, and the mortality rate was 0.6%.
A meta-analysis of national-level hepatitis C virus prevalence in the Arabian Gulf region found that it is comparable to global levels, although higher HCV prevalence is found in specific expatriate populations reflecting the prevalence in their countries of origin.
A resistance analysis of the drug GS-9190, a NS5B non-nucleoside analogue for the treatment of hepatitis C virus infection, found that the Y448H mutation was rapidly selected in the majority of patients receiving multiple doses of GS-9190 as monotherapy, despite undetectable levels in pretreatment samples. Researchers concluded that Y448H confers reduced susceptibility to GS-9190 and other non-nucleoside inhibitors and persisted in most patients for months post-treatment.
A study published in the International Journal of Infectious Diseases found that hepatitis delta virus (HDV) patients in the Amazon region can be treated with a combination of Pegylated Interferon Alpha and Entecavir for 48 weeks, with good chances of negative HDV RNA at week 24. The results suggest that HDV-3 in the native population may be an “easy to treat” variant compared to HDV-1.
Development of acute hepatitis B virus disease in successfully vaccinated individuals is a rare event, affirmed a study of the Italian Surveillance System for Acute Viral Hepatitis (SEIEVA) from 1993 to 2014. Only 3.2% of acute hepatitis B cases had been vaccinated. Investigators said further efforts are needed to enhance the vaccine coverage rate in people at increased risk of infection, as hepatitis B is a vaccine-preventable disease.
Lab-made hepatocyte transplantation has therapeutic potential as a bridge or even alternative to whole organ liver transplantation, but researchers say deficiencies and uncertainties must be addressed in future studies aimed at developing liver cell therapies with such hepatocytes.
A major concern in potential liver transplant candidates is of unintended harm by achieving sustained viral response rates to direct-acting antiviral treatment, but without improvement in hepatic function to an extent where the patients might function well. A review essay in the Journal of Viral Hepatitis says there is a growing sentiment in some transplant quarters that those with decompensated liver disease awaiting liver transplant be treated for HCV after liver transplant instead of pre-transplant. The authors say it is essential that to develop robust predictors of improvement in liver function so patients can be carefully selected for therapy in the context of liver transplantation.
Treating mild-stage hepatitis C infection in people who inject drugs had virtually no impact on HCV-related end-stage liver disease/hepatocellular carcinoma (ESLD/HCC) within 15 years, a recent study found, but the long timescale of liver disease means relatively few people who inject drugs reach cirrhosis before cessation of injecting. Investigators said strategies focusing on treating advanced disease have the potential for dramatic reductions in severe morbidity, but virtually no preventative impact.
On Twitter @richpizzi
If you work on the front lines of medical care treating patients with hepatitis, you may not have time to review all the hepatitis research that enters the medical literature every month. Here’s a quick look at some notable news items and journal articles published over the past month, covering a variety of the major hepatitis viruses.
In the United States, hepatitis C virus (HCV)-associated mortality is increasing. From 2003-2013, the number of deaths associated with HCV has now surpassed 60 other nationally notifiable infectious conditions combined.
Chronic hepatitis B infection increased mortality and complexity among a cohort of HIV-coinfected patients in South Africa, according to a study in HIV Medicine. Researchers found that mortality was increased for chronic hepatitis B patients with hepatitis B virus DNA levels greater than 10,000 copies/mL, compared with non-coinfected patients.
A study in the Journal of Infectious Diseases found that Interferon Lambda (IFNL) genotypes were individually linked to higher rates of fibrosis in HIV–hepatitis C co-infection. Investigators said IFNL genotypes may be useful to target hepatitis C virus treatments to those who are at higher risk of liver disease.
A phase I study of a new NS3/4A protease inhibitor for treatment of chronic hepatitis C virus genotype 1-4 infection yielded positive tolerability, efficacy, and pharmacokinetic results, indicating further evaluation is warranted. The drug, GS-9857, produced by Gilead Sciences, achieved mean and median maximum reductions in HCV RNA of greater than or equal to 3 log10 IU/mL following administration of a 100-mg dose in patients with HCV genotype 1a, 1b, 2, 3, or 4 infection.
High baseline bilirubin and low albumin predict liver decompensation and serious adverse events in hepatitis C-infected patients treated with sofosbuvir-containing regimens, according to a study in the Journal of Viral Hepatitis. Among 499 previously stable patients in the cohort, the incidence of decompensation/events was 4.5%, and the mortality rate was 0.6%.
A meta-analysis of national-level hepatitis C virus prevalence in the Arabian Gulf region found that it is comparable to global levels, although higher HCV prevalence is found in specific expatriate populations reflecting the prevalence in their countries of origin.
A resistance analysis of the drug GS-9190, a NS5B non-nucleoside analogue for the treatment of hepatitis C virus infection, found that the Y448H mutation was rapidly selected in the majority of patients receiving multiple doses of GS-9190 as monotherapy, despite undetectable levels in pretreatment samples. Researchers concluded that Y448H confers reduced susceptibility to GS-9190 and other non-nucleoside inhibitors and persisted in most patients for months post-treatment.
A study published in the International Journal of Infectious Diseases found that hepatitis delta virus (HDV) patients in the Amazon region can be treated with a combination of Pegylated Interferon Alpha and Entecavir for 48 weeks, with good chances of negative HDV RNA at week 24. The results suggest that HDV-3 in the native population may be an “easy to treat” variant compared to HDV-1.
Development of acute hepatitis B virus disease in successfully vaccinated individuals is a rare event, affirmed a study of the Italian Surveillance System for Acute Viral Hepatitis (SEIEVA) from 1993 to 2014. Only 3.2% of acute hepatitis B cases had been vaccinated. Investigators said further efforts are needed to enhance the vaccine coverage rate in people at increased risk of infection, as hepatitis B is a vaccine-preventable disease.
Lab-made hepatocyte transplantation has therapeutic potential as a bridge or even alternative to whole organ liver transplantation, but researchers say deficiencies and uncertainties must be addressed in future studies aimed at developing liver cell therapies with such hepatocytes.
A major concern in potential liver transplant candidates is of unintended harm by achieving sustained viral response rates to direct-acting antiviral treatment, but without improvement in hepatic function to an extent where the patients might function well. A review essay in the Journal of Viral Hepatitis says there is a growing sentiment in some transplant quarters that those with decompensated liver disease awaiting liver transplant be treated for HCV after liver transplant instead of pre-transplant. The authors say it is essential that to develop robust predictors of improvement in liver function so patients can be carefully selected for therapy in the context of liver transplantation.
Treating mild-stage hepatitis C infection in people who inject drugs had virtually no impact on HCV-related end-stage liver disease/hepatocellular carcinoma (ESLD/HCC) within 15 years, a recent study found, but the long timescale of liver disease means relatively few people who inject drugs reach cirrhosis before cessation of injecting. Investigators said strategies focusing on treating advanced disease have the potential for dramatic reductions in severe morbidity, but virtually no preventative impact.
On Twitter @richpizzi

New Analysis shows that Women who Develop Diabetes while Pregnant are Likely to Develop Fatty Liver Disease
(Reuters Health) - Women who develop diabetes while pregnant may be at elevated risk of also developing a dangerous build up of fat in their livers when they reach middle age, according to a new analysis.
The common risk factor for both gestational diabetes and non-alcoholic fatty liver disease, researchers say, is trouble making or using the hormone insulin to manage blood sugar, known as insulin resistance.
"We hope that early identification can promote healthy lifestyle changes that prevent or slow disease progression," said lead author Dr. Veeral Ajmera of the University of California, San Francisco.
"Pregnancy stresses the body in many ways, one of which is the ability to manage blood sugar," Ajmera said by email. "During pregnancy a woman's body becomes more resistant to insulin, which is the hormone required to decrease the blood sugar."
Insulin resistance is also "central to development of non-alcoholic fatty liver disease," which affects 20 percent to 30 percent of adults in the western world, the study team writes in The American Journal of Gastroenterology. Non-alcoholic fatty liver disease is the most common chronic liver disease in the United States.
Fatty liver disease is often diagnosed later in life, Ajmera told Reuters Health. So the researchers used long-term data to see if diabetes during pregnancy made a woman more likely to develop fatty liver disease 25 years later.
The researchers analyzed information about 1,115 black and white women recruited between 1985-1986 in four cities across the United States who gave birth to at least one child.
The participants did not have diabetes before becoming pregnant and the study excluded people who had liver issues related to alcohol, HIV, hepatitis or medications.
At the start of the study, women reported on whether they first experienced diabetes during pregnancy, and researchers confirmed the diagnosis with blood test results. Twenty-five years later, the women received more blood tests as well as CT scans of their livers to check if they had fatty liver disease.
At the beginning of the study, 124 women reported that they developed diabetes while they were pregnant. These women were more likely than those who did not experience gestational diabetes to be overweight. They also had higher degrees of insulin resistance when they were younger as well as at the 25-year follow up.
The women who experienced diabetes during pregnancy were also more likely to have developed diabetes again at some point in the following 25 years.
Overall, 75 women were diagnosed with non-alcoholic fatty liver disease when they were middle aged. Women who had diabetes during pregnancy were more than twice as likely as those who didn't to later develop fatty liver disease.
After researchers adjusted for diabetes that some women experienced outside of pregnancy, the risk of non-alcoholic fatty liver disease was still 50 percent higher for women who had gestational diabetes compared to those who didn't.
Fatty liver disease can have grave health effects and can even lead to cirrhosis, a condition that causes liver damage and possible failure, said Simon Taylor-Robinson, a professor of medicine at Imperial College London in the U.K. who wasn't involved in the study.
He advocates changes in diet to avoid the insulin resistance that leads to diabetes and fatty liver disease. "Many women are obese - so it is a matter of reducing weight and eating sensibly," he said.
Taylor-Robinson recommends eating fewer carbohydrates, more proteins and vegetables, and in particular, avoiding large amounts of fruit juice, which can contain a lot of sugar.
Ajmera also advised lifestyle changes, especially adding exercise. "We recommend either aerobic or resistance training for 30 minutes five times per week," he said.
"There are consequences to obesity and this includes cirrhosis, liver cancer and heart disease," Taylor-Robinson said. "Those people who become diabetic during pregnancy have strong risks of developing these complications later in life if attention isn't given to weight, diet and exercise."
EHR Report: Take your medicine!
“Drugs don’t work in patients who don’t take them.”
–C. Everett Koop, M.D.
While it would be hard to imagine accountable care organizations being able to get the data they need to manage care without electronic health records, and EHRs are critical as payment has evolved to emphasize the outcomes of treatment, one area remains the holy grail of disease management: how to get patients to take the medications that are prescribed.
Poor adherence to medications is a critical issue in the management of chronic disease. The causes for suboptimal adherence are numerous, including the cost of medications, patient-physician communication, patient education, motivation, and simple forgetfulness.

Approximately 1.5 billion prescriptions, at a cost of more than $250 billion, are dispensed each year in the United States. A large body of evidence supports the use of these medications. For patients with diabetes, for instance, correct medication use can lower blood sugar, blood pressure, and cholesterol, and by so doing, decrease morbidity and mortality from both microvascular and macrovascular disease.
The act of taking medications is influenced by many factors, and all of these factors come together at a point in time when patients are not directly engaged with the health care system. It is at that moment that patients remember and decide whether to take their medications.
Numerous studies show that individuals often do not take their medicines as prescribed. Adherence rates for medications for chronic disease show that patients on average take only about 50% of prescribed doses. For patients with diabetes, the average adherence rate is about 70%, with rates ranging in different studies from 31% to 87%.
When patients do not take their medications correctly, there can be severe consequences. Poor medication adherence can lead to poorer clinical outcomes, including increased hospitalizations. One large dataset of more than 56,000 individuals with type 2 diabetes covered by employer-sponsored health insurance showed that increased adherence to medications significantly reduced hospitalizations and emergency department visits. When adherence rates increased, the hospitalization rate fell 23%, and the rate of emergency department visits decreased 46%, resulting in significant cost savings for the health system.1
In response to this issue, many strategies have emerged. We now regularly get correspondence from insurance companies alerting us to nonadherence of individual patients. This information tends to be of little benefit, because the information is received long after the decision to take or not take the medication is made. Our response in the office to our patients is generally to remind them to take their medications, which is not much different from the discussion we have with them without that information.
Recently, a new set of apps for smartphones and tablets has emerged to help patients organize their approach to taking medications. Examples of some of these apps include Care4Today, Dosecast, Medisafe, MedSimple, MyMedREc, MyMeds, and OnTimeRx. Most of these apps allow a patient to put in their medication schedule and are organized to provide reminders when it is time to take medications.
The problem with reminders, of course, is that they don’t always happen at a time when it is convenient for a person to take their medications. For example, if your app reminds you to take your medicines at 9 p.m. each night, and you are at the movies on a Saturday night, you may extinguish the reminder and not remember to take the medications when you get home.
Many of the apps also track adherence rates so that patients can see how well they are doing in taking their medications. The results are often startling to patients, and it is hoped that such information would encourage more effort in taking medications.
One problem with many of the apps currently available is that they essentially function as sophisticated alarm clocks. They do not get at some of the fundamental reasons that people do not take their medications, which would require more behavioral input.
In fact, a recent article in the American Journal of Preventive Medicine looked at 166 medication adherence apps and concluded that current apps contained little in the way of evidence-based behavioral change techniques that have been shown to help change behavior. In fact, only about one-third of apps contained any feedback on behavior at all.2
While adherence apps still have a way to go, they can be helpful, and many contain interesting, novel features. Some allow the patient to input the name of a medication by scanning the name from the medication’s pill bottle. Some have the ability not only to remind a patient to take a medication, but also to text that patient’s caregiver (or parent, in the case of a teenager) if the medication is not taken.
While not perfect, these adherence apps are worth learning more about. They may be helpful additions to our efforts to achieve the best outcomes for our patients by helping them to actually take the medications that we so carefully prescribe.
References
1. Encinosa, W.E.; Bernard, D.; Dor, A. Does prescription drug adherence reduce hospitalizations and costs? The case of diabetes. Advances in Health Economics and Health Services Research 22, pp. 151-73, 2010 (AHRQ Publication No. 11-R008).
2. Am J Prev Med. 2015 Nov 17. pii: S0749-3797(15)00637-6. doi: 10.1016/j.amepre.2015.09.034.
Dr. Notte is a family physician and clinical informaticist for Abington (Pa.) Memorial Hospital. He is a partner in EHR Practice Consultants, a firm that aids physicians in adopting electronic health records. Dr. Skolnik is associate director of the family medicine residency program at Abington Memorial Hospital and professor of family and community medicine at Temple University in Philadelphia.
“Drugs don’t work in patients who don’t take them.”
–C. Everett Koop, M.D.
While it would be hard to imagine accountable care organizations being able to get the data they need to manage care without electronic health records, and EHRs are critical as payment has evolved to emphasize the outcomes of treatment, one area remains the holy grail of disease management: how to get patients to take the medications that are prescribed.
Poor adherence to medications is a critical issue in the management of chronic disease. The causes for suboptimal adherence are numerous, including the cost of medications, patient-physician communication, patient education, motivation, and simple forgetfulness.
Approximately 1.5 billion prescriptions, at a cost of more than $250 billion, are dispensed each year in the United States. A large body of evidence supports the use of these medications. For patients with diabetes, for instance, correct medication use can lower blood sugar, blood pressure, and cholesterol, and by so doing, decrease morbidity and mortality from both microvascular and macrovascular disease.
The act of taking medications is influenced by many factors, and all of these factors come together at a point in time when patients are not directly engaged with the health care system. It is at that moment that patients remember and decide whether to take their medications.
Numerous studies show that individuals often do not take their medicines as prescribed. Adherence rates for medications for chronic disease show that patients on average take only about 50% of prescribed doses. For patients with diabetes, the average adherence rate is about 70%, with rates ranging in different studies from 31% to 87%.
When patients do not take their medications correctly, there can be severe consequences. Poor medication adherence can lead to poorer clinical outcomes, including increased hospitalizations. One large dataset of more than 56,000 individuals with type 2 diabetes covered by employer-sponsored health insurance showed that increased adherence to medications significantly reduced hospitalizations and emergency department visits. When adherence rates increased, the hospitalization rate fell 23%, and the rate of emergency department visits decreased 46%, resulting in significant cost savings for the health system.1
In response to this issue, many strategies have emerged. We now regularly get correspondence from insurance companies alerting us to nonadherence of individual patients. This information tends to be of little benefit, because the information is received long after the decision to take or not take the medication is made. Our response in the office to our patients is generally to remind them to take their medications, which is not much different from the discussion we have with them without that information.
Recently, a new set of apps for smartphones and tablets has emerged to help patients organize their approach to taking medications. Examples of some of these apps include Care4Today, Dosecast, Medisafe, MedSimple, MyMedREc, MyMeds, and OnTimeRx. Most of these apps allow a patient to put in their medication schedule and are organized to provide reminders when it is time to take medications.
The problem with reminders, of course, is that they don’t always happen at a time when it is convenient for a person to take their medications. For example, if your app reminds you to take your medicines at 9 p.m. each night, and you are at the movies on a Saturday night, you may extinguish the reminder and not remember to take the medications when you get home.
Many of the apps also track adherence rates so that patients can see how well they are doing in taking their medications. The results are often startling to patients, and it is hoped that such information would encourage more effort in taking medications.
One problem with many of the apps currently available is that they essentially function as sophisticated alarm clocks. They do not get at some of the fundamental reasons that people do not take their medications, which would require more behavioral input.
In fact, a recent article in the American Journal of Preventive Medicine looked at 166 medication adherence apps and concluded that current apps contained little in the way of evidence-based behavioral change techniques that have been shown to help change behavior. In fact, only about one-third of apps contained any feedback on behavior at all.2
While adherence apps still have a way to go, they can be helpful, and many contain interesting, novel features. Some allow the patient to input the name of a medication by scanning the name from the medication’s pill bottle. Some have the ability not only to remind a patient to take a medication, but also to text that patient’s caregiver (or parent, in the case of a teenager) if the medication is not taken.
While not perfect, these adherence apps are worth learning more about. They may be helpful additions to our efforts to achieve the best outcomes for our patients by helping them to actually take the medications that we so carefully prescribe.
References
1. Encinosa, W.E.; Bernard, D.; Dor, A. Does prescription drug adherence reduce hospitalizations and costs? The case of diabetes. Advances in Health Economics and Health Services Research 22, pp. 151-73, 2010 (AHRQ Publication No. 11-R008).
2. Am J Prev Med. 2015 Nov 17. pii: S0749-3797(15)00637-6. doi: 10.1016/j.amepre.2015.09.034.
Dr. Notte is a family physician and clinical informaticist for Abington (Pa.) Memorial Hospital. He is a partner in EHR Practice Consultants, a firm that aids physicians in adopting electronic health records. Dr. Skolnik is associate director of the family medicine residency program at Abington Memorial Hospital and professor of family and community medicine at Temple University in Philadelphia.
Nevi, Melanoma, and the Ongoing Argument on Atypia
In a case study published online on March 2 in JAMA Dermatology, Geller et al examined the relationship between total nevi, atypical nevi, and melanoma thickness. The study included 566 patients with melanoma. They were administered written surveys and underwent skin examinations at academic centers in Michigan and California within 3 months of diagnosis, measuring current total nevus count and atypical nevus count in addition to cataloguing melanoma thickness, histologic subtype, patient age, sex, marital status, skin self-examination and physician skin examination tendency, other health care visits, and mode of melanoma discovery.
Many epidemiologic trends were noted, but in summary, most melanoma patients had 0 to 20 total nevi (66.4%) and no atypical nevi (73.3%), a trend most pronounced in older patients (≥60 years). In patients younger than 60 years, higher nevus count (>50) was associated with thinner melanomas (≤2.0 mm), and the presence of more than 5 atypical nevi was associated with thicker melanomas (>2.0 mm).
What’s the issue?Studies clarifying the overall clinical characteristics of patients with aggressive melanomas appear every month in reputable journals, touting that concurrent total nevus count is important; or nevus size is important; or atypia is important; or clinical stigmata, medical history, and family history are important. Who is correct? Is everyone correct? On the pathology arm of the argument, Rosendahl et al (J Am Acad Dermatol. 2015;73:507-512) highlighted the same dilemma in which clinicians do not agree on the histopathologic features of nevi that consistently put patients at risk for individual lesion or de novo melanoma.
For me, each clinic day involves performing many total-body skin examinations, and many of these patients have innumerable nevi and various scars from lesions removed over the years with “atypical mole,” “premelanoma,” “precancer,” and various other self-reported labels. Some lesions may have documented pathology reports, but many do not. Some reports refer to dysplasia as a gradient, some do not. Some reports include molecular testing or clinical markers to grade lesions, and each can vary between institutions and pathologists. On the macroscopic level, clinically atypical nevi do not have a widely agreed upon set of criteria or threshold for biopsy; some clinicians use dermoscopic markers, and others utilize some version of the ABCDE (a=asymmetry; b=border; c=color; d=diameter; e=evolving) features.
The Geller et al study supports that these melanoma patients did not necessarily have more total nevi, and younger patients with aggressive melanoma may have a tendency toward more clinically atypical nevi. Although the study establishes what those institutions and clinicians determined to be atypical, I’m not sure that this is something that most clinicians widely agree upon. Additionally, these features were not paired with histopathologic dysplasia because the lesions were not biopsied.
What I find in conversation with colleagues is that some agree with what Geller et al defined as atypical, but some clinicians do not even refer to nevi as clinically atypical in a medical record unless they have pathology evidence of atypia (or the term their pathologist may use), which may be to avoid controversy regarding legal implications of atypia or “open-note” misunderstanding that the patient may have about this term, likening it to Papanicolaou test premalignancy verbiage.
I am not aware of one dermatologist or dermatopathologist who does not find this quandary to be frustrating. How do any of us really know which patients to follow more often for melanoma surveillance? How does your practice or institution report atypia in the clinical and histopathologic setting, and what do you find are the most important markers for development of melanoma?