User login
Cancer drugs could treat vascular disorder

Photo by Aaron Logan
Two research teams have found evidence to suggest that mutations in PIK3CA, a gene linked to cancer, may drive venous malformations (VMs) in some patients.
Both groups of researchers showed that PIK3CA mutations give rise to VMs in mice, and PIK3CA mutations are present in humans with VMs.
Subsequent experiments with the mice suggested that PIK3CA inhibitors could be used to treat VMs.
Both groups reported their findings in Science Translational Medicine.
Pau Castel, of Memorial Sloan Kettering Cancer Center in New York, New York, and his colleagues were originally studying the role of PIK3CA in uterine cancer when they noticed that mice harboring PIK3CA mutations developed defective blood vessels that closely resembled VMs.
Sandra Castillo, PhD, of University College London in the UK, and her colleagues generated mice with PIK3CA-activating mutations that also mimicked the human disease, including during mouse embryonic development.
Both teams found the mutations spurred uncontrolled growth of endothelial cells, which formed abnormal clusters and faulty blood vessels.
To verify their mouse models, the researchers analyzed samples from patients with VMs. Dr Castillo and her colleagues looked at samples from 13 children, while Castel and his colleagues evaluated samples from 32 patients (both adults and children).
Dr Castillo and her colleagues found PIK3CA mutations in 25% of patients, and Castel and his colleagues found mutations in PIK3CA and related genes of the PI3K/AKT pathway in about 30% of patients.
Both groups of researchers then tested PI3K inhibitors in their mouse models and found these drugs could stunt blood vessel overgrowth.
“Rapamycin is a drug that blocks a signaling process that happens downstream of PIK3CA, so it stops one of PIK3CA’s effects but does not block it at the source,” Dr Castillo said. “When we gave rapamycin to the mice, it showed clinical benefit, but, in patients, it can have serious side effects and compromise the immune system.”
“Our colleagues at MSK [Memorial Sloan Kettering] then tested drugs on the mice that directly inhibit PIK3CA, developed to treat cancer. These drugs worked well and significantly reduced the size of the malformations, not only when given through the bloodstream but also when applied directly to the skin as a cream.” ![]()
Dual inhibitor shows early promise for DLBCL

The small-molecule inhibitor CUDC-907 can provide disease control in patients with relapsed or refractory lymphoma and multiple myeloma (MM), according to researchers.
In a phase 1 trial, CUDC-907 produced responses in a small number of patients with diffuse large B-cell lymphoma (DLBCL).
And more than half of patients had stable disease while on CUDC-907, including those with MM, DLBCL, Hodgkin lymphoma (HL), and other lymphomas.
However, a majority of patients in this trial—84%—discontinued treatment due to confirmed progressive disease or signs of progression.
These results were published in The Lancet. The trial was sponsored by Curis, Inc., the company developing CUDC-907, and the Leukemia and Lymphoma Society.
“The data from the phase 1 monotherapy trial for CUDC-907, especially in heavily pretreated patients with relapsed/refractory DLBCL are very encouraging, and we look forward to data emerging from the current phase 2 trial in patients with MYC-altered DLBCL,” said study author Anas Younes, MD, of the Memorial Sloan Kettering Cancer Center in New York, New York.
CUDC-907 is an oral, dual inhibitor of class I and II histone deacetylases (HDACs), as well as class I PI3K enzymes. Specifically, CUDC-907 is designed to inhibit HDACs 1, 2, 3, 6, and 10 and PI3K-alpha, delta, and beta isoforms.
Between Jan 23, 2013, and July 27, 2015, the phase 1 trial of CUDC-907 enrolled 44 patients who were refractory to or had relapsed after 2 or more previous regimens. The patients’ median age was 63 (range, 22-83), and they had received a median of 5 prior treatments (range, 2-10).
Four patients had MM, 12 had HL, and 12 had DLBCL. The remaining 16 patients had other types of lymphoma, including lymphoplasmacytic lymphoma (n=3), small lymphocytic lymphoma (n=3), mantle cell lymphoma (n=3), follicular lymphoma (n=2), T-cell lymphoma (n=2), marginal zone lymphoma (n=1), Burkitt lymphoma (n=1), and gray zone lymphoma (n=1).
Treatment
CUDC-907 was given in a standard 3 + 3 dose-escalation design at 4 different dosing schedules—once daily, twice weekly, 3 times weekly, and daily for 5 days followed by a 2-day break (5/2)—in 21-day cycles.
Patients continued to receive CUDC-907 until disease progression or other treatment discontinuation criteria were met. The primary objective was to determine the maximum tolerated dose (MTD) and recommended phase 2 dose.
Ten patients were sequentially assigned to CUDC-907 once-daily (MTD 60 mg), 12 to twice-weekly (MTD 150 mg), 15 to 3-times-weekly (MTD 150 mg), and 7 to the 5/2 dosing schedule (MTD 60 mg).
Safety
Four dose-limiting toxicities (DLTs) occurred in 3 of 40 DLT-evaluable patients. The DLTs were diarrhea and hyperglycemia in 1 patient on 60 mg once daily, hyperglycemia in 1 patient on 150 mg twice weekly, and diarrhea in 1 patient on 150 mg 3 times weekly. There were no DLTs in patients on the 5/2 schedule.
The incidence of grade 3 or higher adverse events (AEs) was 43% (19/44). The most common of these AEs were thrombocytopenia (20%, n=9), neutropenia (7%, n=3), and hyperglycemia (7%, n=3).
Twenty-five percent of patients (11/44) had serious AEs. Three of these events were considered treatment-related. They were epistaxis and the DLTs of diarrhea and hyperglycemia.
AEs led to dose reductions in 6 patients (14%) and treatment discontinuation in 7 patients (16%).
Efficacy
Thirty-seven patients were evaluable for response, and 5 of these patients responded (14%). All responses—2 complete and 3 partial responses—occurred in patients with DLBCL.
Twenty-one of the response-evaluable patients (57%) had stable disease. This included 1 patient with DLBCL, 2 with MM, 8 with HL, and 10 with the “other” types of lymphoma.
The remaining 11 patients progressed (30%)—3 with DLBCL, 2 with MM, 2 with HL, and 4 with other lymphomas.
Thirty-seven patients (84%) discontinued CUDC-907 because of progressive disease or clinical signs of progressive disease at the data cutoff.
Based on the clinical activity of CUDC-907 in patients with relapsed/refractory DLBCL, particularly those with MYC alterations, Curis has initiated a phase 2 trial of the drug in these patients. The recommended phase 2 dose is 60 mg on the 5/2 dosing schedule. ![]()
Macaque-to-human transmission of malaria

Photo by Sakurai Midori
The parasite responsible for a form of malaria now spreading from macaques to humans in South Asia could evolve to infect humans more efficiently, according to a study published in Nature Communications.
Researchers identified a sugar variant on the surface of human red blood cells (RBCs) that currently limits the ability of the parasite Plasmodium knowlesi to invade.
But the team also found the parasite can evolve to get around this barrier and pass into the human population in a more virulent form.
“With increasing concern about the spread of P knowlesi into human populations, it is great to be able to gain insight into what the molecular stumbling blocks are for P knowlesi infection of humans and how the parasite can potentially overcome them,” said study author Selasi Dankwa, PhD, of Harvard T.H. Chan School of Public Health in Boston, Massachusetts.
The macaque malaria parasite P knowlesi has emerged as a major source of human infections in Southeast Asia. While most human infections are mild, increasing numbers of severe infections are being reported, leading to concerns that the parasite is adapting to infect humans more efficiently.
With this in mind, Dr Dankwa and her colleagues decided to explore the parasite’s ability to invade and adapt.
The team introduced the macaque sugar variant onto the human RBC surface and demonstrated that the parasite normally dependent on the macaque variant for invasion was unable to use the human version.
Specifically, macaques synthesize the sialic acid variant N-glycolylneuraminic acid (Neu5Gc), but humans lack Neu5Gc because of an Alu-mediated exon deletion in the gene encoding CMAH, which converts N-acetylneuraminic acid (Neu5Ac) to Neu5Gc.
So the absence of Neu5Gc on human RBCs limits P knowlesi invasion, but the researchers found that parasites can evolve to invade human RBCs via sialic acid-independent pathways.
Following prolonged adaptation to growth on human RBCs, P knowlesi invaded human RBCs independently of Neu5Gc. This occurred via duplication of the region containing the sialic acid-independent gene PkDBPα and complete deletion of the sialic acid-dependent gene PkDBPγ.
Based on these findings, the researchers are calling for continued monitoring of the P knowlesi parasite to ensure that it has not switched to using a sialic acid-independent pathway to invade human RBCs. ![]()
A Perfect Storm: Interventions – Closing the survival gap
Editor’s Note: This is the fourth installment of a five-part monthly series that will discuss the biologic, genomic, and health system factors that contribute to the racial survival disparity in breast cancer. The series was adapted from an article that originally appeared in CA: A Cancer Journal for Clinicians,1 a journal of the American Cancer Society. Eliminating racial disparities in cancer mortality through effective interventions has become an increasingly important imperative of federal, state, and community health care programs. This month’s column reviews interventions to close this survival gap.
Insurance
It has been posited that interventions aimed at providing insurance coverage to minority patients will be able to reduce racial health care disparities.2 Studies have indicated that women without insurance present with more-advanced disease,3,4 and are more likely to receive nonstandard treatment.5 However, outside of cancer care, a large study of Medicaid expansion in Oregon demonstrated that Medicaid coverage alone generated no significant improvement in measured physical health outcomes in the first 2 years.6 Thus, coverage alone does not ensure that patients will be able to navigate the health care system and that quality care will be provided.
In breast cancer, Hoffman et al.7 evaluated the effect of race and health insurance on diagnostic time, which was defined as the number of days from suspicious finding to diagnostic resolution (either no evidence of malignancy on diagnostic mammogram or definitive diagnosis by biopsy) in a large, urban setting. The authors’ hypothesis was that every insured patient would receive the same timely diagnosis as any other patient with equivalent insurance, regardless of race or ethnicity. The study found that non-Hispanic whites with government insurance had significantly shorter diagnostic times than did non-Hispanic African Americans with government insurance: The average diagnostic times were 12 and 39 days, respectively. In addition, privately insured non-Hispanic whites also had significantly shorter diagnostic times than did privately insured non-Hispanic African Americans (16 vs. 27 days). In addition, Short et al.8 demonstrated that when the health plan status was held constant in a retrospective study of 476 white patients and 99 African American patients with newly diagnosed breast cancer, African American patients had a higher mortality rate (8.1% vs. 3.6%) and were diagnosed at a later stage. Accordingly, interventions must go beyond just providing health insurance to minorities in order to have a significant impact on the mortality gap.
Patient education and physician communication

An underlying cause frequently cited for the delayed diagnosis and treatment of African American patients with breast cancer is a lack of patient education and physician communication. These elements are essential components of quality care. In a qualitative study of low-income, ethnically diverse women older than 40 years, Allen et al.9 identified salient themes differentiating women who received timely follow-up from those who did not. For the women who delayed follow-up, prominent themes were dissatisfaction with the communication of results, disrespect on the part of providers and clinical staff, logistical barriers to accessing services, anxiety and fear about a possible cancer diagnosis, and a lack of information about breast cancer screening and symptoms.
In another study, Masi and Gehlert10 employed focus group interviews of African American adults to characterize their perceptions of breast cancer treatment. The analysis revealed a core set of themes, including mistrust of the medical establishment and concern about the effect of racism on treatment quality; the researchers concluded that “in the eyes of many study participants, the issues of trust, race, and quality of care were closely intertwined.”10 Thus, this knot that is created by underlying issues of trust can be untied only by interventions that address improved physician communication and patient education.
Janz et al.11 examined racial differences in the adequacy of information and support for women with breast cancer. The researchers used survey data from a population of 1,766 women diagnosed with nonmetastatic breast cancer and reported to the Los Angeles County Surveillance, Epidemiology, and End Results (SEER) registry. The study found that across treatment- and survivorship-related issues, African American women desired more information than white women did. One of the explanations for the unmet information needs posited by the authors is a failure to provide culturally appropriate information related to health issues. This breakdown in patient education and communication was demonstrated by Hawley et al. to hold across providers and locations.12
Hawley et al.12 evaluated the association between minority patients’ knowledge of breast cancer treatment risks and benefits and provider characteristics and treatment locations. The provider characteristics included surgeon-level independent variables, such as breast cancer procedure volume and demographics (years in practice and sex). The treatment location variable was categorized into one of three groups: National Cancer Institute–designated cancer center, American College of Surgeons cancer program, or no specific cancer program. Provider characteristics and treatment locations are factors previously identified as being associated with high-quality care.
The study employed a multivariable regression to identify associations between patient, surgeon, and treatment-setting factors and accurate knowledge of the survival benefit and recurrence risk related to mastectomy and breast-conserving surgery with radiation. The authors found that minority women were significantly less likely to have adequate knowledge and more likely to be uncertain about recurrence risk than were white patients. In the multivariate logistic regression model, neither provider characteristics nor treatment setting attenuated observed racial disparities in knowledge. Quality health care depends on the ability to make an informed treatment decision. As the authors concluded, this study underscores the need for providers to communicate information effectively to all patients, and effective communication relies on the cultural competency of providers.13 Without effective, culturally competent communication, there are treatment delays and omissions that result in poor-quality cancer care. Currently, the research has established that these communication deficits are found across providers and treatment center types.
Patient Navigation
Patient navigation has been championed as a method of improving care in breast cancer by enhancing patient communication and education, and removing barriers to timely care. Patient navigation empowers patients to become knowledgeable about their own health and supports them through the course of care.14 Patient navigation programs have been developed to address the patient communication breakdowns and underuse and misuse of treatment among vulnerable populations, which were detailed earlier in this series and are thought to contribute to the racial mortality gap.15
A benefit of patient navigation has been suggested in studies evaluating the time to diagnosis and follow-up from an abnormal screening. Markossian et al.16 evaluated the efficacy of a Chicago-based cancer patient navigation program developed to reduce the time from abnormal screening to definitive diagnostic testing. The majority of patients in this study were Hispanic (66%) and African American (32%). Compared with controls without navigation, the breast navigation group had a shorter time to diagnostic resolution. Hoffman et al.17 evaluated patient navigation in the District of Columbia to determine its ability to reduce the breast cancer diagnostic time (number of days from abnormal screening to a definitive diagnosis). African American women comprised 48% of the study population. The investigators found that women in the navigation group reached their diagnostic resolution significantly faster than did other women. Among women with breast cancer, there was a nearly fourfold reduction in time to diagnostic resolution for women in the navigation group versus women without a navigator.

In a national multicenter study, Ko et al.14 were the first to evaluate whether patient navigation can improve the quality of breast cancer care. The authors hypothesized that breast cancer patients assigned a navigator would be more likely to receive recommended standard treatment than were those without a navigator. Three separate quality measures of breast cancer care, including initiation of antiestrogen therapy, radiation therapy, and chemotherapy, were evaluated. Study participants were racially and ethnically diverse, with a plurality being African American (37.5%). The study produced mixed results: Patients in the navigation group had a statistically higher likelihood of receiving antiestrogen therapy than were non–navigated controls, but navigation patients eligible for radiation therapy were no more likely to receive it than were controls. The initiation of chemotherapy could not be accurately assessed because of a limited sample size. The study concluded that navigation alone does not remove all of the barriers to quality care for breast cancer patients, and barriers are diverse and potentially specific to the modality of treatment.
A study by Tejeda et al.18 used a systematic framework to characterize barriers faced by minority patients with breast and cervical cancer. The investigators categorized barriers as intrapersonal (defined by characteristics of the individual, such as knowledge, belief, attitudes, and transportation and financial barriers), interpersonal (defined by processes that involve other people, such as social support systems, child care, and employment issues), or institutional (defined by characteristics and policies of organizations). The authors found that although navigators were able to easily resolve intrapersonal barriers, ongoing navigation was needed to address institutional barriers. Thus, patient navigation in a vacuum does not work, and it is only in examining the entire health care system that changes can be implemented to eliminate barriers to quality care and close the racial mortality chasm.
System Change
To this effect, Clarke et al.19 performed a review of the disparities intervention literature to understand which interventions are being evaluated to improve minority health. The authors found that the majority of such interventions are focused on changing the patient rather than the system that serves her, with the most common strategy being education and training (37% of strategies studied). Interventions aimed at health care system improvements were surprisingly few, with the responsibility for change resting with the patient rather than the care delivery system. Interventions incorporating community involvement were also severely lacking and reflected only 6.5% of the reviewed intervention tactics. The majority of interventions failed to involve major stakeholders, including providers, health care institutions, community organizers, and policy makers, and accordingly, were unlikely to succeed in creating meaningful change.
In breast cancer, there have been examples of successful system-based approaches to reducing the racial mortality disparity. At New York area hospitals, Bickell et al.20 implemented a tracking and feedback registry to close the referral loop between surgeons and oncologists to decrease the underuse of valuable adjuvant treatments.
The intervention targeted important quality issues in both communication (the breakdown in dialogue among providers of different specialties and between providers and patients) and the underuse of adjuvant treatment in minorities. The approach was designed to address failures in the health care system through the involvement of leadership from pathology, surgery, and oncology. The intervention also incorporated technology, with tracking software prompting contact with patients who had failed to follow up. Among African American and Hispanic women, there were statistically significant decreases in the underuse of radiotherapy (23% before the intervention vs. 10% after the intervention), chemotherapy (26% vs. 6%), and hormonal therapy (27% vs. 11%). After the intervention, minority race was no longer a risk factor for low rates of oncology consultation or underuse of adjuvant therapy. Interestingly, four of the six hospitals involved in this study had a patient navigation system in place; however, as discussed, the navigation system alone was not enough to address the system failures that led to disparities in care.
Ansell et al.21 also described a system-based approach to reducing the breast cancer mortality disparity in Chicago. The Metropolitan Chicago Breast Cancer Task Force comprised 102 individuals and 74 Chicago area organizations to address the growing disparity in breast cancer mortality between African American and white patients. The task force identified a number of themes underlying the disparity gap, including a need for breast cancer education and outreach programs for African American women, a broken mammography process leading to quality differences between African American and white patients, and a number of barriers to diagnosis and treatment, including fear, a lack of primary care, the burden of insurance copays/deductibles, and the noncompletion of treatment for social and economic reasons. After identifying these underlying causes, the task force proposed that addressing one aspect of the health care system would not correct the problem, but rather quality improvement initiatives would have to occur across the continuum of care for breast cancer.
In Delaware, such a broad system-based intervention was implemented to eliminate health disparities in colorectal cancer.22 Delaware created a comprehensive statewide colorectal screening and treatment program, combining many of the interventions discussed previously, including insurance coverage, patient education and communication, and patient navigation, to address the entire health care system and its treatment of African Americans with colorectal cancer. The state also partnered with underserved community organizations to tailor programs locally and create targeted marketing campaigns.
The results of this system-based approach were impressive, with screening rates among African American increasing from 48% to 74% and equaling the rate among whites. In addition, among African American patients, the percentage diagnosed at advanced and regional stages declined from 79% to 40%, and the percentage diagnosed at a local stage increased from 16% to 50%. Most importantly, the mortality rate declined by 42% for African Americans, resulting in a rate almost equal to that among whites. Significantly, this program was also found to be economically viable, because the cost savings from reduced cancer incidence and the stage shift to cancers requiring less-aggressive treatment offset the program cost. As the authors concluded, this model of a comprehensive, system-wide approach to the racial mortality difference would lend itself to other cancers, and more research is needed to assess and build such an approach to breast cancer.
As discussed in the aforementioned studies, multifaceted interventions that address all stakeholders are needed to close the racial survival disparity in breast cancer. In the final installment of this series, we will address how the changing care models ushered in by the Patient Protection and Affordable Care Act have the potential to advance this agenda of creating an intervention that works across the breast cancer care continuum to reduce disparities.
Other installments of this column can be found in the Related Content box.
1. Daly B, Olopade OI. A perfect storm: How tumor biology, genomics, and health care delivery patterns collide to create a racial survival disparity in breast cancer and proposed interventions for change. CA Cancer J Clin. 2015 May-Jun;65(3):221-38.
2. Lillie-Blanton M, Hoffman C. The role of health insurance coverage in reducing racial/ethnic disparities in health care. Health Aff (Millwood). 2005 Mar-Apr;24(2):398-408.
3. Ayanian JZ, Kohler BA, Abe T, Epstein AM. The relation between health insurance coverage and clinical outcomes among women with breast cancer. N Engl J Med. 1993 Jul 29;329(5):326-31.
4. Coburn N, Fulton J, Pearlman DN, Law C, DiPaolo B, Cady B. Treatment variation by insurance status for breast cancer patients. Breast J. 2008 Mar-Apr;14(2):128-34.
5. Voti L, Richardson LC, Reis I, Fleming LE, Mackinnon J, Coebergh JW. The effect of race/ethnicity and insurance in the administration of standard therapy for local breast cancer in Florida. Breast Cancer Res Treat. 2006 Jan;95(1):89-95.
6. Baicker K, Taubman SL, Allen HL, et al. The Oregon experiment – effects of Medicaid on clinical outcomes. N Engl J Med. 2013 May 2;368(18):1713-22.
7. Hoffman HJ, LaVerda NL, Levine PH, et al. Having health insurance does not eliminate race/ethnicity-associated delays in breast cancer diagnosis in the District of Columbia. Cancer. 2011 Aug 15;117(16):3824-32.
8. Short LJ, Fisher MD, Wahl PM, et al. Disparities in medical care among commercially insured patients with newly diagnosed breast cancer: opportunities for intervention. Cancer. 2010 Jan 1;116(1):193-202.
9. Allen JD, Shelton RC, Harden E, Goldman RE. Follow-up of abnormal screening mammograms among low-income ethnically diverse women: findings from a qualitative study. Patient Educ Couns. 2008 Aug;72(2):283-92.
10. Masi CM, Gehlert S. Perceptions of breast cancer treatment among African-American women and men: implications for interventions. J Gen Intern Med. 2009 Mar;24(3):408-14.
11. Janz NK, Mujahid MS, Hawley ST, Griggs JJ, Hamilton AS, Katz SJ. Racial/ethnic differences in adequacy of information and support for women with breast cancer. Cancer. 2008 Sep 1;113(5):1058-67.
12. Hawley ST, Fagerlin A, Janz NK, Katz SJ. Racial/ethnic disparities in knowledge about risks and benefits of breast cancer treatment: does it matter where you go? Health Serv Res. 2008 Aug;43(4):1366-87.
13. Lannin DR, Mathews HF, Mitchell J, Swanson MS. Impacting cultural attitudes in African-American women to decrease breast cancer mortality. Am J Surg. 2002 Nov;184(5):418-23.
14. Ko NY, Darnell JS, Calhoun E, et al. Can patient navigation improve receipt of recommended breast cancer care? Evidence from the National Patient Navigation Research Program. J Clin Oncol. 2014 Sep 1;32(25):2758-64.
15. Vargas RB, Ryan GW, Jackson CA, Rodriguez R, Freeman HP. Characteristics of the original patient navigation programs to reduce disparities in the diagnosis and treatment of breast cancer. Cancer. 2008 Jul 15;113(2):426-33.
16. Markossian TW, Darnell JS, Calhoun EA. Follow-up and timeliness after an abnormal cancer screening among underserved, urban women in a patient navigation program. Cancer Epidemiol Biomarkers Prev. 2012 Oct;21(10):1691-700.
17. Hoffman HJ, LaVerda NL, Young HA, et al. Patient navigation significantly reduces delays in breast cancer diagnosis in the District of Columbia. Cancer Epidemiol Biomarkers Prev. 2012 Oct;21(10):1655-63.
18. Tejeda S, Darnell JS, Cho YI, Stolley MR, Markossian TW, Calhoun EA. Patient barriers to follow-up care for breast and cervical cancer abnormalities. J Womens Health (Larchmt). 2013 Jun;22(6):507-17.
19. Clarke AR, Goddu AP, Nocon RS, et al. Thirty years of disparities intervention research: what are we doing to close racial and ethnic gaps in health care? Med Care. 2013 Nov;51(11):1020-26.
20. Bickell NA, Shastri K, Fei K, et al. A tracking and feedback registry to reduce racial disparities in breast cancer care. J Natl Cancer Inst. 2008 Dec 3;100(23):1717-23.
21. Ansell D, Grabler P, Whitman S, et al. A community effort to reduce the black/white breast cancer mortality disparity in Chicago. Cancer Causes Control. 2009 Nov;20(9):1681-88.
22. Grubbs SS, Polite BN, Carney J, Jr., et al. Eliminating racial disparities in colorectal cancer in the real world: it took a village. J Clin Oncol. 2013 Jun 1;31(16):1928-30.


Olufunmilayo Olopade, MD, FACP, OON, is the Walter L. Palmer Distinguished Service Professor of Medicine and Human Genetics, and director, Center for Global Health at the University of Chicago. She is adopting emerging high throughput genomic and informatics strategies to identify genetic and nongenetic risk factors for breast cancer in order to implement precision health care in diverse populations. This innovative approach has the potential to improve the quality of care and reduce costs while saving more lives.
Disclosures: Dr. Olopade serves on the Medical Advisory Board for CancerIQ. Dr. Daly serves as a director of Quadrant Holdings Corporation and receives compensation from this entity. Frontline Medical Communications is a subsidiary of Quadrant Holdings Corporation.
Published in conjunction with Susan G. Komen®.
Editor’s Note: This is the fourth installment of a five-part monthly series that will discuss the biologic, genomic, and health system factors that contribute to the racial survival disparity in breast cancer. The series was adapted from an article that originally appeared in CA: A Cancer Journal for Clinicians,1 a journal of the American Cancer Society. Eliminating racial disparities in cancer mortality through effective interventions has become an increasingly important imperative of federal, state, and community health care programs. This month’s column reviews interventions to close this survival gap.
Insurance
It has been posited that interventions aimed at providing insurance coverage to minority patients will be able to reduce racial health care disparities.2 Studies have indicated that women without insurance present with more-advanced disease,3,4 and are more likely to receive nonstandard treatment.5 However, outside of cancer care, a large study of Medicaid expansion in Oregon demonstrated that Medicaid coverage alone generated no significant improvement in measured physical health outcomes in the first 2 years.6 Thus, coverage alone does not ensure that patients will be able to navigate the health care system and that quality care will be provided.
In breast cancer, Hoffman et al.7 evaluated the effect of race and health insurance on diagnostic time, which was defined as the number of days from suspicious finding to diagnostic resolution (either no evidence of malignancy on diagnostic mammogram or definitive diagnosis by biopsy) in a large, urban setting. The authors’ hypothesis was that every insured patient would receive the same timely diagnosis as any other patient with equivalent insurance, regardless of race or ethnicity. The study found that non-Hispanic whites with government insurance had significantly shorter diagnostic times than did non-Hispanic African Americans with government insurance: The average diagnostic times were 12 and 39 days, respectively. In addition, privately insured non-Hispanic whites also had significantly shorter diagnostic times than did privately insured non-Hispanic African Americans (16 vs. 27 days). In addition, Short et al.8 demonstrated that when the health plan status was held constant in a retrospective study of 476 white patients and 99 African American patients with newly diagnosed breast cancer, African American patients had a higher mortality rate (8.1% vs. 3.6%) and were diagnosed at a later stage. Accordingly, interventions must go beyond just providing health insurance to minorities in order to have a significant impact on the mortality gap.
Patient education and physician communication
An underlying cause frequently cited for the delayed diagnosis and treatment of African American patients with breast cancer is a lack of patient education and physician communication. These elements are essential components of quality care. In a qualitative study of low-income, ethnically diverse women older than 40 years, Allen et al.9 identified salient themes differentiating women who received timely follow-up from those who did not. For the women who delayed follow-up, prominent themes were dissatisfaction with the communication of results, disrespect on the part of providers and clinical staff, logistical barriers to accessing services, anxiety and fear about a possible cancer diagnosis, and a lack of information about breast cancer screening and symptoms.
In another study, Masi and Gehlert10 employed focus group interviews of African American adults to characterize their perceptions of breast cancer treatment. The analysis revealed a core set of themes, including mistrust of the medical establishment and concern about the effect of racism on treatment quality; the researchers concluded that “in the eyes of many study participants, the issues of trust, race, and quality of care were closely intertwined.”10 Thus, this knot that is created by underlying issues of trust can be untied only by interventions that address improved physician communication and patient education.
Janz et al.11 examined racial differences in the adequacy of information and support for women with breast cancer. The researchers used survey data from a population of 1,766 women diagnosed with nonmetastatic breast cancer and reported to the Los Angeles County Surveillance, Epidemiology, and End Results (SEER) registry. The study found that across treatment- and survivorship-related issues, African American women desired more information than white women did. One of the explanations for the unmet information needs posited by the authors is a failure to provide culturally appropriate information related to health issues. This breakdown in patient education and communication was demonstrated by Hawley et al. to hold across providers and locations.12
Hawley et al.12 evaluated the association between minority patients’ knowledge of breast cancer treatment risks and benefits and provider characteristics and treatment locations. The provider characteristics included surgeon-level independent variables, such as breast cancer procedure volume and demographics (years in practice and sex). The treatment location variable was categorized into one of three groups: National Cancer Institute–designated cancer center, American College of Surgeons cancer program, or no specific cancer program. Provider characteristics and treatment locations are factors previously identified as being associated with high-quality care.
The study employed a multivariable regression to identify associations between patient, surgeon, and treatment-setting factors and accurate knowledge of the survival benefit and recurrence risk related to mastectomy and breast-conserving surgery with radiation. The authors found that minority women were significantly less likely to have adequate knowledge and more likely to be uncertain about recurrence risk than were white patients. In the multivariate logistic regression model, neither provider characteristics nor treatment setting attenuated observed racial disparities in knowledge. Quality health care depends on the ability to make an informed treatment decision. As the authors concluded, this study underscores the need for providers to communicate information effectively to all patients, and effective communication relies on the cultural competency of providers.13 Without effective, culturally competent communication, there are treatment delays and omissions that result in poor-quality cancer care. Currently, the research has established that these communication deficits are found across providers and treatment center types.
Patient Navigation
Patient navigation has been championed as a method of improving care in breast cancer by enhancing patient communication and education, and removing barriers to timely care. Patient navigation empowers patients to become knowledgeable about their own health and supports them through the course of care.14 Patient navigation programs have been developed to address the patient communication breakdowns and underuse and misuse of treatment among vulnerable populations, which were detailed earlier in this series and are thought to contribute to the racial mortality gap.15
A benefit of patient navigation has been suggested in studies evaluating the time to diagnosis and follow-up from an abnormal screening. Markossian et al.16 evaluated the efficacy of a Chicago-based cancer patient navigation program developed to reduce the time from abnormal screening to definitive diagnostic testing. The majority of patients in this study were Hispanic (66%) and African American (32%). Compared with controls without navigation, the breast navigation group had a shorter time to diagnostic resolution. Hoffman et al.17 evaluated patient navigation in the District of Columbia to determine its ability to reduce the breast cancer diagnostic time (number of days from abnormal screening to a definitive diagnosis). African American women comprised 48% of the study population. The investigators found that women in the navigation group reached their diagnostic resolution significantly faster than did other women. Among women with breast cancer, there was a nearly fourfold reduction in time to diagnostic resolution for women in the navigation group versus women without a navigator.
In a national multicenter study, Ko et al.14 were the first to evaluate whether patient navigation can improve the quality of breast cancer care. The authors hypothesized that breast cancer patients assigned a navigator would be more likely to receive recommended standard treatment than were those without a navigator. Three separate quality measures of breast cancer care, including initiation of antiestrogen therapy, radiation therapy, and chemotherapy, were evaluated. Study participants were racially and ethnically diverse, with a plurality being African American (37.5%). The study produced mixed results: Patients in the navigation group had a statistically higher likelihood of receiving antiestrogen therapy than were non–navigated controls, but navigation patients eligible for radiation therapy were no more likely to receive it than were controls. The initiation of chemotherapy could not be accurately assessed because of a limited sample size. The study concluded that navigation alone does not remove all of the barriers to quality care for breast cancer patients, and barriers are diverse and potentially specific to the modality of treatment.
A study by Tejeda et al.18 used a systematic framework to characterize barriers faced by minority patients with breast and cervical cancer. The investigators categorized barriers as intrapersonal (defined by characteristics of the individual, such as knowledge, belief, attitudes, and transportation and financial barriers), interpersonal (defined by processes that involve other people, such as social support systems, child care, and employment issues), or institutional (defined by characteristics and policies of organizations). The authors found that although navigators were able to easily resolve intrapersonal barriers, ongoing navigation was needed to address institutional barriers. Thus, patient navigation in a vacuum does not work, and it is only in examining the entire health care system that changes can be implemented to eliminate barriers to quality care and close the racial mortality chasm.
System Change
To this effect, Clarke et al.19 performed a review of the disparities intervention literature to understand which interventions are being evaluated to improve minority health. The authors found that the majority of such interventions are focused on changing the patient rather than the system that serves her, with the most common strategy being education and training (37% of strategies studied). Interventions aimed at health care system improvements were surprisingly few, with the responsibility for change resting with the patient rather than the care delivery system. Interventions incorporating community involvement were also severely lacking and reflected only 6.5% of the reviewed intervention tactics. The majority of interventions failed to involve major stakeholders, including providers, health care institutions, community organizers, and policy makers, and accordingly, were unlikely to succeed in creating meaningful change.
In breast cancer, there have been examples of successful system-based approaches to reducing the racial mortality disparity. At New York area hospitals, Bickell et al.20 implemented a tracking and feedback registry to close the referral loop between surgeons and oncologists to decrease the underuse of valuable adjuvant treatments.
The intervention targeted important quality issues in both communication (the breakdown in dialogue among providers of different specialties and between providers and patients) and the underuse of adjuvant treatment in minorities. The approach was designed to address failures in the health care system through the involvement of leadership from pathology, surgery, and oncology. The intervention also incorporated technology, with tracking software prompting contact with patients who had failed to follow up. Among African American and Hispanic women, there were statistically significant decreases in the underuse of radiotherapy (23% before the intervention vs. 10% after the intervention), chemotherapy (26% vs. 6%), and hormonal therapy (27% vs. 11%). After the intervention, minority race was no longer a risk factor for low rates of oncology consultation or underuse of adjuvant therapy. Interestingly, four of the six hospitals involved in this study had a patient navigation system in place; however, as discussed, the navigation system alone was not enough to address the system failures that led to disparities in care.
Ansell et al.21 also described a system-based approach to reducing the breast cancer mortality disparity in Chicago. The Metropolitan Chicago Breast Cancer Task Force comprised 102 individuals and 74 Chicago area organizations to address the growing disparity in breast cancer mortality between African American and white patients. The task force identified a number of themes underlying the disparity gap, including a need for breast cancer education and outreach programs for African American women, a broken mammography process leading to quality differences between African American and white patients, and a number of barriers to diagnosis and treatment, including fear, a lack of primary care, the burden of insurance copays/deductibles, and the noncompletion of treatment for social and economic reasons. After identifying these underlying causes, the task force proposed that addressing one aspect of the health care system would not correct the problem, but rather quality improvement initiatives would have to occur across the continuum of care for breast cancer.
In Delaware, such a broad system-based intervention was implemented to eliminate health disparities in colorectal cancer.22 Delaware created a comprehensive statewide colorectal screening and treatment program, combining many of the interventions discussed previously, including insurance coverage, patient education and communication, and patient navigation, to address the entire health care system and its treatment of African Americans with colorectal cancer. The state also partnered with underserved community organizations to tailor programs locally and create targeted marketing campaigns.
The results of this system-based approach were impressive, with screening rates among African American increasing from 48% to 74% and equaling the rate among whites. In addition, among African American patients, the percentage diagnosed at advanced and regional stages declined from 79% to 40%, and the percentage diagnosed at a local stage increased from 16% to 50%. Most importantly, the mortality rate declined by 42% for African Americans, resulting in a rate almost equal to that among whites. Significantly, this program was also found to be economically viable, because the cost savings from reduced cancer incidence and the stage shift to cancers requiring less-aggressive treatment offset the program cost. As the authors concluded, this model of a comprehensive, system-wide approach to the racial mortality difference would lend itself to other cancers, and more research is needed to assess and build such an approach to breast cancer.
As discussed in the aforementioned studies, multifaceted interventions that address all stakeholders are needed to close the racial survival disparity in breast cancer. In the final installment of this series, we will address how the changing care models ushered in by the Patient Protection and Affordable Care Act have the potential to advance this agenda of creating an intervention that works across the breast cancer care continuum to reduce disparities.
Other installments of this column can be found in the Related Content box.
1. Daly B, Olopade OI. A perfect storm: How tumor biology, genomics, and health care delivery patterns collide to create a racial survival disparity in breast cancer and proposed interventions for change. CA Cancer J Clin. 2015 May-Jun;65(3):221-38.
2. Lillie-Blanton M, Hoffman C. The role of health insurance coverage in reducing racial/ethnic disparities in health care. Health Aff (Millwood). 2005 Mar-Apr;24(2):398-408.
3. Ayanian JZ, Kohler BA, Abe T, Epstein AM. The relation between health insurance coverage and clinical outcomes among women with breast cancer. N Engl J Med. 1993 Jul 29;329(5):326-31.
4. Coburn N, Fulton J, Pearlman DN, Law C, DiPaolo B, Cady B. Treatment variation by insurance status for breast cancer patients. Breast J. 2008 Mar-Apr;14(2):128-34.
5. Voti L, Richardson LC, Reis I, Fleming LE, Mackinnon J, Coebergh JW. The effect of race/ethnicity and insurance in the administration of standard therapy for local breast cancer in Florida. Breast Cancer Res Treat. 2006 Jan;95(1):89-95.
6. Baicker K, Taubman SL, Allen HL, et al. The Oregon experiment – effects of Medicaid on clinical outcomes. N Engl J Med. 2013 May 2;368(18):1713-22.
7. Hoffman HJ, LaVerda NL, Levine PH, et al. Having health insurance does not eliminate race/ethnicity-associated delays in breast cancer diagnosis in the District of Columbia. Cancer. 2011 Aug 15;117(16):3824-32.
8. Short LJ, Fisher MD, Wahl PM, et al. Disparities in medical care among commercially insured patients with newly diagnosed breast cancer: opportunities for intervention. Cancer. 2010 Jan 1;116(1):193-202.
9. Allen JD, Shelton RC, Harden E, Goldman RE. Follow-up of abnormal screening mammograms among low-income ethnically diverse women: findings from a qualitative study. Patient Educ Couns. 2008 Aug;72(2):283-92.
10. Masi CM, Gehlert S. Perceptions of breast cancer treatment among African-American women and men: implications for interventions. J Gen Intern Med. 2009 Mar;24(3):408-14.
11. Janz NK, Mujahid MS, Hawley ST, Griggs JJ, Hamilton AS, Katz SJ. Racial/ethnic differences in adequacy of information and support for women with breast cancer. Cancer. 2008 Sep 1;113(5):1058-67.
12. Hawley ST, Fagerlin A, Janz NK, Katz SJ. Racial/ethnic disparities in knowledge about risks and benefits of breast cancer treatment: does it matter where you go? Health Serv Res. 2008 Aug;43(4):1366-87.
13. Lannin DR, Mathews HF, Mitchell J, Swanson MS. Impacting cultural attitudes in African-American women to decrease breast cancer mortality. Am J Surg. 2002 Nov;184(5):418-23.
14. Ko NY, Darnell JS, Calhoun E, et al. Can patient navigation improve receipt of recommended breast cancer care? Evidence from the National Patient Navigation Research Program. J Clin Oncol. 2014 Sep 1;32(25):2758-64.
15. Vargas RB, Ryan GW, Jackson CA, Rodriguez R, Freeman HP. Characteristics of the original patient navigation programs to reduce disparities in the diagnosis and treatment of breast cancer. Cancer. 2008 Jul 15;113(2):426-33.
16. Markossian TW, Darnell JS, Calhoun EA. Follow-up and timeliness after an abnormal cancer screening among underserved, urban women in a patient navigation program. Cancer Epidemiol Biomarkers Prev. 2012 Oct;21(10):1691-700.
17. Hoffman HJ, LaVerda NL, Young HA, et al. Patient navigation significantly reduces delays in breast cancer diagnosis in the District of Columbia. Cancer Epidemiol Biomarkers Prev. 2012 Oct;21(10):1655-63.
18. Tejeda S, Darnell JS, Cho YI, Stolley MR, Markossian TW, Calhoun EA. Patient barriers to follow-up care for breast and cervical cancer abnormalities. J Womens Health (Larchmt). 2013 Jun;22(6):507-17.
19. Clarke AR, Goddu AP, Nocon RS, et al. Thirty years of disparities intervention research: what are we doing to close racial and ethnic gaps in health care? Med Care. 2013 Nov;51(11):1020-26.
20. Bickell NA, Shastri K, Fei K, et al. A tracking and feedback registry to reduce racial disparities in breast cancer care. J Natl Cancer Inst. 2008 Dec 3;100(23):1717-23.
21. Ansell D, Grabler P, Whitman S, et al. A community effort to reduce the black/white breast cancer mortality disparity in Chicago. Cancer Causes Control. 2009 Nov;20(9):1681-88.
22. Grubbs SS, Polite BN, Carney J, Jr., et al. Eliminating racial disparities in colorectal cancer in the real world: it took a village. J Clin Oncol. 2013 Jun 1;31(16):1928-30.
Olufunmilayo Olopade, MD, FACP, OON, is the Walter L. Palmer Distinguished Service Professor of Medicine and Human Genetics, and director, Center for Global Health at the University of Chicago. She is adopting emerging high throughput genomic and informatics strategies to identify genetic and nongenetic risk factors for breast cancer in order to implement precision health care in diverse populations. This innovative approach has the potential to improve the quality of care and reduce costs while saving more lives.
Disclosures: Dr. Olopade serves on the Medical Advisory Board for CancerIQ. Dr. Daly serves as a director of Quadrant Holdings Corporation and receives compensation from this entity. Frontline Medical Communications is a subsidiary of Quadrant Holdings Corporation.
Published in conjunction with Susan G. Komen®.

Goodbye measures of data quantity, hello data quality measures of MACRA
Practicing clinical medicine is increasingly challenging. Besides the onslaught of new clinical information, we have credentialing, accreditation, certification, team-based care, and patient satisfaction that contribute to the complexity of current medical practice. At the heart of many of these challenges is the issue of accountability. Never has our work product as physicians been under such intense scrutiny as it is today.
To demonstrate proof of the care we have provided, we have enlisted a host of administrators, assistants, abstractors, and other helpers to decipher our work and demonstrate its value to professional organizations, boards, hospitals, insurers, and the government. They comb through our charts, decipher our handwriting and dictations, guesstimate our intentions, and sometimes devalue our care because we have not adequately documented what we have done. To solve this accountability problem, our government and the payer community have promoted the electronic health record (EHR) as the “single source of truth” for the care we provide.
This effort received a huge boost in 2009 with the Health Information Technology for Economic and Clinical Health (HITECH) Act. HITECH authorized incentive payments through Medicare and Medicaid to health care providers that could demonstrate Meaningful Use (MU) of a certified EHR. This resulted in a boom in EHR purchases and installations.
By 2012, 71.8% of office-based physicians reported using some type of EHR system, up from 34.8% in 2007.1 In many respects this action was designed as a stimulus for the slow economy, but Congress also wanted some type of accountability that the money spent to subsidize EHR purchases was going to be well spent, and would hopefully have an impact on some of the serious health issues we face.
The initial stage of this MU program seemed to work out reasonably well. So, if a little is good, more must be better, right? Unfortunately, no. But, where did MU go wrong, and how is it being fixed? Contrary to popular belief, MU is not going away, it is being transformed. To help you navigate the tethered landscape of MU past and, more importantly, bring you up to speed on MU future (the Medicare Access and CHIP Reauthorization Act of 2015 [MACRA]) and your payment incentives in this data-centric world, we address MU transformation in this article.
Where Meaningful Use stage 2 went wrong
MU stage 2 turned out to significantly increase the documentation burden on health care professionals. In addition, one of the tragic unintended consequences was that all available EHR development resources by vendors went toward meeting MU data capture requirements rather than to improving the usability and efficiency of the EHRs. Neither result has been well received by health care professionals.
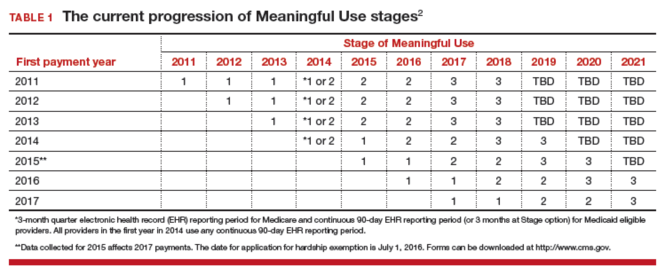
Stage 3 of MU is now in place. It is an attempt to simplify the requirements and focus on quality, safety, interoperability, and patient engagement. See “Meaningful Use stage 3 specifications”. The current progression of MU stages is depicted in TABLE 1.2
Meaningful Use stage 3 specifications
Objective 1: Protect patient health information. Protect electronic health information created or maintained by the Certified Electronic Health Record Technology (CEHRT) through the implementation of appropriate technical, administrative, and physical safeguards.
Objective 2: Electronic prescribing. Eligible providers (EPs) must generate and transmit permissible prescriptions electronically, and eligible hospitals must generate and transmit permissible discharge prescriptions electronically.
Objective 3: Clinical decision support. Implement clinical decision support interventions focused on improving performance on high-priority health conditions.
Objective 4: Computerized provider order entry. Use computerized provider order entry for medication, laboratory, and diagnostic imaging orders directly entered by any licensed health care professional, credentialed medical assistant, or a medical staff member credentialed and performing the equivalent duties of a credentialed medical assistant, who can enter orders into the medical record per state, local, and professional guidelines.
Objective 5: Patient electronic access to health information. The EP provides patients (or patient-authorized representatives) with timely electronic access to their health information and patient-specific education.
Objective 6: Coordination of care through patient engagement. Use the CEHRT to engage with patients or their authorized representatives about the patient's care.
Objective 7: Health information exchange. The EP provides a summary of care record when transitioning or referring their patient to another setting of care, receives or retrieves a summary of care record upon the receipt of a transition or referral or upon the first patient encounter with a new patient, and incorporates summary of care information from other providers into their EHR using the functions of CEHRT.
Objective 8: Public health and clinical data registry reporting. The EP is in active engagement with a public health agency or clinical data registry to submit electronic public health data in a meaningful way using certified EHR technology, except where prohibited, and in accordance with applicable law and practice.
Reference
1. Medicare and Medicaid Programs; Electronic Health Record Incentive Program-Stage 3. Federal Register website. https://www.federalregister.gov/articles/2015/03/30/2015-06685/medicare-and-medicaid-programs-electronic-health-record-incentive-program-stage-3#t-4. Accessed March 19, 2016.
Our new paradigm
Now that EHR implementation is fairly widespread, attention is focused on streamlining the reporting and documentation required for accountability, both from the data entry standpoint and the data analysis standpoint. Discrete data elements, entered by clinicians at the point of care, and downloaded directly from the EHR increasingly will be the way our patient care is assessed. Understanding this new paradigm is critical for both practice and professional viability.
Challenges in this new era
To understand the challenges ahead, we must first take a critical look at how physicians think about documentation, and what changes these models of documentation will have to undergo. Physicians are taught to think in complex models that we document as narratives or stories. While these models are composed of individual “elements” (patient age, due date, hemoglobin value, systolic blood pressure), the real information is in how these elements are related. Understanding a patient, a disease process, or a clinical workflow involves elements that must have context and relationships to be meaningful. Isolated hemoglobin or systolic blood pressure values tell us little, and may in fact obscure the forest for the trees. Physicians want to tell, and understand, the story.
However, an EHR is much more than a collection of narrative text documents. Entering data as discrete elements will allow each data element to be standardized, delegated, automated, analyzed, and monetized. In fact, these processes cannot be accomplished without the data being in this discrete form. While a common complaint about EHRs is that the “story” is hard to decipher, discrete elements are here to stay. Algorithms that can “read” a story and automatically populate these elements (known as natural language processing, or NLP) may someday allow us to go back to our dictations, but that day is frustratingly still far off.
Hello eCQMs
Up to now, physicians have relied on an army of abstractors, coders, billers, quality and safety helpers, and the like to read our notes and supply discrete data to the many clients who want to see accountability for our work. This process of course adds considerable cost to the health care system, and the data collected may not always supply accurate information. The gap between administrative data (gathered from the International Classificationof Diseases Ninth and Tenth revisions and Current Procedural Terminology [copyright American Medical Association] codes) and clinical reality is well documented.3–5
In an attempt to simplify this process, and to create a stronger connection to actual clinical data, the Centers for Medicare and Medicaid Services (CMS)6 is moving toward direct extraction of discrete data that have been entered by health care providers themselves.7 Using clinical data to report on quality metrics allows for improvement in risk adjustment as well as accuracy. Specific measures of this type have been designated eCQMs.
An eCQM is a format for a quality measure, utilizing data entered directly by health care professionals, and extracted directly from the EHR, without the need for additional personnel to review and abstract the chart. eCQMs rapidly are being phased into use for Medicare reimbursement; it is assumed that Medicaid and private payers soon will follow. Instead of payment solely for the quantity of documentation and intervention, we will soon also be paid for the quality of the care we provide (and document). TABLE 2 includes the proposed eCQM reporting timelines for Medicare and Medicaid.2
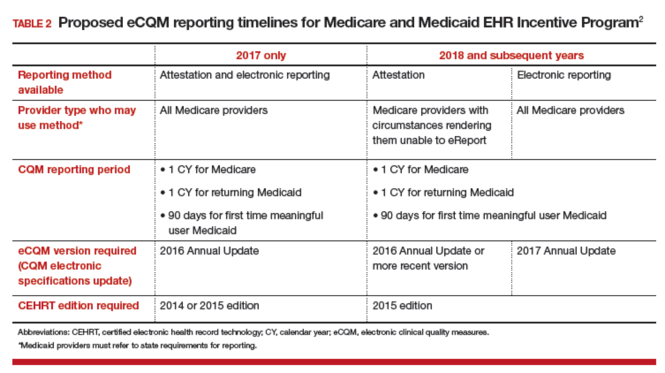
MACRA
eCQMs are a part of a larger federal effort to reform physician payments—MACRA. Over the past few years, there have been numerous federal programs to measure the quality and appropriateness of care. The Evaluation and Management (E&M) coding guidelines have been supplemented with factors for quality (Physician Quality Reporting System [PQRS]), resource use (the Value-based Payment Modifier), and EHR engagement (MU stages 1, 2, and 3). All of these programs are now being rolled up into a single program under MACRA.
MACRA has 2 distinct parts, known as the Merit-based Incentive Payment System (MIPS) and the Alternative Payment Model. MIPS keeps the underlying fee-for-service model but adds in a factor based on the following metrics:
- clinical quality (which will be based on eCQMs)
- resource use (a gauge of how many economic resources you use in comparison to your peers)
- clinical practice improvement (a measure of how well you are engaged in quality improvement, which includes capturing patient satisfaction data, and being part of a qualified clinical data registry is one way to demonstrate that engagement)
- meaningful use of EHR.
It is important to understand this last bulleted metric: MU is not going away (although that is a popular belief), it is just being transformed into MACRA, with the MU criteria simplified to emphasize a patient-centered medical record. Getting your patients involved through a portal and being able yourself to download, transmit, and accept patients’ data in electronic form are significant parts of MU. Vendors will continue to bear some of this burden, as their requirement to produce systems capable of these functions also increases their accountability.
Measurement and payment incentive
In the MIPS part of MACRA, the 4 factors of clinical quality, resource use, clinical practice improvement, and meaningful use of EHR will be combined in a formula to determine where each practitioner lies in comparison to his or her peers.
Now the bad news: Instead of receiving a bonus by meeting a benchmark, the bonus funds will be subtracted from those providers on the low end of the curve, and given to those at the top end. No matter how well the group does as a whole, no additional money will be available, and the bottom tier will be paying the bonuses of the top tier. The total pool of money to be distributed by CMS in the MIPS program will only grow by 0.5% per year for the foreseeable future. But MACRA does provide an alternative model for reimbursement, the Alternative Payment Model.
Alternative Payment Model
The Alternative Payment Model is basically an Accountable Care Organization—a group of providers agree to meet a certain standard of care (eCQMs again) and, in turn, receive a lump sum of money to deliver that care to a population. If there is some money left over at the end of a year, the group runs a profit. If not, they run a loss. One advantage of this model is that, under MACRA, the pool of money paid to “qualified” groups will increase at 5% per year for the next 5 years. This is certainly a better deal than the 0.5% increase of MIPS.
For specialists in general obstetrics and gynecology it may very well be that the volume of Medicare patients we see will be insufficient to participate meaningfully in either MIPS or the Alternative Payment Model. Regulations are still being crafted to exempt low-volume providers from the burdens associated with MACRA, and the American Congress of Obstetricians and Gynecologists (ACOG) is working diligently to advocate for systems that will allow members to see Medicare patients without requiring the substantial investments these programs likely will require.
The EHR: The single source of truth
The push to make the EHR the single source of truth will streamline many peripheral activities on the health care delivery side as well as the payer side. These requirements will present a new challenge to health care professionals, however. No one went to medical school to become a data entry clerk. Still, EHRs show the promise to transform many aspects of health care delivery. They speed communication,8 reduce errors,9 and may well improve the safety and quality of care. There also is some evidence developing that they may slow the rising cost of health care.10
But they are also quickly becoming a major source of physician dissatisfaction,11 with an apparent dose-response relationship.12 Authors of a recent RAND study note, “the current state of EHR technology significantly worsened professional satisfaction in multiple ways, due to poor usability, time-consuming data entry, interference with face-to-face patient care, inefficient and less fulfilling work content, insufficient health information exchange, and degradation of clinical documentation.”13
This pushback against EHRs has beenheard all the way to Congress. The Senate recently has introduced the ‘‘Improving Health Information Technology Act.’’14 This bill includes proposals for rating EHR systems, decreasing “unnecessary” documentation, prohibiting “information blocking,” and increasing interoperability. It remains to be seen what specific actions will be included, and how this bill will fare in an election year.
So the practice of medicine continues to evolve, and our accountability obligations show no sign of slowing down. The vision of the EHR as a single source of truth—the tool to streamline both the data entry and the data analysis—is being pushed hard by the folks who control the purse strings. This certainly will change the way we conduct our work as physicians and health care professionals. There are innovative efforts being developed to ease this burden. Cloud-based object-oriented data models, independent “apps,” open Application Programming Interfaces, or other technologies may supplant the transactional billing platforms15 we now rely upon.
ACOG is engaged at many levels with these issues, and we will continue to keep the interests of our members and the health of our patients at the center of our efforts. But it seems that, at least for now, a move to capturing discrete data elements and relying on eCQMs for quality measurements will shape the foreseeable payment incentive future.
Share your thoughts! Send your Letter to the Editor to [email protected]. Please include your name and the city and state in which you practice.
- Hsiao CJ, Hing E, Ashman J. Trends in electronic health record system use among office-based physicians: United States, 2007–2012. Natl Health Stat Report. 2014;(75):1–18.
- Medicare and Medicaid Programs; Electronic Health Record Incentive Program-Stage 3. Federal Register website. https://www.federalregister.gov/articles/2015/03/30/2015-06685/medicare-and-medicaid-programs-electronic-health-record-incentive-program-stage-3#t-4. Published March 10, 2015. Accessed March 19, 2016.
- Assareh H, Achat HM, Stubbs JM, Guevarra VM, Hill K.Incidence and variation of discrepancies in recording chronic conditions in Australian hospital administrative data. PLoS One. 2016;11(1):e0147087.
- Williams DJ, Shah SS, Myers A, et al. Identifying pediatric community-acquired pneumonia hospitalizations: Accuracy of administrative billing codes. JAMA Pediatr. 2013;167(9):851–858.
- Liede A, Hernandez RK, Roth M, Calkins G, Larrabee K, Nicacio L. Validation of International Classification of Diseases coding for bone metastases in electronic health records using technology-enabled abstraction. Clin Epidemiol. 2015;7:441–448.
- Revisions of Quality Reporting Requirements for Specific Providers, Including Changes Related to the Electronic Health Record Incentive Program. Federal Register website. https://federalregister.gov/a/2015-19049. Published August 17, 2015. Accessed March 19, 2016.
- Panjamapirom A. Hospitals: Electronic CQM Reporting Has Arrived. Are You Ready? http://www.ihealthbeat.org/perspectives/2015/hospitals-electronic-cqm-reporting-has -arrived-are-you-ready. Published August 24, 2015. Accessed March 17, 2016.
- Bernstein PS, Farinelli C, Merkatz IR. Using an electronic medical record to improve communication within a prenatal care network. Obstet Gynecol. 2005;105(3):607–612.
- George J, Bernstein PS. Using electronic medical records to reduce errors and risks in a prenatal network. Curr Opin Obstet Gynecol. 2009;21(6):527–531.
- Adler-Milstein J, Salzberg C, Franz C, Orav EJ, Newhouse JP, Bates DW. Effect of electronic health records on health care costs: longitudinal comparative evidence from community practices. Ann Intern Med. 2013;159(2):97–104.
- Pedulli L. Survey reveals widespread dissatisfaction with EHR systems. http://www.clinical-innovation.com/topics/ehr-emr/survey-reveals-widespread-dissatisfaction-ehr-systems. Published February 11, 2014. Accessed March 17, 2016.
- Babbott S, Manwell LB, Brown R, et al. Electronic medical records and physician stress in primary care: results from the MEMO Study. J Am Med Inform Assoc. 2014;21(e1):e100–e106.
- Friedberg MW, Chen PG, Van Busum KR, et al. Factors affecting physician professional satisfaction and their implications for patient care, health systems, and health policy. RAND Corporation website. http://www.rand.org/pubs/research_reports/RR439.html. Published 2013. Accessed March 17, 2016.
- Majority and Minority Staff of the Senate Committee on Health, Education, Labor, and Pensions. Summary of Improving Health Information Technology Act. http://www.help.senate.gov/imo/media/doc/Improving%20Health%20Information%20Technology%20Act%20--%20Summary.pdf. Accessed March 18, 2016.
- LetDoctorsbeDoctors.com. http://www.letdoctorsbedoctors.com/?sf21392355=1. Published 2016. Accessed March 18, 2016.
Steve Hasley, MD, and Barbara S. Levy, MD

Dr. Hasley is Chief Medical Informatics Officer, American Congress of Obstetricians and Gynecologists; Medical Director for Information Technology, Women’s Health, University of Pittsburgh Medical Center; Medical Director eRecord, Magee Women’s Hospital; Assistant Professor, Department of Obstetrics and Gynecology and Reproductive Science and Department of Medicine; and Adjunct Professor, Department of Biomedical Informatics at the University of Pittsburgh in Pennsylvania.

Dr. Levy is Vice President for Health Policy at the American Congress of Obstetricians and Gynecologistsin Washington, DC.
The authors report no financial relationships relevant to this article.
Steve Hasley, MD, and Barbara S. Levy, MD
Dr. Hasley is Chief Medical Informatics Officer, American Congress of Obstetricians and Gynecologists; Medical Director for Information Technology, Women’s Health, University of Pittsburgh Medical Center; Medical Director eRecord, Magee Women’s Hospital; Assistant Professor, Department of Obstetrics and Gynecology and Reproductive Science and Department of Medicine; and Adjunct Professor, Department of Biomedical Informatics at the University of Pittsburgh in Pennsylvania.
Dr. Levy is Vice President for Health Policy at the American Congress of Obstetricians and Gynecologistsin Washington, DC.
The authors report no financial relationships relevant to this article.
Practicing clinical medicine is increasingly challenging. Besides the onslaught of new clinical information, we have credentialing, accreditation, certification, team-based care, and patient satisfaction that contribute to the complexity of current medical practice. At the heart of many of these challenges is the issue of accountability. Never has our work product as physicians been under such intense scrutiny as it is today.
To demonstrate proof of the care we have provided, we have enlisted a host of administrators, assistants, abstractors, and other helpers to decipher our work and demonstrate its value to professional organizations, boards, hospitals, insurers, and the government. They comb through our charts, decipher our handwriting and dictations, guesstimate our intentions, and sometimes devalue our care because we have not adequately documented what we have done. To solve this accountability problem, our government and the payer community have promoted the electronic health record (EHR) as the “single source of truth” for the care we provide.
This effort received a huge boost in 2009 with the Health Information Technology for Economic and Clinical Health (HITECH) Act. HITECH authorized incentive payments through Medicare and Medicaid to health care providers that could demonstrate Meaningful Use (MU) of a certified EHR. This resulted in a boom in EHR purchases and installations.
By 2012, 71.8% of office-based physicians reported using some type of EHR system, up from 34.8% in 2007.1 In many respects this action was designed as a stimulus for the slow economy, but Congress also wanted some type of accountability that the money spent to subsidize EHR purchases was going to be well spent, and would hopefully have an impact on some of the serious health issues we face.
The initial stage of this MU program seemed to work out reasonably well. So, if a little is good, more must be better, right? Unfortunately, no. But, where did MU go wrong, and how is it being fixed? Contrary to popular belief, MU is not going away, it is being transformed. To help you navigate the tethered landscape of MU past and, more importantly, bring you up to speed on MU future (the Medicare Access and CHIP Reauthorization Act of 2015 [MACRA]) and your payment incentives in this data-centric world, we address MU transformation in this article.
Where Meaningful Use stage 2 went wrong
MU stage 2 turned out to significantly increase the documentation burden on health care professionals. In addition, one of the tragic unintended consequences was that all available EHR development resources by vendors went toward meeting MU data capture requirements rather than to improving the usability and efficiency of the EHRs. Neither result has been well received by health care professionals.
Stage 3 of MU is now in place. It is an attempt to simplify the requirements and focus on quality, safety, interoperability, and patient engagement. See “Meaningful Use stage 3 specifications”. The current progression of MU stages is depicted in TABLE 1.2
Meaningful Use stage 3 specifications
Objective 1: Protect patient health information. Protect electronic health information created or maintained by the Certified Electronic Health Record Technology (CEHRT) through the implementation of appropriate technical, administrative, and physical safeguards.
Objective 2: Electronic prescribing. Eligible providers (EPs) must generate and transmit permissible prescriptions electronically, and eligible hospitals must generate and transmit permissible discharge prescriptions electronically.
Objective 3: Clinical decision support. Implement clinical decision support interventions focused on improving performance on high-priority health conditions.
Objective 4: Computerized provider order entry. Use computerized provider order entry for medication, laboratory, and diagnostic imaging orders directly entered by any licensed health care professional, credentialed medical assistant, or a medical staff member credentialed and performing the equivalent duties of a credentialed medical assistant, who can enter orders into the medical record per state, local, and professional guidelines.
Objective 5: Patient electronic access to health information. The EP provides patients (or patient-authorized representatives) with timely electronic access to their health information and patient-specific education.
Objective 6: Coordination of care through patient engagement. Use the CEHRT to engage with patients or their authorized representatives about the patient's care.
Objective 7: Health information exchange. The EP provides a summary of care record when transitioning or referring their patient to another setting of care, receives or retrieves a summary of care record upon the receipt of a transition or referral or upon the first patient encounter with a new patient, and incorporates summary of care information from other providers into their EHR using the functions of CEHRT.
Objective 8: Public health and clinical data registry reporting. The EP is in active engagement with a public health agency or clinical data registry to submit electronic public health data in a meaningful way using certified EHR technology, except where prohibited, and in accordance with applicable law and practice.
Reference
1. Medicare and Medicaid Programs; Electronic Health Record Incentive Program-Stage 3. Federal Register website. https://www.federalregister.gov/articles/2015/03/30/2015-06685/medicare-and-medicaid-programs-electronic-health-record-incentive-program-stage-3#t-4. Accessed March 19, 2016.
Our new paradigm
Now that EHR implementation is fairly widespread, attention is focused on streamlining the reporting and documentation required for accountability, both from the data entry standpoint and the data analysis standpoint. Discrete data elements, entered by clinicians at the point of care, and downloaded directly from the EHR increasingly will be the way our patient care is assessed. Understanding this new paradigm is critical for both practice and professional viability.
Challenges in this new era
To understand the challenges ahead, we must first take a critical look at how physicians think about documentation, and what changes these models of documentation will have to undergo. Physicians are taught to think in complex models that we document as narratives or stories. While these models are composed of individual “elements” (patient age, due date, hemoglobin value, systolic blood pressure), the real information is in how these elements are related. Understanding a patient, a disease process, or a clinical workflow involves elements that must have context and relationships to be meaningful. Isolated hemoglobin or systolic blood pressure values tell us little, and may in fact obscure the forest for the trees. Physicians want to tell, and understand, the story.
However, an EHR is much more than a collection of narrative text documents. Entering data as discrete elements will allow each data element to be standardized, delegated, automated, analyzed, and monetized. In fact, these processes cannot be accomplished without the data being in this discrete form. While a common complaint about EHRs is that the “story” is hard to decipher, discrete elements are here to stay. Algorithms that can “read” a story and automatically populate these elements (known as natural language processing, or NLP) may someday allow us to go back to our dictations, but that day is frustratingly still far off.
Hello eCQMs
Up to now, physicians have relied on an army of abstractors, coders, billers, quality and safety helpers, and the like to read our notes and supply discrete data to the many clients who want to see accountability for our work. This process of course adds considerable cost to the health care system, and the data collected may not always supply accurate information. The gap between administrative data (gathered from the International Classificationof Diseases Ninth and Tenth revisions and Current Procedural Terminology [copyright American Medical Association] codes) and clinical reality is well documented.3–5
In an attempt to simplify this process, and to create a stronger connection to actual clinical data, the Centers for Medicare and Medicaid Services (CMS)6 is moving toward direct extraction of discrete data that have been entered by health care providers themselves.7 Using clinical data to report on quality metrics allows for improvement in risk adjustment as well as accuracy. Specific measures of this type have been designated eCQMs.
An eCQM is a format for a quality measure, utilizing data entered directly by health care professionals, and extracted directly from the EHR, without the need for additional personnel to review and abstract the chart. eCQMs rapidly are being phased into use for Medicare reimbursement; it is assumed that Medicaid and private payers soon will follow. Instead of payment solely for the quantity of documentation and intervention, we will soon also be paid for the quality of the care we provide (and document). TABLE 2 includes the proposed eCQM reporting timelines for Medicare and Medicaid.2
MACRA
eCQMs are a part of a larger federal effort to reform physician payments—MACRA. Over the past few years, there have been numerous federal programs to measure the quality and appropriateness of care. The Evaluation and Management (E&M) coding guidelines have been supplemented with factors for quality (Physician Quality Reporting System [PQRS]), resource use (the Value-based Payment Modifier), and EHR engagement (MU stages 1, 2, and 3). All of these programs are now being rolled up into a single program under MACRA.
MACRA has 2 distinct parts, known as the Merit-based Incentive Payment System (MIPS) and the Alternative Payment Model. MIPS keeps the underlying fee-for-service model but adds in a factor based on the following metrics:
- clinical quality (which will be based on eCQMs)
- resource use (a gauge of how many economic resources you use in comparison to your peers)
- clinical practice improvement (a measure of how well you are engaged in quality improvement, which includes capturing patient satisfaction data, and being part of a qualified clinical data registry is one way to demonstrate that engagement)
- meaningful use of EHR.
It is important to understand this last bulleted metric: MU is not going away (although that is a popular belief), it is just being transformed into MACRA, with the MU criteria simplified to emphasize a patient-centered medical record. Getting your patients involved through a portal and being able yourself to download, transmit, and accept patients’ data in electronic form are significant parts of MU. Vendors will continue to bear some of this burden, as their requirement to produce systems capable of these functions also increases their accountability.
Measurement and payment incentive
In the MIPS part of MACRA, the 4 factors of clinical quality, resource use, clinical practice improvement, and meaningful use of EHR will be combined in a formula to determine where each practitioner lies in comparison to his or her peers.
Now the bad news: Instead of receiving a bonus by meeting a benchmark, the bonus funds will be subtracted from those providers on the low end of the curve, and given to those at the top end. No matter how well the group does as a whole, no additional money will be available, and the bottom tier will be paying the bonuses of the top tier. The total pool of money to be distributed by CMS in the MIPS program will only grow by 0.5% per year for the foreseeable future. But MACRA does provide an alternative model for reimbursement, the Alternative Payment Model.
Alternative Payment Model
The Alternative Payment Model is basically an Accountable Care Organization—a group of providers agree to meet a certain standard of care (eCQMs again) and, in turn, receive a lump sum of money to deliver that care to a population. If there is some money left over at the end of a year, the group runs a profit. If not, they run a loss. One advantage of this model is that, under MACRA, the pool of money paid to “qualified” groups will increase at 5% per year for the next 5 years. This is certainly a better deal than the 0.5% increase of MIPS.
For specialists in general obstetrics and gynecology it may very well be that the volume of Medicare patients we see will be insufficient to participate meaningfully in either MIPS or the Alternative Payment Model. Regulations are still being crafted to exempt low-volume providers from the burdens associated with MACRA, and the American Congress of Obstetricians and Gynecologists (ACOG) is working diligently to advocate for systems that will allow members to see Medicare patients without requiring the substantial investments these programs likely will require.
The EHR: The single source of truth
The push to make the EHR the single source of truth will streamline many peripheral activities on the health care delivery side as well as the payer side. These requirements will present a new challenge to health care professionals, however. No one went to medical school to become a data entry clerk. Still, EHRs show the promise to transform many aspects of health care delivery. They speed communication,8 reduce errors,9 and may well improve the safety and quality of care. There also is some evidence developing that they may slow the rising cost of health care.10
But they are also quickly becoming a major source of physician dissatisfaction,11 with an apparent dose-response relationship.12 Authors of a recent RAND study note, “the current state of EHR technology significantly worsened professional satisfaction in multiple ways, due to poor usability, time-consuming data entry, interference with face-to-face patient care, inefficient and less fulfilling work content, insufficient health information exchange, and degradation of clinical documentation.”13
This pushback against EHRs has beenheard all the way to Congress. The Senate recently has introduced the ‘‘Improving Health Information Technology Act.’’14 This bill includes proposals for rating EHR systems, decreasing “unnecessary” documentation, prohibiting “information blocking,” and increasing interoperability. It remains to be seen what specific actions will be included, and how this bill will fare in an election year.
So the practice of medicine continues to evolve, and our accountability obligations show no sign of slowing down. The vision of the EHR as a single source of truth—the tool to streamline both the data entry and the data analysis—is being pushed hard by the folks who control the purse strings. This certainly will change the way we conduct our work as physicians and health care professionals. There are innovative efforts being developed to ease this burden. Cloud-based object-oriented data models, independent “apps,” open Application Programming Interfaces, or other technologies may supplant the transactional billing platforms15 we now rely upon.
ACOG is engaged at many levels with these issues, and we will continue to keep the interests of our members and the health of our patients at the center of our efforts. But it seems that, at least for now, a move to capturing discrete data elements and relying on eCQMs for quality measurements will shape the foreseeable payment incentive future.
Share your thoughts! Send your Letter to the Editor to [email protected]. Please include your name and the city and state in which you practice.
- Hsiao CJ, Hing E, Ashman J. Trends in electronic health record system use among office-based physicians: United States, 2007–2012. Natl Health Stat Report. 2014;(75):1–18.
- Medicare and Medicaid Programs; Electronic Health Record Incentive Program-Stage 3. Federal Register website. https://www.federalregister.gov/articles/2015/03/30/2015-06685/medicare-and-medicaid-programs-electronic-health-record-incentive-program-stage-3#t-4. Published March 10, 2015. Accessed March 19, 2016.
- Assareh H, Achat HM, Stubbs JM, Guevarra VM, Hill K.Incidence and variation of discrepancies in recording chronic conditions in Australian hospital administrative data. PLoS One. 2016;11(1):e0147087.
- Williams DJ, Shah SS, Myers A, et al. Identifying pediatric community-acquired pneumonia hospitalizations: Accuracy of administrative billing codes. JAMA Pediatr. 2013;167(9):851–858.
- Liede A, Hernandez RK, Roth M, Calkins G, Larrabee K, Nicacio L. Validation of International Classification of Diseases coding for bone metastases in electronic health records using technology-enabled abstraction. Clin Epidemiol. 2015;7:441–448.
- Revisions of Quality Reporting Requirements for Specific Providers, Including Changes Related to the Electronic Health Record Incentive Program. Federal Register website. https://federalregister.gov/a/2015-19049. Published August 17, 2015. Accessed March 19, 2016.
- Panjamapirom A. Hospitals: Electronic CQM Reporting Has Arrived. Are You Ready? http://www.ihealthbeat.org/perspectives/2015/hospitals-electronic-cqm-reporting-has -arrived-are-you-ready. Published August 24, 2015. Accessed March 17, 2016.
- Bernstein PS, Farinelli C, Merkatz IR. Using an electronic medical record to improve communication within a prenatal care network. Obstet Gynecol. 2005;105(3):607–612.
- George J, Bernstein PS. Using electronic medical records to reduce errors and risks in a prenatal network. Curr Opin Obstet Gynecol. 2009;21(6):527–531.
- Adler-Milstein J, Salzberg C, Franz C, Orav EJ, Newhouse JP, Bates DW. Effect of electronic health records on health care costs: longitudinal comparative evidence from community practices. Ann Intern Med. 2013;159(2):97–104.
- Pedulli L. Survey reveals widespread dissatisfaction with EHR systems. http://www.clinical-innovation.com/topics/ehr-emr/survey-reveals-widespread-dissatisfaction-ehr-systems. Published February 11, 2014. Accessed March 17, 2016.
- Babbott S, Manwell LB, Brown R, et al. Electronic medical records and physician stress in primary care: results from the MEMO Study. J Am Med Inform Assoc. 2014;21(e1):e100–e106.
- Friedberg MW, Chen PG, Van Busum KR, et al. Factors affecting physician professional satisfaction and their implications for patient care, health systems, and health policy. RAND Corporation website. http://www.rand.org/pubs/research_reports/RR439.html. Published 2013. Accessed March 17, 2016.
- Majority and Minority Staff of the Senate Committee on Health, Education, Labor, and Pensions. Summary of Improving Health Information Technology Act. http://www.help.senate.gov/imo/media/doc/Improving%20Health%20Information%20Technology%20Act%20--%20Summary.pdf. Accessed March 18, 2016.
- LetDoctorsbeDoctors.com. http://www.letdoctorsbedoctors.com/?sf21392355=1. Published 2016. Accessed March 18, 2016.
PSA screens could be cost effective if low-risk cases went untreated
Given current treatment practices, prostate-specific antigen (PSA) screening is not cost effective unless performed every 4 years in men aged 55-69 years, and with a biopsy threshold of 10.0 ng/mL, researchers reported online in JAMA Oncology.
But several less conservative testing strategies could be cost effective if patients with Gleason scores under 7 and clinical T2a stage cancer or lower are not treated unless they clinically progress, said Joshua A. Roth, Ph.D., of Fred Hutchinson Cancer Research Center in Seattle and his associates.

The study has “clear implications for the future of PSA screening in the United States,” the investigators wrote (JAMA Oncol. Mar 24. doi: 10.1001/jamaoncol.2015.6275). “Rather than stopping PSA screening, as recommended by the U.S. Preventive Services Task Force, implementation of strategies that extend the screening interval and/or use higher PSA biopsy thresholds have the potential to preserve substantial benefit, while controlling harm and costs.”
The investigators constructed a hypothetical group of men in the United States who underwent 18 different PSA screening strategies starting at age 40. Under the current treatment paradigm, PSA screening increased years of life by 3%-6%, with a cost of $7,335-$21,649 for each extra year of life. Quality years of life rose only if the strategy included a narrower age range for testing or a biopsy threshold of 10.0 ng/mL.
If the more selective treatment model was used, screening 55- to 69-year-old men every 4 years and using a PSA biopsy threshold of 3.0 ng/mL was not only potentially cost effective, but also increased quality years of life. The same was true for quadrennial screening of men aged 50-74 years with a biopsy threshold of 4.0 ng/mL.
“Our work adds to a growing consensus that highly conservative use of the PSA test and biopsy referral is necessary if PSA screening is to be cost effective,” the researchers concluded. Less frequent screening and stricter biopsy criteria for biopsy were most likely to make screening cost effective, especially if physicians do not immediately treat low-risk cases, they added.
The study was supported by the National Cancer Institute, the Centers for Disease Control and Prevention, and the Agency for Healthcare Research and Quality. The investigators had no disclosures.
This study forces us to change the debate from “Should we screen?” to “How can we get physicians to follow best practice?” I have heard it said that the professional, financial, and malpractice incentives to screen and then treat low-risk cancer are too overwhelming to allow for significant practice change. But this is clearly disconfirmed by the literature. Use of active surveillance for low-risk prostate cancer has increased fourfold in the past few years; PSA testing in older men has also fallen recently. Rates of unnecessary treatment still remain much too high (about 60%) as does screening of older men (about 35% for those aged 75 years and older). More work needs to be done, and much more change needs to happen.

|
Andrew J. Vickers, Ph.D. |
Based on these results, if we follow the literature on how to screen with PSA and which screen-detected prostate cancers to treat, we will likely do more good than harm. If we simply carry on with common practice – screening older men, aggressively treating low-risk disease – then we should call for PSA screening to end.
Andrew J. Vickers, Ph.D., is at Memorial Sloan Kettering Cancer Center, New York. He reported being named on a patent application for a statistical method to detect prostate cancer; receiving royalties from sales of the test; and having stock options in OPKO Health, which commercialized the test. These comments are from his editorial (JAMA Oncol. 2016 Mar 24 doi: 10.1001/jamaoncol.2015.6276).
This study forces us to change the debate from “Should we screen?” to “How can we get physicians to follow best practice?” I have heard it said that the professional, financial, and malpractice incentives to screen and then treat low-risk cancer are too overwhelming to allow for significant practice change. But this is clearly disconfirmed by the literature. Use of active surveillance for low-risk prostate cancer has increased fourfold in the past few years; PSA testing in older men has also fallen recently. Rates of unnecessary treatment still remain much too high (about 60%) as does screening of older men (about 35% for those aged 75 years and older). More work needs to be done, and much more change needs to happen.
|
|
Andrew J. Vickers, Ph.D. |
Based on these results, if we follow the literature on how to screen with PSA and which screen-detected prostate cancers to treat, we will likely do more good than harm. If we simply carry on with common practice – screening older men, aggressively treating low-risk disease – then we should call for PSA screening to end.
Andrew J. Vickers, Ph.D., is at Memorial Sloan Kettering Cancer Center, New York. He reported being named on a patent application for a statistical method to detect prostate cancer; receiving royalties from sales of the test; and having stock options in OPKO Health, which commercialized the test. These comments are from his editorial (JAMA Oncol. 2016 Mar 24 doi: 10.1001/jamaoncol.2015.6276).
Given current treatment practices, prostate-specific antigen (PSA) screening is not cost effective unless performed every 4 years in men aged 55-69 years, and with a biopsy threshold of 10.0 ng/mL, researchers reported online in JAMA Oncology.
But several less conservative testing strategies could be cost effective if patients with Gleason scores under 7 and clinical T2a stage cancer or lower are not treated unless they clinically progress, said Joshua A. Roth, Ph.D., of Fred Hutchinson Cancer Research Center in Seattle and his associates.
The study has “clear implications for the future of PSA screening in the United States,” the investigators wrote (JAMA Oncol. Mar 24. doi: 10.1001/jamaoncol.2015.6275). “Rather than stopping PSA screening, as recommended by the U.S. Preventive Services Task Force, implementation of strategies that extend the screening interval and/or use higher PSA biopsy thresholds have the potential to preserve substantial benefit, while controlling harm and costs.”
The investigators constructed a hypothetical group of men in the United States who underwent 18 different PSA screening strategies starting at age 40. Under the current treatment paradigm, PSA screening increased years of life by 3%-6%, with a cost of $7,335-$21,649 for each extra year of life. Quality years of life rose only if the strategy included a narrower age range for testing or a biopsy threshold of 10.0 ng/mL.
If the more selective treatment model was used, screening 55- to 69-year-old men every 4 years and using a PSA biopsy threshold of 3.0 ng/mL was not only potentially cost effective, but also increased quality years of life. The same was true for quadrennial screening of men aged 50-74 years with a biopsy threshold of 4.0 ng/mL.
“Our work adds to a growing consensus that highly conservative use of the PSA test and biopsy referral is necessary if PSA screening is to be cost effective,” the researchers concluded. Less frequent screening and stricter biopsy criteria for biopsy were most likely to make screening cost effective, especially if physicians do not immediately treat low-risk cases, they added.
The study was supported by the National Cancer Institute, the Centers for Disease Control and Prevention, and the Agency for Healthcare Research and Quality. The investigators had no disclosures.
FROM JAMA ONCOLOGY
Key clinical point: A modeling study found that screening for prostate-specific antigen could be cost effective if low-risk cases are not treated unless they progress.
Major finding: Screening 55- to 69-year-old men every 4 years and using a PSA biopsy threshold of 3.0 ng/mL was potentially cost effective and also increased quality years of life. The same was true for quadrennial screening of men aged 50-74 years with a biopsy threshold of 4.0 ng/mL.
Data source: A microsimulation model of prostate cancer incidence and mortality.
Disclosures: The study was supported by the National Cancer Institute, the Centers for Disease Control and Prevention, and the Agency for Healthcare Research and Quality. The investigators had no disclosures.

U.S. flu activity continues downward trend
Influenza-like illness (ILI) activity in the United States continued to drop during the week ending March 26, 2016, with only one state still at the highest level, according to the Centers for Disease Control and Prevention.
That one state was New Jersey, which was at level 10 on the CDC’s 1-10 scale of ILI activity. One state at level 10 was down from three states the week before and seven states 2 weeks earlier. Also down for a second consecutive week was the proportion of outpatient visits for ILI, which was 2.9% for the most recent week, compared with 3.2% the previous week and a season high of 3.7% for the week ending March 12, the CDC’s Influenza-like Illness Surveillance Network (ILINet) reported.
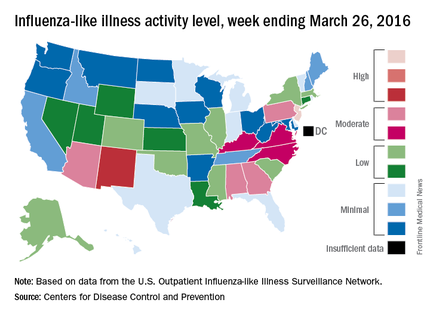
The only other state in the “high” range for the week ending March 26 was New Mexico at level 8. States in the “moderate” range were Alabama, Arizona, Georgia, and Pennsylvania at level 7 and Kentucky, North Carolina, and Virginia at level 6, according to data from ILINet.
Three flu-related pediatric deaths were reported to CDC during the week, but two occurred the previous week and one occurred in February. That brings the total of flu-related pediatric deaths to 33 for the 2015-2016 influenza season, the CDC said. However, 7.7% of all deaths reported through the 122 Cities Mortality Reporting System were due to pneumonia and influenza. This percentage was above the epidemic threshold of 7.2%.
The CDC also reported a cumulative rate for the season of 21.4 laboratory-confirmed influenza-associated hospitalizations per 100,000 population. The highest rate of hospitalization was among adults aged 65 years or older (54.5 per 100,000 population), followed by adults aged 50-64 (31.4 per 100,000 population) and children aged 0-4 years (29.3 per 100,000 population).
Influenza-like illness (ILI) activity in the United States continued to drop during the week ending March 26, 2016, with only one state still at the highest level, according to the Centers for Disease Control and Prevention.
That one state was New Jersey, which was at level 10 on the CDC’s 1-10 scale of ILI activity. One state at level 10 was down from three states the week before and seven states 2 weeks earlier. Also down for a second consecutive week was the proportion of outpatient visits for ILI, which was 2.9% for the most recent week, compared with 3.2% the previous week and a season high of 3.7% for the week ending March 12, the CDC’s Influenza-like Illness Surveillance Network (ILINet) reported.
The only other state in the “high” range for the week ending March 26 was New Mexico at level 8. States in the “moderate” range were Alabama, Arizona, Georgia, and Pennsylvania at level 7 and Kentucky, North Carolina, and Virginia at level 6, according to data from ILINet.
Three flu-related pediatric deaths were reported to CDC during the week, but two occurred the previous week and one occurred in February. That brings the total of flu-related pediatric deaths to 33 for the 2015-2016 influenza season, the CDC said. However, 7.7% of all deaths reported through the 122 Cities Mortality Reporting System were due to pneumonia and influenza. This percentage was above the epidemic threshold of 7.2%.
The CDC also reported a cumulative rate for the season of 21.4 laboratory-confirmed influenza-associated hospitalizations per 100,000 population. The highest rate of hospitalization was among adults aged 65 years or older (54.5 per 100,000 population), followed by adults aged 50-64 (31.4 per 100,000 population) and children aged 0-4 years (29.3 per 100,000 population).
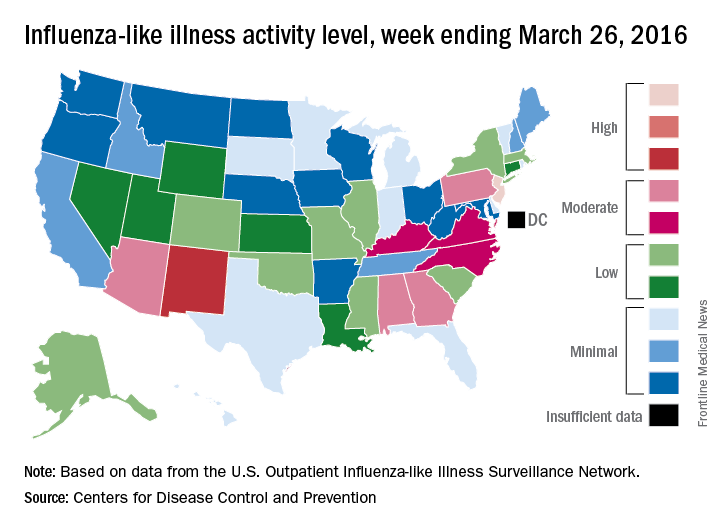
Rituximab bests fingolimod in MS patients switching from natalizumab
For patients with relapsing-remitting multiple sclerosis (RRMS) switching to other therapies due to positive JC virus serology, treatment with rituximab resulted in a lower rate of clinical relapse as compared with fingolimod in a retrospective outcomes study of registry data from three Swedish MS centers, according to a report published online March 31 in Annals of Neurology.
Although natalizumab (Tysabri) is approved for the treatment of highly active RRMS, its long-term use can increase the risk of developing progressive multifocal leukoencephalopathy. Because this is a serious and potentially lethal condition associated with opportunistic brain infection with the JC virus, those patients testing positive for JC virus antibodies may require a switch to an alternative treatment, such as fingolimod (Gilenya), or off-label use of rituximab (Rituxan). The efficacy, safety, and tolerability associated with switching to either of these alternative therapies were compared by Peter Alping of the department of clinical neuroscience, Karolinska Institutet, Stockholm, and his associates (Ann Neurol. 2016 Mar 31. doi: 10.1002/ana.24651).

Of the 256 patients included in the study, 142 (55%) were switched to fingolimod. The efficacy outcomes comparison showed a statistically significant difference in favor of rituximab, with which 2% of patients had a clinical relapse in the first 1.5 years of treatment after natalizumab cessation as opposed to 18% for fingolimod. This corresponded to an annual relapse rate of 0.02 and 0.16, respectively. Additionally, a review of patients’ contrast-enhancing lesions on MRI scans after at least 3 months of treatment indicated that disease progression was detected less frequently in patients switched to rituximab (1%) as opposed to those switched to fingolimod (16%).
The safety and tolerability data also indicated more favorable results for those patients switched to rituximab. For example, a significantly lower rate of adverse events was noted in the rituximab group (5%) when compared with the fingolimod group (21%). Similarly, a lower rate of treatment discontinuation was observed for those switched to rituximab (2%) when compared with those switched to fingolimod (28%).
The statistically significant differences found in the efficacy, safety, and tolerability data persisted even after adjusting for possible confounding factors including patient age, sex, disability status, time on natalizumab, washout time, follow-up time, and study center. Despite the differences noted in the safety findings, the authors said that both treatments seemed to be safe in general.
In most cases, natalizumab had been given 300 mg IV every 4 weeks. Fingolimod was given orally 0.5 mg once daily. Nearly all patients who received rituximab got a single IV infusion of 500 or 1,000 mg every 6 months, but in some cases the first infusion had been repeated after 2 weeks.
In the absence of formal randomized clinical trial data, the authors said that these findings support the use of rituximab over fingolimod in this particular population of MS patients.
This study was supported by the Swedish Medical Research council and the Stockholm County. First author Peter Alping declared no competing interests; several of his associates reported ties to numerous industry sources.
For patients with relapsing-remitting multiple sclerosis (RRMS) switching to other therapies due to positive JC virus serology, treatment with rituximab resulted in a lower rate of clinical relapse as compared with fingolimod in a retrospective outcomes study of registry data from three Swedish MS centers, according to a report published online March 31 in Annals of Neurology.
Although natalizumab (Tysabri) is approved for the treatment of highly active RRMS, its long-term use can increase the risk of developing progressive multifocal leukoencephalopathy. Because this is a serious and potentially lethal condition associated with opportunistic brain infection with the JC virus, those patients testing positive for JC virus antibodies may require a switch to an alternative treatment, such as fingolimod (Gilenya), or off-label use of rituximab (Rituxan). The efficacy, safety, and tolerability associated with switching to either of these alternative therapies were compared by Peter Alping of the department of clinical neuroscience, Karolinska Institutet, Stockholm, and his associates (Ann Neurol. 2016 Mar 31. doi: 10.1002/ana.24651).
Of the 256 patients included in the study, 142 (55%) were switched to fingolimod. The efficacy outcomes comparison showed a statistically significant difference in favor of rituximab, with which 2% of patients had a clinical relapse in the first 1.5 years of treatment after natalizumab cessation as opposed to 18% for fingolimod. This corresponded to an annual relapse rate of 0.02 and 0.16, respectively. Additionally, a review of patients’ contrast-enhancing lesions on MRI scans after at least 3 months of treatment indicated that disease progression was detected less frequently in patients switched to rituximab (1%) as opposed to those switched to fingolimod (16%).
The safety and tolerability data also indicated more favorable results for those patients switched to rituximab. For example, a significantly lower rate of adverse events was noted in the rituximab group (5%) when compared with the fingolimod group (21%). Similarly, a lower rate of treatment discontinuation was observed for those switched to rituximab (2%) when compared with those switched to fingolimod (28%).
The statistically significant differences found in the efficacy, safety, and tolerability data persisted even after adjusting for possible confounding factors including patient age, sex, disability status, time on natalizumab, washout time, follow-up time, and study center. Despite the differences noted in the safety findings, the authors said that both treatments seemed to be safe in general.
In most cases, natalizumab had been given 300 mg IV every 4 weeks. Fingolimod was given orally 0.5 mg once daily. Nearly all patients who received rituximab got a single IV infusion of 500 or 1,000 mg every 6 months, but in some cases the first infusion had been repeated after 2 weeks.
In the absence of formal randomized clinical trial data, the authors said that these findings support the use of rituximab over fingolimod in this particular population of MS patients.
This study was supported by the Swedish Medical Research council and the Stockholm County. First author Peter Alping declared no competing interests; several of his associates reported ties to numerous industry sources.
FROM ANNALS OF NEUROLOGY
Key clinical point: Patients with RRMS switching from natalizumab to rituximab due to JC virus antibody positivity achieved better efficacy outcomes than did those switched to fingolimod.
Major finding: A significantly higher percentage of study participants experienced clinical relapse when switched to fingolimod (18%) as opposed to rituximab (2%) within 1.5 years of natalizumab cessation.
Data source: A retrospective outcomes study of registry data from three Swedish MS centers involving 256 JC virus antibody–positive RRMS patients who had switched therapies.
Disclosures: This study was supported by the Swedish Medical Research council and the Stockholm County. First author Peter Alping declared no competing interests; several of his associates reported ties to numerous industry sources.

VIDEO: Low thyroid function increases odds of type 2 diabetes
BOSTON – Results of a population-based study involving more than 8,000 adults from the Netherlands who were diabetes free at baseline has implicated low thyroid function with a 13% increased likelihood of developing type 2 diabetes, and up to 40% higher in individuals with prediabetes.
The heightened risk exists even for individuals with subclinical hypothyroidism, in whom thyroid-stimulating hormone (TSH) in the blood is still in the normal concentration range.
“These findings suggest we should consider screening people with prediabetes for low thyroid function,” Dr. Layal Chaker of Erasmus Medical Center, Rotterdam, the Netherlands, said at the annual meeting of the Endocrine Society.
Thyroid screening is recommended for patients with type 1 diabetes, since they are at increased risk of thyroid disease. An association between thyroid dysfunction in the form of hypothyroidism and type 2 diabetes has been surmised, since type 2 diabetes and hypothyroidism tend to be more prevalent in older adults, and since hypothyroidism has been linked with weight gain and reduced sensitivity to insulin.
To further study the link between thyroid function and diabetes, Dr. Chaker and her colleagues studied data from 8,452 participants aged 45 years and above (mean age 62 years, 58% female) from the Rotterdam Study, a prospective, longitudinal cohort study in the Ommoord district of Rotterdam that was undertaken to investigate the risk factors of cardiovascular, neurological, ophthalmologic, and endocrine diseases in the elderly. The cohort was considered representative of the general population in the Netherlands. All participants had blood tests to measure blood glucose, TSH, and free thyroxine (FT4). Normal blood glucose was considered to be under 5.9 mmol/L, prediabetes as over 5.9 to less than 7.0 mmol/L glucose, and diabetes as above 7.0 mmol/L.
Prediabetes and type 2 diabetes developed in 1,100 and 798 subjects, respectively, during a mean follow-up of 7.9 years. Higher TSH levels increased the risk of development of type 2 diabetes risk (hazard ratio [HR] 1.13, 95% confidence interval [CI], 1.08-1.18, per logTSH). This risk held even for subjects whose TSH levels were at the lower end of the reference range of thyroid function (HR 1.24, CI, 1.06-1.45). The risk of diabetes was reduced in subjects with FT4 levels that were elevated (HR 0.96, CI, 0.93-0.99, per pmol/L) and for those whose FT4 levels were in the reference range (HR 0.96, CI, 0.92-0.99). Low thyroid function, even within the normal range, was associated with a 1.4 times risk of progression from prediabetes to type 2 diabetes (P = .002).
“Low and, surprisingly, low-normal thyroid function are risk factors for incident diabetes, especially in individuals with prediabetes,” said Dr. Chaker.
The data point to the need to clarify whether screening for and treatment of subclinical hypothyroidism can help curb the development of diabetes, she added.
Dr. Chaker had no disclosures.
AT ENDO 2016
Key clinical point: Hypothyroidism increases the risk of developing type 2 diabetes.
Major finding: Higher TSH levels increased the risk of development of type 2 diabetes risk (hazard ratio 1.13, 95% confidence interval, 1.08-1.18, per logTSH).
Data source: Population-based study of 8,452 adult from the Netherlands
Disclosures: Dr. Chaker had no disclosures.

VIDEO: Management of difficult-to-treat IBD cases
PHILADELPHIA – The lack of evidence-based management strategies for the treatment of difficult inflammatory bowel disease cases, such as with Crohn’s disease, can lead to confusion for some clinicians.
Dr. Mark T. Osterman, assistant professor of medicine at the University of Pennsylvania, Philadelphia, discusses when to use antibiotics in Crohn’s disease and when to consider antibiotics in combination with draining fistulae. He also discusses available pharmacotherapies, and the value of bowel rest.
“The best treatment of all for difficult inflammatory bowel disease is aggressive and early, so that the condition doesn’t go from bad to worse,” Dr. Osterman said.
The video was recorded at this year’s meeting of Digestive Diseases: New Advances, a meeting held by Global Academy for Medical Education and Rutgers, the State University of New Jersey. Global Academy and this news organization are owned by the same company.
The video associated with this article is no longer available on this site. Please view all of our videos on the MDedge YouTube channel
On Twitter @whitneymcknight
EXPERT ANALYSIS FROM DIGESTIVE DISEASES: NEW ADVANCES