User login
EHR woes will get worse before they get better: ONC chief
WASHINGTON – EHR woes may tick up as medical practices begin to move from fee for service to a value-based care model, according to the new federal health IT leader, B. Vindell Washington, MD.
“If you are in an environment where you have, say for example, 20%-25% of your patients that are in an accountable care model and the rest of your entire panel is a fee-for-service model, then you’re really not in a position to really reap the full benefit, and quite frankly you are straddling the fence in terms of both your work flow and patient delivery,” Dr. Washington, National Coordinator for Health Information Technology, said at a Sept. 19 press briefing. That said, “I think that there will be improvements for physicians as we work our way through delivery system reform.”

The Office of the National Coordinator for Health Information Technology (ONC) is working on regulations that would push EHR vendors to publish app interfaces to foster innovation, create more efficient work-flow applications, and improve EHRs in general, said Dr. Washington, former president and chief medical information officer of the Franciscan Missionaries of Our Lady Health System Medical Group, Baton Rogue, La. “This change is not just a change in the tool that folks are using, it is also a change in the system in which they operate.”
Interoperability also should improve as more clinicians move into value-based care models, he said. For example, in Tulsa, Okla., three competing health systems are participating in the Comprehensive Primary Care Initiative demonstration. The health systems involved in the demonstration are seeing unprecedented levels of information sharing between them because participation in CPC requires it.
“Part of this value proposition comes when you take care of groups of patients and you move into more of the CPC+ or medical home or coordinated care models where the sort of larger, longer view and team-based approach to care become more and more prominent,” Dr. Washington said.
He also talked about the value of documenting efforts related to process measures, and the criticism that clinicians are simply checking boxes rather than focusing on outcomes.
Dr. Washington acknowledged that defining and measuring outcomes is a much more difficult task. He noted that improvement in health is the goal. And while the measure may be difficult, what physicians “need to do in health care to lead to those outcomes, to have people have better, healthier, more enriched lives, you end up with measures around.”
As an example, he pointed to preventing diabetic retinopathy or amputation. “Our best guess at how to do that is to keep their hemoglobin A1c in a certain range,” he said, adding that while tracking hemoglobin A1c is the measurement, “what you really want is the [diabetes patient] to have a long life, keep their eyesight, and not lose a limb. It’s that juxtaposition of what you can measure easily versus what the ultimate outcome” is, and physicians will come up with a series of steps in order to achieve the outcome of improved overall health status.
WASHINGTON – EHR woes may tick up as medical practices begin to move from fee for service to a value-based care model, according to the new federal health IT leader, B. Vindell Washington, MD.
“If you are in an environment where you have, say for example, 20%-25% of your patients that are in an accountable care model and the rest of your entire panel is a fee-for-service model, then you’re really not in a position to really reap the full benefit, and quite frankly you are straddling the fence in terms of both your work flow and patient delivery,” Dr. Washington, National Coordinator for Health Information Technology, said at a Sept. 19 press briefing. That said, “I think that there will be improvements for physicians as we work our way through delivery system reform.”
The Office of the National Coordinator for Health Information Technology (ONC) is working on regulations that would push EHR vendors to publish app interfaces to foster innovation, create more efficient work-flow applications, and improve EHRs in general, said Dr. Washington, former president and chief medical information officer of the Franciscan Missionaries of Our Lady Health System Medical Group, Baton Rogue, La. “This change is not just a change in the tool that folks are using, it is also a change in the system in which they operate.”
Interoperability also should improve as more clinicians move into value-based care models, he said. For example, in Tulsa, Okla., three competing health systems are participating in the Comprehensive Primary Care Initiative demonstration. The health systems involved in the demonstration are seeing unprecedented levels of information sharing between them because participation in CPC requires it.
“Part of this value proposition comes when you take care of groups of patients and you move into more of the CPC+ or medical home or coordinated care models where the sort of larger, longer view and team-based approach to care become more and more prominent,” Dr. Washington said.
He also talked about the value of documenting efforts related to process measures, and the criticism that clinicians are simply checking boxes rather than focusing on outcomes.
Dr. Washington acknowledged that defining and measuring outcomes is a much more difficult task. He noted that improvement in health is the goal. And while the measure may be difficult, what physicians “need to do in health care to lead to those outcomes, to have people have better, healthier, more enriched lives, you end up with measures around.”
As an example, he pointed to preventing diabetic retinopathy or amputation. “Our best guess at how to do that is to keep their hemoglobin A1c in a certain range,” he said, adding that while tracking hemoglobin A1c is the measurement, “what you really want is the [diabetes patient] to have a long life, keep their eyesight, and not lose a limb. It’s that juxtaposition of what you can measure easily versus what the ultimate outcome” is, and physicians will come up with a series of steps in order to achieve the outcome of improved overall health status.

The art of knowledge transfer
WAIKOLOA, HAWAII – At the annual meeting of the American Association for the Surgery of Trauma (AAST), Grace S. Rozycki, MD, highlighted findings from a survey of 62 seasoned surgeons who were asked to share their insights, advice, and practical suggestions on how to transmit wisdom to the next generation of surgeons.
Dr. Rozycki is professor of surgery at Indiana University, Indianapolis, and is the current president of the AAST. She reported having no financial disclosures.
AT THE AAST ANNUAL MEETING

Mucous Membrane Pemphigoid Involving the Trachea and Bronchi: An Extremely Rare and Life-Threatening Presentation
To the Editor:
Mucous membrane pemphigoid (MMP) is an autoimmune blistering disorder that causes subepithelial damage and scarring of mucosal surfaces with or without skin involvement.1 The clinical presentation is highly variable. The oropharynx is the most common site of initial presentation, followed by ocular, nasopharyngeal, anogenital, skin, laryngeal, and esophageal involvement.2 Patients often present to a variety of specialists depending on initial symptoms, and due to the diverse clinical manifestations, MMP often is misdiagnosed. Our patient presented an even greater challenge because the disease progressed to tracheal and bronchial involvement.
A 37-year-old man presented to his primary care physician with a chief concern of a sore throat and oral ulcers. The patient was treated with a course of antibiotics followed by a nystatin oral solution. He continued to develop ulcerative lesions on the soft palate, posterior pharynx, and nasal mucosae. He sought treatment from 2 otolaryngologists (ENTs) and a gastroenterologist, and continued to be treated with multiple oral antibiotics, fluconazole, and topical nystatin. Despite treatment, the patient developed pansinusitis and laryngitis and presented to the ENT department at our institution with severe hoarseness and dyspnea on exertion. Examination by the ENT department revealed ulcerative lesions of the nares with stenosis and ulcers along the soft palate. Videolaryngostroboscopy showed remarkable supraglottic edema with thick endolaryngeal mucus. The patient worked as a funeral director and had notable formaldehyde exposure. He also hunted wild game and performed taxidermy regularly.
The patient was admitted and treated with intravenous dexamethasone for a compromised airway. Subsequently, he was taken to the operating room and had biopsies performed of the posterior pharynx. Given his exposure history, the infectious disease department was consulted and he was evaluated for multiple viral, bacterial, and fungal suspects including leishmania and tularemia. Age-appropriate screening, physical examination, and review of systems were negative for an underlying neoplasm. Histopathologic examination revealed a subepithelial vesicular mucositis with a mixed infiltrate of lymphocytes and histiocytes. Direct immunofluorescence microscopy demonstrated strong linear fluorescence along the epithelial-subepithelial junction with IgG and C3. Based on these findings, the diagnosis of MMP was made.
Further testing for bullous pemphigoid antigen 1 (BP230) and bullous pemphigoid antigen 2 (BP180) were negative. On one occasion the patient tested positive for anti-BP230 IgG, but it was at a level judged to be insignificant (7.5 [reference range, <9]). The patient also was negative for autoantibodies against desmoglein 1 and 3. Indirect immunofluorescence using rat bladder epithelium was not performed.
The patient was started on methotrexate and oral prednisone by the rheumatology department, but after 1 week, he presented in respiratory distress and was taken for an emergency tracheostomy. The patient eventually was referred to the dermatology department where methotrexate was discontinued and the patient was started on titrating doses of prednisone and mycophenolate mofetil. Eight weeks later, the patient became completely aphonic and was taken by ENT for dilation of the supraglottic, glottic, and subglottic stenosis with mucosal triamcinolone injections. Doxycycline 100 mg twice daily and nicotinamide 500 mg twice daily was initiated in addition to mycophenolate mofetil 3 g and prednisone 80 mg, but again the patient developed near-complete tracheal stenosis just proximal to the tracheostomy entry site. At 16 weeks, balloon dilation was repeated with dexamethasone injections and topical mitomycin C. Subsequently, the patient regained some use of his voice. Although the next several laryngoscopes showed improvement in the patient’s epiglottis and glottis, the trachea continued to require debridement and dilation.
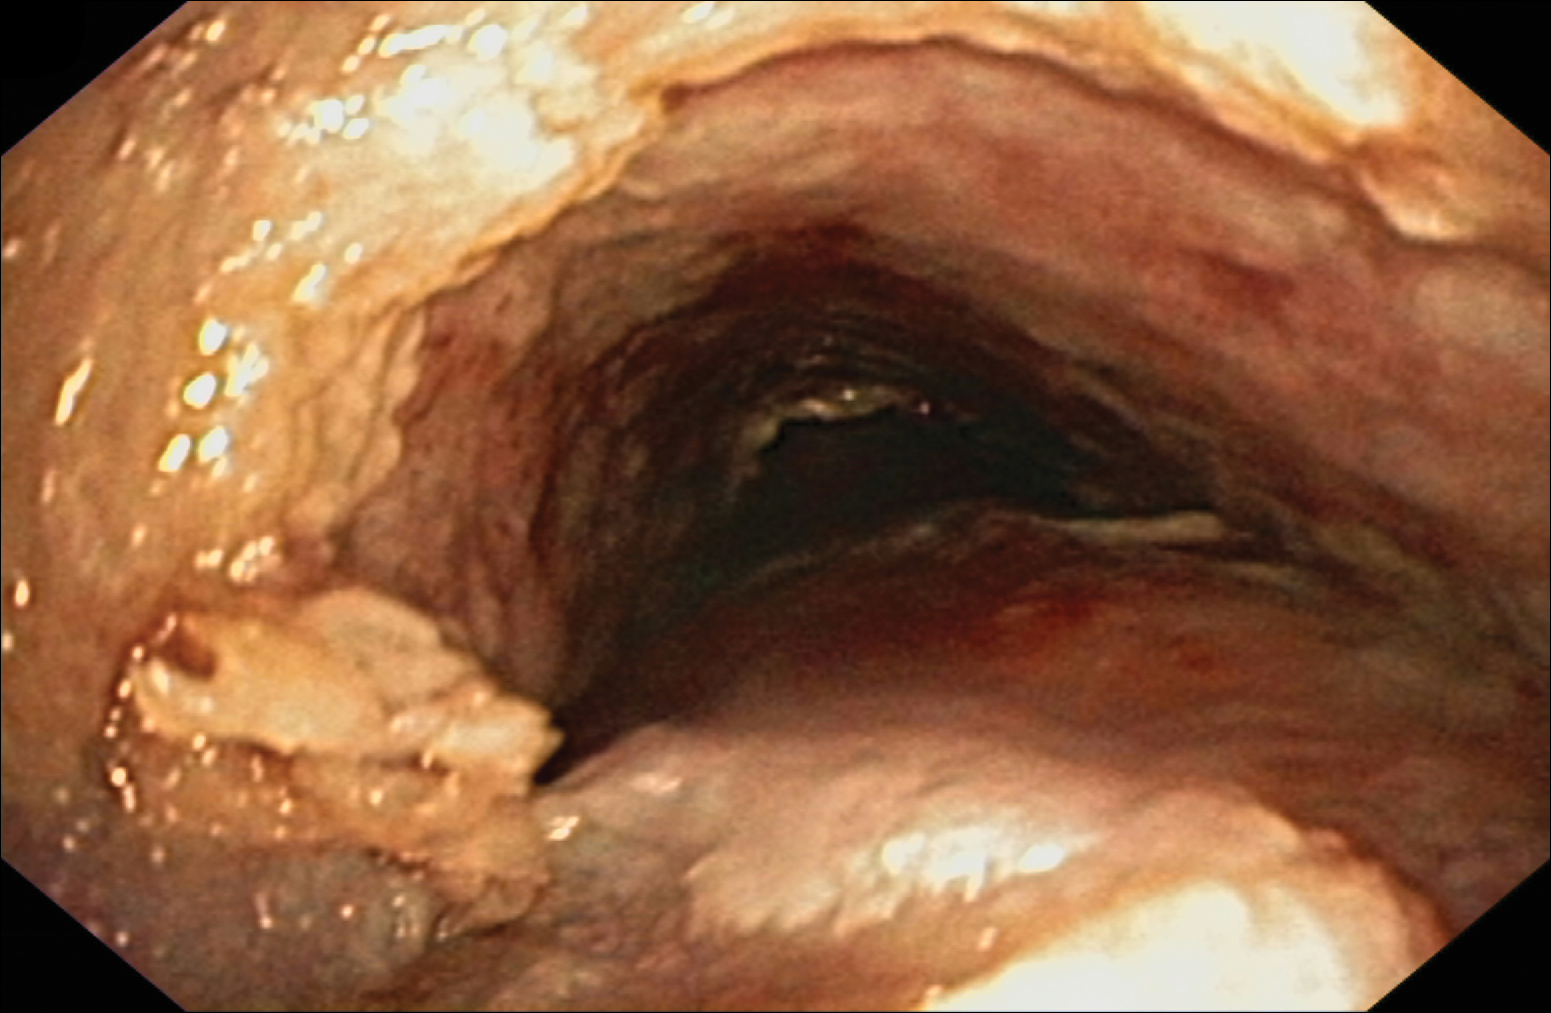
Despite maximal medical therapy and surgical interventions, the patient had little improvement in his voice and large clots of blood obstructed his tracheostomy daily. He was unable to sleep in his preferred position on the stomach (prone) due to dyspnea but had less distress sleeping on his back (supine). The patient was referred to the pulmonology department for an endotracheobronchoscopy to further evaluate the airway. It was discovered that the mucosa of the trachea from the level of the tracheostomy to the carina was friable with active erosions and thick bloody secretions (Figure 1). Lesions extended as far as the scope was able to visualize to the left upper lobe takeoff and the right mainstem bronchus (Figure 2). Biopsies of the carinal mucosa showed 3+/3+ linear fluorescence with IgG along the dermoepidermal junction. Salt-split studies were performed, but because the specimen was fragmented, it was not possible to assess if the fluorescence was present at the floor or at the roof of the split.

Given the severity of disease and failure to respond to other aggressive immunosuppressive therapies as well as having been with a tracheostomy for 22 months, the patient was started on 2 doses of intravenous rituximab 1 g 2 weeks apart along with trimethoprim-sulfamethoxazole (3 times weekly) for pneumocystis pneumonia prophylaxis. No complications were observed during infusions. After 2 rituximab infusions, he was weaned off of prednisone and a repeat bronchoscopy showed no airway ulcers beyond the distal trachea or endobronchial obstruction. However, the subglottic space and area above the tracheostomy showed remarkable stenosis with a cobblestone pattern and granulation tissue with continued narrowing of the subglottic area. The ENT performed further dilation and after 34 months, the tracheostomy was removed and a T-tube was placed. The patient required cleaning out of the T-tube approximately every 3 months, and after 2 years the original T-tube was replaced with a new one. At the time of this report, the ENT recommended removing the T-tube, but the patient was reluctant to do so; therefore, a second T-tube replacement is planned. He continues to do well without relapse and has been off all medical therapy for nearly 4 years.
Mucous membrane pemphigoid is an acquired autoimmune subepithelial blistering disease that predominantly affects mucous membranes with or without skin involvement. This condition has been referred to as cicatricial pemphigoid, oral pemphigoid, and ocular cicatricial pemphigoid, among other names. It is characterized by linear deposition of IgG, IgA, or C3 along the epithelial basement membrane zone. According to the international consensus on MMP, the target antigens identified in the epithelial basement membrane zone include bullous pemphigoid antigen 1 (BP230), bullous pemphigoid antigen 2 (BP180), laminin 5 (α3, β3, γ2 chains), laminin 6 (α3 chain), type VII collagen, and integrin β4 subunit.3 Not all patients with MMP will have circulating autoantibodies to the above components, and although our patient did have detectable anti-BP230 IgG, it was not considered clinically significant. Furthermore, the type of autoantibody does not impact decisions regarding therapy selection.3
Although rare, MMP is well-known to dermatologists and ophthalmologists who manage a large majority of MMP patients depending on which mucosa is involved. Mucous membrane pemphigoid is extremely rare in the lower respiratory tract, and when these lesions are discovered, it often is in the face of life-threatening respiratory distress. Mucous membrane pemphigoid is a challenging disease to treat, even more so when the primary specialty physician is unable to visualize the affected areas. Our patient’s disease was limited primarily to the pharynx, larynx, trachea, and bronchi with few oral lesions. According to a PubMed search of articles indexed for MEDLINE using the terms mucous membrane pemphigus, cicatricial pemphigoid, trachea, bronchus, and fatal, 8 reports (7 case reports and 1 prospective study) of MMP involving the lower respiratory tract have been published.4-11 Of the case reports, each patient also presented with involvement of the eyes or skin.4,5,7-11 Four of these cases were fatal secondary to cardiopulmonary arrest.5,7,9,10 In the prospective study, 110 consecutive patients with clinical, histologic, and immunologic criteria of MMP were examined with a flexible nasopharyngolaryngoscope.6 Thirty-eight patients had nose or throat symptoms but only 10 had laryngeal involvement and 5 had acute dyspnea. The nasal valves, choanae, pharynx, and/or larynx were severely scarred in 7 patients, which was fatal in 3.6
Medical treatment should be based on the following factors of the patient’s disease: site, severity, and rapidity of progression.3 High-risk patients can be defined as those who have lesions at any of the following sites: ocular, genital, nasopharyngeal, esophageal, and laryngeal mucosae. As our patient had involvement at several high-risk sites, in particular sites only visualized by various scoping procedures, a team of physicians including dermatologists, ENT physicians, pulmonologists, and oncologists was necessary to facilitate his care. Scarring is the hallmark of MMP and prevention of scarring is the most important aspect of treatment of MMP. Surgical repair of the previously involved mucosa is difficult, as the tissue is prone to re-scarring and difficult to heal. Over the last several years, there has been increasing evidence for the use of rituximab in autoimmune bullous skin diseases including pemphigus vulgaris, epidermolysis bullosa acquisita, and MMP.12-14 After 2 infusions of rituximab, our patient had clearance of his disease and currently is doing well with a T-tube.
Acknowledgments
We thank Kim Yancey, MD (Dallas, Texas), for providing access to the patient’s diagnostic laboratory immunology and reviewing biopsy specimens; Luis Angel, MD (San Antonio, Texas), for providing bronchoscopy photographs; and C. Blake Simpson, MD (San Antonio, Texas), for co-managing this challenging case.
- James WD, Berger TG, Elston D. Chronic blistering diseases. In: James WD, Berger TG, Elston D. Andrews’ Diseases of the Skin: Clinical Dermatology. 11th ed. Philadelphia, PA: Sanders Elsevier; 2010:448-467.
- Neff AG, Turner M, Mutasim DF. Treatment strategies in mucous membrane pemphigoid. Ther Clin Risk Manag. 2008;4:617-626.
- Chan LS, Ahmed AR, Anhalt GJ, et al. The first international consensus on mucous membrane pemphigoid: definition, diagnostic criteria, pathogenic factors, medical treatment, and prognostic indicators. Arch Dermatol. 2002;138:370-379.
- Kato K, Moriyama Y, Saito H, et al. A case of mucous membrane pemphigoid involving the trachea and bronchus with autoantibodies to β3 subunit of laminin-332. Acta Derm Venereol. 2014;94:237-238.
- Gamm DM, Harris A, Mehran RJ, et al. Mucous membrane pemphigoid with fatal bronchial involvement in a seventeen-year-old girl. Cornea. 2006;25:474-478.
- Alexandre M, Brette MD, Pascal F, et al. A prospective study of upper aerodigestive tract manifestations of mucous membrane pemphigoid. Medicine (Baltimore). 2006;85:239-252.
- de Carvalho CR, Amato MB, Da Silva LM, et al. Obstructive respiratory failure in cicatricial pemphigoid. Thorax. 1989;44:601-602.
- Müller LC, Salzer GM. Stenosis of left mainstem bronchus in a case of cicatricial pemphigoid. Eur J Cardiothorac Surg. 1988;2:284-286.
- Camisa C, Allen CM. Death from CP in a young woman with oral, laryngeal, and bronchial involvement. Cutis. 1987;40:426-429.
- Derbes VJ, Pitot HC, Chernosky ME. Fatal cicatricial mucous membrane pemphigoid of the trachea. Dermatol Trop Ecol Geogr. 1962;1:114-117.
- Wieme N, Lambert J, Moerman M, et al. Epidermolysis bullosa acquisita with combined features of bullous pemphigoid and cicatricial pemphigoid. Dermatology. 1999;198:310-313.
- Taylor J, McMillan R, Shephard M, et al. World Workshop on Oral Medicine VI: a systematic review of the treatment of mucous membrane pemphigoid [published online March 11, 2015]. Oral Surg Oral Med Oral Pathol Oral Radiol. 2015;120:161.e20-171.e20.
- Sobolewska B, Deuter C, Zierhut M. Current medical treatment of ocular mucous membrane pemphigoid [published online July 9, 2013]. Ocul Surf. 2013;11:259-266.
- Maley A, Warren M, Haberman I, et al. Rituximab combined with conventional therapy versus conventional therapy alone for the treatment of mucous membrane pemphigoid (MMP) [published online February 28, 2016]. J Am Acad Dermatol. 2016;74:835-840.
To the Editor:
Mucous membrane pemphigoid (MMP) is an autoimmune blistering disorder that causes subepithelial damage and scarring of mucosal surfaces with or without skin involvement.1 The clinical presentation is highly variable. The oropharynx is the most common site of initial presentation, followed by ocular, nasopharyngeal, anogenital, skin, laryngeal, and esophageal involvement.2 Patients often present to a variety of specialists depending on initial symptoms, and due to the diverse clinical manifestations, MMP often is misdiagnosed. Our patient presented an even greater challenge because the disease progressed to tracheal and bronchial involvement.
A 37-year-old man presented to his primary care physician with a chief concern of a sore throat and oral ulcers. The patient was treated with a course of antibiotics followed by a nystatin oral solution. He continued to develop ulcerative lesions on the soft palate, posterior pharynx, and nasal mucosae. He sought treatment from 2 otolaryngologists (ENTs) and a gastroenterologist, and continued to be treated with multiple oral antibiotics, fluconazole, and topical nystatin. Despite treatment, the patient developed pansinusitis and laryngitis and presented to the ENT department at our institution with severe hoarseness and dyspnea on exertion. Examination by the ENT department revealed ulcerative lesions of the nares with stenosis and ulcers along the soft palate. Videolaryngostroboscopy showed remarkable supraglottic edema with thick endolaryngeal mucus. The patient worked as a funeral director and had notable formaldehyde exposure. He also hunted wild game and performed taxidermy regularly.
The patient was admitted and treated with intravenous dexamethasone for a compromised airway. Subsequently, he was taken to the operating room and had biopsies performed of the posterior pharynx. Given his exposure history, the infectious disease department was consulted and he was evaluated for multiple viral, bacterial, and fungal suspects including leishmania and tularemia. Age-appropriate screening, physical examination, and review of systems were negative for an underlying neoplasm. Histopathologic examination revealed a subepithelial vesicular mucositis with a mixed infiltrate of lymphocytes and histiocytes. Direct immunofluorescence microscopy demonstrated strong linear fluorescence along the epithelial-subepithelial junction with IgG and C3. Based on these findings, the diagnosis of MMP was made.
Further testing for bullous pemphigoid antigen 1 (BP230) and bullous pemphigoid antigen 2 (BP180) were negative. On one occasion the patient tested positive for anti-BP230 IgG, but it was at a level judged to be insignificant (7.5 [reference range, <9]). The patient also was negative for autoantibodies against desmoglein 1 and 3. Indirect immunofluorescence using rat bladder epithelium was not performed.
The patient was started on methotrexate and oral prednisone by the rheumatology department, but after 1 week, he presented in respiratory distress and was taken for an emergency tracheostomy. The patient eventually was referred to the dermatology department where methotrexate was discontinued and the patient was started on titrating doses of prednisone and mycophenolate mofetil. Eight weeks later, the patient became completely aphonic and was taken by ENT for dilation of the supraglottic, glottic, and subglottic stenosis with mucosal triamcinolone injections. Doxycycline 100 mg twice daily and nicotinamide 500 mg twice daily was initiated in addition to mycophenolate mofetil 3 g and prednisone 80 mg, but again the patient developed near-complete tracheal stenosis just proximal to the tracheostomy entry site. At 16 weeks, balloon dilation was repeated with dexamethasone injections and topical mitomycin C. Subsequently, the patient regained some use of his voice. Although the next several laryngoscopes showed improvement in the patient’s epiglottis and glottis, the trachea continued to require debridement and dilation.
Despite maximal medical therapy and surgical interventions, the patient had little improvement in his voice and large clots of blood obstructed his tracheostomy daily. He was unable to sleep in his preferred position on the stomach (prone) due to dyspnea but had less distress sleeping on his back (supine). The patient was referred to the pulmonology department for an endotracheobronchoscopy to further evaluate the airway. It was discovered that the mucosa of the trachea from the level of the tracheostomy to the carina was friable with active erosions and thick bloody secretions (Figure 1). Lesions extended as far as the scope was able to visualize to the left upper lobe takeoff and the right mainstem bronchus (Figure 2). Biopsies of the carinal mucosa showed 3+/3+ linear fluorescence with IgG along the dermoepidermal junction. Salt-split studies were performed, but because the specimen was fragmented, it was not possible to assess if the fluorescence was present at the floor or at the roof of the split.
Given the severity of disease and failure to respond to other aggressive immunosuppressive therapies as well as having been with a tracheostomy for 22 months, the patient was started on 2 doses of intravenous rituximab 1 g 2 weeks apart along with trimethoprim-sulfamethoxazole (3 times weekly) for pneumocystis pneumonia prophylaxis. No complications were observed during infusions. After 2 rituximab infusions, he was weaned off of prednisone and a repeat bronchoscopy showed no airway ulcers beyond the distal trachea or endobronchial obstruction. However, the subglottic space and area above the tracheostomy showed remarkable stenosis with a cobblestone pattern and granulation tissue with continued narrowing of the subglottic area. The ENT performed further dilation and after 34 months, the tracheostomy was removed and a T-tube was placed. The patient required cleaning out of the T-tube approximately every 3 months, and after 2 years the original T-tube was replaced with a new one. At the time of this report, the ENT recommended removing the T-tube, but the patient was reluctant to do so; therefore, a second T-tube replacement is planned. He continues to do well without relapse and has been off all medical therapy for nearly 4 years.
Mucous membrane pemphigoid is an acquired autoimmune subepithelial blistering disease that predominantly affects mucous membranes with or without skin involvement. This condition has been referred to as cicatricial pemphigoid, oral pemphigoid, and ocular cicatricial pemphigoid, among other names. It is characterized by linear deposition of IgG, IgA, or C3 along the epithelial basement membrane zone. According to the international consensus on MMP, the target antigens identified in the epithelial basement membrane zone include bullous pemphigoid antigen 1 (BP230), bullous pemphigoid antigen 2 (BP180), laminin 5 (α3, β3, γ2 chains), laminin 6 (α3 chain), type VII collagen, and integrin β4 subunit.3 Not all patients with MMP will have circulating autoantibodies to the above components, and although our patient did have detectable anti-BP230 IgG, it was not considered clinically significant. Furthermore, the type of autoantibody does not impact decisions regarding therapy selection.3
Although rare, MMP is well-known to dermatologists and ophthalmologists who manage a large majority of MMP patients depending on which mucosa is involved. Mucous membrane pemphigoid is extremely rare in the lower respiratory tract, and when these lesions are discovered, it often is in the face of life-threatening respiratory distress. Mucous membrane pemphigoid is a challenging disease to treat, even more so when the primary specialty physician is unable to visualize the affected areas. Our patient’s disease was limited primarily to the pharynx, larynx, trachea, and bronchi with few oral lesions. According to a PubMed search of articles indexed for MEDLINE using the terms mucous membrane pemphigus, cicatricial pemphigoid, trachea, bronchus, and fatal, 8 reports (7 case reports and 1 prospective study) of MMP involving the lower respiratory tract have been published.4-11 Of the case reports, each patient also presented with involvement of the eyes or skin.4,5,7-11 Four of these cases were fatal secondary to cardiopulmonary arrest.5,7,9,10 In the prospective study, 110 consecutive patients with clinical, histologic, and immunologic criteria of MMP were examined with a flexible nasopharyngolaryngoscope.6 Thirty-eight patients had nose or throat symptoms but only 10 had laryngeal involvement and 5 had acute dyspnea. The nasal valves, choanae, pharynx, and/or larynx were severely scarred in 7 patients, which was fatal in 3.6
Medical treatment should be based on the following factors of the patient’s disease: site, severity, and rapidity of progression.3 High-risk patients can be defined as those who have lesions at any of the following sites: ocular, genital, nasopharyngeal, esophageal, and laryngeal mucosae. As our patient had involvement at several high-risk sites, in particular sites only visualized by various scoping procedures, a team of physicians including dermatologists, ENT physicians, pulmonologists, and oncologists was necessary to facilitate his care. Scarring is the hallmark of MMP and prevention of scarring is the most important aspect of treatment of MMP. Surgical repair of the previously involved mucosa is difficult, as the tissue is prone to re-scarring and difficult to heal. Over the last several years, there has been increasing evidence for the use of rituximab in autoimmune bullous skin diseases including pemphigus vulgaris, epidermolysis bullosa acquisita, and MMP.12-14 After 2 infusions of rituximab, our patient had clearance of his disease and currently is doing well with a T-tube.
Acknowledgments
We thank Kim Yancey, MD (Dallas, Texas), for providing access to the patient’s diagnostic laboratory immunology and reviewing biopsy specimens; Luis Angel, MD (San Antonio, Texas), for providing bronchoscopy photographs; and C. Blake Simpson, MD (San Antonio, Texas), for co-managing this challenging case.
- James WD, Berger TG, Elston D. Chronic blistering diseases. In: James WD, Berger TG, Elston D. Andrews’ Diseases of the Skin: Clinical Dermatology. 11th ed. Philadelphia, PA: Sanders Elsevier; 2010:448-467.
- Neff AG, Turner M, Mutasim DF. Treatment strategies in mucous membrane pemphigoid. Ther Clin Risk Manag. 2008;4:617-626.
- Chan LS, Ahmed AR, Anhalt GJ, et al. The first international consensus on mucous membrane pemphigoid: definition, diagnostic criteria, pathogenic factors, medical treatment, and prognostic indicators. Arch Dermatol. 2002;138:370-379.
- Kato K, Moriyama Y, Saito H, et al. A case of mucous membrane pemphigoid involving the trachea and bronchus with autoantibodies to β3 subunit of laminin-332. Acta Derm Venereol. 2014;94:237-238.
- Gamm DM, Harris A, Mehran RJ, et al. Mucous membrane pemphigoid with fatal bronchial involvement in a seventeen-year-old girl. Cornea. 2006;25:474-478.
- Alexandre M, Brette MD, Pascal F, et al. A prospective study of upper aerodigestive tract manifestations of mucous membrane pemphigoid. Medicine (Baltimore). 2006;85:239-252.
- de Carvalho CR, Amato MB, Da Silva LM, et al. Obstructive respiratory failure in cicatricial pemphigoid. Thorax. 1989;44:601-602.
- Müller LC, Salzer GM. Stenosis of left mainstem bronchus in a case of cicatricial pemphigoid. Eur J Cardiothorac Surg. 1988;2:284-286.
- Camisa C, Allen CM. Death from CP in a young woman with oral, laryngeal, and bronchial involvement. Cutis. 1987;40:426-429.
- Derbes VJ, Pitot HC, Chernosky ME. Fatal cicatricial mucous membrane pemphigoid of the trachea. Dermatol Trop Ecol Geogr. 1962;1:114-117.
- Wieme N, Lambert J, Moerman M, et al. Epidermolysis bullosa acquisita with combined features of bullous pemphigoid and cicatricial pemphigoid. Dermatology. 1999;198:310-313.
- Taylor J, McMillan R, Shephard M, et al. World Workshop on Oral Medicine VI: a systematic review of the treatment of mucous membrane pemphigoid [published online March 11, 2015]. Oral Surg Oral Med Oral Pathol Oral Radiol. 2015;120:161.e20-171.e20.
- Sobolewska B, Deuter C, Zierhut M. Current medical treatment of ocular mucous membrane pemphigoid [published online July 9, 2013]. Ocul Surf. 2013;11:259-266.
- Maley A, Warren M, Haberman I, et al. Rituximab combined with conventional therapy versus conventional therapy alone for the treatment of mucous membrane pemphigoid (MMP) [published online February 28, 2016]. J Am Acad Dermatol. 2016;74:835-840.
Practice Points
- Mucous membrane pemphigoid (MMP) can present with diverse clinical manifestations, making the diagnosis challenging for many clinicians, including experienced dermatologists.
- If not treated early and aggressively, MMP can lead to scarring and is a potentially life-threatening disease.

ASCO updates postmastectomy radiotherapy guideline
The 2001 American Society of Clinical Oncology clinical practice guideline on postmastectomy radiotherapy has been updated to help clinicians and patients decide which cases of T1-T2 breast cancer with one-three positive axillary lymph nodes will not benefit from the treatment. Recent evidence suggests that some subsets of this patient group are likely to have such a low risk of locoregional recurrence that the potential adverse effects of radiotherapy would outweigh its benefit.
“We still don’t have a single, validated formula that can determine who needs postmastectomy radiotherapy, but we hope that the research evidence summarized in this guideline update will help doctors and patients make more informed decisions,” Abram Recht, MD, cochair of the expert panel that developed the update, said in a press statement.
“Thanks to advances in systemic therapy, fewer women need radiation therapy after a mastectomy. This means we can be more selective when recommending this treatment to our patients,” said Dr. Recht of Beth Israel Deaconess Medical Center, Boston.
ASCO, in collaboration with the American Society for Radiation Oncology and the Society of Surgical Oncology, reviewed the literature since 2001, including a meta-analysis of 22 clinical trials involving 8,135 patients who were randomly assigned to receive or not receive postmastectomy radiotherapy. “Our panel focused on the results for the 3,786 women who underwent axillary dissection.” The 10-year rate of locoregional treatment failure was only 4.3% with irradiation, compared with 21.0% without irradiation. The 10-year rate of local or distant treatment failure was 33.8% with irradiation and 45.5% without it, and the 20-year rates of breast cancer mortality were 41.5% and 49.4%, respectively.
“The panel unanimously agreed that the available evidence shows that postmastectomy radiotherapy reduces the risks of locoregional failure, any recurrence, and breast cancer mortality for patients with T1-T2 breast cancer and one-three positive lymph nodes,” according to the guideline.
However, clinicians and patients “should consider factors that may decrease the risk of locoregional failure, attenuate the benefit of reduced breast cancer–specific mortality, and/or increase the risk of complications.” These include older patient age, limited life expectancy, coexisting conditions that affect the risk of complications, small tumor size, absence of lymphovascular invasion, small nodal metastases, substantial response to neoadjuvant systemic therapy, low tumor grade, or strong tumor sensitivity to hormonal therapy, Dr. Recht and his associates said (J Clin Oncol. 2016 Sep 19. doi: 10.1200/JCO.2016.69.1188).
The guideline also addressed other areas of controversy.
Some clinicians now omit performing axillary lymph node dissection if one-two sentinel nodes are positive, “primarily based on extrapolation of data from randomized trials of patients treated exclusively or predominantly with breast-conserving surgery.” In such cases, the updated guideline “recommends that these patients receive postmastectomy radiotherapy only if there is already sufficient information to justify its use without needing to know that additional axillary nodes are involved.”
Many clinicians are uncertain whether to pursue postmastectomy radiotherapy in patients who have received neoadjuvant systemic therapy, because observational studies suggest the risk of locoregional recurrence is low for those who either have clinically negative nodes before undergoing the treatment or have a complete pathologic response to it in the lymph nodes. The panel decided that current evidence is insufficient to recommend whether radiotherapy should be administered or can be omitted in these groups.
The guideline also recommends that regional nodal irradiation generally should target both the internal mammary and the supraclavicular-axillary apical nodes, in addition to the chest wall or reconstructed breast. “There may be subgroups that will experience limited, if any, benefits from treating both these nodal areas, compared with treating only one or perhaps treating only the chest wall or reconstructed breast. [However,] there is insufficient evidence at this time to define such subgroups in detail.”
Copies of the updated guideline, as well as additional information such as details regarding the panel’s methodology, evidence tables, and clinical tools, are avail at www.asco.org/pmrt-guideline and www.asco.org/guidelineswiki.
This work was supported by the American Society of Clinical Oncology, the American Society for Radiation Oncology, and the Society of Surgical Oncology. Dr. Recht reported serving as a consultant or advisor to CareCore and U.S. Oncology and receiving research funding from Genomic Health; his associates reported ties to numerous industry sources.
FROM THE JOURNAL OF CLINICAL ONCOLOGY
Key clinical point: The ASCO clinical practice guideline on postmastectomy radiotherapy has been updated to help clinicians decide which patients who have T1-T2 breast cancer with one-three positive axillary lymph nodes will not benefit from the treatment.
Major finding: The 10-year rate of locoregional treatment failure was only 4.3% with irradiation, compared with 21.0% without irradiation, and the 10-year rate of local or distant treatment failure was 33.8% with irradiation and 45.5% without it.
Data source: A review of the literature and compilation of several treatment recommendations.
Disclosures: This work was supported by the American Society of Clinical Oncology, the American Society for Radiation Oncology, and the Society of Surgical Oncology. Dr. Recht reported serving as a consultant or advisor to CareCore and U.S. Oncology and receiving research funding from Genomic Health; his associates reported ties to numerous industry sources.
Breastfeeding in residency
I had my first child during my third year of medical school, and I remember being embarrassed to tell my attending and residents that I needed to pump. I was at the bottom of the training hierarchy and I didn’t want to ask for “special accommodations.” I remember racing to a separate wing of the hospital to pump during my lunch break (if not taken up by lectures), while devouring a sandwich. It quickly became overwhelming, and by the time my daughter was 3 months old, I started supplementing.
I am currently breastfeeding my second child now as a third year pediatric resident. The experience has been much better. My son is 6 months old and is still breastfed! As a resident, I felt more comfortable making everyone aware of my need to pump periodically during work hours. My coresidents and faculty have been very supportive. In fact, I remember my first month back from maternity leave working in the pediatric ICU. I quickly discovered that nearly every floor of the hospital has a lactation room, including the ICU. One time I was in the middle of pumping when my attending paged me with a nonurgent issue. Once finished, I called back and apologized, explaining the reason for my late response. In return, I received an even bigger apology from my attending, who felt bad for disturbing my pumping session. I was moved.

The American Academy of Pediatrics recommends exclusive breastfeeding of healthy term infants for about 6 months.1 Healthy People 2020 set goals of 82% breastfeeding at birth and 61% at 6 months.2 How do we as trainees do? A study published in 1996 looked at 60 female residents who delivered a child during residency. They found that even though 80% initiated breastfeeding, only 15% were still breastfeeding at 6 months. Only 54% of these residents who were breastfeeding after returning to work felt supported by their attending, and 67% felt supported by their colleagues.3 A more recent study published in 2013 looked at breastfeeding during obstetrics residency. Of 89 female residents who had personal experience with breastfeeding, 73% felt supported by their program directors and faculty; and 84% felt supported by colleagues. The rate of breastfeeding at 6 months was now 52%.4
Compared with 1996, breastfeeding practices during residency appear to have improved with much higher rates at 6 months. However, we are slightly below the Healthy People 2020 goals. For the most part, residents feel supported by their attendings and colleagues. With continued support and attention, these goals are well within reach. When it comes to breastfeeding during training, be your own advocate!
References
1. Pediatrics. 2012 Mar;129(3):e827-41.
3. Pediatrics. 1996 Sep;98(3 Pt 1):434-7.
4. Breastfeed Med. 2013 Aug;8(4):394-400.
Dr. Burek is a third-year pediatric resident at the Medical College of Wisconsin and the Children’s Hospital of Wisconsin, both in Milwaukee.
I had my first child during my third year of medical school, and I remember being embarrassed to tell my attending and residents that I needed to pump. I was at the bottom of the training hierarchy and I didn’t want to ask for “special accommodations.” I remember racing to a separate wing of the hospital to pump during my lunch break (if not taken up by lectures), while devouring a sandwich. It quickly became overwhelming, and by the time my daughter was 3 months old, I started supplementing.
I am currently breastfeeding my second child now as a third year pediatric resident. The experience has been much better. My son is 6 months old and is still breastfed! As a resident, I felt more comfortable making everyone aware of my need to pump periodically during work hours. My coresidents and faculty have been very supportive. In fact, I remember my first month back from maternity leave working in the pediatric ICU. I quickly discovered that nearly every floor of the hospital has a lactation room, including the ICU. One time I was in the middle of pumping when my attending paged me with a nonurgent issue. Once finished, I called back and apologized, explaining the reason for my late response. In return, I received an even bigger apology from my attending, who felt bad for disturbing my pumping session. I was moved.
The American Academy of Pediatrics recommends exclusive breastfeeding of healthy term infants for about 6 months.1 Healthy People 2020 set goals of 82% breastfeeding at birth and 61% at 6 months.2 How do we as trainees do? A study published in 1996 looked at 60 female residents who delivered a child during residency. They found that even though 80% initiated breastfeeding, only 15% were still breastfeeding at 6 months. Only 54% of these residents who were breastfeeding after returning to work felt supported by their attending, and 67% felt supported by their colleagues.3 A more recent study published in 2013 looked at breastfeeding during obstetrics residency. Of 89 female residents who had personal experience with breastfeeding, 73% felt supported by their program directors and faculty; and 84% felt supported by colleagues. The rate of breastfeeding at 6 months was now 52%.4
Compared with 1996, breastfeeding practices during residency appear to have improved with much higher rates at 6 months. However, we are slightly below the Healthy People 2020 goals. For the most part, residents feel supported by their attendings and colleagues. With continued support and attention, these goals are well within reach. When it comes to breastfeeding during training, be your own advocate!
References
1. Pediatrics. 2012 Mar;129(3):e827-41.
3. Pediatrics. 1996 Sep;98(3 Pt 1):434-7.
4. Breastfeed Med. 2013 Aug;8(4):394-400.
Dr. Burek is a third-year pediatric resident at the Medical College of Wisconsin and the Children’s Hospital of Wisconsin, both in Milwaukee.

European guidelines cover entire spectrum of MS treatment
LONDON – New European guidelines on the pharmacologic treatment of multiple sclerosis consider all types of adult patients, including those with clinically isolated syndrome.
In addition to advocating early treatment in clinically isolated syndrome (CIS), the guidelines look at the treatment of relapsing-remitting multiple sclerosis (RRMS) and primary progressive MS (PPMS), and give recommendations on monitoring therapy, what to do if a treatment needs to be stopped or switched, and how to treat in special situations such as pregnancy.
Developed jointly by the European Committee for Treatment and Research in Multiple Sclerosis (ECTRIMS) and the European Academy of Neurology (EAN), the guidelines are the first to formalize how best to use new disease-modifying drugs and strategies in Europe, based on current evidence.

“With several new drugs available in the past years, and others soon to come, this poses a major challenge to advice on a specific treatment for a specific patient,” said Susana Otero-Romero, MD, of the Centre d’Esclerosi Múltiple de Catalunya (CEMCAT) at Vall d’Hebron University Hospital in Barcelona.
Dr. Otero-Romero, who presented some general recommendations from the draft guidelines at the ECTRIMS annual congress, added that evidence-based guidance was needed and so ECTRIMS and EAN convened an expert panel in 2015 to review available data. The focus was on disease-modifying therapies approved by the European Medicines Agency.
The expert panel was chaired by the president of ECTRIMS, Xavier Montalbán, MD, of CEMCAT, and Ralf Gold, MD, of Ruhr-Universität Bochum in Germany, on behalf of the EAN, and included MS experts from across Europe, as well as patient representatives from groups such as the Multiple Sclerosis International Federation and the European Multiple Sclerosis Platform.
The panel followed the EAN’s recently issued framework for developing guidelines (Eur J Neurol. 2015 Dec;22[12]:1505-10) and Dr. Otero-Romero emphasized that the guidelines were built on the evidence base, using GRADE (Grading of Recommendations Assessment, Development Evaluation) methodology, to rate the quality and strength of each recommendation. Where no evidence was found, expert consensus was used.
Dr. Otero-Romero noted that an overall recommendation was that “the entire spectrum of disease-modifying drugs should only be prescribed in centers where there was the infrastructure to provide the proper monitoring of patients, comprehensive assessment, and detection of side effects and how to address them.”
That doesn’t mean patients need to be treated in specialist centers, Dr. Montalbán was keen to point out during discussions. It means that centers who prescribe the expanding range of MS drugs need to have a process to enable them to take good care of patients, monitor them, be aware of side effects, and have the expertise to be able to manage patients if side effects do occur.
“We looked specifically at the subpopulation of patients with CIS,” Dr. Otero-Romero noted, and said the panel decided that treatment with interferon or glatiramer acetate was the best option for CIS patients with an abnormal MRI scan who do not fulfill MS diagnostic criteria.
During discussion, a delegate queried why only injectable drugs were recommended when patients in this early phase of disease would probably be asking for oral treatment. Dr. Otero-Romero responded that this recommendation was based purely on the evidence available. “For now, this would only support starting on interferon or glatiramer acetate,” she said.
For patients with RRMS, defined as multiple relapses, MRI activity, or both, the recommendation is to offer early treatment with disease-modifying drugs. Which drug should be used is not specified, although the guidelines provide general advice on factors to consider when choosing a drug, including patient characteristics and comorbidities, disease severity and activity, the drug’s safety profile, and accessibility to the drug.
“There have not really been any head-to-head comparisons between drugs, so we do not have enough evidence to recommend one over another,” Dr. Otero-Romero said. “If you do not have good evidence you cannot really stratify the drugs and say ‘this one goes first, this one goes second,’ so we still need more evidence.”
For monitoring, consider MRI together with clinical measures. A reference brain MRI, taken within 6 months of starting disease-modifying treatment, is advocated, with a follow-up brain scan at 1 year, although the timing will need to be adjusted based on the drug treatment being used and the level of disease activity.
If there is a poor response to interferon or glatiramer acetate therapy or there is evidence of disease activity, the recommendation is to offer a more efficacious drug. If a highly efficacious drug then needs to be stopped for any reason, another highly efficacious drug should be considered. Factors to consider when switching include the degree of disease activity, which dictates how quickly the switch needs to be made, drugs’ respective half-lives and biological activity, and the potential for rebounding disease activity, particularly with natalizumab (Tysabri).
Although the expert panel has included a recommendation on the use of ocrelizumab for PPMS based on available phase III trial data, this is only if the drug is licensed for use by the EMA by the time the guidelines are published.
“We have agreed on our first set of recommendations. We will probably still work to refine some of these, and we expect to publish at the beginning of next year,” Dr. Otero-Romero said.
Providing independent comment in an interview, Samuel F. Hunter, MD, of the Advanced Neurosciences Institute in Nashville, Tenn., said that the European guidelines were of interest as there were no up-to-date guidelines on drug therapy for MS available in the United States.
While the American Academy of Neurology has produced practice guidelines on the use of disease-modifying therapies in MS (Neurology. 2002;58[2]:169-78) and issued specific guidance on natalizumab (Neurology. 2008;71[10]:766–73), these documents were published years ago. Five new therapies have appeared since then, Dr. Hunter said.
“Guidance is so far behind the advancement of therapy for MS, such that we don’t have any accepted guidelines. The current opinion from various groups is that all therapies should be available for all patients, according to physician advice,” Dr. Hunter said.
“People predominantly follow individual escalation of therapy efficacy guideline for the majority of patients, and people with very severe, fulminant relapses are relegated to higher-efficacy therapies,” he added.
The new European guidelines will influence what is happening in the United States, Dr. Hunter said, but there is such a diversity of interests among the large managed care organizations, the government, payers, pharmaceutical companies, and different academic centers, for example, that reaching a consensus will be difficult.
Dr. Otero-Romero did not declare any specific disclosures in relation to her presentation of the guidelines. Dr. Hunter did not have any disclosure relevant to his comments.
LONDON – New European guidelines on the pharmacologic treatment of multiple sclerosis consider all types of adult patients, including those with clinically isolated syndrome.
In addition to advocating early treatment in clinically isolated syndrome (CIS), the guidelines look at the treatment of relapsing-remitting multiple sclerosis (RRMS) and primary progressive MS (PPMS), and give recommendations on monitoring therapy, what to do if a treatment needs to be stopped or switched, and how to treat in special situations such as pregnancy.
Developed jointly by the European Committee for Treatment and Research in Multiple Sclerosis (ECTRIMS) and the European Academy of Neurology (EAN), the guidelines are the first to formalize how best to use new disease-modifying drugs and strategies in Europe, based on current evidence.
“With several new drugs available in the past years, and others soon to come, this poses a major challenge to advice on a specific treatment for a specific patient,” said Susana Otero-Romero, MD, of the Centre d’Esclerosi Múltiple de Catalunya (CEMCAT) at Vall d’Hebron University Hospital in Barcelona.
Dr. Otero-Romero, who presented some general recommendations from the draft guidelines at the ECTRIMS annual congress, added that evidence-based guidance was needed and so ECTRIMS and EAN convened an expert panel in 2015 to review available data. The focus was on disease-modifying therapies approved by the European Medicines Agency.
The expert panel was chaired by the president of ECTRIMS, Xavier Montalbán, MD, of CEMCAT, and Ralf Gold, MD, of Ruhr-Universität Bochum in Germany, on behalf of the EAN, and included MS experts from across Europe, as well as patient representatives from groups such as the Multiple Sclerosis International Federation and the European Multiple Sclerosis Platform.
The panel followed the EAN’s recently issued framework for developing guidelines (Eur J Neurol. 2015 Dec;22[12]:1505-10) and Dr. Otero-Romero emphasized that the guidelines were built on the evidence base, using GRADE (Grading of Recommendations Assessment, Development Evaluation) methodology, to rate the quality and strength of each recommendation. Where no evidence was found, expert consensus was used.
Dr. Otero-Romero noted that an overall recommendation was that “the entire spectrum of disease-modifying drugs should only be prescribed in centers where there was the infrastructure to provide the proper monitoring of patients, comprehensive assessment, and detection of side effects and how to address them.”
That doesn’t mean patients need to be treated in specialist centers, Dr. Montalbán was keen to point out during discussions. It means that centers who prescribe the expanding range of MS drugs need to have a process to enable them to take good care of patients, monitor them, be aware of side effects, and have the expertise to be able to manage patients if side effects do occur.
“We looked specifically at the subpopulation of patients with CIS,” Dr. Otero-Romero noted, and said the panel decided that treatment with interferon or glatiramer acetate was the best option for CIS patients with an abnormal MRI scan who do not fulfill MS diagnostic criteria.
During discussion, a delegate queried why only injectable drugs were recommended when patients in this early phase of disease would probably be asking for oral treatment. Dr. Otero-Romero responded that this recommendation was based purely on the evidence available. “For now, this would only support starting on interferon or glatiramer acetate,” she said.
For patients with RRMS, defined as multiple relapses, MRI activity, or both, the recommendation is to offer early treatment with disease-modifying drugs. Which drug should be used is not specified, although the guidelines provide general advice on factors to consider when choosing a drug, including patient characteristics and comorbidities, disease severity and activity, the drug’s safety profile, and accessibility to the drug.
“There have not really been any head-to-head comparisons between drugs, so we do not have enough evidence to recommend one over another,” Dr. Otero-Romero said. “If you do not have good evidence you cannot really stratify the drugs and say ‘this one goes first, this one goes second,’ so we still need more evidence.”
For monitoring, consider MRI together with clinical measures. A reference brain MRI, taken within 6 months of starting disease-modifying treatment, is advocated, with a follow-up brain scan at 1 year, although the timing will need to be adjusted based on the drug treatment being used and the level of disease activity.
If there is a poor response to interferon or glatiramer acetate therapy or there is evidence of disease activity, the recommendation is to offer a more efficacious drug. If a highly efficacious drug then needs to be stopped for any reason, another highly efficacious drug should be considered. Factors to consider when switching include the degree of disease activity, which dictates how quickly the switch needs to be made, drugs’ respective half-lives and biological activity, and the potential for rebounding disease activity, particularly with natalizumab (Tysabri).
Although the expert panel has included a recommendation on the use of ocrelizumab for PPMS based on available phase III trial data, this is only if the drug is licensed for use by the EMA by the time the guidelines are published.
“We have agreed on our first set of recommendations. We will probably still work to refine some of these, and we expect to publish at the beginning of next year,” Dr. Otero-Romero said.
Providing independent comment in an interview, Samuel F. Hunter, MD, of the Advanced Neurosciences Institute in Nashville, Tenn., said that the European guidelines were of interest as there were no up-to-date guidelines on drug therapy for MS available in the United States.
While the American Academy of Neurology has produced practice guidelines on the use of disease-modifying therapies in MS (Neurology. 2002;58[2]:169-78) and issued specific guidance on natalizumab (Neurology. 2008;71[10]:766–73), these documents were published years ago. Five new therapies have appeared since then, Dr. Hunter said.
“Guidance is so far behind the advancement of therapy for MS, such that we don’t have any accepted guidelines. The current opinion from various groups is that all therapies should be available for all patients, according to physician advice,” Dr. Hunter said.
“People predominantly follow individual escalation of therapy efficacy guideline for the majority of patients, and people with very severe, fulminant relapses are relegated to higher-efficacy therapies,” he added.
The new European guidelines will influence what is happening in the United States, Dr. Hunter said, but there is such a diversity of interests among the large managed care organizations, the government, payers, pharmaceutical companies, and different academic centers, for example, that reaching a consensus will be difficult.
Dr. Otero-Romero did not declare any specific disclosures in relation to her presentation of the guidelines. Dr. Hunter did not have any disclosure relevant to his comments.
AT ECTRIMS 2016
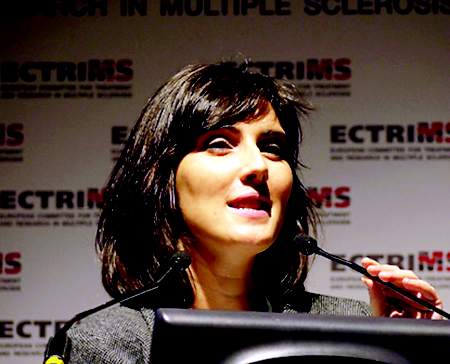
Decision rule identifies unprovoked VTE patients who can halt anticoagulation
ROME – Half of all women who experience a first unprovoked venous thromboembolism (VTE) can safely be spared lifelong anticoagulation through application of the newly validated HERDOO2 decision rule, Marc A. Rodger, MD, reported at the annual congress of the European Society of Cardiology.
“We’ve validated that a simple, memorable decision rule on anticoagulation applied at the clinically relevant time point works. And it is the only clinical decision rule that has now been prospectively validated,” said Dr. Rodger, professor of medicine, chief and chair of the division of hematology, and head of the thrombosis program at the University of Ottawa.

He presented the results of the validation study, known as the REVERSE II study, which included 2,779 patients with a first unprovoked VTE at 44 centers in seven countries. The full name of the decision rule is “Men Continue and HERDOO2,” a name that says it all: the rule posits that all men as well as those women with a HERDOO2 (Hyperpigmentation, Edema, Redness, d-dimer, Obesity, Older age, 2 or more points) score of at least 2 out of a possible 4 points need to stay on anticoagulation indefinitely because their risk of a recurrent VTE off-therapy clearly exceeds that of a bleeding event on-therapy. In contrast, women with a HERDOO2 score of 0 or 1 can safely stop anticoagulation after the standard 3-6 months of acute short-term therapy.
“Sorry, gentlemen, but we could find no low-risk group of men. They were all high risk,” he said. “But 50% of women with unprovoked vein blood clots can be spared the burdens, costs, and risks of lifelong blood thinners.”
Dr. Rodger and coinvestigators began work on developing a multivariate clinical decision rule in 2001. They examined 69 risk predictors, eventually winnowing down to a manageable four potent risk predictors identified by the acronym HERDOO2.
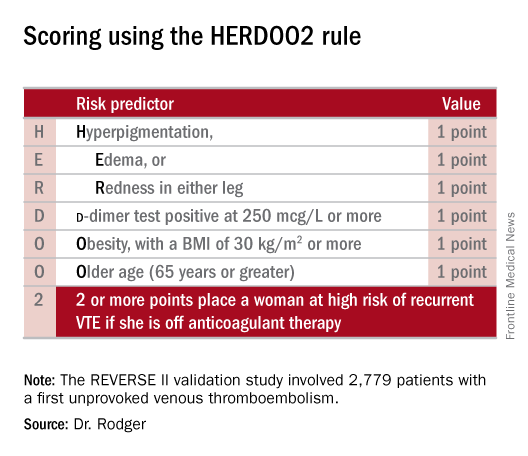
The derivation study was published 8 years ago (CMAJ. 2008;Aug 26;179[5]:417-26). It showed that women with a HERDOO2 score of 2 or more as well as all men had roughly a 14% rate of recurrent VTE in the first year after stopping anticoagulation, while women with a score of 0 or 1 had about a 1.6% risk. The International Society on Thrombosis and Haemostasis suggests that it’s safe to discontinue anticoagulants if the risk of recurrent thrombosis at 1 year off-therapy is less than 5%, given the significant risk of serious bleeding on-therapy and the fact that a serious bleed event is two to three times more likely than a VTE to be fatal.
Dr. Rodger and coinvestigators recognized that a clinical decision rule needs to be externally validated before it’s ready for prime-time use in clinical practice. Thus, they conducted the REVERSE II study, in which the decision rule was applied after the 2,799 participants had been on anticoagulation for 5-12 months. All had a first proximal deep vein thrombosis and/or a segmental or greater pulmonary embolism. Patients were still on anticoagulation at the time the rule was applied, which is why the cut point for a positive d-dimer test in HERDOO2 is 250 mcg/L, half of the threshold value for a positive test in patients not on anticoagulation.
They identified 631 women as low risk, with a HERDOO2 score of 0 or 1. They and their physicians were instructed to stop anticoagulation at that time. The 2,148 high-risk subjects – that is, all of the men and the high-risk women – were advised to remain on anticoagulation. The primary study endpoint was the rate of recurrent VTE in the 12 months following testing and patient guidance. The lost-to-follow-up rate was 2.2%.
The recurrent VTE rate was 3% in the 591 low-risk women who discontinued anticoagulants and zero in 31 others who elected to stay on medication. In the high-risk group identified by the HERDOO2 rule, the recurrent VTE rate at 12 months was 8.1% in the 323 who opted to discontinue anticoagulants and just 1.6% in 1,802 who continued on therapy as advised, a finding that underscores the effectiveness of selectively applied long-term anticoagulation therapy, he continued.
The recurrent VTE rate among the 291 women with a HERDOO2 score of 0 or 1 who were on exogenous estrogen was 1.4%, while in high-risk women taking estrogen the rate was more than doubled at 3.1%. But in women aged 50-64 identified by the HERDOO2 rule as being low risk, the actual recurrent VTE rate was 5.7%, a finding that raised a red flag for the investigators.
“There may be an evolution of the HERDOO2 decision rule to a lower age cut point. But that’s something that requires further study in postmenopausal women,” according to Dr. Rodger.
The investigators defined a first unprovoked VTE as one occurring in the absence during the previous 90 days of major surgery, a fracture or cast, more than 3 days of immobilization, or malignancy within the last 5 years.
Venous thromboembolism is the second most common cardiovascular disorder and the third most common cause of cardiovascular death. Unprovoked VTEs account for half of all VTEs. Their management has been a controversial subject. Both the American College of Chest Physicians and the European Society of Cardiology recommend continuing anticoagulation indefinitely in patients who aren’t at high bleeding risk.
“But this is a relatively weak 2B recommendation because of the tightly balanced competing risks of recurrent thrombosis off anticoagulation and major bleeding on anticoagulation,” Dr. Rodger said. He added that he considers REVERSE II to be practice changing, and predicted that once the results are published the guidelines will be revised.
Discussant Giancarlo Agnelli, MD, was a tough critic who gave fair warning.
“I am friends with many of the authors of this paper, and in this country we are usually gentle with enemies and nasty with friends,” declared Dr. Agnelli, professor of internal medicine and director of internal and cardiovascular medicine and the stroke unit at the University of Perugia, Italy.
He didn’t find the REVERSE II study or the HERDOO2 rule persuasive. On the plus side, he said, the HERDOO2 rule has now been validated, unlike the proposed DASH and Vienna rules. And it was tested in a diverse multinational patient population. But the fact that the HERDOO2 rule is only applicable in women is a major limitation. And REVERSE II was not a randomized trial, Dr. Agnelli noted.
Moreover, 1 year of follow-up seems insufficient, he continued. He cited a French multicenter trial in which patients with a first unprovoked VTE received 6 months of anticoagulants and were then randomized to another 18 months of anticoagulation or placebo. During that 18 months, the group on anticoagulants had a significantly lower rate of the composite endpoint comprised of recurrent VTE or major bleeding, but once that period was over they experienced catchup. By the time the study ended at 42 months, the two study arms didn’t differ significantly in the composite endpoint (JAMA. 2015 Jul 7;314[1]:31-40).
More broadly, Dr. Agnelli also questioned the need for an anticoagulation discontinuation rule in the contemporary era of new oral anticoagulants (NOACs). He was lead investigator in the AMPLIFY study, a major randomized trial of fixed-dose apixaban (Eliquis) versus conventional therapy with subcutaneous enoxaparin (Lovenox) bridging to warfarin in 5,395 patients with acute VTE. The NOAC was associated with a 69% reduction in the relative risk of bleeding and was noninferior to standard therapy in the risk of recurrent VTE (N Engl J Med. 2013 Aug 29;369[9]:799-808).
“Why should we think about withholding anticoagulation in some patients when we now have such a safe approach?” he asked.
Dr. Rodger reported receiving research grants from the French government as well as from Biomerieux, which funded the REVERSE II study. Dr. Agnelli reported having no financial conflicts.
ROME – Half of all women who experience a first unprovoked venous thromboembolism (VTE) can safely be spared lifelong anticoagulation through application of the newly validated HERDOO2 decision rule, Marc A. Rodger, MD, reported at the annual congress of the European Society of Cardiology.
“We’ve validated that a simple, memorable decision rule on anticoagulation applied at the clinically relevant time point works. And it is the only clinical decision rule that has now been prospectively validated,” said Dr. Rodger, professor of medicine, chief and chair of the division of hematology, and head of the thrombosis program at the University of Ottawa.
He presented the results of the validation study, known as the REVERSE II study, which included 2,779 patients with a first unprovoked VTE at 44 centers in seven countries. The full name of the decision rule is “Men Continue and HERDOO2,” a name that says it all: the rule posits that all men as well as those women with a HERDOO2 (Hyperpigmentation, Edema, Redness, d-dimer, Obesity, Older age, 2 or more points) score of at least 2 out of a possible 4 points need to stay on anticoagulation indefinitely because their risk of a recurrent VTE off-therapy clearly exceeds that of a bleeding event on-therapy. In contrast, women with a HERDOO2 score of 0 or 1 can safely stop anticoagulation after the standard 3-6 months of acute short-term therapy.
“Sorry, gentlemen, but we could find no low-risk group of men. They were all high risk,” he said. “But 50% of women with unprovoked vein blood clots can be spared the burdens, costs, and risks of lifelong blood thinners.”
Dr. Rodger and coinvestigators began work on developing a multivariate clinical decision rule in 2001. They examined 69 risk predictors, eventually winnowing down to a manageable four potent risk predictors identified by the acronym HERDOO2.
The derivation study was published 8 years ago (CMAJ. 2008;Aug 26;179[5]:417-26). It showed that women with a HERDOO2 score of 2 or more as well as all men had roughly a 14% rate of recurrent VTE in the first year after stopping anticoagulation, while women with a score of 0 or 1 had about a 1.6% risk. The International Society on Thrombosis and Haemostasis suggests that it’s safe to discontinue anticoagulants if the risk of recurrent thrombosis at 1 year off-therapy is less than 5%, given the significant risk of serious bleeding on-therapy and the fact that a serious bleed event is two to three times more likely than a VTE to be fatal.
Dr. Rodger and coinvestigators recognized that a clinical decision rule needs to be externally validated before it’s ready for prime-time use in clinical practice. Thus, they conducted the REVERSE II study, in which the decision rule was applied after the 2,799 participants had been on anticoagulation for 5-12 months. All had a first proximal deep vein thrombosis and/or a segmental or greater pulmonary embolism. Patients were still on anticoagulation at the time the rule was applied, which is why the cut point for a positive d-dimer test in HERDOO2 is 250 mcg/L, half of the threshold value for a positive test in patients not on anticoagulation.
They identified 631 women as low risk, with a HERDOO2 score of 0 or 1. They and their physicians were instructed to stop anticoagulation at that time. The 2,148 high-risk subjects – that is, all of the men and the high-risk women – were advised to remain on anticoagulation. The primary study endpoint was the rate of recurrent VTE in the 12 months following testing and patient guidance. The lost-to-follow-up rate was 2.2%.
The recurrent VTE rate was 3% in the 591 low-risk women who discontinued anticoagulants and zero in 31 others who elected to stay on medication. In the high-risk group identified by the HERDOO2 rule, the recurrent VTE rate at 12 months was 8.1% in the 323 who opted to discontinue anticoagulants and just 1.6% in 1,802 who continued on therapy as advised, a finding that underscores the effectiveness of selectively applied long-term anticoagulation therapy, he continued.
The recurrent VTE rate among the 291 women with a HERDOO2 score of 0 or 1 who were on exogenous estrogen was 1.4%, while in high-risk women taking estrogen the rate was more than doubled at 3.1%. But in women aged 50-64 identified by the HERDOO2 rule as being low risk, the actual recurrent VTE rate was 5.7%, a finding that raised a red flag for the investigators.
“There may be an evolution of the HERDOO2 decision rule to a lower age cut point. But that’s something that requires further study in postmenopausal women,” according to Dr. Rodger.
The investigators defined a first unprovoked VTE as one occurring in the absence during the previous 90 days of major surgery, a fracture or cast, more than 3 days of immobilization, or malignancy within the last 5 years.
Venous thromboembolism is the second most common cardiovascular disorder and the third most common cause of cardiovascular death. Unprovoked VTEs account for half of all VTEs. Their management has been a controversial subject. Both the American College of Chest Physicians and the European Society of Cardiology recommend continuing anticoagulation indefinitely in patients who aren’t at high bleeding risk.
“But this is a relatively weak 2B recommendation because of the tightly balanced competing risks of recurrent thrombosis off anticoagulation and major bleeding on anticoagulation,” Dr. Rodger said. He added that he considers REVERSE II to be practice changing, and predicted that once the results are published the guidelines will be revised.
Discussant Giancarlo Agnelli, MD, was a tough critic who gave fair warning.
“I am friends with many of the authors of this paper, and in this country we are usually gentle with enemies and nasty with friends,” declared Dr. Agnelli, professor of internal medicine and director of internal and cardiovascular medicine and the stroke unit at the University of Perugia, Italy.
He didn’t find the REVERSE II study or the HERDOO2 rule persuasive. On the plus side, he said, the HERDOO2 rule has now been validated, unlike the proposed DASH and Vienna rules. And it was tested in a diverse multinational patient population. But the fact that the HERDOO2 rule is only applicable in women is a major limitation. And REVERSE II was not a randomized trial, Dr. Agnelli noted.
Moreover, 1 year of follow-up seems insufficient, he continued. He cited a French multicenter trial in which patients with a first unprovoked VTE received 6 months of anticoagulants and were then randomized to another 18 months of anticoagulation or placebo. During that 18 months, the group on anticoagulants had a significantly lower rate of the composite endpoint comprised of recurrent VTE or major bleeding, but once that period was over they experienced catchup. By the time the study ended at 42 months, the two study arms didn’t differ significantly in the composite endpoint (JAMA. 2015 Jul 7;314[1]:31-40).
More broadly, Dr. Agnelli also questioned the need for an anticoagulation discontinuation rule in the contemporary era of new oral anticoagulants (NOACs). He was lead investigator in the AMPLIFY study, a major randomized trial of fixed-dose apixaban (Eliquis) versus conventional therapy with subcutaneous enoxaparin (Lovenox) bridging to warfarin in 5,395 patients with acute VTE. The NOAC was associated with a 69% reduction in the relative risk of bleeding and was noninferior to standard therapy in the risk of recurrent VTE (N Engl J Med. 2013 Aug 29;369[9]:799-808).
“Why should we think about withholding anticoagulation in some patients when we now have such a safe approach?” he asked.
Dr. Rodger reported receiving research grants from the French government as well as from Biomerieux, which funded the REVERSE II study. Dr. Agnelli reported having no financial conflicts.
AT THE ESC CONGRESS 2016
Key clinical point: Half of women who have a first unprovoked venous thromboembolism can safely be spared lifelong anticoagulation through application of the newly validated HERDOO2 decision rule.
Major finding: Women with a first unprovoked venous thromboembolism identified as being at low risk of recurrence on the basis of the HERDOO2 decision rule had a 3% recurrence rate in the year after stopping anticoagulation therapy, while those identified as high risk had an 8.1% recurrence rate if they discontinued anticoagulants.
Data source: This was a prospective, multinational, observational study involving 2,779 patients with a first unprovoked venous thromboembolism.
Disclosures: The presenter reported receiving research grants from the French government as well as from Biomerieux, which funded the REVERSE II study.
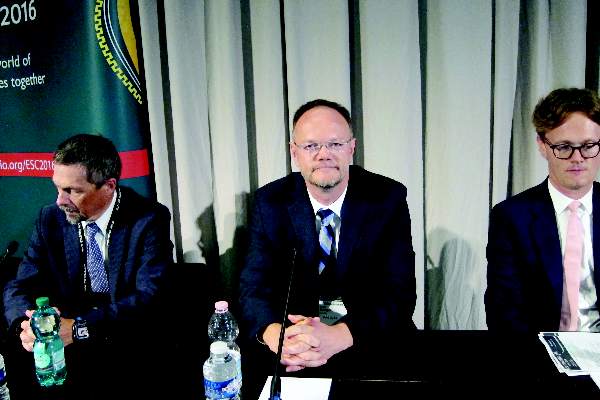
Simtuzumab did not help IPF patients
LONDON – Despite very promising activity in animal models of idiopathic pulmonary fibrosis (IPF), a monoclonal antibody targeted at an enzyme considered to be important to collagen cross-linking did not produce any improvement in progression-free survival (PFS), according to results of a multicenter study presented at the annual congress of the European Respiratory Society.
“This was such a negative study, there is no point in doing another,” reported Ganesh Raghu, MD, director of the Pulmonary Fibrosis Program at the University of Washington Medical Center, Seattle.

The focus of this study was simtuzumab, a monoclonal antibody targeted at lysyl oxidase like 2 (LOXL2), an enzyme which catalyzes a step in the formation of collagen crosslinks, which are thought to be important in fibrosis formation. Simtuzumab has been entered into clinical trials for treatment of several forms of fibrosis, including fibrosis in the liver.
“In animal models, simtuzumab has demonstrated efficacy in reducing fibrosis when administered prior to fibrosis formation or after the process has already begun,” Dr. Raghu explained. He said a large trial was initiated in IPF because the agent seemed so promising and because a large study was thought to be the best strategy to arrive at a definitive answer regarding safety and efficacy.
The drug was found safe but not effective. The independent data monitoring and safety committee terminated the trial early for futility.
In the study, 544 IPF patients were randomized to 125 mg simtuzumab or placebo administered subcutaneously once weekly. The primary endpoint was PFS, but there were a large number of secondary endpoints including hospitalization for progressive disease, change in 6-minute walk distance (6MWD), and overall survival.
For the endpoint of PFS, “there was absolutely no difference” between the groups receiving simtuzumab or placebo. When the patients were stratified for demonstrating above or below median expression of LOXL2, which was a prespecified analysis for the trial, there was still no difference between groups. Even when those in the top quarter percentile of LOXL2 expression were compared with those with less [expression of the enzyme], there was still “absolutely no difference.”
There was also no significant evidence of benefit for simtuzumab observed on key secondary endpoints, such as overall survival. When patients were stratified by baseline lung function as expressed by percentage of predicted forced expiratory volume in 1 second (FEV1), there was no signal of benefit for those with severe, moderate, or mild impairment.
One criticism of this study raised after the presentation was that patients with 26% or greater of predicted FEV1 were permitted into the study. It was suggested that such patients would be expected to already have a high degree of fibrosis and therefore would be less likely to benefit from an antifibrosis therapy. Dr. Raghu acknowledged this criticism, but he said it was important to include patients with advanced disease in order to generate an adequate event rate. Even with inclusion of patients with severe lung impairment, the mortality rate was less than 10%.
He concluded that there was no signal of benefit even among those with the greatest expression of the target.
“We absolutely need better markers for IPF,” Dr. Raghu maintained. While other members of the LOXL family of enzymes may still prove to be valuable markers of IPF risk and targets of therapy, these data appear to rule out a therapeutic role for blocking LOXL2.
Dr. Raghu is a consultant for Boehringer Ingelheim, Biogen, FibroGen, Gilead, Janssen, MedImmune, Promedior, Sanofi-Aventis, and Veracyte.
LONDON – Despite very promising activity in animal models of idiopathic pulmonary fibrosis (IPF), a monoclonal antibody targeted at an enzyme considered to be important to collagen cross-linking did not produce any improvement in progression-free survival (PFS), according to results of a multicenter study presented at the annual congress of the European Respiratory Society.
“This was such a negative study, there is no point in doing another,” reported Ganesh Raghu, MD, director of the Pulmonary Fibrosis Program at the University of Washington Medical Center, Seattle.
The focus of this study was simtuzumab, a monoclonal antibody targeted at lysyl oxidase like 2 (LOXL2), an enzyme which catalyzes a step in the formation of collagen crosslinks, which are thought to be important in fibrosis formation. Simtuzumab has been entered into clinical trials for treatment of several forms of fibrosis, including fibrosis in the liver.
“In animal models, simtuzumab has demonstrated efficacy in reducing fibrosis when administered prior to fibrosis formation or after the process has already begun,” Dr. Raghu explained. He said a large trial was initiated in IPF because the agent seemed so promising and because a large study was thought to be the best strategy to arrive at a definitive answer regarding safety and efficacy.
The drug was found safe but not effective. The independent data monitoring and safety committee terminated the trial early for futility.
In the study, 544 IPF patients were randomized to 125 mg simtuzumab or placebo administered subcutaneously once weekly. The primary endpoint was PFS, but there were a large number of secondary endpoints including hospitalization for progressive disease, change in 6-minute walk distance (6MWD), and overall survival.
For the endpoint of PFS, “there was absolutely no difference” between the groups receiving simtuzumab or placebo. When the patients were stratified for demonstrating above or below median expression of LOXL2, which was a prespecified analysis for the trial, there was still no difference between groups. Even when those in the top quarter percentile of LOXL2 expression were compared with those with less [expression of the enzyme], there was still “absolutely no difference.”
There was also no significant evidence of benefit for simtuzumab observed on key secondary endpoints, such as overall survival. When patients were stratified by baseline lung function as expressed by percentage of predicted forced expiratory volume in 1 second (FEV1), there was no signal of benefit for those with severe, moderate, or mild impairment.
One criticism of this study raised after the presentation was that patients with 26% or greater of predicted FEV1 were permitted into the study. It was suggested that such patients would be expected to already have a high degree of fibrosis and therefore would be less likely to benefit from an antifibrosis therapy. Dr. Raghu acknowledged this criticism, but he said it was important to include patients with advanced disease in order to generate an adequate event rate. Even with inclusion of patients with severe lung impairment, the mortality rate was less than 10%.
He concluded that there was no signal of benefit even among those with the greatest expression of the target.
“We absolutely need better markers for IPF,” Dr. Raghu maintained. While other members of the LOXL family of enzymes may still prove to be valuable markers of IPF risk and targets of therapy, these data appear to rule out a therapeutic role for blocking LOXL2.
Dr. Raghu is a consultant for Boehringer Ingelheim, Biogen, FibroGen, Gilead, Janssen, MedImmune, Promedior, Sanofi-Aventis, and Veracyte.
AT THE ERS CONGRESS 2016
Key clinical point: A large multicenter trial with simtuzumab in idiopathic pulmonary fibrosis failed to generate a hint of benefit.
Major finding: In this study, efficacy was not seen even in those with high expression of the simtuzumab target, lysyl oxidase like 2 (LOXL2).
Data source: Phase II multicenter, placebo-controlled trial.
Disclosures: Dr. Raghu is a consultant for Boehringer Ingelheim, Biogen, FibroGen, Gilead, Janssen, MedImmune, Promedior, Sanofi-Aventis, and Veracyte.
More TOPCAT flaws back spironolactone’s HFpEF efficacy
ORLANDO – Spironolactone inched a little closer toward becoming the first and only agent with proven efficacy for treating patients with heart failure with preserved ejection fraction based on further evidence for the drug’s efficacy in a subgroup of patients enrolled in the TOPCAT trial.
In 2014, the initial TOPCAT (Treatment of Preserved Cardiac Function Heart Failure with an Aldosterone Antagonist) report showed that spironolactone treatment of patients with heart failure with preserved ejection fraction (HFpEF) for 3 years produced a small, 11% relative reduction in the primary risk endpoint, compared with placebo that was not statistically significant (N Engl J Med. 2014 Apr 10;370[15]:1383-92).
But a follow-up post hoc analysis a year later showed evidence that the roughly half of patients in TOPCAT enrolled at centers in Russia and the Republic of Georgia may not have had HFpEF and also may not have received the planned dosage of spironolactone (Circulation. 2015 Jan 6;131[1]:34-42). An analysis that focused only on the 1,767 HFpEF patients (51% of the total TOPCAT cohort) enrolled in the Americas (United States, Canada, Argentina, and Brazil) showed that, compared with placebo, treatment with spironolactone cut the combined rate of cardiovascular death, nonfatal cardiac arrest, and heart failure hospitalization by 4.5 percentage points, an 18% relative risk reduction that was statistically significant. In the Americas, spironolactone also cut cardiovascular death alone by a relative 26%, and reduced heart failure hospitalization by a relative 18%, both statistically significant.
Additional analysis reported at the annual scientific meeting of the Heart Failure Society of America further supported the idea that many TOPCAT patients enrolled in Russia did not receive a physiologically meaningful dosage of spironolactone. Among 66 Russian patients randomized to the spironolactone arm who reported taking their drug as prescribed and who participated in a random draw of blood specimens 1 year into the study, 20 (30%) failed to show detectable blood levels of canrenone, a characteristic spironolactone metabolite, reported Eileen O’Meara, MD, at the meeting. In contrast, 2 (3%) of 76 enrolled U.S. patients failed to show detectable blood levels of the canrenone metabolite, a 10-fold difference said Dr. O’Meara, a cardiologist at the Montreal Heart Institute.The tested U.S. patients also showed a clear dose-response relationship between their reported spironolactone dosage and their canrenone levels, something not seen in the Russian patients. These new findings, plus the evidence cited in the 2015 analysis, create a compelling case that “actual use of spironolactone in Russia was lower than reported” by the trial participants in Russia and probably in Georgia as well, Dr. O’Meara said. The implication is that spironolactone’s real impact on HFpEF patients is best represented in the 51% of TOPCAT patients from the Americas, she added.
“We believe these findings emphasize the reliability of the Americas data,” said Marc A. Pfeffer, MD, a coinvestigator for TOPCAT and lead author of the 2015 post hoc analysis. “Until someone comes up with a better treatment for patients with HFpEF, we should pay attention to this. People need to get this message. And spironolactone costs 7 cents a day,” said Dr. Pfeffer, professor of medicine at Harvard Medical School in Boston.Currently, no agent is considered proven effective for improving outcomes in HFpEF patients. The 2016 guidelinesfor heart failure treatment from the European Society of Cardiology said “no treatment has yet been shown, convincingly, to reduce morbidity or mortality in patients with HFpEF.”
After the TOPCAT results and post hoc analysis came out in 2014 and 2015 and word spread of spironolactone’s apparent efficacy in the American half of the trial, use of spironolactone to treat HFpEF patient has increased, commented Margaret M. Redfield, MD, a heart failure physician and professor at the Mayo Clinic in Rochester, Minn. She said she often prescribes spironolactone patients to HFpEF patients who require potassium supplementation, generally because of their diuretic treatment. These are the “safest” HFpEF patients for spironolactone treatment, she said, because they face the lowest risk for hyperkalemia, the major adverse effect from spironolactone.
On Twitter @mitchelzoler
This is extraordinarily important information from an extraordinarily important study. I’m strongly persuaded that the data from the Americas in TOPCAT show that spironolactone worked. The new data presented on canrenone levels make me even more ready to exclude from consideration the TOPCAT data from Russia and Georgia.
|
| Mitchel L. Zoler/Frontline Medical News Dr. Barry H. Greenberg |
The heart failure community is left to decide what conclusions to draw from TOPCAT. I think guideline committees will struggle over what to make of the TOPCAT evidence. Any recommendation in favor of spironolactone needs to be somewhat guarded, but if a group made recommendations in support of spironolactone it would add an impetus for using it.
There has been long-standing interest in treating patients with heart failure with preserved ejection fraction with spironolactone. Currently, about a quarter of these patients take spironolactone. I’m not sure this level of use will increase dramatically because of what we now know about TOPCAT.
Dr. Barry H. Greenberg is professor of medicine and director of the advanced heart failure treatment program at the University of California, San Diego. He had no relevant disclosures. He made these comments in an interview.
This is extraordinarily important information from an extraordinarily important study. I’m strongly persuaded that the data from the Americas in TOPCAT show that spironolactone worked. The new data presented on canrenone levels make me even more ready to exclude from consideration the TOPCAT data from Russia and Georgia.
|
|
| Mitchel L. Zoler/Frontline Medical News Dr. Barry H. Greenberg |
The heart failure community is left to decide what conclusions to draw from TOPCAT. I think guideline committees will struggle over what to make of the TOPCAT evidence. Any recommendation in favor of spironolactone needs to be somewhat guarded, but if a group made recommendations in support of spironolactone it would add an impetus for using it.
There has been long-standing interest in treating patients with heart failure with preserved ejection fraction with spironolactone. Currently, about a quarter of these patients take spironolactone. I’m not sure this level of use will increase dramatically because of what we now know about TOPCAT.
Dr. Barry H. Greenberg is professor of medicine and director of the advanced heart failure treatment program at the University of California, San Diego. He had no relevant disclosures. He made these comments in an interview.
ORLANDO – Spironolactone inched a little closer toward becoming the first and only agent with proven efficacy for treating patients with heart failure with preserved ejection fraction based on further evidence for the drug’s efficacy in a subgroup of patients enrolled in the TOPCAT trial.
In 2014, the initial TOPCAT (Treatment of Preserved Cardiac Function Heart Failure with an Aldosterone Antagonist) report showed that spironolactone treatment of patients with heart failure with preserved ejection fraction (HFpEF) for 3 years produced a small, 11% relative reduction in the primary risk endpoint, compared with placebo that was not statistically significant (N Engl J Med. 2014 Apr 10;370[15]:1383-92).
But a follow-up post hoc analysis a year later showed evidence that the roughly half of patients in TOPCAT enrolled at centers in Russia and the Republic of Georgia may not have had HFpEF and also may not have received the planned dosage of spironolactone (Circulation. 2015 Jan 6;131[1]:34-42). An analysis that focused only on the 1,767 HFpEF patients (51% of the total TOPCAT cohort) enrolled in the Americas (United States, Canada, Argentina, and Brazil) showed that, compared with placebo, treatment with spironolactone cut the combined rate of cardiovascular death, nonfatal cardiac arrest, and heart failure hospitalization by 4.5 percentage points, an 18% relative risk reduction that was statistically significant. In the Americas, spironolactone also cut cardiovascular death alone by a relative 26%, and reduced heart failure hospitalization by a relative 18%, both statistically significant.
Additional analysis reported at the annual scientific meeting of the Heart Failure Society of America further supported the idea that many TOPCAT patients enrolled in Russia did not receive a physiologically meaningful dosage of spironolactone. Among 66 Russian patients randomized to the spironolactone arm who reported taking their drug as prescribed and who participated in a random draw of blood specimens 1 year into the study, 20 (30%) failed to show detectable blood levels of canrenone, a characteristic spironolactone metabolite, reported Eileen O’Meara, MD, at the meeting. In contrast, 2 (3%) of 76 enrolled U.S. patients failed to show detectable blood levels of the canrenone metabolite, a 10-fold difference said Dr. O’Meara, a cardiologist at the Montreal Heart Institute.The tested U.S. patients also showed a clear dose-response relationship between their reported spironolactone dosage and their canrenone levels, something not seen in the Russian patients. These new findings, plus the evidence cited in the 2015 analysis, create a compelling case that “actual use of spironolactone in Russia was lower than reported” by the trial participants in Russia and probably in Georgia as well, Dr. O’Meara said. The implication is that spironolactone’s real impact on HFpEF patients is best represented in the 51% of TOPCAT patients from the Americas, she added.
“We believe these findings emphasize the reliability of the Americas data,” said Marc A. Pfeffer, MD, a coinvestigator for TOPCAT and lead author of the 2015 post hoc analysis. “Until someone comes up with a better treatment for patients with HFpEF, we should pay attention to this. People need to get this message. And spironolactone costs 7 cents a day,” said Dr. Pfeffer, professor of medicine at Harvard Medical School in Boston.Currently, no agent is considered proven effective for improving outcomes in HFpEF patients. The 2016 guidelinesfor heart failure treatment from the European Society of Cardiology said “no treatment has yet been shown, convincingly, to reduce morbidity or mortality in patients with HFpEF.”
After the TOPCAT results and post hoc analysis came out in 2014 and 2015 and word spread of spironolactone’s apparent efficacy in the American half of the trial, use of spironolactone to treat HFpEF patient has increased, commented Margaret M. Redfield, MD, a heart failure physician and professor at the Mayo Clinic in Rochester, Minn. She said she often prescribes spironolactone patients to HFpEF patients who require potassium supplementation, generally because of their diuretic treatment. These are the “safest” HFpEF patients for spironolactone treatment, she said, because they face the lowest risk for hyperkalemia, the major adverse effect from spironolactone.
On Twitter @mitchelzoler
AT THE HFSA ANNUAL SCIENTIFIC MEETING
Key clinical point: A post hoc analysis of spironolactone use among TOPCAT participants further fueled the idea that spironolactone provides real benefit to patients with HFpEF.
Major finding: Among patients reportedly taking spironolactone, 30% of tested Russians and 3% of tested Americans did not have detectable canrenone levels.
Data source: TOPCAT, a multicenter, randomized trial with 3,445 HFpEF patients.
Disclosures: TOPCAT received no commercial funding. Dr. O’Meara, Dr. Pfeffer, and Dr. Redfield had no relevant disclosures.

Data point to optimal window for endoscopy in sicker patients with peptic ulcer bleeding
The timing of endoscopy may make the difference between life and death in sicker patients with peptic ulcer bleeding, according to an analysis of more than 12,000 patients treated in Denmark.
Patients who were hemodynamically stable but had a higher level of comorbidity were about half as likely to die during their hospital stay if they underwent endoscopy within 12-36 hours of presentation as compared with sooner or later, results showed (Gastrointest Endosc. 2016 Sep 10. doi: 10.1016/j.gie.2016.08.049). And hemodynamically unstable patients had a roughly one-fourth reduction in the odds of death if they underwent the procedure within 6-24 hours.
[[{"attributes":{},"fields":{}}]]
“Although caution should be applied when interpreting these data, the current recommendation of endoscopy within 0-24 hours may not be optimal for all patients,” wrote the investigators, who were led by Stig B. Laursen, PhD, department of medical gastroenterology, Odense (Denmark) University Hospital.
“Our data may suggest that in patients with major comorbidities, the first few hours of hospital admission might be best used for optimising treatment of comorbidities, which may include correction of severe anaemia, reversal of anticoagulants, and investigation for possible infection that requires rapid treatment with antibiotics,” they elaborate. “Likewise, in patients with hemodynamic instability, endoscopy between 6 and 24 hours from time of admission to hospital allows time for optimal resuscitation and initiating treatment of comorbid diseases before endoscopy. However, these data should not lead to delayed endoscopy in patients with severe hemodynamic instability not responding to intensive resuscitation.”
The investigators analyzed data from 12,601 consecutive patients with peptic ulcer bleeding admitted between January 2005 and September 2013 to Danish hospitals, where all patients had access to 24-hour endoscopy. Time to endoscopy was assessed from hospital admission, defined as arrival in the emergency department, or from symptom onset in patients who developed bleeding when already hospitalized.
For analyses, the patients were stratified by hemodynamic status (a marker for the severity of bleeding) and by American Society of Anesthesiologists score (a marker for the extent of comorbidity).
[[{"attributes":{},"fields":{}}]]
The timing of endoscopy did not significantly influence in-hospital or 30-day mortality in hemodynamically stable patients with an American Society of Anesthesiologists score of 1-2 as a whole, Dr. Laursen and his colleagues report. Subgroup analyses suggested a reduction of in-hospital mortality when it was done between 0 and 24 hours in those patients whose bleeding began outside the hospital (adjusted odds ratio, 0.48).
In contrast, analyses revealed a U-shaped association between timing and mortality for hemodynamically stable patients with an American Society of Anesthesiologists score of 3-5. For this group, in-hospital mortality was significantly lower when endoscopy was performed within 12-36 hours as compared with times outside this window (adjusted OR, 0.48), and 30-day mortality tended to be lower as well.
Similarly, timing appeared to influence outcome for hemodynamically unstable patients, having both systolic blood pressure below 100 mm Hg and heart rate above 100 beats/min. For this group, performance of endoscopy within 6-24 hours was associated with significantly lower in-hospital mortality (adjusted OR, 0.73) and also 30-day mortality (adjusted OR, 0.66). Patients’ American Society of Anesthesiologists score did not appear to play a role here.
The study’s findings may have been affected by unmeasured and unknown confounders, acknowledge the investigators, who declared that they have no competing interests related to the research.
“Although a well-powered randomized controlled trial represents the best way to account for these problems, randomizing patients with [peptic ulcer bleeding] to early versus late endoscopy will be very difficult, including from an ethical and methodological point of view,” they note.
FROM GASTROINTESTINAL ENDOSCOPY
Key clinical point:
Major finding: In-hospital mortality was lower when endoscopy was performed within 12-36 hours in hemodynamically stable patients with higher comorbidity (odds ratio, 0.48) and within 6-24 hours in hemodynamically unstable patients (OR, 0.73).
Data source: A nationwide cohort study of 12,601 consecutive patients admitted to Danish hospitals with peptic ulcer bleeding.
Disclosures: The investigators declare that they do not have any competing interests.