User login
Fewer early neurologic complications with TAVR than SAVR
PARIS – Patients with severe aortic stenosis at intermediate operative risk have a significantly lower 30-day risk of stroke and other neurologic complications with transcatheter aortic valve replacement than with surgical replacement, according to new results from the landmark SURTAVI trial.
“This is the first time the stroke rate has been shown to be lower with TAVR than with surgery,” A. Pieter Kappetein, MD, noted in presenting the results at the annual congress of the European Association of Percutaneous Cardiovascular Interventions.
It’s a finding that adds to the momentum for studying TAVR in low-surgical-risk patients, he added.
“As we move toward lower-risk patients it will become even more important to see whether there is a difference in stroke. Suppose the stroke rate in SURTAVI had been a little higher with TAVR than SAVR? It would really make us more cautious about moving toward lower-risk patients. Now that we see that in intermediate-risk patients the stroke rate is actually a little bit lower than with surgery, I think we’ll feel more comfortable moving toward lower-risk patients,” according to Dr. Kappetein, professor of cardiothoracic surgery at Erasmus University Medical Center in Rotterdam.
SURTAVI (Surgical Replacement and Transcatheter Aortic Valve Implantation) involved randomization of 1,660 patients with severe symptomatic aortic stenosis to TAVR or SAVR. All participants were deemed to be at intermediate operative risk based upon a predicted surgical mortality of 3%-15%. The primary outcome -- a composite of all-cause mortality and disabling stroke at 2 years -- was presented at the 2017 meeting of the American College of Cardiology and simultaneously published (N Engl J Med. 2017 Apr 6;376(14):1321-1331). The rate was 12.6% with TAVR using the self-expanding CoreValve or Evolut R bioprosthesis and noninferior at 14% with SAVR.
Dr. Kappetein presented a prespecified secondary analysis of the 30-day rate of all neurologic complications, including nondisabling strokes and encephalopathy. He and the other SURTAVI organizers felt this was an important outcome because these early neurologic events have a major impact upon quality of life, including whether a patient will be discharged home or to a rehabilitation clinic or skilled nursing facility following aortic valve replacement.
The 30-day incidence of all stroke was 3.3% in the TAVR patients, significantly lower than the 5.4% rate in the SAVR group. By the 2-year mark, however, the difference was no longer statistically significant, with a rate of 6.3% in the TAVR group compared with 8.0% with SAVR.
Ninety-five percent of the early strokes were ischemic.
The 30-day incidence of disabling stroke was 1.2% with TAVR and 2.4% with SAVR, a difference that was not significant (P=0.057). The 2-year rate was 2.4% in the TAVR arm and 4.5% with SAVR, again not significantly different.
Half of the strokes in the TAVR group had a modified Rankin score of 0-1 at 30 days, meaning no or only minimal signs of stroke. In contrast, most of the strokes in the SAVR group were disabling, with a modified Rankin score of 2-6.
Only 36% of patients who had an early stroke were discharged home, compared with 87% of patients without a stroke. Not surprisingly, quality of life as assessed using the SF-36 physical summary was significantly worse in the early-stroke group. However, with or without stroke, TAVR patients recovered quality of life faster than SAVR patients.
He noted that the timing of the early strokes differed between the two groups. The great majority of both disabling and nondisabling strokes in the TAVR patients were periprocedural, occurring on the day of TAVR or the next day. Strokes in the SAVR group occurred then as well, but also on days 2-6.
One reason why SURTAVI is the first study to show a lower stroke risk with TAVR is that it was the first TAVR-versus-SAVR study to feature comprehensive neurologic testing pre- and post-procedure, along with evaluation of all suspected events by a neurologist or stroke specialist, according to Dr. Kappetein.
“As surgeons we all have said the stroke rate after SAVR is 1%-1.5%, but only when the patient wasn’t waving to us the next morning would we say, ‘Oh, that patient may have a stroke.’ Then we would call a neurologist. So there were many more subtle strokes that we never actually detected. If you do a proper examination of the patient before and after the procedure you’ll find many more strokes,” he said.
He and his coinvestigators systematically searched in vain for predictors of increased stroke risk among the TAVR and SAVR patients.
“Actually, the stroke risk is present for every patient we treat with TAVR or SAVR,” the surgeon continued.
However, discussant Adnan Kastrati, MD, chief physician at the German Heart Center in Munich, thought he spied in the SURTAVI data a potential opportunity to reduce early strokes in SAVR patients. He noted that new-onset atrial fibrillation is consistently more common in SAVR than TAVR patients, and that many of the strokes in the SAVR group occurred on days 2-6. When do heart surgeons typically start oral anticoagulation in their patients with postsurgical atrial fibrillation? he asked.
Not until after 48 hours, Dr. Kappetein replied.
“Those strokes on days 4, 5, and 6 might have to do with atrial fibrillation, and we may need to be more aggressive as surgeons in anticoagulating patients with atrial fibrillation after surgery,” he said.
Dr. Kappetein reported receiving research grant support from Medtronic, sponsor of SURTAVI.
This article was updated July 28, 2107.
AT EUROPCR
Key clinical point:
Major finding: The combined incidence of disabling and nondisabling stroke within 30 days of TAVR was 3.3%, significantly better than the 5.4% rate in patients who underwent SAVR.
Data source: SURTAVI was a multicenter trial which included 1,660 patients with severe aortic stenosis who were at intermediate operative risk and were randomized to TAVR or SAVR.
Disclosures: The study presenter reported receiving research grant support from Medtronic, sponsor of the SURTAVI trial.
VIDEO: Childhood second-hand smoke boosts RA incidence
MADRID – Second-hand smoke exposure to children was about as potent a trigger for future rheumatoid arthritis as active smoking by an adult, based on an analysis of data collected from more than 70,000 French women followed for an average of more than 20 years
“This is the first demonstration of a rheumatoid arthritis risk associated with passive smoking,” Raphaèle Seror, MD, said at the European Congress of Rheumatology.
“This is an important finding because we can avoid passive smoke exposure,” Dr. Seror added in a video interview . The imperative to eliminate second-hand smoke exposure to children is particularly acute for those with a genetic risk for developing rheumatoid arthritis (RA), specifically children with a parent diagnosed with RA, suggested Dr. Seror, a professor of rheumatology at the University of Paris–South.
She and her associates used data collected in the E3N, a longitudinal French epidemiological study that enrolled nearly 100,000 women in 1990 when they were 40-65 years old and collected health data by questionnaire every 2-3 years for an average of 21 years. They identified from this cohort women with “confirmed” RA based on a self report of having incident RA during follow-up plus a coincident record of reimbursement for a prescription for an RA-specific treatment, such as methotrexate or a biological disease-modifying drug.
This identified 389 women with confirmed incident RA, including 350 with a complete smoking history that made the current analysis possible. The study also included 70,248 women who did not develop RA and who had provided a complete smoking history.
The analysis showed that women who reported a history of second-hand smoke exposure estimated at more than an hour daily as children but without a history of active smoking had a 43% higher rate of incident RA compared with never smoker women without a history of passive smoke exposure, Dr. Seror reported. This association just missed reaching statistical significance, a limitation that Dr. Seror attributed to a power issue as the analysis included only 30 women who had incident RA and a history of second-hand smoke exposure without adult smoke exposure. By comparison, women in the study with a history of active smoking without childhood exposure linked had a 37% increased incidence of RA, a finding that confirmed the well-known link between smoking and RA incidence.
The study also found that women with both second-hand smoke exposure as children and adult smoking linked with a 73% higher RA incidence, an indication that the contributions from second-hand smoke in children and active smoking by adults were not only similar in magnitude but also worked additively to promote RA development.
The video associated with this article is no longer available on this site. Please view all of our videos on the MDedge YouTube channel
[email protected]
On Twitter @mitchelzoler
AT THE EULAR 2017 CONGRESS
Key clinical point:
Major finding: Women with significant second-hand smoke exposure as children had a 43% increased rate of incident rheumatoid arthritis.
Data source: E3N, a prospective, longitudinal, observational study of nearly 100,000 French women begun in 1990.
Disclosures: Dr. Seror had no relevant disclosures.

Neurotoxicity needs separate treatment from CRS in CAR T-cell therapy

CHICAGO – The neurotoxicity in adult patients with relapsed or refractory B-cell acute lymphocytic leukemia (B-ALL) treated with CD19 CAR T cells is a separate process from cytokine release syndrome (CRS) and needs to be treated separately, according to a new study presented at the American Society of Clinical Oncology annual meeting (abstract 3019).
CD19-specific CAR-modified T cells produce high, durable anti-tumor activity, but can be associated with treatment-related toxicities, including CRS and neurotoxicity.
Neurotoxicity is poorly understood and it hasn't been clear where to focus further research, said Bianca Santomasso, MD, of Memorial Sloan Kettering Cancer Center in New York, New York.
Dr Santomasso and colleagues had conducted a phase 1 study using autologous 19-CAR T cells in adult patients with relapsing/refractory B-ALL, with high response rates.
To gain a better understanding of CD19 CAR T-cell-associated neurotoxicity, they analyzed clinical and research parameters after stratifying patients by neurotoxicity grade.
At ASCO, she reported neurologic symptom presentation in 51 adult patients with relapsed/refractory B-ALL who were treated with CAR T cells following conditioning chemotherapy, along with cerebrospinal fluid (CSF) data and neuroimaging findings associated with neurotoxicity.
Of the 51 patients treated, 10 patients (20%) developed mild neurologic symptoms (grade 1 or 2) and 21 patients (41%) developed severe neurotoxicity (grade 3 or 4).
No grade 5 neurotoxicity or diffuse cerebral edema occurred and, in all but one case, neurologic symptoms fully resolved.
Fourteen patients (27.4%) developed severe CRS; 6 patients received tocilizumab alone, 13 patients tocilizumab plus steroids, 4 patients steroids alone, and 29 patients supportive care.
The cytokines IL-6, IL-8, IL-10, interferon gamma, and granulocyte-colony stimulating factor were elevated in CSF over serum at the time of neurotoxicity and correlated with CSF protein levels.
“We found no significant correlation between neurotoxicity grade and the CAR T-cell concentration in the CSF during neurotoxicity,” Dr Santomasso said. “Instead, CSF protein level was correlated with neurotoxicity grade.”
Neurotoxicity was associated with peak CAR T-cell expansion in the blood and peak serum levels of several cytokines associated with T-cell activation or proliferation, she said.
“CAR T cells traffic to the CSF of patients with all grades of neurotoxicity, including grade 0, and there is no significant correlation between CAR T cells in CSF at the time of acute neurotoxicity and grade of neurotoxicity,” Dr Santomasso reported. “This suggests that neurotoxicity is not directly mediated by CAR T cells, which cross into the spinal fluid.”
Some chemokines/cytokines are elevated in CSF relative to serum, suggesting CNS-specific production of these factors, she said.
“Clinicians treating these patients tend to lump CRS and neurotoxicity together. Now we have an increasing understanding that these adverse events are separated in time and possibly in underlying pathology,” said Dr Santomasso.
“Even when patients recover from CRS, they could still be at risk for neurotoxicity.”
She noted that the neurotoxicity symptoms that B-ALL patients develop in the setting of CAR T cells are manageable.
In a subset of patients with severe neurotoxicity, T2/FLAIR changes were observed, which resolved with steroids and neurologic symptom resolution. ![]()
In 8 years, TMVR means more procedures
NEW YORK – Since the commercialization of transcatheter mitral valve repair, the share of these procedures among all mitral operations has grown exponentially and has also contributed to an increase in the number of overall mitral procedures, including surgical repair, according to an analysis of a national German database reported at the American Association for Thoracic Surgery Mitral Conclave here.
Transcatheter mitral valve repair (TMVR) using the MitraClip device (Abbott Vascular) was first commercialized in Germany in 2008, and in the years since the share of TMVR procedures among all mitral operations increased from 0.3% to 18.1% in 2015 throughout Germany, said Lenard Conradi, MD, surgical director of minimally-invasive and transcatheter heart valve procedures at the University Heart Center Hamburg.
The goal of the study was to gain insights into how cardiothoracic surgeons in Germany and at Dr. Conradi’s center in particular were approaching TMVR and what types of patients were having the procedure, Dr. Conradi said.
“While the EuroSCORE I of patients we operated on didn’t change at all between these two time frames, there were subtle changes in the patients that we operated on,” he said. “Before the commercialization of TMVR, we tended to have a ratio of organic vs. functional MR [mitral regurgitation] of 50-50; after commercialization of TMVR, many of the functional MR patients were allocated to TMVR.”
Dr. Conradi noted the profile of patients who had mitral valve repair also changed once the transcatheter approach became available. “Ischemic disease with coronary artery disease, previous infarction, or previous cardiac surgery – mostly coronary artery bypass grafting – were much less prevalent in this surgery population after TMVR became available,” he said.
The study also found that 30-day mortality declined from 7% to 4% during the study period. “That was probably due to more adequate patient selection because we had a more appropriate treatment that we could offer these high-risk patients as an alternative to high-risk surgical approaches,” Dr. Conradi said.
The analysis stratified procedure volumes and growth by four age groups: younger than 65 years; 65-74; 75-84; and greater than ore equal to 85. Older patients were more likely to have TMVR. Surgical procedure volumes increased most in the less than 65 group and least in the greater than or equal to 85 group.
In Germany, transcatheter mitral valve procedures are reimbursed at a higher rate than surgical procedures, but that doesn’t fully explain the uptake in TMVR, Dr. Conradi said. “The patients receiving the transcatheter approach vs. surgery still differ fundamentally, but the addition of an interventional program decreases the surgical patient’s mean risk profile and thus optimizes surgical results,” he said. “I think this can only happen if surgeons are closely involved. The indications will broaden for these therapies. There’s no doubt about that.”
Dr. Conradi disclosed receiving travel support and lecture fees from Abbott Vascular.
AT THE AATS MITRAL CONCLAVE 2017
Key clinical point: Since its commercialization, transcatheter mitral valve repair (TMVR) has accounted for an increasing share of all mitral surgeries in Germany and driven greater mitral surgery volume overall.
Major finding: Volume of surgical mitral valve procedures increased 70% overall and TMVR procedures 57% in Germany since 2008.
Data source: Analysis of data from German Federal statistics office.
Disclosures: Dr. Conradi reported receiving travel support and lecture fees from Abbott Vascular.
Comorbidities emerge in adulthood for many patients with JIA
MADRID – More than half of young adults with juvenile idiopathic arthritis have comorbid conditions that impact their daily quality of life.
The issues range from directly disease-related – like uveitis – to more tangentially associated problems, like depression, Kirsten Minden, MD, said at the European Congress of Rheumatology.
She discussed the findings of two large German registries, Biologika in der Kinder-Rheumatologie (BiKeR) and Juvenile Arthritis-Methotrexate/Biologics Long-Term Observation (JUMBO).
Children enter BiKeR as soon as they receive a JIA diagnosis; they transfer to JuMBO when they turn 18 years old. Since 2001, 1,022 children have transitioned from the pediatric to young adult databases.
These patients are largely female (68%), with a mean age of 23 years and a mean disease duration of 13 years. Most (77%) had received at least one biologic disease-modifying antirheumatic drug; the mean number of those drugs received was 3. They were diagnosed with a wide variety of JIA subtypes: polyarthritis RF-negative (27%); enthesitis-related (20%); extended oligoarthritis (17%); polyarthritis RF-positive (9%); psoriatic arthritis (9%); persistent oligoarthritis (9%); and systemic arthritis (5%). The remainder had other subtypes.
More than half of the patients had at least one comorbidity; the mean number of issues per patient was two. Eye disorders were most common (17%), with uveitis making up 16% of that. Immune disorders were also common (12%). Psychiatric disorders occurred in 10%, with most of that (9%) being depression. Another 9% had skin or subcutaneous tissue disorders, including psoriasis (3%).
Autoimmune thyroiditis occurred in 2.5%, as did inflammatory bowel disease. General gastrointestinal disorders were present in 5%.
Men and women experienced different comorbidity clusters. Depression was more common among women (12% vs. 3%), as were pain disorders (6% vs. 2%) and autoimmune disorders (3% vs. 1%). Men, however, experienced more inflammatory bowel disease than women (4% vs. 2%).
Comorbidities were also expressed differently among the different JIA subtypes. Those with systemic disease were more likely to have hypertension (21%), osteoporosis (10%), and amyloidosis (4%). Uveitis was most common among those with extended oligoarthritis (35%). Psoriasis was most common among those with psoriatic arthritis (20%).
A progressive enrollment assessment showed some encouraging trends, however. The patients who enrolled in the earliest epoch (2001-2005) were also oldest at initial assessment (26). The majority of those (71%) had at least one comorbidity. But from 2006-2009, patients were younger when assessed, and fewer had comorbidities (55%). In the last epoch of 2010-2016, patients were a mean of 20 when assessed, and about 45% endorsed at least one comorbidity.
Hypertension, uveitis, and depression have all decreased since the first epoch, Dr. Minden noted. Hypertension has gone down from a rate of 21% in 2001-2005 to 13% most recently. Depression declined from 11.5%-6%, and uveitis, from 17%-2%.
This improvement, she said, may reflect newer trends in earlier diagnosis, earlier treatment, and more effective disease-modifying drugs.
“Age and disease duration do play a role in the presence of comorbidities, but whether the lower rates are due to younger age now is questionable,” she said. “It may be that the decreasing rates are due to earlier and better treatment strategies, and we are analyzing this now.”
A key finding supports this hypothesis, she noted.
“When we look at the presence of short stature over time, we can be encouraged about this. In the earliest period, 5% had short stature. That is now seen in less than 1% of our patients enrolled in the last decade.”
Dr. Minden is on the speakers bureau of Pfizer, Roche, and Pharm-Allergan. BiKeR is funded by unconditional grants from AbbVie, Germany, Novartis, Germany, and Roche, Germany, JuMBO by unconditional grants from AbbVie, Pfizer, and Roche.
[email protected]
On Twitter @Alz_gal
AT THE EULAR 2017 CONGRESS
Key clinical point:
Major finding: More than half of these patients (54%) have at least one comorbidity that interferes with their quality of life.
Data source: The JuMBO registry used in the study comprised 1,022 patients.
Disclosures: Dr. Minden is on the speakers bureau of Pfizer, Roche, and Pharm-Allergan. BiKeR is funded by unconditional grants from AbbVie, Germany, Novartis, Germany, and Roche, Germany; JuMBO by unconditional grants from AbbVie, Pfizer, and Roch
2017 Update on menopause
Since publication of initial findings of the Women’s Health Initiative (WHI) in 2002, use of systemic menopausal hormone therapy (HT) has declined by some 80% among US women.1 Against this backdrop, this year’s Menopause Update highlights the “hot off the press” updated position statement on menopausal HT from The North American Menopause Society (NAMS), summarized by Dr. JoAnn V. Pinkerton. Although this guidance is chock full of practical, evidence-based guidance, the take-home message that Dr. Pinkerton and I would like to leave readers of OBG
Related Article:
Dr. Andrew M. Kaunitz on prescribing systemic HT to older women
Although menopausal vasomotor and related symptoms improve as women age, in untreated women, vulvovaginal atrophy (VVA, also known as genitourinary syndrome of menopause, or GSM) tends to progress, causing vaginal dryness and sexual dysfunction, among other symptoms. When symptomatic GSM represents the only indication for treatment, low-dose local vaginal estrogen, ospemifene, or dehydroepiandrosterone (DHEA; prasterone) is safe and effective. However, as with systemic HT, specific treatments for GSM are substantially underutilized.2 The current package labeling for low-dose vaginal estrogen deters many appropriate candidates from using this safe, effective treatment. In this Update, Dr. JoAnn E. Manson reviews the rationale for updating this labeling as well as recent efforts to accomplish the task.
Read about updated NAMS guidelines on HT
Guidelines on HT have been updated by The North American Menopause Society
The North American Menopause Society Hormone Therapy (HT) Position Statement Advisory Panel, composed of more than 20 experts in menopausal women's HT, including clinicians, researchers, and epidemiologists, reviewed the 2012 HT Position Statement, evaluated prior and new literature and used levels of evidence to identify the quality of the evidence and strength of the recommendations and to find consensus for the guidelines. The following information comes from the NAMS 2017 Hormone Therapy Position Statement.3
What are the major findings?
HT is the most effective treatment for vasomotor symptoms (VMS) and GSM and has been shown to prevent bone loss and fracture. Risks of HT may differ for women depending on type, dose, duration, route of administration, and timing of initiation and whether or not a progestogen is needed. Treatment should be individualized using the best available evidence to maximize benefits and minimize risks, with periodic reevaluation about benefits and risks of continuing or discontinuing HT.
For women who are younger than age 60 or within 10 years of menopause and have no contraindication, the clearest benefit of HT is for the treatment of VMS and prevention of bone loss in those at elevated risk.
The clinical guidelines were presented to NAMS audience at the 2016 annual clinical meeting, where NAMS recommended "determining the most appropriate type, dose, formulation, and duration of HT."4
When to initiate HT and duration of use
In its now-published 2017 guidelines on HT, NAMS affirms the safety and efficacy of HT for symptomatic menopausal women or those at high risk for bone loss who are under age 60 or within 10 years of menopause. NAMS encourages practitioners to employ shared decision making with their patients to find the appropriate type, dose, formulation, and duration of HT, making individualized decisions based on evidence-based information, the unique health risks of women, and with periodic reassessment.
In the clinical guidelines presented in the 2016 NAMS annual meeting,4 key recommendations taken from the 2017 Hormone Therapy Position Statement3 include the following: For women who are aged younger than 60 years or within 10 years of menopause and have no contraindications, the benefit/risk ratio appears favorable for treatment of bothersome VMS and in those at elevated risk for bone loss or fracture.
For women who initiate HT more than 10 years from menopause or after age 60, this benefit/risk ratio appears less favorable because of greater absolute risks of coronary heart disease, stroke, venous thromboembolism, and dementia.
What about extended use of hormone therapy? There is no evidence to support routine discontinuation of HT after age 65. Decisions about longer durations of HT should be individualized and considered for indications such as persistent VMS or bone loss, with shared decision making, documentation, and periodic reevaluation. Longer duration is more favorable for estrogen therapy than for estrogen-progestin therapy, based on the Women's Health Initiative (WHI) randomized controlled trials.5
What about only vaginal symptoms? For bothersome GSM not relieved with over-the-counter therapies and without indications for use of systemic HT, low-dose vaginal estrogen therapy or other therapies are recommended and can be continued as long as indicated since there is minimal systemic absorption of estrogen, with serum levels remaining within the normal postmenopausal range.6,7 For women with estrogen sensitive cancer, oncologists should be included in decision making, particularly for women on aromatase inhibitors.
Considerations for special populations Early menopause. For women with hypoestrogenism, primary ovarian insufficiency, or premature surgical menopause without contraindications, HT is recommended until at least the median age of menopause (52 years), as studies suggest that benefits outweigh the risks for effects on bone, heart, cognition, GSM, sexual function, and mood.8
Family history of breast cancer. Observational evidence suggests that use of HT does not further alter the risk for breast cancer in women with a family history of breast cancer. Family history is one risk, among others, that should be assessed when counseling women regarding HT.
Women who are BRCA-positive without breast cancer. For women who are BRCA-positive (higher genetic risk of breast cancer, primarily estrogen-receptor-negative), and have undergone surgical menopause (bilateral salpingo-oophorectomy), the benefits of estrogen to decrease health risks caused by premature loss of estrogen need to be considered on an individual basis.9 On the basis of limited observational studies, consider offering systemic HT until the median age of menopause (52 years) with longer use individualized.3
Related Article:
Is menopausal hormone therapy safe when your patient carries a BRCA mutation?
Survivors of endometrial and breast cancer with bothersome VMS. For women with prior estrogen-sensitive cancers, non-HTs should be considered first, particularly those agents studied through randomized controlled trials in this population and found to be effective. If systemic estrogen is considered for persistent symptoms after non-HT or complementary options have been unsuccessful, decisions should be made for compelling reasons and after detailed counseling, with shared decision making and in conjunction with their oncologist.3
Bothersome GSM. On the basis of limited observational data, there appears to be minimal to no demonstrated elevation in risk for recurrence of endometrial or breast cancer using low-dose vaginal estrogen,3,10 but decisions should be made in conjunction with an oncologist.
Related Article:
Focus on treating genital atrophy symptoms
The importance of relaying the new guidelines to patients
It is important for clinicians to talk to women about their menopausal symptoms and their options for relief of symptoms or prevention of bone loss. Discussion should take into account age and time from menopause, include evidence-based information11-13 about benefits and risks of different types of therapy, and employ shared decision making to choose the most appropriate therapy to maximize benefits and minimize risks for the individual woman.
Following the WHI initial release in 2002, both women and providers became fearful of HT and believed media hype and celebrities that compounded bioidentical HT was safer than FDA-approved HTs. However, compounded products lack safety and efficacy data, are not monitored or regulated by the FDA, and have unique risks associated with compounding, including concerns about sterility, impurities, and overdosing or underdosing, which could increase cancer risk.3
- Hormone therapy for symptomatic menopausal women is safe and effective for those under age 60 or within 10 years of menopause.
- Identify the most appropriate type, dose, formulation, and duration of hormone therapy for an individual woman based on evidence.
- We want to remove the fear of using hormone therapy for healthy symptomatic women who are under age 60 or within 10 years of menopause.
- Age at initiation of hormone therapy matters.
- NAMS endorses use of FDA-approved hormone therapy over compounded therapies.
Read about modifying low-dose vaginal estrogen’s black box warning
Physicians continue to underwhelmingly prescribe low-dose vaginal estrogen for GSM
Kingsberg SA, Krychman M, Graham S, Bernick B, Mirkin S. The Women's EMPOWER survey: identifying women's perceptions on vulvar and vaginal atrophy and its treatment. J Sex Med. 2017;14(3):413-424.
GSM is seriously underrecognized and undertreated.2,8,14 It has a major impact on women's lives--a silent epidemic affecting women's quality of life, sexual health, interpersonal relationships, and even physical health in terms of increased risk of urinary tract infections and urinary symptoms. Unfortunately, patients are reluctant to mention the problem to their clinicians, and they do not clearly recognize it as a medical condition that has available treatment options. Clinicians also rarely receive adequate training in the management of this condition and how to discuss it with their patients. Given busy schedules and time constraints, addressing this topic often falls through the cracks, representing a missed opportunity for helping our patients with safe and effective treatments. In a recent study by Kingsberg and colleagues, an astoundingly low percentageof women with GSM symptoms received treatment.
Details of the study
The study authors evaluated women's perceptions of GSM and available treatment options. US women aged 45 and older who reported GSM symptoms were surveyed. Of 1,858 women with a median age of 58 (range, 45-90), the study authors found that 50% had never used any treatment; 25% used over-the-counter medications; 18% were former users of GSM treatments; and 7% currently used prescribed GSM therapies.
When GSM was discussed, women were more likely than their clinicians to initiate the conversation. The main reason for women not mentioning their symptoms was the perception that GSM symptoms were a natural and inevitable part of aging. Hormonal products were perceived by women as having several downsides, including risk of systemic absorption, messiness of local creams, and the need to reuse an applicator. Overall, clinicians recommended vaginal estrogen therapy to only 23% and oral HTs to 18% of women.
The results of the study are consistent with results of earlier surveys of menopausal women. Although the survey included nearly 2,000 women, it has the potential for selection biases inherent to most Internet-based surveys. In addition, the respondents tended to be white and have higher socieconomic status, with limited representation from other groups.
Calls for the current boxed warning to be revised
GSM is highly prevalent among postmenopausal women; the condition has adverse effects on quality of life and sexual health.2,8,14 Safe and effective treatments are available but are underutilized.1,8,15,16 A current boxed warning appears on low-dose vaginal estrogen--class labeling that appears on all medications in the class of estrogen or HT, regardless of dose or route of administration. These warnings are based on findings from the WHI and other studies of systemic estrogen or estrogen plus progestin, which demonstrated a complex pattern of risks and benefits of HT (including increased risk of venous thrombosis or pulmonary embolism, stroke, and breast cancer [with estrogen plus progestin]).
These findings, however, do not appear to be relevant to low-dose vaginal estrogen, given minimal if any systemic absorption and much lower blood levels of hormones than found with systemic HT. Blood levels of estradiol with low-dose vaginal estrogen remain in the normal postmenopausal range, compared to several-fold elevations in hormone levels with systemic HT.8,15,16 Additionally, observational studies of low-dose vaginal estrogen, as well as short-term randomized clinical trials, show no evidence of an increased risk of venous thromboembolic events, heart disease, stroke, breast cancer, or dementia--the listed possible adverse effects in the boxed warning. The current warning is based on extrapolating findings from systemic HT, which is inappropriate and not evidence-based for low-dose vaginal estrogen.15
The inappropriate boxed warning contributes to the problem of undertreatment of GSM in women by discouraging clinicians from prescribing the medication and dissuading patients from taking it even after purchase. Testimonials from many clinicians caring for these women have underscored that women will fill their prescription, but after seeing the boxed warning will often become alarmed and decide not to take the medication. Clinicians reported that patients often say at their next appointment: "No, I never took it. I got very scared when I saw the boxed warning." As a result, clinicians often have to spend a great deal of time explaining the limitations of, and lack of evidence for, the boxed warning on low-dose vaginal estrogen.
Related Article:
2016 Update on menopause
Recommended label revisions
A modified label, without a boxed warning, would be safer for women because the key messages would not be obscured by the large amount of irrelevant information. Our Working Group recommended that the label explain that the listed risks were found in studies of systemic HT and their relevance to low-dose vaginal estrogen is unknown. The Group also recommended that warning text should be added in bold font to advise patients to seek medical attention if they have vaginal bleeding or spotting while taking the medication. In addition, patients who have a history of breast cancer or other hormone-sensitive cancer should discuss the use of the medication with their oncologist.
Status update on efforts to revise label. A citizen's petition was filed in the Spring of 2016, with signatures from more than 600 clinicians and patients and representatives of medical and professional organizations endorsing a more appropriate evidence-based label for low-dose vaginal estrogen. The FDA is continuing to review and deliberate on these issues but has not yet made a final decision.
Share your thoughts! Send your Letter to the Editor to [email protected]. Please include your name and the city and state in which you practice.
- Manson JM, Kaunitz AM. Menopause management—Getting clinical care back on track. N Engl J Med. 2016;374(9):803–806.
- Parish SJ, Nappi RE, Krychman ML, et al. Impact of vulvovaginal health on postmenopausal women: a review of surveys on symptoms of vulvovaginal atrophy. Int J Womens Health. 2013;5:437–447.
- The 2017 hormone therapy position statement of The North American Menopause Society [published online ahead of print June 2017]. Menopause.
- Pinkerton JV. Hormone therapy: 2016 NAMS position statement [abstract]. Menopause. 2016;23:1365.
- Manson JE, Chlebowski RT, Stefanick ML, et al. Menopausal hormone therapy and health outcomes during the intervention and extended poststopping phases of the Women’s Health Initiative randomized trials. JAMA. 2013;310(13):1353–1368.
- Lethaby A, Ayeleke RO, Roberts H. Local oestrogen for vaginal atrophy in postmenopausal women. Cochrane Database Sys Rev. 2016;8:CD001500.
- Management of symptomatic vulvovaginal atrophy: 2013 position statement of The North American Menopause Society. Menopause. 2013;20(9):888–902.
- Faubion SS, Kuhle CL, Shuster LT, Rocca WA. Long-term health consequences of premature or early menopause and considerations for management. Climacteric. 2015;18(4):483–491.
- Chai X, Domchek S, Kauff N, Rebbeck T, Chen J. RE: Breast cancer risk after salpingo-oophorectomy in healthy BRCA1/2 mutation carriers: revisiting the evidence for risk reduction. J Natl Cancer Inst. 2015;107(9).
- Farrell R; American College of Obstetricians and Gynecologists’ Committee on Gynecologic Practice. ACOG Committee Opinion No. 659 summary: The use of vaginal estrogen in women with a history of estrogen-dependent breast cancer. Obstet Gynecol. 2016;127(3):618–619.
- Hodis HN, Mack WJ, Henderson VW, et al; ELITE Research Group. Vascular effects of early versus late postmenopausal treatment with estradiol. N Engl J Med. 2016;374(13):1221–1231.
- Marjoribanks J, Farquhar C, Roberts H, Lethaby A, Lee J. Long-term hormone therapy for perimenopausal and postmenopausal women. Cochrane Database Syst Rev. 2017;1:CD004143.
- Boardman HM, Hartley L, Eisinga A, et al. Hormone therapy for preventing cardiovascular disease in post-menopausal women. Cochrane Database Syst Rev. 2015;(3):CD002229.
- Parish S, Nappi RE, Krychman ML, et al. Impact of vulvovaginal health on postmenopausal women: a review of surveys on symptoms of vulvovaginal atrophy. Int J Womens Health. 2013;5:437–447.
- Manson JE, Goldstein SR, Kagan R, et al; Working Group on Women’s Health and Well-Being in Menopause. Why the product labeling for low-dose vaginal estrogen should be changed. Menopause. 2014;21(9):911–916.
- Kaunitz AM, Manson JE. Management of menopausal symptoms. Obstet Gynecol. 2015;126(4):859-876.

Andrew M. Kaunitz, MD, NCMP
Dr. Kaunitz is University of Florida Research Foundation Professor and Associate Chairman, Department of Obstetrics and Gynecology, University of Florida College of Medicine—Jacksonville. He serves as Medical Director and directs Menopause and Gynecologic Ultrasound Services at UF Women’s Health Specialists—Emerson. Dr. Kaunitz is a Board Member for The North American Menopause Society (NAMS) and serves on the

JoAnn V. Pinkerton, MD, NCMP
Dr. Pinkerton is Professor, Department of Obstetrics and Gynecology, and Director, Midlife Health, University of Virginia Health System, Charlottesville, Virginia, and Executive Director of NAMS. She serves on the

JoAnn E. Manson, MD, DrPH, NCMP
Dr. Manson is Professor of Medicine and the Michael and Lee Bell Professor of Women’s Health at Harvard Medical School, Professor at the Harvard T. H. Chan School of Public Health, and Chief of the Division of Preventive Medicine at Brigham and Women’s Hospital, Boston, Massachusetts. She is a past President of NAMS.
Dr. Kaunitz reports receiving grant or research support from Bayer, Pfizer, Radius, Shionogi, and TherapeuticsMD. Dr. Pinkerton reports that her institution receives research funds for a multicenter trial from TherapeuticsMD. Dr. Manson reports no financial relationships relevant to this article.
Andrew M. Kaunitz, MD, NCMP
Dr. Kaunitz is University of Florida Research Foundation Professor and Associate Chairman, Department of Obstetrics and Gynecology, University of Florida College of Medicine—Jacksonville. He serves as Medical Director and directs Menopause and Gynecologic Ultrasound Services at UF Women’s Health Specialists—Emerson. Dr. Kaunitz is a Board Member for The North American Menopause Society (NAMS) and serves on the
JoAnn V. Pinkerton, MD, NCMP
Dr. Pinkerton is Professor, Department of Obstetrics and Gynecology, and Director, Midlife Health, University of Virginia Health System, Charlottesville, Virginia, and Executive Director of NAMS. She serves on the
JoAnn E. Manson, MD, DrPH, NCMP
Dr. Manson is Professor of Medicine and the Michael and Lee Bell Professor of Women’s Health at Harvard Medical School, Professor at the Harvard T. H. Chan School of Public Health, and Chief of the Division of Preventive Medicine at Brigham and Women’s Hospital, Boston, Massachusetts. She is a past President of NAMS.
Dr. Kaunitz reports receiving grant or research support from Bayer, Pfizer, Radius, Shionogi, and TherapeuticsMD. Dr. Pinkerton reports that her institution receives research funds for a multicenter trial from TherapeuticsMD. Dr. Manson reports no financial relationships relevant to this article.
Since publication of initial findings of the Women’s Health Initiative (WHI) in 2002, use of systemic menopausal hormone therapy (HT) has declined by some 80% among US women.1 Against this backdrop, this year’s Menopause Update highlights the “hot off the press” updated position statement on menopausal HT from The North American Menopause Society (NAMS), summarized by Dr. JoAnn V. Pinkerton. Although this guidance is chock full of practical, evidence-based guidance, the take-home message that Dr. Pinkerton and I would like to leave readers of OBG
Related Article:
Dr. Andrew M. Kaunitz on prescribing systemic HT to older women
Although menopausal vasomotor and related symptoms improve as women age, in untreated women, vulvovaginal atrophy (VVA, also known as genitourinary syndrome of menopause, or GSM) tends to progress, causing vaginal dryness and sexual dysfunction, among other symptoms. When symptomatic GSM represents the only indication for treatment, low-dose local vaginal estrogen, ospemifene, or dehydroepiandrosterone (DHEA; prasterone) is safe and effective. However, as with systemic HT, specific treatments for GSM are substantially underutilized.2 The current package labeling for low-dose vaginal estrogen deters many appropriate candidates from using this safe, effective treatment. In this Update, Dr. JoAnn E. Manson reviews the rationale for updating this labeling as well as recent efforts to accomplish the task.
Read about updated NAMS guidelines on HT
Guidelines on HT have been updated by The North American Menopause Society
The North American Menopause Society Hormone Therapy (HT) Position Statement Advisory Panel, composed of more than 20 experts in menopausal women's HT, including clinicians, researchers, and epidemiologists, reviewed the 2012 HT Position Statement, evaluated prior and new literature and used levels of evidence to identify the quality of the evidence and strength of the recommendations and to find consensus for the guidelines. The following information comes from the NAMS 2017 Hormone Therapy Position Statement.3
What are the major findings?
HT is the most effective treatment for vasomotor symptoms (VMS) and GSM and has been shown to prevent bone loss and fracture. Risks of HT may differ for women depending on type, dose, duration, route of administration, and timing of initiation and whether or not a progestogen is needed. Treatment should be individualized using the best available evidence to maximize benefits and minimize risks, with periodic reevaluation about benefits and risks of continuing or discontinuing HT.
For women who are younger than age 60 or within 10 years of menopause and have no contraindication, the clearest benefit of HT is for the treatment of VMS and prevention of bone loss in those at elevated risk.
The clinical guidelines were presented to NAMS audience at the 2016 annual clinical meeting, where NAMS recommended "determining the most appropriate type, dose, formulation, and duration of HT."4
When to initiate HT and duration of use
In its now-published 2017 guidelines on HT, NAMS affirms the safety and efficacy of HT for symptomatic menopausal women or those at high risk for bone loss who are under age 60 or within 10 years of menopause. NAMS encourages practitioners to employ shared decision making with their patients to find the appropriate type, dose, formulation, and duration of HT, making individualized decisions based on evidence-based information, the unique health risks of women, and with periodic reassessment.
In the clinical guidelines presented in the 2016 NAMS annual meeting,4 key recommendations taken from the 2017 Hormone Therapy Position Statement3 include the following: For women who are aged younger than 60 years or within 10 years of menopause and have no contraindications, the benefit/risk ratio appears favorable for treatment of bothersome VMS and in those at elevated risk for bone loss or fracture.
For women who initiate HT more than 10 years from menopause or after age 60, this benefit/risk ratio appears less favorable because of greater absolute risks of coronary heart disease, stroke, venous thromboembolism, and dementia.
What about extended use of hormone therapy? There is no evidence to support routine discontinuation of HT after age 65. Decisions about longer durations of HT should be individualized and considered for indications such as persistent VMS or bone loss, with shared decision making, documentation, and periodic reevaluation. Longer duration is more favorable for estrogen therapy than for estrogen-progestin therapy, based on the Women's Health Initiative (WHI) randomized controlled trials.5
What about only vaginal symptoms? For bothersome GSM not relieved with over-the-counter therapies and without indications for use of systemic HT, low-dose vaginal estrogen therapy or other therapies are recommended and can be continued as long as indicated since there is minimal systemic absorption of estrogen, with serum levels remaining within the normal postmenopausal range.6,7 For women with estrogen sensitive cancer, oncologists should be included in decision making, particularly for women on aromatase inhibitors.
Considerations for special populations Early menopause. For women with hypoestrogenism, primary ovarian insufficiency, or premature surgical menopause without contraindications, HT is recommended until at least the median age of menopause (52 years), as studies suggest that benefits outweigh the risks for effects on bone, heart, cognition, GSM, sexual function, and mood.8
Family history of breast cancer. Observational evidence suggests that use of HT does not further alter the risk for breast cancer in women with a family history of breast cancer. Family history is one risk, among others, that should be assessed when counseling women regarding HT.
Women who are BRCA-positive without breast cancer. For women who are BRCA-positive (higher genetic risk of breast cancer, primarily estrogen-receptor-negative), and have undergone surgical menopause (bilateral salpingo-oophorectomy), the benefits of estrogen to decrease health risks caused by premature loss of estrogen need to be considered on an individual basis.9 On the basis of limited observational studies, consider offering systemic HT until the median age of menopause (52 years) with longer use individualized.3
Related Article:
Is menopausal hormone therapy safe when your patient carries a BRCA mutation?
Survivors of endometrial and breast cancer with bothersome VMS. For women with prior estrogen-sensitive cancers, non-HTs should be considered first, particularly those agents studied through randomized controlled trials in this population and found to be effective. If systemic estrogen is considered for persistent symptoms after non-HT or complementary options have been unsuccessful, decisions should be made for compelling reasons and after detailed counseling, with shared decision making and in conjunction with their oncologist.3
Bothersome GSM. On the basis of limited observational data, there appears to be minimal to no demonstrated elevation in risk for recurrence of endometrial or breast cancer using low-dose vaginal estrogen,3,10 but decisions should be made in conjunction with an oncologist.
Related Article:
Focus on treating genital atrophy symptoms
The importance of relaying the new guidelines to patients
It is important for clinicians to talk to women about their menopausal symptoms and their options for relief of symptoms or prevention of bone loss. Discussion should take into account age and time from menopause, include evidence-based information11-13 about benefits and risks of different types of therapy, and employ shared decision making to choose the most appropriate therapy to maximize benefits and minimize risks for the individual woman.
Following the WHI initial release in 2002, both women and providers became fearful of HT and believed media hype and celebrities that compounded bioidentical HT was safer than FDA-approved HTs. However, compounded products lack safety and efficacy data, are not monitored or regulated by the FDA, and have unique risks associated with compounding, including concerns about sterility, impurities, and overdosing or underdosing, which could increase cancer risk.3
- Hormone therapy for symptomatic menopausal women is safe and effective for those under age 60 or within 10 years of menopause.
- Identify the most appropriate type, dose, formulation, and duration of hormone therapy for an individual woman based on evidence.
- We want to remove the fear of using hormone therapy for healthy symptomatic women who are under age 60 or within 10 years of menopause.
- Age at initiation of hormone therapy matters.
- NAMS endorses use of FDA-approved hormone therapy over compounded therapies.
Read about modifying low-dose vaginal estrogen’s black box warning
Physicians continue to underwhelmingly prescribe low-dose vaginal estrogen for GSM
Kingsberg SA, Krychman M, Graham S, Bernick B, Mirkin S. The Women's EMPOWER survey: identifying women's perceptions on vulvar and vaginal atrophy and its treatment. J Sex Med. 2017;14(3):413-424.
GSM is seriously underrecognized and undertreated.2,8,14 It has a major impact on women's lives--a silent epidemic affecting women's quality of life, sexual health, interpersonal relationships, and even physical health in terms of increased risk of urinary tract infections and urinary symptoms. Unfortunately, patients are reluctant to mention the problem to their clinicians, and they do not clearly recognize it as a medical condition that has available treatment options. Clinicians also rarely receive adequate training in the management of this condition and how to discuss it with their patients. Given busy schedules and time constraints, addressing this topic often falls through the cracks, representing a missed opportunity for helping our patients with safe and effective treatments. In a recent study by Kingsberg and colleagues, an astoundingly low percentageof women with GSM symptoms received treatment.
Details of the study
The study authors evaluated women's perceptions of GSM and available treatment options. US women aged 45 and older who reported GSM symptoms were surveyed. Of 1,858 women with a median age of 58 (range, 45-90), the study authors found that 50% had never used any treatment; 25% used over-the-counter medications; 18% were former users of GSM treatments; and 7% currently used prescribed GSM therapies.
When GSM was discussed, women were more likely than their clinicians to initiate the conversation. The main reason for women not mentioning their symptoms was the perception that GSM symptoms were a natural and inevitable part of aging. Hormonal products were perceived by women as having several downsides, including risk of systemic absorption, messiness of local creams, and the need to reuse an applicator. Overall, clinicians recommended vaginal estrogen therapy to only 23% and oral HTs to 18% of women.
The results of the study are consistent with results of earlier surveys of menopausal women. Although the survey included nearly 2,000 women, it has the potential for selection biases inherent to most Internet-based surveys. In addition, the respondents tended to be white and have higher socieconomic status, with limited representation from other groups.
Calls for the current boxed warning to be revised
GSM is highly prevalent among postmenopausal women; the condition has adverse effects on quality of life and sexual health.2,8,14 Safe and effective treatments are available but are underutilized.1,8,15,16 A current boxed warning appears on low-dose vaginal estrogen--class labeling that appears on all medications in the class of estrogen or HT, regardless of dose or route of administration. These warnings are based on findings from the WHI and other studies of systemic estrogen or estrogen plus progestin, which demonstrated a complex pattern of risks and benefits of HT (including increased risk of venous thrombosis or pulmonary embolism, stroke, and breast cancer [with estrogen plus progestin]).
These findings, however, do not appear to be relevant to low-dose vaginal estrogen, given minimal if any systemic absorption and much lower blood levels of hormones than found with systemic HT. Blood levels of estradiol with low-dose vaginal estrogen remain in the normal postmenopausal range, compared to several-fold elevations in hormone levels with systemic HT.8,15,16 Additionally, observational studies of low-dose vaginal estrogen, as well as short-term randomized clinical trials, show no evidence of an increased risk of venous thromboembolic events, heart disease, stroke, breast cancer, or dementia--the listed possible adverse effects in the boxed warning. The current warning is based on extrapolating findings from systemic HT, which is inappropriate and not evidence-based for low-dose vaginal estrogen.15
The inappropriate boxed warning contributes to the problem of undertreatment of GSM in women by discouraging clinicians from prescribing the medication and dissuading patients from taking it even after purchase. Testimonials from many clinicians caring for these women have underscored that women will fill their prescription, but after seeing the boxed warning will often become alarmed and decide not to take the medication. Clinicians reported that patients often say at their next appointment: "No, I never took it. I got very scared when I saw the boxed warning." As a result, clinicians often have to spend a great deal of time explaining the limitations of, and lack of evidence for, the boxed warning on low-dose vaginal estrogen.
Related Article:
2016 Update on menopause
Recommended label revisions
A modified label, without a boxed warning, would be safer for women because the key messages would not be obscured by the large amount of irrelevant information. Our Working Group recommended that the label explain that the listed risks were found in studies of systemic HT and their relevance to low-dose vaginal estrogen is unknown. The Group also recommended that warning text should be added in bold font to advise patients to seek medical attention if they have vaginal bleeding or spotting while taking the medication. In addition, patients who have a history of breast cancer or other hormone-sensitive cancer should discuss the use of the medication with their oncologist.
Status update on efforts to revise label. A citizen's petition was filed in the Spring of 2016, with signatures from more than 600 clinicians and patients and representatives of medical and professional organizations endorsing a more appropriate evidence-based label for low-dose vaginal estrogen. The FDA is continuing to review and deliberate on these issues but has not yet made a final decision.
Share your thoughts! Send your Letter to the Editor to [email protected]. Please include your name and the city and state in which you practice.
- Manson JM, Kaunitz AM. Menopause management—Getting clinical care back on track. N Engl J Med. 2016;374(9):803–806.
- Parish SJ, Nappi RE, Krychman ML, et al. Impact of vulvovaginal health on postmenopausal women: a review of surveys on symptoms of vulvovaginal atrophy. Int J Womens Health. 2013;5:437–447.
- The 2017 hormone therapy position statement of The North American Menopause Society [published online ahead of print June 2017]. Menopause.
- Pinkerton JV. Hormone therapy: 2016 NAMS position statement [abstract]. Menopause. 2016;23:1365.
- Manson JE, Chlebowski RT, Stefanick ML, et al. Menopausal hormone therapy and health outcomes during the intervention and extended poststopping phases of the Women’s Health Initiative randomized trials. JAMA. 2013;310(13):1353–1368.
- Lethaby A, Ayeleke RO, Roberts H. Local oestrogen for vaginal atrophy in postmenopausal women. Cochrane Database Sys Rev. 2016;8:CD001500.
- Management of symptomatic vulvovaginal atrophy: 2013 position statement of The North American Menopause Society. Menopause. 2013;20(9):888–902.
- Faubion SS, Kuhle CL, Shuster LT, Rocca WA. Long-term health consequences of premature or early menopause and considerations for management. Climacteric. 2015;18(4):483–491.
- Chai X, Domchek S, Kauff N, Rebbeck T, Chen J. RE: Breast cancer risk after salpingo-oophorectomy in healthy BRCA1/2 mutation carriers: revisiting the evidence for risk reduction. J Natl Cancer Inst. 2015;107(9).
- Farrell R; American College of Obstetricians and Gynecologists’ Committee on Gynecologic Practice. ACOG Committee Opinion No. 659 summary: The use of vaginal estrogen in women with a history of estrogen-dependent breast cancer. Obstet Gynecol. 2016;127(3):618–619.
- Hodis HN, Mack WJ, Henderson VW, et al; ELITE Research Group. Vascular effects of early versus late postmenopausal treatment with estradiol. N Engl J Med. 2016;374(13):1221–1231.
- Marjoribanks J, Farquhar C, Roberts H, Lethaby A, Lee J. Long-term hormone therapy for perimenopausal and postmenopausal women. Cochrane Database Syst Rev. 2017;1:CD004143.
- Boardman HM, Hartley L, Eisinga A, et al. Hormone therapy for preventing cardiovascular disease in post-menopausal women. Cochrane Database Syst Rev. 2015;(3):CD002229.
- Parish S, Nappi RE, Krychman ML, et al. Impact of vulvovaginal health on postmenopausal women: a review of surveys on symptoms of vulvovaginal atrophy. Int J Womens Health. 2013;5:437–447.
- Manson JE, Goldstein SR, Kagan R, et al; Working Group on Women’s Health and Well-Being in Menopause. Why the product labeling for low-dose vaginal estrogen should be changed. Menopause. 2014;21(9):911–916.
- Kaunitz AM, Manson JE. Management of menopausal symptoms. Obstet Gynecol. 2015;126(4):859-876.

Ustekinumab trumps TNF-blockade for enthesitis in patients with psoriatic arthritis
MADRID – The anti-IL-23 antibody ustekinumab cleared enthesitis significantly better than did TNF-blockade in a small, open-label trial of patients with psoriatic arthritis
After 6 months on the drug, 71% of those taking the antibody achieved a score of 0 on the Spondyloarthritis Research Consortium of Canada (SPARCC) scale, representing a complete absence of enthesitis, Elizabeth Araujo, MD, said at the European Congress of Rheumatology. Just 38% of those on TNF-inhibitors achieved that score.
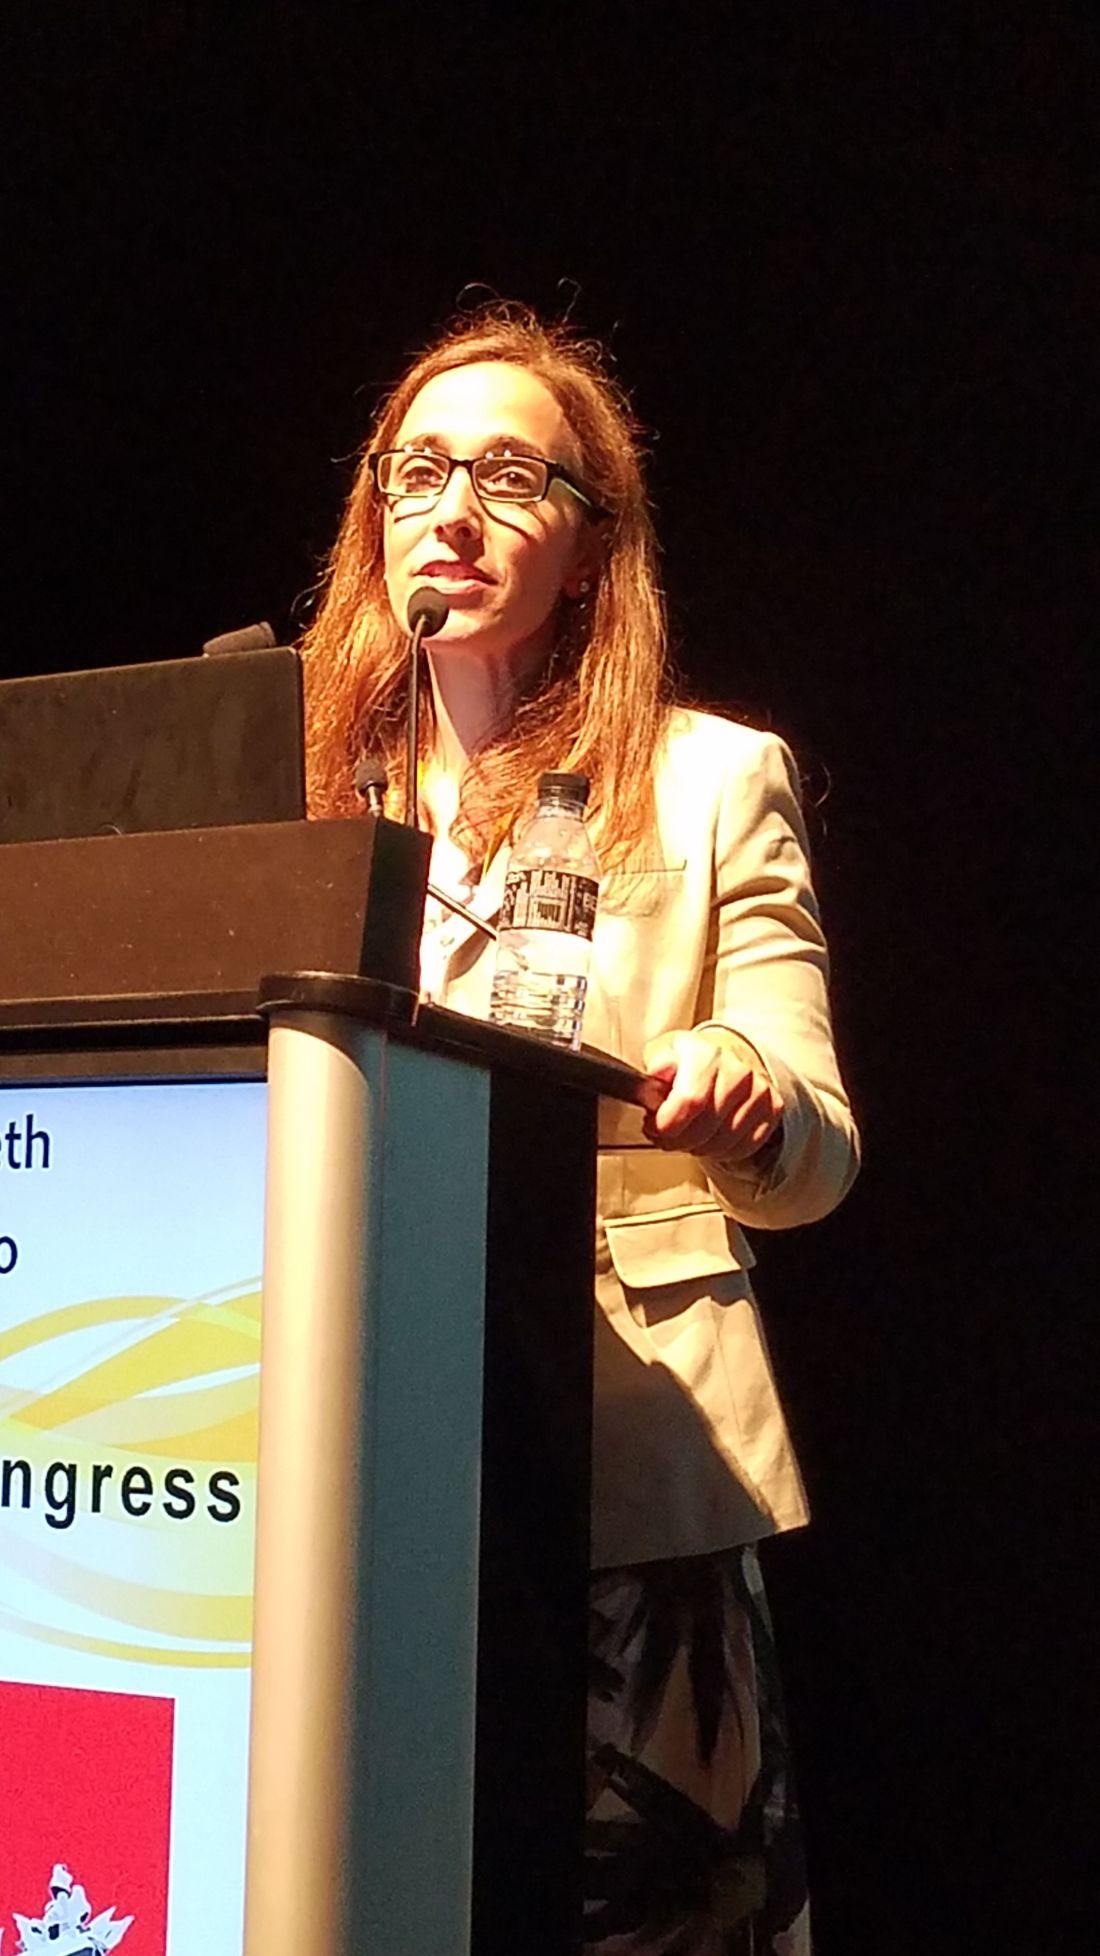
Enthesitis is often more bothersome to arthritis patients than their primary disease, said Dr. Araujo of the Centre of Internal Medicine, Universitätsklinikum Erlangen, Germany.
“Despite being a hallmark of PsA patients, enthesitis still receives rather peripheral attention as an outcome, especially when compared with ‘classical’ arthritis. Nonetheless, in clinical practice, enthesitis is an important factor for PsA-associated pain in many patients,” explained Dr. Araujo.
Yet it’s frequently ignored or under-treated. When it is addressed, enthesitis is often treated using TNF-inhibitors. But recent increases in the treatment options for PsA patients got Dr. Araujo thinking that PsA patients with enthesitis might respond better to a different therapy.
She investigated this with the open-label ECLIPSA trial, which randomized 51 PsA patients (47 with active enthesitis) to a 6-month treatment regimen of ustekinumab or a TNF-inhibitor. The primary endpoint of the observational study was a SPARCC score of 0.
Patients were a mean of 61 years, with a mean disease duration of 2.5 years. The mean baseline SPARCC score was 4. The mean Psoriatic Area and Severity Score (PASI) was 3.
Patients’ arthritis symptoms responded equally well to both drugs, with similar marked decreases in tender and swollen joint counts. But there was a clear, significant between-group separation on the SPARCC score, with 71% of the ustekinumab group reaching a 0 compared to 38% of the TNF-inhibition group.
Ustekinumab also effected better skin clearance than TNF-inhibition, she said. Among the TNF-inhibition group, about 20% achieved a PASI 90 and 20%, a PASI 100. Among those taking ustekinumab, about 80% achieved a PASI 90 and 55% a PASI 100.
The data point the way to more stratified treatment approaches for PsA patients, where PsA that predominantly involves enthesitis is treated by drugs like ustekinumab, Dr. Araujo said. Since both TNF-inhibitors and ustekinumab are approved for treatment of PsA, treatment could be tailored.
“Stratification of PsA patients according to clinical features (enthesitis driven vs. arthritis driven) appears within reach and will allow a more selective use of cytokine-blocking agents in PsA in the future,” said Dr. Araujo.
“More attention on enthesial-driven PsA patients is needed in the future as this patient group is well known to clinicians working in the PsA field but is massively underrepresented in clinical studies. Comparative studies of biological [disease-modifying antirheumatic drugs] in PsA need to take into account the differences in the clinical profile of PsA patients and should not be confined to the traditional polyarticular arthritis–driven disease population,” she added.
Dr. Araujo had no financial disclosures.
[email protected]
On Twitter @Alz_gal
MADRID – The anti-IL-23 antibody ustekinumab cleared enthesitis significantly better than did TNF-blockade in a small, open-label trial of patients with psoriatic arthritis
After 6 months on the drug, 71% of those taking the antibody achieved a score of 0 on the Spondyloarthritis Research Consortium of Canada (SPARCC) scale, representing a complete absence of enthesitis, Elizabeth Araujo, MD, said at the European Congress of Rheumatology. Just 38% of those on TNF-inhibitors achieved that score.
Enthesitis is often more bothersome to arthritis patients than their primary disease, said Dr. Araujo of the Centre of Internal Medicine, Universitätsklinikum Erlangen, Germany.
“Despite being a hallmark of PsA patients, enthesitis still receives rather peripheral attention as an outcome, especially when compared with ‘classical’ arthritis. Nonetheless, in clinical practice, enthesitis is an important factor for PsA-associated pain in many patients,” explained Dr. Araujo.
Yet it’s frequently ignored or under-treated. When it is addressed, enthesitis is often treated using TNF-inhibitors. But recent increases in the treatment options for PsA patients got Dr. Araujo thinking that PsA patients with enthesitis might respond better to a different therapy.
She investigated this with the open-label ECLIPSA trial, which randomized 51 PsA patients (47 with active enthesitis) to a 6-month treatment regimen of ustekinumab or a TNF-inhibitor. The primary endpoint of the observational study was a SPARCC score of 0.
Patients were a mean of 61 years, with a mean disease duration of 2.5 years. The mean baseline SPARCC score was 4. The mean Psoriatic Area and Severity Score (PASI) was 3.
Patients’ arthritis symptoms responded equally well to both drugs, with similar marked decreases in tender and swollen joint counts. But there was a clear, significant between-group separation on the SPARCC score, with 71% of the ustekinumab group reaching a 0 compared to 38% of the TNF-inhibition group.
Ustekinumab also effected better skin clearance than TNF-inhibition, she said. Among the TNF-inhibition group, about 20% achieved a PASI 90 and 20%, a PASI 100. Among those taking ustekinumab, about 80% achieved a PASI 90 and 55% a PASI 100.
The data point the way to more stratified treatment approaches for PsA patients, where PsA that predominantly involves enthesitis is treated by drugs like ustekinumab, Dr. Araujo said. Since both TNF-inhibitors and ustekinumab are approved for treatment of PsA, treatment could be tailored.
“Stratification of PsA patients according to clinical features (enthesitis driven vs. arthritis driven) appears within reach and will allow a more selective use of cytokine-blocking agents in PsA in the future,” said Dr. Araujo.
“More attention on enthesial-driven PsA patients is needed in the future as this patient group is well known to clinicians working in the PsA field but is massively underrepresented in clinical studies. Comparative studies of biological [disease-modifying antirheumatic drugs] in PsA need to take into account the differences in the clinical profile of PsA patients and should not be confined to the traditional polyarticular arthritis–driven disease population,” she added.
Dr. Araujo had no financial disclosures.
[email protected]
On Twitter @Alz_gal
AT EULAR 2017
Key clinical point:
Major finding: After 6 months, 71% of those taking ustekinumab and 38% of those taking TNF-blockers achieved total enthesitis clearance.
Data source: The open-label trial randomized 51 patients - 47 of whom had active enthesitis.
Disclosures: Dr. Araujo had no financial disclosures.
VIDEO: Guselkumab bests placebo in psoriatic arthritis
MADRID – Guselkumab, an IL-23 blocker that has proved its mettle in psoriasis, also posted excellent results in an early-phase psoriatic arthritis trial.
The fully human monoclonal antibody, which is being developed by Janssen, targets the p19 subunit of interleukin-23, Atul Deodhar, MD, said at the European Congress of Rheumatology. The 52-week phase 2a study randomized 149 patients to 100 mg guselkumab or placebo given subcutaneously at baseline and week 4, then every 8 weeks, for 24 weeks. Patients who didn’t respond adequately in either arm could begin using ustekinumab. After 24 weeks, everyone remaining in the placebo group switched to guselkumab, and patients in both arms continued open-label treatment until 52 weeks.
Dr. Deodhar of the Oregon Health and Science University, Portland, reported 24-week outcomes. A full year of data will be presented at the American College of Rheumatology meeting in San Diego in November.
Guselkumab aced the study’s primary endpoint – ACR 20 response by week 24 (58% vs. 18% with the placebo, P less than .001). Improvement developed rapidly, with a significant separation between the groups by week 4 (21% vs. 0%; P less than .001). It also succeeded on the secondary endpoints of ACR 50 response (34% vs. 10%) and ACR 70 (14% vs. 2%). The antibody also significantly outperformed placebo on the Health Assessment Questionnaire Disability Index (HAQ-DI), 36-Item Short Form Health Survey (SF-36), and Minimal Disease Activity score. Skin clearance was strikingly good, Dr. Deodhar said: 39% achieved complete clearance, with a Psoriasis Area and Severity Index (PASI) score of 100; 66% achieved a PASI of 90; and 79% acheived a PASI of 75.
Guselkumab also significantly improved enthesitis – a symptom that can be terribly troubling for patients with psoriatic arthritis. Enthesitis was present in 106 at baseline. By 24 weeks, it had resolved in 56.6% of those taking the antibody and 29% of those taking the placebo (P = .012.).
A phase III trial in psoriatic arthritis will be forthcoming, Dr. Deodhar said.
Dr. Deodhar has received research funding and is a consultant for Janssen and other pharmaceutical companies.
The video associated with this article is no longer available on this site. Please view all of our videos on the MDedge YouTube channel
[email protected]
On Twitter @alz_gal
AT THE EULAR 2017 CONGRESS
Key clinical point:
Major finding: ACR 20 response at 24 weeks was 58% in the treated group, vs. 18% in the placebo group.
Data source: The 52-week 2a study randomized 149 patients to guselkumab or placebo.
Disclosures: Dr. Deodhar has received research monies and is a consultant for Janssen, which is developing guselkumab.

PBC incidence remains stable in rural parts of U.S.
The incidence of primary biliary cholangitis (PBC) in rural parts of the midwestern United States has remained stable over the last 2 decades, allowing better prognosis and improved survival rates.
In a population-based cohort study, Rajan Kanth, MD, and his associates researched 79 incident PBC cases observed in the Marshfield Epidemiologic Study Area (MESA) of 24 zip codes in central and northern Wisconsin between 1992 and 2011. The overall age- and sex-standardized PBC incidence rate was 4.9 cases per 100,000 person-years. The annual incidence rate of PBC increased; however, it was not significant (P = .114) during the 20-year study time frame. In women, PBC ranged from a low of 6.9 cases per 100,000 person-years in 1992-1996 to a high of 11.3 cases per 100,000 person-years in 2002-2006. The sex-specific comparisons were not significant at any time during the 5-year period.
After a mean follow-up of 7.3 years, 23 (29%) patients with PBC died. The estimated 10-year survival of PBC cases in MESA was 76%.
Researchers noted the MESA source population grew over the 20-year study time frame, going from a low of 364,722 MESA person-years in 1992-1996 to a high of 409,670 person-years in 2007-2011. The proportion of men and women in MESA were consistent throughout the study, but there was a general population aging trend with a 29% increase in the number of individuals aged 40-69 years in 2007-2011 relative to 1992-1996.
“The overall incidence of PBC in a Midwestern population of the United States has remained relatively stable over the last two decades,” researchers concluded. “Results suggest that the overall incidence of PBC in the United States is not rising quickly, and that patients with PBC have generally improved prognosis and survival.”
Find the full study in Clinical Medicine & Research (2017. doi: 10.3121/cmr.2017.1351).
FROM CLINICAL MEDICINE & RESEARCH
What’s driving the ‘failure’ of the ACA marketplaces?
Two reports from the Centers for Medicare & Medicaid Services show declines in the number of consumers who are activating the health insurance purchased via an Affordable Care Act exchange, a development Trump administration officials say underlines the failure of the ACA.

As of March 15, 10.3 million people paid premiums to activate coverage they purchased on the exchanges out of 12.2 million who enrolled in plans as of the Jan. 31 deadline for 2017, according to a June 12 report from CMS.
Further, some consumers who began paying premiums stopped.
Two key factors are behind the drop off, according to a second CMS report.
According to a voluntary online survey of consumers who left the exchanges between August 2016 and April 2017, 46% who canceled coverage prior to paying premiums cited cost as the main reason, including 20% who cited increased premiums over the previous year and 17% who claimed ineligibility for financial assistance.
Of those who activated their coverage by paying premiums, half (49%) said they stopped because they became eligible and received coverage elsewhere, mostly through an employer or Medicare. About a quarter (27%) cited affordability as the reason why they dropped coverage.
According to the Commonwealth Fund, CMS officials missed a few big reasons why people did not consistently pay for their coverage: Many were reacting to uncertainty around the Trump administration’s ACA repeal and replace efforts. Others were missed because of policy changes undertaken by the administration.
“One of the things that we know affected enrollment this year was the pullback of outreach efforts in the last weekend of the open enrollment period by the Trump administration,” Sara Collins, PhD, vice president of health care access and coverage at the Commonwealth Fund, said in an interview. “It did have an affect on enrollment and might be part of the reason why we are seeing – compared to last year – a lower effectuate enrollment.”
Other administration actions are taking a toll, Dr. Collins said.
There is a “general uncertainty that the administration is generating with respect to the enforcement of the individual mandate and also the uncertainty that is affecting insurers’ commitment to the marketplaces for 2018 [cost sharing reduction payments],” she said, noting both insurers and consumers are affected by this uncertainty.
While acknowledging that the main reason consumers dropped exchange policies was gaining coverage from source, Dr. Collins noted that “we are in such a strange environment, where it’s not clear what Congress is going to do or what the administration is going to do. It probably has confused the public somewhat about what their options are and maybe a concern even if they stay in a plan whether or not they will continue to get their tax credits. There has just been a general sense of uncertainty that has been created by the Trump administration and Congress in terms of the future of marketplace plans.”
Two reports from the Centers for Medicare & Medicaid Services show declines in the number of consumers who are activating the health insurance purchased via an Affordable Care Act exchange, a development Trump administration officials say underlines the failure of the ACA.
As of March 15, 10.3 million people paid premiums to activate coverage they purchased on the exchanges out of 12.2 million who enrolled in plans as of the Jan. 31 deadline for 2017, according to a June 12 report from CMS.
Further, some consumers who began paying premiums stopped.
Two key factors are behind the drop off, according to a second CMS report.
According to a voluntary online survey of consumers who left the exchanges between August 2016 and April 2017, 46% who canceled coverage prior to paying premiums cited cost as the main reason, including 20% who cited increased premiums over the previous year and 17% who claimed ineligibility for financial assistance.
Of those who activated their coverage by paying premiums, half (49%) said they stopped because they became eligible and received coverage elsewhere, mostly through an employer or Medicare. About a quarter (27%) cited affordability as the reason why they dropped coverage.
According to the Commonwealth Fund, CMS officials missed a few big reasons why people did not consistently pay for their coverage: Many were reacting to uncertainty around the Trump administration’s ACA repeal and replace efforts. Others were missed because of policy changes undertaken by the administration.
“One of the things that we know affected enrollment this year was the pullback of outreach efforts in the last weekend of the open enrollment period by the Trump administration,” Sara Collins, PhD, vice president of health care access and coverage at the Commonwealth Fund, said in an interview. “It did have an affect on enrollment and might be part of the reason why we are seeing – compared to last year – a lower effectuate enrollment.”
Other administration actions are taking a toll, Dr. Collins said.
There is a “general uncertainty that the administration is generating with respect to the enforcement of the individual mandate and also the uncertainty that is affecting insurers’ commitment to the marketplaces for 2018 [cost sharing reduction payments],” she said, noting both insurers and consumers are affected by this uncertainty.
While acknowledging that the main reason consumers dropped exchange policies was gaining coverage from source, Dr. Collins noted that “we are in such a strange environment, where it’s not clear what Congress is going to do or what the administration is going to do. It probably has confused the public somewhat about what their options are and maybe a concern even if they stay in a plan whether or not they will continue to get their tax credits. There has just been a general sense of uncertainty that has been created by the Trump administration and Congress in terms of the future of marketplace plans.”