User login
HLF proves ‘critical’ for HSC quiescence

Preclinical research suggests hepatic leukemia factor (HLF) protects hematopoietic stem cells (HSCs) by helping them maintain quiescence.
Researchers found that HLF-deficient HSCs were more sensitive than wild-type HSCs to chemotherapy and irradiation.
After transplantation in mice, HLF-deficient HSCs were less able than wild-type HSCs to reconstitute hematopoiesis.
These findings were published in Cell Reports.
“The study confirms several previous studies that show the HLF gene’s significance in blood formation,” said study author Mattias Magnusson, PhD, of Lund University in Sweden.
“Identifying the factors that control blood stem cells provides knowledge needed to be able to propagate the stem cells outside the body. This has long been one of the major goals in the blood stem cell field, as it would increase possibilities for blood stem cell transplantation when, for example, there is a shortage of stem cells or donors. In addition, we will increase our understanding of how leukemia arises.”
Previous research by Dr Magnusson and his colleagues suggested that HLF may regulate HSCs in both normal and malignant hematopoiesis.
With the current study, the researchers found that HLF was “dispensable for steady-state hematopoiesis.” In fact, HLF-knockout mice had “essentially normal hematopoietic parameters” in steady-state conditions.
However, when HLF-deficient HSCs were serially transplanted in mice, the cells showed a reduction in regenerative potential, when compared to wild-type HSCs.
Additionally, mice with HLF-deficient HSCs exhibited increased sensitivity to the myeloablative agent 5-fluorouracil and reduced survival after sublethal irradiation, as compared to control mice.
“It’s surprising that the mice [initially] lived a normal life without the HLF gene, but when they had an acute need for new blood after an external damage such as cytostatic treatment, the mice did not survive,” Dr Magnusson said.
“All the blood stem cells were eliminated by the treatment, as they were active rather than in a resting state. Without the HLF gene, the blood stem cells were no longer protected against cytostatic treatment or other types of stress such as transplantation.”
Taking their findings together, Dr Magnusson and his colleagues concluded that HLF is a “critical” regulator of HSC quiescence and “essential” for maintaining HSCs’ ability to produce new blood. 
Preclinical research suggests hepatic leukemia factor (HLF) protects hematopoietic stem cells (HSCs) by helping them maintain quiescence.
Researchers found that HLF-deficient HSCs were more sensitive than wild-type HSCs to chemotherapy and irradiation.
After transplantation in mice, HLF-deficient HSCs were less able than wild-type HSCs to reconstitute hematopoiesis.
These findings were published in Cell Reports.
“The study confirms several previous studies that show the HLF gene’s significance in blood formation,” said study author Mattias Magnusson, PhD, of Lund University in Sweden.
“Identifying the factors that control blood stem cells provides knowledge needed to be able to propagate the stem cells outside the body. This has long been one of the major goals in the blood stem cell field, as it would increase possibilities for blood stem cell transplantation when, for example, there is a shortage of stem cells or donors. In addition, we will increase our understanding of how leukemia arises.”
Previous research by Dr Magnusson and his colleagues suggested that HLF may regulate HSCs in both normal and malignant hematopoiesis.
With the current study, the researchers found that HLF was “dispensable for steady-state hematopoiesis.” In fact, HLF-knockout mice had “essentially normal hematopoietic parameters” in steady-state conditions.
However, when HLF-deficient HSCs were serially transplanted in mice, the cells showed a reduction in regenerative potential, when compared to wild-type HSCs.
Additionally, mice with HLF-deficient HSCs exhibited increased sensitivity to the myeloablative agent 5-fluorouracil and reduced survival after sublethal irradiation, as compared to control mice.
“It’s surprising that the mice [initially] lived a normal life without the HLF gene, but when they had an acute need for new blood after an external damage such as cytostatic treatment, the mice did not survive,” Dr Magnusson said.
“All the blood stem cells were eliminated by the treatment, as they were active rather than in a resting state. Without the HLF gene, the blood stem cells were no longer protected against cytostatic treatment or other types of stress such as transplantation.”
Taking their findings together, Dr Magnusson and his colleagues concluded that HLF is a “critical” regulator of HSC quiescence and “essential” for maintaining HSCs’ ability to produce new blood.
Preclinical research suggests hepatic leukemia factor (HLF) protects hematopoietic stem cells (HSCs) by helping them maintain quiescence.
Researchers found that HLF-deficient HSCs were more sensitive than wild-type HSCs to chemotherapy and irradiation.
After transplantation in mice, HLF-deficient HSCs were less able than wild-type HSCs to reconstitute hematopoiesis.
These findings were published in Cell Reports.
“The study confirms several previous studies that show the HLF gene’s significance in blood formation,” said study author Mattias Magnusson, PhD, of Lund University in Sweden.
“Identifying the factors that control blood stem cells provides knowledge needed to be able to propagate the stem cells outside the body. This has long been one of the major goals in the blood stem cell field, as it would increase possibilities for blood stem cell transplantation when, for example, there is a shortage of stem cells or donors. In addition, we will increase our understanding of how leukemia arises.”
Previous research by Dr Magnusson and his colleagues suggested that HLF may regulate HSCs in both normal and malignant hematopoiesis.
With the current study, the researchers found that HLF was “dispensable for steady-state hematopoiesis.” In fact, HLF-knockout mice had “essentially normal hematopoietic parameters” in steady-state conditions.
However, when HLF-deficient HSCs were serially transplanted in mice, the cells showed a reduction in regenerative potential, when compared to wild-type HSCs.
Additionally, mice with HLF-deficient HSCs exhibited increased sensitivity to the myeloablative agent 5-fluorouracil and reduced survival after sublethal irradiation, as compared to control mice.
“It’s surprising that the mice [initially] lived a normal life without the HLF gene, but when they had an acute need for new blood after an external damage such as cytostatic treatment, the mice did not survive,” Dr Magnusson said.
“All the blood stem cells were eliminated by the treatment, as they were active rather than in a resting state. Without the HLF gene, the blood stem cells were no longer protected against cytostatic treatment or other types of stress such as transplantation.”
Taking their findings together, Dr Magnusson and his colleagues concluded that HLF is a “critical” regulator of HSC quiescence and “essential” for maintaining HSCs’ ability to produce new blood.
Pearls in Dermatology: 2017
The Pearls in Dermatology collection consists of our popular pearls from the year in one convenient file. Topics include:
- Nail psoriasis and psoriasis on the hands and feet
- Genital wart treatment
- Isotretinoin for acne
- Cosmeceuticals for rosacea
- Surgical technique with the flexible scalpel blade
Editor’s Commentary provided by Vincent A. DeLeo, MD, Editor-in-Chief, Cutis.
Save this collection, print it, and/or share it with your colleagues. We hope this comprehensive collection will positively impact how you manage patients.

The Pearls in Dermatology collection consists of our popular pearls from the year in one convenient file. Topics include:
- Nail psoriasis and psoriasis on the hands and feet
- Genital wart treatment
- Isotretinoin for acne
- Cosmeceuticals for rosacea
- Surgical technique with the flexible scalpel blade
Editor’s Commentary provided by Vincent A. DeLeo, MD, Editor-in-Chief, Cutis.
Save this collection, print it, and/or share it with your colleagues. We hope this comprehensive collection will positively impact how you manage patients.
The Pearls in Dermatology collection consists of our popular pearls from the year in one convenient file. Topics include:
- Nail psoriasis and psoriasis on the hands and feet
- Genital wart treatment
- Isotretinoin for acne
- Cosmeceuticals for rosacea
- Surgical technique with the flexible scalpel blade
Editor’s Commentary provided by Vincent A. DeLeo, MD, Editor-in-Chief, Cutis.
Save this collection, print it, and/or share it with your colleagues. We hope this comprehensive collection will positively impact how you manage patients.

Atopic march largely attributed to genetic factors
according to a systematic review.
PhD candidate Sabria Khan and her colleagues at the Centre for Epidemiology and Biostatistics at the University of Melbourne said that the atopic march concept “asserts that allergic diseases start in early life with eczema, progress through food allergy, and culminate with hay fever and asthma.”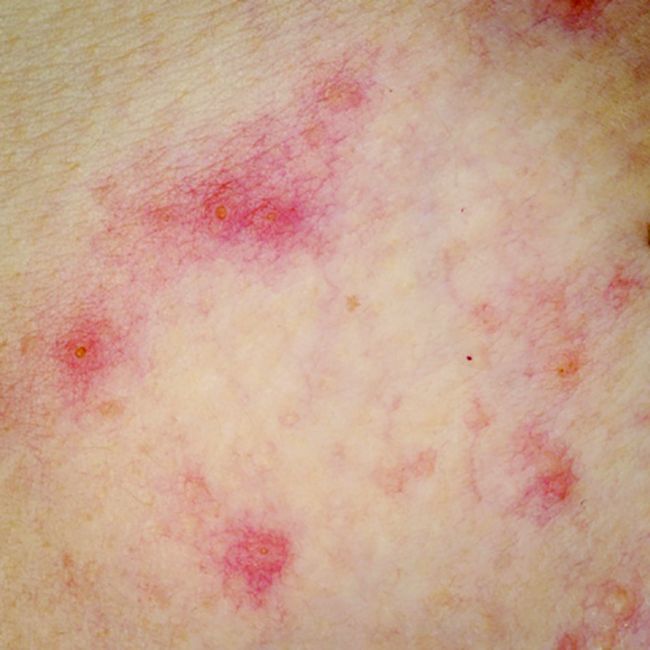
This systematic review of ten twin and sibling studies looked at known, measured environmental and genetic influences on the associations between the atopic phenotypes of the atopic march.
The studies of asthma and hay fever suggested that the prevalence of having both conditions was high (32%) and that they were more likely to occur together in monozygotic twins than they were in dizygotic twins. Similarly, other studies found a high phenotypic overlap between eczema and asthma and between eczema and hay fever, which was more pronounced in monozygotic twins than in dizygotic twins.
“Asthma is linked to hay fever and eczema through intermediate phenotypes like clinical measures of lung function, physiological measures of airway responsiveness and the biomarker exhaled nitric oxide, all of which are influenced by hereditary factors,” the authors said.
Overall, they concluded that genetic factors account for 75% of eczema cases, 70%-91% of asthma cases, and 72%-84% of hay fever cases, making them all highly heritable diseases.
“Our study found that the contribution of shared environmental factors to the proportion of correlation are very low (from 4% to 18%) and does not explain the familial patterns seen for asthma and hay fever,” they reported. “This finding contradicts various analyses where smoking behavior, indoor-outdoor pollution, and house dust mites were found to be significant risk factor for asthma and hay fever that are shared by siblings.”
The authors commented that preventing the onset of the atopic march, or arresting its development, could have significant public health implications. They suggested that interventions such as oral antihistamines could be introduced either before a child gets eczema or before a child with eczema goes on to develop asthma or hay fever. “Two randomized controlled trials showed moisturizing the skin can prevent mild to moderate eczema, and long-term studies are needed to see whether such intervention will prevent development of asthma and hay fever,” they said.
No conflicts of interest were declared.
SOURCE: Khan SJ et al. Allergy. 2018 Jan;73(1):17-28.
according to a systematic review.
PhD candidate Sabria Khan and her colleagues at the Centre for Epidemiology and Biostatistics at the University of Melbourne said that the atopic march concept “asserts that allergic diseases start in early life with eczema, progress through food allergy, and culminate with hay fever and asthma.”
This systematic review of ten twin and sibling studies looked at known, measured environmental and genetic influences on the associations between the atopic phenotypes of the atopic march.
The studies of asthma and hay fever suggested that the prevalence of having both conditions was high (32%) and that they were more likely to occur together in monozygotic twins than they were in dizygotic twins. Similarly, other studies found a high phenotypic overlap between eczema and asthma and between eczema and hay fever, which was more pronounced in monozygotic twins than in dizygotic twins.
“Asthma is linked to hay fever and eczema through intermediate phenotypes like clinical measures of lung function, physiological measures of airway responsiveness and the biomarker exhaled nitric oxide, all of which are influenced by hereditary factors,” the authors said.
Overall, they concluded that genetic factors account for 75% of eczema cases, 70%-91% of asthma cases, and 72%-84% of hay fever cases, making them all highly heritable diseases.
“Our study found that the contribution of shared environmental factors to the proportion of correlation are very low (from 4% to 18%) and does not explain the familial patterns seen for asthma and hay fever,” they reported. “This finding contradicts various analyses where smoking behavior, indoor-outdoor pollution, and house dust mites were found to be significant risk factor for asthma and hay fever that are shared by siblings.”
The authors commented that preventing the onset of the atopic march, or arresting its development, could have significant public health implications. They suggested that interventions such as oral antihistamines could be introduced either before a child gets eczema or before a child with eczema goes on to develop asthma or hay fever. “Two randomized controlled trials showed moisturizing the skin can prevent mild to moderate eczema, and long-term studies are needed to see whether such intervention will prevent development of asthma and hay fever,” they said.
No conflicts of interest were declared.
SOURCE: Khan SJ et al. Allergy. 2018 Jan;73(1):17-28.
according to a systematic review.
PhD candidate Sabria Khan and her colleagues at the Centre for Epidemiology and Biostatistics at the University of Melbourne said that the atopic march concept “asserts that allergic diseases start in early life with eczema, progress through food allergy, and culminate with hay fever and asthma.”
This systematic review of ten twin and sibling studies looked at known, measured environmental and genetic influences on the associations between the atopic phenotypes of the atopic march.
The studies of asthma and hay fever suggested that the prevalence of having both conditions was high (32%) and that they were more likely to occur together in monozygotic twins than they were in dizygotic twins. Similarly, other studies found a high phenotypic overlap between eczema and asthma and between eczema and hay fever, which was more pronounced in monozygotic twins than in dizygotic twins.
“Asthma is linked to hay fever and eczema through intermediate phenotypes like clinical measures of lung function, physiological measures of airway responsiveness and the biomarker exhaled nitric oxide, all of which are influenced by hereditary factors,” the authors said.
Overall, they concluded that genetic factors account for 75% of eczema cases, 70%-91% of asthma cases, and 72%-84% of hay fever cases, making them all highly heritable diseases.
“Our study found that the contribution of shared environmental factors to the proportion of correlation are very low (from 4% to 18%) and does not explain the familial patterns seen for asthma and hay fever,” they reported. “This finding contradicts various analyses where smoking behavior, indoor-outdoor pollution, and house dust mites were found to be significant risk factor for asthma and hay fever that are shared by siblings.”
The authors commented that preventing the onset of the atopic march, or arresting its development, could have significant public health implications. They suggested that interventions such as oral antihistamines could be introduced either before a child gets eczema or before a child with eczema goes on to develop asthma or hay fever. “Two randomized controlled trials showed moisturizing the skin can prevent mild to moderate eczema, and long-term studies are needed to see whether such intervention will prevent development of asthma and hay fever,” they said.
No conflicts of interest were declared.
SOURCE: Khan SJ et al. Allergy. 2018 Jan;73(1):17-28.
FROM ALLERGY
Key clinical point: Twin and sibling studies suggest that genetics play a far more significant role than environmental factors in the progression of atopic disease in childhood known as the “atopic march.”
Major finding: Genetic factors account for 75% of eczema, 70%-91% of asthma, and 72%-84% of hay fever.
Data source: Systematic review of ten twin and sibling studies.
Disclosures: No conflicts of interest were declared.
Source: Khan SJ et al. Allergy. 2018 Jan;73(1):17-28.
Use of non–vitamin K antagonist oral anticoagulants in the acute care, periprocedural settings
Non–vitamin K antagonist anticoagulants (NOACs, also called novel or direct oral anticoagulants) are commonly used to treat and prevent venous thromboembolism (VTE) and to prevent ischemic stroke in patients with nonvalvular atrial fibrillation. These agents, which include the factor Xa inhibitors rivaroxaban (Xarelto), apixaban (Eliquis), and edoxaban (Savaysa), and the competitive thrombin inhibitor dabigatran (Pradaxa), often are preferred over warfarin because of their more predictable pharmacokinetics, comparable efficacy, comparable or lower risk of major bleeding complications, fewer drug interactions, and lack of need for frequent monitoring. However, the acute care of patients taking NOACS can be challenging, because only dabigatran has an approved reversal agent, and none have readily available, reliable measurement assays. The American Heart Association (AHA) published a statement on the periprocedural and acute care management of patients taking NOACs. Here are the findings and recommendations of the AHA that are most relevant to primary care physicians.
Measurement
While all NOACs affect coagulation tests, their effect on prothrombin time and activated partial thromboplastin time is neither predictable nor an accurate reflection of the degree of anticoagulation. Instead, use the time of last drug ingestion and the patient’s creatinine clearance to estimate the anticoagulation effect. Dabigatran takes 1 hour to reach peak effect, or 2 hours if taken with food. Its half-life is 12-17 hours, on the higher end in the elderly and in those with moderate renal impairment. In those with severe renal impairment, half-life can be 28 hours. Rivaroxaban’s time to peak is 2-4 hours, and its half-life is 5-9 hours or up to 13 in the elderly. Apixaban’s time to peak is 3-4 hours and its half-life is about 12 hours. An antifactor Xa activity assay does provide a quantitative assessment of the factor Xa inhibitors.
Kidney injury
Acute kidney injury increases risk of bleeding while taking a NOAC. Monitor these patients closely and consider temporarily switching to a different anticoagulant in the setting of kidney injury.
Bleeding
Lack of reversibility is a common concern. Use 5 g of IV idarucizumab (Praxbind) to reverse dabigatran within minutes in a patient experiencing major bleeding. Hemodialysis, which removes about half of dabigatran in 4 hours, is a suitable option in acute kidney injury or in patients with a creatinine clearance under 30mL/min.
Options are more limited for the Xa inhibitors, because there are no available reversal agents and hemodialysis does not clear these highly protein-bound drugs. While data are limited, prothrombin complex concentrate may be given for patients on rivaroxaban, apixaban, or edoxaban who are experiencing an intracranial hemorrhage or other form of severe bleeding. Simply holding the NOAC is acceptable for minor bleeding.
Overdose
Activated charcoal to induce vomiting will work within 1-2 hours of drug ingestion.
Intracranial hemorrhage
Assume that a patient taking a NOAC who displays any acute neurologic change is experiencing an intracranial hemorrhage until proven otherwise. After CT confirmation, reverse dabigatran with idarucizumab, or give prothrombin complex concentrate to patients on other NOACs.
Ischemic stroke
Patients who suffer an ischemic stroke despite NOAC therapy are not candidates for tissue plasminogen activators.
The primary care physician is likely to be involved in the decision of whether, when, and for how long to resume anticoagulation therapy after a stroke. The statement says, “guidelines support withholding oral anticoagulation until 1-2 weeks after stroke among individuals with NVAF [nonvalvular atrial fibrillation], with shorter times for those with transient ischemic attack or small, nondisabling strokes and longer times for moderate to severe strokes.” In addition, it is worthwhile to consider medication nonadherence if no other etiology for the stroke is found; patients who miss doses may benefit more from warfarin because of its longer half-life.
Procedures and surgeries
Each year approximately 10% of patients on anticoagulation require surgery or other invasive procedures, and 20% require a minor procedure. To determine whether to interrupt NOAC therapy prior to a procedure, first determine the procedure’s bleeding risk. Patients undergoing procedures with low risk of bleeding, including minor dental, dermatologic, and ophthalmologic procedures, and endoscopies without biopsies, do not require interruption. For procedures with a moderate bleeding risk (including cardiac ablation, endoscopy with biopsies, radial artery catheterization) or high bleeding risk (including major surgery and cardiac catheterization via femoral artery), the patient’s thromboembolic risk should be evaluated using the medical history and the CHA2DS2 VASc score. NOACs should be stopped for 24-48 hours prior to the moderate to high-risk procedures. Dabigatran should be held for 72 hours for patients with creatinine clearance less than 50mL/min. Bridging therapy with heparin is not recommended for patients taking NOACS who are to have surgery. The decision about when to restart NOAC is based on the risk of thromboembolism and the bleeding risk of surgery.
Spinal or epidural anesthesia
Anesthesia guidelines recommend holding NOACs 3-5 days prior to the intervention, however, this increases risk of TE and studies have shown a very low incidence of hematoma in patients anticoagulated with a NOAC. For patients with a high risk of VTE, the NOAC can be resumed 12 hours post-procedure.
The bottom line
NOACS are commonly used for treatment and prophylaxis of VTE and atrial fibrillation and are often preferred over warfarin due to their more predictable pharmacokinetics, comparable efficacy, comparable or lower risk of major bleeding complications, fewer drug interactions, and lack of need for frequent monitoring. The AHA scientific statement gives guidance on managing NOACS in the face of acute bleeding as well as during and after procedures. NOACS should be stopped 24-48 hours prior to major surgeries and may be restarted based on weighing the risk of bleeding and risk of thromboembolism.
Dr. Skolnik is professor of family and community medicine at Sidney Kimmel Medical College, Thomas Jefferson University, Philadelphia, and associate director of the family medicine residency program at Abington (Pa.) Jefferson Health. Dr. Oh is a third-year resident in the family medicine residency program at Abington Jefferson Health.
Reference
Raval AN et al. Management of patients on non–vitamin K antagonist oral anticoagulants in the acute care and periprocedural setting: A scientific statement from the American Heart Association. Circulation. 2017 Feb 6;135[10]:e604-e33. doi: 10.1161/CIR.0000000000000477
Non–vitamin K antagonist anticoagulants (NOACs, also called novel or direct oral anticoagulants) are commonly used to treat and prevent venous thromboembolism (VTE) and to prevent ischemic stroke in patients with nonvalvular atrial fibrillation. These agents, which include the factor Xa inhibitors rivaroxaban (Xarelto), apixaban (Eliquis), and edoxaban (Savaysa), and the competitive thrombin inhibitor dabigatran (Pradaxa), often are preferred over warfarin because of their more predictable pharmacokinetics, comparable efficacy, comparable or lower risk of major bleeding complications, fewer drug interactions, and lack of need for frequent monitoring. However, the acute care of patients taking NOACS can be challenging, because only dabigatran has an approved reversal agent, and none have readily available, reliable measurement assays. The American Heart Association (AHA) published a statement on the periprocedural and acute care management of patients taking NOACs. Here are the findings and recommendations of the AHA that are most relevant to primary care physicians.
Measurement
While all NOACs affect coagulation tests, their effect on prothrombin time and activated partial thromboplastin time is neither predictable nor an accurate reflection of the degree of anticoagulation. Instead, use the time of last drug ingestion and the patient’s creatinine clearance to estimate the anticoagulation effect. Dabigatran takes 1 hour to reach peak effect, or 2 hours if taken with food. Its half-life is 12-17 hours, on the higher end in the elderly and in those with moderate renal impairment. In those with severe renal impairment, half-life can be 28 hours. Rivaroxaban’s time to peak is 2-4 hours, and its half-life is 5-9 hours or up to 13 in the elderly. Apixaban’s time to peak is 3-4 hours and its half-life is about 12 hours. An antifactor Xa activity assay does provide a quantitative assessment of the factor Xa inhibitors.
Kidney injury
Acute kidney injury increases risk of bleeding while taking a NOAC. Monitor these patients closely and consider temporarily switching to a different anticoagulant in the setting of kidney injury.
Bleeding
Lack of reversibility is a common concern. Use 5 g of IV idarucizumab (Praxbind) to reverse dabigatran within minutes in a patient experiencing major bleeding. Hemodialysis, which removes about half of dabigatran in 4 hours, is a suitable option in acute kidney injury or in patients with a creatinine clearance under 30mL/min.
Options are more limited for the Xa inhibitors, because there are no available reversal agents and hemodialysis does not clear these highly protein-bound drugs. While data are limited, prothrombin complex concentrate may be given for patients on rivaroxaban, apixaban, or edoxaban who are experiencing an intracranial hemorrhage or other form of severe bleeding. Simply holding the NOAC is acceptable for minor bleeding.
Overdose
Activated charcoal to induce vomiting will work within 1-2 hours of drug ingestion.
Intracranial hemorrhage
Assume that a patient taking a NOAC who displays any acute neurologic change is experiencing an intracranial hemorrhage until proven otherwise. After CT confirmation, reverse dabigatran with idarucizumab, or give prothrombin complex concentrate to patients on other NOACs.
Ischemic stroke
Patients who suffer an ischemic stroke despite NOAC therapy are not candidates for tissue plasminogen activators.
The primary care physician is likely to be involved in the decision of whether, when, and for how long to resume anticoagulation therapy after a stroke. The statement says, “guidelines support withholding oral anticoagulation until 1-2 weeks after stroke among individuals with NVAF [nonvalvular atrial fibrillation], with shorter times for those with transient ischemic attack or small, nondisabling strokes and longer times for moderate to severe strokes.” In addition, it is worthwhile to consider medication nonadherence if no other etiology for the stroke is found; patients who miss doses may benefit more from warfarin because of its longer half-life.
Procedures and surgeries
Each year approximately 10% of patients on anticoagulation require surgery or other invasive procedures, and 20% require a minor procedure. To determine whether to interrupt NOAC therapy prior to a procedure, first determine the procedure’s bleeding risk. Patients undergoing procedures with low risk of bleeding, including minor dental, dermatologic, and ophthalmologic procedures, and endoscopies without biopsies, do not require interruption. For procedures with a moderate bleeding risk (including cardiac ablation, endoscopy with biopsies, radial artery catheterization) or high bleeding risk (including major surgery and cardiac catheterization via femoral artery), the patient’s thromboembolic risk should be evaluated using the medical history and the CHA2DS2 VASc score. NOACs should be stopped for 24-48 hours prior to the moderate to high-risk procedures. Dabigatran should be held for 72 hours for patients with creatinine clearance less than 50mL/min. Bridging therapy with heparin is not recommended for patients taking NOACS who are to have surgery. The decision about when to restart NOAC is based on the risk of thromboembolism and the bleeding risk of surgery.
Spinal or epidural anesthesia
Anesthesia guidelines recommend holding NOACs 3-5 days prior to the intervention, however, this increases risk of TE and studies have shown a very low incidence of hematoma in patients anticoagulated with a NOAC. For patients with a high risk of VTE, the NOAC can be resumed 12 hours post-procedure.
The bottom line
NOACS are commonly used for treatment and prophylaxis of VTE and atrial fibrillation and are often preferred over warfarin due to their more predictable pharmacokinetics, comparable efficacy, comparable or lower risk of major bleeding complications, fewer drug interactions, and lack of need for frequent monitoring. The AHA scientific statement gives guidance on managing NOACS in the face of acute bleeding as well as during and after procedures. NOACS should be stopped 24-48 hours prior to major surgeries and may be restarted based on weighing the risk of bleeding and risk of thromboembolism.
Dr. Skolnik is professor of family and community medicine at Sidney Kimmel Medical College, Thomas Jefferson University, Philadelphia, and associate director of the family medicine residency program at Abington (Pa.) Jefferson Health. Dr. Oh is a third-year resident in the family medicine residency program at Abington Jefferson Health.
Reference
Raval AN et al. Management of patients on non–vitamin K antagonist oral anticoagulants in the acute care and periprocedural setting: A scientific statement from the American Heart Association. Circulation. 2017 Feb 6;135[10]:e604-e33. doi: 10.1161/CIR.0000000000000477
Non–vitamin K antagonist anticoagulants (NOACs, also called novel or direct oral anticoagulants) are commonly used to treat and prevent venous thromboembolism (VTE) and to prevent ischemic stroke in patients with nonvalvular atrial fibrillation. These agents, which include the factor Xa inhibitors rivaroxaban (Xarelto), apixaban (Eliquis), and edoxaban (Savaysa), and the competitive thrombin inhibitor dabigatran (Pradaxa), often are preferred over warfarin because of their more predictable pharmacokinetics, comparable efficacy, comparable or lower risk of major bleeding complications, fewer drug interactions, and lack of need for frequent monitoring. However, the acute care of patients taking NOACS can be challenging, because only dabigatran has an approved reversal agent, and none have readily available, reliable measurement assays. The American Heart Association (AHA) published a statement on the periprocedural and acute care management of patients taking NOACs. Here are the findings and recommendations of the AHA that are most relevant to primary care physicians.
Measurement
While all NOACs affect coagulation tests, their effect on prothrombin time and activated partial thromboplastin time is neither predictable nor an accurate reflection of the degree of anticoagulation. Instead, use the time of last drug ingestion and the patient’s creatinine clearance to estimate the anticoagulation effect. Dabigatran takes 1 hour to reach peak effect, or 2 hours if taken with food. Its half-life is 12-17 hours, on the higher end in the elderly and in those with moderate renal impairment. In those with severe renal impairment, half-life can be 28 hours. Rivaroxaban’s time to peak is 2-4 hours, and its half-life is 5-9 hours or up to 13 in the elderly. Apixaban’s time to peak is 3-4 hours and its half-life is about 12 hours. An antifactor Xa activity assay does provide a quantitative assessment of the factor Xa inhibitors.
Kidney injury
Acute kidney injury increases risk of bleeding while taking a NOAC. Monitor these patients closely and consider temporarily switching to a different anticoagulant in the setting of kidney injury.
Bleeding
Lack of reversibility is a common concern. Use 5 g of IV idarucizumab (Praxbind) to reverse dabigatran within minutes in a patient experiencing major bleeding. Hemodialysis, which removes about half of dabigatran in 4 hours, is a suitable option in acute kidney injury or in patients with a creatinine clearance under 30mL/min.
Options are more limited for the Xa inhibitors, because there are no available reversal agents and hemodialysis does not clear these highly protein-bound drugs. While data are limited, prothrombin complex concentrate may be given for patients on rivaroxaban, apixaban, or edoxaban who are experiencing an intracranial hemorrhage or other form of severe bleeding. Simply holding the NOAC is acceptable for minor bleeding.
Overdose
Activated charcoal to induce vomiting will work within 1-2 hours of drug ingestion.
Intracranial hemorrhage
Assume that a patient taking a NOAC who displays any acute neurologic change is experiencing an intracranial hemorrhage until proven otherwise. After CT confirmation, reverse dabigatran with idarucizumab, or give prothrombin complex concentrate to patients on other NOACs.
Ischemic stroke
Patients who suffer an ischemic stroke despite NOAC therapy are not candidates for tissue plasminogen activators.
The primary care physician is likely to be involved in the decision of whether, when, and for how long to resume anticoagulation therapy after a stroke. The statement says, “guidelines support withholding oral anticoagulation until 1-2 weeks after stroke among individuals with NVAF [nonvalvular atrial fibrillation], with shorter times for those with transient ischemic attack or small, nondisabling strokes and longer times for moderate to severe strokes.” In addition, it is worthwhile to consider medication nonadherence if no other etiology for the stroke is found; patients who miss doses may benefit more from warfarin because of its longer half-life.
Procedures and surgeries
Each year approximately 10% of patients on anticoagulation require surgery or other invasive procedures, and 20% require a minor procedure. To determine whether to interrupt NOAC therapy prior to a procedure, first determine the procedure’s bleeding risk. Patients undergoing procedures with low risk of bleeding, including minor dental, dermatologic, and ophthalmologic procedures, and endoscopies without biopsies, do not require interruption. For procedures with a moderate bleeding risk (including cardiac ablation, endoscopy with biopsies, radial artery catheterization) or high bleeding risk (including major surgery and cardiac catheterization via femoral artery), the patient’s thromboembolic risk should be evaluated using the medical history and the CHA2DS2 VASc score. NOACs should be stopped for 24-48 hours prior to the moderate to high-risk procedures. Dabigatran should be held for 72 hours for patients with creatinine clearance less than 50mL/min. Bridging therapy with heparin is not recommended for patients taking NOACS who are to have surgery. The decision about when to restart NOAC is based on the risk of thromboembolism and the bleeding risk of surgery.
Spinal or epidural anesthesia
Anesthesia guidelines recommend holding NOACs 3-5 days prior to the intervention, however, this increases risk of TE and studies have shown a very low incidence of hematoma in patients anticoagulated with a NOAC. For patients with a high risk of VTE, the NOAC can be resumed 12 hours post-procedure.
The bottom line
NOACS are commonly used for treatment and prophylaxis of VTE and atrial fibrillation and are often preferred over warfarin due to their more predictable pharmacokinetics, comparable efficacy, comparable or lower risk of major bleeding complications, fewer drug interactions, and lack of need for frequent monitoring. The AHA scientific statement gives guidance on managing NOACS in the face of acute bleeding as well as during and after procedures. NOACS should be stopped 24-48 hours prior to major surgeries and may be restarted based on weighing the risk of bleeding and risk of thromboembolism.
Dr. Skolnik is professor of family and community medicine at Sidney Kimmel Medical College, Thomas Jefferson University, Philadelphia, and associate director of the family medicine residency program at Abington (Pa.) Jefferson Health. Dr. Oh is a third-year resident in the family medicine residency program at Abington Jefferson Health.
Reference
Raval AN et al. Management of patients on non–vitamin K antagonist oral anticoagulants in the acute care and periprocedural setting: A scientific statement from the American Heart Association. Circulation. 2017 Feb 6;135[10]:e604-e33. doi: 10.1161/CIR.0000000000000477

HIPEC shows survival benefit for advanced ovarian cancer
Patients with newly diagnosed advanced-stage ovarian cancer who were referred to receive three cycles of neoadjuvant chemotherapy experienced statistically significant improved recurrence-free survival and overall survival from hyperthermic intraperitoneal chemotherapy (HIPEC) during interval cytoreductive surgery, results of a phase 3 trial showed.
After 4.7 years’ median follow-up, 89% of patients who received surgery with no HIPEC had disease recurrence or death, compared with 81% of patients treated with HIPEC (hazard ratio, 0.66; P = .003). Patients in the HIPEC cohort experienced recurrence-free survival a median of 3.5 months longer than patients who received surgery alone (10.7 months vs. 14.2 months), Willemien J. van Driel, MD, PhD, of the Netherlands Cancer Institute, Amsterdam, and her colleagues reported in the New England Journal of Medicine.
Dr. van Driel and her coauthors also reported a median 11.8 months increased overall survival (33.9 months vs. 45.7 months) for HIPEC, compared with surgery alone.
Both recurrence-free survival and overall survival remained consistently beneficial for patients in the HIPEC group across prespecified stratification factors and subgroups, including age, histology type, regional involvement, and previous surgery, according to the researchers.
They also reported that no significant differences between the two groups were noted in the incidence of adverse events of any grade. In total, grade 3 or 4 adverse events were reported by 32 patients (27%) who received HIPEC and 30 patients (25%) who received surgery (P = .76); the most common were abdominal pain, infection, and ileus.
Combination treatment with intravenous and intraperitoneal chemotherapy has been shown to prolong overall survival after primary cytoreductive surgery, according to the authors.
“Catheter-related problems, increased demands on the patient, and gastrointestinal and renal side effects have hampered the adoption of this approach in most countries,” the researchers wrote. “Hyperthermia increases the penetration of chemotherapy at the peritoneal surface and increases the sensitivity of the cancer to chemotherapy by impairing DNA repair [and] … can circumvent most of these drawbacks while maintaining its advantages.”
This research was supported by the Dutch Cancer Society. Dr. van Driel reported no relevant financial disclosures. Two other researchers reported funding from various pharmaceutical companies as well as the KFW–Dutch Cancer Foundation.
SOURCE: van Driel WJ et al. N Engl J Med. 2018 Jan 18. doi: 10.1056/NEJMoa1708618.
Although the data reported by Dr. van Driel and her colleagues represent an important first step, the findings “should not drive changes in practice yet,” according to David R. Spriggs, MD, and Oliver Zivanovick, MD.
Dr. Spriggs and Dr. Zivanovic raised questions surrounding the efficacy of adding HIPEC to surgery and suggested that the benefit observed by Dr. van Driel and her coauthors could be attributed to several variables such as the route of intraperitoneal administration or the skill level of the attending surgeon.
Currently, certain patients with advanced ovarian cancer receive primary surgery instead of neoadjuvant chemotherapy. HIPEC does not change that approach, Dr. Spriggs and Dr. Zivanovic said.
They went on to note that further “well-designed” research could reveal other patient subgroups that warrant further investigation such as those who underwent an optimal cytoreductive procedure.
“These considerations will be important for clinical trial investigators as they focus on the positive effect of HIPEC as an intervention as compared with the effects of promising new agent combinations or immunotherapy treatments,” they wrote.
Dr. Spriggs is the associate director for clinical and translational research at Memorial Sloan Kettering Cancer Center in New York, and Dr. Zivanovic is a gynecologic oncologic surgeon at Sloan Kettering. These remarks were taken from their invited commentary on the report by Dr. van Driel and her associates. Dr. Spriggs reported that he is employed by the New England Journal of Medicine as an associate editor. Dr. Zivanovic reported no relevant financial disclosures.
SOURCE: Spriggs DR et al. N Engl J Med. 2018 Jan 18. doi: 10.1056/NEJMe1714556.
Although the data reported by Dr. van Driel and her colleagues represent an important first step, the findings “should not drive changes in practice yet,” according to David R. Spriggs, MD, and Oliver Zivanovick, MD.
Dr. Spriggs and Dr. Zivanovic raised questions surrounding the efficacy of adding HIPEC to surgery and suggested that the benefit observed by Dr. van Driel and her coauthors could be attributed to several variables such as the route of intraperitoneal administration or the skill level of the attending surgeon.
Currently, certain patients with advanced ovarian cancer receive primary surgery instead of neoadjuvant chemotherapy. HIPEC does not change that approach, Dr. Spriggs and Dr. Zivanovic said.
They went on to note that further “well-designed” research could reveal other patient subgroups that warrant further investigation such as those who underwent an optimal cytoreductive procedure.
“These considerations will be important for clinical trial investigators as they focus on the positive effect of HIPEC as an intervention as compared with the effects of promising new agent combinations or immunotherapy treatments,” they wrote.
Dr. Spriggs is the associate director for clinical and translational research at Memorial Sloan Kettering Cancer Center in New York, and Dr. Zivanovic is a gynecologic oncologic surgeon at Sloan Kettering. These remarks were taken from their invited commentary on the report by Dr. van Driel and her associates. Dr. Spriggs reported that he is employed by the New England Journal of Medicine as an associate editor. Dr. Zivanovic reported no relevant financial disclosures.
SOURCE: Spriggs DR et al. N Engl J Med. 2018 Jan 18. doi: 10.1056/NEJMe1714556.
Although the data reported by Dr. van Driel and her colleagues represent an important first step, the findings “should not drive changes in practice yet,” according to David R. Spriggs, MD, and Oliver Zivanovick, MD.
Dr. Spriggs and Dr. Zivanovic raised questions surrounding the efficacy of adding HIPEC to surgery and suggested that the benefit observed by Dr. van Driel and her coauthors could be attributed to several variables such as the route of intraperitoneal administration or the skill level of the attending surgeon.
Currently, certain patients with advanced ovarian cancer receive primary surgery instead of neoadjuvant chemotherapy. HIPEC does not change that approach, Dr. Spriggs and Dr. Zivanovic said.
They went on to note that further “well-designed” research could reveal other patient subgroups that warrant further investigation such as those who underwent an optimal cytoreductive procedure.
“These considerations will be important for clinical trial investigators as they focus on the positive effect of HIPEC as an intervention as compared with the effects of promising new agent combinations or immunotherapy treatments,” they wrote.
Dr. Spriggs is the associate director for clinical and translational research at Memorial Sloan Kettering Cancer Center in New York, and Dr. Zivanovic is a gynecologic oncologic surgeon at Sloan Kettering. These remarks were taken from their invited commentary on the report by Dr. van Driel and her associates. Dr. Spriggs reported that he is employed by the New England Journal of Medicine as an associate editor. Dr. Zivanovic reported no relevant financial disclosures.
SOURCE: Spriggs DR et al. N Engl J Med. 2018 Jan 18. doi: 10.1056/NEJMe1714556.
Patients with newly diagnosed advanced-stage ovarian cancer who were referred to receive three cycles of neoadjuvant chemotherapy experienced statistically significant improved recurrence-free survival and overall survival from hyperthermic intraperitoneal chemotherapy (HIPEC) during interval cytoreductive surgery, results of a phase 3 trial showed.
After 4.7 years’ median follow-up, 89% of patients who received surgery with no HIPEC had disease recurrence or death, compared with 81% of patients treated with HIPEC (hazard ratio, 0.66; P = .003). Patients in the HIPEC cohort experienced recurrence-free survival a median of 3.5 months longer than patients who received surgery alone (10.7 months vs. 14.2 months), Willemien J. van Driel, MD, PhD, of the Netherlands Cancer Institute, Amsterdam, and her colleagues reported in the New England Journal of Medicine.
Dr. van Driel and her coauthors also reported a median 11.8 months increased overall survival (33.9 months vs. 45.7 months) for HIPEC, compared with surgery alone.
Both recurrence-free survival and overall survival remained consistently beneficial for patients in the HIPEC group across prespecified stratification factors and subgroups, including age, histology type, regional involvement, and previous surgery, according to the researchers.
They also reported that no significant differences between the two groups were noted in the incidence of adverse events of any grade. In total, grade 3 or 4 adverse events were reported by 32 patients (27%) who received HIPEC and 30 patients (25%) who received surgery (P = .76); the most common were abdominal pain, infection, and ileus.
Combination treatment with intravenous and intraperitoneal chemotherapy has been shown to prolong overall survival after primary cytoreductive surgery, according to the authors.
“Catheter-related problems, increased demands on the patient, and gastrointestinal and renal side effects have hampered the adoption of this approach in most countries,” the researchers wrote. “Hyperthermia increases the penetration of chemotherapy at the peritoneal surface and increases the sensitivity of the cancer to chemotherapy by impairing DNA repair [and] … can circumvent most of these drawbacks while maintaining its advantages.”
This research was supported by the Dutch Cancer Society. Dr. van Driel reported no relevant financial disclosures. Two other researchers reported funding from various pharmaceutical companies as well as the KFW–Dutch Cancer Foundation.
SOURCE: van Driel WJ et al. N Engl J Med. 2018 Jan 18. doi: 10.1056/NEJMoa1708618.
Patients with newly diagnosed advanced-stage ovarian cancer who were referred to receive three cycles of neoadjuvant chemotherapy experienced statistically significant improved recurrence-free survival and overall survival from hyperthermic intraperitoneal chemotherapy (HIPEC) during interval cytoreductive surgery, results of a phase 3 trial showed.
After 4.7 years’ median follow-up, 89% of patients who received surgery with no HIPEC had disease recurrence or death, compared with 81% of patients treated with HIPEC (hazard ratio, 0.66; P = .003). Patients in the HIPEC cohort experienced recurrence-free survival a median of 3.5 months longer than patients who received surgery alone (10.7 months vs. 14.2 months), Willemien J. van Driel, MD, PhD, of the Netherlands Cancer Institute, Amsterdam, and her colleagues reported in the New England Journal of Medicine.
Dr. van Driel and her coauthors also reported a median 11.8 months increased overall survival (33.9 months vs. 45.7 months) for HIPEC, compared with surgery alone.
Both recurrence-free survival and overall survival remained consistently beneficial for patients in the HIPEC group across prespecified stratification factors and subgroups, including age, histology type, regional involvement, and previous surgery, according to the researchers.
They also reported that no significant differences between the two groups were noted in the incidence of adverse events of any grade. In total, grade 3 or 4 adverse events were reported by 32 patients (27%) who received HIPEC and 30 patients (25%) who received surgery (P = .76); the most common were abdominal pain, infection, and ileus.
Combination treatment with intravenous and intraperitoneal chemotherapy has been shown to prolong overall survival after primary cytoreductive surgery, according to the authors.
“Catheter-related problems, increased demands on the patient, and gastrointestinal and renal side effects have hampered the adoption of this approach in most countries,” the researchers wrote. “Hyperthermia increases the penetration of chemotherapy at the peritoneal surface and increases the sensitivity of the cancer to chemotherapy by impairing DNA repair [and] … can circumvent most of these drawbacks while maintaining its advantages.”
This research was supported by the Dutch Cancer Society. Dr. van Driel reported no relevant financial disclosures. Two other researchers reported funding from various pharmaceutical companies as well as the KFW–Dutch Cancer Foundation.
SOURCE: van Driel WJ et al. N Engl J Med. 2018 Jan 18. doi: 10.1056/NEJMoa1708618.
FROM NEW ENGLAND JOURNAL OF MEDICINE
Key clinical point: Administering HIPEC during interval cytoreductive surgery lengthened survival without increasing safety risk for patients with advanced-stage ovarian cancer.
Major finding: Patients who received HIPEC experienced a median recurrence-free survival that was 3.5 months longer and overall survival that was 11.8 months longer than patients who received surgery alone.
Study details: A multicenter, open-label phase 3 trial that randomly assigned patients who had received neoadjuvant chemotherapy to receive either HIPEC or surgery alone with an endpoint of recurrence-free survival.
Disclosures: This research was supported by the Dutch Cancer Society. Dr. van Driel reported no relevant financial disclosures. Two other researchers reported funding from various pharmaceutical companies as well as the KFW–Dutch Cancer Foundation.
Source: van Driel WJ et al. N Engl J Med. 2018 Jan 18. doi: 10.1056/NEJMoa1708618.
Thrombosis risk is elevated with myeloproliferative neoplasms
Patients with myeloproliferative neoplasms (MPNs) have a higher rate of arterial and venous thrombosis than does the general population, with the greatest risk occurring around the time of diagnosis, according to results of a retrospective study.
Hazard ratios at 3 months after diagnosis were 3.0 (95% CI, 2.7-3.4) for arterial thrombosis and 9.7 (95% CI, 7.8-12.0) for venous thrombosis, compared with matched controls, Malin Hultcrantz, MD, PhD, of the Karolinska University Hospital, Stockholm, and her coauthors reported in the Annals of Internal Medicine.
Although previous studies have suggested patients with MPNs are at increased risk for thrombotic events, this large, population-based analysis is believed to be the first study to provide estimates of excess risk compared with matched control participants.
“These results are encouraging, and we believe that further refinement of risk scoring systems (such as by including time since MPN diagnosis and biomarkers); rethinking of recommendations for younger patients with MPNs; and emerging, more effective treatments will further improve outcomes for patients with MPNs,” the researchers wrote.
The retrospective, population-based cohort study included 9,429 Swedish patients diagnosed with MPNs between 1987 and 2009 and 35,820 matched control participants. Patient follow-up through 2010 was included in the analysis.
Thrombosis risk was highest near the time of diagnosis but decreased during the following year “likely because of effective thromboprophylactic and cytoreductive treatment of the MPN;”still, the risk remained elevated, the researchers wrote.
“This novel finding underlines the importance of initiating phlebotomy as well as thromboprophylactic and cytoreductive treatment, when indicated, as soon as the MPN is diagnosed,” they added.
Arterial thrombosis hazard ratios for MPN patients, compared with control participants, were 3.0 at 3 months after diagnosis, 2.0 at 1 year, and 1.5 at 5 years. Similarly, venous thrombosis hazard ratios were 9.7 at 3 months, 4.7 at 1 year, and 3.2 at 5 years.
Thrombosis risk was elevated in all age groups and all MPN subtypes, including primary myelofibrosis, polycythemia vera, and essential thrombocythemia. Of note, the study confirmed prior thrombosis and older age (60 years or older) as risk factors. Among patients with both of those risk factors, risk of thrombosis was increased 7-fold, according to the researchers.
Hazard ratios for thrombosis decreased during more recent time periods, suggesting a “positive effect” of improved treatment strategies, including increased use of aspirin as primary prophylaxis, better cardiovascular risk management, and better adherence to recommendations for cytoreductive treatment and phlebotomy, the researchers noted. Additionally, treatment with interferon and Janus kinase 2 inhibitors, such as ruxolitinib, “may be effective in further reducing risk for thrombosis,” the researchers wrote.
The study was funded by the Cancer Research Foundations of Radiumhemmet, the Swedish Research Council, and Memorial Sloan Kettering Cancer Center, among other sources. The researchers reported having no financial disclosures relevant to the study.
SOURCE: Hultcrantz M et al. Ann Intern Med. 2018. doi: 10.7326/M17-0028.
The most notable contribution of the large cohort study by Hultcrantz and her colleagues is quantification of the magnitude of thrombotic risk that MPNs confer, according to Alison R. Moliterno, MD, and Elizabeth V. Ratchford, MD.
“Hultcrantz and colleagues have opened our eyes to the magnitude of thrombotic risk MPNs bring to affected patients,” Dr. Moliterno and Dr. Ratchford wrote in an editorial in Annals of Internal Medicine. “Their study shows us that the traditional approach to assessing thrombotic risk in patients with MPNs [who are age 60 years and older, have prior thrombotic event, and have traditional cardiovascular risk factors] lacks precision and personalization.”
Both arterial and venous thrombotic events were increased throughout patients’ lifetimes, though the highest risk was around the time of MPN diagnosis. According to study results, 10% of patients had a thrombotic event in the 30 days before or after diagnosis.
“Patients and clinicians should be keenly aware of this particularly risky period, during which risk for thrombosis is similar to that in the month after a transient ischemic attack,” Dr. Moliterno and Dr. Ratchford wrote.
Unfortunately, the study did not include data on genomics, they noted. The acquired JAK2 V617F mutation, which drives MPN phenotypes, is associated with elevated inflammatory cytokines, and inflammation is a recognized risk factor for thrombosis, according to the editorial authors.
Alison R. Moliterno, MD, and Elizabeth V. Ratchford, MD, are with Johns Hopkins University, Baltimore. These comments are adapted from an accompanying editorial (Ann Intern Med. 2018. doi: 10.7326/M17-3153). The authors reported having no relevant conflicts related to the study.
The most notable contribution of the large cohort study by Hultcrantz and her colleagues is quantification of the magnitude of thrombotic risk that MPNs confer, according to Alison R. Moliterno, MD, and Elizabeth V. Ratchford, MD.
“Hultcrantz and colleagues have opened our eyes to the magnitude of thrombotic risk MPNs bring to affected patients,” Dr. Moliterno and Dr. Ratchford wrote in an editorial in Annals of Internal Medicine. “Their study shows us that the traditional approach to assessing thrombotic risk in patients with MPNs [who are age 60 years and older, have prior thrombotic event, and have traditional cardiovascular risk factors] lacks precision and personalization.”
Both arterial and venous thrombotic events were increased throughout patients’ lifetimes, though the highest risk was around the time of MPN diagnosis. According to study results, 10% of patients had a thrombotic event in the 30 days before or after diagnosis.
“Patients and clinicians should be keenly aware of this particularly risky period, during which risk for thrombosis is similar to that in the month after a transient ischemic attack,” Dr. Moliterno and Dr. Ratchford wrote.
Unfortunately, the study did not include data on genomics, they noted. The acquired JAK2 V617F mutation, which drives MPN phenotypes, is associated with elevated inflammatory cytokines, and inflammation is a recognized risk factor for thrombosis, according to the editorial authors.
Alison R. Moliterno, MD, and Elizabeth V. Ratchford, MD, are with Johns Hopkins University, Baltimore. These comments are adapted from an accompanying editorial (Ann Intern Med. 2018. doi: 10.7326/M17-3153). The authors reported having no relevant conflicts related to the study.
The most notable contribution of the large cohort study by Hultcrantz and her colleagues is quantification of the magnitude of thrombotic risk that MPNs confer, according to Alison R. Moliterno, MD, and Elizabeth V. Ratchford, MD.
“Hultcrantz and colleagues have opened our eyes to the magnitude of thrombotic risk MPNs bring to affected patients,” Dr. Moliterno and Dr. Ratchford wrote in an editorial in Annals of Internal Medicine. “Their study shows us that the traditional approach to assessing thrombotic risk in patients with MPNs [who are age 60 years and older, have prior thrombotic event, and have traditional cardiovascular risk factors] lacks precision and personalization.”
Both arterial and venous thrombotic events were increased throughout patients’ lifetimes, though the highest risk was around the time of MPN diagnosis. According to study results, 10% of patients had a thrombotic event in the 30 days before or after diagnosis.
“Patients and clinicians should be keenly aware of this particularly risky period, during which risk for thrombosis is similar to that in the month after a transient ischemic attack,” Dr. Moliterno and Dr. Ratchford wrote.
Unfortunately, the study did not include data on genomics, they noted. The acquired JAK2 V617F mutation, which drives MPN phenotypes, is associated with elevated inflammatory cytokines, and inflammation is a recognized risk factor for thrombosis, according to the editorial authors.
Alison R. Moliterno, MD, and Elizabeth V. Ratchford, MD, are with Johns Hopkins University, Baltimore. These comments are adapted from an accompanying editorial (Ann Intern Med. 2018. doi: 10.7326/M17-3153). The authors reported having no relevant conflicts related to the study.
Patients with myeloproliferative neoplasms (MPNs) have a higher rate of arterial and venous thrombosis than does the general population, with the greatest risk occurring around the time of diagnosis, according to results of a retrospective study.
Hazard ratios at 3 months after diagnosis were 3.0 (95% CI, 2.7-3.4) for arterial thrombosis and 9.7 (95% CI, 7.8-12.0) for venous thrombosis, compared with matched controls, Malin Hultcrantz, MD, PhD, of the Karolinska University Hospital, Stockholm, and her coauthors reported in the Annals of Internal Medicine.
Although previous studies have suggested patients with MPNs are at increased risk for thrombotic events, this large, population-based analysis is believed to be the first study to provide estimates of excess risk compared with matched control participants.
“These results are encouraging, and we believe that further refinement of risk scoring systems (such as by including time since MPN diagnosis and biomarkers); rethinking of recommendations for younger patients with MPNs; and emerging, more effective treatments will further improve outcomes for patients with MPNs,” the researchers wrote.
The retrospective, population-based cohort study included 9,429 Swedish patients diagnosed with MPNs between 1987 and 2009 and 35,820 matched control participants. Patient follow-up through 2010 was included in the analysis.
Thrombosis risk was highest near the time of diagnosis but decreased during the following year “likely because of effective thromboprophylactic and cytoreductive treatment of the MPN;”still, the risk remained elevated, the researchers wrote.
“This novel finding underlines the importance of initiating phlebotomy as well as thromboprophylactic and cytoreductive treatment, when indicated, as soon as the MPN is diagnosed,” they added.
Arterial thrombosis hazard ratios for MPN patients, compared with control participants, were 3.0 at 3 months after diagnosis, 2.0 at 1 year, and 1.5 at 5 years. Similarly, venous thrombosis hazard ratios were 9.7 at 3 months, 4.7 at 1 year, and 3.2 at 5 years.
Thrombosis risk was elevated in all age groups and all MPN subtypes, including primary myelofibrosis, polycythemia vera, and essential thrombocythemia. Of note, the study confirmed prior thrombosis and older age (60 years or older) as risk factors. Among patients with both of those risk factors, risk of thrombosis was increased 7-fold, according to the researchers.
Hazard ratios for thrombosis decreased during more recent time periods, suggesting a “positive effect” of improved treatment strategies, including increased use of aspirin as primary prophylaxis, better cardiovascular risk management, and better adherence to recommendations for cytoreductive treatment and phlebotomy, the researchers noted. Additionally, treatment with interferon and Janus kinase 2 inhibitors, such as ruxolitinib, “may be effective in further reducing risk for thrombosis,” the researchers wrote.
The study was funded by the Cancer Research Foundations of Radiumhemmet, the Swedish Research Council, and Memorial Sloan Kettering Cancer Center, among other sources. The researchers reported having no financial disclosures relevant to the study.
SOURCE: Hultcrantz M et al. Ann Intern Med. 2018. doi: 10.7326/M17-0028.
Patients with myeloproliferative neoplasms (MPNs) have a higher rate of arterial and venous thrombosis than does the general population, with the greatest risk occurring around the time of diagnosis, according to results of a retrospective study.
Hazard ratios at 3 months after diagnosis were 3.0 (95% CI, 2.7-3.4) for arterial thrombosis and 9.7 (95% CI, 7.8-12.0) for venous thrombosis, compared with matched controls, Malin Hultcrantz, MD, PhD, of the Karolinska University Hospital, Stockholm, and her coauthors reported in the Annals of Internal Medicine.
Although previous studies have suggested patients with MPNs are at increased risk for thrombotic events, this large, population-based analysis is believed to be the first study to provide estimates of excess risk compared with matched control participants.
“These results are encouraging, and we believe that further refinement of risk scoring systems (such as by including time since MPN diagnosis and biomarkers); rethinking of recommendations for younger patients with MPNs; and emerging, more effective treatments will further improve outcomes for patients with MPNs,” the researchers wrote.
The retrospective, population-based cohort study included 9,429 Swedish patients diagnosed with MPNs between 1987 and 2009 and 35,820 matched control participants. Patient follow-up through 2010 was included in the analysis.
Thrombosis risk was highest near the time of diagnosis but decreased during the following year “likely because of effective thromboprophylactic and cytoreductive treatment of the MPN;”still, the risk remained elevated, the researchers wrote.
“This novel finding underlines the importance of initiating phlebotomy as well as thromboprophylactic and cytoreductive treatment, when indicated, as soon as the MPN is diagnosed,” they added.
Arterial thrombosis hazard ratios for MPN patients, compared with control participants, were 3.0 at 3 months after diagnosis, 2.0 at 1 year, and 1.5 at 5 years. Similarly, venous thrombosis hazard ratios were 9.7 at 3 months, 4.7 at 1 year, and 3.2 at 5 years.
Thrombosis risk was elevated in all age groups and all MPN subtypes, including primary myelofibrosis, polycythemia vera, and essential thrombocythemia. Of note, the study confirmed prior thrombosis and older age (60 years or older) as risk factors. Among patients with both of those risk factors, risk of thrombosis was increased 7-fold, according to the researchers.
Hazard ratios for thrombosis decreased during more recent time periods, suggesting a “positive effect” of improved treatment strategies, including increased use of aspirin as primary prophylaxis, better cardiovascular risk management, and better adherence to recommendations for cytoreductive treatment and phlebotomy, the researchers noted. Additionally, treatment with interferon and Janus kinase 2 inhibitors, such as ruxolitinib, “may be effective in further reducing risk for thrombosis,” the researchers wrote.
The study was funded by the Cancer Research Foundations of Radiumhemmet, the Swedish Research Council, and Memorial Sloan Kettering Cancer Center, among other sources. The researchers reported having no financial disclosures relevant to the study.
SOURCE: Hultcrantz M et al. Ann Intern Med. 2018. doi: 10.7326/M17-0028.
FROM ANNALS OF INTERNAL MEDICINE
Key clinical point:
Major finding: Hazard ratios (HRs) at 3 months were 3.0 (95% confidence interval, 2.7-3.4) for arterial thrombosis and 9.7 (95% CI, 7.8-12.0) for venous thrombosis, compared with matched controls.
Study details: A Swedish retrospective, population-based study including 9,429 patients with MPNs and 35,820 matched control participants.
Disclosures: The study was funded by the Cancer Research Foundations of Radiumhemmet, the Swedish Research Council, and Memorial Sloan Kettering Cancer Center, among other sources. The researchers reported having no relevant financial disclosures.
Source: Hultcrantz M et al. Ann Intern Med. 2018. doi: 10.7326/M17-0028.
OS similar among mRCC patients enrolled in clinical trials across different geographic regions
Overall survival was similar among patients enrolled in clinical trials for metastatic renal cell carcinoma (mRCC) across different geographic regions, according to a pooled retrospective analysis.
Demographic characteristics, clinicopathologic variables, survival, and toxicity data were collected across five geographic regions, including, United States/Canada (USC), Western Europe (WE), Eastern Europe (EE), Latin America (LA), and Asia/Africa/Oceania (AAO) for 4,736 patients who had mRCC treated between 2003 and 2013 and were enrolled in phase 2 and phase 3 clinical trials.
Patients in USC and WE were slightly older (mean ages, 60.6 and 60.5 years, respectively) and with higher numbers undergoing prior nephrectomy. Higher BMI was also observed in patients in the USC and LA regions. While ECOG performance status of 0 was more frequent in LA patients, treatment-related adverse events and use of statin and angiotensin inhibitor system was higher in USC.
“We highlight that, despite different baseline characteristics, OS was similar among patients enrolled in clinical trials across different geographic regions,” reported Andre P. Fay, MD, PhD, and colleagues from Dana Farber Cancer Institute, Boston, in Journal of Global Oncology. “Access to clinical trials may be an important alternative to eliminate health disparities and promote health equity in patients with mRCC.”
This study was supported by Pfizer and in part by the Dana-Farber/Harvard Cancer Center Kidney SPORE, DF/HCC Kidney Cancer Program, and the Trust Family, Loker Pinard, and Michael Brigham Funds for Kidney Cancer Research at Dana-Farber Cancer Institute. All of the study authors reported disclosures with the sponsor, Pfizer, or other pharmaceutical companies.
SOURCE: Fay AP et al. J Global Oncol. 2018 Jan 17. doi: 10.1200/JGO.17.00119.
Overall survival was similar among patients enrolled in clinical trials for metastatic renal cell carcinoma (mRCC) across different geographic regions, according to a pooled retrospective analysis.
Demographic characteristics, clinicopathologic variables, survival, and toxicity data were collected across five geographic regions, including, United States/Canada (USC), Western Europe (WE), Eastern Europe (EE), Latin America (LA), and Asia/Africa/Oceania (AAO) for 4,736 patients who had mRCC treated between 2003 and 2013 and were enrolled in phase 2 and phase 3 clinical trials.
Patients in USC and WE were slightly older (mean ages, 60.6 and 60.5 years, respectively) and with higher numbers undergoing prior nephrectomy. Higher BMI was also observed in patients in the USC and LA regions. While ECOG performance status of 0 was more frequent in LA patients, treatment-related adverse events and use of statin and angiotensin inhibitor system was higher in USC.
“We highlight that, despite different baseline characteristics, OS was similar among patients enrolled in clinical trials across different geographic regions,” reported Andre P. Fay, MD, PhD, and colleagues from Dana Farber Cancer Institute, Boston, in Journal of Global Oncology. “Access to clinical trials may be an important alternative to eliminate health disparities and promote health equity in patients with mRCC.”
This study was supported by Pfizer and in part by the Dana-Farber/Harvard Cancer Center Kidney SPORE, DF/HCC Kidney Cancer Program, and the Trust Family, Loker Pinard, and Michael Brigham Funds for Kidney Cancer Research at Dana-Farber Cancer Institute. All of the study authors reported disclosures with the sponsor, Pfizer, or other pharmaceutical companies.
SOURCE: Fay AP et al. J Global Oncol. 2018 Jan 17. doi: 10.1200/JGO.17.00119.
Overall survival was similar among patients enrolled in clinical trials for metastatic renal cell carcinoma (mRCC) across different geographic regions, according to a pooled retrospective analysis.
Demographic characteristics, clinicopathologic variables, survival, and toxicity data were collected across five geographic regions, including, United States/Canada (USC), Western Europe (WE), Eastern Europe (EE), Latin America (LA), and Asia/Africa/Oceania (AAO) for 4,736 patients who had mRCC treated between 2003 and 2013 and were enrolled in phase 2 and phase 3 clinical trials.
Patients in USC and WE were slightly older (mean ages, 60.6 and 60.5 years, respectively) and with higher numbers undergoing prior nephrectomy. Higher BMI was also observed in patients in the USC and LA regions. While ECOG performance status of 0 was more frequent in LA patients, treatment-related adverse events and use of statin and angiotensin inhibitor system was higher in USC.
“We highlight that, despite different baseline characteristics, OS was similar among patients enrolled in clinical trials across different geographic regions,” reported Andre P. Fay, MD, PhD, and colleagues from Dana Farber Cancer Institute, Boston, in Journal of Global Oncology. “Access to clinical trials may be an important alternative to eliminate health disparities and promote health equity in patients with mRCC.”
This study was supported by Pfizer and in part by the Dana-Farber/Harvard Cancer Center Kidney SPORE, DF/HCC Kidney Cancer Program, and the Trust Family, Loker Pinard, and Michael Brigham Funds for Kidney Cancer Research at Dana-Farber Cancer Institute. All of the study authors reported disclosures with the sponsor, Pfizer, or other pharmaceutical companies.
SOURCE: Fay AP et al. J Global Oncol. 2018 Jan 17. doi: 10.1200/JGO.17.00119.
FROM journal of global oncology
Key clinical point: The potential differences in clinical outcomes may be contributed by differences in access to clinical trials, disease biology, reporting of adverse events, and quality of care.
Major finding: Patient characteristics differed according to geographic region. No statistically significant differences in OS were observed when the United States/Canada (USC) was compared with other regions: Latin America, Asia/Oceania/Africa, and Eastern Europe.
Study details: Pooled retrospective analysis of 4,736 patients who had mRCC treated between 2003 and 2013 and were enrolled in phase 2 and phase 3 clinical trials.
Disclosures: The study was funded by Pfizer and in part by the Dana Farber/Harvard Cancer Center. All of the study authors reported conflicts of interest involving the sponsor, Pfizer, or other pharmaceutical companies.
Source: Fay AP et al. J Global Oncol. 2018 Jan 17. doi: 10.1200/JGO.17.00119.
Mortality, Length of Stay, and Cost of Weekend Admissions
The “weekend effect” refers to the association between weekend hospital admissions and poorer outcomes, such as higher mortality rates. Analysis of National Health Service claims data from the United Kingdom suggested a 10% increase in 30-day mortality in patients admitted on Saturdays and 15% in patients admitted on Sundays,1 leading to the push for a 7-day work week and invoking controversial changes in their junior doctor (residency) working contract. Studies in the United States highlighting differences in outcomes for patients admitted on weekends compared to weekdays have mostly focused on specific diagnoses and results have been variable. Few have gone on to look at the association of weekend hospital admissions on cost2,3 and length of stay3 but results are overall inconclusive. Some have suggested that such poorer outcomes for patients admitted on weekends are due to reduced staffing and delayed procedures on weekends compared to weekdays, although this has been debated.4 The lack of consensus has made it difficult for hospitals to plan if and how to expand weekend manpower or services.
In the United States, increase in mortality rate for patients admitted on weekends has been demonstrated for a range of diagnoses, including pulmonary embolism,5 intracerebral hemorrhage,6 upper gastrointestinal hemorrhage,7,8 ruptured aortic aneurysm,9 heart failure,10 and acute kidney injury.11 However, other diagnoses such as atrial flutter or fibrillation,2 hip fractures,12 ischemic stroke,13 and esophageal variceal hemorrhage,14 show no difference in mortality between weekday and weekend admissions. Yet, other conditions such as myocardial infarction15,16 and subarachnoid hemorrhage17,18 have multiple studies with conflicting results. None of these studies have comprehensively looked at the effect of weekend admissions across all diagnoses nor compared the effect size between common diagnoses in the United States using the same risk adjustment. Reporting of differences in length of stay and cost is also rare.
We postulated that the weekend admissions are associated with increased mortality and length of stay, but that the effect would be heterogeneous between different diagnosis groups. Using a large nationally representative inpatient database, we investigated the association between weekend versus weekday admissions on in-hospital mortality, length of stay, and cost for acute hospitalizations in the United States. We performed subgroup analyses of the top 20 diagnoses to determine which diagnoses, if any, should be targeted for expanded weekend manpower or services.
METHODS
Data Sources
We used information from the National Inpatient Sample (NIS) database for this study,19 which is the largest all-payer inpatient healthcare database in the United States. It contains administrative claims information on a 20% stratified sample of discharges from all hospitals participating in the Healthcare Cost and Utilization Project (HCUP), which includes over 90% of hospitals and 95% of discharges in the country. The NIS contains clinical and nonclinical data elements, including diagnoses, severity and comorbidity measures, demographics, admission characteristics, and charges.
Study Patients
The study included all patients who were 18 years or older and were admitted to hospitals participating in HCUP from 2012 to 2014. Elective or planned admissions were excluded from this study because of the anticipated degree of unmeasured confounding that would be present between patients electively admitted on weekends compared to weekdays.
Study Variables
The primary exposure variable was admission on weekends (defined as Friday midnight to Sunday midnight) compared to the rest of the week. The primary outcome variable was in-hospital mortality. The secondary outcome variables were length of stay (measured in integer days) and cost. Length of stay was compared only using only patients who survived the hospital admission to eliminate the effect of death in shortening the length of stay. Cost was calculated by using charges available in the NIS and multiplied by the accompanying cost-to-charge ratios. Charges reflect total amount that hospitals billed for services but do not reflect how much these services actually cost. The HCUP cost-to-charge ratios are hospital-specific data based on hospital accounting reports collected by the Centers for Medicare & Medicaid Services.19
Covariates included age, sex, race, income, payer, presence or absence of comorbidities as defined by the Elixhauser comorbidity index,20 risk of mortality, and severity of illness scores as defined by the 3M Health Information Systems.21 Mortality risk and severity of illness groups are defined by using a proprietary iterative process developed by 3M Health Information Systems using International Classification of Diseases, 9th Revision-Clinical Modification (ICD-9-CM) principal and secondary diagnosis codes and procedure codes, age, sex, and discharge disposition, evaluated with historical data.21 Severity of illness refers to the extent of physiologic decompensation or loss of function of an organ system, whereas risk of mortality refers to the likelihood of dying.
Statistical Analysis
We compared patient characteristics and other covariates between patients emergently admitted on weekends and weekdays. Continuous variables that were not normally distributed were either categorized (age, risk of mortality, and severity of illness scores) or log-transformed if right skewed (length of stay and cost). Categorical data were reported as percentages and continuous data as medians (interquartile range). We compared the inpatient mortality rate between weekend and weekday admissions by using χ2 tests. Multivariable logistic regression was used to adjust for covariates of age, gender, race, payer, income, risk of mortality and severity of illness scores, number of comorbidities, and the presence or absence of each of the 29 comorbidities available in the database to determine an adjusted odds ratio (OR), P values, and confidence intervals (CIs).
We also compared the length of stay amongst survivors and costs between weekend and weekday admissions. Multivariable linear regression was applied to the natural log of these outcome variables and the coefficients exponentiated to determine the difference in length of stay and cost of weekend admissions as compared to weekday. Covariates in the model were the same as those used for the primary outcome.
To determine if particular diagnoses had a pronounced weekend effect, the above analyses were repeated in subgroups of the top 20 most prevalent diagnoses on weekends by using the Clinical Classifications Software for ICD-9-CM diagnosis groups. For subgroup analyses, a Bonferroni correction was used, so P values of <.0025 were considered significant.
Statistical analyses were performed by using SAS version 9.4 (SAS Institute Inc, Cary, NC). All regression models were run using PROC SURVEYREG for continuous outcomes and PROC SURVEYLOGISTIC for binary outcomes to account for the sampling structure of NIS. Two-sided P values of .05 were considered significant, apart from the Bonferroni correction applied to the subgroup analysis. As this study involved publicly available deidentified data, our study was exempt from institutional board review.
RESULTS
Patient Characteristics
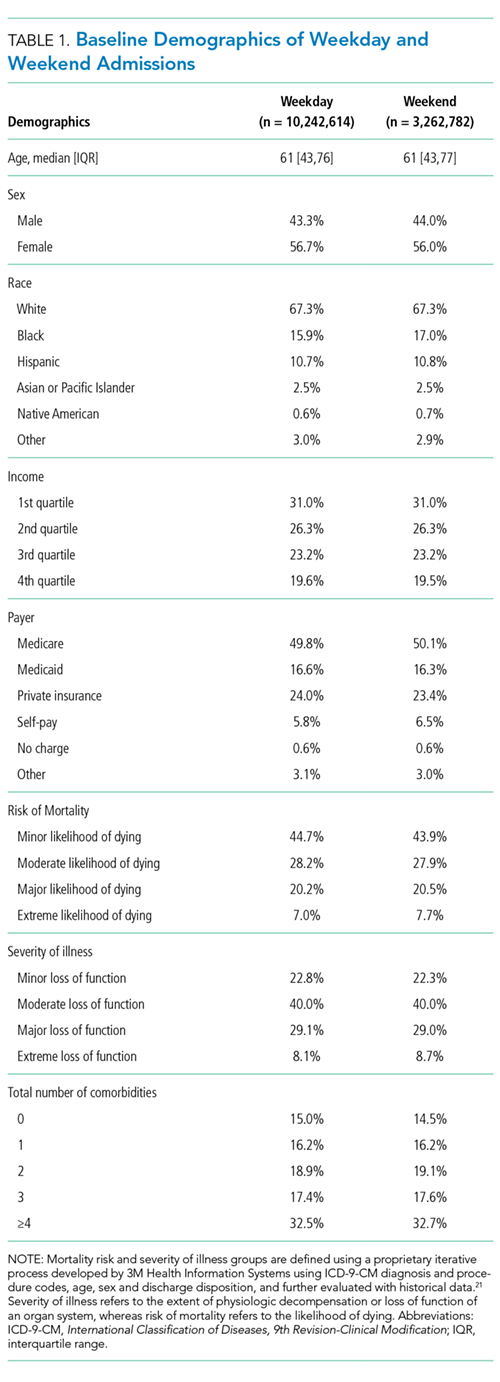
Mortality
The crude in-hospital mortality rate was 2.8% for patients admitted on weekends and 2.5% for patients admitted on weekdays (unadjusted OR, 1.110; 95% CI, 1.105-1.113; P < .0001). This relationship was attenuated after adjustment for demographics, severity, and comorbidities, but remained statistically significant (OR 1.029; 95% CI, 1.020-1.039; P < .0001; Table 2), which corresponds to an adjusted risk difference of 0.07% increase in mortality of weekend admissions. The OR for mortality on weekends compared to weekdays was further calculated for each of the top 20 diagnoses (Table 3). Out of all the diagnosis groups, only 1 (urinary tract infection) had a statistically significant P value after Bonferroni correction. We also looked separately at patients who were electively admitted—there was a highly significant OR of mortality of 1.67 (95% CI, 1.60-1.74). Patients classified as elective admissions were excluded for subsequent analyses.
Length of Stay
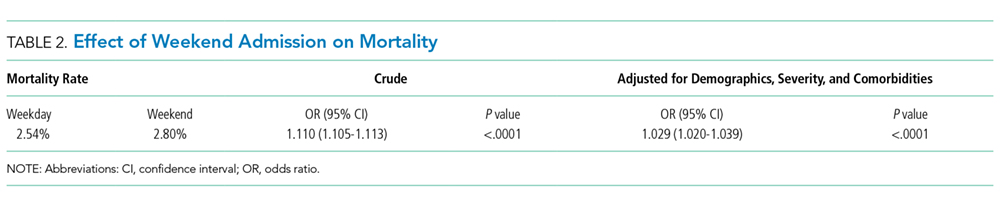
Cost
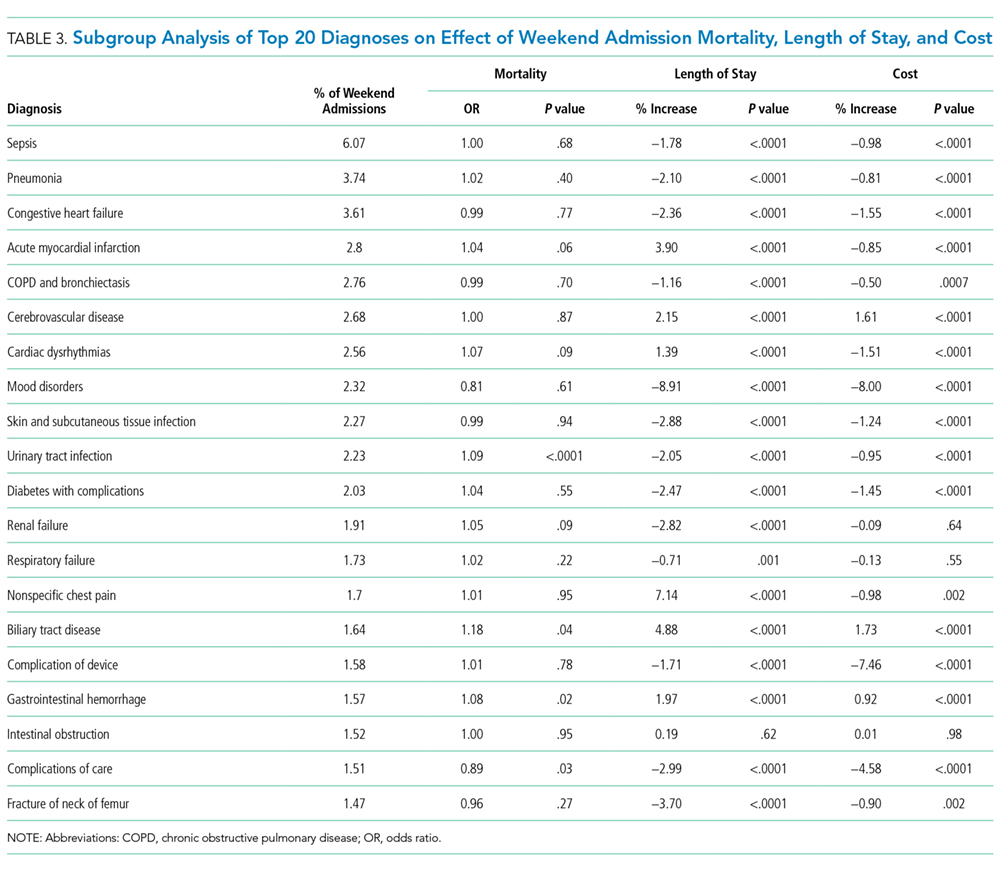
DISCUSSION

The magnitude of association between weekend admissions and mortality in this large administrative database contradicts existing literature, which some believe conclusively proves the international phenomenon of the weekend effect.22,23 However, our results support a minimal increase in odds of death of 2.9%, with no consistent effect amongst the top 20 diagnoses. Only 1 diagnosis group (urinary tract infection) showed a statistically significant increase in mortality, which could be due to chance. In contrast, the policy-influencing paper in the United Kingdom reports that patients admitted on Saturdays and Sundays have an increased risk of death of 10% and 15%, respectively, compared to patients admitted on Wednesdays.24 They also repeated their measurements on a United Health Care Systems database, comprising 254 leading managed care hospitals in the US, over a time period of 3 months in 2010, and found a hazard ratio of 1.18 (95% CI, 1.11-1.26). Ruiz et al.22 combined almost 3 million medical records from 28 metropolitan hospitals in 5 different countries in the Global Comparators Project, including 5 in the United States, and showed increased mortality on weekends in all countries, concluding that the weekend effect is a systematic phenomenon.
There are several possible explanations for differences in our findings. Freemantle’s study differed to ours by comparing outcomes of weekends to an index of Wednesday; they also found an increased mortality on Mondays and Fridays, which could suggest the presence of residual confounding and doubt as to whether Wednesday is the ideal control group. A further difference is the definition of mortality—we looked at in-hospital mortality, as compared to 30-day mortality. In addition, Freemantle’s study included elective admissions. When we looked at the effect of weekend admissions on mortality, we found a highly significant OR of 1.67, compared to 1.03 in emergency admissions. We attributed this discrepancy to unmeasured confounding, such as preference of physicians or difference in classification of elective admissions in different hospitals. Because of significant effect modification of elective compared to emergency admissions, we decided to restrict our analysis to emergency admissions only. This also enabled direct associations with potential policy recommendations on whether to expand weekend clinical care, which is most relevant to emergency admissions. Finally, the Global Comparators Project only samples a small proportion of hospitals in each country, leading to limited generalizability; in addition, international comparisons are difficult to interpret due to differing health systems.
The overall and diagnosis-specific difference in length of stay was small and of doubtful clinical significance. With an adjusted decrease in length of stay in patients admitted on weekends of 2.24%, when applied to a median length of stay of 3 days, it translates into a 1.7-hour difference in length of stay. However, there was striking heterogeneity noted between diagnoses, with a difference ranging from 8.91% decrease in length of stay (mood disorders) to 7.14% increase in length of stay (nonspecific chest pain), which is likely to explain the overall small magnitude of effect. We noted that the diagnoses associated with increased length of stay for weekend admissions tended to be those requiring inpatient procedures or investigations, such as acute myocardial infarction (3.90% increase), acute cerebrovascular disease (2.15% increase), cardiac dysrhythmias (1.39% increase), nonspecific chest pain (7.14% increase), and biliary tract disease (4.88% increase). As hospitals often do not provide certain nonemergent procedures or investigations on weekends, delay in procedures or investigations may explain the increase in length of stay. These include percutaneous coronary intervention or stress testing for evaluation of cardiac ischemia and endoscopic procedures for biliary tract disease and gastrointestinal hemorrhage. It must, however, be noted in conjunction that numerous studies have established higher complication rates when nonemergent surgeries are performed out of hours or on weekends.25-28 Therefore, we suggest further studies to compare the effect of weekends on increased procedural complications as to any morbidity caused by increased length of stay, which the present dataset was unable to capture. Another potential explanation for the heterogeneity in length of stay could be the greater availability of caregivers to assist with discharge on weekends, such as for patients admitted for mood disorders.
Surprisingly, weekend admissions appeared to be less costly than weekday admissions overall. Because of the large sample size, very minor differences in cost are likely to be statistically significant. Indeed, for the absolute difference of 0.45%, given a median cost of $6562 on weekends, this only represents a cost saving of approximately $30 per patient admission. There was also heterogeneity observed amongst the different diagnosis groups, and cerebrovascular disease, biliary tract disease and gastrointestinal hemorrhage, which were also associated with increase length of stay, were associated with an increased cost. However, our study is unable to establish causation, and differences in staffing numbers and reimbursement on weekends may confound cost estimates. We propose that further studies using hospital databases with greater granularity in data are necessary to determine the etiology of cost differences between weekends and weekdays.
Our study’s key strengths are the large sample size and generalizability to the US. As a large administrative database, we recognize the likelihood of inconsistencies in hospital coding for covariates, diagnoses, and charges, which may lead to misclassification bias. The NIS definition of weekend (Friday midnight to Sunday midnight) may differ from other definitions of weekend; ideally Friday 5
CONCLUSION
Our study does not suggest that system-wide policies to increase weekend service coverage will impact mortality, although effects on length of stay and cost are inconclusive. Hospitals wishing to improve coverage may consider focusing on procedural diagnoses as listed above which may shorten length of stay, although the out-of-hours complication rate should be carefully monitored.
Disclosure
The authors declare no conflicts of interest.
1. Freemantle N, Ray D, McNulty D, et al. Increased mortality associated with weekend hospital admission: a case for expanded seven day services? BMJ. 2015;351:h4596. PubMed
2. Weeda ER, Hodgdon N, Do T, et al. Association between weekend admission for atrial fibrillation or flutter and in-hospital mortality, procedure utilization, length-of-stay and treatment costs. Int J Cardiol. 2016;202:427-429. PubMed
3. Khanna R, Wachsberg K, Marouni A, Feinglass J, Williams MV, Wayne DB. The association between night or weekend admission and hospitalization-relevant patient outcomes. J Hosp Med. 2011;6(1):10-14. PubMed
4. Aldridge C, Bion J, Boyal A, et al. Weekend specialist intensity and admission mortality in acute hospital trusts in England: a cross-sectional study. Lancet. 2016;388(10040):178-186. PubMed
5. Coleman CI, Brunault RD, Saulsberry WJ. Association between weekend admission and in-hospital mortality for pulmonary embolism: An observational study and meta-analysis. Int J Cardiol. 2015;194:72-74. PubMed
6. Crowley RW, Yeoh HK, Stukenborg GJ, Medel R, Kassell NF, Dumont AS. Influence of weekend hospital admission on short-term mortality after intracerebral hemorrhage. Stroke. 2009;40(7):2387-2392. PubMed
7. Dorn SD, Shah ND, Berg BP, Naessens JM. Effect of weekend hospital admission on gastrointestinal hemorrhage outcomes. Dig Dis Sci. 2010;55(6):1658-1666. PubMed
8. Shaheen AA, Kaplan GG, Myers RP. Weekend versus weekday admission and mortality from gastrointestinal hemorrhage caused by peptic ulcer disease. Clin Gastroenterol Hepatol. 2009;7(3):303-310. PubMed
9. Groves EM, Khoshchehreh M, Le C, Malik S. Effects of weekend admission on the outcomes and management of ruptured aortic aneurysms. J Vasc Surg. 2014;60(2):318-324. PubMed
10. Horwich TB, Hernandez AF, Liang L, et al. Weekend hospital admission and discharge for heart failure: association with quality of care and clinical outcomes. Am Heart J. 2009;158(3):451-458. PubMed
11. James MT, Wald R, Bell CM, et al. Weekend hospital admission, acute kidney injury, and mortality. J Am Soc Nephrol. 2010;21(5):845-851. PubMed
12. Boylan MR, Rosenbaum J, Adler A, Naziri Q, Paulino CB. Hip Fracture and the Weekend Effect: Does Weekend Admission Affect Patient Outcomes? Am J Orthop (Belle Mead NJ). 2015;44(10):458-464. PubMed
13. Myers RP, Kaplan GG, Shaheen AM. The effect of weekend versus weekday admission on outcomes of esophageal variceal hemorrhage. Can J Gastroenterol. 2009;23(7):495-501. PubMed
14. Hoh BL, Chi YY, Waters MF, Mocco J, Barker FG 2nd. Effect of weekend compared with weekday stroke admission on thrombolytic use, in-hospital mortality, discharge disposition, hospital charges, and length of stay in the Nationwide Inpatient Sample Database, 2002 to 2007. Stroke. 2010;41(10):2323-2328. PubMed
15. Kostis WJ, Demissie K, Marcella SW, Shao YH, Wilson AC, Moreyra AE. Weekend versus weekday admission and mortality from myocardial infarction. N Engl J Med. 2007;356(11):1099-1109. PubMed
16. Noad R, Stevenson M, Herity NA. Analysis of weekend effect on 30-day mortality among patients with acute myocardial infarction. Open Heart. 2017;4:1-5. PubMed
17. Crowley RW, Yeoh HK, Stukenborg GJ, Ionescu AA, Kassell NF, Dumont AS. Influence of weekend versus weekday hospital admission on mortality following subarachnoid hemorrhage. J Neurosurg. 2009;111(1):60-66. PubMed
18. Nguyen E, Tsoi A, Lee K, Farasat S, Coleman CI. Association between weekend admission for intracerebral and subarachnoid hemorrhage and in-hospital mortality. Int J Cardiol. 2016;212:26-28. PubMed
19. Healthcare Cost and Utilization Project. Overview of the National (Nationwide) Inpatient Sample (NIS). https://www.hcup-us.ahrq.gov/nisoverview.jsp. Accessed June 20, 2017.
20. Healthcare Cost and Utilization Project. Elixhauser Comorbidity Software, Version 3.7. https://www.hcup-us.ahrq.gov/toolssoftware/comorbidity/comorbidity.jsp. Accessed Feburary 20, 2017.
21. 3M Health Information Systems. All Patient Refined Diagnosis Related Groups (APR-DRGs), Version 20.0, Methodology Overview. 2003; https://www.hcup-us.ahrq.gov/db/nation/nis/APR-DRGsV20MethodologyOverviewandBibliography.pdf. Accessed on Feburary 20, 2017.
22. Ruiz M, Bottle A, Aylin PP. The Global Comparators project: international comparison of 30-day in-hospital mortality by day of the week. BMJ Qual Saf. 2015;24(8):492-504. PubMed
23. Lilford RJ, Chen YF. The ubiquitous weekend effect: moving past proving it exists to clarifying what causes it. BMJ Qual Saf. 2015;24(8):480-482. PubMed
24. Freemantle N, Richardson M, Wood J, et al. Weekend hospitalization and additional risk of death: an analysis of inpatient data. J R Soc Med. 2012;105(2):74-84. PubMed
25. Aylin P, Alexandrescu R, Jen MH, Mayer EK, Bottle A. Day of week of procedure and 30 day mortality for elective surgery: retrospective analysis of hospital episode statistics. BMJ. 2013;346:f2424. PubMed
26. Bendavid E, Kaganova Y, Needleman J, Gruenberg L, Weissman JS. Complication rates on weekends and weekdays in US hospitals. Am J Med. 2007;120(5):422-428. PubMed
27. Zapf MA, Kothari AN, Markossian T, et al. The “weekend effect” in urgent general operative procedures. Surgery. 2015;158(2):508-514. PubMed
28. Glaser R, Naidu SS, Selzer F, et al. Factors associated with poorer prognosis for patients undergoing primary percutaneous coronary intervention during off-hours: biology or systems failure? JACC Cardiovasc Interv. 2008;1(6):681-688. PubMed
The “weekend effect” refers to the association between weekend hospital admissions and poorer outcomes, such as higher mortality rates. Analysis of National Health Service claims data from the United Kingdom suggested a 10% increase in 30-day mortality in patients admitted on Saturdays and 15% in patients admitted on Sundays,1 leading to the push for a 7-day work week and invoking controversial changes in their junior doctor (residency) working contract. Studies in the United States highlighting differences in outcomes for patients admitted on weekends compared to weekdays have mostly focused on specific diagnoses and results have been variable. Few have gone on to look at the association of weekend hospital admissions on cost2,3 and length of stay3 but results are overall inconclusive. Some have suggested that such poorer outcomes for patients admitted on weekends are due to reduced staffing and delayed procedures on weekends compared to weekdays, although this has been debated.4 The lack of consensus has made it difficult for hospitals to plan if and how to expand weekend manpower or services.
In the United States, increase in mortality rate for patients admitted on weekends has been demonstrated for a range of diagnoses, including pulmonary embolism,5 intracerebral hemorrhage,6 upper gastrointestinal hemorrhage,7,8 ruptured aortic aneurysm,9 heart failure,10 and acute kidney injury.11 However, other diagnoses such as atrial flutter or fibrillation,2 hip fractures,12 ischemic stroke,13 and esophageal variceal hemorrhage,14 show no difference in mortality between weekday and weekend admissions. Yet, other conditions such as myocardial infarction15,16 and subarachnoid hemorrhage17,18 have multiple studies with conflicting results. None of these studies have comprehensively looked at the effect of weekend admissions across all diagnoses nor compared the effect size between common diagnoses in the United States using the same risk adjustment. Reporting of differences in length of stay and cost is also rare.
We postulated that the weekend admissions are associated with increased mortality and length of stay, but that the effect would be heterogeneous between different diagnosis groups. Using a large nationally representative inpatient database, we investigated the association between weekend versus weekday admissions on in-hospital mortality, length of stay, and cost for acute hospitalizations in the United States. We performed subgroup analyses of the top 20 diagnoses to determine which diagnoses, if any, should be targeted for expanded weekend manpower or services.
METHODS
Data Sources
We used information from the National Inpatient Sample (NIS) database for this study,19 which is the largest all-payer inpatient healthcare database in the United States. It contains administrative claims information on a 20% stratified sample of discharges from all hospitals participating in the Healthcare Cost and Utilization Project (HCUP), which includes over 90% of hospitals and 95% of discharges in the country. The NIS contains clinical and nonclinical data elements, including diagnoses, severity and comorbidity measures, demographics, admission characteristics, and charges.
Study Patients
The study included all patients who were 18 years or older and were admitted to hospitals participating in HCUP from 2012 to 2014. Elective or planned admissions were excluded from this study because of the anticipated degree of unmeasured confounding that would be present between patients electively admitted on weekends compared to weekdays.
Study Variables
The primary exposure variable was admission on weekends (defined as Friday midnight to Sunday midnight) compared to the rest of the week. The primary outcome variable was in-hospital mortality. The secondary outcome variables were length of stay (measured in integer days) and cost. Length of stay was compared only using only patients who survived the hospital admission to eliminate the effect of death in shortening the length of stay. Cost was calculated by using charges available in the NIS and multiplied by the accompanying cost-to-charge ratios. Charges reflect total amount that hospitals billed for services but do not reflect how much these services actually cost. The HCUP cost-to-charge ratios are hospital-specific data based on hospital accounting reports collected by the Centers for Medicare & Medicaid Services.19
Covariates included age, sex, race, income, payer, presence or absence of comorbidities as defined by the Elixhauser comorbidity index,20 risk of mortality, and severity of illness scores as defined by the 3M Health Information Systems.21 Mortality risk and severity of illness groups are defined by using a proprietary iterative process developed by 3M Health Information Systems using International Classification of Diseases, 9th Revision-Clinical Modification (ICD-9-CM) principal and secondary diagnosis codes and procedure codes, age, sex, and discharge disposition, evaluated with historical data.21 Severity of illness refers to the extent of physiologic decompensation or loss of function of an organ system, whereas risk of mortality refers to the likelihood of dying.
Statistical Analysis
We compared patient characteristics and other covariates between patients emergently admitted on weekends and weekdays. Continuous variables that were not normally distributed were either categorized (age, risk of mortality, and severity of illness scores) or log-transformed if right skewed (length of stay and cost). Categorical data were reported as percentages and continuous data as medians (interquartile range). We compared the inpatient mortality rate between weekend and weekday admissions by using χ2 tests. Multivariable logistic regression was used to adjust for covariates of age, gender, race, payer, income, risk of mortality and severity of illness scores, number of comorbidities, and the presence or absence of each of the 29 comorbidities available in the database to determine an adjusted odds ratio (OR), P values, and confidence intervals (CIs).
We also compared the length of stay amongst survivors and costs between weekend and weekday admissions. Multivariable linear regression was applied to the natural log of these outcome variables and the coefficients exponentiated to determine the difference in length of stay and cost of weekend admissions as compared to weekday. Covariates in the model were the same as those used for the primary outcome.
To determine if particular diagnoses had a pronounced weekend effect, the above analyses were repeated in subgroups of the top 20 most prevalent diagnoses on weekends by using the Clinical Classifications Software for ICD-9-CM diagnosis groups. For subgroup analyses, a Bonferroni correction was used, so P values of <.0025 were considered significant.
Statistical analyses were performed by using SAS version 9.4 (SAS Institute Inc, Cary, NC). All regression models were run using PROC SURVEYREG for continuous outcomes and PROC SURVEYLOGISTIC for binary outcomes to account for the sampling structure of NIS. Two-sided P values of .05 were considered significant, apart from the Bonferroni correction applied to the subgroup analysis. As this study involved publicly available deidentified data, our study was exempt from institutional board review.
RESULTS
Patient Characteristics
Mortality
The crude in-hospital mortality rate was 2.8% for patients admitted on weekends and 2.5% for patients admitted on weekdays (unadjusted OR, 1.110; 95% CI, 1.105-1.113; P < .0001). This relationship was attenuated after adjustment for demographics, severity, and comorbidities, but remained statistically significant (OR 1.029; 95% CI, 1.020-1.039; P < .0001; Table 2), which corresponds to an adjusted risk difference of 0.07% increase in mortality of weekend admissions. The OR for mortality on weekends compared to weekdays was further calculated for each of the top 20 diagnoses (Table 3). Out of all the diagnosis groups, only 1 (urinary tract infection) had a statistically significant P value after Bonferroni correction. We also looked separately at patients who were electively admitted—there was a highly significant OR of mortality of 1.67 (95% CI, 1.60-1.74). Patients classified as elective admissions were excluded for subsequent analyses.
Length of Stay
Cost
DISCUSSION
The magnitude of association between weekend admissions and mortality in this large administrative database contradicts existing literature, which some believe conclusively proves the international phenomenon of the weekend effect.22,23 However, our results support a minimal increase in odds of death of 2.9%, with no consistent effect amongst the top 20 diagnoses. Only 1 diagnosis group (urinary tract infection) showed a statistically significant increase in mortality, which could be due to chance. In contrast, the policy-influencing paper in the United Kingdom reports that patients admitted on Saturdays and Sundays have an increased risk of death of 10% and 15%, respectively, compared to patients admitted on Wednesdays.24 They also repeated their measurements on a United Health Care Systems database, comprising 254 leading managed care hospitals in the US, over a time period of 3 months in 2010, and found a hazard ratio of 1.18 (95% CI, 1.11-1.26). Ruiz et al.22 combined almost 3 million medical records from 28 metropolitan hospitals in 5 different countries in the Global Comparators Project, including 5 in the United States, and showed increased mortality on weekends in all countries, concluding that the weekend effect is a systematic phenomenon.
There are several possible explanations for differences in our findings. Freemantle’s study differed to ours by comparing outcomes of weekends to an index of Wednesday; they also found an increased mortality on Mondays and Fridays, which could suggest the presence of residual confounding and doubt as to whether Wednesday is the ideal control group. A further difference is the definition of mortality—we looked at in-hospital mortality, as compared to 30-day mortality. In addition, Freemantle’s study included elective admissions. When we looked at the effect of weekend admissions on mortality, we found a highly significant OR of 1.67, compared to 1.03 in emergency admissions. We attributed this discrepancy to unmeasured confounding, such as preference of physicians or difference in classification of elective admissions in different hospitals. Because of significant effect modification of elective compared to emergency admissions, we decided to restrict our analysis to emergency admissions only. This also enabled direct associations with potential policy recommendations on whether to expand weekend clinical care, which is most relevant to emergency admissions. Finally, the Global Comparators Project only samples a small proportion of hospitals in each country, leading to limited generalizability; in addition, international comparisons are difficult to interpret due to differing health systems.
The overall and diagnosis-specific difference in length of stay was small and of doubtful clinical significance. With an adjusted decrease in length of stay in patients admitted on weekends of 2.24%, when applied to a median length of stay of 3 days, it translates into a 1.7-hour difference in length of stay. However, there was striking heterogeneity noted between diagnoses, with a difference ranging from 8.91% decrease in length of stay (mood disorders) to 7.14% increase in length of stay (nonspecific chest pain), which is likely to explain the overall small magnitude of effect. We noted that the diagnoses associated with increased length of stay for weekend admissions tended to be those requiring inpatient procedures or investigations, such as acute myocardial infarction (3.90% increase), acute cerebrovascular disease (2.15% increase), cardiac dysrhythmias (1.39% increase), nonspecific chest pain (7.14% increase), and biliary tract disease (4.88% increase). As hospitals often do not provide certain nonemergent procedures or investigations on weekends, delay in procedures or investigations may explain the increase in length of stay. These include percutaneous coronary intervention or stress testing for evaluation of cardiac ischemia and endoscopic procedures for biliary tract disease and gastrointestinal hemorrhage. It must, however, be noted in conjunction that numerous studies have established higher complication rates when nonemergent surgeries are performed out of hours or on weekends.25-28 Therefore, we suggest further studies to compare the effect of weekends on increased procedural complications as to any morbidity caused by increased length of stay, which the present dataset was unable to capture. Another potential explanation for the heterogeneity in length of stay could be the greater availability of caregivers to assist with discharge on weekends, such as for patients admitted for mood disorders.
Surprisingly, weekend admissions appeared to be less costly than weekday admissions overall. Because of the large sample size, very minor differences in cost are likely to be statistically significant. Indeed, for the absolute difference of 0.45%, given a median cost of $6562 on weekends, this only represents a cost saving of approximately $30 per patient admission. There was also heterogeneity observed amongst the different diagnosis groups, and cerebrovascular disease, biliary tract disease and gastrointestinal hemorrhage, which were also associated with increase length of stay, were associated with an increased cost. However, our study is unable to establish causation, and differences in staffing numbers and reimbursement on weekends may confound cost estimates. We propose that further studies using hospital databases with greater granularity in data are necessary to determine the etiology of cost differences between weekends and weekdays.
Our study’s key strengths are the large sample size and generalizability to the US. As a large administrative database, we recognize the likelihood of inconsistencies in hospital coding for covariates, diagnoses, and charges, which may lead to misclassification bias. The NIS definition of weekend (Friday midnight to Sunday midnight) may differ from other definitions of weekend; ideally Friday 5
CONCLUSION
Our study does not suggest that system-wide policies to increase weekend service coverage will impact mortality, although effects on length of stay and cost are inconclusive. Hospitals wishing to improve coverage may consider focusing on procedural diagnoses as listed above which may shorten length of stay, although the out-of-hours complication rate should be carefully monitored.
Disclosure
The authors declare no conflicts of interest.
The “weekend effect” refers to the association between weekend hospital admissions and poorer outcomes, such as higher mortality rates. Analysis of National Health Service claims data from the United Kingdom suggested a 10% increase in 30-day mortality in patients admitted on Saturdays and 15% in patients admitted on Sundays,1 leading to the push for a 7-day work week and invoking controversial changes in their junior doctor (residency) working contract. Studies in the United States highlighting differences in outcomes for patients admitted on weekends compared to weekdays have mostly focused on specific diagnoses and results have been variable. Few have gone on to look at the association of weekend hospital admissions on cost2,3 and length of stay3 but results are overall inconclusive. Some have suggested that such poorer outcomes for patients admitted on weekends are due to reduced staffing and delayed procedures on weekends compared to weekdays, although this has been debated.4 The lack of consensus has made it difficult for hospitals to plan if and how to expand weekend manpower or services.
In the United States, increase in mortality rate for patients admitted on weekends has been demonstrated for a range of diagnoses, including pulmonary embolism,5 intracerebral hemorrhage,6 upper gastrointestinal hemorrhage,7,8 ruptured aortic aneurysm,9 heart failure,10 and acute kidney injury.11 However, other diagnoses such as atrial flutter or fibrillation,2 hip fractures,12 ischemic stroke,13 and esophageal variceal hemorrhage,14 show no difference in mortality between weekday and weekend admissions. Yet, other conditions such as myocardial infarction15,16 and subarachnoid hemorrhage17,18 have multiple studies with conflicting results. None of these studies have comprehensively looked at the effect of weekend admissions across all diagnoses nor compared the effect size between common diagnoses in the United States using the same risk adjustment. Reporting of differences in length of stay and cost is also rare.
We postulated that the weekend admissions are associated with increased mortality and length of stay, but that the effect would be heterogeneous between different diagnosis groups. Using a large nationally representative inpatient database, we investigated the association between weekend versus weekday admissions on in-hospital mortality, length of stay, and cost for acute hospitalizations in the United States. We performed subgroup analyses of the top 20 diagnoses to determine which diagnoses, if any, should be targeted for expanded weekend manpower or services.
METHODS
Data Sources
We used information from the National Inpatient Sample (NIS) database for this study,19 which is the largest all-payer inpatient healthcare database in the United States. It contains administrative claims information on a 20% stratified sample of discharges from all hospitals participating in the Healthcare Cost and Utilization Project (HCUP), which includes over 90% of hospitals and 95% of discharges in the country. The NIS contains clinical and nonclinical data elements, including diagnoses, severity and comorbidity measures, demographics, admission characteristics, and charges.
Study Patients
The study included all patients who were 18 years or older and were admitted to hospitals participating in HCUP from 2012 to 2014. Elective or planned admissions were excluded from this study because of the anticipated degree of unmeasured confounding that would be present between patients electively admitted on weekends compared to weekdays.
Study Variables
The primary exposure variable was admission on weekends (defined as Friday midnight to Sunday midnight) compared to the rest of the week. The primary outcome variable was in-hospital mortality. The secondary outcome variables were length of stay (measured in integer days) and cost. Length of stay was compared only using only patients who survived the hospital admission to eliminate the effect of death in shortening the length of stay. Cost was calculated by using charges available in the NIS and multiplied by the accompanying cost-to-charge ratios. Charges reflect total amount that hospitals billed for services but do not reflect how much these services actually cost. The HCUP cost-to-charge ratios are hospital-specific data based on hospital accounting reports collected by the Centers for Medicare & Medicaid Services.19
Covariates included age, sex, race, income, payer, presence or absence of comorbidities as defined by the Elixhauser comorbidity index,20 risk of mortality, and severity of illness scores as defined by the 3M Health Information Systems.21 Mortality risk and severity of illness groups are defined by using a proprietary iterative process developed by 3M Health Information Systems using International Classification of Diseases, 9th Revision-Clinical Modification (ICD-9-CM) principal and secondary diagnosis codes and procedure codes, age, sex, and discharge disposition, evaluated with historical data.21 Severity of illness refers to the extent of physiologic decompensation or loss of function of an organ system, whereas risk of mortality refers to the likelihood of dying.
Statistical Analysis
We compared patient characteristics and other covariates between patients emergently admitted on weekends and weekdays. Continuous variables that were not normally distributed were either categorized (age, risk of mortality, and severity of illness scores) or log-transformed if right skewed (length of stay and cost). Categorical data were reported as percentages and continuous data as medians (interquartile range). We compared the inpatient mortality rate between weekend and weekday admissions by using χ2 tests. Multivariable logistic regression was used to adjust for covariates of age, gender, race, payer, income, risk of mortality and severity of illness scores, number of comorbidities, and the presence or absence of each of the 29 comorbidities available in the database to determine an adjusted odds ratio (OR), P values, and confidence intervals (CIs).
We also compared the length of stay amongst survivors and costs between weekend and weekday admissions. Multivariable linear regression was applied to the natural log of these outcome variables and the coefficients exponentiated to determine the difference in length of stay and cost of weekend admissions as compared to weekday. Covariates in the model were the same as those used for the primary outcome.
To determine if particular diagnoses had a pronounced weekend effect, the above analyses were repeated in subgroups of the top 20 most prevalent diagnoses on weekends by using the Clinical Classifications Software for ICD-9-CM diagnosis groups. For subgroup analyses, a Bonferroni correction was used, so P values of <.0025 were considered significant.
Statistical analyses were performed by using SAS version 9.4 (SAS Institute Inc, Cary, NC). All regression models were run using PROC SURVEYREG for continuous outcomes and PROC SURVEYLOGISTIC for binary outcomes to account for the sampling structure of NIS. Two-sided P values of .05 were considered significant, apart from the Bonferroni correction applied to the subgroup analysis. As this study involved publicly available deidentified data, our study was exempt from institutional board review.
RESULTS
Patient Characteristics
Mortality
The crude in-hospital mortality rate was 2.8% for patients admitted on weekends and 2.5% for patients admitted on weekdays (unadjusted OR, 1.110; 95% CI, 1.105-1.113; P < .0001). This relationship was attenuated after adjustment for demographics, severity, and comorbidities, but remained statistically significant (OR 1.029; 95% CI, 1.020-1.039; P < .0001; Table 2), which corresponds to an adjusted risk difference of 0.07% increase in mortality of weekend admissions. The OR for mortality on weekends compared to weekdays was further calculated for each of the top 20 diagnoses (Table 3). Out of all the diagnosis groups, only 1 (urinary tract infection) had a statistically significant P value after Bonferroni correction. We also looked separately at patients who were electively admitted—there was a highly significant OR of mortality of 1.67 (95% CI, 1.60-1.74). Patients classified as elective admissions were excluded for subsequent analyses.
Length of Stay
Cost
DISCUSSION
The magnitude of association between weekend admissions and mortality in this large administrative database contradicts existing literature, which some believe conclusively proves the international phenomenon of the weekend effect.22,23 However, our results support a minimal increase in odds of death of 2.9%, with no consistent effect amongst the top 20 diagnoses. Only 1 diagnosis group (urinary tract infection) showed a statistically significant increase in mortality, which could be due to chance. In contrast, the policy-influencing paper in the United Kingdom reports that patients admitted on Saturdays and Sundays have an increased risk of death of 10% and 15%, respectively, compared to patients admitted on Wednesdays.24 They also repeated their measurements on a United Health Care Systems database, comprising 254 leading managed care hospitals in the US, over a time period of 3 months in 2010, and found a hazard ratio of 1.18 (95% CI, 1.11-1.26). Ruiz et al.22 combined almost 3 million medical records from 28 metropolitan hospitals in 5 different countries in the Global Comparators Project, including 5 in the United States, and showed increased mortality on weekends in all countries, concluding that the weekend effect is a systematic phenomenon.
There are several possible explanations for differences in our findings. Freemantle’s study differed to ours by comparing outcomes of weekends to an index of Wednesday; they also found an increased mortality on Mondays and Fridays, which could suggest the presence of residual confounding and doubt as to whether Wednesday is the ideal control group. A further difference is the definition of mortality—we looked at in-hospital mortality, as compared to 30-day mortality. In addition, Freemantle’s study included elective admissions. When we looked at the effect of weekend admissions on mortality, we found a highly significant OR of 1.67, compared to 1.03 in emergency admissions. We attributed this discrepancy to unmeasured confounding, such as preference of physicians or difference in classification of elective admissions in different hospitals. Because of significant effect modification of elective compared to emergency admissions, we decided to restrict our analysis to emergency admissions only. This also enabled direct associations with potential policy recommendations on whether to expand weekend clinical care, which is most relevant to emergency admissions. Finally, the Global Comparators Project only samples a small proportion of hospitals in each country, leading to limited generalizability; in addition, international comparisons are difficult to interpret due to differing health systems.
The overall and diagnosis-specific difference in length of stay was small and of doubtful clinical significance. With an adjusted decrease in length of stay in patients admitted on weekends of 2.24%, when applied to a median length of stay of 3 days, it translates into a 1.7-hour difference in length of stay. However, there was striking heterogeneity noted between diagnoses, with a difference ranging from 8.91% decrease in length of stay (mood disorders) to 7.14% increase in length of stay (nonspecific chest pain), which is likely to explain the overall small magnitude of effect. We noted that the diagnoses associated with increased length of stay for weekend admissions tended to be those requiring inpatient procedures or investigations, such as acute myocardial infarction (3.90% increase), acute cerebrovascular disease (2.15% increase), cardiac dysrhythmias (1.39% increase), nonspecific chest pain (7.14% increase), and biliary tract disease (4.88% increase). As hospitals often do not provide certain nonemergent procedures or investigations on weekends, delay in procedures or investigations may explain the increase in length of stay. These include percutaneous coronary intervention or stress testing for evaluation of cardiac ischemia and endoscopic procedures for biliary tract disease and gastrointestinal hemorrhage. It must, however, be noted in conjunction that numerous studies have established higher complication rates when nonemergent surgeries are performed out of hours or on weekends.25-28 Therefore, we suggest further studies to compare the effect of weekends on increased procedural complications as to any morbidity caused by increased length of stay, which the present dataset was unable to capture. Another potential explanation for the heterogeneity in length of stay could be the greater availability of caregivers to assist with discharge on weekends, such as for patients admitted for mood disorders.
Surprisingly, weekend admissions appeared to be less costly than weekday admissions overall. Because of the large sample size, very minor differences in cost are likely to be statistically significant. Indeed, for the absolute difference of 0.45%, given a median cost of $6562 on weekends, this only represents a cost saving of approximately $30 per patient admission. There was also heterogeneity observed amongst the different diagnosis groups, and cerebrovascular disease, biliary tract disease and gastrointestinal hemorrhage, which were also associated with increase length of stay, were associated with an increased cost. However, our study is unable to establish causation, and differences in staffing numbers and reimbursement on weekends may confound cost estimates. We propose that further studies using hospital databases with greater granularity in data are necessary to determine the etiology of cost differences between weekends and weekdays.
Our study’s key strengths are the large sample size and generalizability to the US. As a large administrative database, we recognize the likelihood of inconsistencies in hospital coding for covariates, diagnoses, and charges, which may lead to misclassification bias. The NIS definition of weekend (Friday midnight to Sunday midnight) may differ from other definitions of weekend; ideally Friday 5
CONCLUSION
Our study does not suggest that system-wide policies to increase weekend service coverage will impact mortality, although effects on length of stay and cost are inconclusive. Hospitals wishing to improve coverage may consider focusing on procedural diagnoses as listed above which may shorten length of stay, although the out-of-hours complication rate should be carefully monitored.
Disclosure
The authors declare no conflicts of interest.
1. Freemantle N, Ray D, McNulty D, et al. Increased mortality associated with weekend hospital admission: a case for expanded seven day services? BMJ. 2015;351:h4596. PubMed
2. Weeda ER, Hodgdon N, Do T, et al. Association between weekend admission for atrial fibrillation or flutter and in-hospital mortality, procedure utilization, length-of-stay and treatment costs. Int J Cardiol. 2016;202:427-429. PubMed
3. Khanna R, Wachsberg K, Marouni A, Feinglass J, Williams MV, Wayne DB. The association between night or weekend admission and hospitalization-relevant patient outcomes. J Hosp Med. 2011;6(1):10-14. PubMed
4. Aldridge C, Bion J, Boyal A, et al. Weekend specialist intensity and admission mortality in acute hospital trusts in England: a cross-sectional study. Lancet. 2016;388(10040):178-186. PubMed
5. Coleman CI, Brunault RD, Saulsberry WJ. Association between weekend admission and in-hospital mortality for pulmonary embolism: An observational study and meta-analysis. Int J Cardiol. 2015;194:72-74. PubMed
6. Crowley RW, Yeoh HK, Stukenborg GJ, Medel R, Kassell NF, Dumont AS. Influence of weekend hospital admission on short-term mortality after intracerebral hemorrhage. Stroke. 2009;40(7):2387-2392. PubMed
7. Dorn SD, Shah ND, Berg BP, Naessens JM. Effect of weekend hospital admission on gastrointestinal hemorrhage outcomes. Dig Dis Sci. 2010;55(6):1658-1666. PubMed
8. Shaheen AA, Kaplan GG, Myers RP. Weekend versus weekday admission and mortality from gastrointestinal hemorrhage caused by peptic ulcer disease. Clin Gastroenterol Hepatol. 2009;7(3):303-310. PubMed
9. Groves EM, Khoshchehreh M, Le C, Malik S. Effects of weekend admission on the outcomes and management of ruptured aortic aneurysms. J Vasc Surg. 2014;60(2):318-324. PubMed
10. Horwich TB, Hernandez AF, Liang L, et al. Weekend hospital admission and discharge for heart failure: association with quality of care and clinical outcomes. Am Heart J. 2009;158(3):451-458. PubMed
11. James MT, Wald R, Bell CM, et al. Weekend hospital admission, acute kidney injury, and mortality. J Am Soc Nephrol. 2010;21(5):845-851. PubMed
12. Boylan MR, Rosenbaum J, Adler A, Naziri Q, Paulino CB. Hip Fracture and the Weekend Effect: Does Weekend Admission Affect Patient Outcomes? Am J Orthop (Belle Mead NJ). 2015;44(10):458-464. PubMed
13. Myers RP, Kaplan GG, Shaheen AM. The effect of weekend versus weekday admission on outcomes of esophageal variceal hemorrhage. Can J Gastroenterol. 2009;23(7):495-501. PubMed
14. Hoh BL, Chi YY, Waters MF, Mocco J, Barker FG 2nd. Effect of weekend compared with weekday stroke admission on thrombolytic use, in-hospital mortality, discharge disposition, hospital charges, and length of stay in the Nationwide Inpatient Sample Database, 2002 to 2007. Stroke. 2010;41(10):2323-2328. PubMed
15. Kostis WJ, Demissie K, Marcella SW, Shao YH, Wilson AC, Moreyra AE. Weekend versus weekday admission and mortality from myocardial infarction. N Engl J Med. 2007;356(11):1099-1109. PubMed
16. Noad R, Stevenson M, Herity NA. Analysis of weekend effect on 30-day mortality among patients with acute myocardial infarction. Open Heart. 2017;4:1-5. PubMed
17. Crowley RW, Yeoh HK, Stukenborg GJ, Ionescu AA, Kassell NF, Dumont AS. Influence of weekend versus weekday hospital admission on mortality following subarachnoid hemorrhage. J Neurosurg. 2009;111(1):60-66. PubMed
18. Nguyen E, Tsoi A, Lee K, Farasat S, Coleman CI. Association between weekend admission for intracerebral and subarachnoid hemorrhage and in-hospital mortality. Int J Cardiol. 2016;212:26-28. PubMed
19. Healthcare Cost and Utilization Project. Overview of the National (Nationwide) Inpatient Sample (NIS). https://www.hcup-us.ahrq.gov/nisoverview.jsp. Accessed June 20, 2017.
20. Healthcare Cost and Utilization Project. Elixhauser Comorbidity Software, Version 3.7. https://www.hcup-us.ahrq.gov/toolssoftware/comorbidity/comorbidity.jsp. Accessed Feburary 20, 2017.
21. 3M Health Information Systems. All Patient Refined Diagnosis Related Groups (APR-DRGs), Version 20.0, Methodology Overview. 2003; https://www.hcup-us.ahrq.gov/db/nation/nis/APR-DRGsV20MethodologyOverviewandBibliography.pdf. Accessed on Feburary 20, 2017.
22. Ruiz M, Bottle A, Aylin PP. The Global Comparators project: international comparison of 30-day in-hospital mortality by day of the week. BMJ Qual Saf. 2015;24(8):492-504. PubMed
23. Lilford RJ, Chen YF. The ubiquitous weekend effect: moving past proving it exists to clarifying what causes it. BMJ Qual Saf. 2015;24(8):480-482. PubMed
24. Freemantle N, Richardson M, Wood J, et al. Weekend hospitalization and additional risk of death: an analysis of inpatient data. J R Soc Med. 2012;105(2):74-84. PubMed
25. Aylin P, Alexandrescu R, Jen MH, Mayer EK, Bottle A. Day of week of procedure and 30 day mortality for elective surgery: retrospective analysis of hospital episode statistics. BMJ. 2013;346:f2424. PubMed
26. Bendavid E, Kaganova Y, Needleman J, Gruenberg L, Weissman JS. Complication rates on weekends and weekdays in US hospitals. Am J Med. 2007;120(5):422-428. PubMed
27. Zapf MA, Kothari AN, Markossian T, et al. The “weekend effect” in urgent general operative procedures. Surgery. 2015;158(2):508-514. PubMed
28. Glaser R, Naidu SS, Selzer F, et al. Factors associated with poorer prognosis for patients undergoing primary percutaneous coronary intervention during off-hours: biology or systems failure? JACC Cardiovasc Interv. 2008;1(6):681-688. PubMed
1. Freemantle N, Ray D, McNulty D, et al. Increased mortality associated with weekend hospital admission: a case for expanded seven day services? BMJ. 2015;351:h4596. PubMed
2. Weeda ER, Hodgdon N, Do T, et al. Association between weekend admission for atrial fibrillation or flutter and in-hospital mortality, procedure utilization, length-of-stay and treatment costs. Int J Cardiol. 2016;202:427-429. PubMed
3. Khanna R, Wachsberg K, Marouni A, Feinglass J, Williams MV, Wayne DB. The association between night or weekend admission and hospitalization-relevant patient outcomes. J Hosp Med. 2011;6(1):10-14. PubMed
4. Aldridge C, Bion J, Boyal A, et al. Weekend specialist intensity and admission mortality in acute hospital trusts in England: a cross-sectional study. Lancet. 2016;388(10040):178-186. PubMed
5. Coleman CI, Brunault RD, Saulsberry WJ. Association between weekend admission and in-hospital mortality for pulmonary embolism: An observational study and meta-analysis. Int J Cardiol. 2015;194:72-74. PubMed
6. Crowley RW, Yeoh HK, Stukenborg GJ, Medel R, Kassell NF, Dumont AS. Influence of weekend hospital admission on short-term mortality after intracerebral hemorrhage. Stroke. 2009;40(7):2387-2392. PubMed
7. Dorn SD, Shah ND, Berg BP, Naessens JM. Effect of weekend hospital admission on gastrointestinal hemorrhage outcomes. Dig Dis Sci. 2010;55(6):1658-1666. PubMed
8. Shaheen AA, Kaplan GG, Myers RP. Weekend versus weekday admission and mortality from gastrointestinal hemorrhage caused by peptic ulcer disease. Clin Gastroenterol Hepatol. 2009;7(3):303-310. PubMed
9. Groves EM, Khoshchehreh M, Le C, Malik S. Effects of weekend admission on the outcomes and management of ruptured aortic aneurysms. J Vasc Surg. 2014;60(2):318-324. PubMed
10. Horwich TB, Hernandez AF, Liang L, et al. Weekend hospital admission and discharge for heart failure: association with quality of care and clinical outcomes. Am Heart J. 2009;158(3):451-458. PubMed
11. James MT, Wald R, Bell CM, et al. Weekend hospital admission, acute kidney injury, and mortality. J Am Soc Nephrol. 2010;21(5):845-851. PubMed
12. Boylan MR, Rosenbaum J, Adler A, Naziri Q, Paulino CB. Hip Fracture and the Weekend Effect: Does Weekend Admission Affect Patient Outcomes? Am J Orthop (Belle Mead NJ). 2015;44(10):458-464. PubMed
13. Myers RP, Kaplan GG, Shaheen AM. The effect of weekend versus weekday admission on outcomes of esophageal variceal hemorrhage. Can J Gastroenterol. 2009;23(7):495-501. PubMed
14. Hoh BL, Chi YY, Waters MF, Mocco J, Barker FG 2nd. Effect of weekend compared with weekday stroke admission on thrombolytic use, in-hospital mortality, discharge disposition, hospital charges, and length of stay in the Nationwide Inpatient Sample Database, 2002 to 2007. Stroke. 2010;41(10):2323-2328. PubMed
15. Kostis WJ, Demissie K, Marcella SW, Shao YH, Wilson AC, Moreyra AE. Weekend versus weekday admission and mortality from myocardial infarction. N Engl J Med. 2007;356(11):1099-1109. PubMed
16. Noad R, Stevenson M, Herity NA. Analysis of weekend effect on 30-day mortality among patients with acute myocardial infarction. Open Heart. 2017;4:1-5. PubMed
17. Crowley RW, Yeoh HK, Stukenborg GJ, Ionescu AA, Kassell NF, Dumont AS. Influence of weekend versus weekday hospital admission on mortality following subarachnoid hemorrhage. J Neurosurg. 2009;111(1):60-66. PubMed
18. Nguyen E, Tsoi A, Lee K, Farasat S, Coleman CI. Association between weekend admission for intracerebral and subarachnoid hemorrhage and in-hospital mortality. Int J Cardiol. 2016;212:26-28. PubMed
19. Healthcare Cost and Utilization Project. Overview of the National (Nationwide) Inpatient Sample (NIS). https://www.hcup-us.ahrq.gov/nisoverview.jsp. Accessed June 20, 2017.
20. Healthcare Cost and Utilization Project. Elixhauser Comorbidity Software, Version 3.7. https://www.hcup-us.ahrq.gov/toolssoftware/comorbidity/comorbidity.jsp. Accessed Feburary 20, 2017.
21. 3M Health Information Systems. All Patient Refined Diagnosis Related Groups (APR-DRGs), Version 20.0, Methodology Overview. 2003; https://www.hcup-us.ahrq.gov/db/nation/nis/APR-DRGsV20MethodologyOverviewandBibliography.pdf. Accessed on Feburary 20, 2017.
22. Ruiz M, Bottle A, Aylin PP. The Global Comparators project: international comparison of 30-day in-hospital mortality by day of the week. BMJ Qual Saf. 2015;24(8):492-504. PubMed
23. Lilford RJ, Chen YF. The ubiquitous weekend effect: moving past proving it exists to clarifying what causes it. BMJ Qual Saf. 2015;24(8):480-482. PubMed
24. Freemantle N, Richardson M, Wood J, et al. Weekend hospitalization and additional risk of death: an analysis of inpatient data. J R Soc Med. 2012;105(2):74-84. PubMed
25. Aylin P, Alexandrescu R, Jen MH, Mayer EK, Bottle A. Day of week of procedure and 30 day mortality for elective surgery: retrospective analysis of hospital episode statistics. BMJ. 2013;346:f2424. PubMed
26. Bendavid E, Kaganova Y, Needleman J, Gruenberg L, Weissman JS. Complication rates on weekends and weekdays in US hospitals. Am J Med. 2007;120(5):422-428. PubMed
27. Zapf MA, Kothari AN, Markossian T, et al. The “weekend effect” in urgent general operative procedures. Surgery. 2015;158(2):508-514. PubMed
28. Glaser R, Naidu SS, Selzer F, et al. Factors associated with poorer prognosis for patients undergoing primary percutaneous coronary intervention during off-hours: biology or systems failure? JACC Cardiovasc Interv. 2008;1(6):681-688. PubMed
© 2018 Society of Hospital Medicine
TXT2STAYQUIT: Pilot Randomized Trial of Brief Automated Smoking Cessation Texting Intervention for Inpatient Smokers Discharged from the Hospital
Hospitalization requires smokers to quit temporarily and offers healthcare professionals an opportunity to provide cessation treatment.1 However, it is important that encouragement continues after the patient has been discharged from the hospital.2 Studies have shown that text messaging interventions for smoking cessation are efficacious in increasing biochemically confirmed cessation rates at 6-month follow-up.3-5 Utilizing technology such as automated voice calls postdischarge has been shown to increase smoking cessation rates; however, text messaging has not been applied to this population.6 This randomized controlled trial of automated smoking cessation support at discharge, coupled with brief advice among hospital inpatients, aimed to assess whether text messaging is a feasible method for providing smoking cessation support and monitoring smoking status postdischarge.
METHODS
Six hundred fifty-five inpatients accepted cessation counseling, 248 were eligible for study participation (including smoking ≥20 cigarettes in 30 days prior to admission and being willing to make a quit attempt and send and/or receive texts), 158 consented to the study, and 140 were included in the analysis (participant removal from analysis was due to technical difficulties prohibiting the participants from receiving the intervention). Participants received texts via an automated system maintained through the College of Information Sciences and Technology at Pennsylvania State University starting at discharge and continuing for 1 month. Control participants received weekly text message smoking status questions. Intervention participants received weekly smoking status questions in addition to daily smoking cessation tips and had the option to interact with the system for additional support. Quit status was based on self-reported, past-week abstinence 28 days after discharge with subsample biochemical verification via carbon monoxide (CO) reading. Intent-to-treat analysis was utilized, and those who did not complete the follow-up phone call were classified as smokers.7 Power was calculated based on the magnitude of change found in the largest published randomized controlled trial of texts for smoking cessation that reported results using a similar 28-day definition.4 This study had 63% power to detect a difference in 28-day abstinence (measured using past 7-day abstinence) of 28.7% in the intervention group compared with 12.1% in the control group.
RESULTS
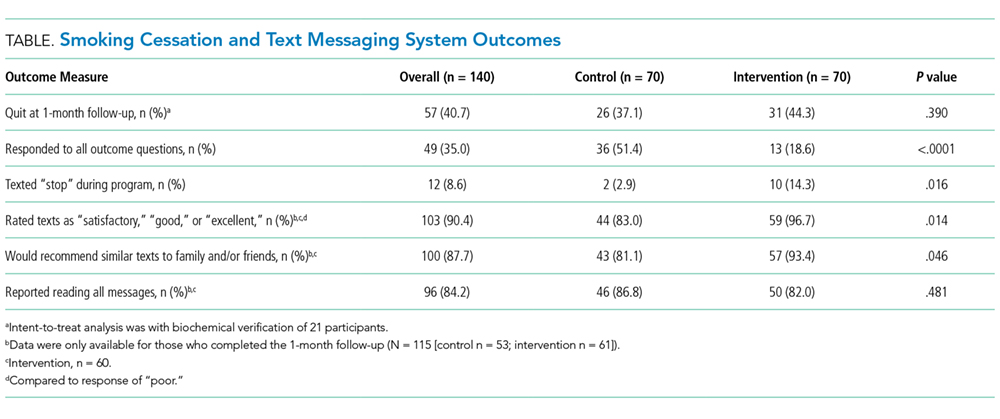
DISCUSSION
This study demonstrates that texting may be a feasible method for following up with hospitalized smokers postdischarge. A majority of participants responded to at least 4 of the 5 outcome questions. Additionally, participants in the intervention group who completed the 1-month follow-up were more likely than those in the control group to rate the texts favorably and to say that they would recommend similar texts to family or friends, indicating that those in the intervention group found the program helpful. However, a majority of participants in the control group also rated the texts favorably and reported they would recommend similar texts to friends or family. This implies that the limited texts provided to the control group may have provided more benefit than researchers previously anticipated.
This study also illustrates the importance of biochemical verification of quit status. Of participants who completed CO verification, 14% did not meet the requirement to be classified as nonsmokers. Other studies of text messaging interventions, including Abroms et al.3 and Free et al.,4 utilized biochemical verification via salivary cotinine and found that of participants who self-reported having quit at follow-up, 24.4% and 28% failed the verification, respectively. In the current study, 10 participants refused verification. It is possible that those who were unwilling to comply may not truly have quit.
While researchers have found that text messaging interventions are efficacious, they have not applied them to an inpatient setting. A limitation is that 62% (n = 407) of the patients counseled were ineligible, and 36% (n = 90) of those who were eligible were not interested in participating. This may indicate that the intervention format is of interest to a limited audience that is already familiar with text messaging. Another limitation is that this was a pilot study conducted with limited power. However, it does provide useful preliminary data for consideration in the development of future text-based smoking cessation interventions.
In conclusion, this study shows that automated text messaging may be a feasible way to monitor smoking status as well as provide smoking cessation support after smokers are discharged from the hospital.
Acknowledgments
The authors gratefully acknowledge those in the respiratory care department at Penn State Health Milton S. Hershey Medical Center for their assistance in the recruitment for this study and providing inpatient smoking cessation counseling.
Disclosure
Dr. Foulds has done paid consulting for pharmaceutical companies that are involved in producing smoking cessation medications, including GlaxoSmithKline, Pfizer, Novartis, Johnson and Johnson, and Cypress Bioscience Inc. All other authors declare that they have no potential conflicts of interest to disclose.
Funding
The project described was supported by the National Center for Advancing Translational Sciences, National Institutes of Health, through an internal pilot grant (PI: JF) as part of parent grant to Penn State CTSI: Grant UL1 TR000127 and TR002014. The content is solely the responsibility of the authors and does not necessarily represent the official views of the NIH.
1. Fiore MC, Jaén CR, Baker TB, et al. Treating Tobacco Use and Dependence: 2008 Update. Rockville, MD: U.S. Department of Health and Human Services; 2008. PubMed
2. Rigotti NA, Munafo MR, Stead LF. Smoking cessation interventions for hospitalized smokers: a systematic review. Arch Intern Med. 2008;168(18):1950-1960. PubMed
3. Abroms LC, Boal AL, Simmens SJ, Mendel JA, Windsor RA. A randomized trial of Text2Quit: a text messaging program for smoking cessation. Am J Prev Med. 2014;47(3):242-250. PubMed
4. Free C, Knight R, Robertson S, et al. Smoking cessation support delivered via mobile phone text messaging (txt2stop): a single-blind, randomised trial. Lancet. 2011;378(9785):49-55. PubMed
5. Spohr SA, Nandy R, Gandhiraj D, Vemulapalli A, Anne S, Walters ST. Efficacy of SMS text message interventions for smoking cessation: a meta-analysis. J Subst Abuse Treat. 2015;56:1-10. PubMed
6. Rigotti NA, Regan S, Levy DE, et al. Sustained care intervention and postdischarge smoking cessation among hospitalized adults: a randomized clinical trial. JAMA. 2014;312(7):719-728. PubMed
7. Gupta SK. Intention-to-treat concept: a review. Perspect Clin Res. 2011;2(3):109-112. PubMed
Hospitalization requires smokers to quit temporarily and offers healthcare professionals an opportunity to provide cessation treatment.1 However, it is important that encouragement continues after the patient has been discharged from the hospital.2 Studies have shown that text messaging interventions for smoking cessation are efficacious in increasing biochemically confirmed cessation rates at 6-month follow-up.3-5 Utilizing technology such as automated voice calls postdischarge has been shown to increase smoking cessation rates; however, text messaging has not been applied to this population.6 This randomized controlled trial of automated smoking cessation support at discharge, coupled with brief advice among hospital inpatients, aimed to assess whether text messaging is a feasible method for providing smoking cessation support and monitoring smoking status postdischarge.
METHODS
Six hundred fifty-five inpatients accepted cessation counseling, 248 were eligible for study participation (including smoking ≥20 cigarettes in 30 days prior to admission and being willing to make a quit attempt and send and/or receive texts), 158 consented to the study, and 140 were included in the analysis (participant removal from analysis was due to technical difficulties prohibiting the participants from receiving the intervention). Participants received texts via an automated system maintained through the College of Information Sciences and Technology at Pennsylvania State University starting at discharge and continuing for 1 month. Control participants received weekly text message smoking status questions. Intervention participants received weekly smoking status questions in addition to daily smoking cessation tips and had the option to interact with the system for additional support. Quit status was based on self-reported, past-week abstinence 28 days after discharge with subsample biochemical verification via carbon monoxide (CO) reading. Intent-to-treat analysis was utilized, and those who did not complete the follow-up phone call were classified as smokers.7 Power was calculated based on the magnitude of change found in the largest published randomized controlled trial of texts for smoking cessation that reported results using a similar 28-day definition.4 This study had 63% power to detect a difference in 28-day abstinence (measured using past 7-day abstinence) of 28.7% in the intervention group compared with 12.1% in the control group.
RESULTS
DISCUSSION
This study demonstrates that texting may be a feasible method for following up with hospitalized smokers postdischarge. A majority of participants responded to at least 4 of the 5 outcome questions. Additionally, participants in the intervention group who completed the 1-month follow-up were more likely than those in the control group to rate the texts favorably and to say that they would recommend similar texts to family or friends, indicating that those in the intervention group found the program helpful. However, a majority of participants in the control group also rated the texts favorably and reported they would recommend similar texts to friends or family. This implies that the limited texts provided to the control group may have provided more benefit than researchers previously anticipated.
This study also illustrates the importance of biochemical verification of quit status. Of participants who completed CO verification, 14% did not meet the requirement to be classified as nonsmokers. Other studies of text messaging interventions, including Abroms et al.3 and Free et al.,4 utilized biochemical verification via salivary cotinine and found that of participants who self-reported having quit at follow-up, 24.4% and 28% failed the verification, respectively. In the current study, 10 participants refused verification. It is possible that those who were unwilling to comply may not truly have quit.
While researchers have found that text messaging interventions are efficacious, they have not applied them to an inpatient setting. A limitation is that 62% (n = 407) of the patients counseled were ineligible, and 36% (n = 90) of those who were eligible were not interested in participating. This may indicate that the intervention format is of interest to a limited audience that is already familiar with text messaging. Another limitation is that this was a pilot study conducted with limited power. However, it does provide useful preliminary data for consideration in the development of future text-based smoking cessation interventions.
In conclusion, this study shows that automated text messaging may be a feasible way to monitor smoking status as well as provide smoking cessation support after smokers are discharged from the hospital.
Acknowledgments
The authors gratefully acknowledge those in the respiratory care department at Penn State Health Milton S. Hershey Medical Center for their assistance in the recruitment for this study and providing inpatient smoking cessation counseling.
Disclosure
Dr. Foulds has done paid consulting for pharmaceutical companies that are involved in producing smoking cessation medications, including GlaxoSmithKline, Pfizer, Novartis, Johnson and Johnson, and Cypress Bioscience Inc. All other authors declare that they have no potential conflicts of interest to disclose.
Funding
The project described was supported by the National Center for Advancing Translational Sciences, National Institutes of Health, through an internal pilot grant (PI: JF) as part of parent grant to Penn State CTSI: Grant UL1 TR000127 and TR002014. The content is solely the responsibility of the authors and does not necessarily represent the official views of the NIH.
Hospitalization requires smokers to quit temporarily and offers healthcare professionals an opportunity to provide cessation treatment.1 However, it is important that encouragement continues after the patient has been discharged from the hospital.2 Studies have shown that text messaging interventions for smoking cessation are efficacious in increasing biochemically confirmed cessation rates at 6-month follow-up.3-5 Utilizing technology such as automated voice calls postdischarge has been shown to increase smoking cessation rates; however, text messaging has not been applied to this population.6 This randomized controlled trial of automated smoking cessation support at discharge, coupled with brief advice among hospital inpatients, aimed to assess whether text messaging is a feasible method for providing smoking cessation support and monitoring smoking status postdischarge.
METHODS
Six hundred fifty-five inpatients accepted cessation counseling, 248 were eligible for study participation (including smoking ≥20 cigarettes in 30 days prior to admission and being willing to make a quit attempt and send and/or receive texts), 158 consented to the study, and 140 were included in the analysis (participant removal from analysis was due to technical difficulties prohibiting the participants from receiving the intervention). Participants received texts via an automated system maintained through the College of Information Sciences and Technology at Pennsylvania State University starting at discharge and continuing for 1 month. Control participants received weekly text message smoking status questions. Intervention participants received weekly smoking status questions in addition to daily smoking cessation tips and had the option to interact with the system for additional support. Quit status was based on self-reported, past-week abstinence 28 days after discharge with subsample biochemical verification via carbon monoxide (CO) reading. Intent-to-treat analysis was utilized, and those who did not complete the follow-up phone call were classified as smokers.7 Power was calculated based on the magnitude of change found in the largest published randomized controlled trial of texts for smoking cessation that reported results using a similar 28-day definition.4 This study had 63% power to detect a difference in 28-day abstinence (measured using past 7-day abstinence) of 28.7% in the intervention group compared with 12.1% in the control group.
RESULTS
DISCUSSION
This study demonstrates that texting may be a feasible method for following up with hospitalized smokers postdischarge. A majority of participants responded to at least 4 of the 5 outcome questions. Additionally, participants in the intervention group who completed the 1-month follow-up were more likely than those in the control group to rate the texts favorably and to say that they would recommend similar texts to family or friends, indicating that those in the intervention group found the program helpful. However, a majority of participants in the control group also rated the texts favorably and reported they would recommend similar texts to friends or family. This implies that the limited texts provided to the control group may have provided more benefit than researchers previously anticipated.
This study also illustrates the importance of biochemical verification of quit status. Of participants who completed CO verification, 14% did not meet the requirement to be classified as nonsmokers. Other studies of text messaging interventions, including Abroms et al.3 and Free et al.,4 utilized biochemical verification via salivary cotinine and found that of participants who self-reported having quit at follow-up, 24.4% and 28% failed the verification, respectively. In the current study, 10 participants refused verification. It is possible that those who were unwilling to comply may not truly have quit.
While researchers have found that text messaging interventions are efficacious, they have not applied them to an inpatient setting. A limitation is that 62% (n = 407) of the patients counseled were ineligible, and 36% (n = 90) of those who were eligible were not interested in participating. This may indicate that the intervention format is of interest to a limited audience that is already familiar with text messaging. Another limitation is that this was a pilot study conducted with limited power. However, it does provide useful preliminary data for consideration in the development of future text-based smoking cessation interventions.
In conclusion, this study shows that automated text messaging may be a feasible way to monitor smoking status as well as provide smoking cessation support after smokers are discharged from the hospital.
Acknowledgments
The authors gratefully acknowledge those in the respiratory care department at Penn State Health Milton S. Hershey Medical Center for their assistance in the recruitment for this study and providing inpatient smoking cessation counseling.
Disclosure
Dr. Foulds has done paid consulting for pharmaceutical companies that are involved in producing smoking cessation medications, including GlaxoSmithKline, Pfizer, Novartis, Johnson and Johnson, and Cypress Bioscience Inc. All other authors declare that they have no potential conflicts of interest to disclose.
Funding
The project described was supported by the National Center for Advancing Translational Sciences, National Institutes of Health, through an internal pilot grant (PI: JF) as part of parent grant to Penn State CTSI: Grant UL1 TR000127 and TR002014. The content is solely the responsibility of the authors and does not necessarily represent the official views of the NIH.
1. Fiore MC, Jaén CR, Baker TB, et al. Treating Tobacco Use and Dependence: 2008 Update. Rockville, MD: U.S. Department of Health and Human Services; 2008. PubMed
2. Rigotti NA, Munafo MR, Stead LF. Smoking cessation interventions for hospitalized smokers: a systematic review. Arch Intern Med. 2008;168(18):1950-1960. PubMed
3. Abroms LC, Boal AL, Simmens SJ, Mendel JA, Windsor RA. A randomized trial of Text2Quit: a text messaging program for smoking cessation. Am J Prev Med. 2014;47(3):242-250. PubMed
4. Free C, Knight R, Robertson S, et al. Smoking cessation support delivered via mobile phone text messaging (txt2stop): a single-blind, randomised trial. Lancet. 2011;378(9785):49-55. PubMed
5. Spohr SA, Nandy R, Gandhiraj D, Vemulapalli A, Anne S, Walters ST. Efficacy of SMS text message interventions for smoking cessation: a meta-analysis. J Subst Abuse Treat. 2015;56:1-10. PubMed
6. Rigotti NA, Regan S, Levy DE, et al. Sustained care intervention and postdischarge smoking cessation among hospitalized adults: a randomized clinical trial. JAMA. 2014;312(7):719-728. PubMed
7. Gupta SK. Intention-to-treat concept: a review. Perspect Clin Res. 2011;2(3):109-112. PubMed
1. Fiore MC, Jaén CR, Baker TB, et al. Treating Tobacco Use and Dependence: 2008 Update. Rockville, MD: U.S. Department of Health and Human Services; 2008. PubMed
2. Rigotti NA, Munafo MR, Stead LF. Smoking cessation interventions for hospitalized smokers: a systematic review. Arch Intern Med. 2008;168(18):1950-1960. PubMed
3. Abroms LC, Boal AL, Simmens SJ, Mendel JA, Windsor RA. A randomized trial of Text2Quit: a text messaging program for smoking cessation. Am J Prev Med. 2014;47(3):242-250. PubMed
4. Free C, Knight R, Robertson S, et al. Smoking cessation support delivered via mobile phone text messaging (txt2stop): a single-blind, randomised trial. Lancet. 2011;378(9785):49-55. PubMed
5. Spohr SA, Nandy R, Gandhiraj D, Vemulapalli A, Anne S, Walters ST. Efficacy of SMS text message interventions for smoking cessation: a meta-analysis. J Subst Abuse Treat. 2015;56:1-10. PubMed
6. Rigotti NA, Regan S, Levy DE, et al. Sustained care intervention and postdischarge smoking cessation among hospitalized adults: a randomized clinical trial. JAMA. 2014;312(7):719-728. PubMed
7. Gupta SK. Intention-to-treat concept: a review. Perspect Clin Res. 2011;2(3):109-112. PubMed
© 2018 Society of Hospital Medicine
The Maturing Antibiotic Mantra: “Shorter Is Still Better”
The proper duration of antibiotic therapy for various infections is a matter of long-standing consternation. For decades, the standard antibiotic course for most acute bacterial infections has been 7 to 14 days, based largely on the fact that the week has 7 days in it.1 The reason the week has 7 days in it dates back to an edict issued by Constantine the Great in 321 AD.1 To underscore the absurdity of basing 21st century antibiotic course durations on an ancient Roman Emperor’s decree, I refer to such durations as “Constantine Units.” One Constantine Unit is a 7-day course of antibiotics, and 2 Constantine Units is a 14-day course.
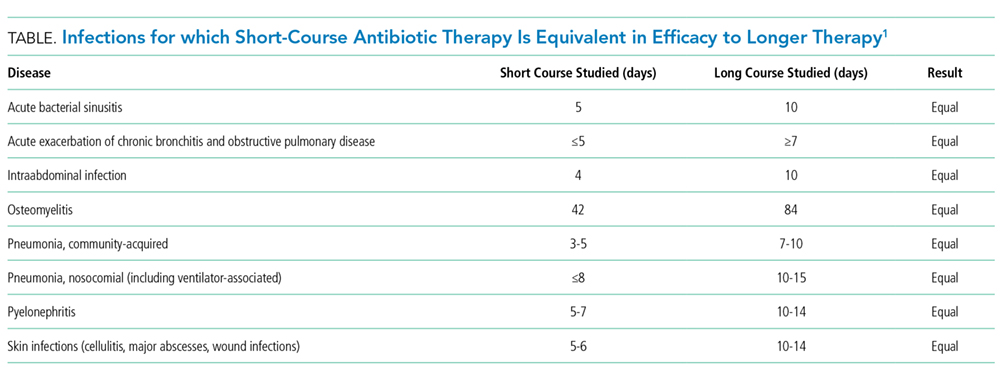
Based on such a plethora of data, a year ago, I suggested that physicians replace the dogma of Constantine-Unit-based durations of therapy with a new mantra, “shorter is better.”1 A year later, that mantra is no longer new. It is maturing, but it is not yet sufficiently widespread among providers. As a result, providers continue to prescribe unnecessarily long durations of antibiotic therapy, which wastes antibiotics, results in increased selective pressure driving antibiotic resistance, and continues to erode the miraculous efficacy of these drugs.
Royer et al.4 have now added to the overwhelming evidence in favor of short-course antibiotic therapy with a new meta-analysis comparing shorter courses with longer courses of therapy for acute bacterial infections, specifically for hospitalized patients. They studied clinical trials comparing shorter versus longer courses of therapy for hospital inpatients with pneumonia, complicated urinary tract infections, intraabdominal infections, or nosocomial infections of unknown origin. Across 13 clinical trials that included efficacy data, cumulatively, the investigators found no difference in clinical cure, microbiological cure, mortality, or infection relapses between short courses and longer courses of therapy. As mentioned, this result is concordant with an extensive body of literature on this topic (Table).
The fact that short durations of antibiotics can cure infections has been known for a long time. In the early penicillin era, courses of therapy were typically 1 to 4 days with good success rates.2 Interestingly, in a recent clinical trial in which daptomycin was found to be ineffective for community-acquired pneumonia (because of inactivation by pulmonary surfactant), a single dose of ceftriaxone markedly improved the cure rate for pneumonia in the daptomycin arm.5,6 The salutary effect of a single dose of ceftriaxone on the clinical cure for pneumonia reinforces how badly we have been overtreating infections for many years.
Many of the signs and symptoms of bacterial infections result from the inflammatory response to the bacteria rather than the direct presence of viable bacteria. Thus, the persistence of symptoms for a few days does not necessarily mean that viable bacteria are still present (ie, symptoms can persist even when all the bacteria are dead). It is likely that a reasonable proportion of patients with acute bacterial infections are cured with 1 day of therapy, and that additional days are decremental to increasing that cure rate. Even 5 days of antibiotics are likely more than is needed to cure the large majority of patients with acute bacterial infections.
Unfortunately, we do not yet have the technology to truly customize durations of therapy in individual patients, although the resolution of high-procalcitonin levels can assist with this question by enabling earlier termination of therapy.7 Rather, we tend to select fixed durations of therapy knowing that we are overtreating some (if not most) patients because we cannot distinguish individual treatment needs, and we want to be sure that the duration we select will maximally cure everyone we treat. Our desire to maximize cures across a population has led us to expand durations of therapy over many decades based on increments of Constantine Units. Fortunately, more recent randomized controlled trials now tell us with great confidence that shorter courses of antibiotic therapy are as effective as longer courses, with the added benefit of reducing the exposure of patients to antibiotics. Reduced exposure intrinsically reduces the risk of adverse events and of selective pressure that drives resistance in our microbiomes.
Thus, shorter is indeed better. The thought is no longer new; it is maturing. It is based on real, repeated, high-quality randomized controlled trials across multiple types of infections. Medical staffs of hospitals should pass expected practices around short-course antibiotic therapy to encourage their providers to practice modern antiinfective medicine. National guidelines for specific types of infections and regulatory standards for clinical trial conduct should also be updated.3,8 In short, it is time for the medical community to support changing our old habits and help to transform how we use and protect the rapidly eroding societal trust8 that is effective antimicrobial therapy.
Disclosure: This work was supported by the National Institute of Allergy and Infectious Diseases at the National Institutes of Health, grant numbers R01 AI130060, R01 HSO25690, R01 AI1081719, and R21 AI127954. In the last 12 months, BS has consulted for Cempra, The Medicines Company, Medimmune, Tetraphase, AstraZeneca, Merck, Genentech, Forge, and Pfizer and owns equity in BioAIM, Synthetic Biologics, and Mycomed.
1. Spellberg B. The New Antibiotic Mantra-”Shorter Is Better.” JAMA Intern Med. 2016;176(9):1254-1255. PubMed
2. Rice LB. The Maxwell Finland Lecture: for the duration-rational antibiotic administration in an era of antimicrobial resistance and clostridium difficile. Clin Infect Dis. 2008;46(4):491-496. PubMed
3. Spellberg B, Bartlett JG, Gilbert DN. The future of antibiotics and resistance. N Engl J Med. 2013;368(4):299-302. PubMed
4. Royer S, DeMerle KM, Dickson RP, Prescott HC. Shorter versus Longer Courses of Antibiotics for Infection in Hospitalized Patients: a Systematic Review and Meta-Analysis. J Hosp Med. In press. PubMed
5. Pertel PE, Bernardo P, Fogarty C, et al. Effects of prior effective therapy on the efficacy of daptomycin and ceftriaxone for the treatment of community-acquired pneumonia. Clin Infect Dis. 2008;46:1142-1151. PubMed
6. Silverman JA, Mortin LI, Vanpraagh AD, Li T, Alder J. Inhibition of daptomycin by pulmonary surfactant: in vitro modeling and clinical impact. J Infect Dis. 2005;191(12):2149-2152. PubMed
7. Sager R, Kutz A, Mueller B, Schuetz P. Procalcitonin-guided diagnosis and antibiotic stewardship revisited. BMC Med. 2017;15(1):15-25. PubMed
8. Spellberg B, Srinivasan A, Chambers HF. New Societal Approaches to Empowering Antibiotic Stewardship. JAMA. 2016;315(12):1229-1230. PubMed
The proper duration of antibiotic therapy for various infections is a matter of long-standing consternation. For decades, the standard antibiotic course for most acute bacterial infections has been 7 to 14 days, based largely on the fact that the week has 7 days in it.1 The reason the week has 7 days in it dates back to an edict issued by Constantine the Great in 321 AD.1 To underscore the absurdity of basing 21st century antibiotic course durations on an ancient Roman Emperor’s decree, I refer to such durations as “Constantine Units.” One Constantine Unit is a 7-day course of antibiotics, and 2 Constantine Units is a 14-day course.
Based on such a plethora of data, a year ago, I suggested that physicians replace the dogma of Constantine-Unit-based durations of therapy with a new mantra, “shorter is better.”1 A year later, that mantra is no longer new. It is maturing, but it is not yet sufficiently widespread among providers. As a result, providers continue to prescribe unnecessarily long durations of antibiotic therapy, which wastes antibiotics, results in increased selective pressure driving antibiotic resistance, and continues to erode the miraculous efficacy of these drugs.
Royer et al.4 have now added to the overwhelming evidence in favor of short-course antibiotic therapy with a new meta-analysis comparing shorter courses with longer courses of therapy for acute bacterial infections, specifically for hospitalized patients. They studied clinical trials comparing shorter versus longer courses of therapy for hospital inpatients with pneumonia, complicated urinary tract infections, intraabdominal infections, or nosocomial infections of unknown origin. Across 13 clinical trials that included efficacy data, cumulatively, the investigators found no difference in clinical cure, microbiological cure, mortality, or infection relapses between short courses and longer courses of therapy. As mentioned, this result is concordant with an extensive body of literature on this topic (Table).
The fact that short durations of antibiotics can cure infections has been known for a long time. In the early penicillin era, courses of therapy were typically 1 to 4 days with good success rates.2 Interestingly, in a recent clinical trial in which daptomycin was found to be ineffective for community-acquired pneumonia (because of inactivation by pulmonary surfactant), a single dose of ceftriaxone markedly improved the cure rate for pneumonia in the daptomycin arm.5,6 The salutary effect of a single dose of ceftriaxone on the clinical cure for pneumonia reinforces how badly we have been overtreating infections for many years.
Many of the signs and symptoms of bacterial infections result from the inflammatory response to the bacteria rather than the direct presence of viable bacteria. Thus, the persistence of symptoms for a few days does not necessarily mean that viable bacteria are still present (ie, symptoms can persist even when all the bacteria are dead). It is likely that a reasonable proportion of patients with acute bacterial infections are cured with 1 day of therapy, and that additional days are decremental to increasing that cure rate. Even 5 days of antibiotics are likely more than is needed to cure the large majority of patients with acute bacterial infections.
Unfortunately, we do not yet have the technology to truly customize durations of therapy in individual patients, although the resolution of high-procalcitonin levels can assist with this question by enabling earlier termination of therapy.7 Rather, we tend to select fixed durations of therapy knowing that we are overtreating some (if not most) patients because we cannot distinguish individual treatment needs, and we want to be sure that the duration we select will maximally cure everyone we treat. Our desire to maximize cures across a population has led us to expand durations of therapy over many decades based on increments of Constantine Units. Fortunately, more recent randomized controlled trials now tell us with great confidence that shorter courses of antibiotic therapy are as effective as longer courses, with the added benefit of reducing the exposure of patients to antibiotics. Reduced exposure intrinsically reduces the risk of adverse events and of selective pressure that drives resistance in our microbiomes.
Thus, shorter is indeed better. The thought is no longer new; it is maturing. It is based on real, repeated, high-quality randomized controlled trials across multiple types of infections. Medical staffs of hospitals should pass expected practices around short-course antibiotic therapy to encourage their providers to practice modern antiinfective medicine. National guidelines for specific types of infections and regulatory standards for clinical trial conduct should also be updated.3,8 In short, it is time for the medical community to support changing our old habits and help to transform how we use and protect the rapidly eroding societal trust8 that is effective antimicrobial therapy.
Disclosure: This work was supported by the National Institute of Allergy and Infectious Diseases at the National Institutes of Health, grant numbers R01 AI130060, R01 HSO25690, R01 AI1081719, and R21 AI127954. In the last 12 months, BS has consulted for Cempra, The Medicines Company, Medimmune, Tetraphase, AstraZeneca, Merck, Genentech, Forge, and Pfizer and owns equity in BioAIM, Synthetic Biologics, and Mycomed.
The proper duration of antibiotic therapy for various infections is a matter of long-standing consternation. For decades, the standard antibiotic course for most acute bacterial infections has been 7 to 14 days, based largely on the fact that the week has 7 days in it.1 The reason the week has 7 days in it dates back to an edict issued by Constantine the Great in 321 AD.1 To underscore the absurdity of basing 21st century antibiotic course durations on an ancient Roman Emperor’s decree, I refer to such durations as “Constantine Units.” One Constantine Unit is a 7-day course of antibiotics, and 2 Constantine Units is a 14-day course.
Based on such a plethora of data, a year ago, I suggested that physicians replace the dogma of Constantine-Unit-based durations of therapy with a new mantra, “shorter is better.”1 A year later, that mantra is no longer new. It is maturing, but it is not yet sufficiently widespread among providers. As a result, providers continue to prescribe unnecessarily long durations of antibiotic therapy, which wastes antibiotics, results in increased selective pressure driving antibiotic resistance, and continues to erode the miraculous efficacy of these drugs.
Royer et al.4 have now added to the overwhelming evidence in favor of short-course antibiotic therapy with a new meta-analysis comparing shorter courses with longer courses of therapy for acute bacterial infections, specifically for hospitalized patients. They studied clinical trials comparing shorter versus longer courses of therapy for hospital inpatients with pneumonia, complicated urinary tract infections, intraabdominal infections, or nosocomial infections of unknown origin. Across 13 clinical trials that included efficacy data, cumulatively, the investigators found no difference in clinical cure, microbiological cure, mortality, or infection relapses between short courses and longer courses of therapy. As mentioned, this result is concordant with an extensive body of literature on this topic (Table).
The fact that short durations of antibiotics can cure infections has been known for a long time. In the early penicillin era, courses of therapy were typically 1 to 4 days with good success rates.2 Interestingly, in a recent clinical trial in which daptomycin was found to be ineffective for community-acquired pneumonia (because of inactivation by pulmonary surfactant), a single dose of ceftriaxone markedly improved the cure rate for pneumonia in the daptomycin arm.5,6 The salutary effect of a single dose of ceftriaxone on the clinical cure for pneumonia reinforces how badly we have been overtreating infections for many years.
Many of the signs and symptoms of bacterial infections result from the inflammatory response to the bacteria rather than the direct presence of viable bacteria. Thus, the persistence of symptoms for a few days does not necessarily mean that viable bacteria are still present (ie, symptoms can persist even when all the bacteria are dead). It is likely that a reasonable proportion of patients with acute bacterial infections are cured with 1 day of therapy, and that additional days are decremental to increasing that cure rate. Even 5 days of antibiotics are likely more than is needed to cure the large majority of patients with acute bacterial infections.
Unfortunately, we do not yet have the technology to truly customize durations of therapy in individual patients, although the resolution of high-procalcitonin levels can assist with this question by enabling earlier termination of therapy.7 Rather, we tend to select fixed durations of therapy knowing that we are overtreating some (if not most) patients because we cannot distinguish individual treatment needs, and we want to be sure that the duration we select will maximally cure everyone we treat. Our desire to maximize cures across a population has led us to expand durations of therapy over many decades based on increments of Constantine Units. Fortunately, more recent randomized controlled trials now tell us with great confidence that shorter courses of antibiotic therapy are as effective as longer courses, with the added benefit of reducing the exposure of patients to antibiotics. Reduced exposure intrinsically reduces the risk of adverse events and of selective pressure that drives resistance in our microbiomes.
Thus, shorter is indeed better. The thought is no longer new; it is maturing. It is based on real, repeated, high-quality randomized controlled trials across multiple types of infections. Medical staffs of hospitals should pass expected practices around short-course antibiotic therapy to encourage their providers to practice modern antiinfective medicine. National guidelines for specific types of infections and regulatory standards for clinical trial conduct should also be updated.3,8 In short, it is time for the medical community to support changing our old habits and help to transform how we use and protect the rapidly eroding societal trust8 that is effective antimicrobial therapy.
Disclosure: This work was supported by the National Institute of Allergy and Infectious Diseases at the National Institutes of Health, grant numbers R01 AI130060, R01 HSO25690, R01 AI1081719, and R21 AI127954. In the last 12 months, BS has consulted for Cempra, The Medicines Company, Medimmune, Tetraphase, AstraZeneca, Merck, Genentech, Forge, and Pfizer and owns equity in BioAIM, Synthetic Biologics, and Mycomed.
1. Spellberg B. The New Antibiotic Mantra-”Shorter Is Better.” JAMA Intern Med. 2016;176(9):1254-1255. PubMed
2. Rice LB. The Maxwell Finland Lecture: for the duration-rational antibiotic administration in an era of antimicrobial resistance and clostridium difficile. Clin Infect Dis. 2008;46(4):491-496. PubMed
3. Spellberg B, Bartlett JG, Gilbert DN. The future of antibiotics and resistance. N Engl J Med. 2013;368(4):299-302. PubMed
4. Royer S, DeMerle KM, Dickson RP, Prescott HC. Shorter versus Longer Courses of Antibiotics for Infection in Hospitalized Patients: a Systematic Review and Meta-Analysis. J Hosp Med. In press. PubMed
5. Pertel PE, Bernardo P, Fogarty C, et al. Effects of prior effective therapy on the efficacy of daptomycin and ceftriaxone for the treatment of community-acquired pneumonia. Clin Infect Dis. 2008;46:1142-1151. PubMed
6. Silverman JA, Mortin LI, Vanpraagh AD, Li T, Alder J. Inhibition of daptomycin by pulmonary surfactant: in vitro modeling and clinical impact. J Infect Dis. 2005;191(12):2149-2152. PubMed
7. Sager R, Kutz A, Mueller B, Schuetz P. Procalcitonin-guided diagnosis and antibiotic stewardship revisited. BMC Med. 2017;15(1):15-25. PubMed
8. Spellberg B, Srinivasan A, Chambers HF. New Societal Approaches to Empowering Antibiotic Stewardship. JAMA. 2016;315(12):1229-1230. PubMed
1. Spellberg B. The New Antibiotic Mantra-”Shorter Is Better.” JAMA Intern Med. 2016;176(9):1254-1255. PubMed
2. Rice LB. The Maxwell Finland Lecture: for the duration-rational antibiotic administration in an era of antimicrobial resistance and clostridium difficile. Clin Infect Dis. 2008;46(4):491-496. PubMed
3. Spellberg B, Bartlett JG, Gilbert DN. The future of antibiotics and resistance. N Engl J Med. 2013;368(4):299-302. PubMed
4. Royer S, DeMerle KM, Dickson RP, Prescott HC. Shorter versus Longer Courses of Antibiotics for Infection in Hospitalized Patients: a Systematic Review and Meta-Analysis. J Hosp Med. In press. PubMed
5. Pertel PE, Bernardo P, Fogarty C, et al. Effects of prior effective therapy on the efficacy of daptomycin and ceftriaxone for the treatment of community-acquired pneumonia. Clin Infect Dis. 2008;46:1142-1151. PubMed
6. Silverman JA, Mortin LI, Vanpraagh AD, Li T, Alder J. Inhibition of daptomycin by pulmonary surfactant: in vitro modeling and clinical impact. J Infect Dis. 2005;191(12):2149-2152. PubMed
7. Sager R, Kutz A, Mueller B, Schuetz P. Procalcitonin-guided diagnosis and antibiotic stewardship revisited. BMC Med. 2017;15(1):15-25. PubMed
8. Spellberg B, Srinivasan A, Chambers HF. New Societal Approaches to Empowering Antibiotic Stewardship. JAMA. 2016;315(12):1229-1230. PubMed
© Society of Hospital Medicine