User login
Dramatic improvements reported after surgery for hidradenitis suppurativa
A retrospective German study found that the majority of , with many saying they no longer suffered from everyday impairment from the disease.
“We were able to show that surgical therapy resulted in convincing improvement of life quality and long-term results for HS that are at least as effective as biologicals,” the researchers wrote. The study was published online in the Journal of the European Academy of Dermatology and Venereology.
Lukas Kofler, MD, and associates from the department of dermatology at Eberhard Karls University’s University Medical Center, Tübingen, Germany, surveyed 910 of the facility’s patients who had undergone wide local excision for HS from 2006 to 2015. Surgery was “designed to reach into clinically disease-free subcutaneous fatty tissue,” followed by second intention healing, they wrote.
A total of 255 patients answered the survey, a response rate of 28%. There were 103 men and 152 women with a median age of 38 years (range, 14-66 years); 75% reported prior “nicotine abuse.” Almost half had been treated previously, most often with systemic antibiotics in 68%. The mean follow-up time was 57 months (range, 19-127 months);
All cases were Hurley grade III. Just over three-quarters of the patients described disease-related limitations in private life prior to surgery as “very strong” or “strong,” and 95% reported that their day-to-day life was impaired. Sixty percent said the disease impaired their work life (another 8% were not employed).
After surgery, 27% experienced postoperative complications, including minor bleeding, infection, and limited mobility; 65% experienced pain but 38% of the patients required analgesics postoperatively.
After surgery, 80% were satisfied or very satisfied with the results, and more than two-thirds were satisfied with the cosmetic results. Just over half said their private life was not impaired by the disease at all, compared with 3% who said so before surgery. After surgery, 20% reported being strongly or very strongly impaired, compared with 77% before surgery.

Nearly 70% reported that HS recurred after surgery, but 62% of those with recurrences said the disease was not as severe as before surgery.
“Surgery represents an important treatment option by itself but should also be part of combined therapeutic strategies, especially in severe disease stages. However, consistent approaches combining systemic and surgical treatments have not been established yet,” the authors noted.
The study had no funding source. The authors had no conflicts to disclose.
SOURCE: Kofler L et al. J Eur Acad Dermatol Venereol. 2018 Mar 23. doi: 10.1111/jdv.14892.
A retrospective German study found that the majority of , with many saying they no longer suffered from everyday impairment from the disease.
“We were able to show that surgical therapy resulted in convincing improvement of life quality and long-term results for HS that are at least as effective as biologicals,” the researchers wrote. The study was published online in the Journal of the European Academy of Dermatology and Venereology.
Lukas Kofler, MD, and associates from the department of dermatology at Eberhard Karls University’s University Medical Center, Tübingen, Germany, surveyed 910 of the facility’s patients who had undergone wide local excision for HS from 2006 to 2015. Surgery was “designed to reach into clinically disease-free subcutaneous fatty tissue,” followed by second intention healing, they wrote.
A total of 255 patients answered the survey, a response rate of 28%. There were 103 men and 152 women with a median age of 38 years (range, 14-66 years); 75% reported prior “nicotine abuse.” Almost half had been treated previously, most often with systemic antibiotics in 68%. The mean follow-up time was 57 months (range, 19-127 months);
All cases were Hurley grade III. Just over three-quarters of the patients described disease-related limitations in private life prior to surgery as “very strong” or “strong,” and 95% reported that their day-to-day life was impaired. Sixty percent said the disease impaired their work life (another 8% were not employed).
After surgery, 27% experienced postoperative complications, including minor bleeding, infection, and limited mobility; 65% experienced pain but 38% of the patients required analgesics postoperatively.
After surgery, 80% were satisfied or very satisfied with the results, and more than two-thirds were satisfied with the cosmetic results. Just over half said their private life was not impaired by the disease at all, compared with 3% who said so before surgery. After surgery, 20% reported being strongly or very strongly impaired, compared with 77% before surgery.
Nearly 70% reported that HS recurred after surgery, but 62% of those with recurrences said the disease was not as severe as before surgery.
“Surgery represents an important treatment option by itself but should also be part of combined therapeutic strategies, especially in severe disease stages. However, consistent approaches combining systemic and surgical treatments have not been established yet,” the authors noted.
The study had no funding source. The authors had no conflicts to disclose.
SOURCE: Kofler L et al. J Eur Acad Dermatol Venereol. 2018 Mar 23. doi: 10.1111/jdv.14892.
FROM THE JOURNAL OF THE EUROPEAN ACADEMY OF DERMATOLOGY AND VENEREOLOGY.
Key clinical point: Patients with hidradenitis suppurativa (HS) report dramatic improvement after radical surgery.
Major finding: The percentage reporting strong or very strong impairment of private life fell from 77% before surgery to 20% afterward.
Study details: A retrospective survey of 255 patients who had undergone surgery for HS (Hurley stage III).
Disclosures: The study had no funding source. The authors had no conflicts to disclose.
Source: Kofler L et al. J Eur Acad Dermatol Venereol. 2018 Mar 23. doi: 10.1111/jdv.14892.
Permanent His-bundle pacing superior to RV pacing
ORLANDO – Pacing at the bundle of His was associated with significantly reduced morbidity and mortality, compared with right ventricular pacing, over time in a large observational registry of patients needing a permanent pacemaker for bradycardia, Mohamed Abdelrahman, MD, reported at the annual meeting of the American College of Cardiology.
The superiority of His-bundle pacing (HBP) was concentrated in patients who required ventricular pacing more than 20% of the time. This finding is consistent with previous reports that even a modest utilization of ventricular pacing is sufficient to boost the risk of left ventricular dysfunction secondary to electrical and mechanical dyssynchrony, added Dr. Abdelrahman of the Geisinger Heart Institute in Danville, Pa.

The primary study endpoint was a composite of all-cause mortality, heart-failure hospitalization, and biventricular pacing upgrade. During a mean 2 years of follow-up, this endpoint was reached in 25% of the HBP group, compared with 32% of the RVP group, for a significant 29% relative risk reduction. In patients with a ventricular pacing burden greater than 20%, the primary endpoint occurred in 25% of the HBP group and 36% of patients with RVP, for a 35% relative risk reduction. However, in patients who required ventricular pacing less than 20% of the time, there was no significant difference in the primary outcome between the two groups.
Heart failure hospitalization occurred in 12.4% of the HBP group and 17.6% of the RVP patients, for a 37% relative risk reduction. In patients with ventricular pacing more than 20% of the time, the rates were 12.4% and 20.1%, for a 46% relative risk reduction in favor of HBP.
Among patients with a ventricular pacing burden of more than 20%, all-cause mortality occurred in 18% of the HBP group, compared with 23.7% of RVP-treated patients.
One patient in the HBP group required an upgrade to biventricular pacing, as did six patients in the RVP group. Lead revision was necessary in 14 patients in the HBP group, versus 2 in the RVP group. Pericardial effusion within the first month of pacemaker implantation occurred in three patients in the RVP group and did not occur in the HBP group.
Discussant Kristen K. Patton, MD, called the Geisinger work “a really wonderful study,” adding, “It’s incredibly difficult to overstate how excited we are in electrophysiology about His-bundle pacing and what a wonderfully elegant solution this is to the problem of pacing-induced dyssynchrony.
“Is there anything that gives you pause, any patients in whom the increased risk of revisions makes you think, ‘I shouldn’t do this in everyone?’ Because I can tell you, it’s hard not to want to do this in everyone,” said Dr. Patton, professor of medicine at the University of Washington, Seattle.
Dr. Abdelrahman replied that Geisinger electrophysiologists now utilize HBP in all patients who require a permanent pacemaker for bradycardia.
Session chair Martin B. Leon, MD, of Columbia University, New York, had a question: “This is such an important area. Why didn’t you do a randomized trial from the start?”
Dr. Abdelrahman’s senior coinvestigator, Pugazhendhi Vijayaraman, MD, explained: “His-bundle pacing has been around for the last 20 years. It’s had its ups and downs. In the last few years there’s been a groundswell of implanters doing His-bundle pacing. The number of implanters here and around the world is rapidly expanding. So we are ready for a randomized trial, and we’ve applied for funding from the National Institutes of Health. Industry support for this has not been forthcoming because His-bundle pacing does not seem to add to the value of a company’s portfolio, but more to better patient outcomes.”
He emphasized that, of the 14 patients in the HBP group who underwent lead revision, only 2 had absolute lead failure and loss of capture, underscoring the safety of this pacing strategy.
Dr. Abdelrahman reported having no financial conflicts of interest regarding the study.
SOURCE: Abdelrahman M. ACC 18.
ORLANDO – Pacing at the bundle of His was associated with significantly reduced morbidity and mortality, compared with right ventricular pacing, over time in a large observational registry of patients needing a permanent pacemaker for bradycardia, Mohamed Abdelrahman, MD, reported at the annual meeting of the American College of Cardiology.
The superiority of His-bundle pacing (HBP) was concentrated in patients who required ventricular pacing more than 20% of the time. This finding is consistent with previous reports that even a modest utilization of ventricular pacing is sufficient to boost the risk of left ventricular dysfunction secondary to electrical and mechanical dyssynchrony, added Dr. Abdelrahman of the Geisinger Heart Institute in Danville, Pa.
The primary study endpoint was a composite of all-cause mortality, heart-failure hospitalization, and biventricular pacing upgrade. During a mean 2 years of follow-up, this endpoint was reached in 25% of the HBP group, compared with 32% of the RVP group, for a significant 29% relative risk reduction. In patients with a ventricular pacing burden greater than 20%, the primary endpoint occurred in 25% of the HBP group and 36% of patients with RVP, for a 35% relative risk reduction. However, in patients who required ventricular pacing less than 20% of the time, there was no significant difference in the primary outcome between the two groups.
Heart failure hospitalization occurred in 12.4% of the HBP group and 17.6% of the RVP patients, for a 37% relative risk reduction. In patients with ventricular pacing more than 20% of the time, the rates were 12.4% and 20.1%, for a 46% relative risk reduction in favor of HBP.
Among patients with a ventricular pacing burden of more than 20%, all-cause mortality occurred in 18% of the HBP group, compared with 23.7% of RVP-treated patients.
One patient in the HBP group required an upgrade to biventricular pacing, as did six patients in the RVP group. Lead revision was necessary in 14 patients in the HBP group, versus 2 in the RVP group. Pericardial effusion within the first month of pacemaker implantation occurred in three patients in the RVP group and did not occur in the HBP group.
Discussant Kristen K. Patton, MD, called the Geisinger work “a really wonderful study,” adding, “It’s incredibly difficult to overstate how excited we are in electrophysiology about His-bundle pacing and what a wonderfully elegant solution this is to the problem of pacing-induced dyssynchrony.
“Is there anything that gives you pause, any patients in whom the increased risk of revisions makes you think, ‘I shouldn’t do this in everyone?’ Because I can tell you, it’s hard not to want to do this in everyone,” said Dr. Patton, professor of medicine at the University of Washington, Seattle.
Dr. Abdelrahman replied that Geisinger electrophysiologists now utilize HBP in all patients who require a permanent pacemaker for bradycardia.
Session chair Martin B. Leon, MD, of Columbia University, New York, had a question: “This is such an important area. Why didn’t you do a randomized trial from the start?”
Dr. Abdelrahman’s senior coinvestigator, Pugazhendhi Vijayaraman, MD, explained: “His-bundle pacing has been around for the last 20 years. It’s had its ups and downs. In the last few years there’s been a groundswell of implanters doing His-bundle pacing. The number of implanters here and around the world is rapidly expanding. So we are ready for a randomized trial, and we’ve applied for funding from the National Institutes of Health. Industry support for this has not been forthcoming because His-bundle pacing does not seem to add to the value of a company’s portfolio, but more to better patient outcomes.”
He emphasized that, of the 14 patients in the HBP group who underwent lead revision, only 2 had absolute lead failure and loss of capture, underscoring the safety of this pacing strategy.
Dr. Abdelrahman reported having no financial conflicts of interest regarding the study.
SOURCE: Abdelrahman M. ACC 18.
REPORTING FROM ACC 18
Key clinical point:
Major finding: The combined rate of all-cause mortality, heart-failure hospitalization, and biventricular pacing upgrade during a mean 2 years of follow-up was 25% in patients with His-bundle pacing, compared with 32% with right ventricular pacing.
Study details: This observational registry included 765 consecutive patients who required an initial permanent pacemaker implantation. All those treated at one medical center underwent an attempt at His-bundle pacing, while all those at a closely allied sister medical center received right ventricular pacing.
Disclosures: The study presenter reported having no financial conflicts of interest.
Source: Abdelrahman M. ACC 18.
Fat Fracture: A Rare Cause of Anterior and Medial Knee Pain in a Professional Baseball Player
ABSTRACT
Blunt trauma to the anterior knee typically results in a contusion or fracture of the patella. Additionally, injury to the extensor mechanism may come from a partial or full disruption of the patellar or quadriceps tendon. A professional baseball player suffered an injury to his knee after he collided with an outfield wall. Acute swelling in the suprapatellar soft tissues concealed a palpable defect, which initially was suspected to be an injury to the quadriceps tendon. Magnetic resonance imaging of the knee revealed an intact extensor mechanism; moreover, a fracture of the subcutaneous fat anterior to the quadriceps tendon was evident and diagnosed as a fat fracture.
Fat fracture is a rare diagnosis, and to the best of our knowledge, this is the first reported diagnosis in a professional athlete. Conservative management including, but not limited to, range of motion exercises, hydrotherapy, and iontophoresis effectively treated the athlete’s injury.
Blunt trauma to the anterior knee can result in a contusion or fracture of the patella, subluxation of the patella, and injury to the quadriceps or patellar tendon. Typically, a contusion or non-displaced fracture of the patella clinically presents with a direct anterior effusion and point tenderness. A displaced fracture or tendon deficit typically has an extensor lag or weakness in extension. Fat fracture or traumatic lipomata has been previously described in 1 case of anterior knee pain after blunt injury.1
In this article, we present the case of a 32-year-old professional baseball player who suffered a blunt injury to his left knee after collision with the outfield wall and experienced both anterior and medial knee pain. The patient provided written informed consent for print and electronic publication of this case report.
CASE
A 32-year-old outfielder for a professional baseball team was attempting a catch in the outfield when his left knee collided with the padded outfield wall in a semiflexed position. The player was able to walk off the field in the middle of the inning; however, he then experienced increasing pain and was unable to return to play. He had no prior history of significant knee pain or injury. He complained only of pain, with no instability or sensation of catching or locking.
Continue to: Physical examination of the patient...
Physical examination of the patient revealed a grade 1+ swelling over the anterior aspect of the superior pole of the patella in the prepatellar region, as well as medially over the medial femoral condyle. However, there was no joint effusion. Palpation of the superomedial aspect of the patella elicited pain, but no medial joint line tenderness was elicited. Percussion testing to the patella was negative. There were no gross palpable defects in the extensor mechanism, and the patient was able to perform a straight leg raise against resistance with pain.
Mild coronal laxity of the patella was noted compared with that of the contralateral knee. Hip range of motion (ROM) was intact, but knee ROM was limited to 110° of flexion, with the complaint of anterior tightness at this position. He was able to fully extend his knee without symptoms. The knee was stable to varus and valgus stress at both 0° and 30° of flexion. Lachman and anterior and posterior drawer tests were negative and symmetric to the contralateral knee. The McMurray test for meniscal pathology also was negative. Radiographs of the left knee were completed and were negative for fracture.
OUTCOMES
The initial clinical diagnosis was a patellar contusion and sprain of the medial retinaculum, and the athlete was treated with multiple modalities available in the athletic training room. Rehabilitation included activity modifications, passive and active ROM activities, quadriceps isometric exercises, and neuromuscular control activities. Adjunctive modalities included cryotherapy, hydrotherapy, topical hematoma cream, and iontophoresis.2 This aggressive treatment was continued for 3 days with decreased but persistent pain with running drills and limited knee flexion. Repeat clinical examination revealed a decreased swelling, but there was evidence of a clinically palpable defect anteriorly proximal to the patella. Although the patient could perform a straight leg raise, a partial injury to the quadriceps became plausible. Magnetic resonance imaging (MRI) of the left knee was performed, owing to the persistent pain and limited flexion despite aggressive conservative management, as well as the palpable soft-tissue defect.
MRI was performed using a 3T (Tesla) system (GE Healthcare) with a GE Healthcare Precision 8-channel knee coil. Routine knee protocol imaging was performed to include the distal quadriceps tendon due to clinical concern for a quadriceps tear. Sagittal proton density and proton-density fat-saturated (PD FS), coronal T1 and PD FS, and axial T1 and PD FS sequences were acquired.
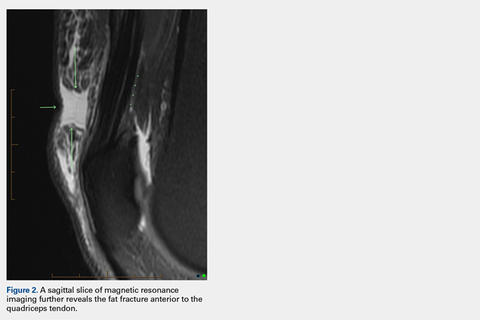
An acutely marginated, 1.5 cm × 3 cm, longitudinal and transverse fluid defect “crevasse” was identified at the midline in the prepatellar subcutaneous fat overlying the distal quadriceps tendon and corresponded to a clinically palpable abnormality (Figures 1, 2). 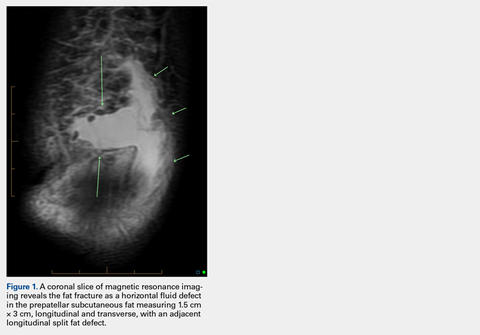

Continue to: These findings explained...
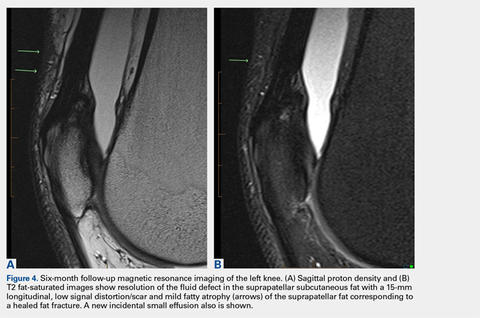
These findings explained the delayed course in resolution of symptoms. Over the next 48 hours, continued conservative management, as outlined above, led to the resolution of symptoms, and the athlete returned to play. At a 2-month follow-up, the athlete described normal function in his knee without any residual symptoms. He returned to play without any symptoms. At 6 months, the athlete underwent MRI of the same knee for an unrelated reason. MRI revealed a healed fat fracture with resolution of the fluid defect in the subcutaneous fat (Figures 4A, 4B).
DISCUSSION
A fat fracture was first described in 1972 in 12 cases of buttock fat fractures after blunt trauma.3 The authors explained that fat lobules are typically arranged in layers and supported by horizontal and vertical fibrous septa. Typical loads flatten the lobules and disperse the forces throughout the layer. However, abnormal loads to a local area disrupt the fat lobules and shear the septa, resulting in decreased integrity of the interface between the epidermis and the fascia.
However, the extremities typically have less adipose tissue than in the buttocks, and the anterior knee is prone to blunt trauma. A previous description of a fat fracture in the knee noted a palpable defect in the quadriceps tendon and an inability to perform a straight leg raise. Our case initially presented with swelling, which concealed any soft-tissue defect. Furthermore, a straight leg raise was always intact despite the fat fracture defect surfacing after anterior swelling subsided. However, the disparity in these 2 cases highlights the spectrum of injury that is possible, as well as the difficulty in diagnosing a fat fracture. The previous report used ultrasound to confirm the diagnosis and assess the integrity of adjacent musculotendinous structures. An ultrasound may be readily available in athletic training rooms.1 Of note, to the best of our knowledge, this is the first case in the literature to report a fat fracture in a professional athlete and in baseball players. Furthermore, this case report describes an athlete who presented with anterior and medial knee pain. The edema from the fat fracture dispersed into the medial prepatellar bursa, which could be confused with edema from an injury to the medial-sided soft tissues.
Although these injuries do not require operative management, conservative measures may not be as effective as those in a patellar contusion or ligamentous sprain, and prolonged treatment may be necessary. Additionally, healthcare providers should be aware of this possible source of injury and counsel on an appropriate recovery time. Ideally, further recognition of such injuries can facilitate improved management and a faster return to activity.
1. Thomas RH, Holt MD, James SH, White PG. 'Fat fracture'—a physical sign mimicking tendon rupture. J Bone Joint Surg Br. 2001;83(2):204-205.
2. Antich T, Randall CC, Westbrook RA, Morrissey MC, Brewster CE. Physical therapy treatment of knee extensor mechanism disorders: comparison of four treatment modalities*. J Orthop Sports Phys Ther. 1986;8(5):255-259.
3. Meggitt BF, Wilson JN. The battered buttock syndrome—fat fractures. A report on a group of traumatic lipomata. Br J Surg. 1972;59(3):165-169.
ABSTRACT
Blunt trauma to the anterior knee typically results in a contusion or fracture of the patella. Additionally, injury to the extensor mechanism may come from a partial or full disruption of the patellar or quadriceps tendon. A professional baseball player suffered an injury to his knee after he collided with an outfield wall. Acute swelling in the suprapatellar soft tissues concealed a palpable defect, which initially was suspected to be an injury to the quadriceps tendon. Magnetic resonance imaging of the knee revealed an intact extensor mechanism; moreover, a fracture of the subcutaneous fat anterior to the quadriceps tendon was evident and diagnosed as a fat fracture.
Fat fracture is a rare diagnosis, and to the best of our knowledge, this is the first reported diagnosis in a professional athlete. Conservative management including, but not limited to, range of motion exercises, hydrotherapy, and iontophoresis effectively treated the athlete’s injury.
Blunt trauma to the anterior knee can result in a contusion or fracture of the patella, subluxation of the patella, and injury to the quadriceps or patellar tendon. Typically, a contusion or non-displaced fracture of the patella clinically presents with a direct anterior effusion and point tenderness. A displaced fracture or tendon deficit typically has an extensor lag or weakness in extension. Fat fracture or traumatic lipomata has been previously described in 1 case of anterior knee pain after blunt injury.1
In this article, we present the case of a 32-year-old professional baseball player who suffered a blunt injury to his left knee after collision with the outfield wall and experienced both anterior and medial knee pain. The patient provided written informed consent for print and electronic publication of this case report.
CASE
A 32-year-old outfielder for a professional baseball team was attempting a catch in the outfield when his left knee collided with the padded outfield wall in a semiflexed position. The player was able to walk off the field in the middle of the inning; however, he then experienced increasing pain and was unable to return to play. He had no prior history of significant knee pain or injury. He complained only of pain, with no instability or sensation of catching or locking.
Continue to: Physical examination of the patient...
Physical examination of the patient revealed a grade 1+ swelling over the anterior aspect of the superior pole of the patella in the prepatellar region, as well as medially over the medial femoral condyle. However, there was no joint effusion. Palpation of the superomedial aspect of the patella elicited pain, but no medial joint line tenderness was elicited. Percussion testing to the patella was negative. There were no gross palpable defects in the extensor mechanism, and the patient was able to perform a straight leg raise against resistance with pain.
Mild coronal laxity of the patella was noted compared with that of the contralateral knee. Hip range of motion (ROM) was intact, but knee ROM was limited to 110° of flexion, with the complaint of anterior tightness at this position. He was able to fully extend his knee without symptoms. The knee was stable to varus and valgus stress at both 0° and 30° of flexion. Lachman and anterior and posterior drawer tests were negative and symmetric to the contralateral knee. The McMurray test for meniscal pathology also was negative. Radiographs of the left knee were completed and were negative for fracture.
OUTCOMES
The initial clinical diagnosis was a patellar contusion and sprain of the medial retinaculum, and the athlete was treated with multiple modalities available in the athletic training room. Rehabilitation included activity modifications, passive and active ROM activities, quadriceps isometric exercises, and neuromuscular control activities. Adjunctive modalities included cryotherapy, hydrotherapy, topical hematoma cream, and iontophoresis.2 This aggressive treatment was continued for 3 days with decreased but persistent pain with running drills and limited knee flexion. Repeat clinical examination revealed a decreased swelling, but there was evidence of a clinically palpable defect anteriorly proximal to the patella. Although the patient could perform a straight leg raise, a partial injury to the quadriceps became plausible. Magnetic resonance imaging (MRI) of the left knee was performed, owing to the persistent pain and limited flexion despite aggressive conservative management, as well as the palpable soft-tissue defect.
MRI was performed using a 3T (Tesla) system (GE Healthcare) with a GE Healthcare Precision 8-channel knee coil. Routine knee protocol imaging was performed to include the distal quadriceps tendon due to clinical concern for a quadriceps tear. Sagittal proton density and proton-density fat-saturated (PD FS), coronal T1 and PD FS, and axial T1 and PD FS sequences were acquired.
An acutely marginated, 1.5 cm × 3 cm, longitudinal and transverse fluid defect “crevasse” was identified at the midline in the prepatellar subcutaneous fat overlying the distal quadriceps tendon and corresponded to a clinically palpable abnormality (Figures 1, 2).
Continue to: These findings explained...
These findings explained the delayed course in resolution of symptoms. Over the next 48 hours, continued conservative management, as outlined above, led to the resolution of symptoms, and the athlete returned to play. At a 2-month follow-up, the athlete described normal function in his knee without any residual symptoms. He returned to play without any symptoms. At 6 months, the athlete underwent MRI of the same knee for an unrelated reason. MRI revealed a healed fat fracture with resolution of the fluid defect in the subcutaneous fat (Figures 4A, 4B).
DISCUSSION
A fat fracture was first described in 1972 in 12 cases of buttock fat fractures after blunt trauma.3 The authors explained that fat lobules are typically arranged in layers and supported by horizontal and vertical fibrous septa. Typical loads flatten the lobules and disperse the forces throughout the layer. However, abnormal loads to a local area disrupt the fat lobules and shear the septa, resulting in decreased integrity of the interface between the epidermis and the fascia.
However, the extremities typically have less adipose tissue than in the buttocks, and the anterior knee is prone to blunt trauma. A previous description of a fat fracture in the knee noted a palpable defect in the quadriceps tendon and an inability to perform a straight leg raise. Our case initially presented with swelling, which concealed any soft-tissue defect. Furthermore, a straight leg raise was always intact despite the fat fracture defect surfacing after anterior swelling subsided. However, the disparity in these 2 cases highlights the spectrum of injury that is possible, as well as the difficulty in diagnosing a fat fracture. The previous report used ultrasound to confirm the diagnosis and assess the integrity of adjacent musculotendinous structures. An ultrasound may be readily available in athletic training rooms.1 Of note, to the best of our knowledge, this is the first case in the literature to report a fat fracture in a professional athlete and in baseball players. Furthermore, this case report describes an athlete who presented with anterior and medial knee pain. The edema from the fat fracture dispersed into the medial prepatellar bursa, which could be confused with edema from an injury to the medial-sided soft tissues.
Although these injuries do not require operative management, conservative measures may not be as effective as those in a patellar contusion or ligamentous sprain, and prolonged treatment may be necessary. Additionally, healthcare providers should be aware of this possible source of injury and counsel on an appropriate recovery time. Ideally, further recognition of such injuries can facilitate improved management and a faster return to activity.
1. Thomas RH, Holt MD, James SH, White PG. 'Fat fracture'—a physical sign mimicking tendon rupture. J Bone Joint Surg Br. 2001;83(2):204-205.
2. Antich T, Randall CC, Westbrook RA, Morrissey MC, Brewster CE. Physical therapy treatment of knee extensor mechanism disorders: comparison of four treatment modalities*. J Orthop Sports Phys Ther. 1986;8(5):255-259.
3. Meggitt BF, Wilson JN. The battered buttock syndrome—fat fractures. A report on a group of traumatic lipomata. Br J Surg. 1972;59(3):165-169.
TAKE-HOME POINTS
- A fat fracture should be considered in the setting of a blunt injury to the anterior knee when a palpable soft-tissue defect is observed and the extensor mechanism is clinically intact.
- An ultrasound or MRI can assist in making the diagnosis, which can aid in guiding the patient with management and in determining the expected duration of symptoms.
- Injuries to the anterior knee that may present as contusions but have a prolonged course of symptoms should not be overlooked.

Patient advocacy groups take in millions from drugmakers. Is there a payback?
Pharmaceutical companies gave at least $116 million to patient advocacy groups in a single year, reveals a new database logging 12,000 donations from large publicly traded drugmakers to such organizations.
Even as these patient groups grow in number and political influence, their funding and their relationships to drugmakers are little understood. Unlike payments to doctors and lobbying expenses, companies do not have to report payments to the groups.
The database, called “Pre$cription for Power,” shows that . The 14 companies that contributed $116 million to patient advocacy groups reported only about $63 million in lobbying activities that same year.
Though their primary missions are to focus attention on the needs of patients with a particular disease – such as arthritis, heart disease or various cancers – some groups effectively supplement the work lobbyists perform, providing patients to testify on Capitol Hill and organizing letter-writing and social media campaigns that are beneficial to pharmaceutical companies.
Six drugmakers, the data show, contributed a million dollars or more to individual groups that represent patients who rely on their drugs. The database identifies more than 1,200 patient groups. Of those, 594 accepted money from the drugmakers in the database.
The financial ties are troubling if they cause even one patient group to act in a way that’s “not fully representing the interest of its constituents,” said Matthew McCoy, a medical ethics professor at the University of Pennsylvania, Philadelphia, who coauthored a 2017 study about patient advocacy groups’ influence and transparency.
Notably, such groups have been silent or slow to complain about high or escalating prices, a prime concern of patients.
“When so many patient organizations are being influenced in this way, it can shift our whole approach to health policy, taking away from the interests of patients and towards the interests of industry,” Mr. McCoy said. “That’s not just a problem for the patients and caregivers that particular patient organizations serve; that’s a problem for everyone.”
Bristol-Myers Squibb provides a stark example of how patient groups are valued. In 2015, it spent more than $20.5 million on patient groups, compared with $2.9 million on federal lobbying and less than $1 million on major trade associations, according to public records and company disclosures. The company said its decisions regarding lobbying and contributions to patient groups are “unrelated.”
“Bristol-Myers Squibb is focused on supporting a health care environment that rewards innovation and ensures access to medicines for patients,” said spokeswoman Laura Hortas. “The company supports patient organizations with this shared objective.”
The first-of-its-kind database, compiled by Kaiser Health News, tallies the money from Big Pharma to patient groups. KHN examined the 20 pharmaceutical firms included in the S&P 500, 14 of which were transparent – in varying degrees – about giving money to patient groups. Pre$cription for Power is based on information contained in charitable giving reports from company websites and federal 990 regulatory filings.
It spotlights donations pharma companies made to patient groups large and small. The recipients include well-known disease groups, like the American Diabetes Association, with revenues of hundreds of millions of dollars; high-profile foundations like Susan G. Komen, a patient group focused on breast cancer; and smaller, lesser-known groups, like the Caring Ambassadors Program, which focuses on lung cancer and hepatitis C.
The data show that 15 patient groups – with annual revenues as large as $3.6 million – relied on the pharmaceutical companies for at least 20% of their revenue, and some relied on them for more than half of their revenue. The database explores only a slice of the pharmaceutical industry’s giving overall and will be expanded with more companies and groups over time.
“It’s clear that more transparency in this space is vitally important,” said Sen. Claire McCaskill (D-Mo.), who has been investigating the links between patient advocates and opioid manufacturers and is considering legislation to track funding. “This database is one step forward in that effort, but we also need Congress to act.”
What drives the money flow
The financial ties between drugmakers and the organizations that represent those who use or prescribe their blockbuster medicines have been of growing concern as drug prices escalate. The Senate investigated conflicts of interest in the run-up to the passage of the 2010 Physician Payments Sunshine Act – a law that required payments to physicians from makers of drugs and devices to be registered on a public website – but patient groups were not addressed in the bill.
Some of the patient groups with ties to trade groups echo industry talking points in media campaigns and letters to federal agencies, and do little else. And patients, supported by pharma, are dispatched to state capitals and Washington to support research funding. Some groups send patients updates on the newest drugs and industry products.
“It’s through groups like this that patients often learn about illnesses and treatments,” said Rick Claypool, a research director for Public Citizen, a consumer advocacy group that says it does not accept pharmaceutical funding.
For the patient group Caring Ambassadors Program, industry funds are needed to make up for a lack of public funding, said the group’s executive director, Lorren Sandt. According to IRS filings and published company reports, in 2015, the group received $413,000, the bulk of which came from one company, AbbVie, which makes a hepatitis C treatment and has been testing a new lung cancer drug, Rova-T, not yet approved. She said the money had no influence on the Caring Ambassadors Program’s priorities.
“There aren’t a lot of large pockets of funding outside of the pharmaceutical money,” Sandt said. “We take it where we can find it.”
Other patient groups such as the National Women’s Health Network, based in Washington, make sacrifices to avoid pharmaceutical funding. That includes operating with a small staff in a “modest” office building with few windows and outdated computers, according to executive director Cindy Pearson. “You can see the effect of our approach to funding as soon as you walk [in] the door.”
Pearson said it’s hard for patient groups not to be influenced by the funder, even if they proclaim independence. Patient groups “build relationships with their funders and feel in sync and have sympathy” for them. “It’s human nature. It’s not evil or weak, but it’s wrong.”
Charity as marketing
Patients newly diagnosed with a disease often turn to patient advocacy groups for advice, but the money flow to such groups may distort patients’ knowledge and public debate over treatment options, said Dr. Adriane Fugh-Berman, the director of PharmedOut, a Georgetown University Medical Center program in Washington that is critical of some pharmaceutical marketing practices.
“[The money flow limits] their advocacy agenda to competing branded products when the best therapy might be generics, over-the-counter drugs or diet and exercise,” she said.
AbbVie – whose specialty drug Humira made up 65% of the company’s net revenue in 2017 and is used to treat patients with autoimmune diseases, including Crohn’s disease and certain kinds of arthritis – gave $2.7 million to the Crohn’s & Colitis Foundation and $1.6 million to the Arthritis Foundation, according to the company’s public disclosures included in the database. The list price for a month’s supply of Humira, a biologic drug, is $4,872, according to Express Scripts, a pharmacy benefits manager.
Even though Humira will face competition from near-copycat drugs called biosimilars, it is expected to remain the highest-grossing drug in the United States through 2022, according to drug industry analysts at EvaluatePharma.
The Arthritis and Crohn’s foundations have been largely silent on the cost of Humira and vocal on safety concerns about biosimilars. The Arthritis Foundation has championed state laws that could add extra steps for consumers to receive biosimilars at the pharmacy counter, potentially keeping more patients on the brand-name drug. Experts say those laws could help protect Humira’s market share from generic competitors.
A coalition of patient groups, Patients for Biologics Safety & Access, opposes the automatic substitution of a cheaper biosimilar when doctors prescribe a biologic. In 2015, members of that coalition, including the Crohn’s & Colitis Foundation, the Arthritis Foundation and the Lupus Foundation of America, accepted about $9.1 million from pharmaceutical companies in the database, according to public disclosures. They include AbbVie and Johnson & Johnson, makers of blockbuster biologics.
The Arthritis Foundation did not deny receiving the money but said the foundation represents patients, not sponsors. It is “optimistic” about biosimilars’ ability to help patients and save them money, said Anna Hyde, vice president of advocacy and access. “The Foundation supports the Food and Drug Administration’s scientific standards in evaluating the safety and efficacy of biosimilars, and we support policies that encourage innovation and foster a competitive marketplace.”
The Crohn’s & Colitis Foundation maintains “more than an arm’s-length distance” from its donors in the pharmaceutical industry, who have no say over the foundation’s strategic objectives, said president and CEO Michael Osso.
He added that the foundation’s position on biosimilars is “evolving.”
Lupus Foundation CEO Sandra Raymond said she could not explain how her group, also based in Washington, was involved in the coalition. She confirmed the Lupus Foundation received $444,000 from Pfizer in 2015 but said the money was not linked to any relationship with Patients for Biologics Safety & Access.
“I never went to a meeting,” Raymond said. “A former employee signed us up for a whole host of coalitions. I think we put our name on something or someone did.”
She said the Lupus Foundation was no longer a member of the coalition. Days after Kaiser Health News reached out to the coalition, its website was updated, excluding the Lupus Foundation.
For its part, AbbVie – which overall donated $24.7 million to patient groups in 2015, according to the new database – stipulates that its grants to nonprofits are “non-promotional” and provide no direct benefit to its business, according to a company statement. The company gives to patient groups because they serve as an “important, unbiased and independent resource for patients and caregivers.”
Insulin and influence
The American Diabetes Association said in an email to KHN that it received $18.3 million in pharmaceutical funding in 2017, accounting for 12.3% of its revenue; that was down from $26.7 million in 2015. The money flowed in as insulin makers continued to hike prices in those years – up to four times per product – leading to hardships for patients.
The only “Big Three” insulin maker in the database, Eli Lilly, gave $2.9 million to the American Diabetes Association in 2015, according to disclosures from the company and its foundation. Sanofi and Novo Nordisk are the other two major insulin makers, but neither was in the S&P 500 and therefore not included in the database. Over the past 20 years, Eli Lilly has repeatedly raised prices on its best-selling insulins, Humalog and Humulin, even though the medicines have been around for decades. The drugmaker faced protests – by people demanding to know the cost of manufacturing a vial of insulin – at its Indianapolis headquarters last fall.
The ADA launched a campaign decrying “skyrocketing” insulin in late 2016 but did not call out any drugmaker in its literature. When legislators in Nevada passed a bill last year requiring insulin makers to disclose their profits to the public, the ADA did not take a public stance.
The American Diabetes Association said it doesn’t confront individual companies because it is seeking action from “all entities in the supply chain” – manufacturers, wholesalers, pharmacy benefit managers and insurers.
“As a public health organization, the ADA’s commitment and focus is on the needs of the more than 30 million people with diabetes,” said Dr. William Cefalu, its chief scientific and medical officer. “The ADA requires support from a diverse set of partners to achieve this objective.”
Eli Lilly said it contributes money to the American Diabetes Association because the two share a “common goal” of helping diabetes patients.
“We provide funding for a wide variety of educational programs and opportunities at ADA, and they design and implement those programs in ways that are aligned with their goals,” Eli Lilly said in a statement. “We’re proud to support the ADA on important work that helps millions of people living with diabetes.”
Most patient groups say that funders have little or no influence in shaping their programs and policies, but their agreements are private.
They weren’t always backed by Pharma
Into the ’80s and early ’90s, patient lobbying was generally limited and self-funded with only one or two affluent patients from an organization traveling to Washington on a given day, said Diana Zuckerman, PhD, president of the nonprofit National Center for Health Research.
But the power of patient-lobbyists became apparent after a successful campaign by AIDS patients led to government action and a national push to find drugs to treat the then-terminal disease. Dr. Zuckerman said she will never forget when two women visited her office and asked how breast cancer patients could be as effective as the AIDS patients.
“At the time, there were no breast cancer patients advocating for money or anything else. It’s hard to believe,” she said. “I still remember that conversation, because it was really a turning point.”
Soon after, breast cancer patients started visiting the Hill more frequently. Patients with other diseases followed. Over time, patients’ voices became a potent force, often with industry support.
Even some wealthy, high-profile organizations take industry money: For example, $459,000 of Susan G. Komen’s $118 million in 2015 revenue came from drugmakers in the database, according to public disclosures. Asked about the pharma money, the foundation said it has institutional processes in place to ensure that “no corporate partner – pharma or otherwise – decides our mission priorities,” including a scientific advisory board – free of sponsor influence – that reviews its research program.
Today, patient advocacy groups flush with more industry dollars fly patients in for testimony and training about how to lobby for their drugs.
Some years ago, as the groups increased in number, Dr. Zuckerman said, she started getting email invitations from advocacy groups to attend so-called lobbying days explicitly sponsored by the pharmaceutical industry. The hosts often promised training and usually some kind of keynote speaker at a luncheon in Washington – plus a potential scholarship to cover travel. Now, lobbying days involving dozens of patients from a single group are part of the landscape.
Dan Boston, president of lobbying firm Health Policy Source, said, “It would be naive to think these people on a Tuesday afternoon just happen to turn up in XYZ places,” adding that the money isn’t necessarily a bad thing. Money tends to flow toward citizen groups that already have the same priorities as their funders, he said.
Marching into the future
Patient groups have been successful at campaigning for drug approvals, at times sparking controversy.
When scientists within the FDA advised against the approval of Exondys 51, a drug to treat Duchenne muscular dystrophy, parents of children with the rare genetic disorder and patients rallied to lobby for it in Washington. They were seen as pivotal to the FDA’s 2016 decision to grant approval for the drug, made by Sarepta Therapeutics. The decision was controversial in part because the FDA noted that clinical benefits of the drug – aimed at a subset of people with Duchenne muscular dystrophy – were not yet established.
Sarepta Therapeutics, which is not featured in the database, has taken measures to support its patient base. In March, it announced an annual scholarship program – 10 grants of up to $10,000 each for students with Duchenne muscular dystrophy to attend university or trade schools. Sarepta is also among the funders of Parent Project Muscular Dystrophy, a patient advocacy group at the forefront of the push for Exondys 51’s approval.
The Pre$cription for Power database will grow to include new disclosures. Not all drugmakers are willing to disclose their company giving. Eleven of the 20 companies examined – Allergan, Baxter International, Biogen, Celgene, Endo International, Gilead Sciences, Mallinckrodt, Mylan, Perrigo Co., Regeneron Pharmaceuticals, and Vertex Pharmaceuticals – declined to disclose their company giving or did not respond to repeated calls.
Paul Thacker, a former investigator for Sen. Chuck Grassley (R-Iowa) who helped draft the Physician Payments Sunshine Act in 2010, said there is reason to question the flow of money to patient advocacy groups. The pharmaceutical industry has fostered relationships in every link of the drug supply chain, including payments to researchers, doctors and professional societies.
“There’s so much money out there, and they’ve created all of these allies, so nobody is clamoring for change,” Mr. Thacker said.
Since the Physician Payments Sunshine Act began requiring the industry to report its payments to physicians, the industry is more reluctant to co-opt them, so “pharma has to find other megaphones,” PharmedOut’s Dr. Fugh-Berman said.
And, in times of public outrage over high drug prices and soaring insurance costs, patients are particularly sympathetic messengers, she said.
“Sick consumers make for good press,” Dr. Fugh-Berman said. “They make for good testimony before Congress. They can be very powerful spokespeople for pharmaceutical companies.”
KHN’s coverage of prescription drug development, costs and pricing is supported by the Laura and John Arnold Foundation. Kaiser Health News is a nonprofit news service covering health issues. It is an editorially independent program of the Kaiser Family Foundation that is not affiliated with Kaiser Permanente.
Health IT ‘under-users’ outnumber ‘super-users’
Almost 27% of medical practices are “super-users” of health information technology, but another 39% are “under-users” that may be affecting “the ability of the health system as a whole to provide coordinated and efficient care,” investigators said in the American Journal of Managed Care.
To put it another way, wrote Juliet Rumball-Smith, MBChB, PhD, and her associates, who analyzed data for 30,123 practices from the 2014 Healthcare Information and Management Systems Society (HIMSS) Analytics ambulatory practice survey.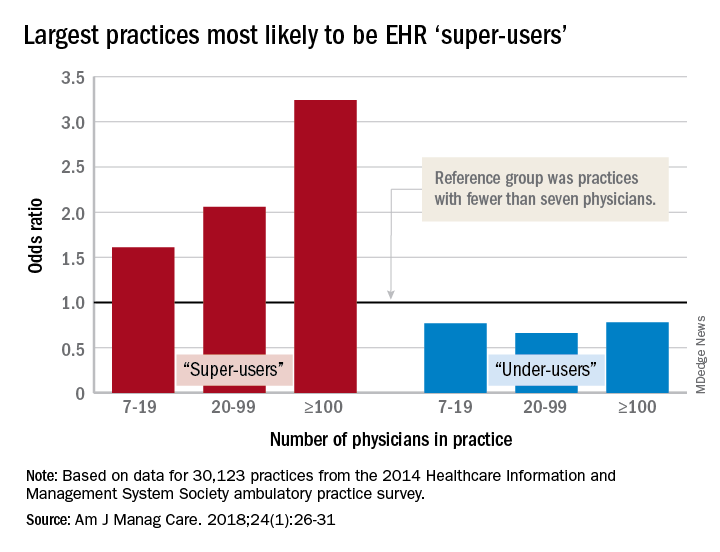
After all the scores were calculated, 8,003 practices (27%) were classified as super-users and 11,706 (39%) as under-users. More specific analysis showed that the smallest practices were least likely to be super-users, and that the likelihood rose with increasing practice size. With practices of fewer than seven physicians as the reference group, odds ratios of being a super-user were 1.61 for practices of 7-19 physicians, 2.06 for those with 20-99 physicians, and 3.24 for those of 100 or more associated physicians, reported Dr. Rumball-Smith and her associates at Rand Health in Santa Monica, Calif.
The situation was not as clear-cut among the technology avoiders, as the odds ratios made practices of 20-99 physicians less likely (0.66) than those of 7-19 (0.77) and 100 or more (0.78) physicians to be under-users, they said.
The super-users also were more likely to located in metropolitan areas (OR, 2.45, compared with rural practices) and in the Midwest (OR, 2.05, compared with the Northeast) or the South (OR, 1.32) and to be primary care/family medicine clinics, which were the reference group for the practice-type comparison (OR, 0.89, for single- or multiple-specialty; 0.64, for specialist services or urgent care), the investigators said.
“It is important that policy makers and health care providers understand the limits of health IT functionality in ambulatory care practices, as strategies aimed at improving the coordination of care or those relying on the EHR as a vehicle for intervention may be hindered by the technological capacity of ambulatory care partners,” they wrote.
The study was funded by the Commonwealth Fund, Rand, and the Agency for Healthcare Research and Quality. The investigators said that they had no conflicts of interest.
SOURCE: Rumball-Smith J et al. Am J Manag Care. 2018;24(1):26-31.
FROM AMERICAN JOURNAL OF MANAGED CARE
Key clinical point: Many medical practices are not prepared to take advantage of EHR-based initiatives.
Major finding: 73% of ambulatory practices are not using EHRs “to their full benefit.”
Study details: HIMSS Analytics 2014 ambulatory practice survey for 30,123 practices.
Disclosures: The study was funded by the Commonwealth Fund, Rand, and the Agency for Healthcare Research and Quality. The investigators said that they had no conflicts of interest.
Source: Rumball-Smith J et al. Am J Manag Care. 2018;24(1):26-31.
Reassurance for women taking certolizumab during pregnancy
according to results of a new study.
Megan E.B. Clowse, MD, of Duke University Medical Center, Durham, N.C., and her coauthors reported on a prospective and retrospective analysis of data from 528 pregnancies – including 10 twin pregnancies – in which the mother was exposed to the anti–tumor necrosis factor (anti-TNF) drug certolizumab during pregnancy.
There were 459 (85.3%) live births, 47 (8.7%) miscarriages, 27 (5%) elective abortions, and five (0.9%) stillbirths, figures that are similar to those seen in the general population. Among the singleton births, 11.7% were low birth weight, which the authors noted was slightly higher than the frequency observed in the general population but was in line with previous reports with TNF inhibitors.
Two cases of neonatal death were reported. One occurred in one member of a female twin pair, born at 25 weeks, who succumbed to brain damage and pneumoperitoneum. The other was also in female twins, born at 27 weeks, in which one of the pair was born with a heart defect and died during surgery for an unspecified infection of the intestines, the authors reported in Arthritis & Rheumatology.
The study noted eight (1.7%) reports of congenital malformations in the infants born alive, including accessory auricle, polydactyly, hydronephrosis, cerebral ventricle dilatation, and congenital heart disease.
Four cases were in infants whose mothers had rheumatoid arthritis, one in an infant whose mother had ankylosing spondylitis, and three in infants whose mothers had Crohn’s disease (CD).
In five cases, the women were exposed to certolizumab at least in the first trimester, in four they were exposed at least in the second trimester, and in five cases, the women were exposed at least during the third trimester of pregnancy.
“The teratologist review concluded no temporal association with CZP [certolizumab] exposure for the case of hydronephrosis, owing to evidence of anomalies on ultrasound prior to initiation of medication (during the third trimester); the possibility of an association could not be ruled out for the cases of anal fistula, accessory auricle, vesicoureteric reflux, talipes, and congenital heart disease,” the researchers wrote.
Twenty-two women (4.2%) had serious infections during pregnancy, which was in line with the frequency of serious infections reported in patients taking certolizumab.
Among the live births, nearly half (44.5%) reported certolizumab exposure during all three trimesters, 81.2% reported exposure at least during the first trimester, and 29.2% were exposed during the first trimester only.
“More women with rheumatic diseases than CD had first-trimester–only or first- and second-trimester exposure to CZP, reflecting the differing clinical practice between CD and rheumatic diseases,” the authors wrote. “Spontaneous disease improvement in women with IBD [inflammatory bowel disease] during pregnancy is less likely, compared to RA and other rheumatic diseases, and many patients may require treatment throughout pregnancy; thus, potentially reducing the risk of adverse outcomes, such as spontaneous miscarriage, premature birth, low birth weight, small gestational age.”
The authors commented that, despite increasing evidence of the safety of TNF inhibitors during pregnancy – recent systematic reviews and meta-analyses have found no link to adverse outcomes with anti-TNF exposure during the first trimester – patients and physicians still have had concerns about their use.
“This analysis of prospective pregnancy reports from the UCB Pharma safety database represents the largest published cohort of pregnant women exposed to an anti-TNF for the management of chronic inflammatory diseases,” the authors wrote. “It addresses the need for new and detailed studies on the impact of drug exposure during pregnancy and supports the conclusion that CZP exposure in utero does not appear to increase the risk of major congenital malformations or fetal loss.”
However, they acknowledged the lack of an untreated control group and said this meant a formal statistical analysis was not possible. They also noted that outcomes data were not available for about one-third of the entire cohort of 1,137 women whose pregnancies were exposed to certolizumab.
“However, these data are reassuring for women of childbearing age affected by chronic inflammatory diseases who need an anti-TNF to control their condition and wish to become or are pregnant during CZP treatment,” they wrote.
The study was funded by UCB Pharma. One author was a contractor for, and three were employees of, UCB Pharma. Six authors declared grants, consulting fees, and other remuneration from pharmaceutical companies, including UCB Pharma.
SOURCE: Clowse MEB et al. Arthritis & Rheumatology. 2018 Apr 5. doi: 10.1002/art.40508.
FROM ARTHRITIS & RHEUMATOLOGY
Key clinical point: Certolizumab use during pregnancy does not appear to increase the risk of congenital malformations.
Major finding: The incidence of fetal death and congenital malformations in certolizumab-exposed pregnancies is similar to that in the general population.
Study details: A prospective and retrospective analysis of data from 528 certolizumab-exposed pregnancies.
Disclosures: The study was funded by UCB Pharma. One author was a contractor for UCB Pharma, and three were employees of, UCB Pharma. Six authors declared grants, consulting fees, and other remuneration from pharmaceutical companies, including UCB Pharma.
Source: Clowse MEB et al. Arthritis & Rheumatology. 2018 Apr 5. doi: 10.1002/art.40508
Bisphosphonate use linked with lower risk of lung cancer for never-smokers
Oral bisphosphonates may confer a protective effect against lung cancer, according to an observational study.
However, this effect was only observed among never-smokers, as there was no significant difference in lung cancer incidence between oral bisphosphonate use and nonuse in the overall study cohort, Meng-Hua Tao, PhD, of the University of North Texas Health Science Center, Fort Worth, and associates reported in Annals of Oncology.
While bisphosphonates are commonly prescribed to prevent and treat osteoporosis, research suggests that they may have a range of other benefits, such as inhibition of tumor angiogenesis and cellular proliferation, prevention of tumor-cell adhesion and invasion, and induction of tumor-cell apoptosis. Recent studies have also investigated the association between bisphosphonate use and the risk of several cancers including breast, gastrointestinal tract, endometrial, and ovarian. Additionally, a few studies have looked at the relationship between oral bisphosphonates and lung cancer risk, but results have been inconsistent.
However, previous studies had very limited information on lung cancer risk factors, such as tobacco use, and none had analyzed the potential associations between bisphosphonate use and lung cancer and how it might vary by smoking status, the authors noted.
In the current study, the relationship between oral bisphosphonates use and lung cancer risk, and its potential interaction with smoking status on lung cancer risk, was examined using a prospective cohort of 151,432 postmenopausal women enrolled in the Women’s Health Initiative during 1993-1998. At baseline and follow-up, an inventory of regularly used medications including bisphosphonates was completed.
After a mean cumulative follow-up of 13.3 years, there were 2,257 nonusers and 254 ever-users of oral bisphosphonates, and 2,511 women were diagnosed with incident lung cancer. On multivariable-adjusted analysis, the hazard ratio for lung cancer incidence after use of any type of oral bisphosphonate, compared with never-use, was not significantly different (HR = 0.91; 95% confidence interval, 0.80-1.04; P = .16).
In a subgroup analysis, the authors found that the association patterns differed between never-smokers and ever-smokers (P = .02). Among women who never smoked, oral bisphosphonate use was inversely associated with lung cancer risk in the multivariate adjusted models (HR = 0.57; 95% CI, 0.39-0.84; P less than .01), and this association was stronger when the duration of bisphosphonate usage was 1.5 years or longer (HR, 0.36; 95% CI, 0.18-0.73).
For ever-smokers, there was no association between bisphosphonate use and lung cancer risk.
When looking at lung cancer subtype, the incidences of small cell lung cancer and non–small cell lung cancer were similar in bisphosphonate users, but for never-smokers, bisphosphonate use was also associated with a lower non–small cell lung cancer risk (HR = 0.62; 95% CI, 0.41-0.92; P = .02).
“These observational study findings need to be confirmed. As the U.S. Food and Drug Administration issued safety announcements related to potential risk of long-term bisphosphonate use further studies are warranted to investigate how duration of bisphosphonate use may influence risk of lung cancer and evaluate optimal dose of oral bisphosphonates for lung cancer prevention in older women,” wrote Dr. Tao and her associates.
The study was primarily supported by a grant from the National Cancer Institute at the National Institutes of Health. Dr. Tao has no disclosures.
SOURCE: Tao MH et al. Ann Oncol. 2018 Mar 29. doi:10.1093/annonc/mdy097.
FROM THE ANNALS OF ONCOLOGY
Key clinical point: Oral bisphosphonates appeared to confer a protective effect against lung cancer in women who have never smoked.
Major finding: Oral bisphosphonate use was inversely associated with lung cancer risk in nonsmokers (hazard ratio = 0.57; 95% confidence interval, 0.39-0.84; P less than .01).
Study details: Data was drawn from the observational Women’s Health Initiative and included 151,432 participants.
Disclosures: The study was primarily supported by a grant from the National Cancer Institute at the National Institutes of Health. Dr. Tao has no disclosures.
Source: Tao MH et al. Ann Oncol. 2018 Mar 29. doi:10.1093/annonc/mdy097.
Researchers seek better understanding of von Willebrand disease
SAN DIEGO – Several groups of researchers are examining cohorts of von Willebrand disease (VWD), looking at its pathogenesis and molecular causes, as well as ways to improve treatment strategies.
At the biennial summit of the Thrombosis & Hemostasis Societies of North America, Robert F. Sidonio Jr., MD, MSc, highlighted the efforts underway, including the Zimmerman Program for the Molecular and Clinical Biology of VWD study (ZPMCB-VWD), a large grant project funded by the National Institutes of Health.
At the time of publication, there were more than 700 index cases and more than 2,200 families in the study. It includes data from 8 primary centers and 23 secondary centers. The goals are to characterize the molecular causes of VWD and the examine the fidelity of diagnosis, “which is a critical component of the study,” said Dr. Sidonio, clinical director of the hemostasis/thrombosis program at Children’s Healthcare of Atlanta.

When the ZPMCB-VWD investigators examined the correlation of bleeding phenotype and the genotype, the found that as the level of VW factor goes down, the bleeding score generally goes up, but it becomes a little bit flat in the 20-30 IU/dL range.
“Where we spend a lot of our time is with patients who have levels of 30%-50%, which can be quite heterogeneous,” Dr. Sidonio said.
Another finding made out of the ZPMCB-VWD project was the discovery of the single nucleotide polymorphism p.D1472H, which was noted to be more common in African American patients and leads to low Von Willebrand Ristocetin Cofactor (VWF:RCo) and VWF:RCo/VWF:Ag ratio, but does not increase the bleeding score.
The fidelity of diagnosis was another key finding to come out of ZPMCB-VWD. Most type 1 VWD cases were identified by low VWF:RCo. There was poor correlation between historical and current assays (r2 = 0.22), and diagnostic labs improved after central lab testing.
Next, Dr. Sidonio discussed findings from RENAWI 1 and 2, which are Italian registries of about 1,000 VWF patients that were organized by 12 centers in 2002. The goals are to evaluate the natural history of VWD in Italy and to characterize treatment strategies. According to preliminary findings from the researchers, the biological response to desmopressin (DDAVP) was 69% in those with VWD1, 26% in those with VWD2A, 20% in those with VWD2B, 33% in those with VWD2M, 71% in those with VWD2N, and 0% in those with VWD3 (Blood 2014;123:4037-44).
These researchers also found that a mean bleeding score of 3.5 corresponds to a VWF:RCo score of 30 U/dL or greater. “This indicates that there is something slightly different about patients that are above and below that threshold,” Dr. Sidonio said. “I think that’s something we’ve all been struggling with: trying to understand where the differences are and how aggressively we should be treating our patients with mild VWD.”
Another effort, The Willebrand in the Netherlands’ study (WiN), is a prospective cohort trial of about 700 patients with types 1, 2, and 3 VWD from 12 centers in that country (Blood 2008;112:4510). It was the first large study to use VWF propeptide (pp) to discriminate between severe type 1 and type 3 VWD. It also found that type 2 VWD is more characterized by increased clearance in VWF in contrast to type 1 VWD, leading to higher VWFpp/VWF:Ag ratio. In addition, in type 1 VWD, antigen rates increased about 3.5 U/dL per decade, RCo increased about 9.5 U/dL per decade, and Factor VIII: C increased about 7.1 U/dL per decade (J Thromb Haemost. 2014; 12[7]:1066-75).
“I don’t think we have a study to be able to follow patients for 20 years or so, knowing that we rely on the assays that we were using 20 years ago,” Dr. Sidonio said. “That’s a challenge at a lot of our centers, but we know that VWF generally rises with age in mild VWD patients.”
In patients with definitively diagnosed type 2 VWD, no age-related VWF or FVIII changes were observed. The researchers also observed an increase in surgical bleeding and GI bleeding in elderly VWD patients.
In the meantime, the Canadian Type 1 VWD study was one of the first to elucidate the complexity of the pathogenesis of type 1 VWD. It identified CLEC4M as playing a role in VWF clearance, with polymorphisms contributing to the variability of VWF.
More data collection is underway through a partnership between the Centers for Disease Control and Prevention and the American Thrombosis and Hemostasis Network (ATHN).
The CDC Universal Data Collection Project gathered surveillance data on bleeding disorders on patients from 1998-2011. The goals were to characterize bleeding complications, monitor safety of blood-based products to manage bleeding, identify health issues in need of additional research, evaluate bleeding disorders over the lifespan, and evaluate quality of life. In 2006, the ATHN was formed to provide stewardship of the secured national database housed at the CDC. To date, at least 34,000 patients have opted in to the data set, which includes demographic and clinical data used for research.
In a separate, phase 4 study of about 130 patients funded by Shire and led by Dr. Sidonio and Angela C. Weyand, MD, researchers will conduct a “real-world” safety and efficacy study of prophylaxis for severe VWD. Known as ATHN 9, the study includes patients currently enrolled in the ATHN data set. Treatment regimen is at the discretion of patients’ providers, and patients will be followed for up to 2 years from the start of enrollment. The study’s primary aim is to collect data on effectiveness and safety, including adverse events of various VWF regimens in adult and pediatric patients with severe congenital VWD.
Another effort is the Medical and Scientific Advisory Council (MASAC) Working Group, of which Dr. Sidonio is a member. The first meeting took place in July of 2016. The goals include making improvements to diagnostic testing and laboratory standards, assessing existing standards of care and clinical practice guidelines, developing educational programming, conducting research to better understand and develop effective treatments for VWD, and collaborating with partner organizations.
Dr. Sidonio reported that he has participated in advisory boards for Shire, CSL Behring, Biogen/Bioverativ, Pfizer, Emergent Solutions, Roche/Genentech, Aptevo, Novo Nordisk, Hema Biologics, and Octapharma. He also has received investigator-initiated grant funding from Bioverativ, Grifols, Kedrion, and Shire.
SAN DIEGO – Several groups of researchers are examining cohorts of von Willebrand disease (VWD), looking at its pathogenesis and molecular causes, as well as ways to improve treatment strategies.
At the biennial summit of the Thrombosis & Hemostasis Societies of North America, Robert F. Sidonio Jr., MD, MSc, highlighted the efforts underway, including the Zimmerman Program for the Molecular and Clinical Biology of VWD study (ZPMCB-VWD), a large grant project funded by the National Institutes of Health.
At the time of publication, there were more than 700 index cases and more than 2,200 families in the study. It includes data from 8 primary centers and 23 secondary centers. The goals are to characterize the molecular causes of VWD and the examine the fidelity of diagnosis, “which is a critical component of the study,” said Dr. Sidonio, clinical director of the hemostasis/thrombosis program at Children’s Healthcare of Atlanta.
When the ZPMCB-VWD investigators examined the correlation of bleeding phenotype and the genotype, the found that as the level of VW factor goes down, the bleeding score generally goes up, but it becomes a little bit flat in the 20-30 IU/dL range.
“Where we spend a lot of our time is with patients who have levels of 30%-50%, which can be quite heterogeneous,” Dr. Sidonio said.
Another finding made out of the ZPMCB-VWD project was the discovery of the single nucleotide polymorphism p.D1472H, which was noted to be more common in African American patients and leads to low Von Willebrand Ristocetin Cofactor (VWF:RCo) and VWF:RCo/VWF:Ag ratio, but does not increase the bleeding score.
The fidelity of diagnosis was another key finding to come out of ZPMCB-VWD. Most type 1 VWD cases were identified by low VWF:RCo. There was poor correlation between historical and current assays (r2 = 0.22), and diagnostic labs improved after central lab testing.
Next, Dr. Sidonio discussed findings from RENAWI 1 and 2, which are Italian registries of about 1,000 VWF patients that were organized by 12 centers in 2002. The goals are to evaluate the natural history of VWD in Italy and to characterize treatment strategies. According to preliminary findings from the researchers, the biological response to desmopressin (DDAVP) was 69% in those with VWD1, 26% in those with VWD2A, 20% in those with VWD2B, 33% in those with VWD2M, 71% in those with VWD2N, and 0% in those with VWD3 (Blood 2014;123:4037-44).
These researchers also found that a mean bleeding score of 3.5 corresponds to a VWF:RCo score of 30 U/dL or greater. “This indicates that there is something slightly different about patients that are above and below that threshold,” Dr. Sidonio said. “I think that’s something we’ve all been struggling with: trying to understand where the differences are and how aggressively we should be treating our patients with mild VWD.”
Another effort, The Willebrand in the Netherlands’ study (WiN), is a prospective cohort trial of about 700 patients with types 1, 2, and 3 VWD from 12 centers in that country (Blood 2008;112:4510). It was the first large study to use VWF propeptide (pp) to discriminate between severe type 1 and type 3 VWD. It also found that type 2 VWD is more characterized by increased clearance in VWF in contrast to type 1 VWD, leading to higher VWFpp/VWF:Ag ratio. In addition, in type 1 VWD, antigen rates increased about 3.5 U/dL per decade, RCo increased about 9.5 U/dL per decade, and Factor VIII: C increased about 7.1 U/dL per decade (J Thromb Haemost. 2014; 12[7]:1066-75).
“I don’t think we have a study to be able to follow patients for 20 years or so, knowing that we rely on the assays that we were using 20 years ago,” Dr. Sidonio said. “That’s a challenge at a lot of our centers, but we know that VWF generally rises with age in mild VWD patients.”
In patients with definitively diagnosed type 2 VWD, no age-related VWF or FVIII changes were observed. The researchers also observed an increase in surgical bleeding and GI bleeding in elderly VWD patients.
In the meantime, the Canadian Type 1 VWD study was one of the first to elucidate the complexity of the pathogenesis of type 1 VWD. It identified CLEC4M as playing a role in VWF clearance, with polymorphisms contributing to the variability of VWF.
More data collection is underway through a partnership between the Centers for Disease Control and Prevention and the American Thrombosis and Hemostasis Network (ATHN).
The CDC Universal Data Collection Project gathered surveillance data on bleeding disorders on patients from 1998-2011. The goals were to characterize bleeding complications, monitor safety of blood-based products to manage bleeding, identify health issues in need of additional research, evaluate bleeding disorders over the lifespan, and evaluate quality of life. In 2006, the ATHN was formed to provide stewardship of the secured national database housed at the CDC. To date, at least 34,000 patients have opted in to the data set, which includes demographic and clinical data used for research.
In a separate, phase 4 study of about 130 patients funded by Shire and led by Dr. Sidonio and Angela C. Weyand, MD, researchers will conduct a “real-world” safety and efficacy study of prophylaxis for severe VWD. Known as ATHN 9, the study includes patients currently enrolled in the ATHN data set. Treatment regimen is at the discretion of patients’ providers, and patients will be followed for up to 2 years from the start of enrollment. The study’s primary aim is to collect data on effectiveness and safety, including adverse events of various VWF regimens in adult and pediatric patients with severe congenital VWD.
Another effort is the Medical and Scientific Advisory Council (MASAC) Working Group, of which Dr. Sidonio is a member. The first meeting took place in July of 2016. The goals include making improvements to diagnostic testing and laboratory standards, assessing existing standards of care and clinical practice guidelines, developing educational programming, conducting research to better understand and develop effective treatments for VWD, and collaborating with partner organizations.
Dr. Sidonio reported that he has participated in advisory boards for Shire, CSL Behring, Biogen/Bioverativ, Pfizer, Emergent Solutions, Roche/Genentech, Aptevo, Novo Nordisk, Hema Biologics, and Octapharma. He also has received investigator-initiated grant funding from Bioverativ, Grifols, Kedrion, and Shire.
EXPERT ANALYSIS FROM THSNA 2018
Why is gene therapy for hemophilia taking so long?
SAN DIEGO – The goal of gene therapy for hemophilia and other genetic diseases is to achieve long-term expression and levels adequate to improve the phenotype of disease, according to Katherine A. High, MD.
“Sometimes people ask me, ‘Why is it taking so long to develop these therapeutics?’ ” Dr. High said at the biennial summit of the Thrombosis & Hemostasis Societies of North America. “The answer is that gene therapy vectors are arguably one of the most complex therapeutics yet developed.”

Spark Therapeutics is currently developing gene therapies for hemophilia A (SPK-8011) and hemophilia B (SPK-9001).
Hemostasis and thrombosis targets in gene therapy trials include hemophilia, as well as peripheral artery disease/claudication and congestive heart failure. In the latter, a prior phase 2b trial of adeno-associated virus (AAV) expressing SERCA2a did not support efficacy (Lancet 2016;387:1178-86), while a current trial of adenovirus 5–vector expressing adenylyl cyclase–type 6 is entering phase 3 study (NCT03360448).
To get a sense of how long it may take for a new class of therapeutics to become established, Dr. High noted that the first monoclonal antibody to be licensed was OKT3 (muromonab-CD3) in 1986, followed by abciximab in 1994, rituximab and daclizumab in 1997, and four additional products in 1998. By 2007, 8 of the top 20 biotech drugs were monoclonal antibodies.
Hemophilia has long been a favored gene therapy target because biology is in its favor. “It has a wide therapeutic window, it does not require tissue-specific expression of transgene, small and large animal models exist, and endpoints are well validated and easy to measure,” she said. “Thus, early gene-therapy clinical investigation since 1998 explored many strategies.”
There are several current investigational efforts in AAV-mediated gene transfer in hemophilia, including:
- A single-arm study to evaluate the efficacy and safety of valoctocogene roxaparvovec in hemophilia A patients at a dose of 4×10¹³ vector genome per kilogram (NCT03392974).
- A dose-ranging study of recombinant AAV2/6 human factor 8 gene therapy SB-525 in subjects with severe hemophilia A (NCT03061201).
- A safety and dose-escalation study of an adeno-associated viral vector for gene transfer in hemophilia A subjects (NCT03370172).
Other approaches in preclinical investigation include lentiviral transduction of hematopoietic stem cells with megakaryocyte-restricted expression, lentiviral transduction of liver cells and endothelial cells, and genome editing using zinc finger nucleases.
“AAV vectors are one of the smallest of all naturally occurring viruses,” said Dr. High, who is also emeritus professor of pediatrics at the University of Pennsylvania, Philadelphia. “The recombinant AAV consists of a highly ordered set of proteins [vector capsid] containing DNA [the active agent].”
Overall goals for a hemophilia gene therapy include long-term expression and levels adequate to prevent bleeds in someone with a normal active lifestyle. “We’d like to see consistency of results from one person to the next, and we’d like to use the lowest possible dose,” she said. “In the setting of gene transfer, the lower the dose, the lower the likelihood of immune responses that need to be managed. Theoretically, the lower the dose, the lower the risk of insertional mutagenesis, and the shorter-term duration of vector shedding in body fluids, including in semen.”
Going forward, a key question for researchers relates to the long-term effect of gene therapy. “How long is long enough?” Dr. High asked. “The longest reported durability is 8 years, with observation ongoing, from studies initially reported in men with severe hemophilia B. The durability in large animal models exceeds 10 years.”
Another unanswered question is what level of factor VIII to aim for in treatment. “Some data suggest that FVIII levels greater than 100 IU/dL are associated with a greater level of thrombosis,” Dr. High said. “So I think somewhere between 12% and 100% is probably the ideal level.”
SAN DIEGO – The goal of gene therapy for hemophilia and other genetic diseases is to achieve long-term expression and levels adequate to improve the phenotype of disease, according to Katherine A. High, MD.
“Sometimes people ask me, ‘Why is it taking so long to develop these therapeutics?’ ” Dr. High said at the biennial summit of the Thrombosis & Hemostasis Societies of North America. “The answer is that gene therapy vectors are arguably one of the most complex therapeutics yet developed.”
Spark Therapeutics is currently developing gene therapies for hemophilia A (SPK-8011) and hemophilia B (SPK-9001).
Hemostasis and thrombosis targets in gene therapy trials include hemophilia, as well as peripheral artery disease/claudication and congestive heart failure. In the latter, a prior phase 2b trial of adeno-associated virus (AAV) expressing SERCA2a did not support efficacy (Lancet 2016;387:1178-86), while a current trial of adenovirus 5–vector expressing adenylyl cyclase–type 6 is entering phase 3 study (NCT03360448).
To get a sense of how long it may take for a new class of therapeutics to become established, Dr. High noted that the first monoclonal antibody to be licensed was OKT3 (muromonab-CD3) in 1986, followed by abciximab in 1994, rituximab and daclizumab in 1997, and four additional products in 1998. By 2007, 8 of the top 20 biotech drugs were monoclonal antibodies.
Hemophilia has long been a favored gene therapy target because biology is in its favor. “It has a wide therapeutic window, it does not require tissue-specific expression of transgene, small and large animal models exist, and endpoints are well validated and easy to measure,” she said. “Thus, early gene-therapy clinical investigation since 1998 explored many strategies.”
There are several current investigational efforts in AAV-mediated gene transfer in hemophilia, including:
- A single-arm study to evaluate the efficacy and safety of valoctocogene roxaparvovec in hemophilia A patients at a dose of 4×10¹³ vector genome per kilogram (NCT03392974).
- A dose-ranging study of recombinant AAV2/6 human factor 8 gene therapy SB-525 in subjects with severe hemophilia A (NCT03061201).
- A safety and dose-escalation study of an adeno-associated viral vector for gene transfer in hemophilia A subjects (NCT03370172).
Other approaches in preclinical investigation include lentiviral transduction of hematopoietic stem cells with megakaryocyte-restricted expression, lentiviral transduction of liver cells and endothelial cells, and genome editing using zinc finger nucleases.
“AAV vectors are one of the smallest of all naturally occurring viruses,” said Dr. High, who is also emeritus professor of pediatrics at the University of Pennsylvania, Philadelphia. “The recombinant AAV consists of a highly ordered set of proteins [vector capsid] containing DNA [the active agent].”
Overall goals for a hemophilia gene therapy include long-term expression and levels adequate to prevent bleeds in someone with a normal active lifestyle. “We’d like to see consistency of results from one person to the next, and we’d like to use the lowest possible dose,” she said. “In the setting of gene transfer, the lower the dose, the lower the likelihood of immune responses that need to be managed. Theoretically, the lower the dose, the lower the risk of insertional mutagenesis, and the shorter-term duration of vector shedding in body fluids, including in semen.”
Going forward, a key question for researchers relates to the long-term effect of gene therapy. “How long is long enough?” Dr. High asked. “The longest reported durability is 8 years, with observation ongoing, from studies initially reported in men with severe hemophilia B. The durability in large animal models exceeds 10 years.”
Another unanswered question is what level of factor VIII to aim for in treatment. “Some data suggest that FVIII levels greater than 100 IU/dL are associated with a greater level of thrombosis,” Dr. High said. “So I think somewhere between 12% and 100% is probably the ideal level.”
EXPERT ANALYSIS FROM THSNA 2018
Age and race affect access to myeloma treatment
Older patients, African Americans, and individuals of low socioeconomic status may be less likely to receive systemic treatment for newly diagnosed multiple myeloma, results of a recent study suggest.
Comorbidities and poor performance indicators also reduced the likelihood of receiving first-line treatment, according to results of the retrospective cohort study published in Clinical Lymphoma, Myeloma & Leukemia.
The findings highlight the need for a “multifaceted approach” to address outcome disparities in multiple myeloma, according to researcher Bita Fakhri, MD, MPH, of the division of oncology at Washington University, St. Louis, and her coinvestigators.
“Particular attention to aging-related issues is essential to ensure older patients will benefit from the advances achieved in the field, similar to young patients,” the investigators wrote.
Racial and socioeconomic barriers should also be addressed, they added.
The retrospective cohort analysis included data on 3,814 patients with active multiple myeloma in the Surveillance, Epidemiology, and End Results–Medicare database from 2007 to 2011. Investigators found that overall, 1,445 patients (38%) had no insurance claims confirming that they had received systemic treatment.
Older age increased the odds of not receiving treatment, with the likelihood increasing by 7% for each year of advancing age (adjusted odds ratio, 1.07; 95% confidence interval, 1.06-1.08). Likewise, African American patients were 26% more likely to have had no treatment (aOR, 1.26; 95% CI, 1.03-1.54), and patients who were enrolled in both Medicaid and Medicare – a proxy for lower income – had a 21% increased odds of no treatment (aOR, 1.21; 95% CI, 1.02-1.42).
Similarly increased odds of no treatment were reported for patients with comorbidities and poor performance status indicators.
“In a subset of older and frail patients, the risks of treatments approved for [multiple myeloma] might outweigh the benefits or might not be in line with the individual’s goals of care,” the investigators wrote.
The study did not track supportive-care treatments that patients may have received instead of active disease treatment, such as bisphosphonates for skeletal lesions or plasmapheresis for hyperviscosity syndrome.
Lack of treatment was associated with poorer survival in the study. Median overall survival was just 9.6 months for individuals with no record of treatment, compared with 32.3 months for patients who had received treatment.
Dr. Fakhri and coauthors reported having no financial disclosures related to the study, which was supported by the National Cancer Institute.
SOURCE: Fakhri B et al. Clin Lymphoma Myeloma Leuk. 2018 Mar;18(3):219-24.
FROM CLINICAL LYMPHOMA, MYELOMA & LEUKEMIA
Key clinical point:
Major finding: Factors significantly associated with no systemic treatment included older age (adjusted odds ratio, 1.07 per year), African American descent (aOR, 1.26), and dual Medicare-Medicaid enrollment (aOR, 1.21).
Study details: A retrospective cohort analysis including data on 3,814 patients with active multiple myeloma in the Surveillance, Epidemiology, and End Results–Medicare database from 2007 to 2011.
Disclosures: The research was supported by the National Cancer Institute. The investigators reported having no financial disclosures.
Source: Fakhri B et al. Clin Lymphoma Myeloma Leuk. Mar 2018;18(3):219-24.