User login
Measles exacts high toll among Europe’s youngest citizens
MADRID – Children younger than 2 years who contracted measles were significantly more likely to die of the disease than were older children, according to new data from the European Center for Disease Control and Prevention.
Infants younger than 12 months faced the worst mortality outcomes, with a sevenfold increased risk of death, compared with children aged 2 years or older, Emmanuel Robesyn, MD said at the European Society of Clinical Microbiology and Infectious Diseases annual congress. Infants and children younger than 2 years also were much more likely to develop severe complications of the disease, including pneumonia and encephalitis.

The statistics should drive home the point that measles can be a life-threatening disease, especially for small children, said Dr. Robesyn, an expert in outbreak response at the European Center for Disease Prevention and Control, Stockholm.
“We want the population to understand that measles is much more than a nuisance illness of childhood,” he said. “Already this year we have recorded 13 deaths from measles,” which were not included in the data he presented.
“As you know, measles has been set for elimination” as a communicable disease, he said. “We need high immune coverage to achieve that, meaning 95% of the population covered with two doses. That is a challenge.”
Infants are especially vulnerable, and they fully reliant on the immunity of others to avoid measles.
“Vaccination recommendations begin at age 1, so before that, infants are dependent on their mothers’ antibodies, and on herd immunity. It’s very important that we have high vaccine coverage to protect them.”
Dr. Robesyn described measles outcomes in children 24 months and younger in 30 member states of the European Union and the European Economic Area from 2013 to 2017. Data were extracted from the European Surveillance System, which collects and analyzes infectious disease data across Europe.
During that period, there were 37,365 measles cases in people of all ages. Most were in Italy, Romania, Germany, the Netherlands, and the United Kingdom, with each reporting more than 5% of the cases. These countries also had the most cases that had not been connected with importation of the disease.
Overall, the patients were a mean of 12 years old. Less than 2% had been fully vaccinated against the disease. Complications (diarrhea, otitis media, pneumonia, or encephalitis) occurred in 13.6%, and about 33% of patients had to be hospitalized. Most cases (81%) occurred in people aged 2 years and older, 9% occurred in children who were 12-24 months old, and 10% occurred in children younger than 12 months. These younger children, however, accounted for 61% of the deaths in the cohort, Dr. Robesyn said.
Most of the cases occurred in unvaccinated or incompletely vaccinated patients. Forty-six died from measles, a mortality rate of about 1 per 1,000 who contracted the disease. Of these deaths, 16 were among children younger than 12 months, 12 among children aged 12-24 months, and the remainder among those older than 2 years.
These younger patients were also more susceptible to complications of measles, both mild (diarrhea and otitis media) and severe (pneumonia and encephalitis). Most of the uncomplicated cases (75%) occurred in children older than 24 months, with just 25% of uncomplicated cases occurring in the younger groups.
“When we looked at age as a continuous variable, we saw that the chance of having no complications or just mild complications increased with age, and the chance of having severe complications decreased with age,” Dr. Robesyn said.
“We definitely saw that these two groups are at increased risk. The consequences however, are different. For the children who are 1 year of age or older, the message is that it’s really important to strictly follow national recommendations and get timely and complete vaccination. For those younger than 1 year, we have to rely on the population to be vaccinated. It is very important that we reach this 95% coverage rate to protect these youngest children. We need adolescents and young adults who have missed vaccinations to get them completed,” he said.
Dr. Robesyn had no financial disclosures.
SOURCE: Robesyn E et al. ECCMID 2018, abstract O0060
MADRID – Children younger than 2 years who contracted measles were significantly more likely to die of the disease than were older children, according to new data from the European Center for Disease Control and Prevention.
Infants younger than 12 months faced the worst mortality outcomes, with a sevenfold increased risk of death, compared with children aged 2 years or older, Emmanuel Robesyn, MD said at the European Society of Clinical Microbiology and Infectious Diseases annual congress. Infants and children younger than 2 years also were much more likely to develop severe complications of the disease, including pneumonia and encephalitis.
The statistics should drive home the point that measles can be a life-threatening disease, especially for small children, said Dr. Robesyn, an expert in outbreak response at the European Center for Disease Prevention and Control, Stockholm.
“We want the population to understand that measles is much more than a nuisance illness of childhood,” he said. “Already this year we have recorded 13 deaths from measles,” which were not included in the data he presented.
“As you know, measles has been set for elimination” as a communicable disease, he said. “We need high immune coverage to achieve that, meaning 95% of the population covered with two doses. That is a challenge.”
Infants are especially vulnerable, and they fully reliant on the immunity of others to avoid measles.
“Vaccination recommendations begin at age 1, so before that, infants are dependent on their mothers’ antibodies, and on herd immunity. It’s very important that we have high vaccine coverage to protect them.”
Dr. Robesyn described measles outcomes in children 24 months and younger in 30 member states of the European Union and the European Economic Area from 2013 to 2017. Data were extracted from the European Surveillance System, which collects and analyzes infectious disease data across Europe.
During that period, there were 37,365 measles cases in people of all ages. Most were in Italy, Romania, Germany, the Netherlands, and the United Kingdom, with each reporting more than 5% of the cases. These countries also had the most cases that had not been connected with importation of the disease.
Overall, the patients were a mean of 12 years old. Less than 2% had been fully vaccinated against the disease. Complications (diarrhea, otitis media, pneumonia, or encephalitis) occurred in 13.6%, and about 33% of patients had to be hospitalized. Most cases (81%) occurred in people aged 2 years and older, 9% occurred in children who were 12-24 months old, and 10% occurred in children younger than 12 months. These younger children, however, accounted for 61% of the deaths in the cohort, Dr. Robesyn said.
Most of the cases occurred in unvaccinated or incompletely vaccinated patients. Forty-six died from measles, a mortality rate of about 1 per 1,000 who contracted the disease. Of these deaths, 16 were among children younger than 12 months, 12 among children aged 12-24 months, and the remainder among those older than 2 years.
These younger patients were also more susceptible to complications of measles, both mild (diarrhea and otitis media) and severe (pneumonia and encephalitis). Most of the uncomplicated cases (75%) occurred in children older than 24 months, with just 25% of uncomplicated cases occurring in the younger groups.
“When we looked at age as a continuous variable, we saw that the chance of having no complications or just mild complications increased with age, and the chance of having severe complications decreased with age,” Dr. Robesyn said.
“We definitely saw that these two groups are at increased risk. The consequences however, are different. For the children who are 1 year of age or older, the message is that it’s really important to strictly follow national recommendations and get timely and complete vaccination. For those younger than 1 year, we have to rely on the population to be vaccinated. It is very important that we reach this 95% coverage rate to protect these youngest children. We need adolescents and young adults who have missed vaccinations to get them completed,” he said.
Dr. Robesyn had no financial disclosures.
SOURCE: Robesyn E et al. ECCMID 2018, abstract O0060
REPORTING FROM ECCMID 2018
Key clinical point: Measles is most dangerous to children younger than 2 years.
Major finding: Children younger than 12 months who contracted measles were seven times more likely to die of the disease than were children 2 years and older.
Study details: The analysis involved 37,365 measles cases that occurred in the European Union from 2013 to 2017.
Disclosures: The analysis was conducted by the European Center for Disease Prevention and Control.
Source: Robesyn E et al. ECCMID 2018, abstract O0060.
Suicide prevention, NRA team up for safer gun storage
WASHINGTON – A suicide prevention organization based at the University of Washington partnered with the National Rifle Association and other gun-user organizations to launch a state-wide program in Washington aimed at safe firearm storage to cut suicide rates.
with plans to expand these activities, Jennifer P. Stuber, Ph.D., said at the annual conference of the American Association of Suicidology.
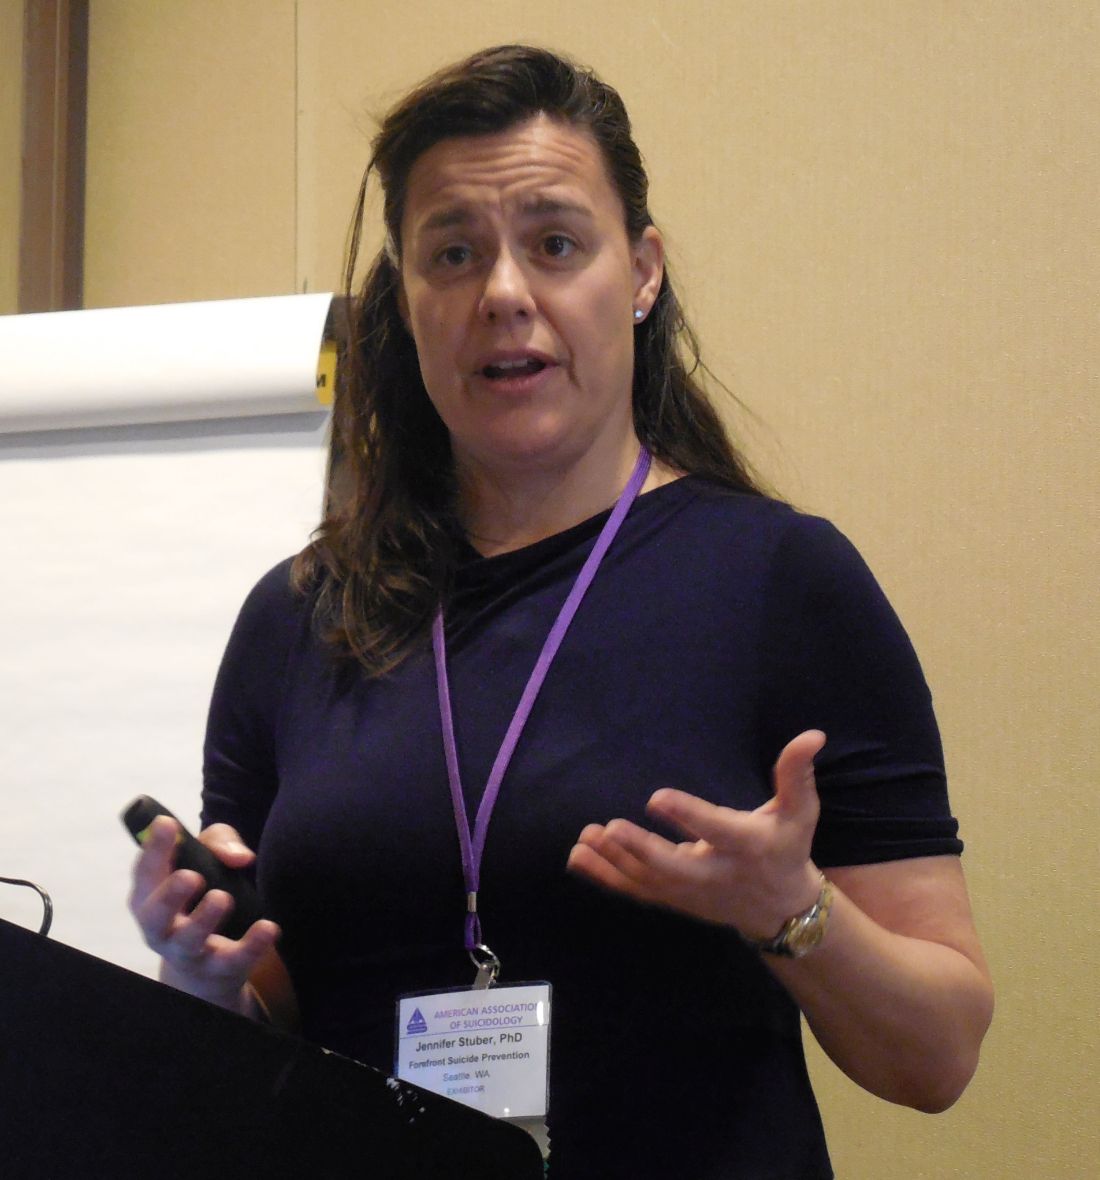
The idea behind SAFER Homes came from recognition that a majority of suicides are caused by firearms, a majority of deaths from firearms are suicides, and that a potentially effective way to cut suicide numbers is by restricting unauthorized or unintended firearm access, especially to middle-aged men, said Dr. Stuber, a health policy researcher at the University of Washington, Seattle, and founder and policy director of Forefront Suicide Prevention, a social impact organization operated by the university’s school of social work. SAFER Homes also came into being as Dr. Stuber realized that she had a receptive audience on the issue of safe gun storage to prevent suicides among gun owners, gun retailers, and gun-rights proponents.
“There is remarkably little push back. These are folks who care about suicide. Seventy percent of gun-shop owners have experienced a personal suicide loss, and shop owners don’t want to be the one who sells someone a gun who then uses it to end their life,” Dr. Stuber said in an interview.
The Second Amendment Foundation gun-rights organization has been the main partner with Forefront Suicide Prevention in launching SAFER Homes Suicide Aware, but the campaign also received endorsement from the National Rifle Association. Dr. Stuber also worked with the Second Amendment Foundation and the National Rifle Association to get legislation passed in Washington to expand education on suicide prevention through improved gun safety. Dr. Stuber became an advocate for suicide prevention and safer gun storage following the firearm suicide of her husband in 2011, an experience she wrote about in a 2016 essay.
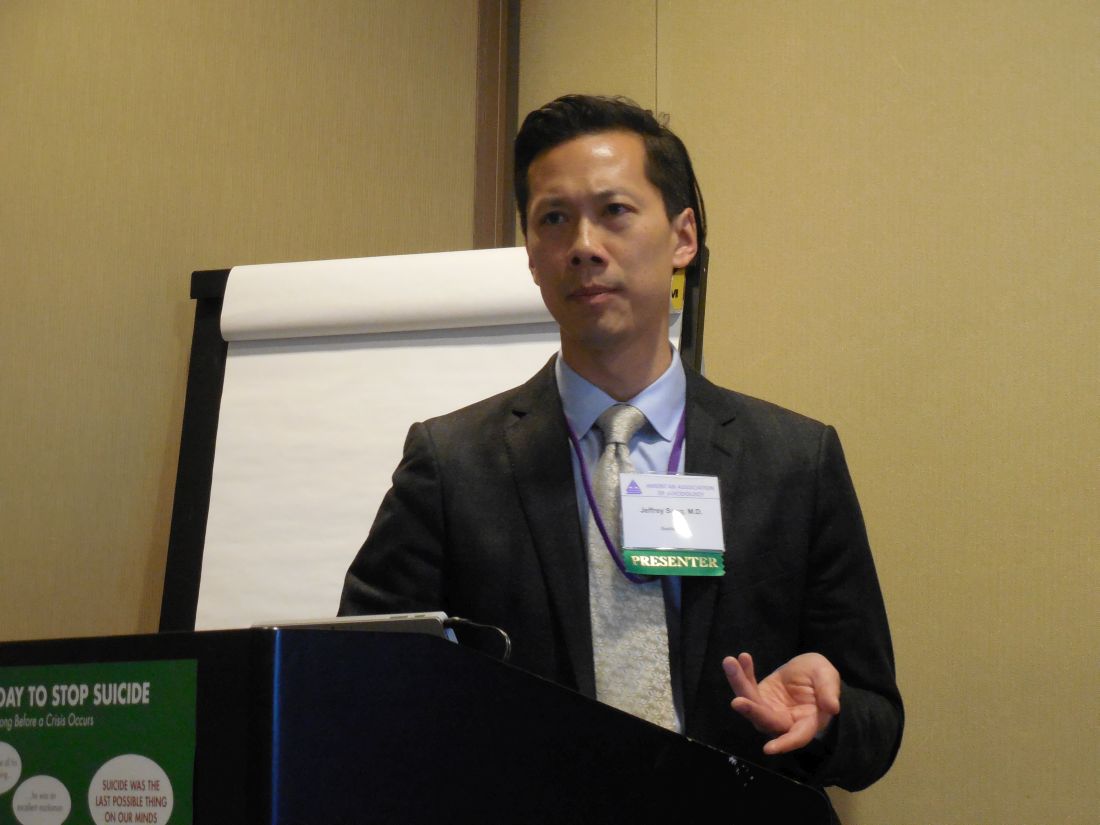
Preventing suicide through safer storage of firearms makes sense because the U.S. demographic subgroup with the highest number of suicides is men 35-64 years old. In this subgroup, the majority of those killed by suicide were never identified as depressed or having a mental health problem, and more than 80% never had a prior suicide attempt, said Jeffrey C. Sung, MD, a psychiatrist at the University of Washington who has worked with Dr. Stuber on the SAFER Homes campaign. He cited a study of 310 suicides among patients in the Veterans Health Administration system (93% men, 76% aged 50 years or older) that showed 72% reported having no suicide ideation on the most recent health questionnaire prior to their suicide (Psych Services. 2016 May;67[5]:517-22).
Because men like these do not come to clinical attention prior to their suicide, the best preventive strategy is to focus on improved safety measures to control potential means of lethality, said Dr. Sung, who is also immediate past president of the Washington State Psychiatric Society.
SAFER Homes “goes to community-based settings, like gun shows, where men in their middle years can be reached,” Dr. Stuber noted. By talking about taking steps to reduce the risk of firearm suicide with attendees at gun shows and with gun retailers, “you’re pushing on an open door,” Dr. Sung added.
Dr. Stuber and Dr. Sung had no disclosures.
SOURCE: Stuber J et al. Annual conference of the American Association of Suicidology.
WASHINGTON – A suicide prevention organization based at the University of Washington partnered with the National Rifle Association and other gun-user organizations to launch a state-wide program in Washington aimed at safe firearm storage to cut suicide rates.
with plans to expand these activities, Jennifer P. Stuber, Ph.D., said at the annual conference of the American Association of Suicidology.
The idea behind SAFER Homes came from recognition that a majority of suicides are caused by firearms, a majority of deaths from firearms are suicides, and that a potentially effective way to cut suicide numbers is by restricting unauthorized or unintended firearm access, especially to middle-aged men, said Dr. Stuber, a health policy researcher at the University of Washington, Seattle, and founder and policy director of Forefront Suicide Prevention, a social impact organization operated by the university’s school of social work. SAFER Homes also came into being as Dr. Stuber realized that she had a receptive audience on the issue of safe gun storage to prevent suicides among gun owners, gun retailers, and gun-rights proponents.
“There is remarkably little push back. These are folks who care about suicide. Seventy percent of gun-shop owners have experienced a personal suicide loss, and shop owners don’t want to be the one who sells someone a gun who then uses it to end their life,” Dr. Stuber said in an interview.
The Second Amendment Foundation gun-rights organization has been the main partner with Forefront Suicide Prevention in launching SAFER Homes Suicide Aware, but the campaign also received endorsement from the National Rifle Association. Dr. Stuber also worked with the Second Amendment Foundation and the National Rifle Association to get legislation passed in Washington to expand education on suicide prevention through improved gun safety. Dr. Stuber became an advocate for suicide prevention and safer gun storage following the firearm suicide of her husband in 2011, an experience she wrote about in a 2016 essay.
Preventing suicide through safer storage of firearms makes sense because the U.S. demographic subgroup with the highest number of suicides is men 35-64 years old. In this subgroup, the majority of those killed by suicide were never identified as depressed or having a mental health problem, and more than 80% never had a prior suicide attempt, said Jeffrey C. Sung, MD, a psychiatrist at the University of Washington who has worked with Dr. Stuber on the SAFER Homes campaign. He cited a study of 310 suicides among patients in the Veterans Health Administration system (93% men, 76% aged 50 years or older) that showed 72% reported having no suicide ideation on the most recent health questionnaire prior to their suicide (Psych Services. 2016 May;67[5]:517-22).
Because men like these do not come to clinical attention prior to their suicide, the best preventive strategy is to focus on improved safety measures to control potential means of lethality, said Dr. Sung, who is also immediate past president of the Washington State Psychiatric Society.
SAFER Homes “goes to community-based settings, like gun shows, where men in their middle years can be reached,” Dr. Stuber noted. By talking about taking steps to reduce the risk of firearm suicide with attendees at gun shows and with gun retailers, “you’re pushing on an open door,” Dr. Sung added.
Dr. Stuber and Dr. Sung had no disclosures.
SOURCE: Stuber J et al. Annual conference of the American Association of Suicidology.
EXPERT ANALYSIS FROM THE AAS ANNUAL CONFERENCE
BET inhibitor has lasting effects in AML, MM

CHICAGO—A BET inhibitor can have potent and long-lasting effects against leukemia and multiple myeloma (MM), according to researchers.
The inhibitor, TG-1601 (or CK-103), exhibited cytotoxicity in MM and leukemia cell lines but did not affect the growth of normal cell lines.
TG-1601 also reduced tumor volume in mouse models of MM and acute myeloid leukemia (AML), and drug holidays had little impact on this activity.
Furthermore, researchers observed enduring MYC inhibition in mice treated with TG-1601.
This research was presented at the AACR Annual Meeting 2018 (abstract 5790).
The work was conducted by researchers from TG Therapeutics and Checkpoint Therapeutics—the companies developing TG-1601—as well as Jubilant Biosys.
In vitro activity
Researchers assessed the cytotoxic activity of TG-1601 in leukemia, MM, and normal cell lines by incubating the cells with increasing concentrations of the drug for 72 hours.
The results suggested TG-1601 inhibits MM and leukemia cell growth, as all EC50 values were below 100 nM.
In the leukemia cell lines, EC50 values were 35 nM (Jurkat), 31 nM (HEL92.1.7), 24 nM (CCRF-CEM and MV4-11), and 18 nM (OCI-AML3).
In the MM cell lines, EC50 values were 85 nM (RPMI8226), 32 nM (KMS28PE), 24 nM (KMS28BM), 21 nM (MOLP8), and 15 nM (MM1s).
In the normal cell lines (Beas2B and WT9-12), cell growth wasn’t inhibited more than 50% with TG-1601 at 10 μM.
In vivo activity
For their MM model, researchers used mice inoculated with MM1 cells. The mice received TG-1601 at 10 mg/kg twice a day.
At day 17 after treatment initiation, there was a 70% reduction in tumor volume. During a week-long drug holiday, tumors did not grow back as fast in TG-1601-treated mice as they did in vehicle control mice.
For their AML model, researchers used mice inoculated with MV4-11 cells. The mice received TG-1601 as a single dose of 20 mg/kg/day—continuously or with 2, 3, or 4 days off per week—or at 10 mg/kg twice a day.
At day 15, 100% of mice that received the drug at 10 mg/kg twice a day were tumor-free. Mice that received the single 20 mg/kg dose had a 94% reduction in tumor volume.
The reduction in tumor volume was 91% in mice with the 2-day drug holiday, 78% in those with the 3-day holiday, and 82% in those with the 4-day holiday.
The researchers also found that TG-1601 had synergistic antitumor activity with an anti-PD-1 antibody in a mouse model of melanoma.
Pharmacodynamic activity
In the MV4-11 cell line, TG-1601 induced “rapid” downregulation of MYC and BCL2 and an increase of p21 mRNA, according to the researchers.
The team also assessed MYC expression in mice with MV4-11 tumors. They said MYC levels rapidly decreased in the tumors and were undetectable at 3 hours after a single dose of TG-1601.
The researchers noted that, at 24 hours after dosing, TG-1601 was cleared from the tumor. However, MYC levels remained below 40% their initial level.
The team said this suggests a long-lasting effect of TG-1601 that may be attributed to its enhanced binding affinity.
“These data demonstrate [TG-1601’s] potential to be a novel BET inhibitor that potently inhibits MYC expression,” said James F. Oliviero, president and chief executive officer of Checkpoint Therapeutics.
“We believe the preclinical data presented today provides encouraging evidence to support the development of [TG-1601] as an anticancer agent, alone and in combination with our anti-PD-L1 antibody, and look forward to the advancement of [TG-1601] into a first-in-human phase 1 trial expected to commence later this year.”
VIDEO: Fix physician burnout? You need more than yoga
NEW ORLEANS – Among a growing number of physicians, the words of a Righteous Brothers’ song ring true about their careers: They’ve lost that loving feeling.
For burned-out physicians, “they’ve lost that sense that they’re making a difference,” explained Susan Thompson Hingle, MD, of Southern Illinois University in Springfield. And the solutions aren’t simple. “You can’t yoga your way out of this,” Dr. Hingle cautioned.
At the annual meeting of the American College of Physicians, Dr. Hingle and Daisy Smith, MD, vice president of clinical programs at the ACP, talked about solutions to burnout, including how more traditional approaches can boost physician well-being, such as team-based care, physician champions, and increasing the pool of primary care providers.
But they also detailed ways that struggling physicians can find support from an unlikely source: their patients.
Dr. Smith’s video interview:
Dr. Hingle’s video interview:
REPORTING FROM ACP INTERNAL MEDICINE
CO2 laser guided by confocal microscopy effectively treated superficial BCC
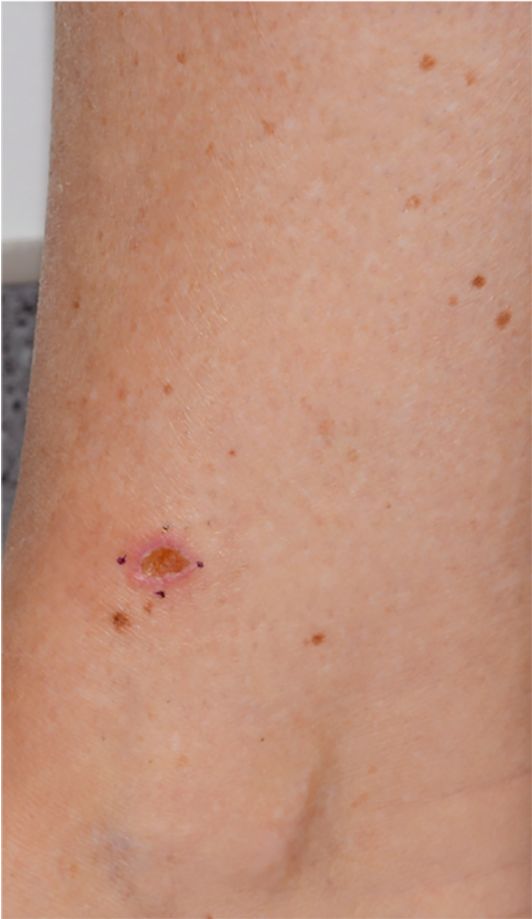
DALLAS – The use of CO2 laser ablation guided by reflectance confocal microscopy is an effective, minimally invasive treatment for superficial and early nodular basal cell carcinoma (BCC), according to results from an ongoing study.
“While surgery is the gold standard for many basal cell carcinomas, nonsurgical therapies may be a good option for the superficial and early nodular subtypes,” lead study author Anthony M. Rossi, MD, said at the annual conference of the American Society for Laser Medicine and Surgery. “Laser ablation was used many years ago, so this is not a novel concept, but we’re bringing it back and we’re trying to use confocal microscopy to hone in on the basal cell and selectively target the tumor.”

For the current analysis, he and his associates used with a mean age of 55 years. Of the 20 lesions, 18 were located on the limbs and trunk, while two were on the head and neck. The median lesion diameter was 7 mm. Prior to laser ablation, the researchers performed reflectance confocal microscopy to define lateral and deep margins and define the laser parameters.
The median number of laser passes was three, and ranged from two to eight, delivered at a fluence of 7.5 J/cm2. Reflectance confocal microscopy was repeated immediately after the laser treatment to the skin wound margins and deep margins, and it was performed every 3-6 months thereafter. “If you do confocal microscopy too early, you’ll see mainly inflammation and you may see residual tumor that hasn’t been fully resolved yet,” Dr. Rossi said.

As for future directions, he and his colleagues are developing contrast agents to enhance the ability to detect BCC tumors in vivo, to highlight tumor islands, and to differentiate sebaceous glands and hair follicles. Dr. Rossi reported having no relevant disclosures.
DALLAS – The use of CO2 laser ablation guided by reflectance confocal microscopy is an effective, minimally invasive treatment for superficial and early nodular basal cell carcinoma (BCC), according to results from an ongoing study.
“While surgery is the gold standard for many basal cell carcinomas, nonsurgical therapies may be a good option for the superficial and early nodular subtypes,” lead study author Anthony M. Rossi, MD, said at the annual conference of the American Society for Laser Medicine and Surgery. “Laser ablation was used many years ago, so this is not a novel concept, but we’re bringing it back and we’re trying to use confocal microscopy to hone in on the basal cell and selectively target the tumor.”
For the current analysis, he and his associates used with a mean age of 55 years. Of the 20 lesions, 18 were located on the limbs and trunk, while two were on the head and neck. The median lesion diameter was 7 mm. Prior to laser ablation, the researchers performed reflectance confocal microscopy to define lateral and deep margins and define the laser parameters.
The median number of laser passes was three, and ranged from two to eight, delivered at a fluence of 7.5 J/cm2. Reflectance confocal microscopy was repeated immediately after the laser treatment to the skin wound margins and deep margins, and it was performed every 3-6 months thereafter. “If you do confocal microscopy too early, you’ll see mainly inflammation and you may see residual tumor that hasn’t been fully resolved yet,” Dr. Rossi said.
As for future directions, he and his colleagues are developing contrast agents to enhance the ability to detect BCC tumors in vivo, to highlight tumor islands, and to differentiate sebaceous glands and hair follicles. Dr. Rossi reported having no relevant disclosures.
REPORTING FROM ASLMS 2018
Key clinical point: Reflectance confocal microscopy-guided CO2 laser ablation of basal cell carcinoma (BCC) was found to be effective.
Major finding: After an average follow-up of 17 months, no recurrence of BCC has been detected clinically, dermoscopically, or by reflectance confocal microscopy.
Study details: A clinical analysis of seven adults with superficial BCC who were treated with a CO2 laser guided by confocal microscopy.
Disclosures: Dr. Rossi reported having no financial disclosures.
New JIA guidelines emphasize treating to target
– a strategy made possible with new therapies that have transformed treatment in recent years, including earlier treatment with methotrexate, expanding use of intra-articular glucocorticoids, and especially disease-modifying antibodies.
The guidelines, published online April 11 in the Annals of the Rheumatic Diseases, are a departure from some others in that there is very little research supporting the approach they advocate. But there is precedent in adult disease. Research in adults with rheumatoid arthritis has shown that achievement of low levels of disease activity through frequent adjustments of therapy improves patient outcomes, no matter the treatment used.

Nevertheless, the time for aggressive treatment in children has come, according to Karen Onel, MD, chief of the division of pediatric rheumatology at the Hospital for Special Surgery, New York. She pointed out that joint and organ damage resulting from JIA can be permanent. “These guidelines are meant to be fluid, but we need to be committed to getting patients into remission as quickly as possible. Anything less than that is not OK,” said Dr. Onel, who did not participate in drafting the guidelines.
The guidelines make almost no mention of specific treatments, with the exception of an admonition to avoid long-term systemic glucocorticoid therapy. “It’s addressing a philosophy of care that is different than what most of us do in our daily practice,” Dr. Lovell said. The lack of medication specifics also ensures that the guidelines will be useful in a wide range of settings, since specific drugs may be unavailable in some countries, or unaffordable due to insurance considerations.
The guidelines and the community at large are battling a historical perception of JIA as a childhood disease that patients outgrow. That has led to conservative approaches to therapy in an attempt to spare children from toxicity. But with new treatment options, that approach is outdated. “We have an issue in pediatrics where many people feel, including families, that you should wait until the child is old enough to make these decisions on their own. But the reality is that if [JIA] is not fixed in childhood, it won’t be fixed in adulthood,” Dr. Onel said.
About half of JIA cases are handled by rheumatologists who primarily work with adults, and they tend to favor toxicity-sparing regimens. These practitioners must be convinced to be more aggressive in their treatment, but parents are critical as well. The guidelines emphasize communicating with parents the rationale behind a chosen treatment target, along with information on the disease and the benefits and risks of the medications to be prescribed. Parents may struggle to understand the need for aggressive treatment, especially those with young children.
Parents may even be socially stigmatized by peers who think dietary change and exercise should be sufficient. “It’s really unfair. Nobody says to a parent of a child with cancer that they are treating their children with poison. The same holds true for other childhood chronic diseases. For whatever reason, the risk of permanent disability from childhood arthritis is understated,” Dr. Onel said.
A call for research
The primary target called for in the guidelines is clinically inactive disease (CID), defined as an absence of signs and symptoms of inflammatory disease activity, including extra-articular manifestations. An alternative target is minimal or low disease activity (LDA), which may be a more appropriate goal in patients with long-standing disease. Whatever the target, patients should be tracked at each clinical visit using a validated composite instrument, though the committee did not recommend one specifically.
Frequency of assessments may range from weekly to monthly or every 3 months, depending on the disease state. Within 3 months, the guidelines call for a minimum 50% improvement in disease activity, and by 6 months, clinicians should aim to achieve the target of clinical remission or LDA.
“It’s really important that clinicians systematically collect information on disease activity at every encounter. The next step is making sure we have some way of measuring outcomes. That might require a registry. It’s not easy to just start doing this. You need to have a plan in place,” said Esi Morgan, MD, of the department of rheumatology at Cincinnati Children’s Hospital Medical Center, and also a member of the guideline committee.
It remains to be seen how effective treatment to target will be, but Dr. Lovell hopes the guidelines will encourage research to provide definitive answers. “I think the recommendation is to just get on with it. Start doing trials utilizing a treat-to-target approach, and do them in a formal enough fashion that you can compare it to routine care in kids with JIA so you can assess the impact,” Dr. Lovell said.
Confidence is high. “There are many examples [of treating to target], so we can be confident this will work. What’s slightly different is applying this across the many subtypes of JIA. There are many categories, so it makes it a little more complex in terms of telling people what to do. But it’s definitely worth doing. We just need to solve the problem of how to address those issues,” Dr. Morgan said.
One key question is whether CID or LDA is the best target for functional outcomes. The UK Childhood Arthritis Prospective Study examined this question among 832 JIA patients and found that only achievement of CID on the clinical Juvenile Arthritis Disease Activity Score (cJADAS) was associated with an improvement in functional ability and psychosocial health at 1 year. Both endpoints were associated with greater absence of limited joints.
Another challenge is to determine what instrument to use to track disease activity and treatment response. Instruments include Wallace’s preliminary criteria, the American College of Rheumatology preliminary criteria, the Childhood Health Assessment Questionnaire (CHAQ), and the JADAS. All can be time consuming, which is a problem in a busy clinic. “That’s the work we need to do now: Figuring out what the best, easiest, most predictive instrument is going to be,” Dr. Onel said.
Dr. Lovell and Dr. Onel have no financial disclosures. Dr. Morgan is chair of the Pediatric Rheumatology Care and Outcomes Improvement Network (PR-COIN), which has received grants from Novartis and Medac Pharma.
SOURCE: Ravelli A et al. Ann Rheum Dis. 2018 Apr 11. doi: 10.1136/annrheumdis-2018-213030.
– a strategy made possible with new therapies that have transformed treatment in recent years, including earlier treatment with methotrexate, expanding use of intra-articular glucocorticoids, and especially disease-modifying antibodies.
The guidelines, published online April 11 in the Annals of the Rheumatic Diseases, are a departure from some others in that there is very little research supporting the approach they advocate. But there is precedent in adult disease. Research in adults with rheumatoid arthritis has shown that achievement of low levels of disease activity through frequent adjustments of therapy improves patient outcomes, no matter the treatment used.
Nevertheless, the time for aggressive treatment in children has come, according to Karen Onel, MD, chief of the division of pediatric rheumatology at the Hospital for Special Surgery, New York. She pointed out that joint and organ damage resulting from JIA can be permanent. “These guidelines are meant to be fluid, but we need to be committed to getting patients into remission as quickly as possible. Anything less than that is not OK,” said Dr. Onel, who did not participate in drafting the guidelines.
The guidelines make almost no mention of specific treatments, with the exception of an admonition to avoid long-term systemic glucocorticoid therapy. “It’s addressing a philosophy of care that is different than what most of us do in our daily practice,” Dr. Lovell said. The lack of medication specifics also ensures that the guidelines will be useful in a wide range of settings, since specific drugs may be unavailable in some countries, or unaffordable due to insurance considerations.
The guidelines and the community at large are battling a historical perception of JIA as a childhood disease that patients outgrow. That has led to conservative approaches to therapy in an attempt to spare children from toxicity. But with new treatment options, that approach is outdated. “We have an issue in pediatrics where many people feel, including families, that you should wait until the child is old enough to make these decisions on their own. But the reality is that if [JIA] is not fixed in childhood, it won’t be fixed in adulthood,” Dr. Onel said.
About half of JIA cases are handled by rheumatologists who primarily work with adults, and they tend to favor toxicity-sparing regimens. These practitioners must be convinced to be more aggressive in their treatment, but parents are critical as well. The guidelines emphasize communicating with parents the rationale behind a chosen treatment target, along with information on the disease and the benefits and risks of the medications to be prescribed. Parents may struggle to understand the need for aggressive treatment, especially those with young children.
Parents may even be socially stigmatized by peers who think dietary change and exercise should be sufficient. “It’s really unfair. Nobody says to a parent of a child with cancer that they are treating their children with poison. The same holds true for other childhood chronic diseases. For whatever reason, the risk of permanent disability from childhood arthritis is understated,” Dr. Onel said.
A call for research
The primary target called for in the guidelines is clinically inactive disease (CID), defined as an absence of signs and symptoms of inflammatory disease activity, including extra-articular manifestations. An alternative target is minimal or low disease activity (LDA), which may be a more appropriate goal in patients with long-standing disease. Whatever the target, patients should be tracked at each clinical visit using a validated composite instrument, though the committee did not recommend one specifically.
Frequency of assessments may range from weekly to monthly or every 3 months, depending on the disease state. Within 3 months, the guidelines call for a minimum 50% improvement in disease activity, and by 6 months, clinicians should aim to achieve the target of clinical remission or LDA.
“It’s really important that clinicians systematically collect information on disease activity at every encounter. The next step is making sure we have some way of measuring outcomes. That might require a registry. It’s not easy to just start doing this. You need to have a plan in place,” said Esi Morgan, MD, of the department of rheumatology at Cincinnati Children’s Hospital Medical Center, and also a member of the guideline committee.
It remains to be seen how effective treatment to target will be, but Dr. Lovell hopes the guidelines will encourage research to provide definitive answers. “I think the recommendation is to just get on with it. Start doing trials utilizing a treat-to-target approach, and do them in a formal enough fashion that you can compare it to routine care in kids with JIA so you can assess the impact,” Dr. Lovell said.
Confidence is high. “There are many examples [of treating to target], so we can be confident this will work. What’s slightly different is applying this across the many subtypes of JIA. There are many categories, so it makes it a little more complex in terms of telling people what to do. But it’s definitely worth doing. We just need to solve the problem of how to address those issues,” Dr. Morgan said.
One key question is whether CID or LDA is the best target for functional outcomes. The UK Childhood Arthritis Prospective Study examined this question among 832 JIA patients and found that only achievement of CID on the clinical Juvenile Arthritis Disease Activity Score (cJADAS) was associated with an improvement in functional ability and psychosocial health at 1 year. Both endpoints were associated with greater absence of limited joints.
Another challenge is to determine what instrument to use to track disease activity and treatment response. Instruments include Wallace’s preliminary criteria, the American College of Rheumatology preliminary criteria, the Childhood Health Assessment Questionnaire (CHAQ), and the JADAS. All can be time consuming, which is a problem in a busy clinic. “That’s the work we need to do now: Figuring out what the best, easiest, most predictive instrument is going to be,” Dr. Onel said.
Dr. Lovell and Dr. Onel have no financial disclosures. Dr. Morgan is chair of the Pediatric Rheumatology Care and Outcomes Improvement Network (PR-COIN), which has received grants from Novartis and Medac Pharma.
SOURCE: Ravelli A et al. Ann Rheum Dis. 2018 Apr 11. doi: 10.1136/annrheumdis-2018-213030.
FROM ANNALS OF THE RHEUMATIC DISEASES

Studies eye adjuvant therapy in locally advanced rectal cancer
For adults whose stage T3 or greater rectal cancer shows a pathological complete response to neoadjuvant chemoradiation and resection, perioperative adjuvant therapy was associated with significantly improved outcomes, according to the results of two observational cohort studies of the National Cancer Database.
In the first study, Fahima Dossa, MD, of the University of Toronto, and her associates compared 667 patients with T1 to 2N+ or T3 to 4N0/+ rectal adenocarcinoma who received adjuvant chemotherapy with 667 patients who did not. They used propensity-score matching to account for measurable differences between groups that might influence the receipt of adjuvant treatment. They also conducted a subgroup analysis to determine if treatment effects depended on whether patients initially had node-positive disease.
After a median follow-up of 3.1 years (interquartile range, 1.9-4.4 years), adjuvant therapy was associated with significantly improved overall survival (hazard ratio, 0.44; 95% confidence interval, 0.28-0.70), Dr. Dossa and her coinvestigators said. However, the effect was limited to patients with pretreatment, node-positive disease (HR, 0.24; 95% CI, 0.10-0.58).
“Although this study suggests a beneficial effect of adjuvant treatment on survival in patients with pathologic[al] complete response, these results are limited by the presence of potential unmeasured confounding in this nonrandomized study,” Dr. Dossa and her associates wrote in JAMA Oncology. A pathological complete response signifies a good prognosis in locally advanced rectal cancer, and any additional survival benefit from adjuvant chemotherapy has to be weighed against the risk of chemotoxicity, they stressed. (In their study, 5-year overall survival rates were 95% in the adjuvant group and 88% in the observation-only group).
In the second study, Patricio M. Polanco, MD, of the University of Texas, Dallas, and his associates also used propensity-score matching to compare 741 patients with clinical TNM stages T1 to 2N+ or T3 to 4N0/+ rectal adenocarcinoma who received adjuvant chemotherapy with 741 patients who underwent observation only. Once again, after a median follow-up of 3.2 years, adjuvant chemotherapy was associated with significantly improved overall survival (HR, 0.50; 95% CI, 0.32-0.79). Estimated 5-year overall survival rates were 95% and 88%, respectively (P = .05). Subgroup analyses showed that adjuvant chemotherapy had the strongest apparent effect in the setting of stage T3/T4 and node-positive disease.
Current U.S. guidelines recommend treating stage T3 or higher or node-positive rectal cancer with neoadjuvant chemoradiation therapy plus 6 months of perioperative chemotherapy. Each of these studies attempted to address the lack of evidence clearly supporting adjuvant chemotherapy for these patients, the researchers noted.
Dr. Fossa and her associates reported no specific funders or conflicts of interests. Dr. Polanco disclosed support from the VA North Texas New Investigator Program, Department of Veterans Affairs. He and his associates reported no conflicts of interest.
SOURCES: Dossa F et al. JAMA Oncol. 2018 Apr 19. doi: 10.1001/jamaoncol.2017.5597; Polanco PM et al. JAMA Oncol. 2018 Apr 19. doi: 10.1001/jamaoncol.2018.0231.
These retrospective studies probably overestimate the benefits of adjuvant chemotherapy in ypT0N0 rectal cancer, argued George J. Chang, MD, MS.
“If there is a true benefit associated with adjuvant chemotherapy, it is likely to be small,” he wrote in an editorial accompanying the studies in JAMA Oncology.
The problem comes down to methodology – both studies used propensity-score matching, which can overestimate treatment effects, continued Dr. Chang of the University of Texas MD Anderson Cancer Center, Houston.
Investigators should beware of this method for large registry studies like these, he added. “There are many examples in the literature of propensity-score analysis leading to biased estimates, despite apparently rigorous methodology.”
Neoadjuvant chemoradiation treatment has a favorable prognosis in ypT0N0, so patients should carefully weigh the risk of side effects from adjuvant chemotherapy, such as chronic neuropathy, Dr. Chang wrote. He recommended pursuing alternatives to propensity-score matching that are less subject to confounding.
Dr. George J. Chang had no conflicts of interest. These comments paraphrase his editorial (JAMA Oncol. 2018 Apr 19. doi: 10.1001/jamaoncol.2018.0227 ).
For adults whose stage T3 or greater rectal cancer shows a pathological complete response to neoadjuvant chemoradiation and resection, perioperative adjuvant therapy was associated with significantly improved outcomes, according to the results of two observational cohort studies of the National Cancer Database.
In the first study, Fahima Dossa, MD, of the University of Toronto, and her associates compared 667 patients with T1 to 2N+ or T3 to 4N0/+ rectal adenocarcinoma who received adjuvant chemotherapy with 667 patients who did not. They used propensity-score matching to account for measurable differences between groups that might influence the receipt of adjuvant treatment. They also conducted a subgroup analysis to determine if treatment effects depended on whether patients initially had node-positive disease.
After a median follow-up of 3.1 years (interquartile range, 1.9-4.4 years), adjuvant therapy was associated with significantly improved overall survival (hazard ratio, 0.44; 95% confidence interval, 0.28-0.70), Dr. Dossa and her coinvestigators said. However, the effect was limited to patients with pretreatment, node-positive disease (HR, 0.24; 95% CI, 0.10-0.58).
“Although this study suggests a beneficial effect of adjuvant treatment on survival in patients with pathologic[al] complete response, these results are limited by the presence of potential unmeasured confounding in this nonrandomized study,” Dr. Dossa and her associates wrote in JAMA Oncology. A pathological complete response signifies a good prognosis in locally advanced rectal cancer, and any additional survival benefit from adjuvant chemotherapy has to be weighed against the risk of chemotoxicity, they stressed. (In their study, 5-year overall survival rates were 95% in the adjuvant group and 88% in the observation-only group).
In the second study, Patricio M. Polanco, MD, of the University of Texas, Dallas, and his associates also used propensity-score matching to compare 741 patients with clinical TNM stages T1 to 2N+ or T3 to 4N0/+ rectal adenocarcinoma who received adjuvant chemotherapy with 741 patients who underwent observation only. Once again, after a median follow-up of 3.2 years, adjuvant chemotherapy was associated with significantly improved overall survival (HR, 0.50; 95% CI, 0.32-0.79). Estimated 5-year overall survival rates were 95% and 88%, respectively (P = .05). Subgroup analyses showed that adjuvant chemotherapy had the strongest apparent effect in the setting of stage T3/T4 and node-positive disease.
Current U.S. guidelines recommend treating stage T3 or higher or node-positive rectal cancer with neoadjuvant chemoradiation therapy plus 6 months of perioperative chemotherapy. Each of these studies attempted to address the lack of evidence clearly supporting adjuvant chemotherapy for these patients, the researchers noted.
Dr. Fossa and her associates reported no specific funders or conflicts of interests. Dr. Polanco disclosed support from the VA North Texas New Investigator Program, Department of Veterans Affairs. He and his associates reported no conflicts of interest.
SOURCES: Dossa F et al. JAMA Oncol. 2018 Apr 19. doi: 10.1001/jamaoncol.2017.5597; Polanco PM et al. JAMA Oncol. 2018 Apr 19. doi: 10.1001/jamaoncol.2018.0231.
FROM JAMA ONCOLOGY
Key clinical point: Studies linked adjuvant therapy with improved survival in locally advanced rectal cancer, but an editorialist questioned their methodology.
Major finding: After about 3 years of median follow-up, hazard ratios for overall survival were 0.44 and 0.50, favoring adjuvant treatment.
Study details: Two retrospective, observational cohort studies of 2,816 adults with node-positive or stage T3 or higher rectal cancer from the National Cancer Database.
Disclosures: Dr. Dossa and her associates reported no specific funders or conflicts of interests. Dr. Polanco disclosed support from the VA North Texas New Investigator Program, Department of Veterans Affairs. He and his associates reported no conflicts of interest.
Sources: Dossa F et al. JAMA Oncol. 2018 Apr 19. doi: 10.1001/jamaoncol.2017.5597; Polanco PM et al. JAMA Oncol. 2018 Apr 19. doi: 10.1001/jamaoncol.2018.0231.
Federal spending agreement includes wins for medical community
President Trump signed a $1.3 trillion omnibus appropriations package that includes notable increases for the National Institutes of Health (NIH) and the Centers for Disease Control and Prevention (CDC) last week. This funding and language is a major victory for digestive disease research and patients. AGA thanks everyone who joined our call to Congress to increase funding for research. Your advocacy matters and makes a difference!
NIH
NIH is a big winner in the omnibus and will receive $37.1 billion for fiscal year 2018, an 8.8% increase over the previous year’s funding, which represents the largest increase for NIH since the doubling period over a decade ago.
The omnibus also includes language pushed by AGA to require NIH to provide Congress with an update on the implementation of the recommendations of the National Commission on Digestive Diseases. AGA applauds Congress for including language that will help increase digestive disease research.
Congress also included funding for young researchers and continues to take action to reduce the average age of a new NIH-supported investigator. AGA appreciates the appropriators including this language, which has been a longstanding priority of AGA in supporting young investigators and ensuring that our best and brightest scientists have the support and funding that they need to start their careers.
Language was also included that prohibits the administration from capping administrative and facility fees paid to research institutions.
The All of Us Precision Medicine initiative received an increase of $60 million and antibiotic resistance initiatives received an increase of $50 million.
Opioid funding
The bill includes $4.65 billion to address the opioid epidemic across various government agencies. NIH would receive $1 billion to research opioid addiction and alternative pain management and treatment.
CDC
The CDC would receive $8.3 billion in funding, rejecting President Trump’s call for $900 million in cuts.
AGA leaders recognized for their contributions to the field
We are proud to announce the 2018 AGA Recognition Award recipients who are honored for their outstanding contributions to the field of gastroenterology and hepatology. The recipients will be formally recognized during Digestive Disease Week® (DDW) 2018 in Washington, D.C., but you can congratulate your colleagues now in the AGA Community.
2018 Recognition Award Recipients
Julius Friedenwald Medal
Loren A. Laine, MD
Distinguished Achievement Award in Basic Science
T. Jake Liang, MD, AGAF
William Beaumont Prize in Gastroenterology
Mary K. Estes, PhD, AGAF
Distinguished Educator Award
James D. Lewis, MD, MSCE, AGAF
Distinguished Clinician Award
Private Practice: Bertha (Nice’) E. Toriz, MD
Clinical Academic Practice: Michael L. Kochman, MD, AGAF
Distinguished Mentor Award
Mary K. Estes, PhD, AGAF
Young Investigator Awards
Clinical Science: David S. Goldberg, MD, MSCE
Basic Science: Andrew D. Rhim, MD
You can read more about each award recipient and the awards themselves at gastro.org/about/awards.
Save the date for the 2019 Crohn’s & Colitis Congress
Building on the success of this year’s inaugural Crohn’s & Colitis Congress™, the Crohn’s & Colitis Foundation and the American Gastroenterological Association (AGA) are pleased to announce the second annual Crohn’s & Colitis Congress. Be sure to save the date: Feb. 7-9, 2019 at the Bellagio in Las Vegas.
The Crohn’s & Colitis Congress is the must-attend meeting for all inflammatory bowel disease (IBD) professionals. It offers a bold, multidisciplinary approach to learning in the IBD space as one care team. All health care professionals and research investigators interested in IBD are invited to attend.
By bringing all audiences together to learn from each other, the Congress embodies how IBD research and patient care needs to be approached – it is not “one-size-fits-all” and it requires collaboration from a variety of health practitioners.
By attending the Crohn’s& Colitis Congress, attendees will:
• Build a powerful network and share solutions with IBD thought leaders.
• Discover cutting-edge basic, translational and clinical research in the IBD space.
• Determine best practices at every stage of the patient’s disease journey.
• Explore new technologies and products from IBD-related exhibitors.
• Earn CME and MOC points.
• Improve skills and patient outcomes.
• Learn together as one multidisciplinary care team.
Get ready to expand your knowledge, network with IBD leaders, and be inspired. Stay tuned at www.crohnscolitiscongress.org for more details coming in later this spring.