User login
Aortic aneurysm: Fluoroquinolones, genetic counseling
To the Editor: The review of thoracic aortic aneurysm by Cikach et al1 was excellent. However, we noted that referral for clinical genetic counseling and testing is suggested only if 1 or more first-degree relatives have aneurysmal disease.
Absence of a family history does not rule out syndromic aortopathy, which can occur de novo. In addition, a clinical diagnosis of syndromic aortopathy can be made on the basis of physical features that can be very subtle, such as pectus deformities, scoliosis, dolichostenomelia, joint hypermobility or contractures, craniofacial features, or skin fragility.2
Genetic counseling is paramount even if molecular testing is negative or inconclusive, which can occur in more than 50% of patients referred.3 Clinical genetic evaluation would also facilitate testing for other family members who may be affected, and would help to coordinate care for nonvascular conditions that may be associated with the syndrome.
- Cikach F, Desai MY, Roselli EE, Kalahasti V. Thoracic aortic aneurysm: how to counsel, when to refer. Cleve Clin J Med 2018; 85(6):481–492. doi:10.3949/ccjm.85a.17039
- McKusick-Nathans Institute of Genetic Medicine, Johns Hopkins University. OMIM. Online mendelian inheritance in man. https://omim.org. Accessed July 31, 2018.
- Mazine A, Moryousef-Abitbol JH, Faghfoury H, Meza JM, Morel C, Ouzounian M. Yield of genetic testing in patients with thoracic aortic disease. J Am Coll Cardiol 2017; 69(11):2005. doi:10.1016/S0735-1097(17)35394-9
To the Editor: The review of thoracic aortic aneurysm by Cikach et al1 was excellent. However, we noted that referral for clinical genetic counseling and testing is suggested only if 1 or more first-degree relatives have aneurysmal disease.
Absence of a family history does not rule out syndromic aortopathy, which can occur de novo. In addition, a clinical diagnosis of syndromic aortopathy can be made on the basis of physical features that can be very subtle, such as pectus deformities, scoliosis, dolichostenomelia, joint hypermobility or contractures, craniofacial features, or skin fragility.2
Genetic counseling is paramount even if molecular testing is negative or inconclusive, which can occur in more than 50% of patients referred.3 Clinical genetic evaluation would also facilitate testing for other family members who may be affected, and would help to coordinate care for nonvascular conditions that may be associated with the syndrome.
- Cikach F, Desai MY, Roselli EE, Kalahasti V. Thoracic aortic aneurysm: how to counsel, when to refer. Cleve Clin J Med 2018; 85(6):481–492. doi:10.3949/ccjm.85a.17039
- McKusick-Nathans Institute of Genetic Medicine, Johns Hopkins University. OMIM. Online mendelian inheritance in man. https://omim.org. Accessed July 31, 2018.
- Mazine A, Moryousef-Abitbol JH, Faghfoury H, Meza JM, Morel C, Ouzounian M. Yield of genetic testing in patients with thoracic aortic disease. J Am Coll Cardiol 2017; 69(11):2005. doi:10.1016/S0735-1097(17)35394-9

In reply: Aortic aneurysm: Fluoroquinolones, genetic counseling
In Reply: We thank Drs. Goldstein and Mascitelli for their comments regarding fluoroquinolones and thoracic aortic aneurysms. We acknowledge that fluoroquinolones (particularly ciprofloxacin) have been associated with a risk of aortic aneurysm and dissection based on large observational studies from Taiwan, Canada, and Sweden. Although all of the studies have shown an association between ciprofloxacin and aortic aneurysm, the causative role is not well established. In addition, the numbers of events were very small in these large cohorts of patients. In our large tertiary care practice at Cleveland Clinic, we have very few patients with aortic aneurysm or dissection who have used fluoroquinolones.
We recognize the association; however, our paper was intended to emphasize the more common causes and treatment options that primary care physicians are likely to encounter in routine practice.
We also thank Drs. Ayoubieh and MacCarrick for their comments about genetic counseling. We agree that genetic counseling is important, as is a detailed physical examination for subtle features of genetically mediated aortic aneurysm. In fact, we incorporate the physical examination when patients are seen at our aortic center so as to recognize the physical features. We do routinely recommend screening of first-degree relatives even without significant family history on an individual basis and make appropriate referrals for other conditions that can be seen in these patients. Our article, however, is primarily intended to emphasize the importance of referring these patients for more-focused care at a specialized center, where we incorporate all of the suggestions that were made.

Reducing Benzodiazepine Prescribing in Older Veterans: A Direct-to-Consumer Educational Brochure
This quality improvement project used an educational brochure to help older veterans reduce their benzodiazepine use.
Benzodiazepines (BZDs) are among the most commonly prescribed medications. A recent study found that in 2008, more than 5% of Americans used a BZD, and the percentage was almost 9% among Americans aged ≥ 65 years.1,2 Among veterans, BZD use is even higher, in part because of the high prevalence of posttraumatic stress disorder (PTSD). One study found that more than 30% of veterans with PTSD received at least 1 BZD prescription.3 The risks associated with BZD treatment for PTSD are compounded by concurrent use of other sedatives and opioids prescribed for co-occurring chronic pain and insomnia.3
Older adults metabolize long-acting BZDs more slowly and generally have an increased sensitivity to the adverse effects (AEs) of all BZDs.4 In older adults, BZD use has been associated with cognitive decline, dementia, falls and consequent fractures, and adverse respiratory outcomes.5-12 The risk of most but not all of these AEs was increased with higher BZD dose or long-term BZD use, which this quality improvement project (QIP) defines as having at least a 60-day supply of BZD prescriptions dispensed within the past year.
Long-term BZD use increases with age. One study found that, among patients receiving a BZD, the rate of long-term BZD use was more than double in older adults (31.4%) than it was in adults aged between 18 and 35 years (14.7%).2 For these reasons, the 2012 Beers criteria of the American Geriatrics Society recommend avoiding all types of BZDs in the treatment of insomnia, agitation, or delirium in patients aged > 65 years.13 Despite this recommendation, the prevalence of BZD use in older adults remains high.14
Some innovative approaches have been developed to address the inappropriate use, including overuse and misuse, of BZDs in older adults.15 In one approach, direct-to-consumer (DTC) information is used to empower patients to collaborate with their physician to manage their health. Results from several studies suggest that providing older patients with information on BZD risks and benefits increases patient–physician interaction and thereby decreases inappropriate BZD use and improves health outcomes.4,16,17 One study found that perceptions of BZD risks increased 1 week after exposure to a DTC educational brochure (EB), with intention to discuss BZD discontinuation with their physician higher for patients who received the EB than it was for those who did not (83.1% vs 44.3%; P < .0001).16 The EMPOWER (Eliminating Medications Through Patient Ownership of End Results) cluster randomized controlled trial assessed the effectiveness of a DTC EB focused on BZD risks in older adults.17 In that seminal study, patients who received a DTC EB were more likely than were comparison patients to discontinue BZD within 6 months (27% vs 5%; risk difference, 23%; 95% CI, 14%-32%).
The Veterans Integrated Systems Network (VISN) 22 Academic Detailing Program is a pharmacy educational outreach program that uses unbiased clinical guidelines to promote physicians’ safety initiatives and align prescribing behavior with best practices.18-20 With BZD use among older veterans remaining high, the VISN 22 program initiated a clinical QIP modeled on the EMPOWER trial. Veterans in VISN 22 received the DTC EB, which included information on BZD risks and encouraged them to discuss their BZD treatment with their health care provider. VISN 22 was the first VISN in the VHA to implement the EMPOWER protocol.
As this was a QIP, all eligible veterans in VISN 22 were mailed the DTC EB, thus making it difficult to estimate the impact of the EB on BZD discontinuation in this VISN. Therefore, DTC EB efficacy was estimated by comparing BZD discontinuation between VISN 22 and VISN 21, an adjacent VISN that did not mail the DTC EB.
Methods
Two QIPs were undertaken to determine the impact of DTC EB on BZD use in older veterans in the VHA.
Quality Improvement Project 1
Design. A retrospective cohort analysis was performed. The VISN 22 catchment area, which encompasses VA facilities and clinics in southern California and southern Nevada, serves about 500,000 veterans, a substantial proportion of whom are aged ≥ 65 years. Among these older veterans are active long-term BZD users, who were defined as having ≥ 60-day supply of BZD prescriptions dispensed within the past year. Each active long-term user with a BZD prescription released within 200 days before the index date (the date the user was to meet with the prescribing physician) was mailed an EB 2 to 8 weeks in advance of the visit. Excluded from analysis were veterans with a schizophrenia, spinal cord injury, or seizure disorder diagnosis recorded in both their inpatient and outpatient medical records; veterans seen by Palliative Care within the past year; and veterans who died before analysis was completed.
Education Brochure. The EB for VISN 22 (Figure 1, see 
Patients. The sample consisted of all veterans identified as meeting the inclusion criteria and being enrolled in VISN 22. The EB was mailed once to veterans on a rolling basis from December 2014 to February 2016. Change in BZD use was analyzed only after 9 to 24 months had passed since the index appointment with the prescribing physician. This period included 12 weeks for BZD taper and then 6 months after taper.
Analysis. For each veteran, monthly mean lorazepam equivalent (LE) was calculated using as many as 12 fills before the index date. Average daily dose of LE was calculated by dividing the sum of LE from all included prescriptions by total number of days between the first fill and the index date. The BZD prescription fills were evaluated after the index date. Veterans who received at least 1 prescription after the index date but then had no BZD prescription activity in VA clinics for 3 consecutive months during the 9-month observation period were recorded as having tapered and then discontinued BZD. Veterans who had no BZD prescription activity in VA clinics after the index date and during the 9-month observation period were recorded as having discontinued BZD without tapering. For veterans who had BZD prescription activity in VA clinics after the index date and during the 9-month observation period, mean LE was calculated by dividing the total LE for BZD prescriptions after the index date by number of days from the first fill after the index date to the date of analysis.
Quality Improvement Project 2
Design. A retrospective cohort analysis using PSM was performed on a subgroup of the QIP-1 sample to evaluate the impact of EB on BZD prescribing in the VA during 2 periods: 6 to 9 months and 6 to 12 months after the index date. A secondary outcome was discontinuation 1 to 12 months after the index date. Veterans in the analysis were active long-term BZD users, had at least 1 BZD prescription released within 200 days before the index date, were aged ≥ 65 years, and had an appointment scheduled with their BZD prescriber within 2 to 8 weeks (Figure 2). 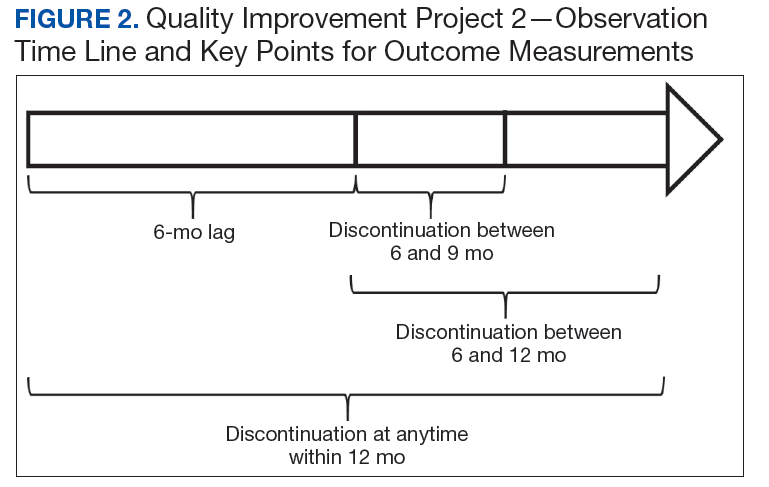
Patients. VISN 22 implemented QIP-2, a real-world application of a modified EMPOWER program, by identifying eligible veterans on a rolling basis from December 2014 to August 2015. All veterans who were identified and sent an EB during this period were included in the case group. The index date was defined as the first of the month the EB was mailed. Veterans with a pending appointment were chosen because the lead time would allow them to receive the EB and prepare to discuss it with the physician during the visit.
A comparator group was drawn from the adjacent VISN 21 catchment area, which encompasses VA facilities and clinics in Hawaii, northern California, and northern Nevada. During the observation period, VISN 21 did not mail any EBs specifically addressing BZD risks. Veterans in the comparator group had an appointment scheduled with their BZD prescribing physician within 4 weeks, were aged ≥ 65 years on the index date (first of the month before the next appointment, coinciding with the date EBs were sent to VISN 22 veterans), were active long-term BZD users, and had at least 1 BZD prescription released within 200 days before the index date. All patients were followed for up to 12 months after the index date, with BZD discontinuation recorded 9 and 12 months after the index date.
Propensity Score Matching
Propensity score (PS) was estimated with logistic regression analysis with treatment as the dependent variable and baseline characteristics as the independent variables.21,22 One-to-one matching on the PS was performed using the nearest neighbor approach without replacements. Independent variables related to outcome but unrelated to EB exposure were selected for PS development.22 These variables included year of birth; male sex; Hispanic ethnicity; annual income; service connection status; region; body mass index; Charlson Comorbidity Index category; total baseline BZD dose; and diagnosis of AIDS, nonmetastatic cancer, metastatic cancer, chronic obstructive pulmonary disease (COPD), congestive heart failure (CHF), dementia, diabetes mellitus (DM), DM with complications, gastroesophageal reflux disease (GERD), general anxiety disorder (GAD), hemiparaplegia, liver disease (mild), liver disease (moderate to severe), myocardial infarction (MI), Parkinson disease, peptic ulcer disease (PUD), psychosis, renal disease, rheumatoid arthritis (RA), or substance use disorder (SUD).
The EMPOWER cluster randomized controlled trial (RCT) demonstrated the effectiveness of EB exposure in a Canadian population of elderly patients who were long-term BZD users.17 Randomized controlled trials are the gold standard for clinical trials because they can establish causal inference.23-25 Given ethical and practical concerns, however, RCTs cannot be applied to all clinical scenarios. Although EMPOWER is reported to be an effective tool in reducing BZD use in older adults, its application in a real-world, large, integrated health care system remains untested. Observational studies are often conducted as an alternative to RCTs but are subject to selection bias because of their lack of randomization.26 Therefore, robust research methods are needed to generate unbiased estimates of the impact of an intervention on an outcome. Propensity score matching simulates an RCT by balancing the covariates across treatment groups.21,22,27 Observed patient characteristics are used to estimate PS, the probability that treatment will be received. Logistic or probit regression is used to balance the potential confounding covariates between the treatment groups.Once PSs are known, mean treatment effect can be estimated without the mean model.28 In other words, PSM methods can be used to generate an unbiased estimate of the treatment.
Propensity Score Analysis
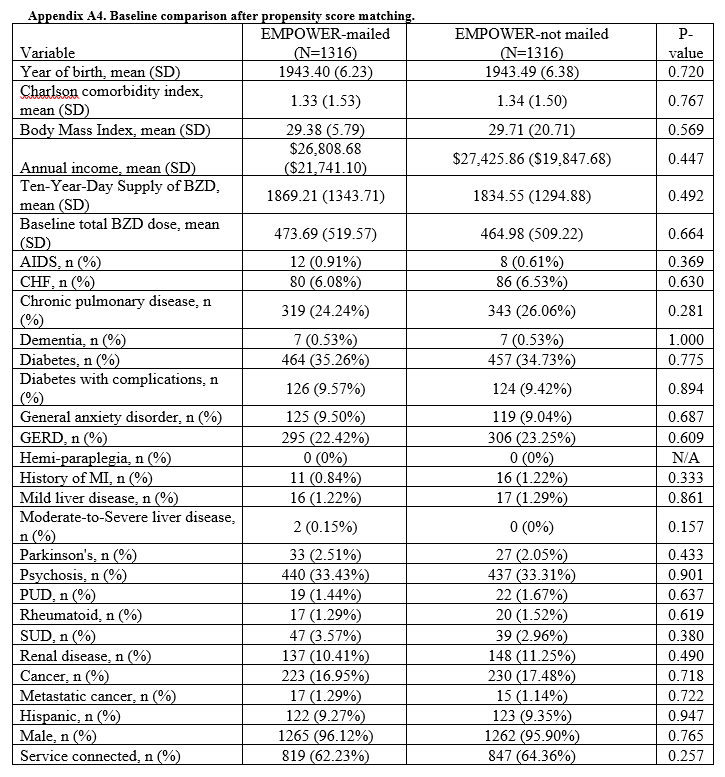
Baseline characteristics were compared using Student t test (continuous variables) and χ2 test (discrete variables). Results are presented as means and standard deviations (continuous variables) and frequency and percentage (discrete variables).
The main outcome was BZD discontinuation 9 and 12 months after the index date. A postindex lag of 6 months was used to capture any tapering (Figure 2). Discontinuation, defined as 3 consecutive months of no BZD prescription on hand, was measured for 2 periods: 6 to 9 months and 6 to 12 months after the index date. A secondary outcome was discontinuation 1 to 12 months after the index date. An estimate was made of the difference in the proportions of BZD discontinuers who received the EB and BZD discontinuers who did not receive the EB, where mean treatment (risk difference) was presented as the absolute risk difference with a 95% CI. Standard errors and 95% CIs for the risk differences were generated with biased-corrected CIs from 1,000 bootstrap samples.
Sensitivity Analyses
Naïve multivariate logistic regression analysis was performed to evaluate the association between EB exposure and BZD discontinuation while controlling for potential confounders. Results are presented as odds ratios (ORs) and 95% CIs. Confounders identified were the same covariates used to generate the PSs.
Several analyses were performed to test the sensitivity of the methods applied using PSM by changing caliber size while maintaining the nearest neighbor approach without replacement. Linear regression analysis was performed with robust standard errors to estimate the risk difference of BZD discontinuation between EB-exposed and EB-unexposed veterans.
Statistical significance was set at P < .05. All statistical analyses were performed with Stata/SE Version 13 (College Station, TX).
Results
Quality Improvement Project 1
On a rolling basis from December 2014 to February 2016, the EB was mailed once to 3,896 VISN 22 veterans 2 to 8 weeks before a clinic appointment with their BZD prescribing physician. 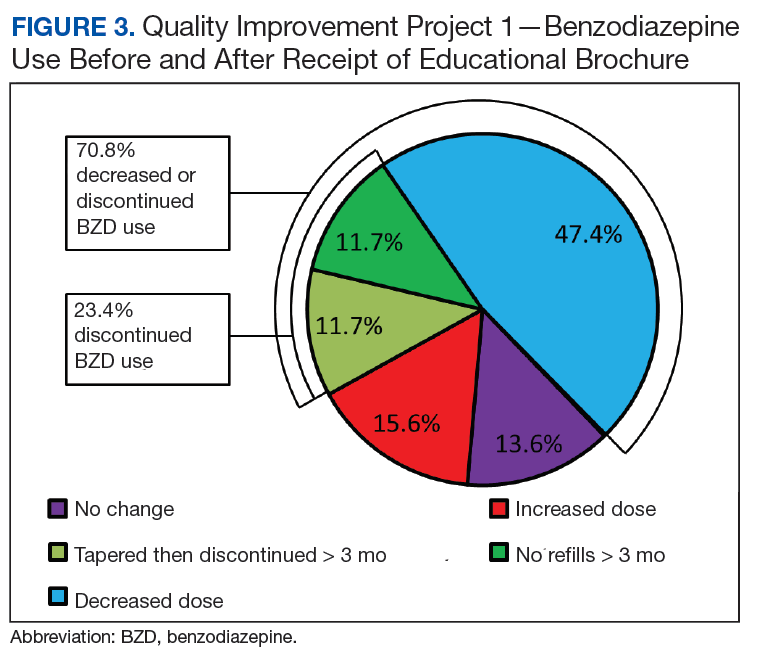

Quality Improvement Project 2
Of all the VISN 22 and VISN 21 veterans, 24,420 met the inclusion and exclusion criteria. Of these 24,420 veterans, 2,020 (8.3%) were in VISN 22 and received the EB between December 2014 and August 2015 (QIP-1), and 22,400 (91.7%) were in VISN 21 and did not receive the EB.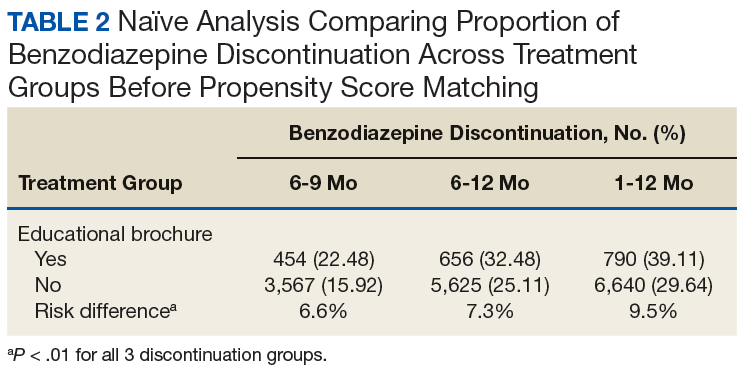
Naïve Results Before PS Matching. In the naïve analyses, a larger proportion of EB-exposed vs unexposed veterans discontinued BZD; in addition, reductions were 6.6%, 7.4%, and 9.5% larger for 6 to 9 months, 6 to 12 months, and 1 to 12 months after the index date, respectively (P < .0001 for all comparisons; Table 2). 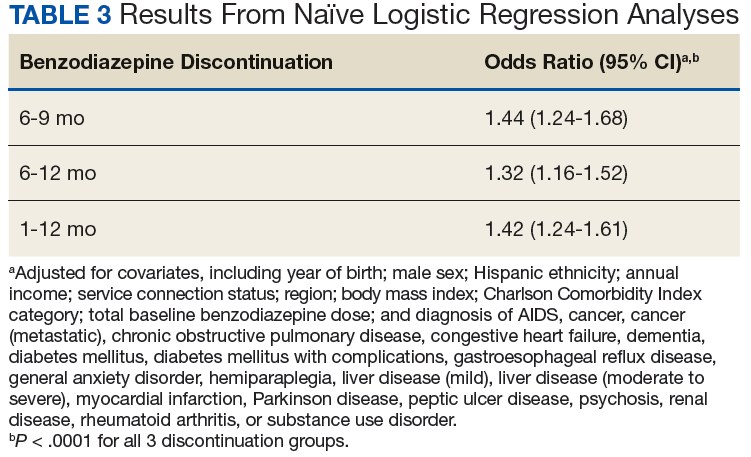
After controlling for potential confounders, the naïve logistic regression analyses found EB exposure was significantly associated with 44%, 32%, and 42% increases in the odds of BZD discontinuation for 6 to 9 months, 6 to 12 months, and 1 to 12 months after the index date, respectively (Table 3). 
Propensity Score Matching. Before matching, there were significant differences in baseline characteristics of veterans who met the inclusion and exclusion criteria, with few exceptions (eAppendices 2 and 3, ).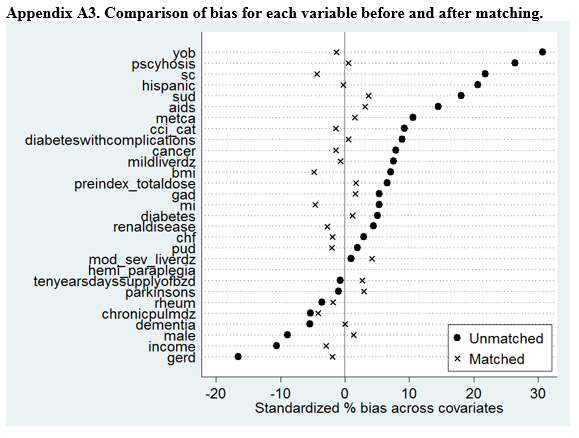
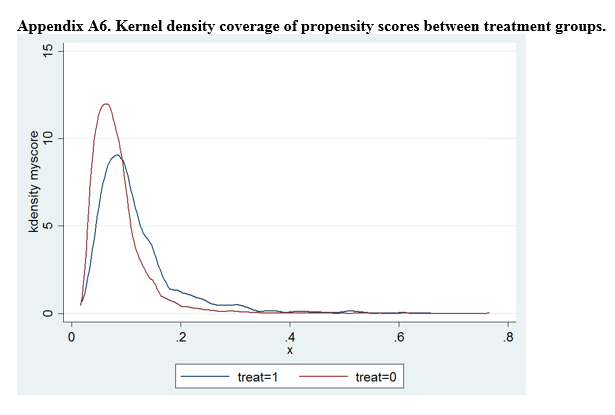
Propensity Score Matching Results. Inspection of PSs revealed good coverage across treatment groups on a histogram plot and a kernel density plot (eAppendices 5 and 6). 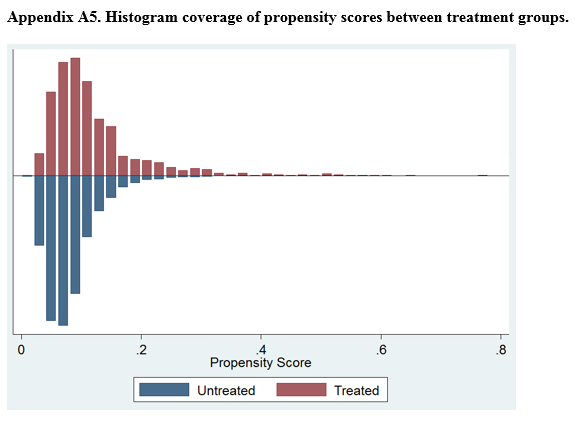

Discussion
This QIP was the first to evaluate the impact of an EMPOWER-modeled DTC EB in a large, integrated health care system in the U.S. It was also the first to demonstrate potential benefits of a DTC EB designed for older veterans who are long-term BZD users. In this QIP, which mailed the EB to 3,896 veterans, 1,847 (47.4%) decreased their BZD dose, 458 (11.7%) tapered and then discontinued BZD, and 455 (11.7%) immediately discontinued BZD. The total percentage of veterans who discontinued BZD (23.4%; 913/3,896) was similar to the 27% reported in the EMPOWER trial.17 However, the risk difference between the 1,316 EB-exposed VISN 22 veterans (QIP-1) and the 1,316 EB-unexposed VISN 21 veterans in this QIP was significantly lower than the 23% risk difference in EMPOWER (though it still demonstrated a significantly larger reduction for EB-exposed veterans).17
Given this inclusion of all qualifying veterans from the catchment area studied in this QIP, and given the ethical and practical concerns, an RCT was not possible. Therefore, PSM methods were used to balance the covariates across treatment groups and thereby simulate an RCT.21,22,27 With use of the PSM approach, findings from the descriptive analysis were confirmed and potential selection bias reduced.
Study Limitations
The less robust risk difference found in this QIP has several possible explanations. The authors’ use of a DTC EB coincided with a national VA effort to reduce older veterans’ use of BZDs and other inappropriate medications. For instance, during the study period, academic detailing was being implemented to reduce use of BZDs, particularly in combination with opioids, across VHA facilities and clinics. (Academic detailing is a pharmacy educational outreach program that uses unbiased clinical guidelines to promote physicians’ safety initiatives and align prescribing behavior with best practices.18-20) However, QIP-2 results and PS analysis of a subgroup of the original sample suggest that EB-exposed veterans were significantly more likely than were their unexposed counterparts were to discontinue BZD. To an extent, this analysis controlled for these other efforts to reduce BZD use in VHA clinics and can be considered a study strength.
Another limitation is the study design, which lacked a control group and did not consider the possibility that some facility or clinic physicians might influence others. Although the region variable was controlled for in PSM, the authors did not capture facility characteristics, including frequency of prescribing BZD and use of a protocol for enforcing the Beers criteria. Such confounders might have influenced outcomes. Unlike the EMPOWER trial,17 this QIP did not assess or exclude cognitively impaired veterans. It is reasonable to assume that these veterans might not understand some EB messages and consequently might fail to engage their physicians. Failure to initiate discussion with a physician would attenuate the impact of the EB.
Study Strengths
A strength of this QIP was its use of a DTC EB in a large, regional sample of older veterans in a real-world clinical setting. In addition, the study group (EB-exposed veterans) and the comparator group (EB-unexposed veterans) were from similar geographic areas (primarily California and Nevada).
Conclusion
Results of this study suggest that a DTC EB, designed to reduce BZD use among older veterans, was effective in helping patients lower their BZD dose and discontinue BZD. The likelihood of discontinuing BZD 9 and 12 months after the index date was significantly higher for veterans who received an EB modeled on the EMPOWER educational brochure than for a comparator group of veterans who did not receive the EB and were receiving care during the same observation period. In the future, it would be beneficial to use a design that controls for physician exposure to academic detailing focused on BZD reduction and that accounts for the cluster effects of facility practice. Despite these limitations, this QIP is the first real-world empirical example of using an EMPOWER-modeled DTC EB to decrease BZD use among older veterans. Furthermore, these results suggest that a DTC EB can be used to target other high-risk prescription drugs, such as opioids, particularly if alternative treatment options can be provided.
Acknowledgments
Dr. Hauser thanks Cathy, Anika, Katia, and Max Hauser, and Alba and Kevin Quinlan, for their support. In memory of Jirina Hauser, who died on Mother’s Day, May 14, 2017, at the age of 100.
1. Dell’osso B, Lader M. Do benzodiazepines still deserve a major role in the treatment of psychiatric disorders? A critical reappraisal. Eur Psychiatry. 2013;28(1):7-20.
2. Olfson M, King M, Schoenbaum M. Benzodiazepine use in the United States. JAMA Psychiatry. 2015;72(2):136-142.
3. Bernardy NC, Lund BC, Alexander B, Friedman MJ. Increased polysedative use in veterans with posttraumatic stress disorder. Pain Med. 2014;15(7):1083-1090.
4. Roberts KJ. Patient empowerment in the United States: a critical commentary. Health Expect. 1999;2(2):82-92.
5. Paterniti S, Dufouil C, Alpérovitch A. Long-term benzodiazepine use and cognitive decline in the elderly: the Epidemiology of Vascular Aging Study. J Clin Psychopharmacol. 2002;22(3):285-293.
6. van der Hooft CS, Schoofs MW, Ziere G, et al. Inappropriate benzodiazepine use in older adults and the risk of fracture. Br J Clin Pharmacol. 2008;66(2):276-282.
7. Zint K, Haefeli WE, Glynn RJ, Mogun H, Avorn J, Stürmer T. Impact of drug interactions, dosage, and duration of therapy on the risk of hip fracture associated with benzodiazepine use in older adults. Pharmacoepidemiol Drug Saf. 2010;19(12):1248-1255.
8. Finkle WD, Der JS, Greenland S, et al. Risk of fractures requiring hospitalization after an initial prescription for zolpidem, alprazolam, lorazepam, or diazepam in older adults. J Am Geriatr Soc. 2011;59(10):1883-1890.
9. de Gage SB, Bégaud B, Bazin F, et al. Benzodiazepine use and risk of dementia: prospective population based study. BMJ. 2012;345:e6231
10. Tannenbaum C, Paquette A, Hilmer S, Holroyd-Leduc J, Carnahan R. A systematic review of amnestic and non-amnestic mild cognitive impairment induced by anticholinergic, antihistamine, GABAergic and opioid drugs. Drugs Aging. 2012;29(8):639-658.
11. Vozoris NT, Fischer HD, Wang X, et al. Benzodiazepine drug use and adverse respiratory outcomes among older adults with chronic obstructive pulmonary disease. Eur Respir J. 2014;44(2):332-340.
12. Gomm W, von Holt K, Thomé F, et al. Regular benzodiazepine and z-substance use and risk of dementia: an analysis of German claims data. J Alzheimers Dis. 2016;54(2):801-808.
13. American Geriatrics Society 2012 Beers Criteria Update Expert Panel. American Geriatrics Society updated Beers criteria for potentially inappropriate medication use in older adults. J Am Geriatr Soc. 2012;60(4):616-631.
14. National Institutes of Health. Despite risks, benzodiazepine use highest in older people. https://www.nih.gov/news-events/news-releases/despite-risks-benzodiaze pine-use-highest-older-people. Published December 17, 2014. Accessed July 31, 2018.
15. Airagnes G, Pelissolo A, Lavallée M, Flament M, Limosin F. Benzodiazepine misuse in the elderly: risk factors, consequences, and management. Curr Psychiatry Rep. 2016;18(10):89.
16. Martin P, Tamblyn R, Ahmed S, Tannenbaum C. A drug education tool developed for older adults changes knowledge, beliefs and risk perceptions about inappropriate benzodiazepine prescriptions in the elderly. Patient Educ Couns. 2013;92(1):81-87.
17. Tannenbaum C, Martin P, Tamblyn R, Benedetti A, Ahmed S. Reduction of inappropriate benzodiazepine prescriptions among older adults through direct patient education: the EMPOWER cluster randomized trial. JAMA Intern Med. 2014;174(6):890-898.
18. Soumerai SB, Avorn J. Principles of educational outreach (‘academic detailing’) to improve clinical decision making. JAMA. 1990;263(4):549-556.
19. Fischer MA, Avorn J. Academic detailing can play a key role in assessing and implementing comparative effectiveness research findings. Health Aff (Millwood). 2012;31(10):2206-2212.
20. Wells DL, Popish S, Kay C, Torrise V, Christopher ML. VA Academic Detailing Service: implementation and lessons learned. Fed Pract. 2016;33(5):38-42.
21. Austin PC. An introduction to propensity score methods for reducing the effects of confounding in observational studies. Multivariate Behav Res. 2011;46(3):399-424.
22. Brookhart MA, Schneeweiss S, Rothman KJ, Glynn RJ, Avorn J, Stürmer T. Variable selection for propensity score models. Am J Epidemiol. 2006;163(12):1149-1156.
23. Rubin DB. Estimating causal effects of treatments in randomized and nonrandomized studies. J Ed Psych. 1974;66(5):688-701.
24. Greenland S. An introduction to instrumental variables for epidemiologists. Int J Epidemiol. 2000;29(4):722-729.
25. Cartwright N. What are randomized controlled trials good for? Philos Stud. 2010;147(1):59.
26. Kleinbaum DG, Morgenstern H, Kupper LL. Selection bias in epidemiologic studies. Am J Epidemiol. 1981;113(4):452-463.
27. Rosenbaum PR, Rubin DB. The central role of the propensity score in observational studies for causal effects. Biometrika. 1983;70(1):41-55.
28. Pirracchio R, Carone M, Rigon MR, Caruana E, Mebazaa A, Chevret S. Propensity score estimators for the average treatment effect and the average treatment effect on the treated may yield very different estimates. Stat Methods Med Res. 2016;25(5):1938-1954.
This quality improvement project used an educational brochure to help older veterans reduce their benzodiazepine use.
This quality improvement project used an educational brochure to help older veterans reduce their benzodiazepine use.
Benzodiazepines (BZDs) are among the most commonly prescribed medications. A recent study found that in 2008, more than 5% of Americans used a BZD, and the percentage was almost 9% among Americans aged ≥ 65 years.1,2 Among veterans, BZD use is even higher, in part because of the high prevalence of posttraumatic stress disorder (PTSD). One study found that more than 30% of veterans with PTSD received at least 1 BZD prescription.3 The risks associated with BZD treatment for PTSD are compounded by concurrent use of other sedatives and opioids prescribed for co-occurring chronic pain and insomnia.3
Older adults metabolize long-acting BZDs more slowly and generally have an increased sensitivity to the adverse effects (AEs) of all BZDs.4 In older adults, BZD use has been associated with cognitive decline, dementia, falls and consequent fractures, and adverse respiratory outcomes.5-12 The risk of most but not all of these AEs was increased with higher BZD dose or long-term BZD use, which this quality improvement project (QIP) defines as having at least a 60-day supply of BZD prescriptions dispensed within the past year.
Long-term BZD use increases with age. One study found that, among patients receiving a BZD, the rate of long-term BZD use was more than double in older adults (31.4%) than it was in adults aged between 18 and 35 years (14.7%).2 For these reasons, the 2012 Beers criteria of the American Geriatrics Society recommend avoiding all types of BZDs in the treatment of insomnia, agitation, or delirium in patients aged > 65 years.13 Despite this recommendation, the prevalence of BZD use in older adults remains high.14
Some innovative approaches have been developed to address the inappropriate use, including overuse and misuse, of BZDs in older adults.15 In one approach, direct-to-consumer (DTC) information is used to empower patients to collaborate with their physician to manage their health. Results from several studies suggest that providing older patients with information on BZD risks and benefits increases patient–physician interaction and thereby decreases inappropriate BZD use and improves health outcomes.4,16,17 One study found that perceptions of BZD risks increased 1 week after exposure to a DTC educational brochure (EB), with intention to discuss BZD discontinuation with their physician higher for patients who received the EB than it was for those who did not (83.1% vs 44.3%; P < .0001).16 The EMPOWER (Eliminating Medications Through Patient Ownership of End Results) cluster randomized controlled trial assessed the effectiveness of a DTC EB focused on BZD risks in older adults.17 In that seminal study, patients who received a DTC EB were more likely than were comparison patients to discontinue BZD within 6 months (27% vs 5%; risk difference, 23%; 95% CI, 14%-32%).
The Veterans Integrated Systems Network (VISN) 22 Academic Detailing Program is a pharmacy educational outreach program that uses unbiased clinical guidelines to promote physicians’ safety initiatives and align prescribing behavior with best practices.18-20 With BZD use among older veterans remaining high, the VISN 22 program initiated a clinical QIP modeled on the EMPOWER trial. Veterans in VISN 22 received the DTC EB, which included information on BZD risks and encouraged them to discuss their BZD treatment with their health care provider. VISN 22 was the first VISN in the VHA to implement the EMPOWER protocol.
As this was a QIP, all eligible veterans in VISN 22 were mailed the DTC EB, thus making it difficult to estimate the impact of the EB on BZD discontinuation in this VISN. Therefore, DTC EB efficacy was estimated by comparing BZD discontinuation between VISN 22 and VISN 21, an adjacent VISN that did not mail the DTC EB.
Methods
Two QIPs were undertaken to determine the impact of DTC EB on BZD use in older veterans in the VHA.
Quality Improvement Project 1
Design. A retrospective cohort analysis was performed. The VISN 22 catchment area, which encompasses VA facilities and clinics in southern California and southern Nevada, serves about 500,000 veterans, a substantial proportion of whom are aged ≥ 65 years. Among these older veterans are active long-term BZD users, who were defined as having ≥ 60-day supply of BZD prescriptions dispensed within the past year. Each active long-term user with a BZD prescription released within 200 days before the index date (the date the user was to meet with the prescribing physician) was mailed an EB 2 to 8 weeks in advance of the visit. Excluded from analysis were veterans with a schizophrenia, spinal cord injury, or seizure disorder diagnosis recorded in both their inpatient and outpatient medical records; veterans seen by Palliative Care within the past year; and veterans who died before analysis was completed.
Education Brochure. The EB for VISN 22 (Figure 1, see
Patients. The sample consisted of all veterans identified as meeting the inclusion criteria and being enrolled in VISN 22. The EB was mailed once to veterans on a rolling basis from December 2014 to February 2016. Change in BZD use was analyzed only after 9 to 24 months had passed since the index appointment with the prescribing physician. This period included 12 weeks for BZD taper and then 6 months after taper.
Analysis. For each veteran, monthly mean lorazepam equivalent (LE) was calculated using as many as 12 fills before the index date. Average daily dose of LE was calculated by dividing the sum of LE from all included prescriptions by total number of days between the first fill and the index date. The BZD prescription fills were evaluated after the index date. Veterans who received at least 1 prescription after the index date but then had no BZD prescription activity in VA clinics for 3 consecutive months during the 9-month observation period were recorded as having tapered and then discontinued BZD. Veterans who had no BZD prescription activity in VA clinics after the index date and during the 9-month observation period were recorded as having discontinued BZD without tapering. For veterans who had BZD prescription activity in VA clinics after the index date and during the 9-month observation period, mean LE was calculated by dividing the total LE for BZD prescriptions after the index date by number of days from the first fill after the index date to the date of analysis.
Quality Improvement Project 2
Design. A retrospective cohort analysis using PSM was performed on a subgroup of the QIP-1 sample to evaluate the impact of EB on BZD prescribing in the VA during 2 periods: 6 to 9 months and 6 to 12 months after the index date. A secondary outcome was discontinuation 1 to 12 months after the index date. Veterans in the analysis were active long-term BZD users, had at least 1 BZD prescription released within 200 days before the index date, were aged ≥ 65 years, and had an appointment scheduled with their BZD prescriber within 2 to 8 weeks (Figure 2).
Patients. VISN 22 implemented QIP-2, a real-world application of a modified EMPOWER program, by identifying eligible veterans on a rolling basis from December 2014 to August 2015. All veterans who were identified and sent an EB during this period were included in the case group. The index date was defined as the first of the month the EB was mailed. Veterans with a pending appointment were chosen because the lead time would allow them to receive the EB and prepare to discuss it with the physician during the visit.
A comparator group was drawn from the adjacent VISN 21 catchment area, which encompasses VA facilities and clinics in Hawaii, northern California, and northern Nevada. During the observation period, VISN 21 did not mail any EBs specifically addressing BZD risks. Veterans in the comparator group had an appointment scheduled with their BZD prescribing physician within 4 weeks, were aged ≥ 65 years on the index date (first of the month before the next appointment, coinciding with the date EBs were sent to VISN 22 veterans), were active long-term BZD users, and had at least 1 BZD prescription released within 200 days before the index date. All patients were followed for up to 12 months after the index date, with BZD discontinuation recorded 9 and 12 months after the index date.
Propensity Score Matching
Propensity score (PS) was estimated with logistic regression analysis with treatment as the dependent variable and baseline characteristics as the independent variables.21,22 One-to-one matching on the PS was performed using the nearest neighbor approach without replacements. Independent variables related to outcome but unrelated to EB exposure were selected for PS development.22 These variables included year of birth; male sex; Hispanic ethnicity; annual income; service connection status; region; body mass index; Charlson Comorbidity Index category; total baseline BZD dose; and diagnosis of AIDS, nonmetastatic cancer, metastatic cancer, chronic obstructive pulmonary disease (COPD), congestive heart failure (CHF), dementia, diabetes mellitus (DM), DM with complications, gastroesophageal reflux disease (GERD), general anxiety disorder (GAD), hemiparaplegia, liver disease (mild), liver disease (moderate to severe), myocardial infarction (MI), Parkinson disease, peptic ulcer disease (PUD), psychosis, renal disease, rheumatoid arthritis (RA), or substance use disorder (SUD).
The EMPOWER cluster randomized controlled trial (RCT) demonstrated the effectiveness of EB exposure in a Canadian population of elderly patients who were long-term BZD users.17 Randomized controlled trials are the gold standard for clinical trials because they can establish causal inference.23-25 Given ethical and practical concerns, however, RCTs cannot be applied to all clinical scenarios. Although EMPOWER is reported to be an effective tool in reducing BZD use in older adults, its application in a real-world, large, integrated health care system remains untested. Observational studies are often conducted as an alternative to RCTs but are subject to selection bias because of their lack of randomization.26 Therefore, robust research methods are needed to generate unbiased estimates of the impact of an intervention on an outcome. Propensity score matching simulates an RCT by balancing the covariates across treatment groups.21,22,27 Observed patient characteristics are used to estimate PS, the probability that treatment will be received. Logistic or probit regression is used to balance the potential confounding covariates between the treatment groups.Once PSs are known, mean treatment effect can be estimated without the mean model.28 In other words, PSM methods can be used to generate an unbiased estimate of the treatment.
Propensity Score Analysis
Baseline characteristics were compared using Student t test (continuous variables) and χ2 test (discrete variables). Results are presented as means and standard deviations (continuous variables) and frequency and percentage (discrete variables).
The main outcome was BZD discontinuation 9 and 12 months after the index date. A postindex lag of 6 months was used to capture any tapering (Figure 2). Discontinuation, defined as 3 consecutive months of no BZD prescription on hand, was measured for 2 periods: 6 to 9 months and 6 to 12 months after the index date. A secondary outcome was discontinuation 1 to 12 months after the index date. An estimate was made of the difference in the proportions of BZD discontinuers who received the EB and BZD discontinuers who did not receive the EB, where mean treatment (risk difference) was presented as the absolute risk difference with a 95% CI. Standard errors and 95% CIs for the risk differences were generated with biased-corrected CIs from 1,000 bootstrap samples.
Sensitivity Analyses
Naïve multivariate logistic regression analysis was performed to evaluate the association between EB exposure and BZD discontinuation while controlling for potential confounders. Results are presented as odds ratios (ORs) and 95% CIs. Confounders identified were the same covariates used to generate the PSs.
Several analyses were performed to test the sensitivity of the methods applied using PSM by changing caliber size while maintaining the nearest neighbor approach without replacement. Linear regression analysis was performed with robust standard errors to estimate the risk difference of BZD discontinuation between EB-exposed and EB-unexposed veterans.
Statistical significance was set at P < .05. All statistical analyses were performed with Stata/SE Version 13 (College Station, TX).
Results
Quality Improvement Project 1
On a rolling basis from December 2014 to February 2016, the EB was mailed once to 3,896 VISN 22 veterans 2 to 8 weeks before a clinic appointment with their BZD prescribing physician.
Quality Improvement Project 2
Of all the VISN 22 and VISN 21 veterans, 24,420 met the inclusion and exclusion criteria. Of these 24,420 veterans, 2,020 (8.3%) were in VISN 22 and received the EB between December 2014 and August 2015 (QIP-1), and 22,400 (91.7%) were in VISN 21 and did not receive the EB.
Naïve Results Before PS Matching. In the naïve analyses, a larger proportion of EB-exposed vs unexposed veterans discontinued BZD; in addition, reductions were 6.6%, 7.4%, and 9.5% larger for 6 to 9 months, 6 to 12 months, and 1 to 12 months after the index date, respectively (P < .0001 for all comparisons; Table 2).
After controlling for potential confounders, the naïve logistic regression analyses found EB exposure was significantly associated with 44%, 32%, and 42% increases in the odds of BZD discontinuation for 6 to 9 months, 6 to 12 months, and 1 to 12 months after the index date, respectively (Table 3).
Propensity Score Matching. Before matching, there were significant differences in baseline characteristics of veterans who met the inclusion and exclusion criteria, with few exceptions (eAppendices 2 and 3, ).
Propensity Score Matching Results. Inspection of PSs revealed good coverage across treatment groups on a histogram plot and a kernel density plot (eAppendices 5 and 6).
Discussion
This QIP was the first to evaluate the impact of an EMPOWER-modeled DTC EB in a large, integrated health care system in the U.S. It was also the first to demonstrate potential benefits of a DTC EB designed for older veterans who are long-term BZD users. In this QIP, which mailed the EB to 3,896 veterans, 1,847 (47.4%) decreased their BZD dose, 458 (11.7%) tapered and then discontinued BZD, and 455 (11.7%) immediately discontinued BZD. The total percentage of veterans who discontinued BZD (23.4%; 913/3,896) was similar to the 27% reported in the EMPOWER trial.17 However, the risk difference between the 1,316 EB-exposed VISN 22 veterans (QIP-1) and the 1,316 EB-unexposed VISN 21 veterans in this QIP was significantly lower than the 23% risk difference in EMPOWER (though it still demonstrated a significantly larger reduction for EB-exposed veterans).17
Given this inclusion of all qualifying veterans from the catchment area studied in this QIP, and given the ethical and practical concerns, an RCT was not possible. Therefore, PSM methods were used to balance the covariates across treatment groups and thereby simulate an RCT.21,22,27 With use of the PSM approach, findings from the descriptive analysis were confirmed and potential selection bias reduced.
Study Limitations
The less robust risk difference found in this QIP has several possible explanations. The authors’ use of a DTC EB coincided with a national VA effort to reduce older veterans’ use of BZDs and other inappropriate medications. For instance, during the study period, academic detailing was being implemented to reduce use of BZDs, particularly in combination with opioids, across VHA facilities and clinics. (Academic detailing is a pharmacy educational outreach program that uses unbiased clinical guidelines to promote physicians’ safety initiatives and align prescribing behavior with best practices.18-20) However, QIP-2 results and PS analysis of a subgroup of the original sample suggest that EB-exposed veterans were significantly more likely than were their unexposed counterparts were to discontinue BZD. To an extent, this analysis controlled for these other efforts to reduce BZD use in VHA clinics and can be considered a study strength.
Another limitation is the study design, which lacked a control group and did not consider the possibility that some facility or clinic physicians might influence others. Although the region variable was controlled for in PSM, the authors did not capture facility characteristics, including frequency of prescribing BZD and use of a protocol for enforcing the Beers criteria. Such confounders might have influenced outcomes. Unlike the EMPOWER trial,17 this QIP did not assess or exclude cognitively impaired veterans. It is reasonable to assume that these veterans might not understand some EB messages and consequently might fail to engage their physicians. Failure to initiate discussion with a physician would attenuate the impact of the EB.
Study Strengths
A strength of this QIP was its use of a DTC EB in a large, regional sample of older veterans in a real-world clinical setting. In addition, the study group (EB-exposed veterans) and the comparator group (EB-unexposed veterans) were from similar geographic areas (primarily California and Nevada).
Conclusion
Results of this study suggest that a DTC EB, designed to reduce BZD use among older veterans, was effective in helping patients lower their BZD dose and discontinue BZD. The likelihood of discontinuing BZD 9 and 12 months after the index date was significantly higher for veterans who received an EB modeled on the EMPOWER educational brochure than for a comparator group of veterans who did not receive the EB and were receiving care during the same observation period. In the future, it would be beneficial to use a design that controls for physician exposure to academic detailing focused on BZD reduction and that accounts for the cluster effects of facility practice. Despite these limitations, this QIP is the first real-world empirical example of using an EMPOWER-modeled DTC EB to decrease BZD use among older veterans. Furthermore, these results suggest that a DTC EB can be used to target other high-risk prescription drugs, such as opioids, particularly if alternative treatment options can be provided.
Acknowledgments
Dr. Hauser thanks Cathy, Anika, Katia, and Max Hauser, and Alba and Kevin Quinlan, for their support. In memory of Jirina Hauser, who died on Mother’s Day, May 14, 2017, at the age of 100.
1. Dell’osso B, Lader M. Do benzodiazepines still deserve a major role in the treatment of psychiatric disorders? A critical reappraisal. Eur Psychiatry. 2013;28(1):7-20.
2. Olfson M, King M, Schoenbaum M. Benzodiazepine use in the United States. JAMA Psychiatry. 2015;72(2):136-142.
3. Bernardy NC, Lund BC, Alexander B, Friedman MJ. Increased polysedative use in veterans with posttraumatic stress disorder. Pain Med. 2014;15(7):1083-1090.
4. Roberts KJ. Patient empowerment in the United States: a critical commentary. Health Expect. 1999;2(2):82-92.
5. Paterniti S, Dufouil C, Alpérovitch A. Long-term benzodiazepine use and cognitive decline in the elderly: the Epidemiology of Vascular Aging Study. J Clin Psychopharmacol. 2002;22(3):285-293.
6. van der Hooft CS, Schoofs MW, Ziere G, et al. Inappropriate benzodiazepine use in older adults and the risk of fracture. Br J Clin Pharmacol. 2008;66(2):276-282.
7. Zint K, Haefeli WE, Glynn RJ, Mogun H, Avorn J, Stürmer T. Impact of drug interactions, dosage, and duration of therapy on the risk of hip fracture associated with benzodiazepine use in older adults. Pharmacoepidemiol Drug Saf. 2010;19(12):1248-1255.
8. Finkle WD, Der JS, Greenland S, et al. Risk of fractures requiring hospitalization after an initial prescription for zolpidem, alprazolam, lorazepam, or diazepam in older adults. J Am Geriatr Soc. 2011;59(10):1883-1890.
9. de Gage SB, Bégaud B, Bazin F, et al. Benzodiazepine use and risk of dementia: prospective population based study. BMJ. 2012;345:e6231
10. Tannenbaum C, Paquette A, Hilmer S, Holroyd-Leduc J, Carnahan R. A systematic review of amnestic and non-amnestic mild cognitive impairment induced by anticholinergic, antihistamine, GABAergic and opioid drugs. Drugs Aging. 2012;29(8):639-658.
11. Vozoris NT, Fischer HD, Wang X, et al. Benzodiazepine drug use and adverse respiratory outcomes among older adults with chronic obstructive pulmonary disease. Eur Respir J. 2014;44(2):332-340.
12. Gomm W, von Holt K, Thomé F, et al. Regular benzodiazepine and z-substance use and risk of dementia: an analysis of German claims data. J Alzheimers Dis. 2016;54(2):801-808.
13. American Geriatrics Society 2012 Beers Criteria Update Expert Panel. American Geriatrics Society updated Beers criteria for potentially inappropriate medication use in older adults. J Am Geriatr Soc. 2012;60(4):616-631.
14. National Institutes of Health. Despite risks, benzodiazepine use highest in older people. https://www.nih.gov/news-events/news-releases/despite-risks-benzodiaze pine-use-highest-older-people. Published December 17, 2014. Accessed July 31, 2018.
15. Airagnes G, Pelissolo A, Lavallée M, Flament M, Limosin F. Benzodiazepine misuse in the elderly: risk factors, consequences, and management. Curr Psychiatry Rep. 2016;18(10):89.
16. Martin P, Tamblyn R, Ahmed S, Tannenbaum C. A drug education tool developed for older adults changes knowledge, beliefs and risk perceptions about inappropriate benzodiazepine prescriptions in the elderly. Patient Educ Couns. 2013;92(1):81-87.
17. Tannenbaum C, Martin P, Tamblyn R, Benedetti A, Ahmed S. Reduction of inappropriate benzodiazepine prescriptions among older adults through direct patient education: the EMPOWER cluster randomized trial. JAMA Intern Med. 2014;174(6):890-898.
18. Soumerai SB, Avorn J. Principles of educational outreach (‘academic detailing’) to improve clinical decision making. JAMA. 1990;263(4):549-556.
19. Fischer MA, Avorn J. Academic detailing can play a key role in assessing and implementing comparative effectiveness research findings. Health Aff (Millwood). 2012;31(10):2206-2212.
20. Wells DL, Popish S, Kay C, Torrise V, Christopher ML. VA Academic Detailing Service: implementation and lessons learned. Fed Pract. 2016;33(5):38-42.
21. Austin PC. An introduction to propensity score methods for reducing the effects of confounding in observational studies. Multivariate Behav Res. 2011;46(3):399-424.
22. Brookhart MA, Schneeweiss S, Rothman KJ, Glynn RJ, Avorn J, Stürmer T. Variable selection for propensity score models. Am J Epidemiol. 2006;163(12):1149-1156.
23. Rubin DB. Estimating causal effects of treatments in randomized and nonrandomized studies. J Ed Psych. 1974;66(5):688-701.
24. Greenland S. An introduction to instrumental variables for epidemiologists. Int J Epidemiol. 2000;29(4):722-729.
25. Cartwright N. What are randomized controlled trials good for? Philos Stud. 2010;147(1):59.
26. Kleinbaum DG, Morgenstern H, Kupper LL. Selection bias in epidemiologic studies. Am J Epidemiol. 1981;113(4):452-463.
27. Rosenbaum PR, Rubin DB. The central role of the propensity score in observational studies for causal effects. Biometrika. 1983;70(1):41-55.
28. Pirracchio R, Carone M, Rigon MR, Caruana E, Mebazaa A, Chevret S. Propensity score estimators for the average treatment effect and the average treatment effect on the treated may yield very different estimates. Stat Methods Med Res. 2016;25(5):1938-1954.
Balanced crystalloid solution improves efficacy outcomes in critically sick adults
Clinical question: Does a balanced crystalloid solution lead to better outcomes than does normal saline when used in critically sick adults?
Background: Balanced crystalloids are considered more physiological, with a composition closer to plasma. Observational studies have shown lower rates of hyperchloremic acidosis, renal failure, and death with use of balanced crystalloids. In spite of this, normal saline has been the most commonly used fluid. Differences in effects on important patient-related outcomes of safety and efficacy between these two interventions remain unknown.
Study design: Pragmatic, unblinded, cluster-randomized, multiple-crossover trial.
Setting: Vanderbilt University Health Center, Nashville, Tenn.

Synopsis: This study comprised 15,802 adults with mean age of 58 admitted to ICU who were cluster randomized to receive either balanced crystalloid or normal saline. Primary outcome was a composite of death from any cause, renal replacement therapy, or persistent renal dysfunction at 30 days and was observed less frequently in the balanced crystalloid group (adjusted odds ratio, 0.90; 95% confidence interval, 0.82-0.99; P = .04).
Since the trial was cluster randomized, prognostic imbalance between the groups caused by confounding factors was a big risk. Results could not be generalized because the study was done in a university health center. Mean fluid amount received was modest in both groups. Questions still remain about the efficacy and safety of balanced fluids, and hospitalists should weigh their decisions in light of this new information.
Bottom line: Balanced crystalloid solution decreased 30-day composite outcome of death, renal replacement therapy, or persistent renal dysfunction.
Citation: Semler MW et al. Balanced crystalloids versus saline in critically ill adults. N Engl J Med. 2018 Mar 1;378(9):829-39.
Dr. Parasramka is an assistant professor in the division of hospital medicine at the University of Kentucky, Lexington.
Clinical question: Does a balanced crystalloid solution lead to better outcomes than does normal saline when used in critically sick adults?
Background: Balanced crystalloids are considered more physiological, with a composition closer to plasma. Observational studies have shown lower rates of hyperchloremic acidosis, renal failure, and death with use of balanced crystalloids. In spite of this, normal saline has been the most commonly used fluid. Differences in effects on important patient-related outcomes of safety and efficacy between these two interventions remain unknown.
Study design: Pragmatic, unblinded, cluster-randomized, multiple-crossover trial.
Setting: Vanderbilt University Health Center, Nashville, Tenn.
Synopsis: This study comprised 15,802 adults with mean age of 58 admitted to ICU who were cluster randomized to receive either balanced crystalloid or normal saline. Primary outcome was a composite of death from any cause, renal replacement therapy, or persistent renal dysfunction at 30 days and was observed less frequently in the balanced crystalloid group (adjusted odds ratio, 0.90; 95% confidence interval, 0.82-0.99; P = .04).
Since the trial was cluster randomized, prognostic imbalance between the groups caused by confounding factors was a big risk. Results could not be generalized because the study was done in a university health center. Mean fluid amount received was modest in both groups. Questions still remain about the efficacy and safety of balanced fluids, and hospitalists should weigh their decisions in light of this new information.
Bottom line: Balanced crystalloid solution decreased 30-day composite outcome of death, renal replacement therapy, or persistent renal dysfunction.
Citation: Semler MW et al. Balanced crystalloids versus saline in critically ill adults. N Engl J Med. 2018 Mar 1;378(9):829-39.
Dr. Parasramka is an assistant professor in the division of hospital medicine at the University of Kentucky, Lexington.
Caplacizumab approved to treat aTTP

The European Commission has granted marketing authorization for caplacizumab (Cablivi™), a humanized bivalent nanobody that inhibits the interaction between von Willebrand factor and platelets.
Caplacizumab is now approved to treat adults with acquired thrombotic thrombocytopenic purpura (aTTP) in all member countries of the European Union as well as Norway, Iceland, and Liechtenstein.
Sanofi Genzyme said it will work with relevant local authorities to make caplacizumab available in countries across Europe.
“The approval of Cablivi provides an important addition to the standard-of-care treatment for patients with aTTP in Europe because it can significantly reduce time to platelet count normalization and induce a clinically meaningful reduction in recurrences,” said Marie Scully, MD, of University College Hospital in London, UK.
The European Commission’s approval of caplacizumab is supported by data from the phase 2 TITAN study and the phase 3 HERCULES study.
TITAN
Results from the TITAN trial were published in The New England Journal of Medicine in 2016.
The study included 75 aTTP patients who were randomized to caplacizumab (n=36) or placebo (n=39), with all patients receiving the current standard of care—daily plasma exchange and immunosuppressive therapy.
The study’s primary endpoint was time to response, which was defined as platelet count normalization (150,000/mm3 or higher).
Patients in the caplacizumab arm had a 39% reduction in the median time to response compared to patients in the placebo arm (P=0.005).
Among the 69 patients who had not undergone a plasma exchange session before enrollment, the median time to response was 3.0 days in the caplacizumab arm and 4.9 days in the placebo arm.
Among the 6 patients who did undergo a plasma exchange session before enrollment, the median time to a response was 2.4 days in the caplacizumab arm and 4.3 days in the placebo arm.
The rate of confirmed response was 86.1% (n=31) in the caplacizumab arm and 71.8% (n=28) in the placebo arm.
There were 541 adverse events (AEs) in 34 of the 35 evaluable patients receiving caplacizumab (97%) and 522 AEs in all 37 evaluable patients receiving placebo (100%). TTP exacerbations and relapses were not included as AEs.
The rate of AEs thought to be related to the study drug was 17% in the caplacizumab arm and 11% in the placebo arm. The rate of AEs that were possibly related was 54% and 8%, respectively. The rate of serious AEs was 37% and 32%, respectively.
There were no deaths in the caplacizumab arm and two in the placebo arm. One death was due to severe, refractory TTP, and the other was due to cerebral hemorrhage.
HERCULES
Results from the HERCULES trial were presented at the 2017 ASH Annual Meeting.
The study enrolled patients with an acute episode of aTTP. They were randomized to receive caplacizumab (n=72) or placebo (n=73) in addition to standard care—plasma exchange and immunosuppression.
The study’s primary endpoint was the time to platelet count response (normalization), which was defined as an initial platelet count of at least 150 x 109/L with subsequent stop of daily plasma exchange within 5 days.
There was a significant reduction in time to platelet count response in the caplacizumab arm compared to the placebo arm. The platelet normalization rate ratio was 1.55 (P<0.01).
A secondary endpoint was the combination of aTTP-related death, aTTP recurrence, and at least one major thromboembolic event during study treatment. The incidence of this combined endpoint was 12.7% (n=9) in the caplacizumab arm and 49.3% (n=36) in the placebo arm (P<0.0001).
The incidence of aTTP-related death was 0% (n=0) in the caplacizumab arm and 4.1% (n=3) in the placebo arm. The incidence of aTTP recurrence was 4.2% (n=3) and 38.4% (n=28), respectively. The incidence of at least one major thromboembolic event was 8.5% (n=6) and 8.2% (n=6), respectively.
The proportion of patients with at least one study-drug-related AE was 57.7% in the caplacizumab arm and 43.8% in the placebo arm. The proportion of patients with at least one study-drug-related serious AE was 14.1% (n=10) and 5.5% (n=4), respectively. The rate of discontinuation due to at least one AE was 7.0% and 12.3%, respectively.
During the treatment period, there were no deaths in the caplacizumab arm and three deaths in the placebo arm. There was one death in the caplacizumab arm during the follow-up period, but it was considered unrelated to caplacizumab.
CV risk prediction tools: Imperfect, Yes, but are they serviceable?
Prevention of cardiovascular disease (CVD) requires timely identification of people who are at increased risk in order to target effective dietary, lifestyle, or pharmacotherapeutic intervention—or a combination of the 3. Risk factors for CVD are well understood, but the relative impact of each factor on an individual’s overall risk is difficult to accurately quantify, making a validated CVD risk calculator an important clinical tool.
Despite numerous available CVD risk calculators, one best tool has yet to emerge. This state of affairs has limited the ability of front-line providers who are tasked with primary prevention of CVD—including family physicians (FPs)—to provide the best evidence-based recommendations to patients.
Implications of CVD risk assessment
Baseline CVD risk assessment is the cornerstone of recommendations for primary prevention of CVD, including aspirin and statin therapy. Interventions to lower CVD risk are of greatest benefit to those at highest risk at initiation of therapy. Overall, statins reduce the risk of a first cardiovascular event in otherwise healthy people by approximately 25% over 10 years.1 Because relative risk reduction is fairly consistent across different levels of absolute risk, a 25% relative reduction confers more actual benefit if risk starts at, say, 40% than at 10%.2 In that example, the same 25% reduction in relative risk results in 1) an absolute risk reduction of 10% when risk starts at 40%, compared to an absolute risk reduction of 2.5% when risk starts at 10% and 2) a number needed to treat (NNT) of, respectively, 10 and 40 (over 10 years).
Identifying a person with an elevated risk of developing CVD has multiple implications. Ideally, that patient is motivated to pursue positive therapeutic lifestyle modifications and make changes that positively affect long-term CVD risk. Conversely, that asymptomatic person identified as at elevated risk also becomes a patient with a medical problem that might adversely affect insurance premiums and self-esteem, and may trigger the use of medications with cost and potential adverse effects. Although the benefit of preventive therapy is greater for a patient at higher risk of disease, the harm of a therapy is relatively constant across all risk groups. Accurately discriminating high and low risk of CVD is, therefore, imperative.
The venerable Framingham risk score
Cardiovascular risk prediction has its roots in the late 1940s, when primary risk factors for CVD were not well-understood, with the inception of the Framingham Heart Study. (A greater understanding of CVD risk today notwithstanding, coronary artery disease [CAD] remains the leading cause of death among American adults.) In the late 1940s, blood pressure (BP) was recognized as the single most useful variable for identifying people at high risk of CVD; other variables were understood to be predictive as well. A composite score—the Framingham Risk Score (FRS)—was thereby developed to calculate the probability that CVD would occur over 8 years in a person who was initially free of such disease.3
The original FRS included glucose intolerance and left ventricular hypertrophy (LVH) identified by electrocardiography (EKG) in its algorithm.3 Other, older algorithms also include a family history of premature CVD. In each risk calculator, these variables are treated as dichotomous (Yes or No), but actual risk associated with each variable is in fact more along a continuum. It is now well-recognized that the sensitivity of EKG for accurately detecting LVH is relatively low; more recent algorithms no longer include this component. A family history of premature CVD variably contributes to an individual’s CVD risk; however, its true impact is nearly impossible to accurately quantify, so this variable is also not included in more modern risk calculators.
Caution: The FRS has meaningful limitations
Although the original Framingham cohort has been expanded multiple times since its inception, clinicians and researchers continue to express concern that the predominantly white, middle-class Framingham, Massachusetts, population might not be representative of the United States in general—which would limit the accuracy of the FRS predictive tool when it is applied to a more diverse population. Furthermore, cholesterol-lowering medications were not available when the FRS was first developed. The FRS, therefore, might not accurately estimate risk in more modern populations, in whom aggressive modification of CVD risk factors has resulted in a lower overall rate of atherosclerotic CVD than when the FRS was developed.4
Continue to: Although demographic changes have increasingly...
Although demographic changes have increasingly led to an extension of primary prevention strategies for CAD to elderly people, the FRS has been demonstrated to perform less well in patients older than 70 years, particularly men.5 An ideal CAD prediction model for elderly people should take into account that, with growing age and frailty, CAD events may be increasingly preempted by death from competing non-coronary causes. In addition, the predictive association of typical CVD risk factors diminishes with increasing age.6,7 Koller and colleagues developed a CAD risk prediction model that accounted for death from non-coronary causes and was validated specifically in patients 65 years and older. Koller’s prediction model provided well-calibrated risk estimates, but it was still not substantially more accurate than the FRS—illustrating the overall difficulty in predicting CAD risk in elderly people.8
Alternative risk calculators have come on the scene
Over the past 2 decades, numerous models have been developed in an attempt to overcome the perceived shortcomings of the FRS. A recent systematic review identified 363 prediction models described in the medical literature prior to July 2013.9 The usefulness of most models remains unclear, however, owing to:
- methodological shortcomings,
- considerable heterogeneity in the definitions of outcomes, and
- lack of external validation.
Even models that are well-validated for a specific population suffer from lack of applicability to a broad multinational population.
In the United Kingdom (UK), electronic health record systems now have the QRISK2 tool embedded to calculate 10-year CVD risk. This algorithm incorporates multiple traditional and nontraditional risk factors (TABLE10). With the inclusion of additional risk factors and validation performed in a population similar to the one from which the algorithm was derived, QRISK2 predicts CVD risk in the UK population more accurately than the modified FRS does.10 It is not clear, however, whether the same algorithm can be applied to the general US population.

New tool: 2013 ACC/AHA pooled cohort risk equations
In the context of multiple imperfect CVD risk-prediction algorithms, the American College of Cardiology/American Heart Association (ACC/AHA) Task Force on Practice Guidelines published the 2013 Pooled Cohort Risk (PCR) equations to predict 10-year risk of a first atherosclerotic CVD event. The Task Force acknowledged concern that the FRS is based on a cohort that might not accurately represent the general US population. Accordingly, PCR equations were developed from 5 large National Institutes of Health (NIH)-funded cohorts: the Framingham Heart Study, the Framingham Offspring Study, the Atherosclerosis Risk in Communities study, the Cardiovascular Health Study, and the Coronary Artery Risk Development in Young Adults Study.
Continue to: The resulting CVD risk calculator incorporates...
The resulting CVD risk calculator incorporates 4 risk equations: 1 each for African-American and non-Hispanic white males and females.11 Of note, PCR equations are typically used to estimate 10-year CVD risk, but they can be modified to estimate risk over any period. The associated Guideline on the Assessment of Cardiovascular Risk recommends statin therapy for primary prevention of CVD in patients with a predicted 10-year risk ≥7.5% and consideration of statin therapy for patients with a predicted 10-year risk between 5% and 7.5%.12
In late 2016, the US Preventive Services Task Force (USPSTF) recommended low- to moderate-dosage statin therapy in adults 40 to 75 years of age without a history of CVD but with at least 1 CVD risk factor (dyslipidemia, diabetes, hypertension, or smoking), and a PCR-calculated 10-year CVD risk of ≥10%. For people with a PCR-calculated risk of 7.5% to 10%, the USPSTF recommended that clinicians “selectively offer” low- to moderate-dosage statin therapy, noting a smaller likelihood of benefit and uncertainty in an individual’s risk prediction.13
Pooled cohort risk equations have predictive validity
Estimates are that nearly 50% of US adults and as many as 65% of European adults would be candidates for statin therapy if, using PCR equations, the 2013 ACC/AHA guidelines were broadly applied.14 Since PCR equations were released, multiple groups have attempted to evaluate the predictive validity of the algorithm in various populations, with mixed findings.
Data from the 1999-2010 NHANES—the National Health and Nutrition Examination Survey—were used to calculate estimated CVD risk for patients free of atherosclerotic CVD at baseline. Risk prediction using PCR equations was compared to true all-cause and CVD mortality using the National Center for Health Statistics National Death Index. In this large, US adult population without CVD at baseline, PCR-estimated CVD risk was significantly associated with all-cause and CVD-specific mortality risk.15
In a community-based primary prevention cohort, 39% of participants were found statin-eligible—ie, they had an estimated 10-year CVD risk ≥7.5%—by ACC/AHA guidelines, compared with 14% found statin-eligible by the guidelines of the National Cholesterol Education Program’s 2004 updated “Third Report of the Expert Panel on Detection, Evaluation, and Treatment of High Blood Cholesterol in Adults (ATP III).” Despite the larger percentage, participants who were statin-eligible by ACC/AHA guidelines had an increased hazard ratio for incident CVD compared with those who were statin-eligible by ATP III; investigators concluded that ACC/AHA guidelines using PCR equations were associated with greater accuracy and efficiency in identifying increased risk of incident CVD.16
Continue to: Pooled cohort risk equations might overestimate CVD risk
Pooled cohort risk equations might overestimate CVD risk
In contrast, a more recent study followed a large, integrated US health-care delivery system population over 5 years, starting in 2008.17 In this group of adults without diabetes, PCR equations substantially overestimated actual 5-year risk of CVD in both sexes and across multiple socioeconomic strata. Similar overestimation of CVD risk was demonstrated in non-Hispanic white, non-Hispanic black, Asian/Pacific Islander, and Hispanic subjects. The latter 2 ethnic groups are considered “white or other” in the atherosclerotic CVD risk equation, raising additional concern that PCR equations may not be accurate for broad, multiethnic application.17 The ACC/AHA Cardiovascular Risk Assessment guideline recognizes this concern, as well, noting that PCR equations may overestimate risk for Hispanic and Asian Americans.12
Predicted 10-year CVD risk using PCR equations was compared with observed event rates in 3 large-scale primary prevention cohorts: the Women’s Health Study, the Physicians’ Health Study, and the Women’s Health Initiative Observational Study.18 In each cohort, the ACC/AHA risk prediction algorithm overestimated observed risk by 75% to 150%. The authors concluded that 40% to 50% of the 33 million middle-aged Americans deemed statin-eligible by ACC/AHA guidelines may not have actual CVD risk that exceeds the 7.5% threshold recommended for statin treatment.18
Therefore, the discrimination of PCR equations—their ability to differentiate between individuals who are more or less likely to develop clinical CVD—is good. The calibration of the equations—the difference between predicted and observed risk—is not as good, however: PCR equations appear to overestimate actual risk in many groups.15
Additional limitations to pooled cohort risk equations
The predictive value of PCR equations is hampered by several factors:
- Despite expansion of the studied cohorts beyond the original Framingham population, the groups still include people screened for study participation or enrolled in clinical trials. The generalizability of this study population to the diverse population treated in a typical clinical practice is, potentially, limited.
- Use of strategies for primary prevention of CVD (eg, statin therapy, antiplatelet therapy, BP control, blood glucose control) continues to increase. Lowering the risk of CVD in the general population with a broad primary prevention approach effectively widens the gap between observed and equation-predicted CVD risk—and thus strengthens the impression of overestimation of risk by PCR equations.
- Lack of comprehensive surveillance in some studies may result in underassessment of CVD events. In this case, PCR equations would, again, appear to overestimate risk.19
Novel tools are available; their use is qualified
First, newer risk markers offer additional options for improving risk prediction offered by the ACC/AHA PCR equations: Coronary artery calcium, ankle-brachial index, high-sensitivity C-reactive protein, and a family history of CAD are all independently associated with incident CAD. ACC/AHA guidelines suggest that assessment of 1 or more of these variables might be considered an adjunct when risk assessment using PCR equations alone does not offer information for making a clear treatment decision.12
Continue to: Of the 4 risk markers...
Of the 4 risk markers, coronary artery calcium provides the most significant increase in discrimination compared to the FRS alone; comparative data using PCR equations is unavailable.20 ACC/AHA guidelines specifically recommend against routine measurement of carotid intima-media thickness for assessment of risk of a first atherosclerotic event.12
Second, a revised set of PCR equations offers improved discrimination and calibration compared to the 2013 PCR equations. A National Institutes of Health (NIH)-sponsored group updated the equations’ cohort by 1) eliminating the original Framingham Heart Study (FHS) data, which was first collected in 1948, and 2) adding data from the Jackson Heart Study and the Multi-Ethnic Study of Atherosclerosis (MESA). Both new cohorts include patient data from 2000 to 2012. Additionally, the NIH group modified the statistical methods used to derive PCR equations. Although these revised PCR equations offer a substantially more accurate estimate of CVD risk, they have not yet been validated for routine clinical use.21
Bottom line: In prediction there persists imperfection
It is widely held that CVD risk prediction, with subsequent treatment to reduce identified risk, is an important component of an overall strategy to reduce the burden of CVD. Cardiovascular risk factors, such as BP and lipid values, do show limited improvement among populations in which systematic screening is practiced, but the true impact of systematic CVD risk assessment alone for healthy people has yet to be demonstrated in terms of hard clinical outcomes.22
CVD risk prediction is most widely used to inform recommendations for statin treatment. However, ACC/AHA PCR equations might substantially overestimate CVD risk and lead to expanded use of statins in patient populations for which such treatment has less potential benefit. Nonetheless, PCR equations do offer good discrimination between higher-risk and lower-risk people.
CVD risk prediction remains an imperfect science—science that is best used as an adjunct to discussion of comprehensive CVD risk factor modification with the individual patient.
CORRESPONDENCE
Jonathon M. Firnhaber, MD, Brody School of Medicine, East Carolina University, 101 Heart Drive, Greenville, NC 27834; [email protected].
1. Taylor F, Huffman MD, Macedo AF, et al. Statins for the primary prevention of cardiovascular disease. Cochrane Database Syst Rev. 2013 Jan 31;(1):CD004816.
2. Holt T. Predicting cardiovascular disease. BMJ. 2016;353:i2621.
3. Kannel WB, McGee D, Gordon T. A general cardiovascular risk profile: the Framingham Study. Am J Cardiol. 1976;38:46-51.
4. Preiss D, Kristensen SL. The new pooled cohort equations risk calculator. Can J Cardiol. 2015;31:613-619.
5. Koller MT, Steyerberg EW, Wolbers M, et al. Validity of the Framingham point scores in the elderly: results from the Rotterdam study. Am Heart J. 2007;154:87-93.
6. Franklin SS, Larson MG, Khan SA, et al. Does the relation of blood pressure to coronary heart disease risk change with aging? The Framingham Heart Study. Circulation. 2001;103:1245-1249.
7. Law MR, Wald NJ, Thompson SG. By how much and how quickly does reduction in serum cholesterol concentration lower risk of ischaemic heart disease? BMJ. 1994;308:367-372.
8. Koller MT, Leening MJ, Wolbers M, et al. Development and validation of a coronary risk prediction model for older U.S. and European persons in the Cardiovascular Health Study and the Rotterdam Study. Ann Intern Med. 2012;157:389-397.
9. Damen JA, Hooft L, Schuit E, et al. Prediction models for cardiovascular disease risk in the general population: systematic review. BMJ. 2016;353:i2416.
10. Hippisley-Cox J, Coupland C, Vinogradova Y, et al. Predicting cardiovascular risk in England and Wales: prospective derivation and validation of QRISK2. BMJ. 2008;336:1475–1482.
11. Stone NJ, Robinson JG, Lichtenstein AH, et al. 2013 ACC/AHA guideline on the treatment of blood cholesterol to reduce atherosclerotic cardiovascular risk in adults: a report of the American College of Cardiology/American Heart Association Task Force on Practice Guidelines. J Amer Coll Cardiol. 2014;63:2889-2934.
12. Goff DC Jr, Lloyd-Jones DM, Bennett G, et al. 2013 ACC/AHA guideline on the assessment of cardiovascular risk: a report of the American College of Cardiology/American Heart Association Task Force on Practice Guidelines. J Am Coll Cardiol. 2014;63:2935-2959.
13. US Preventive Services Task Force, Bibbins-Domingo K, Grossman DC, et al. Statin use for the primary prevention of cardiovascular disease in adults: US Preventive Services Task Force Recommendation Statement. JAMA. 2016;316:1997-2007.
14. Pencina MJ, Navar-Boggan AM, D’Agostino RB Sr, et al. Application of new cholesterol guidelines to a population-based sample. New Engl J Med. 2014;370:1422-1431.
15. Loprinzi PD, Addoh O. Predictive validity of the American College of Cardiology/American Heart Association pooled cohort equations in predicting all-cause and cardiovascular disease–specific mortality in a national prospective cohort study of adults in the United States. Mayo Clin Proc. 2016;91:763-769.
16. Pursnani A, Massaro JM, D’Agostino RB Sr, et al. Guideline-based statin eligibility, coronary artery calcification, and cardiovascular events. JAMA. 2015;314:134-141.
17. Rana JS, Tabada GH, Solomon MD, et al. Accuracy of the atherosclerotic cardiovascular risk equation in a large contemporary, multiethnic population. J Am Coll Cardiol. 2016;67:2118-2130.
18. Ridker PM, Cook NR. Statins: new American guidelines for prevention of cardiovascular disease. Lancet. 2013;382:1762-1765.
19. Cook NR, Ridker PM. Further insight into the cardiovascular risk calculator: the roles of statins, revascularizations, and underascertainment in the Women’s Health Study. JAMA Intern Med. 2014;174:1964-1971.
20. Yeboah J, McClelland RJ, Polonsky TS, et al. Comparison of novel risk markers for improvement in cardiovascular risk assessment in intermediate-risk individuals. JAMA. 2012;308:788-795.
21. Yadlowsky S, Hayward RA, Sussman JB, et al. Clinical implications of revised pooled cohort equations for estimating atherosclerotic cardiovascular disease risk. Ann Intern Med. 2018;169:20-29.
22. Dyakova M, Shantikumar S, Colquitt J, et al. Systematic versus opportunistic risk assessment for the primary prevention of cardiovascular disease. Cochrane Database Syst Rev. 2016 Jan 29;(1):CD010411.
Prevention of cardiovascular disease (CVD) requires timely identification of people who are at increased risk in order to target effective dietary, lifestyle, or pharmacotherapeutic intervention—or a combination of the 3. Risk factors for CVD are well understood, but the relative impact of each factor on an individual’s overall risk is difficult to accurately quantify, making a validated CVD risk calculator an important clinical tool.
Despite numerous available CVD risk calculators, one best tool has yet to emerge. This state of affairs has limited the ability of front-line providers who are tasked with primary prevention of CVD—including family physicians (FPs)—to provide the best evidence-based recommendations to patients.
Implications of CVD risk assessment
Baseline CVD risk assessment is the cornerstone of recommendations for primary prevention of CVD, including aspirin and statin therapy. Interventions to lower CVD risk are of greatest benefit to those at highest risk at initiation of therapy. Overall, statins reduce the risk of a first cardiovascular event in otherwise healthy people by approximately 25% over 10 years.1 Because relative risk reduction is fairly consistent across different levels of absolute risk, a 25% relative reduction confers more actual benefit if risk starts at, say, 40% than at 10%.2 In that example, the same 25% reduction in relative risk results in 1) an absolute risk reduction of 10% when risk starts at 40%, compared to an absolute risk reduction of 2.5% when risk starts at 10% and 2) a number needed to treat (NNT) of, respectively, 10 and 40 (over 10 years).
Identifying a person with an elevated risk of developing CVD has multiple implications. Ideally, that patient is motivated to pursue positive therapeutic lifestyle modifications and make changes that positively affect long-term CVD risk. Conversely, that asymptomatic person identified as at elevated risk also becomes a patient with a medical problem that might adversely affect insurance premiums and self-esteem, and may trigger the use of medications with cost and potential adverse effects. Although the benefit of preventive therapy is greater for a patient at higher risk of disease, the harm of a therapy is relatively constant across all risk groups. Accurately discriminating high and low risk of CVD is, therefore, imperative.
The venerable Framingham risk score
Cardiovascular risk prediction has its roots in the late 1940s, when primary risk factors for CVD were not well-understood, with the inception of the Framingham Heart Study. (A greater understanding of CVD risk today notwithstanding, coronary artery disease [CAD] remains the leading cause of death among American adults.) In the late 1940s, blood pressure (BP) was recognized as the single most useful variable for identifying people at high risk of CVD; other variables were understood to be predictive as well. A composite score—the Framingham Risk Score (FRS)—was thereby developed to calculate the probability that CVD would occur over 8 years in a person who was initially free of such disease.3
The original FRS included glucose intolerance and left ventricular hypertrophy (LVH) identified by electrocardiography (EKG) in its algorithm.3 Other, older algorithms also include a family history of premature CVD. In each risk calculator, these variables are treated as dichotomous (Yes or No), but actual risk associated with each variable is in fact more along a continuum. It is now well-recognized that the sensitivity of EKG for accurately detecting LVH is relatively low; more recent algorithms no longer include this component. A family history of premature CVD variably contributes to an individual’s CVD risk; however, its true impact is nearly impossible to accurately quantify, so this variable is also not included in more modern risk calculators.
Caution: The FRS has meaningful limitations
Although the original Framingham cohort has been expanded multiple times since its inception, clinicians and researchers continue to express concern that the predominantly white, middle-class Framingham, Massachusetts, population might not be representative of the United States in general—which would limit the accuracy of the FRS predictive tool when it is applied to a more diverse population. Furthermore, cholesterol-lowering medications were not available when the FRS was first developed. The FRS, therefore, might not accurately estimate risk in more modern populations, in whom aggressive modification of CVD risk factors has resulted in a lower overall rate of atherosclerotic CVD than when the FRS was developed.4
Continue to: Although demographic changes have increasingly...
Although demographic changes have increasingly led to an extension of primary prevention strategies for CAD to elderly people, the FRS has been demonstrated to perform less well in patients older than 70 years, particularly men.5 An ideal CAD prediction model for elderly people should take into account that, with growing age and frailty, CAD events may be increasingly preempted by death from competing non-coronary causes. In addition, the predictive association of typical CVD risk factors diminishes with increasing age.6,7 Koller and colleagues developed a CAD risk prediction model that accounted for death from non-coronary causes and was validated specifically in patients 65 years and older. Koller’s prediction model provided well-calibrated risk estimates, but it was still not substantially more accurate than the FRS—illustrating the overall difficulty in predicting CAD risk in elderly people.8
Alternative risk calculators have come on the scene
Over the past 2 decades, numerous models have been developed in an attempt to overcome the perceived shortcomings of the FRS. A recent systematic review identified 363 prediction models described in the medical literature prior to July 2013.9 The usefulness of most models remains unclear, however, owing to:
- methodological shortcomings,
- considerable heterogeneity in the definitions of outcomes, and
- lack of external validation.
Even models that are well-validated for a specific population suffer from lack of applicability to a broad multinational population.
In the United Kingdom (UK), electronic health record systems now have the QRISK2 tool embedded to calculate 10-year CVD risk. This algorithm incorporates multiple traditional and nontraditional risk factors (TABLE10). With the inclusion of additional risk factors and validation performed in a population similar to the one from which the algorithm was derived, QRISK2 predicts CVD risk in the UK population more accurately than the modified FRS does.10 It is not clear, however, whether the same algorithm can be applied to the general US population.
New tool: 2013 ACC/AHA pooled cohort risk equations
In the context of multiple imperfect CVD risk-prediction algorithms, the American College of Cardiology/American Heart Association (ACC/AHA) Task Force on Practice Guidelines published the 2013 Pooled Cohort Risk (PCR) equations to predict 10-year risk of a first atherosclerotic CVD event. The Task Force acknowledged concern that the FRS is based on a cohort that might not accurately represent the general US population. Accordingly, PCR equations were developed from 5 large National Institutes of Health (NIH)-funded cohorts: the Framingham Heart Study, the Framingham Offspring Study, the Atherosclerosis Risk in Communities study, the Cardiovascular Health Study, and the Coronary Artery Risk Development in Young Adults Study.
Continue to: The resulting CVD risk calculator incorporates...
The resulting CVD risk calculator incorporates 4 risk equations: 1 each for African-American and non-Hispanic white males and females.11 Of note, PCR equations are typically used to estimate 10-year CVD risk, but they can be modified to estimate risk over any period. The associated Guideline on the Assessment of Cardiovascular Risk recommends statin therapy for primary prevention of CVD in patients with a predicted 10-year risk ≥7.5% and consideration of statin therapy for patients with a predicted 10-year risk between 5% and 7.5%.12
In late 2016, the US Preventive Services Task Force (USPSTF) recommended low- to moderate-dosage statin therapy in adults 40 to 75 years of age without a history of CVD but with at least 1 CVD risk factor (dyslipidemia, diabetes, hypertension, or smoking), and a PCR-calculated 10-year CVD risk of ≥10%. For people with a PCR-calculated risk of 7.5% to 10%, the USPSTF recommended that clinicians “selectively offer” low- to moderate-dosage statin therapy, noting a smaller likelihood of benefit and uncertainty in an individual’s risk prediction.13
Pooled cohort risk equations have predictive validity
Estimates are that nearly 50% of US adults and as many as 65% of European adults would be candidates for statin therapy if, using PCR equations, the 2013 ACC/AHA guidelines were broadly applied.14 Since PCR equations were released, multiple groups have attempted to evaluate the predictive validity of the algorithm in various populations, with mixed findings.
Data from the 1999-2010 NHANES—the National Health and Nutrition Examination Survey—were used to calculate estimated CVD risk for patients free of atherosclerotic CVD at baseline. Risk prediction using PCR equations was compared to true all-cause and CVD mortality using the National Center for Health Statistics National Death Index. In this large, US adult population without CVD at baseline, PCR-estimated CVD risk was significantly associated with all-cause and CVD-specific mortality risk.15
In a community-based primary prevention cohort, 39% of participants were found statin-eligible—ie, they had an estimated 10-year CVD risk ≥7.5%—by ACC/AHA guidelines, compared with 14% found statin-eligible by the guidelines of the National Cholesterol Education Program’s 2004 updated “Third Report of the Expert Panel on Detection, Evaluation, and Treatment of High Blood Cholesterol in Adults (ATP III).” Despite the larger percentage, participants who were statin-eligible by ACC/AHA guidelines had an increased hazard ratio for incident CVD compared with those who were statin-eligible by ATP III; investigators concluded that ACC/AHA guidelines using PCR equations were associated with greater accuracy and efficiency in identifying increased risk of incident CVD.16
Continue to: Pooled cohort risk equations might overestimate CVD risk
Pooled cohort risk equations might overestimate CVD risk
In contrast, a more recent study followed a large, integrated US health-care delivery system population over 5 years, starting in 2008.17 In this group of adults without diabetes, PCR equations substantially overestimated actual 5-year risk of CVD in both sexes and across multiple socioeconomic strata. Similar overestimation of CVD risk was demonstrated in non-Hispanic white, non-Hispanic black, Asian/Pacific Islander, and Hispanic subjects. The latter 2 ethnic groups are considered “white or other” in the atherosclerotic CVD risk equation, raising additional concern that PCR equations may not be accurate for broad, multiethnic application.17 The ACC/AHA Cardiovascular Risk Assessment guideline recognizes this concern, as well, noting that PCR equations may overestimate risk for Hispanic and Asian Americans.12
Predicted 10-year CVD risk using PCR equations was compared with observed event rates in 3 large-scale primary prevention cohorts: the Women’s Health Study, the Physicians’ Health Study, and the Women’s Health Initiative Observational Study.18 In each cohort, the ACC/AHA risk prediction algorithm overestimated observed risk by 75% to 150%. The authors concluded that 40% to 50% of the 33 million middle-aged Americans deemed statin-eligible by ACC/AHA guidelines may not have actual CVD risk that exceeds the 7.5% threshold recommended for statin treatment.18
Therefore, the discrimination of PCR equations—their ability to differentiate between individuals who are more or less likely to develop clinical CVD—is good. The calibration of the equations—the difference between predicted and observed risk—is not as good, however: PCR equations appear to overestimate actual risk in many groups.15
Additional limitations to pooled cohort risk equations
The predictive value of PCR equations is hampered by several factors:
- Despite expansion of the studied cohorts beyond the original Framingham population, the groups still include people screened for study participation or enrolled in clinical trials. The generalizability of this study population to the diverse population treated in a typical clinical practice is, potentially, limited.
- Use of strategies for primary prevention of CVD (eg, statin therapy, antiplatelet therapy, BP control, blood glucose control) continues to increase. Lowering the risk of CVD in the general population with a broad primary prevention approach effectively widens the gap between observed and equation-predicted CVD risk—and thus strengthens the impression of overestimation of risk by PCR equations.
- Lack of comprehensive surveillance in some studies may result in underassessment of CVD events. In this case, PCR equations would, again, appear to overestimate risk.19
Novel tools are available; their use is qualified
First, newer risk markers offer additional options for improving risk prediction offered by the ACC/AHA PCR equations: Coronary artery calcium, ankle-brachial index, high-sensitivity C-reactive protein, and a family history of CAD are all independently associated with incident CAD. ACC/AHA guidelines suggest that assessment of 1 or more of these variables might be considered an adjunct when risk assessment using PCR equations alone does not offer information for making a clear treatment decision.12
Continue to: Of the 4 risk markers...
Of the 4 risk markers, coronary artery calcium provides the most significant increase in discrimination compared to the FRS alone; comparative data using PCR equations is unavailable.20 ACC/AHA guidelines specifically recommend against routine measurement of carotid intima-media thickness for assessment of risk of a first atherosclerotic event.12
Second, a revised set of PCR equations offers improved discrimination and calibration compared to the 2013 PCR equations. A National Institutes of Health (NIH)-sponsored group updated the equations’ cohort by 1) eliminating the original Framingham Heart Study (FHS) data, which was first collected in 1948, and 2) adding data from the Jackson Heart Study and the Multi-Ethnic Study of Atherosclerosis (MESA). Both new cohorts include patient data from 2000 to 2012. Additionally, the NIH group modified the statistical methods used to derive PCR equations. Although these revised PCR equations offer a substantially more accurate estimate of CVD risk, they have not yet been validated for routine clinical use.21
Bottom line: In prediction there persists imperfection
It is widely held that CVD risk prediction, with subsequent treatment to reduce identified risk, is an important component of an overall strategy to reduce the burden of CVD. Cardiovascular risk factors, such as BP and lipid values, do show limited improvement among populations in which systematic screening is practiced, but the true impact of systematic CVD risk assessment alone for healthy people has yet to be demonstrated in terms of hard clinical outcomes.22
CVD risk prediction is most widely used to inform recommendations for statin treatment. However, ACC/AHA PCR equations might substantially overestimate CVD risk and lead to expanded use of statins in patient populations for which such treatment has less potential benefit. Nonetheless, PCR equations do offer good discrimination between higher-risk and lower-risk people.
CVD risk prediction remains an imperfect science—science that is best used as an adjunct to discussion of comprehensive CVD risk factor modification with the individual patient.
CORRESPONDENCE
Jonathon M. Firnhaber, MD, Brody School of Medicine, East Carolina University, 101 Heart Drive, Greenville, NC 27834; [email protected].
1. Taylor F, Huffman MD, Macedo AF, et al. Statins for the primary prevention of cardiovascular disease. Cochrane Database Syst Rev. 2013 Jan 31;(1):CD004816.
2. Holt T. Predicting cardiovascular disease. BMJ. 2016;353:i2621.
3. Kannel WB, McGee D, Gordon T. A general cardiovascular risk profile: the Framingham Study. Am J Cardiol. 1976;38:46-51.
4. Preiss D, Kristensen SL. The new pooled cohort equations risk calculator. Can J Cardiol. 2015;31:613-619.
5. Koller MT, Steyerberg EW, Wolbers M, et al. Validity of the Framingham point scores in the elderly: results from the Rotterdam study. Am Heart J. 2007;154:87-93.
6. Franklin SS, Larson MG, Khan SA, et al. Does the relation of blood pressure to coronary heart disease risk change with aging? The Framingham Heart Study. Circulation. 2001;103:1245-1249.
7. Law MR, Wald NJ, Thompson SG. By how much and how quickly does reduction in serum cholesterol concentration lower risk of ischaemic heart disease? BMJ. 1994;308:367-372.
8. Koller MT, Leening MJ, Wolbers M, et al. Development and validation of a coronary risk prediction model for older U.S. and European persons in the Cardiovascular Health Study and the Rotterdam Study. Ann Intern Med. 2012;157:389-397.
9. Damen JA, Hooft L, Schuit E, et al. Prediction models for cardiovascular disease risk in the general population: systematic review. BMJ. 2016;353:i2416.
10. Hippisley-Cox J, Coupland C, Vinogradova Y, et al. Predicting cardiovascular risk in England and Wales: prospective derivation and validation of QRISK2. BMJ. 2008;336:1475–1482.
11. Stone NJ, Robinson JG, Lichtenstein AH, et al. 2013 ACC/AHA guideline on the treatment of blood cholesterol to reduce atherosclerotic cardiovascular risk in adults: a report of the American College of Cardiology/American Heart Association Task Force on Practice Guidelines. J Amer Coll Cardiol. 2014;63:2889-2934.
12. Goff DC Jr, Lloyd-Jones DM, Bennett G, et al. 2013 ACC/AHA guideline on the assessment of cardiovascular risk: a report of the American College of Cardiology/American Heart Association Task Force on Practice Guidelines. J Am Coll Cardiol. 2014;63:2935-2959.
13. US Preventive Services Task Force, Bibbins-Domingo K, Grossman DC, et al. Statin use for the primary prevention of cardiovascular disease in adults: US Preventive Services Task Force Recommendation Statement. JAMA. 2016;316:1997-2007.
14. Pencina MJ, Navar-Boggan AM, D’Agostino RB Sr, et al. Application of new cholesterol guidelines to a population-based sample. New Engl J Med. 2014;370:1422-1431.
15. Loprinzi PD, Addoh O. Predictive validity of the American College of Cardiology/American Heart Association pooled cohort equations in predicting all-cause and cardiovascular disease–specific mortality in a national prospective cohort study of adults in the United States. Mayo Clin Proc. 2016;91:763-769.
16. Pursnani A, Massaro JM, D’Agostino RB Sr, et al. Guideline-based statin eligibility, coronary artery calcification, and cardiovascular events. JAMA. 2015;314:134-141.
17. Rana JS, Tabada GH, Solomon MD, et al. Accuracy of the atherosclerotic cardiovascular risk equation in a large contemporary, multiethnic population. J Am Coll Cardiol. 2016;67:2118-2130.
18. Ridker PM, Cook NR. Statins: new American guidelines for prevention of cardiovascular disease. Lancet. 2013;382:1762-1765.
19. Cook NR, Ridker PM. Further insight into the cardiovascular risk calculator: the roles of statins, revascularizations, and underascertainment in the Women’s Health Study. JAMA Intern Med. 2014;174:1964-1971.
20. Yeboah J, McClelland RJ, Polonsky TS, et al. Comparison of novel risk markers for improvement in cardiovascular risk assessment in intermediate-risk individuals. JAMA. 2012;308:788-795.
21. Yadlowsky S, Hayward RA, Sussman JB, et al. Clinical implications of revised pooled cohort equations for estimating atherosclerotic cardiovascular disease risk. Ann Intern Med. 2018;169:20-29.
22. Dyakova M, Shantikumar S, Colquitt J, et al. Systematic versus opportunistic risk assessment for the primary prevention of cardiovascular disease. Cochrane Database Syst Rev. 2016 Jan 29;(1):CD010411.
PRACTICE RECOMMENDATIONS
› Avoid the inclination to think that there is 1 best tool for accurately estimating an asymptomatic patient’s risk of cardiovascular disease (CVD). C
› Be mindful that 2013 ACC/AHA Pooled Cohort Risk equations can overestimate CVD risk depending on multiple factors, including the population being evaluated (even though the equations might be the most generalizable of available CVD risk calculators). C
› Consider using one of the newer CVD risk markers to further inform treatment recommendations when quantitative risk assessment does not offer information for making a clear treatment decision. C
Strength of recommendation (SOR)
A Good-quality patient-oriented evidence
B Inconsistent or limited-quality patient-oriented evidence
C Consensus, usual practice, opinion, disease-oriented evidence, case series

Do statins alter the risk or progression of dementia?
EVIDENCE SUMMARY
A 2016 Cochrane systematic review identified 2 double-blind RCTs that evaluated statins for preventing cognitive decline and dementia in patients with either risk factors or a history of vascular disease.1 The authors couldn’t perform a meta-analysis because of heterogeneity.
Statins don’t prevent dementia
The first RCT found that 5804 patients (70-82 years old with pre-existing vascular disease or increased risk because of smoking, hypertension, or diabetes) manifested equivalent cognitive decline at 3.5 years after random assignment to pravastatin 40 mg/d or placebo.2 Investigators measured cognition with the Mini-Mental State Exam (MMSE), which scores cognitive function on a scale of 0 to 30, with higher numbers indicating better function (mean difference [MD] at follow-up=0.06 points; 95% confidence interval [CI], −0.04 to 0.16).
A second RCT evaluated simvastatin 40 mg/d or placebo for as long as 5 years in 20,536 patients 40 to 80 years of age with a history of coronary artery disease or diabetes.3 The study excluded patients with dementia at baseline. The odds of developing dementia didn’t differ between groups (odds ratio=1.0; 95% CI, 0.61-1.65).
Both studies were originally designed to measure cardiovascular outcomes. The authors rated both as high quality with a low risk of bias.
A contrast to earlier, lower-quality studies
These results contrast with an earlier meta-analysis based on one of the previously described RCTs and lower-quality evidence (16 cohort studies and 3 case-control studies) that found using statins to be associated with lower relative risk (RR) of dementia than not using a statin (all-type dementia RR=0.82; 95% CI, 0.69-0.97; Alzheimer’s disease RR=0.70; 95% CI, 0.60-0.83).3,4
The total patient population was more than 2 million and varied widely. Duration of statin use and type of statin (simvastatin, atorvastatin, fluvastatin, pravastatin, rosuvastatin) also varied. The authors noted potential bias in results for 2 reasons: Cross-sectional studies included patients with impaired cognition who were less likely to be prescribed statins, and statin use was determined by patient self-report.
Statins don’t treat dementia
A Cochrane review that included 4 RCTs with 1154 patients, 50 to 90 years old, assessed the effect of ≥6 months of statin therapy (atorvastatin 80 mg/d or simvastatin 40-80 mg/d) on the course of Alzheimer’s disease and vascular dementia.5 Most patients had mild to moderate dementia and most were also taking an anticholinesterase inhibitor.
Continue to: All studies reported...
All studies reported outcomes using the Alzheimer’s Disease Assessment Scale-Cognitive Subscale (ADAS-Cog), scored 0 to 70, with lower numbers indicating better function, and the MMSE. Results of statin use were equivalent to placebo (ADAS-Cog MD= −0.26; 95% CI, −1.05 to 0.52; MMSE MD= −0.32; 95% CI, −0.71 to 0.06).
But do they slow its progression?
In contrast, a case-control study of 6431 patients with mild-to-moderate Alzheimer’s disease concluded that statin use was associated with slower progression of AD.6 Using cholinesterase inhibitor discontinuation as a proxy for worsening dementia, researchers noted that patients with early statin exposure (719 patients) had a lower rate of cholinesterase discontinuation than patients who didn’t receive early statin therapy (RR=0.85; 95% CI, 0.76-0.95).
A 2016 systematic review attempted to identify randomized clinical trials evaluating the effects of statin withdrawal in dementia.7 None were found.
RECOMMENDATIONS
Based primarily on post-marketing surveillance data, the US Food and Drug Administration (FDA) has warned that memory loss and confusion are occasionally associated with statin use from within one day to several years of initiation.8 The FDA indicated that such symptoms are rare, not associated with dementia or clinically significant cognitive decline, and resolve with discontinuation of the medication.
1. McGuinness B, Craig D, Bullock R, et al. Statins for the prevention of dementia. Cochrane Database Syst Rev. 2016;(1):CD003160.
2. Trompet S, van Vliet P, de Craen AJ, et al. Pravastatin and cognitive function in the elderly. Results of the PROSPER study. J Neurol. 2010;257:85-90.
3. Heart Protection Study Collaborative Group. MRC/BHF Heart Protection Study of cholesterol lowering with simvastatin in 20,536 high-risk individuals: a randomised placebo-controlled trial. Lancet. 2002;360:7-22.
4. Wong WB, Lin VW, Boudreau D, et al. Statins in the prevention of dementia and Alzheimer’s disease: a meta-analysis of observational studies and an assessment of confounding. Pharmacoepidemiol Drug Saf. 2013;22:345-358.
5. McGuinness B, Craig D, Bullock R, et al. Statins for the treatment of dementia. Cochrane Database Syst Rev. 2014;(7):CD007514.
6. Lin FC, Chuang YS, Hsieh HM, et al. Early statin use and the progression of Alzheimer disease: a total population-based case-control study. Medicine. 2015;94:e2143.
7. McGuinness B, Cardwell CR, Passmore P. Statin withdrawal in people with dementia. Cochrane Database Syst Rev. 2016;(9):CD012050.
8. US Food and Drug Administration. FDA Drug Safety Communication: Important safety label changes to cholesterol-lowering statin drugs. Available at: www.fda.gov/Drugs/DrugSafety/ucm293101.htm. Accessed August 24, 2018.
EVIDENCE SUMMARY
A 2016 Cochrane systematic review identified 2 double-blind RCTs that evaluated statins for preventing cognitive decline and dementia in patients with either risk factors or a history of vascular disease.1 The authors couldn’t perform a meta-analysis because of heterogeneity.
Statins don’t prevent dementia
The first RCT found that 5804 patients (70-82 years old with pre-existing vascular disease or increased risk because of smoking, hypertension, or diabetes) manifested equivalent cognitive decline at 3.5 years after random assignment to pravastatin 40 mg/d or placebo.2 Investigators measured cognition with the Mini-Mental State Exam (MMSE), which scores cognitive function on a scale of 0 to 30, with higher numbers indicating better function (mean difference [MD] at follow-up=0.06 points; 95% confidence interval [CI], −0.04 to 0.16).
A second RCT evaluated simvastatin 40 mg/d or placebo for as long as 5 years in 20,536 patients 40 to 80 years of age with a history of coronary artery disease or diabetes.3 The study excluded patients with dementia at baseline. The odds of developing dementia didn’t differ between groups (odds ratio=1.0; 95% CI, 0.61-1.65).
Both studies were originally designed to measure cardiovascular outcomes. The authors rated both as high quality with a low risk of bias.
A contrast to earlier, lower-quality studies
These results contrast with an earlier meta-analysis based on one of the previously described RCTs and lower-quality evidence (16 cohort studies and 3 case-control studies) that found using statins to be associated with lower relative risk (RR) of dementia than not using a statin (all-type dementia RR=0.82; 95% CI, 0.69-0.97; Alzheimer’s disease RR=0.70; 95% CI, 0.60-0.83).3,4
The total patient population was more than 2 million and varied widely. Duration of statin use and type of statin (simvastatin, atorvastatin, fluvastatin, pravastatin, rosuvastatin) also varied. The authors noted potential bias in results for 2 reasons: Cross-sectional studies included patients with impaired cognition who were less likely to be prescribed statins, and statin use was determined by patient self-report.
Statins don’t treat dementia
A Cochrane review that included 4 RCTs with 1154 patients, 50 to 90 years old, assessed the effect of ≥6 months of statin therapy (atorvastatin 80 mg/d or simvastatin 40-80 mg/d) on the course of Alzheimer’s disease and vascular dementia.5 Most patients had mild to moderate dementia and most were also taking an anticholinesterase inhibitor.
Continue to: All studies reported...
All studies reported outcomes using the Alzheimer’s Disease Assessment Scale-Cognitive Subscale (ADAS-Cog), scored 0 to 70, with lower numbers indicating better function, and the MMSE. Results of statin use were equivalent to placebo (ADAS-Cog MD= −0.26; 95% CI, −1.05 to 0.52; MMSE MD= −0.32; 95% CI, −0.71 to 0.06).
But do they slow its progression?
In contrast, a case-control study of 6431 patients with mild-to-moderate Alzheimer’s disease concluded that statin use was associated with slower progression of AD.6 Using cholinesterase inhibitor discontinuation as a proxy for worsening dementia, researchers noted that patients with early statin exposure (719 patients) had a lower rate of cholinesterase discontinuation than patients who didn’t receive early statin therapy (RR=0.85; 95% CI, 0.76-0.95).
A 2016 systematic review attempted to identify randomized clinical trials evaluating the effects of statin withdrawal in dementia.7 None were found.
RECOMMENDATIONS
Based primarily on post-marketing surveillance data, the US Food and Drug Administration (FDA) has warned that memory loss and confusion are occasionally associated with statin use from within one day to several years of initiation.8 The FDA indicated that such symptoms are rare, not associated with dementia or clinically significant cognitive decline, and resolve with discontinuation of the medication.
1. McGuinness B, Craig D, Bullock R, et al. Statins for the prevention of dementia. Cochrane Database Syst Rev. 2016;(1):CD003160.
2. Trompet S, van Vliet P, de Craen AJ, et al. Pravastatin and cognitive function in the elderly. Results of the PROSPER study. J Neurol. 2010;257:85-90.
3. Heart Protection Study Collaborative Group. MRC/BHF Heart Protection Study of cholesterol lowering with simvastatin in 20,536 high-risk individuals: a randomised placebo-controlled trial. Lancet. 2002;360:7-22.
4. Wong WB, Lin VW, Boudreau D, et al. Statins in the prevention of dementia and Alzheimer’s disease: a meta-analysis of observational studies and an assessment of confounding. Pharmacoepidemiol Drug Saf. 2013;22:345-358.
5. McGuinness B, Craig D, Bullock R, et al. Statins for the treatment of dementia. Cochrane Database Syst Rev. 2014;(7):CD007514.
6. Lin FC, Chuang YS, Hsieh HM, et al. Early statin use and the progression of Alzheimer disease: a total population-based case-control study. Medicine. 2015;94:e2143.
7. McGuinness B, Cardwell CR, Passmore P. Statin withdrawal in people with dementia. Cochrane Database Syst Rev. 2016;(9):CD012050.
8. US Food and Drug Administration. FDA Drug Safety Communication: Important safety label changes to cholesterol-lowering statin drugs. Available at: www.fda.gov/Drugs/DrugSafety/ucm293101.htm. Accessed August 24, 2018.
EVIDENCE-BASED SUMMARY:
Neither moderate- nor high-intensity statin therapy (with simvastatin or atorvastatin, respectively) improves existing mild to moderately severe Alzheimer’s or vascular dementia (SOR: A, RCTs).
Although statin use is associated with a mild, rare, reversible delirium, it isn’t linked to permanent cognitive decline (SOR: C, expert opinion).

How often does long-term PPI therapy cause clinically significant hypomagnesemia?
EVIDENCE SUMMARY
A systematic review and meta-analysis of observational studies examined the risk of hypomagnesemia, defined in various studies as serum magnesium levels of 1.6, 1.7, or 1.8 mg/dL.1 Two cohort studies, one case-control study, and 6 cross-sectional studies met inclusion criteria; 115,455 patients were enrolled. The studies were significantly heterogeneous (I2=89.1%), because of varying study designs, population sizes, and population characteristics.
PPI use increased the risk of hypomagnesemia (pooled odds ratio [OR]=1.5; 95% confidence interval [CI], 1.1-2.0) after adjustment for possible confounders such as use of diuretics.
Risk rises with long-term use, but severe hypomagnesemia is rare
Two more recent cohort studies produced conflicting results. Of 414 patients in a managed care cohort who received long-term PPIs, only 8 had mild hypomagnesemia (1.2-1.5 mg/dL) on nearly 14% of their combined 289 measurements. At final measurement, all patients had normal serum magnesium levels.2
A cross-sectional analysis of data from a retrospective cohort analysis of 9818 patients in the Netherlands found that any PPI use during the previous year was associated with an increased risk of hypomagnesemia (serum magnesium <1.73 mg/dL) compared with no use (adjusted OR=2; 95% CI, 1.4-2.9).3 The risk was greatest with use longer than 182 days (OR=3.0; 95% CI, 1.7-5.2). As with studies included in the meta-analysis, this study examined laboratory values exclusively. Only 3 of 724 PPI users had a serum magnesium level below 1.2 mg/dL, the point at which symptoms usually occur.
Case-control studies produce conflicting results
Two recent case-control studies also produced conflicting results. The first compared 154 outpatients who used PPIs for at least 6 months (mean, 27.5 months) with 84 nonusers.4 No association was found with hypomagnesemia (2.17 mg/dL vs 2.19 mg/dL), and none of the patients had a serum magnesium level below 1.7 mg/dL. The control group was poorly defined, however, and the study excluded patients taking diuretics.
Conversely, a study that compared 366 patients hospitalized with a primary or secondary diagnosis of hypomagnesemia (determined from an insurance claims database and defined as the presence of ICD-10 codes for hypomagnesemia or magnesium deficiency) with 1464 matched controls found that hospitalized patients with hypomagnesemia were more likely than controls to be current PPI users (adjusted OR=1.4; 95% CI, 1.1-1.9).5 Whether hypomagnesemia was the cause of the hospitalizations or an incidental finding wasn’t clear.
Concurrent use of diuretics and loop diuretics can increase risk
In a subgroup analysis of the second case-control study, PPI users who also used diuretics had an increased risk of hypomagnesemia (adjusted OR=1.7; 95% CI, 1.1-2.7) compared with patients who weren’t taking diuretics (adjusted OR=1.3; 95% CI, 0.8-1.9).5
Continue to: A comparison of the use of loop diuretics and...
A comparison of the use of loop diuretics and thiazides by patients taking PPIs found that concurrent use of loop diuretics increased serum magnesium reduction (−0.08 mg/dL; 95% CI, −0.14 to −0.02), but thiazides didn’t. Numbers were small: Of the 45 participants taking both a PPI and a loop diuretic, only 5 had hypomagnesemia (OR=7.2; 95% CI, 1.7-30.8).3
RECOMMENDATIONS
In 2011, the US Food and Drug Administration (FDA) warned of a possible increased risk of hypomagnesemia in patients taking PPIs long-term. The FDA advisory panel recommended evaluating serum magnesium before beginning long-term PPI therapy and in patients concurrently taking diuretics, digoxin, or other medications associated with hypomagnesemia.6
1. Park CH, Kim EH, Roh YH, et al. The association between the use of proton pump inhibitors and the risk of hypomagnesemia: a systematic review and meta-analysis. PLoS One. 2014;9:e112558.
2. Sharara AI, Chalhoub JM, Hammoud N, et al. Low prevalence of hypomagnesemia in long-term recipients of proton pump inhibitors in a managed care cohort. Clin Gastroenterol Hepatol. 2016;14:317-321.
3. Kieboom BC, Kiefte-de Jong JC, Eijgelsheim M, et al. Proton pump inhibitors and hypomagnesemia in the general population: a population-based cohort study. Am J Kidney Dis. 2015;66:775-782.
4. Biyik M, Solak Y, Ucar R, et al. Hypomagnesemia among outpatient long-term proton pump inhibitor users. Am J Ther. 2014;24:e52-e55.
5. Zipursky J, Macdonald EM, Hollands S, et al. Proton pump inhibitors and hospitalization with hypomagnesemia: a population-based case-control study. PLoS Med. 2014;11:e1001736.
6. United States Food and Drug Administration. FDA Drug Safety Communication: Low magnesium levels can be associated with long-term use of Proton Pump Inhibitor drugs (PPIs). 03/02/2011. Available at: https://www.fda.gov/Drugs/DrugSafety/ucm245011.htm. Accessed August 24, 2018.
EVIDENCE SUMMARY
A systematic review and meta-analysis of observational studies examined the risk of hypomagnesemia, defined in various studies as serum magnesium levels of 1.6, 1.7, or 1.8 mg/dL.1 Two cohort studies, one case-control study, and 6 cross-sectional studies met inclusion criteria; 115,455 patients were enrolled. The studies were significantly heterogeneous (I2=89.1%), because of varying study designs, population sizes, and population characteristics.
PPI use increased the risk of hypomagnesemia (pooled odds ratio [OR]=1.5; 95% confidence interval [CI], 1.1-2.0) after adjustment for possible confounders such as use of diuretics.
Risk rises with long-term use, but severe hypomagnesemia is rare
Two more recent cohort studies produced conflicting results. Of 414 patients in a managed care cohort who received long-term PPIs, only 8 had mild hypomagnesemia (1.2-1.5 mg/dL) on nearly 14% of their combined 289 measurements. At final measurement, all patients had normal serum magnesium levels.2
A cross-sectional analysis of data from a retrospective cohort analysis of 9818 patients in the Netherlands found that any PPI use during the previous year was associated with an increased risk of hypomagnesemia (serum magnesium <1.73 mg/dL) compared with no use (adjusted OR=2; 95% CI, 1.4-2.9).3 The risk was greatest with use longer than 182 days (OR=3.0; 95% CI, 1.7-5.2). As with studies included in the meta-analysis, this study examined laboratory values exclusively. Only 3 of 724 PPI users had a serum magnesium level below 1.2 mg/dL, the point at which symptoms usually occur.
Case-control studies produce conflicting results
Two recent case-control studies also produced conflicting results. The first compared 154 outpatients who used PPIs for at least 6 months (mean, 27.5 months) with 84 nonusers.4 No association was found with hypomagnesemia (2.17 mg/dL vs 2.19 mg/dL), and none of the patients had a serum magnesium level below 1.7 mg/dL. The control group was poorly defined, however, and the study excluded patients taking diuretics.
Conversely, a study that compared 366 patients hospitalized with a primary or secondary diagnosis of hypomagnesemia (determined from an insurance claims database and defined as the presence of ICD-10 codes for hypomagnesemia or magnesium deficiency) with 1464 matched controls found that hospitalized patients with hypomagnesemia were more likely than controls to be current PPI users (adjusted OR=1.4; 95% CI, 1.1-1.9).5 Whether hypomagnesemia was the cause of the hospitalizations or an incidental finding wasn’t clear.
Concurrent use of diuretics and loop diuretics can increase risk
In a subgroup analysis of the second case-control study, PPI users who also used diuretics had an increased risk of hypomagnesemia (adjusted OR=1.7; 95% CI, 1.1-2.7) compared with patients who weren’t taking diuretics (adjusted OR=1.3; 95% CI, 0.8-1.9).5
Continue to: A comparison of the use of loop diuretics and...
A comparison of the use of loop diuretics and thiazides by patients taking PPIs found that concurrent use of loop diuretics increased serum magnesium reduction (−0.08 mg/dL; 95% CI, −0.14 to −0.02), but thiazides didn’t. Numbers were small: Of the 45 participants taking both a PPI and a loop diuretic, only 5 had hypomagnesemia (OR=7.2; 95% CI, 1.7-30.8).3
RECOMMENDATIONS
In 2011, the US Food and Drug Administration (FDA) warned of a possible increased risk of hypomagnesemia in patients taking PPIs long-term. The FDA advisory panel recommended evaluating serum magnesium before beginning long-term PPI therapy and in patients concurrently taking diuretics, digoxin, or other medications associated with hypomagnesemia.6
1. Park CH, Kim EH, Roh YH, et al. The association between the use of proton pump inhibitors and the risk of hypomagnesemia: a systematic review and meta-analysis. PLoS One. 2014;9:e112558.
2. Sharara AI, Chalhoub JM, Hammoud N, et al. Low prevalence of hypomagnesemia in long-term recipients of proton pump inhibitors in a managed care cohort. Clin Gastroenterol Hepatol. 2016;14:317-321.
3. Kieboom BC, Kiefte-de Jong JC, Eijgelsheim M, et al. Proton pump inhibitors and hypomagnesemia in the general population: a population-based cohort study. Am J Kidney Dis. 2015;66:775-782.
4. Biyik M, Solak Y, Ucar R, et al. Hypomagnesemia among outpatient long-term proton pump inhibitor users. Am J Ther. 2014;24:e52-e55.
5. Zipursky J, Macdonald EM, Hollands S, et al. Proton pump inhibitors and hospitalization with hypomagnesemia: a population-based case-control study. PLoS Med. 2014;11:e1001736.
6. United States Food and Drug Administration. FDA Drug Safety Communication: Low magnesium levels can be associated with long-term use of Proton Pump Inhibitor drugs (PPIs). 03/02/2011. Available at: https://www.fda.gov/Drugs/DrugSafety/ucm245011.htm. Accessed August 24, 2018.
EVIDENCE-BASED ANSWER:
Rarely. Proton pump inhibitors (PPIs) may be associated with decreases in serum magnesium laboratory values to below 1.6 to 1.8 mg/dL, especially when used concurrently with diuretics and loop diuretics (strength of recommendation [SOR]: C, disease-oriented outcomes based on cohort, case-control, and cross-sectional studies). Clinically significant or symptomatic hypomagnesemia (below 1.2 mg/dL) appears to be quite rare, however.

4 pearls for treating musculoskeletal pain
Musculoskeletal complaints are one of the top reasons patients visit family physicians, with more than
The article by Drs. Stephen and Peter Carek summarizes the value of specific exercises for hip and knee osteoarthritis (OA), chronic back pain, chronic shoulder pain, Achilles tendinitis, and lateral epicondylitis. This month’s PURL summarizes a negative randomized trial of treatment of knee OA with the popular over-the-counter combination of glucosamine and chondroitin. The findings? The group taking placebo actually had superior pain relief at 6 months!
What else works … and doesn’t? You may find that the following 4 “pearls,” taken from the literature, are also useful to know as you seek to manage patients’ musculoskeletal pain.
Pearl #1. Don’t use diazepam (valium) for acute low back pain. It doesn’t improve pain or function for this back pain. One hundred fourteen patients with acute low back pain were randomized to naproxen 500 mg bid as needed plus either placebo or diazepam 5 mg, 1 or 2 tablets, every 12 hours prn. At 7 days, 32% of the diazepam group reported moderate to severe pain and 22% of the placebo group did.2
Pearl #2. Use naproxen alone when treating acute low back pain. Three hundred twenty-three patients with acute low back pain were randomized to receive naproxen 500 mg bid plus placebo; naproxen plus oxycodone/acetaminophen; or naproxen plus cyclobenzaprine.3 At 7 days and 3 months, pain and function scores did not differ between groups.
Pearl #3. Don’t inject knees with corticosteroids. Enroll these patients in exercise and walking programs, which do provide benefit. One hundred forty patients with moderately severe knee OA were randomized to saline or triamcinolone 40 mg intra-articular injections every 3 months for 2 years.4 There was no difference in pain or function scores measured every 3 months and there was more cartilage degeneration in the triamcinolone group.
Continue to: Pearl #4
Pearl #4. Don’t dismiss the placebo effect. Eighty-three patients with chronic low back pain were randomized to either continue their current pain medications or to continue their current pain medication plus a placebo tablet twice daily for 3 weeks.5 They were told that placebos can have significant pain-relieving qualities. At 3 weeks, the patients taking placebo had less pain than those not taking placebo.
I’m not sure if we should start prescribing placebos, but this study is a strong reminder that we should harness the placebo effect, rather than dismiss it.
1. Peabody MR, O’Neill TR, Stelter KL, et al. Frequency and criticality of diagnoses in family medicine practices: from the National Ambulatory Medical Care Survey (NAMCS). J Am Board Fam Med. 2018;31:126-138.
2. Friedman BW, Irizarry E, Solorzano C, et al. Diazepam is no better than placebo when added to naproxen for acute low back pain. Ann Emerg Med. 2017;70:169-176.
3. Friedman BW, Dym AA, Davitt M, et al. Naproxen with cyclobenzaprine, oxycodone/acetaminophen, or placebo for treating acute low back pain. A randomized clinical trial. JAMA. 2015;314:1572-1580.
4. McAlindon TE, LaValley MP, Harvey WF, et al. Effect of intra-articular triamcinolone vs saline on knee cartilage volume and pain in patients with knee osteoarthritis: a randomized clinical trial. JAMA. 2017;317:1967-1975.
5. Carvalho C, Caetano JM, Cunha L, et al. Open-label placebo treatment in chronic low back pain: a randomized controlled trial. Pain. 2016;157:2766-2772.
Editor-in-Chief
Editor-in-Chief
Editor-in-Chief
Musculoskeletal complaints are one of the top reasons patients visit family physicians, with more than
The article by Drs. Stephen and Peter Carek summarizes the value of specific exercises for hip and knee osteoarthritis (OA), chronic back pain, chronic shoulder pain, Achilles tendinitis, and lateral epicondylitis. This month’s PURL summarizes a negative randomized trial of treatment of knee OA with the popular over-the-counter combination of glucosamine and chondroitin. The findings? The group taking placebo actually had superior pain relief at 6 months!
What else works … and doesn’t? You may find that the following 4 “pearls,” taken from the literature, are also useful to know as you seek to manage patients’ musculoskeletal pain.
Pearl #1. Don’t use diazepam (valium) for acute low back pain. It doesn’t improve pain or function for this back pain. One hundred fourteen patients with acute low back pain were randomized to naproxen 500 mg bid as needed plus either placebo or diazepam 5 mg, 1 or 2 tablets, every 12 hours prn. At 7 days, 32% of the diazepam group reported moderate to severe pain and 22% of the placebo group did.2
Pearl #2. Use naproxen alone when treating acute low back pain. Three hundred twenty-three patients with acute low back pain were randomized to receive naproxen 500 mg bid plus placebo; naproxen plus oxycodone/acetaminophen; or naproxen plus cyclobenzaprine.3 At 7 days and 3 months, pain and function scores did not differ between groups.
Pearl #3. Don’t inject knees with corticosteroids. Enroll these patients in exercise and walking programs, which do provide benefit. One hundred forty patients with moderately severe knee OA were randomized to saline or triamcinolone 40 mg intra-articular injections every 3 months for 2 years.4 There was no difference in pain or function scores measured every 3 months and there was more cartilage degeneration in the triamcinolone group.
Continue to: Pearl #4
Pearl #4. Don’t dismiss the placebo effect. Eighty-three patients with chronic low back pain were randomized to either continue their current pain medications or to continue their current pain medication plus a placebo tablet twice daily for 3 weeks.5 They were told that placebos can have significant pain-relieving qualities. At 3 weeks, the patients taking placebo had less pain than those not taking placebo.
I’m not sure if we should start prescribing placebos, but this study is a strong reminder that we should harness the placebo effect, rather than dismiss it.
1. Peabody MR, O’Neill TR, Stelter KL, et al. Frequency and criticality of diagnoses in family medicine practices: from the National Ambulatory Medical Care Survey (NAMCS). J Am Board Fam Med. 2018;31:126-138.
2. Friedman BW, Irizarry E, Solorzano C, et al. Diazepam is no better than placebo when added to naproxen for acute low back pain. Ann Emerg Med. 2017;70:169-176.
3. Friedman BW, Dym AA, Davitt M, et al. Naproxen with cyclobenzaprine, oxycodone/acetaminophen, or placebo for treating acute low back pain. A randomized clinical trial. JAMA. 2015;314:1572-1580.
4. McAlindon TE, LaValley MP, Harvey WF, et al. Effect of intra-articular triamcinolone vs saline on knee cartilage volume and pain in patients with knee osteoarthritis: a randomized clinical trial. JAMA. 2017;317:1967-1975.
5. Carvalho C, Caetano JM, Cunha L, et al. Open-label placebo treatment in chronic low back pain: a randomized controlled trial. Pain. 2016;157:2766-2772.
Painful facial blisters, fever, and conjunctivitis
A 58-year-old woman with a history of hepatitis C, liver cirrhosis, hepatocellular carcinoma, hypothyroidism, and peripheral neuropathy presented to our clinic with left ear pain and blisters on her lips, nose, and mouth. On exam, the patient’s left tympanic membrane was opaque, and she had multiple 3- to 5-mm irregularly shaped ulcers on her right buccal mucosa, gingiva, and lips. She was given a diagnosis of acute otitis media and prescribed a course of amoxicillin. The physician, who was uncertain about the cause of her gingivostomatitis, took a “shotgun approach” and prescribed a nystatin/diphenhydramine/lidocaine mouthwash.
Three weeks later, the patient returned complaining of cloudy urine, dysuria, fever, vomiting, and “pink eye.” On exam, her right eye was mildly injected with no drainage. She had normal eye movements and no ophthalmoplegia. We diagnosed viral (vs allergic) conjunctivitis and pyelonephritis in this patient and advised her to use lubricant eyedrops and an oral antihistamine for the eye. We also started her on cefpodoxime (200 mg bid for 10 days) for pyelonephritis.
Three days later, the patient called our clinic and said that her right eye was not improving. We prescribed ofloxacin ophthalmic drops, 1 to 2 drops every 6 hours, for presumed bacterial conjunctivitis.
Four days later, she returned to our clinic; she had been using the ofloxacin drops and antihistamine but was experiencing worsening symptoms, including itching of her right eye, associated blurriness, and decreased vision. She had been using a warm compress on the eye and found that it was getting sticky and crusted. A gray corneal opacity was seen on physical exam, and a fluorescein exam was performed (FIGURE).

WHAT IS YOUR DIAGNOSIS?
HOW WOULD YOU TREAT THIS PATIENT?
Diagnosis: Herpes simplex virus keratitis
The patient was sent to the ophthalmology clinic, where a slit-lamp examination of the right eye showed 3+ injection, large dendritic epithelial defects spanning the majority of the cornea (with 10% haze), and trace nuclear sclerosis of the lens. These findings were consistent with a diagnosis of herpes simplex virus (HSV) keratitis, with a likely neurotrophic component (decreased sensation of the affected eye compared with that of the other eye). There was no evidence of secondary infection.
Discussion
The global incidence of HSV keratitis is approximately 1.5 million, including 40,000 new cases of monocular visual impairment or blindness each year.1 Primary infection with HSV-1 occurs following direct contact with infected mucosa or skin surfaces and inoculation. (Our patient likely transferred the infection by touching her eyes after touching her nose or mouth.) The virus remains in sensory ganglia for the lifetime of the host. Most ocular disease is thought to represent recurrent HSV (rather than a primary ocular infection).2 It has been proposed that HSV-1 latency may also occur in the cornea.
The symptoms of HSV keratitis include eye pain, redness, blurred vision, tearing, discharge, and sensitivity to light.
The 4 diagnostic categories
There are 4 categories of HSV keratitis, based on the location of the infection: epithelial, stromal, endotheliitis, and neurotrophic keratopathy.
Epithelial. The most common form, epithelial HSV manifests as dendritic or geographic lesions of the cornea.3 Geographic lesions occur when a dendrite widens and assumes an amoeboid shape.
Continue to: Stromal
Stromal. Stromal involvement accounts for 20% to 25% of presentations4 and may cause significant anterior chamber inflammation. Vision loss can result from permanent stromal scarring.5
Endotheliitis. Keratic precipitates (on top of stromal and epithelial edema) and a mild-to-moderate iritis are signs of endotheliitis.5
Neurotrophic keratopathy. This form of HSV keratitis is associated with corneal hypoesthesia or complete anesthesia secondary to damage of the corneal nerves, which can occur in any form of ocular HSV. Anesthesia may lead to nonhealing corneal epithelial defects.6 These defects, which are generally oval lesions, do not represent active viral disease and are made worse by antiviral drops. These lesions may cause stromal scarring, corneal perforation, or secondary bacterial infection.
Treatment consists of supportive care using artificial tears and prophylactic antibiotic eye drops, if appropriate; more advanced ophthalmologic treatments may be needed for advanced disease.7
Continue to: Other conditions, including conjunctivitis, have similar symptoms
Other conditions, including conjunctivitis, have similar symptoms
The differential for redness of the eye includes conditions such as conjunctivitis, glaucoma, and keratitis.
Conjunctivitis of any form—bacterial, viral, allergic, or toxic—involves injection of both the palpebral and bulbar conjunctiva.
Acute angle closure glaucoma can involve symptoms of headache, malaise, nausea, and vomiting. In addition, the pupil is fixed in mid-dilation, and the cornea becomes hazy.
Anterior uveitis/iritis causes sensitivity to light in both the affected and unaffected eyes, as well as ciliary flush (a red ring around the iris). Typically, there is no eye discharge.
Bacterial keratitis causes foreign body sensation and purulent discharge. This form of keratitis usually occurs due to improper wear of contact lenses.
Continue to: Viral keratitis...
Viral keratitis is characterized by photophobia, foreign body sensation, and watery discharge. A faint branching grey opacity may be seen on penlight exam, and dendrites may be seen with fluorescein.
Scleritis involves severe, boring pain of the eye in addition to photophobia and headache. It is usually associated with systemic inflammatory disorders.
Subconjunctival hemorrhage is asymptomatic and occurs following trauma.
Cellulitis manifests following trauma with a deep violet color and marked edema.
Continue to: Standard Tx
Standard Tx: Antiviral medications
Topical antiviral therapy is the standard treatment for epithelial HSV keratitis, although oral antiviral medications are equally effective. A randomized trial found that using an oral agent in addition to a topical antiviral did not improve outcomes.8 A 2015 systematic review found that topical antivirals acyclovir, ganciclovir, brivudine, trifluridine were equally effective in treatment outcome; 90% of patients healed within 2 weeks.9
Recurrent ocular HSV-1 infections are treated in the same way as the initial infection. Recurrent infection can be prevented with daily suppressive therapy. In one study, patients who took suppressive therapy (acyclovir 400 mg bid) for 1 year had 19% recurrence of ocular infection vs 32% in the placebo group.10
Prompt Tx is key. If the infection is superficial—involving only the outer layer of the cornea (epithelium)—the eye should heal without scarring with proper treatment. However, if the infection is not promptly treated or if deeper layers are involved, scarring of the cornea may occur. This can lead to vision loss or blindness.
Continue to: A missed opportunity for an earlier diagnosis
A missed opportunity for an earlier diagnosis
This case highlights the importance of conducting a thorough exam to identify findings that could shift the diagnosis from a simple allergic, viral, or bacterial conjunctivitis. It is always better to consider primary oral HSV infection than resort to a “shotgun approach” of treating candida and pain with an oral mixture. In this case, the ulcers and vesicles on the buccal mucosa, gingiva, and lips were a missed sign of primary HSV infection. Making this diagnosis might have prevented the ocular disease, as the treatment would have been an oral antiviral.
If conjunctivitis is refractory to usual management, the patient must be seen to rule out dangerous eye diagnoses such as HSV keratitis, preseptal or orbital cellulitis, or in the worst case, acute angle closure glaucoma. If there is uncertainty regarding diagnosis, a fluorescein exam is helpful. This simple in-office exam can facilitate a referral to Ophthalmology or the emergency department for a slit-lamp exam and appropriate therapy.
Our patient was started on valacyclovir 1 g bid, trifluridine eyedrops (5×/d), and erythromycin ophthalmic ointment (3×/d), with Ophthalmology follow-up in 1 week.
CORRESPONDENCE
John Spittler, MD, 3055 Roslyn St, Suite 100, Denver, CO 80238; [email protected]
1. Farooq AV, Shukla D. Herpes simplex epithelial and stromal keratitis: an epidemiologic update. Surv Ophthalmol. 2012;57:448-462.
2. Holland EJ, Mahanti RL, Belongia EA, et al. Ocular involvement in an outbreak of herpes gladiatorum. Am J Ophthalmol. 1992;114:680-684.
3. Cook SD. Herpes simplex virus in the eye. Br J Ophthalmol. 1992;76:365-366.
4. Liesegang TJ. Herpes simplex virus epidemiology and ocular importance. Cornea. 2001;20:1-13.
5. Sekar Babu M, Balammal G, Sangeetha G, et al. A review on viral keratitis caused by herpes simplex virus. J Sci. 2011;1:1-10.
6. Hamrah P, Cruzat A, Dastjerdi MH, et al. Corneal sensation and subbasal nerve alterations in patients with herpes simplex keratitis: an in vivo confocal microscopy study. Ophthalmology. 2010;117:1930-1936.
7. Bonini S, Rama P, Olzi D, et al. Neurotrophic keratitis. Eye. 2003;17:989-995.
8. Szentmáry N, Módis L, Imre L, et al. Diagnostics and treatment of infectious keratitis. Orv Hetil. 2017;158:1203-1212.
9. Wilhelmus KR. Antiviral treatment and other therapeutic interventions for herpes simplex virus epithelial keratitis. Cochrane Database Syst Rev. 2015;(1):CD002898.
10. Herpetic Eye Disease Study Group. Acyclovir for the prevention of recurrent herpes simplex virus eye disease. N Engl J Med. 1998;339:300-306.
A 58-year-old woman with a history of hepatitis C, liver cirrhosis, hepatocellular carcinoma, hypothyroidism, and peripheral neuropathy presented to our clinic with left ear pain and blisters on her lips, nose, and mouth. On exam, the patient’s left tympanic membrane was opaque, and she had multiple 3- to 5-mm irregularly shaped ulcers on her right buccal mucosa, gingiva, and lips. She was given a diagnosis of acute otitis media and prescribed a course of amoxicillin. The physician, who was uncertain about the cause of her gingivostomatitis, took a “shotgun approach” and prescribed a nystatin/diphenhydramine/lidocaine mouthwash.
Three weeks later, the patient returned complaining of cloudy urine, dysuria, fever, vomiting, and “pink eye.” On exam, her right eye was mildly injected with no drainage. She had normal eye movements and no ophthalmoplegia. We diagnosed viral (vs allergic) conjunctivitis and pyelonephritis in this patient and advised her to use lubricant eyedrops and an oral antihistamine for the eye. We also started her on cefpodoxime (200 mg bid for 10 days) for pyelonephritis.
Three days later, the patient called our clinic and said that her right eye was not improving. We prescribed ofloxacin ophthalmic drops, 1 to 2 drops every 6 hours, for presumed bacterial conjunctivitis.
Four days later, she returned to our clinic; she had been using the ofloxacin drops and antihistamine but was experiencing worsening symptoms, including itching of her right eye, associated blurriness, and decreased vision. She had been using a warm compress on the eye and found that it was getting sticky and crusted. A gray corneal opacity was seen on physical exam, and a fluorescein exam was performed (FIGURE).
WHAT IS YOUR DIAGNOSIS?
HOW WOULD YOU TREAT THIS PATIENT?
Diagnosis: Herpes simplex virus keratitis
The patient was sent to the ophthalmology clinic, where a slit-lamp examination of the right eye showed 3+ injection, large dendritic epithelial defects spanning the majority of the cornea (with 10% haze), and trace nuclear sclerosis of the lens. These findings were consistent with a diagnosis of herpes simplex virus (HSV) keratitis, with a likely neurotrophic component (decreased sensation of the affected eye compared with that of the other eye). There was no evidence of secondary infection.
Discussion
The global incidence of HSV keratitis is approximately 1.5 million, including 40,000 new cases of monocular visual impairment or blindness each year.1 Primary infection with HSV-1 occurs following direct contact with infected mucosa or skin surfaces and inoculation. (Our patient likely transferred the infection by touching her eyes after touching her nose or mouth.) The virus remains in sensory ganglia for the lifetime of the host. Most ocular disease is thought to represent recurrent HSV (rather than a primary ocular infection).2 It has been proposed that HSV-1 latency may also occur in the cornea.
The symptoms of HSV keratitis include eye pain, redness, blurred vision, tearing, discharge, and sensitivity to light.
The 4 diagnostic categories
There are 4 categories of HSV keratitis, based on the location of the infection: epithelial, stromal, endotheliitis, and neurotrophic keratopathy.
Epithelial. The most common form, epithelial HSV manifests as dendritic or geographic lesions of the cornea.3 Geographic lesions occur when a dendrite widens and assumes an amoeboid shape.
Continue to: Stromal
Stromal. Stromal involvement accounts for 20% to 25% of presentations4 and may cause significant anterior chamber inflammation. Vision loss can result from permanent stromal scarring.5
Endotheliitis. Keratic precipitates (on top of stromal and epithelial edema) and a mild-to-moderate iritis are signs of endotheliitis.5
Neurotrophic keratopathy. This form of HSV keratitis is associated with corneal hypoesthesia or complete anesthesia secondary to damage of the corneal nerves, which can occur in any form of ocular HSV. Anesthesia may lead to nonhealing corneal epithelial defects.6 These defects, which are generally oval lesions, do not represent active viral disease and are made worse by antiviral drops. These lesions may cause stromal scarring, corneal perforation, or secondary bacterial infection.
Treatment consists of supportive care using artificial tears and prophylactic antibiotic eye drops, if appropriate; more advanced ophthalmologic treatments may be needed for advanced disease.7
Continue to: Other conditions, including conjunctivitis, have similar symptoms
Other conditions, including conjunctivitis, have similar symptoms
The differential for redness of the eye includes conditions such as conjunctivitis, glaucoma, and keratitis.
Conjunctivitis of any form—bacterial, viral, allergic, or toxic—involves injection of both the palpebral and bulbar conjunctiva.
Acute angle closure glaucoma can involve symptoms of headache, malaise, nausea, and vomiting. In addition, the pupil is fixed in mid-dilation, and the cornea becomes hazy.
Anterior uveitis/iritis causes sensitivity to light in both the affected and unaffected eyes, as well as ciliary flush (a red ring around the iris). Typically, there is no eye discharge.
Bacterial keratitis causes foreign body sensation and purulent discharge. This form of keratitis usually occurs due to improper wear of contact lenses.
Continue to: Viral keratitis...
Viral keratitis is characterized by photophobia, foreign body sensation, and watery discharge. A faint branching grey opacity may be seen on penlight exam, and dendrites may be seen with fluorescein.
Scleritis involves severe, boring pain of the eye in addition to photophobia and headache. It is usually associated with systemic inflammatory disorders.
Subconjunctival hemorrhage is asymptomatic and occurs following trauma.
Cellulitis manifests following trauma with a deep violet color and marked edema.
Continue to: Standard Tx
Standard Tx: Antiviral medications
Topical antiviral therapy is the standard treatment for epithelial HSV keratitis, although oral antiviral medications are equally effective. A randomized trial found that using an oral agent in addition to a topical antiviral did not improve outcomes.8 A 2015 systematic review found that topical antivirals acyclovir, ganciclovir, brivudine, trifluridine were equally effective in treatment outcome; 90% of patients healed within 2 weeks.9
Recurrent ocular HSV-1 infections are treated in the same way as the initial infection. Recurrent infection can be prevented with daily suppressive therapy. In one study, patients who took suppressive therapy (acyclovir 400 mg bid) for 1 year had 19% recurrence of ocular infection vs 32% in the placebo group.10
Prompt Tx is key. If the infection is superficial—involving only the outer layer of the cornea (epithelium)—the eye should heal without scarring with proper treatment. However, if the infection is not promptly treated or if deeper layers are involved, scarring of the cornea may occur. This can lead to vision loss or blindness.
Continue to: A missed opportunity for an earlier diagnosis
A missed opportunity for an earlier diagnosis
This case highlights the importance of conducting a thorough exam to identify findings that could shift the diagnosis from a simple allergic, viral, or bacterial conjunctivitis. It is always better to consider primary oral HSV infection than resort to a “shotgun approach” of treating candida and pain with an oral mixture. In this case, the ulcers and vesicles on the buccal mucosa, gingiva, and lips were a missed sign of primary HSV infection. Making this diagnosis might have prevented the ocular disease, as the treatment would have been an oral antiviral.
If conjunctivitis is refractory to usual management, the patient must be seen to rule out dangerous eye diagnoses such as HSV keratitis, preseptal or orbital cellulitis, or in the worst case, acute angle closure glaucoma. If there is uncertainty regarding diagnosis, a fluorescein exam is helpful. This simple in-office exam can facilitate a referral to Ophthalmology or the emergency department for a slit-lamp exam and appropriate therapy.
Our patient was started on valacyclovir 1 g bid, trifluridine eyedrops (5×/d), and erythromycin ophthalmic ointment (3×/d), with Ophthalmology follow-up in 1 week.
CORRESPONDENCE
John Spittler, MD, 3055 Roslyn St, Suite 100, Denver, CO 80238; [email protected]
1. Farooq AV, Shukla D. Herpes simplex epithelial and stromal keratitis: an epidemiologic update. Surv Ophthalmol. 2012;57:448-462.
2. Holland EJ, Mahanti RL, Belongia EA, et al. Ocular involvement in an outbreak of herpes gladiatorum. Am J Ophthalmol. 1992;114:680-684.
3. Cook SD. Herpes simplex virus in the eye. Br J Ophthalmol. 1992;76:365-366.
4. Liesegang TJ. Herpes simplex virus epidemiology and ocular importance. Cornea. 2001;20:1-13.
5. Sekar Babu M, Balammal G, Sangeetha G, et al. A review on viral keratitis caused by herpes simplex virus. J Sci. 2011;1:1-10.
6. Hamrah P, Cruzat A, Dastjerdi MH, et al. Corneal sensation and subbasal nerve alterations in patients with herpes simplex keratitis: an in vivo confocal microscopy study. Ophthalmology. 2010;117:1930-1936.
7. Bonini S, Rama P, Olzi D, et al. Neurotrophic keratitis. Eye. 2003;17:989-995.
8. Szentmáry N, Módis L, Imre L, et al. Diagnostics and treatment of infectious keratitis. Orv Hetil. 2017;158:1203-1212.
9. Wilhelmus KR. Antiviral treatment and other therapeutic interventions for herpes simplex virus epithelial keratitis. Cochrane Database Syst Rev. 2015;(1):CD002898.
10. Herpetic Eye Disease Study Group. Acyclovir for the prevention of recurrent herpes simplex virus eye disease. N Engl J Med. 1998;339:300-306.
