User login
Cannabis withdrawal syndrome real but underrecognized
SAN FRANCISCO – Marijuana withdrawal syndrome is real, and physicians and patients should recognize the phenomenon and take it seriously as legalization rolls out across the United States, an investigation from Columbia University in New York suggests,
“Most clinicians don’t really believe there is a withdrawal syndrome, but there definitely is. The prevalence we found was 12% among frequent cannabis users,” meaning three or more times a week, said psychiatrist and lead investigator Ofir Livne, MD, who until recently was a research fellow at Columbia but now is affiliated with Tel Aviv University in Israel (Drug Alcohol Depend. 2019 Feb 1;195:170-7).
“Usually what happens is a cannabis user will feel a bit agitated, and they’ll take another joint without even realizing they are just perpetuating the addiction.”
Dr. Livne said the syndrome is seen with other substances but is underrecognized with cannabis. “The word needs to get out more,” he said at the annual meeting of the American Psychiatric Association.
The symptoms can last for several days – or longer.
To get an idea of the extent of the problem, he and his team analyzed data from the National Epidemiologic Survey on Alcohol and Related Conditions-III. The survey collected data on more than 36,000 adults about drug use, associated effects, and other issues in 2012-13.
The investigators focused on the 1,527 people who reported frequent use in the preceding 12 months, and looked to see whether the symptoms they reported when they stopped or cut back would qualify them for cannabis withdrawal syndrome (CWS) in the DSM-5, the first edition of the manual to include the diagnosis.
Overall, 12.1% made the cut. The most common symptoms were nervousness/anxiety (76%), irritability (72%), sleep difficulty (68%), and depressed mood (59%). CWS patients also had lower health-related quality of life scores than peers without CWS.
Physical symptoms associated with CWS included headache, tremors, and sweating, among others. Overall, 70% of people reported some sort of physical discomfort associated with withdrawal.
“We also saw that frequent cannabis users who experience withdrawal are a lot more prone to other psychiatric disorders,” Dr. Livne said, including mood disorders (adjusted odds ratio, 1.9-2.6), anxiety disorders (aOR, 2.4-2.5), and personality disorders (aOR, 1.7-2.2). They more often had a family history of depression (aOR, 2.5).
“This study provides the first nationally representative large-scale report on the DSM-5 cannabis withdrawal syndrome. ... Its shared symptoms with depressive and anxiety disorders call for clinician awareness of CWS and the factors associated with it,” Dr. Livne and his colleagues concluded.
The work was adjusted for social demographics and other confounders, including tobacco withdrawal, which has overlapping symptoms.
It’s possible that in some cases, the survey simply caught a return of the anxiety and other issues that caused people to use in the first place, instead of true withdrawal, but Dr. Livne didn’t think so. “Some of them might have been prone to anxiety, but we controlled for that as much as we could,” he said.
The work was funded by the National Institute on Drug Abuse. Dr. Livne had no disclosures.
REPORTING FROM APA 2019

Sexual harassment: Prevention and defense
Unless you have been vacationing on some distant astral plane, you are well aware that sexual misconduct and harassment have dominated news coverage and social media forums over the past year or more. It has ended the careers of a number of formerly respectable celebrities, and the #MeToo movement has empowered many additional harassment victims to come forward with their stories.

Medical offices are far from immune from harassment, of course, and the problem is not limited to staff interactions. According to a Medscape poll, 27% of physicians have been targets of inappropriate behavior in a professional setting. In another poll, 47% of physicians and 71% of nurses reported being harassed (by stalking, persistent attempts at communication, or inappropriate social media contact) by a patient.
The reality is that , have an ethical and legal responsibility to provide a safe and respectful work environment for everyone involved.
The first step in meeting that responsibility is to develop a written policy, if you don’t already have one, starting with a clear definition of sexual harassment. The Equal Employment Opportunity Commission (EEOC) has a good summary on its website of what does and does not constitute harassment, and under what conditions employers may be liable. Once the problem has been defined, a good written policy will provide specific methods for reporting transgressions, along with outlines of investigative and corrective measures to be taken in response. Templates for such documents are available on many websites, if you don’t want to start from scratch.
The next step, once a written policy is in place (and vetted by your attorney), is training for your staff. In particular, you should ensure that those in supervisory roles understand their specific responsibilities, and that everyone knows how to report an incident.
Harassment prevention training is already mandated by law in some states, including New York, California (if you have five or more employees), Maine, Delaware, and Connecticut. Other states, such as Colorado, Florida, Massachusetts, Michigan, Oklahoma, Rhode Island, Tennessee, Utah, and Vermont, have laws that “encourage” employers to provide such training. Other legislation is pending; check for new laws in your state on a regular basis.
Federal EEOC guidelines suggest that all employers “conduct and reinforce” harassment prevention training, whether laws in your particular state require it or not. On a practical level, recent court decisions suggest that offices that do not train their employees may find it difficult to mount an effective defense of a harassment lawsuit, even when they have a written policy in place. They may also be more vulnerable to punitive damage awards.
OSHA and various private companies offer a variety of downloadable training videos at reasonable cost. (As always, I have no financial interest in any product or service mentioned here.)
Misconduct among office staff is a straightforward, zero-tolerance issue. Harassment by patients is more complex, and dealing with it often requires some creativity. No one in your office, however, should think it is something they must accept because it comes from a patient. Any physician or staffer should be empowered to speak up if anyone else’s behavior, including a patient’s, makes them uncomfortable. Even when there is a medical explanation – such as psychiatric or cognitive impairment – it is important (and in some states, mandatory) to call out the behavior and report the incident.
Once reported, it should be documented, so that colleagues and other providers will be aware of the problem, and to protect yourself should the patient ever make false accusations against your practice. At subsequent appointments, take common-sense precautions. Chaperones are always a good idea, but especially so in these situations.
With repeat offenders, everyone has their own barometer of what they can and cannot tolerate. My personal threshold is low; I give one polite warning, explaining that we must provide a respectful and welcoming environment for everyone in the office, and any unacceptable behavior in the future will be grounds for dismissal from my practice. Most get the message; those who don’t are dismissed, politely.

The central point is to prevent harassment whenever possible, and to take every complaint seriously and address it promptly. An effective misconduct policy goes beyond simply avoiding legal liability. Patients and staffers alike should be secure in the knowledge that inappropriate verbal or physical interactions are not acceptable in your office under any circumstances, and will not be ignored or tolerated.
Dr. Eastern practices dermatology and dermatologic surgery in Belleville, N.J. He is the author of numerous articles and textbook chapters, and is a longtime monthly columnist for Dermatology News. Write to him at [email protected] .
Unless you have been vacationing on some distant astral plane, you are well aware that sexual misconduct and harassment have dominated news coverage and social media forums over the past year or more. It has ended the careers of a number of formerly respectable celebrities, and the #MeToo movement has empowered many additional harassment victims to come forward with their stories.
Medical offices are far from immune from harassment, of course, and the problem is not limited to staff interactions. According to a Medscape poll, 27% of physicians have been targets of inappropriate behavior in a professional setting. In another poll, 47% of physicians and 71% of nurses reported being harassed (by stalking, persistent attempts at communication, or inappropriate social media contact) by a patient.
The reality is that , have an ethical and legal responsibility to provide a safe and respectful work environment for everyone involved.
The first step in meeting that responsibility is to develop a written policy, if you don’t already have one, starting with a clear definition of sexual harassment. The Equal Employment Opportunity Commission (EEOC) has a good summary on its website of what does and does not constitute harassment, and under what conditions employers may be liable. Once the problem has been defined, a good written policy will provide specific methods for reporting transgressions, along with outlines of investigative and corrective measures to be taken in response. Templates for such documents are available on many websites, if you don’t want to start from scratch.
The next step, once a written policy is in place (and vetted by your attorney), is training for your staff. In particular, you should ensure that those in supervisory roles understand their specific responsibilities, and that everyone knows how to report an incident.
Harassment prevention training is already mandated by law in some states, including New York, California (if you have five or more employees), Maine, Delaware, and Connecticut. Other states, such as Colorado, Florida, Massachusetts, Michigan, Oklahoma, Rhode Island, Tennessee, Utah, and Vermont, have laws that “encourage” employers to provide such training. Other legislation is pending; check for new laws in your state on a regular basis.
Federal EEOC guidelines suggest that all employers “conduct and reinforce” harassment prevention training, whether laws in your particular state require it or not. On a practical level, recent court decisions suggest that offices that do not train their employees may find it difficult to mount an effective defense of a harassment lawsuit, even when they have a written policy in place. They may also be more vulnerable to punitive damage awards.
OSHA and various private companies offer a variety of downloadable training videos at reasonable cost. (As always, I have no financial interest in any product or service mentioned here.)
Misconduct among office staff is a straightforward, zero-tolerance issue. Harassment by patients is more complex, and dealing with it often requires some creativity. No one in your office, however, should think it is something they must accept because it comes from a patient. Any physician or staffer should be empowered to speak up if anyone else’s behavior, including a patient’s, makes them uncomfortable. Even when there is a medical explanation – such as psychiatric or cognitive impairment – it is important (and in some states, mandatory) to call out the behavior and report the incident.
Once reported, it should be documented, so that colleagues and other providers will be aware of the problem, and to protect yourself should the patient ever make false accusations against your practice. At subsequent appointments, take common-sense precautions. Chaperones are always a good idea, but especially so in these situations.
With repeat offenders, everyone has their own barometer of what they can and cannot tolerate. My personal threshold is low; I give one polite warning, explaining that we must provide a respectful and welcoming environment for everyone in the office, and any unacceptable behavior in the future will be grounds for dismissal from my practice. Most get the message; those who don’t are dismissed, politely.
The central point is to prevent harassment whenever possible, and to take every complaint seriously and address it promptly. An effective misconduct policy goes beyond simply avoiding legal liability. Patients and staffers alike should be secure in the knowledge that inappropriate verbal or physical interactions are not acceptable in your office under any circumstances, and will not be ignored or tolerated.
Dr. Eastern practices dermatology and dermatologic surgery in Belleville, N.J. He is the author of numerous articles and textbook chapters, and is a longtime monthly columnist for Dermatology News. Write to him at [email protected] .

Response endures in cemiplimab-treated patients with cutaneous SCC
MILAN – In an updated analysis of a pivotal phase 2 study, Michael R. Migden, MD, said at the World Congress of Dermatology.
Median duration of response was not reached at the time of the analysis, with probability of no progression or death above 80% at the 20-month mark, according to Dr. Migden, of the department of dermatology at the University of Texas MD Anderson Cancer Center, Houston.
The safety profile of cemiplimab in this study was comparable with what has been reported for other anti–programmed death agents, he said in an oral presentation at the meeting.
While the median time to response was less than 2 months, about one-fifth of patients with locally advanced disease had “unconventional” late responses, occurring up to 10 months after starting treatment, Dr. Migden said. “If you’re just putting someone on some agent like this for a few months, and say, ‘well, I don’t see anything improving,’ it could be one of these patients in this 20% that deserve a little bit longer therapy.”
Cemiplimab (Libtayo) is the only Food and Drug Administration–approved treatment for patients with locally advanced or metastatic cutaneous squamous cell carcinoma (CSCC) who are not suitable for curative surgery or radiation, Dr. Migden said in his presentation. That approval was based in part on previously reported results from the phase 2 study, known as EMPOWER-CSCC-1, which demonstrated that cemiplimab had substantial antitumor activity and durable responses.
In this update on EMPOWER-CSCC-1, Dr. Migden described results for 78 patients with locally advanced CSCC and 59 with metastatic CSCC who received weight-based intravenous cemiplimab for up to 96 weeks, with optional retreatment for those who had disease progression during the follow-up period. This was an older population, with a mean age of 72 years, and more than 80% were male. About one-third had prior systemic therapy, and the majority had prior cancer-related radiotherapy and surgery.
The objective response rate was 43.6% in the locally advanced group and 49.2% in the metastatic group; this numerical difference of less than 3 percentage points was not statistically significant, according to Dr. Migden.
More importantly, he said, the disease control rate (responses, stable disease, and noncomplete response/nonprogressive disease) was 79.5% in the locally advanced group and 71.2% in the metastatic group.
Time to response was “quite rapid” at a median of 1.9 months in both groups, though 7 of the 34 responders in the locally advanced group had unconventional late responses, taking 6-10 months to get to the point of response, Dr. Migden said.
The probability of being event free (such as no progression or death) has remained relatively flat, he added. In the metastatic cohort, event-free probability was 96.4% at 6 months, 88.9% at 12 months, and 82.5% at 20 months, with a 16.5-month median duration of follow-up, while in the locally advanced cohort, the event-free probability was 96.2% at 6 months, 87.8% at both 12 months and 20 months, with a median follow-up of 9.3 months.
Serious treatment-emergent adverse events were reported for 28.5% in these patients, though Dr. Migden noted that treatment emergent does not necessarily mean related to the study drug. Immune-related adverse events of grade 3 or greater were seen in 11.7% of patients, and adverse events leading to discontinuation were reported for 8.8%.
Dr. Migden reported disclosures related to Regeneron, Novartis, Genentech, Eli Lilly, and Sun Pharmaceutical.
REPORTING FROM WCD2019
Visual examinations yield signs to guide vitiligo treatment
MILAN – Subtle signs beyond depigmentation alone can guide management of vitiligo, Michelle Rodrigues, MBBS, said at the World Congress of Dermatology.

Signs of high disease activity can be visually observed and, when found, can compel urgent treatment, Dr. Rodrigues said. “If we identify and understand these [signs, they] can change our management plan, and the patient’s outcomes ... picking these up quickly, getting the best response you can, can help our patients tremendously.”
To assess clinical signs of severity in vitiligo, “use the tools that you have in your practice – your dermatoscope, your Wood’s lamp.”
Showing an image of the leg of a patient with vitiligo, Dr. Rodrigues said, “I know this patient’s vitiligo is very, very active. Why?” Clues come when there are areas of hypopigmentation at the rim of lesions, with depigmentation at the center. The presence of pigmentation, hypopigmentation, and depigmentation within the same lesion indicates high disease activity. This finding is the trichrome sign, also called the “blurry borders” sign in some regions, said Dr. Rodrigues, a dermatologist in Melbourne and the founder of Chroma Dermatology, which specializes in treating pigment problems and diagnosing and managing skin conditions in patients with skin of color.
Next, Dr. Rodrigues said, look at hair growth within the vitiliginous area. “If you’re unable to see that clinically, it’s really important to get that dermatoscope onto the patient, and look within a patch, to see whether or not you can actually see white hairs or normal colored hairs,” she said. This finding will help to determine both treatment plan and prognosis, since leukotrichia is a marker of disease severity in vitiligo.
Be alert to Koebnerization, said Dr. Rodrigues; the presentation may be subtle. As an example, she shared an image of a patient with depigmented patches on the dorsum of each foot. It wasn’t until the patient removed her foot gear – rubber slide-type sandals with a single broad strap over the dorsum – that Dr. Rodrigues recognized that “there was clear Koebnerization from the constant friction as a result of the wearing of the shoes.
“This can also be seen when patients scratch themselves, as can be seen with the itch that vitiligo can sometimes cause,” she said.
She noted that about 10% of patients with vitiligo have pruritus as a prominent symptom. Here, she said, is where a Wood’s lamp can be helpful as well. “Sometimes we can’t appreciate the very, very subtle Koebnerization, especially in patients with lighter skin. Getting out that Wood’s lamp and looking at other areas of involvement is really important,” she said. Areas of high disease activity and signs of progression that might otherwise be missed will be more obvious under the ultraviolet light.
It’s important to look beyond the obvious patches of vitiligo to examine the surrounding skin. Searching for “confetti depigmentation” – tiny white dots of depigmentation scattered over the otherwise normally pigmented skin – also marks high disease activity. An area with these dots – each often only a few millimeters in diameter – is likely destined for rapid depigmentation unless aggressive treatment is started. “We know that without treating these areas there will be very, very rapid and aggressive depigmentation. And remember that in areas that have a paucity of hair follicles, it might be irreversible ... so recognizing these signs is absolutely critical.”
The final clue to highly active disease that’s likely to move quickly without intervention can be found at the border of a vitiligo lesion. Look for a fine rim of erythema and some scale, Dr. Rodrigues said. This sign is common, and often seen early in the disease course. When this erythematous region is biopsied, ”You’ll see an intense inflammatory response, with an interface dermatitis. Again, this tells us that the patient may have a poorer prognosis if we don’t commence treatment early on.”
As a final clinical tip, Dr. Rodrigues reminded attendees that when one sign of disease activity is seen, others are often present. A thorough clinical examination is needed to document aggressive disease. “Please make sure that if you find one, you’re looking for other signs of disease severity as well.”
Dr. Rodrigues reported that she had no disclosures relevant to her presentation.
MILAN – Subtle signs beyond depigmentation alone can guide management of vitiligo, Michelle Rodrigues, MBBS, said at the World Congress of Dermatology.
Signs of high disease activity can be visually observed and, when found, can compel urgent treatment, Dr. Rodrigues said. “If we identify and understand these [signs, they] can change our management plan, and the patient’s outcomes ... picking these up quickly, getting the best response you can, can help our patients tremendously.”
To assess clinical signs of severity in vitiligo, “use the tools that you have in your practice – your dermatoscope, your Wood’s lamp.”
Showing an image of the leg of a patient with vitiligo, Dr. Rodrigues said, “I know this patient’s vitiligo is very, very active. Why?” Clues come when there are areas of hypopigmentation at the rim of lesions, with depigmentation at the center. The presence of pigmentation, hypopigmentation, and depigmentation within the same lesion indicates high disease activity. This finding is the trichrome sign, also called the “blurry borders” sign in some regions, said Dr. Rodrigues, a dermatologist in Melbourne and the founder of Chroma Dermatology, which specializes in treating pigment problems and diagnosing and managing skin conditions in patients with skin of color.
Next, Dr. Rodrigues said, look at hair growth within the vitiliginous area. “If you’re unable to see that clinically, it’s really important to get that dermatoscope onto the patient, and look within a patch, to see whether or not you can actually see white hairs or normal colored hairs,” she said. This finding will help to determine both treatment plan and prognosis, since leukotrichia is a marker of disease severity in vitiligo.
Be alert to Koebnerization, said Dr. Rodrigues; the presentation may be subtle. As an example, she shared an image of a patient with depigmented patches on the dorsum of each foot. It wasn’t until the patient removed her foot gear – rubber slide-type sandals with a single broad strap over the dorsum – that Dr. Rodrigues recognized that “there was clear Koebnerization from the constant friction as a result of the wearing of the shoes.
“This can also be seen when patients scratch themselves, as can be seen with the itch that vitiligo can sometimes cause,” she said.
She noted that about 10% of patients with vitiligo have pruritus as a prominent symptom. Here, she said, is where a Wood’s lamp can be helpful as well. “Sometimes we can’t appreciate the very, very subtle Koebnerization, especially in patients with lighter skin. Getting out that Wood’s lamp and looking at other areas of involvement is really important,” she said. Areas of high disease activity and signs of progression that might otherwise be missed will be more obvious under the ultraviolet light.
It’s important to look beyond the obvious patches of vitiligo to examine the surrounding skin. Searching for “confetti depigmentation” – tiny white dots of depigmentation scattered over the otherwise normally pigmented skin – also marks high disease activity. An area with these dots – each often only a few millimeters in diameter – is likely destined for rapid depigmentation unless aggressive treatment is started. “We know that without treating these areas there will be very, very rapid and aggressive depigmentation. And remember that in areas that have a paucity of hair follicles, it might be irreversible ... so recognizing these signs is absolutely critical.”
The final clue to highly active disease that’s likely to move quickly without intervention can be found at the border of a vitiligo lesion. Look for a fine rim of erythema and some scale, Dr. Rodrigues said. This sign is common, and often seen early in the disease course. When this erythematous region is biopsied, ”You’ll see an intense inflammatory response, with an interface dermatitis. Again, this tells us that the patient may have a poorer prognosis if we don’t commence treatment early on.”
As a final clinical tip, Dr. Rodrigues reminded attendees that when one sign of disease activity is seen, others are often present. A thorough clinical examination is needed to document aggressive disease. “Please make sure that if you find one, you’re looking for other signs of disease severity as well.”
Dr. Rodrigues reported that she had no disclosures relevant to her presentation.
EXPERT ANALYSIS FROM WCD2019
Skin plus GI adverse events with checkpoint inhibitors linked to risk of additional adverse events
MILAN – Patients on checkpoint inhibitors who experience both dermatologic and gastrointestinal side effects may be at increased risk of further immune-related adverse events, even though they may have better odds of a favorable outcome on the cancer treatment, results of a study presented at the World Congress of Dermatology suggest.
The co-occurrence of dermatologic and gastrointestinal immune-related adverse events (irAEs), which was usually seen early in the course of treatment, was independently associated with favorable progression-free and overall survival in this study, said Gabriel E. Molina, a medical student at Harvard Medical School, Boston.
Compared with patients with colitis alone, those patients who had both immune checkpoint inhibitor-induced rash and colitis were at significantly increased risk of additional irAEs affecting other organ systems, according to Mr. Molina. As a result, patients with both dermatologic and gastrointestinal irAEs may warrant earlier or closer monitoring, and need prompt referral to specialty care at first sign of emerging toxicity.
“We are really excited by the possibility that this co-occurrence of rash and colitis may be a unique and early clinical marker of both high-risk irAE patients and favorable treatment response,” Mr. Molina said.
The single-center, retrospective cohort study reported by Mr. Molina included 67 patients treated with immune checkpoint inhibitors who subsequently developed colitis. Of that group, 28 (or about 42%) also had a rash induced by that treatment.
The median time from starting treatment to onset of rash was 32.5 days, according to this report. Median onset of gastrointestinal toxicity was roughly similar between the patients who also had rash, at 73 days, as compared with patients who did not have rash, at 64 days. Most rashes were grade 1-2 in severity, and were treated with topical corticosteroids in 50% of cases or with nothing at all in 43%, according to the report.
The odds of developing an additional irAE such as hepatitis or hypophysitis was 18.5 times higher in the patients who had rash and colitis as compared with those with colitis only, the researchers also found.
In multivariate analysis, the patients with both rash and colitis had longer progression-free survival (hazard ratio, 0.37; 95% confidence interval, 0.17-0.80; P = .012) and overall survival (HR, 0.20; 95% CI, 0.05-0.83; P = .026), as compared with those with just colitis, Mr. Molina reported.
This isn’t the first study to show that the occurrence of an irAE foreshadows a better prognosis. “One promising observation that has consistently emerged in the literature is that cancer patients who develop these toxicities may actually have better oncologic outcomes than those who don’t,” Mr. Molina said.
Harvard now has a multidisciplinary group, including a dermatologist, dedicated to evaluating irAEs, he said. To date, however, a minority of patients are being referred, at which point, the dermatologic toxicity may be quite severe. “There’s this belief – which is generally true – that the rashes are mild and can be treated with topical steroids. So there’s often a delay before they see us.”
While larger studies are needed to validate the findings, just tallying up toxicities isn’t going far enough, according to the investigator.
“Our ultimate goal is to bridge the translational research gap, and to use thoughtful specimen collection to one day identify, ideally at the individualized level, the irAE risk level of the patient as soon as they start their immune checkpoint inhibitor, and then reprognosticate them each time they present with a new toxicity,” Mr. Molina said.
Mr. Molina reported no conflicts of interest.
REPORTING FROM WCD2019
EULAR issues guidelines on managing rheumatic complications of cancer immunotherapies
MADRID – EULAR has issued recommendations to help rheumatologists address the increasingly common clinical issue of diagnosing and managing rheumatic-related adverse events associated with cancer immunotherapy.

“The rheumatic adverse events associated with immunotherapy represent a spectrum of new clinical entities, and they are challenging because they can be difficult to control while attempting to preserve the antitumor effects of oncological drugs,” Marie Kostine, MD, of the Centre Universitaire Hospitalier, Bordeaux, France, explained at the European Congress of Rheumatology.
The recommendations were drawn from the deliberations of an expert task force that identified the clinical issues to address and then developed a consensus about best practice recommendations. In addition to rheumatologists with expertise in this field, the task force included oncologists, allied health personnel, and two patient representatives.
The recommendations include four overarching principles and 10 recommendations.
“One of the overarching principles regards the importance of shared decision making between rheumatologists, oncologists, and patients,” Dr. Kostine said. Because of the expertise of rheumatologists in employing immunomodulatory therapies as they pertain to inflammation of the joints, the recommendations emphasize the value of their collaboration in clinical decisions.
The recommendations address patient referral, the assessment of preexisting rheumatic conditions, diagnosis, and therapeutic strategies.
“Rheumatologists should make themselves aware of the wide spectrum of potential clinical presentations of rheumatic adverse events following the initiation of immunotherapy,” Dr. Kostine said. While rheumatoid arthritis–like symptoms are common, the immune activation produced by checkpoint inhibitors and other immunotherapies can affect nearly every organ in the body, which includes diverse involvement of joint tissues.
In addition to joint pain, which has occurred in up to 40% of patients receiving a checkpoint inhibitor in some series, rheumatology-related events can include vasculitis, systemic sclerosis, and lupus. When associated with immunotherapy, these events sometimes develop in the absence of inflammatory markers or autoantibodies.
The new consensus guidelines emphasize that glucocorticoids can be “considered” to control rheumatic-related adverse events despite their immunosuppressive effect. However, because of their potential to attenuate the benefit of immune activation for treatment of the oncologic disease, such drugs, if used, “should be tapered to the lowest effective dose.”
The consensus recommendations were based on an extensive literature review, but Dr. Kostine acknowledged that prospective studies regarding the best practices for managing rheumatic-related adverse events of immunotherapies remain limited. She suggested that this knowledge gap was one reason for creating an expert task force.
“There has been an immunotherapy revolution, such that rheumatologists who have not yet seen these adverse events soon will,” said Dr. Kostine, noting that the number of approved immunotherapies and their clinical indications have been increasing rapidly.
The EULAR recommendations were created specifically for rheumatologists. In addition to guiding them toward best practice, the report from the task force provides background on the clinical issues raised by therapies that cause inflammatory side effects while stimulating immune function to treat malignancy.
MADRID – EULAR has issued recommendations to help rheumatologists address the increasingly common clinical issue of diagnosing and managing rheumatic-related adverse events associated with cancer immunotherapy.
“The rheumatic adverse events associated with immunotherapy represent a spectrum of new clinical entities, and they are challenging because they can be difficult to control while attempting to preserve the antitumor effects of oncological drugs,” Marie Kostine, MD, of the Centre Universitaire Hospitalier, Bordeaux, France, explained at the European Congress of Rheumatology.
The recommendations were drawn from the deliberations of an expert task force that identified the clinical issues to address and then developed a consensus about best practice recommendations. In addition to rheumatologists with expertise in this field, the task force included oncologists, allied health personnel, and two patient representatives.
The recommendations include four overarching principles and 10 recommendations.
“One of the overarching principles regards the importance of shared decision making between rheumatologists, oncologists, and patients,” Dr. Kostine said. Because of the expertise of rheumatologists in employing immunomodulatory therapies as they pertain to inflammation of the joints, the recommendations emphasize the value of their collaboration in clinical decisions.
The recommendations address patient referral, the assessment of preexisting rheumatic conditions, diagnosis, and therapeutic strategies.
“Rheumatologists should make themselves aware of the wide spectrum of potential clinical presentations of rheumatic adverse events following the initiation of immunotherapy,” Dr. Kostine said. While rheumatoid arthritis–like symptoms are common, the immune activation produced by checkpoint inhibitors and other immunotherapies can affect nearly every organ in the body, which includes diverse involvement of joint tissues.
In addition to joint pain, which has occurred in up to 40% of patients receiving a checkpoint inhibitor in some series, rheumatology-related events can include vasculitis, systemic sclerosis, and lupus. When associated with immunotherapy, these events sometimes develop in the absence of inflammatory markers or autoantibodies.
The new consensus guidelines emphasize that glucocorticoids can be “considered” to control rheumatic-related adverse events despite their immunosuppressive effect. However, because of their potential to attenuate the benefit of immune activation for treatment of the oncologic disease, such drugs, if used, “should be tapered to the lowest effective dose.”
The consensus recommendations were based on an extensive literature review, but Dr. Kostine acknowledged that prospective studies regarding the best practices for managing rheumatic-related adverse events of immunotherapies remain limited. She suggested that this knowledge gap was one reason for creating an expert task force.
“There has been an immunotherapy revolution, such that rheumatologists who have not yet seen these adverse events soon will,” said Dr. Kostine, noting that the number of approved immunotherapies and their clinical indications have been increasing rapidly.
The EULAR recommendations were created specifically for rheumatologists. In addition to guiding them toward best practice, the report from the task force provides background on the clinical issues raised by therapies that cause inflammatory side effects while stimulating immune function to treat malignancy.
REPORTING FROM EULAR 2019 CONGRESS
HM19: One chapter’s experience
The Society of Hospital Medicine is an organization vested in improving the quality of inpatient medicine by empowering its members with education and providing venues for professional development including networking, advocacy, and leadership advancement. Every year, SHM holds a national conference which is a focused meeting point for over 5,000 hospitalists.
SHM hosts more than 50 local chapters nationwide to increase networking, education, and collaboration within the hospital medicine community. The Wiregrass chapter of SHM is based in the southeast corner of Alabama, covering the counties of lower Alabama and the panhandle of Florida. This year we were recognized as a platinum status chapter, which is the highest status, based on our work and participation to improve the quality of inpatient medicine.
As part of winning the platinum ribbon, we were awarded three complimentary registration scholarships to the SHM Annual Conference in 2019. The chapter leadership met and selected three individuals who have been involved with the chapter actively but have never had an opportunity to experience SHM’s Annual Conference. We selected a first-year resident, Dr. Avani Parrekh; a hospital medicine nurse practitioner, Madison Rivenbark; and a fourth-year medical student who is about to start his internal medicine residency, William Bancroft.
After the meeting we interviewed them to better understand their experience. Below are their thoughts.
Avani Parekh, MD
First year, Internal Medicine Residency
Southeast Health Medical Center
Dothan, Ala.

I am so thankful for the opportunity that was given to me by the Wiregrass chapter by sponsoring my attendance at the 2019 SHM Annual Conference in Washington. This was my first SHM conference, and it was truly a rewarding experience.
I thoroughly enjoyed attending the lectures. They were very informative and engaging. Every presenter was so passionate and inspiring. Coming from an “all-female class” of PGY-1 at my program, I especially enjoyed the “Fe(male) in medicine” talk, as well as Quick Talks on women in medicine. The “Updates in Hospital Medicine” session on various topics such as heart failure, pneumonia, and sepsis was outstanding. I was excited to apply the knowledge I gained from this event into my patient care.
Overall, it was a well-organized and up-to-date event. I am looking forward to attending more SHM conferences in the future.
Madison Rivenbark, NP
Department of Hospital Medicine
Southeast Health Medical Center
Dothan, Ala.

I was extremely fortunate to be selected to receive a scholarship that covered the conference fee for the 2019 SHM Annual Conference. This was my first SHM conference, and it was quite the learning experience. I enjoyed each educational session that I attended. I felt like I was able to bring something home with me that I can incorporate into my practice to better care for the patients that I see each day.
As mentioned above, I learned from each session, but my personal favorite was the “Updates in Hospital Medicine” session. I was very impressed by the enthusiasm of the two speakers. The information provided was presented so that it engaged each attendee.
Not only did I learn a wealth of valuable information that will help me in my career, I gained affirmation concerning my future educational endeavors. I was inspired to pursue a higher level of learning regarding my career. I witnessed this awesome organization that is filled with encouraging and motivating people, and I realized I wanted to be more involved on a local level, and maybe one day, on a larger level. In addition, this conference inspired me to continue to be a lifetime learner and to always crave more knowledge. I am blessed to be a part of hospital medicine. I look forward to the future of this specialty.
William Bancroft, MS IV
Alabama College of Osteopathic Medicine
Dothan, Ala.

I was honored to have been chosen by the Wiregrass chapter as the medical student representative for the SHM Annual Conference. I have been serving in the local chapter during both my 3rd and 4th years in different roles, from helping as a student liaison for our medical students to executive planning coordinator for events. It was a surprise when I got asked by the chapter to be their student representative, but one that I was very excited to accept.
This was my first medical conference. I had heard about what different conferences were like from many of my attendings, so I had some expectations, but this experience was so much better. I enjoyed meeting and networking with people. I also found myself eagerly waiting to get to the next lecture because I was getting an opportunity to hear about different case studies, new research outcomes, and new standards of care.
It was a real treat to learn about all the new changes to treatment, but even more encouraging to know that most of it was just reinforcing everything my attendings have been teaching us as medical students. I enjoyed my time at the SHM Annual Conference so much that I emailed all my new coresidents and encouraged them to join the Society.
Dr. Skandhan is a hospitalist at Southeast Health Medical Center in Dothan, Ala., as well as president and founder of the Wiregrass chapter of SHM.
The Society of Hospital Medicine is an organization vested in improving the quality of inpatient medicine by empowering its members with education and providing venues for professional development including networking, advocacy, and leadership advancement. Every year, SHM holds a national conference which is a focused meeting point for over 5,000 hospitalists.
SHM hosts more than 50 local chapters nationwide to increase networking, education, and collaboration within the hospital medicine community. The Wiregrass chapter of SHM is based in the southeast corner of Alabama, covering the counties of lower Alabama and the panhandle of Florida. This year we were recognized as a platinum status chapter, which is the highest status, based on our work and participation to improve the quality of inpatient medicine.
As part of winning the platinum ribbon, we were awarded three complimentary registration scholarships to the SHM Annual Conference in 2019. The chapter leadership met and selected three individuals who have been involved with the chapter actively but have never had an opportunity to experience SHM’s Annual Conference. We selected a first-year resident, Dr. Avani Parrekh; a hospital medicine nurse practitioner, Madison Rivenbark; and a fourth-year medical student who is about to start his internal medicine residency, William Bancroft.
After the meeting we interviewed them to better understand their experience. Below are their thoughts.
Avani Parekh, MD
First year, Internal Medicine Residency
Southeast Health Medical Center
Dothan, Ala.
I am so thankful for the opportunity that was given to me by the Wiregrass chapter by sponsoring my attendance at the 2019 SHM Annual Conference in Washington. This was my first SHM conference, and it was truly a rewarding experience.
I thoroughly enjoyed attending the lectures. They were very informative and engaging. Every presenter was so passionate and inspiring. Coming from an “all-female class” of PGY-1 at my program, I especially enjoyed the “Fe(male) in medicine” talk, as well as Quick Talks on women in medicine. The “Updates in Hospital Medicine” session on various topics such as heart failure, pneumonia, and sepsis was outstanding. I was excited to apply the knowledge I gained from this event into my patient care.
Overall, it was a well-organized and up-to-date event. I am looking forward to attending more SHM conferences in the future.
Madison Rivenbark, NP
Department of Hospital Medicine
Southeast Health Medical Center
Dothan, Ala.
I was extremely fortunate to be selected to receive a scholarship that covered the conference fee for the 2019 SHM Annual Conference. This was my first SHM conference, and it was quite the learning experience. I enjoyed each educational session that I attended. I felt like I was able to bring something home with me that I can incorporate into my practice to better care for the patients that I see each day.
As mentioned above, I learned from each session, but my personal favorite was the “Updates in Hospital Medicine” session. I was very impressed by the enthusiasm of the two speakers. The information provided was presented so that it engaged each attendee.
Not only did I learn a wealth of valuable information that will help me in my career, I gained affirmation concerning my future educational endeavors. I was inspired to pursue a higher level of learning regarding my career. I witnessed this awesome organization that is filled with encouraging and motivating people, and I realized I wanted to be more involved on a local level, and maybe one day, on a larger level. In addition, this conference inspired me to continue to be a lifetime learner and to always crave more knowledge. I am blessed to be a part of hospital medicine. I look forward to the future of this specialty.
William Bancroft, MS IV
Alabama College of Osteopathic Medicine
Dothan, Ala.
I was honored to have been chosen by the Wiregrass chapter as the medical student representative for the SHM Annual Conference. I have been serving in the local chapter during both my 3rd and 4th years in different roles, from helping as a student liaison for our medical students to executive planning coordinator for events. It was a surprise when I got asked by the chapter to be their student representative, but one that I was very excited to accept.
This was my first medical conference. I had heard about what different conferences were like from many of my attendings, so I had some expectations, but this experience was so much better. I enjoyed meeting and networking with people. I also found myself eagerly waiting to get to the next lecture because I was getting an opportunity to hear about different case studies, new research outcomes, and new standards of care.
It was a real treat to learn about all the new changes to treatment, but even more encouraging to know that most of it was just reinforcing everything my attendings have been teaching us as medical students. I enjoyed my time at the SHM Annual Conference so much that I emailed all my new coresidents and encouraged them to join the Society.
Dr. Skandhan is a hospitalist at Southeast Health Medical Center in Dothan, Ala., as well as president and founder of the Wiregrass chapter of SHM.
A “Ray of light”
Finding inspiration in our patients
I rush into the room at 4:30 p.m., hoping for a quick visit and maybe an early exit from the hospital; I had been asked to see Mr. Bryant in room 6765 with sigmoid volvulus.

“Hey, Dr. Hass, my brother!” he says with a huge smile. Somehow, he must have gotten a glimpse of me before I could see him. I peek over the nurse’s shoulder, and then I see that unforgettable smile with only a few teeth and big bright eyes. Immediately I recognize him and think, “How could I have forgotten his name? Ray – like a beam of light.” He certainly had not forgotten me.
“It’s been more than a year since I was last here,” he says proudly.
When we met during his last hospitalization, I was struck by a thought that implanted itself deep in my brain: This guy is the happiest person I have ever met. And after what must have been 18 hard months for him, he is still smiling – and more than that, he is radiating love.
The fact that he is the “happiest person” is made more remarkable by all the hardship he has endured. Ray was born with cerebral palsy and didn’t walk until he was 10. The continuous spasms in his muscles led to severe cervical disc disease. His worsening pain and weakness were missed by his health care providers until he had lost significant strength in his hands and legs. When he finally got an MRI and then emergency surgery, it was too late. He never regained the dexterity of his hands or the ability to walk. He can climb onto his scooter chair only with the help of a lift.
“Wow! How you been, Ray?”
He replies with a phrase that jumped back out from my memory as he was saying it: “I just wake up every day and think about what I can do to make people happy.”
The goosebumps rise on my arms; I remember feeling this same sense of awe the last time we met – a feeling of real spiritual love for this guy.
“Today I feel so much better, too. I want to thank y’all who helped my stomach go down. Man, it got so huge, I thought I might blow up.” One of the consequences of the nerve damage he sustained is a very slow gut that has led to a stretched-out colon. The other day, his big, floppy colon got twisted, and neither our gastroenterologist nor radiologist was able to untwist it. He still has a tube in his rectum to help decompress his bowel.
Ray fills me in on the details in the slightly strained and slurred speech that sometimes comes with cerebral palsy. As he relays his story, my mind goes to work trying to diagnosis this mysterious case of happiness. How can I not try to get to the origins of this wellspring of love? I can’t help but thinking: Was it Ray’s joy and his speech impediment that made him seem childlike, or was it some brain injury that blessedly knocked out his self-pity? I would be wallowing in self-pity if I were as gravely disabled as him.
After a moment’s reflection, I recall the research on the amazing stability of our happiness set point: Good things and bad only move our happiness for a while before we return to our innate level of happiness. I see I had likely fallen prey to a stereotype of the disabled as heroic for just being themselves. Ray’s happiness is largely because of his lack of self-absorption and his focus on service and love.
Finishing our conversation and leaving the room feeling enlivened, I realize that Ray‘s generous spirit is a gift.
That night, my heart aches. I think about the inadequate care that led to Ray’s profound loss of function, leading to a surge of anger toward our flawed health care system – one that routinely lets down the most vulnerable among us.
The next day, two sisters and an aunt join Ray in his room. They ask for hugs, and I happily supply them. “Ray told us about you,” says Sheila, one of his sisters.
“Well, we have been talking about him here at the hospital, because he brightens everyone’s day. He is truly amazing. Has Ray always been so full of love?” I say, hoping to get some insight into his remarkable spirit.
Tonya, his aunt, responds first. “We were raised that way – to look for the good and keep love in our hearts. But Ray has always been the best. He never, ever complains. He brings joy to so many people. You should see him every day out on his scooter. That’s how he got that big sore on his butt.”
Ray indeed had developed a pressure sore, one that was going to need some thoughtful, ongoing care.
“But I finally got the right kind of cushion, before it was real hard,” he says.
I move from hospitalist mode to primary care mode and ask about his home equipment and his dental care. But they all want to keep talking about love.
“If doctors showed more love and their human side, they could bring more healing,” his sister says.
After 20 minutes of chatting, I pause. It is my last day on service, I had run out of medical reason to stay and I have others to see. So, I reluctantly give my goodbye hugs and leave. At the door, I turn back around. “Hey, Ray, can I get a picture with you?”
“Yeah, I want one with you, too!”
So, not surprisingly, Ray never complains. Maybe his spinal cord injury wasn’t from negligent care. Maybe he was so accustomed to looking past discomfort and too busy with his ministry of love, it didn’t occur to him to seek care.
Still, such a tragedy that he lost so much of the little mobility he did have. But maybe not so bad. His injury brought him back in contact with me and our staff. He is still waking up trying to make people happy and I can see his efforts are working. “He made my day!” I hear from a nurse. There is a healthy buzz at the nurses’ station after visits to his room.
Before walking out the door, he gives me an awkward fist bump from the bed and says, “I want to thank y’all again for everything. And I want you to know I love you.”
I find myself tearing up. “I love you too, my brother. And I am the one who should be grateful, Ray.” Saying it, I feel myself playing a part in the cycle of gratitude. Even small gifts put us under an obligation to give back. With great gifts, the desire to give is inescapable.
There is only one Ray, but he has given me something to aspire toward and what feels like urgency to do it. I want to “wake up each day thinking about ways to make other people happy.”
And understanding the potency of the gift from him has alerted me to the value of looking for other gifts and other inspirations from those I care for – something those of us who tend to be in the “doing” part of the provider-patient relationship can easy miss.
I will never be the beacon of light and love that Ray is, but being compelled to be my most authentic caring self with him, I see that for years I have held back – in the name of professionalism – the positive emotions that naturally arise from the work I do. I will try to shine and try to connect with that “Ray of light” residing in all my patients. I hope, too, that the cycle of giving Ray started will continue spreading to all those I care for.
Dr. Hass is a hospitalist at Sutter Health in Oakland, Calif. This article appeared originally in SHM's official blog The Hospital Leader. Read more recent posts here.
Finding inspiration in our patients
Finding inspiration in our patients
I rush into the room at 4:30 p.m., hoping for a quick visit and maybe an early exit from the hospital; I had been asked to see Mr. Bryant in room 6765 with sigmoid volvulus.
“Hey, Dr. Hass, my brother!” he says with a huge smile. Somehow, he must have gotten a glimpse of me before I could see him. I peek over the nurse’s shoulder, and then I see that unforgettable smile with only a few teeth and big bright eyes. Immediately I recognize him and think, “How could I have forgotten his name? Ray – like a beam of light.” He certainly had not forgotten me.
“It’s been more than a year since I was last here,” he says proudly.
When we met during his last hospitalization, I was struck by a thought that implanted itself deep in my brain: This guy is the happiest person I have ever met. And after what must have been 18 hard months for him, he is still smiling – and more than that, he is radiating love.
The fact that he is the “happiest person” is made more remarkable by all the hardship he has endured. Ray was born with cerebral palsy and didn’t walk until he was 10. The continuous spasms in his muscles led to severe cervical disc disease. His worsening pain and weakness were missed by his health care providers until he had lost significant strength in his hands and legs. When he finally got an MRI and then emergency surgery, it was too late. He never regained the dexterity of his hands or the ability to walk. He can climb onto his scooter chair only with the help of a lift.
“Wow! How you been, Ray?”
He replies with a phrase that jumped back out from my memory as he was saying it: “I just wake up every day and think about what I can do to make people happy.”
The goosebumps rise on my arms; I remember feeling this same sense of awe the last time we met – a feeling of real spiritual love for this guy.
“Today I feel so much better, too. I want to thank y’all who helped my stomach go down. Man, it got so huge, I thought I might blow up.” One of the consequences of the nerve damage he sustained is a very slow gut that has led to a stretched-out colon. The other day, his big, floppy colon got twisted, and neither our gastroenterologist nor radiologist was able to untwist it. He still has a tube in his rectum to help decompress his bowel.
Ray fills me in on the details in the slightly strained and slurred speech that sometimes comes with cerebral palsy. As he relays his story, my mind goes to work trying to diagnosis this mysterious case of happiness. How can I not try to get to the origins of this wellspring of love? I can’t help but thinking: Was it Ray’s joy and his speech impediment that made him seem childlike, or was it some brain injury that blessedly knocked out his self-pity? I would be wallowing in self-pity if I were as gravely disabled as him.
After a moment’s reflection, I recall the research on the amazing stability of our happiness set point: Good things and bad only move our happiness for a while before we return to our innate level of happiness. I see I had likely fallen prey to a stereotype of the disabled as heroic for just being themselves. Ray’s happiness is largely because of his lack of self-absorption and his focus on service and love.
Finishing our conversation and leaving the room feeling enlivened, I realize that Ray‘s generous spirit is a gift.
That night, my heart aches. I think about the inadequate care that led to Ray’s profound loss of function, leading to a surge of anger toward our flawed health care system – one that routinely lets down the most vulnerable among us.
The next day, two sisters and an aunt join Ray in his room. They ask for hugs, and I happily supply them. “Ray told us about you,” says Sheila, one of his sisters.
“Well, we have been talking about him here at the hospital, because he brightens everyone’s day. He is truly amazing. Has Ray always been so full of love?” I say, hoping to get some insight into his remarkable spirit.
Tonya, his aunt, responds first. “We were raised that way – to look for the good and keep love in our hearts. But Ray has always been the best. He never, ever complains. He brings joy to so many people. You should see him every day out on his scooter. That’s how he got that big sore on his butt.”
Ray indeed had developed a pressure sore, one that was going to need some thoughtful, ongoing care.
“But I finally got the right kind of cushion, before it was real hard,” he says.
I move from hospitalist mode to primary care mode and ask about his home equipment and his dental care. But they all want to keep talking about love.
“If doctors showed more love and their human side, they could bring more healing,” his sister says.
After 20 minutes of chatting, I pause. It is my last day on service, I had run out of medical reason to stay and I have others to see. So, I reluctantly give my goodbye hugs and leave. At the door, I turn back around. “Hey, Ray, can I get a picture with you?”
“Yeah, I want one with you, too!”
So, not surprisingly, Ray never complains. Maybe his spinal cord injury wasn’t from negligent care. Maybe he was so accustomed to looking past discomfort and too busy with his ministry of love, it didn’t occur to him to seek care.
Still, such a tragedy that he lost so much of the little mobility he did have. But maybe not so bad. His injury brought him back in contact with me and our staff. He is still waking up trying to make people happy and I can see his efforts are working. “He made my day!” I hear from a nurse. There is a healthy buzz at the nurses’ station after visits to his room.
Before walking out the door, he gives me an awkward fist bump from the bed and says, “I want to thank y’all again for everything. And I want you to know I love you.”
I find myself tearing up. “I love you too, my brother. And I am the one who should be grateful, Ray.” Saying it, I feel myself playing a part in the cycle of gratitude. Even small gifts put us under an obligation to give back. With great gifts, the desire to give is inescapable.
There is only one Ray, but he has given me something to aspire toward and what feels like urgency to do it. I want to “wake up each day thinking about ways to make other people happy.”
And understanding the potency of the gift from him has alerted me to the value of looking for other gifts and other inspirations from those I care for – something those of us who tend to be in the “doing” part of the provider-patient relationship can easy miss.
I will never be the beacon of light and love that Ray is, but being compelled to be my most authentic caring self with him, I see that for years I have held back – in the name of professionalism – the positive emotions that naturally arise from the work I do. I will try to shine and try to connect with that “Ray of light” residing in all my patients. I hope, too, that the cycle of giving Ray started will continue spreading to all those I care for.
Dr. Hass is a hospitalist at Sutter Health in Oakland, Calif. This article appeared originally in SHM's official blog The Hospital Leader. Read more recent posts here.
Get patients vaccinated: Avoid unwelcome international travel souvenirs
Summer officially began June 21, 2019, but many of your patients already may have departed or will soon be headed to international destinations. Reasons for travel are as variable as their destinations and include but are not limited to family vacations, mission trips, study abroad, parental job relocation, and visiting friends and relatives. The majority of the trips are planned at least 3 months in advance; however, for many travelers and their parents, they suddenly get an aha moment and realize there is/are specific vaccines required to obtain a visa or entry to their final destination. Unfortunately, too much emphasis is focused on required vaccines. The well-informed traveler knows that they may be exposed to multiple diseases and many are vaccine preventable.

The accompanying table lists vaccines traditionally considered to be travel vaccines. Several require multiple doses administered over 21-28 days to provide protection. Others such as cholera and yellow fever must be completed at least 10 days prior to departure to be effective. Typhoid has two formulations: The oral and injectable typhoid vaccines should be completed 1 and 2 weeks, respectively, prior to travel. Several vaccines have age limitations. Routine immunization of all infants against hepatitis A was recommended in 2006. Depending on your region, there may be adolescents who have not been immunized. Fortunately, hepatitis A vaccine works immediately.
One of the challenges you face is identifying someone in your area that provides travel medicine advice and immunizations to children and adolescents. Most children and teens travel with their parents, but today many adolescents travel independently with organized groups. Most of the vaccines listed are not routinely administered at your office, yet you most likely will be the first call a parent makes seeking travel advice.
Let me tell you about a few vaccines in particular.
Japanese encephalitis
This is most common cause of encephalitis in Asia and parts of the western Pacific. Risk generally is limited to rural agricultural areas where the causative virus is transmitted by a mosquito. Fatality rates are 20%-30%. Among survivors, 30%-50% have significant neurologic, cognitive, and psychiatric sequelae. Candidates for this vaccine are long-term travelers and short-term travelers with extensive outdoor rural activities.
Meningococcal conjugate vaccines (MCV4)
All travelers to the Hajj Pilgrimage (Aug. 9-14, 2019) and/or Umrah must show proof of immunization. Vaccine must be received at least 10 days prior to and no greater than 5 years prior to arrival to Saudi Arabia. Conjugate vaccine must clearly be documented for validity of 5 years. For all health entry requirements, go to www.moh.gov.sa/en/hajj/pages/healthregulations.aspx.
Measles
The Advisory Committee on Immunization Practices recommends all infants 6-11 months old receive one dose of MMR prior to international travel regardless of the destination. This should be followed by two additional countable doses. All persons at least 12 months of age and born after 1956 should receive two doses of MMR at least 28 days apart prior to international travel.
Rabies
Rabies is a viral disease endemic in more than 150 countries with approximately 60,000 fatal cases worldwide each year. Asia and Africa are the areas with the highest risk of exposure, and dogs are the principal hosts. Human rabies is almost always fatal once symptoms develop. Preexposure vaccine is recommended for persons with prolonged and/or remote travel to countries where rabies immunoglobulin is unavailable and the occurrence of animal rabies is high. Post exposure vaccination on days 0 and 3 still would be required.*
Typhoid
A bacterial infection caused by Salmonella enterica serotype Typhi and Paratyphi manifests with fever, headache, abdominal pain, diarrhea, or constipation. When bacteremia occurs, it usually is referred to as enteric fever. It is acquired by consumption of food/water contaminated with human feces. Highest risk areas include Africa, Southern Asia, and Southeast Asia
Yellow fever
Risk is limited to sub-Saharan Africa and the tropical areas of South America. It is transmitted by the bite of an infected mosquito. The vaccine is required for entry into at least 16 countries. In a country where yellow fever is present, persons transiting through for more than 12 hours to reach their final destination may actually cause a change in the entry requirements for the destination country. For example, travel from the United States to Tanzania requires no yellow fever vaccine while travel from the United States to Nairobi (more than 12 hours) to Tanzania requires yellow fever vaccine for entry into Tanzania. Travel sequence and duration is extremely important. Check the Centers for Disease Control and Prevention yellow fever site and/or the consulate for the most up-to-date yellow fever vaccine requirements.

YF-Vax (yellow fever vaccine) produced by Sanofi Pasteur in the United States currently is unavailable. The company is building a new facility, and vaccine will not be available for the remainder of 2019. To assure vaccine for U.S. travelers, Stamaril, a yellow fever vaccine produced by Sanofi Pasteur in France has been made available at more than 250 sites nationwide. Because Stamaril is offered at a limited number of locations, persons in need of vaccine should not delay seeking it. Because of increased demand related to summer travel, travelers in some areas have reported delays of several weeks in scheduling an appointment. To locate a Stamaril site in your area, go to wwwnc.cdc.gov/travel/page/search-for-stamaril-clinics.
There are several other diseases transmitted by mosquitoes and ticks including malaria, dengue, Zika and rickettsial diseases. Vigilant use of mosquito repellents is a must. Prophylactic medication is available for only malaria and should be initiated prior to exposure. Frequency and duration depends on the medication selected.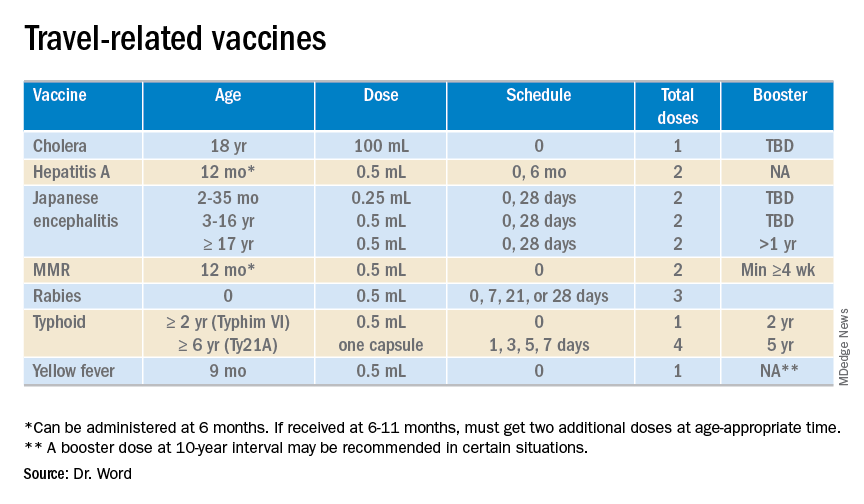
So how do you assist your patients?
Once you’ve identified a travel medicine facility in your area, encourage them to seek pretravel advice 4-6 weeks prior to international travel and make sure their routine immunizations are up to date. Generally, this is not an issue. One challenge is the early administration of MMR. While most practitioners know that early administration for international travel has been recommended for years, many office staff are accustomed to administration at only the 12 month and 4 year visit. When parents call requesting immunization, they often are informed that is it unnecessary and the appointment denied. This is a challenge, especially when coordination of administration of another live vaccine, such as yellow fever, is planned. Familiarizing all members of the health care team with current vaccine recommendations is critical.
For country-specific information, up-to-date travel alerts, and to locate a travel medicine clinic, visit www.cdc.gov/travel.
Dr. Word is a pediatric infectious disease specialist and director of the Houston Travel Medicine Clinic. She had no relevant financial disclosures. Email her at [email protected].
*This article was updated 6/18/2019.
Summer officially began June 21, 2019, but many of your patients already may have departed or will soon be headed to international destinations. Reasons for travel are as variable as their destinations and include but are not limited to family vacations, mission trips, study abroad, parental job relocation, and visiting friends and relatives. The majority of the trips are planned at least 3 months in advance; however, for many travelers and their parents, they suddenly get an aha moment and realize there is/are specific vaccines required to obtain a visa or entry to their final destination. Unfortunately, too much emphasis is focused on required vaccines. The well-informed traveler knows that they may be exposed to multiple diseases and many are vaccine preventable.
The accompanying table lists vaccines traditionally considered to be travel vaccines. Several require multiple doses administered over 21-28 days to provide protection. Others such as cholera and yellow fever must be completed at least 10 days prior to departure to be effective. Typhoid has two formulations: The oral and injectable typhoid vaccines should be completed 1 and 2 weeks, respectively, prior to travel. Several vaccines have age limitations. Routine immunization of all infants against hepatitis A was recommended in 2006. Depending on your region, there may be adolescents who have not been immunized. Fortunately, hepatitis A vaccine works immediately.
One of the challenges you face is identifying someone in your area that provides travel medicine advice and immunizations to children and adolescents. Most children and teens travel with their parents, but today many adolescents travel independently with organized groups. Most of the vaccines listed are not routinely administered at your office, yet you most likely will be the first call a parent makes seeking travel advice.
Let me tell you about a few vaccines in particular.
Japanese encephalitis
This is most common cause of encephalitis in Asia and parts of the western Pacific. Risk generally is limited to rural agricultural areas where the causative virus is transmitted by a mosquito. Fatality rates are 20%-30%. Among survivors, 30%-50% have significant neurologic, cognitive, and psychiatric sequelae. Candidates for this vaccine are long-term travelers and short-term travelers with extensive outdoor rural activities.
Meningococcal conjugate vaccines (MCV4)
All travelers to the Hajj Pilgrimage (Aug. 9-14, 2019) and/or Umrah must show proof of immunization. Vaccine must be received at least 10 days prior to and no greater than 5 years prior to arrival to Saudi Arabia. Conjugate vaccine must clearly be documented for validity of 5 years. For all health entry requirements, go to www.moh.gov.sa/en/hajj/pages/healthregulations.aspx.
Measles
The Advisory Committee on Immunization Practices recommends all infants 6-11 months old receive one dose of MMR prior to international travel regardless of the destination. This should be followed by two additional countable doses. All persons at least 12 months of age and born after 1956 should receive two doses of MMR at least 28 days apart prior to international travel.
Rabies
Rabies is a viral disease endemic in more than 150 countries with approximately 60,000 fatal cases worldwide each year. Asia and Africa are the areas with the highest risk of exposure, and dogs are the principal hosts. Human rabies is almost always fatal once symptoms develop. Preexposure vaccine is recommended for persons with prolonged and/or remote travel to countries where rabies immunoglobulin is unavailable and the occurrence of animal rabies is high. Post exposure vaccination on days 0 and 3 still would be required.*
Typhoid
A bacterial infection caused by Salmonella enterica serotype Typhi and Paratyphi manifests with fever, headache, abdominal pain, diarrhea, or constipation. When bacteremia occurs, it usually is referred to as enteric fever. It is acquired by consumption of food/water contaminated with human feces. Highest risk areas include Africa, Southern Asia, and Southeast Asia
Yellow fever
Risk is limited to sub-Saharan Africa and the tropical areas of South America. It is transmitted by the bite of an infected mosquito. The vaccine is required for entry into at least 16 countries. In a country where yellow fever is present, persons transiting through for more than 12 hours to reach their final destination may actually cause a change in the entry requirements for the destination country. For example, travel from the United States to Tanzania requires no yellow fever vaccine while travel from the United States to Nairobi (more than 12 hours) to Tanzania requires yellow fever vaccine for entry into Tanzania. Travel sequence and duration is extremely important. Check the Centers for Disease Control and Prevention yellow fever site and/or the consulate for the most up-to-date yellow fever vaccine requirements.
YF-Vax (yellow fever vaccine) produced by Sanofi Pasteur in the United States currently is unavailable. The company is building a new facility, and vaccine will not be available for the remainder of 2019. To assure vaccine for U.S. travelers, Stamaril, a yellow fever vaccine produced by Sanofi Pasteur in France has been made available at more than 250 sites nationwide. Because Stamaril is offered at a limited number of locations, persons in need of vaccine should not delay seeking it. Because of increased demand related to summer travel, travelers in some areas have reported delays of several weeks in scheduling an appointment. To locate a Stamaril site in your area, go to wwwnc.cdc.gov/travel/page/search-for-stamaril-clinics.
There are several other diseases transmitted by mosquitoes and ticks including malaria, dengue, Zika and rickettsial diseases. Vigilant use of mosquito repellents is a must. Prophylactic medication is available for only malaria and should be initiated prior to exposure. Frequency and duration depends on the medication selected.
So how do you assist your patients?
Once you’ve identified a travel medicine facility in your area, encourage them to seek pretravel advice 4-6 weeks prior to international travel and make sure their routine immunizations are up to date. Generally, this is not an issue. One challenge is the early administration of MMR. While most practitioners know that early administration for international travel has been recommended for years, many office staff are accustomed to administration at only the 12 month and 4 year visit. When parents call requesting immunization, they often are informed that is it unnecessary and the appointment denied. This is a challenge, especially when coordination of administration of another live vaccine, such as yellow fever, is planned. Familiarizing all members of the health care team with current vaccine recommendations is critical.
For country-specific information, up-to-date travel alerts, and to locate a travel medicine clinic, visit www.cdc.gov/travel.
Dr. Word is a pediatric infectious disease specialist and director of the Houston Travel Medicine Clinic. She had no relevant financial disclosures. Email her at [email protected].
*This article was updated 6/18/2019.
Metabolic and work productivity gains follow telemonitored exercise
while also improving productivity and mental health, research suggests.

In the June 13 online edition of Lancet Public Health, Dr. Sven Haufe of the Institute of Sports Medicine at Hannover Medical School in Germany and coauthors report the outcomes of a prospective, parallel-group, assessor-blind study of a telemonitoring-supported exercise intervention in 314 workers at a car factory. Of the participants, 162 did office work, 114 did manual work, and 30 did work that was not classified as falling under the office or manual work categories.
The participants, who had all been diagnosed with metabolic syndrome, were randomized to a 6-month exercise program involving personal counseling, use of a telemonitored activity monitor and regular feedback and consultation with an exercise scientist, or to continue their current lifestyle.
The participants were told to aim to complete 150 minutes of moderately intense physical activity per week for 6 months and to maintain a high level of daily activity. They were asked to maintain an individual heart rate range of 65%-75% relative to measured maximum heart rate when performing activities, such as walking, running, cycling, and using an elliptical trainer.
Participants wore their activity monitor, the Forerunner 35 (Garmin, Germany), on the wrist of their nondominant hand throughout the intervention period and were trained on how to use the device. Wearing time and steps were continuously recorded and recording of time, distance, and heart rate while performing cardiovascular exercise like riding a bicycle could be stopped and started by the participant. “Both continuous and self-started activity data were saved and directly forwarded via an interface from the Garmin server to a server at Hanover Medical school.” Participants also downloaded an application on their smartphones called Rebirth Active, which was specially designed for the study. The purposes of this app were to facilitate a close relationship between the participant and that participant’s supervising exercise scientist and to provide general information on the study, individual training goals, recommended heart rates during activities, tips for increasing physical activity, and the supervisor’s contact information.
Nearly half of the participants in the exercise program achieved at least the scheduled activity target of 150 minutes of physical activity per week, while the mean overall was 147 minutes per week. The researchers observed a significant reduction in mean metabolic syndrome z score in the intervention group – from 0.93 before the start of the study to 0.63 at the end of the program (P less than .0001). The control group’s mean z score level of improvement did not reach statistical significance (P = .167). The intervention was also associated with significant improvements in the metabolic syndrome components waist circumference, fasting glucose concentration, systolic blood pressure, and triglycerides, but not in HDL cholesterol levels. Additionally, the exercise group experienced greater reductions in mean body weight and mean percentage of body fat than the control group.
Workers who took part in the exercise program showed significant improvements in their performance on three subscales of the work ability index, including their current work ability, work ability in relation to demands, and mental resources. The control group showed no significant gains in these areas.
The intervention group also achieved gains in the physical and mental component scores of the quality of life questionnaires, which were significantly greater than those of the control group. Both the intervention and control groups had decreases in severity scores for anxiety and depression, but participants in the exercise program showed greater improvements.
“The observation that improvements in exercise capacity and mental health are associated with changes in work ability shows the need to offer similar interventions broadly across the working population,” the authors wrote, “not only to reduce individual risk of disease, but also to possibly ease the health care burden and economic costs arising from metabolic syndrome conditions in an aging population, an issue that should be addressed in further studies.”
The study was supported by Audi BKK health insurance and the German Research Foundation. No conflicts of interest were declared.
SOURCE: Haufe S et al. Lancet Public Health 2019. Jun 13. doi.: 10.1016/2468-2667(19)30075-1.
while also improving productivity and mental health, research suggests.
In the June 13 online edition of Lancet Public Health, Dr. Sven Haufe of the Institute of Sports Medicine at Hannover Medical School in Germany and coauthors report the outcomes of a prospective, parallel-group, assessor-blind study of a telemonitoring-supported exercise intervention in 314 workers at a car factory. Of the participants, 162 did office work, 114 did manual work, and 30 did work that was not classified as falling under the office or manual work categories.
The participants, who had all been diagnosed with metabolic syndrome, were randomized to a 6-month exercise program involving personal counseling, use of a telemonitored activity monitor and regular feedback and consultation with an exercise scientist, or to continue their current lifestyle.
The participants were told to aim to complete 150 minutes of moderately intense physical activity per week for 6 months and to maintain a high level of daily activity. They were asked to maintain an individual heart rate range of 65%-75% relative to measured maximum heart rate when performing activities, such as walking, running, cycling, and using an elliptical trainer.
Participants wore their activity monitor, the Forerunner 35 (Garmin, Germany), on the wrist of their nondominant hand throughout the intervention period and were trained on how to use the device. Wearing time and steps were continuously recorded and recording of time, distance, and heart rate while performing cardiovascular exercise like riding a bicycle could be stopped and started by the participant. “Both continuous and self-started activity data were saved and directly forwarded via an interface from the Garmin server to a server at Hanover Medical school.” Participants also downloaded an application on their smartphones called Rebirth Active, which was specially designed for the study. The purposes of this app were to facilitate a close relationship between the participant and that participant’s supervising exercise scientist and to provide general information on the study, individual training goals, recommended heart rates during activities, tips for increasing physical activity, and the supervisor’s contact information.
Nearly half of the participants in the exercise program achieved at least the scheduled activity target of 150 minutes of physical activity per week, while the mean overall was 147 minutes per week. The researchers observed a significant reduction in mean metabolic syndrome z score in the intervention group – from 0.93 before the start of the study to 0.63 at the end of the program (P less than .0001). The control group’s mean z score level of improvement did not reach statistical significance (P = .167). The intervention was also associated with significant improvements in the metabolic syndrome components waist circumference, fasting glucose concentration, systolic blood pressure, and triglycerides, but not in HDL cholesterol levels. Additionally, the exercise group experienced greater reductions in mean body weight and mean percentage of body fat than the control group.
Workers who took part in the exercise program showed significant improvements in their performance on three subscales of the work ability index, including their current work ability, work ability in relation to demands, and mental resources. The control group showed no significant gains in these areas.
The intervention group also achieved gains in the physical and mental component scores of the quality of life questionnaires, which were significantly greater than those of the control group. Both the intervention and control groups had decreases in severity scores for anxiety and depression, but participants in the exercise program showed greater improvements.
“The observation that improvements in exercise capacity and mental health are associated with changes in work ability shows the need to offer similar interventions broadly across the working population,” the authors wrote, “not only to reduce individual risk of disease, but also to possibly ease the health care burden and economic costs arising from metabolic syndrome conditions in an aging population, an issue that should be addressed in further studies.”
The study was supported by Audi BKK health insurance and the German Research Foundation. No conflicts of interest were declared.
SOURCE: Haufe S et al. Lancet Public Health 2019. Jun 13. doi.: 10.1016/2468-2667(19)30075-1.
FROM LANCET PUBLIC HEALTH