User login
Clearance rates higher with bimekizumab vs. secukinumab in phase 3 psoriasis study
Secukinumab is the latest adult plaque psoriasis treatment to be bested by a newcomer, the interleukin 17A and 17F blocker bimekizumab.
Rates of complete clearance were substantially higher with bimekizumab in a phase 3 trial with 743 patients with moderate-to-severe plaque psoriasis, but oral candidiasis (oral thrush) again emerged as a particular issue with the agent.
Clinical improvements seen with bimekizumab have exceeded those with two standard options for adult plaque psoriasis — the tumor necrosis factor blocker adalimumab and the interleukin (IL) 12/23 inhibitor ustekinumab
— in phase 3 trials from manufacturer UCB Pharma, and it›s under review for the indication by the U.S. Food and Drug Administration and the European Medicines Agency.
The biologic is also being evaluated in phase 3 trials for treating psoriatic arthritis, ankylosing spondylitis, nonradiographic axial spondyloarthritis, and hidradenitis suppurativa.
Results of the trial comparing bimekizumab to secukinumab, dubbed BE RADIANT, were presented at the American Academy of Dermatology Virtual Meeting Experience and published online concurrently April 23 in the New England Journal of Medicine.
The results “suggest that inhibition of both interleukin-17A and interleukin-17F with bimekizumab may provide greater clinical benefit for patients with moderate-to-severe plaque psoriasis than inhibition of interleukin-17A alone,” as with secukinumab, said the investigators, led by Kristian Reich, MD, professor of dermatology at the University Medical Center Hamburg-Eppendorf in Hamburg, Germany.
The trial randomly assigned 373 adults to bimekizumab 320 mg every 4 weeks to week 16, then rerandomized them to maintenance dosing either every 4 weeks or every 8 weeks to week 48; another 370 adults were randomly assigned to secukinumab 300 mg weekly for the first 4 weeks, then every 4 weeks to week 48. Baseline Psoriasis Area and Severity Index (PASI) scores were about 20 points in both treatment groups.
At the 1-month point, 71% in the bimekizumab group, vs 47.3% on secukinumab, had a 75% or greater reduction from their baseline PASI score. At 4 months, 61.7% of those on bimekizumab but 48.9% in the secukinumab group had complete clearance with a PASI score of 100.
At 48 weeks, 67% of those on bimekizumab had a PASI 100 response — which was numerically similar between the two bimekizumab dosing regimens after week 16 — vs 46.2% of the secukinumab group (P for all < .001).
The incidence of serious adverse events was just under 6% in both groups, with adverse events leading to discontinuation in 3.5% of bimekizumab and 2.7% of secukinumab subjects. The rate of serious infections was similar in both groups.
However, as in past trials, oral candidiasis was an issue, occurring in 19.3% of bimekizumab subjects vs 3% on secukinumab. Half of the 72 bimekizumab cases were classified as mild, and all but two of the rest as moderate. Over 40% of affected subjects reported more than one case, but none led to treatment discontinuation.
More than 85% of oral candidiasis cases in the study were treated with antifungal therapy and resolved during the trial. Inflammatory bowel disease is a concern with IL-17 blockade, but this hasn’t emerged as a particular issue with bimekizumab. There was one case each of ulcerative colitis in both the bimekizumab and secukinumab groups, and just one case of ulcerative colitis in three previous phase 3 bimekizumab trials, according to the investigators.
Among the trial limitations: Patients who had been on bimekizumab or secukinumab previously were excluded, as were patients who had no response to an IL-17 biologic or more than one biologic agent of any other class within the previous 12 weeks. The limitations could reduce generalizability, the investigators said.
Patients in the trial were about 45 years old, on average, and about two thirds were men; over 90% were White.
The study was funded by UCB Pharma. The investigators had numerous disclosures, including Reich who reported grants and personal fees from companies including UCB Pharma. The full list of disclosures can be found with the New England Journal of Medicine article.
A version of this article first appeared on Medscape.com .
Systematic approach to pain helps avoid opioid issues for dermatologists
, according to an expert who outlined his strategies at the American Academy of Dermatology Virtual Meeting Experience.

The exceptions relate primarily to patients with issues complicating pain control, such as those with psychosocial problems exacerbating the pain response, drug-seeking behavior, or both, according to Robert G. Micheletti, MD, chief of hospital dermatology, University of Pennsylvania, Philadelphia.
To stay out of trouble, Dr. Micheletti advocated a systematic approach to the control of pain that includes documentation, clear expectations, and a sparing use of opioids only at the lowest acceptable dose for periods measured in days.
Using a case of pyoderma gangrenosum to make several points, he recognized that some patients do have a level of pain that warrants a short course of opioids, but this is not his first step. Rather, the initial focus, after administering standard therapies for this disease, is wound care, which often attenuates symptoms. He adds non-pharmacologic treatments, such as ice, heat, and rest when appropriate. The initial pharmacologic approach is alternating doses of an NSAID and acetaminophen.
“If necessary, a short course of opioids is reasonable for patients with acute pain,” he acknowledged. But he wants to avoid providing more opioids than needed to address the initial period of acute pain. In the case of pyoderma gangrenosum, he suggested a typical prescription might be 12 pills of 5 mg oxycodone taken every six hours. A followup appointment within a week provides the opportunity to reassess.
“Set clear expectations,” Dr. Micheletti said. This includes explaining that the goal is manageable pain, not complete pain relief, which is often unobtainable. For painful conditions such as pyoderma gangrenosum, hidradenitis suppurativa, or vasculitis, a short course will generally be sufficient to get past the most significant discomfort.
There are several reasons that Dr. Micheletti encourages dermatologists to take responsibility for pain related to skin diseases. One is the potential for inefficiencies and delays common to referrals, but another is the value of the dermatologist’s expertise in judging pain as a symptom of the disorder. With effective treatment, pain should self-resolve.
“If the patient is not getting better medically, then change therapies,” Dr. Micheletti said. When referred to a non-dermatologist, the pain expert might not recognize what persistent pain is revealing about the underlying condition.
Repeatedly, Dr. Micheletti made the point that dermatologists should manage pain related to skin disorders because of their ability to assess complaints in the context of the disease.
“We are the experts. We should understand when what we are seeing should or should not be painful,” he said. He added that dermatologists are also in the best position to judge “when analgesia is no longer needed.”
With this same logic, dermatologists are in a good position to distinguish nociceptive from neuropathic pain. Some conditions are likely to have both, and this should influence choice of pain relief. Citing a patient with calciphylaxis as an example, Dr. Micheletti suggested that drugs with efficacy against neuropathic pain, such as gabapentin, should be one of the options to consider before moving to opioids. In those with sufficient pain to warrant an opioid, however, Dr. Micheletti would consider tramadol, which acts on both types of pain.
Treating pain is not always straightforward, Dr. Micheletti acknowledged. For example, depression and mood disorders are known to exacerbate pain and are reasonable targets of pain control. The stress related to disruptive psychosocial problems can be another factor in risk of pain.
“Be prepared to acknowledge and address these types of issues,” Dr. Micheletti said. Although these are the types of patients some dermatologists might prefer to refer to a pain specialist, he said that the contribution of factors outside of skin disease should not be allowed to obscure a dermatologic source of pain.
“Just because a patient has psychosocial issues does not mean that there is no pain,” he said.
A systematic approach to the assessment and treatment of pain will help sort out these issues, but Dr. Micheletti also said, “Know your comfort zone.” When patients require opioids, there are several appropriate steps important or mandatory to provide adequate protection for the patient and the physician. In addition to documentation, it is reasonable to verify that the patient is not obtaining opioids from other prescribers, a step that is mandatory in some states.
When opioids are needed, Dr. Micheletti suggested a standard approach that includes short courses without refills. He recommended avoiding long-acting opioids and drugs not commonly used by non-pain specialists, such as codeine, hydrocodone, or fentanyl.
“This is not a prescribe and walk away situation,” he said.

Although the same general approach is employed by Adam Friedman, MD, professor and chair of dermatology, George Washington University, Washington, he is a little less reluctant to refer patients to pain specialists.
“For complex situations, you need complex solutions. In the case of significant pain and even itch, I will collaborate with the GW Pain Center,” he said. For severe pain, the solutions might include nerve blocks or even intravenous ketamine for in-patients.
He also made the point that dermatologists, even if they are uncomfortable prescribing opioids, “should be equipped to use relevant medications such as topical anesthetics, gabapentinoids, and SSRIs” to control pain related to skin conditions.
Dr. Micheletti reports no relevant conflicts of interest. Dr. Friedman has consulting relationships with several pharmaceutical companies, including Amgen, GlaxoSmithKline, and Valeant.
, according to an expert who outlined his strategies at the American Academy of Dermatology Virtual Meeting Experience.
The exceptions relate primarily to patients with issues complicating pain control, such as those with psychosocial problems exacerbating the pain response, drug-seeking behavior, or both, according to Robert G. Micheletti, MD, chief of hospital dermatology, University of Pennsylvania, Philadelphia.
To stay out of trouble, Dr. Micheletti advocated a systematic approach to the control of pain that includes documentation, clear expectations, and a sparing use of opioids only at the lowest acceptable dose for periods measured in days.
Using a case of pyoderma gangrenosum to make several points, he recognized that some patients do have a level of pain that warrants a short course of opioids, but this is not his first step. Rather, the initial focus, after administering standard therapies for this disease, is wound care, which often attenuates symptoms. He adds non-pharmacologic treatments, such as ice, heat, and rest when appropriate. The initial pharmacologic approach is alternating doses of an NSAID and acetaminophen.
“If necessary, a short course of opioids is reasonable for patients with acute pain,” he acknowledged. But he wants to avoid providing more opioids than needed to address the initial period of acute pain. In the case of pyoderma gangrenosum, he suggested a typical prescription might be 12 pills of 5 mg oxycodone taken every six hours. A followup appointment within a week provides the opportunity to reassess.
“Set clear expectations,” Dr. Micheletti said. This includes explaining that the goal is manageable pain, not complete pain relief, which is often unobtainable. For painful conditions such as pyoderma gangrenosum, hidradenitis suppurativa, or vasculitis, a short course will generally be sufficient to get past the most significant discomfort.
There are several reasons that Dr. Micheletti encourages dermatologists to take responsibility for pain related to skin diseases. One is the potential for inefficiencies and delays common to referrals, but another is the value of the dermatologist’s expertise in judging pain as a symptom of the disorder. With effective treatment, pain should self-resolve.
“If the patient is not getting better medically, then change therapies,” Dr. Micheletti said. When referred to a non-dermatologist, the pain expert might not recognize what persistent pain is revealing about the underlying condition.
Repeatedly, Dr. Micheletti made the point that dermatologists should manage pain related to skin disorders because of their ability to assess complaints in the context of the disease.
“We are the experts. We should understand when what we are seeing should or should not be painful,” he said. He added that dermatologists are also in the best position to judge “when analgesia is no longer needed.”
With this same logic, dermatologists are in a good position to distinguish nociceptive from neuropathic pain. Some conditions are likely to have both, and this should influence choice of pain relief. Citing a patient with calciphylaxis as an example, Dr. Micheletti suggested that drugs with efficacy against neuropathic pain, such as gabapentin, should be one of the options to consider before moving to opioids. In those with sufficient pain to warrant an opioid, however, Dr. Micheletti would consider tramadol, which acts on both types of pain.
Treating pain is not always straightforward, Dr. Micheletti acknowledged. For example, depression and mood disorders are known to exacerbate pain and are reasonable targets of pain control. The stress related to disruptive psychosocial problems can be another factor in risk of pain.
“Be prepared to acknowledge and address these types of issues,” Dr. Micheletti said. Although these are the types of patients some dermatologists might prefer to refer to a pain specialist, he said that the contribution of factors outside of skin disease should not be allowed to obscure a dermatologic source of pain.
“Just because a patient has psychosocial issues does not mean that there is no pain,” he said.
A systematic approach to the assessment and treatment of pain will help sort out these issues, but Dr. Micheletti also said, “Know your comfort zone.” When patients require opioids, there are several appropriate steps important or mandatory to provide adequate protection for the patient and the physician. In addition to documentation, it is reasonable to verify that the patient is not obtaining opioids from other prescribers, a step that is mandatory in some states.
When opioids are needed, Dr. Micheletti suggested a standard approach that includes short courses without refills. He recommended avoiding long-acting opioids and drugs not commonly used by non-pain specialists, such as codeine, hydrocodone, or fentanyl.
“This is not a prescribe and walk away situation,” he said.
Although the same general approach is employed by Adam Friedman, MD, professor and chair of dermatology, George Washington University, Washington, he is a little less reluctant to refer patients to pain specialists.
“For complex situations, you need complex solutions. In the case of significant pain and even itch, I will collaborate with the GW Pain Center,” he said. For severe pain, the solutions might include nerve blocks or even intravenous ketamine for in-patients.
He also made the point that dermatologists, even if they are uncomfortable prescribing opioids, “should be equipped to use relevant medications such as topical anesthetics, gabapentinoids, and SSRIs” to control pain related to skin conditions.
Dr. Micheletti reports no relevant conflicts of interest. Dr. Friedman has consulting relationships with several pharmaceutical companies, including Amgen, GlaxoSmithKline, and Valeant.
FROM AAD VMX 2021
Feds lift pause of J&J COVID vaccine, add new warning
Use of the Johnson & Johnson COVID-19 vaccine should resume in the United States for all adults, the Food and Drug Administration and Centers for Disease Contol and Prevention said April 23, although health care providers should warn patients of the risk of developing the rare and serious blood clots that caused the agencies to pause the vaccine’s distribution earlier this month.
“What we are seeing is the overall rate of events was 1.9 cases per million people. In women 18 to 29 years there was an approximate 7 cases per million. The risk is even lower in women over the age of 50 at .9 cases per million,” CDC Director Rochelle Walensky, MD, said in a news briefing the same day.
In the end, the potential benefits of the vaccine far outweighed its risks.
“In terms of benefits, we found that for every 1 million doses of this vaccine, the J&J vaccine could prevent over 650 hospitalizations and 12 deaths among women ages 18-49,” Dr. Walensky said. The potential benefits to women over 50 were even greater: It could prevent 4,700 hospitalizations and 650 deaths.
“In the end, this vaccine was shown to be safe and effective for the vast majority of people,” Dr. Walensky said.
The recommendation to continue the vaccine’s rollout came barely 2 hours after a CDC Advisory Committee on Immunization Practices voted to recommend the pause be lifted. The vote was 10-4 with one abstention.
The decision also includes instructions for the warning directed at women under 50 who have an increased risk of a rare but serious blood clot disorder called thrombosis with thrombocytopenia syndrome (TTS).
As of April 21, 15 cases of TTS, all in women and 13 of them in women under 50, have been confirmed among 7.98 million doses of the J&J vaccine administered in the United States. Three women have died.
The FDA and CDC recommended the pause on April 13 after reports that 6 women developed a blood clotting disorder 6 to 13 days after they received the J&J vaccine.
William Schaffner, MD, an infectious disease expert at Vanderbilt University in Nashville, and a non-voting ACIP member, said in an interview the panel made the right recommendation.
He applauded both the decision to restart the vaccine and the updated warning information that “will explain [TTS] more fully to people, particularly women, who are coming to be vaccinated.”
As to women in the risk group needing to have a choice of vaccines, Dr. Schaffner said that will be addressed differently across the country.
“Every provider will not have alternative vaccines in their location so there will be many different ways to do this. You may have to get this information and select which site you’re going to depending on which vaccine is available if this matter is important to you,” he noted.
ACIP made the decision after a 6-hour emergency meeting to hear evidence on the Johnson & Johnson vaccine's protective benefits against COVID-19 vs. risk of TTS.
In the CDC-FDA press briefing, Dr. Walensky pointed out that over the past few days, as regulators have reviewed the rare events, newly identified patients had been treated appropriately, without the use of heparin, which is not advised for treating TTS.
As a result, regulators felt as if their messages had gotten out to doctors who now knew how to take special precautions when treating patients with the disorder.
She said the Johnson & Johnson shot remained an important option because it was convenient to give and easier to store than the other vaccines currently authorized in the United States.
Peter Marks, MD, the director of FDA’s Center for Biologics Evaluation and Research, said the agency had already added information describing the risk of the rare clotting disorder to its fact sheets for patients and doctors.
Janet Woodcock, MD, acting commissioner of the FDA, said vaccination centers could resume giving the “one and done” shots as early as April 24.
This article was updated April 24, 2021, and first appeared on WebMD.com.
Dyssynergic defecation
Introduction
About 40% of the population experiences lower GI symptoms suggestive of gastrointestinal motility disorders.1,2 The global prevalence of chronic constipation is 18%, and the condition includes multiple overlapping subtypes.3 Evacuation disorders affect over half (59%) of patients and include dyssynergic defecation (DD).4 The inability to coordinate the abdominal, rectal, pelvic floor, and anal/puborectalis muscles to evacuate stools causes DD.5 The etiology of DD remains unclear and is often misdiagnosed. Clinically, the symptoms of DD overlap with other lower GI disorders, often leading to unnecessary and invasive procedures.2 We describe the clinical characteristics, diagnostic tools, treatment options, and evidence-based approach for the management of DD.

Clinical presentation
Over two-thirds of patients with DD acquire this disorder during adulthood, and one-third have symptoms from childhood.6 Though there is not usually an inciting event, 29% of patients report that symptoms began after events such as pregnancy or back injury,6 and opioid users have higher prevalence and severity of DD.7

Over 80% of patients report excessive straining, feelings of incomplete evacuation, and hard stools, and 50% report sensation of anal blockage or use of digital maneuvers.2 Other symptoms include infrequent bowel movements, abdominal pain, anal pain, and stool leakage.2 Evaluation of DD includes obtaining a detailed history utilizing the Bristol Stool Form Scale;8 however, patients’ recall of stool habit is often inaccurate, which results in suboptimal care.9,10 Prospective stool diaries can help to provide more objective assessment of patients’ symptoms, eliminate recall bias, and provide more reliable information. Several useful questionnaires are available for clinical and research purposes to characterize lower-GI symptoms, including the Constipation Scoring System,11 Patient Assessment of Constipation Symptoms (PAC-SYM),12 and Patient Assessment of Constipation Quality of Life (PAC-QOL).2,13 The Constipation Stool digital app enhances accuracy of data capture and offers a reliable and user-friendly method for recording bowel symptoms for patients, clinicians, and clinical investigators.14
Diagnosis
The diagnosis of DD requires careful physical and digital rectal examination together with anorectal manometry and a balloon expulsion test. Defecography and colonic transit studies provide additional assessment.

Physical examination
Abdominal examination should include palpation for stool in the colon and identification of abdominal mass or fecal impaction.2A high-quality digital rectal examination can help to identify patients who could benefit from physiological testing to confirm and treat DD.15 Rectal examination is performed by placing examiner’s lubricated gloved right index finger in a patient’s rectum, with the examiner’s left hand on patient’s abdomen, and asking the patient to push and bear down as if defecating.15 The contraction of the abdominal muscles is felt using the left hand, while the anal sphincter relaxation and degree of perineal descent are felt using the right-hand index finger.15 A diagnosis of dyssynergia is suspected if the digital rectal examination reveals two or more of the following abnormalities: inability to contract abdominal muscles (lack of push effort), inability to relax or paradoxical contraction of the anal sphincter and/or puborectalis, or absence of perineal descent.15 Digital rectal examination has good sensitivity (75%), specificity (87%), and positive predictive value (97%) for DD.16
High resolution anorectal manometry
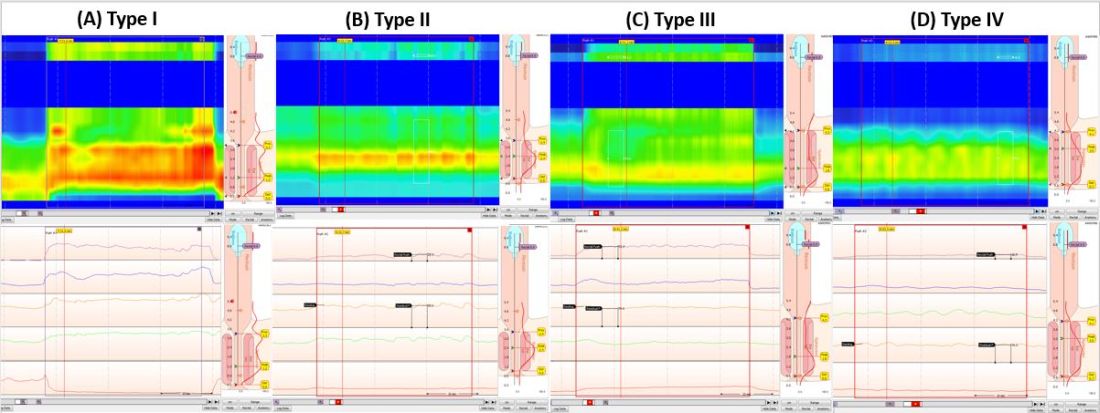
Anorectal manometry (ARM) is the preferred method for the evaluation of defecatory disorders.17,18 ARM is best performed using the high-resolution anorectal manometry (HRAM) systems19 that consist of a flexible probe – 0.5-cm diameter with multiple circumferential sensors along the anal canal – and another two sensors inside a rectal balloon.18 It provides a topographic and waveform display of manometric pressure data (Figure). The 3D high-definition ARM probe is a rigid 1-cm probe that provides 3D topographic profiles.18 ARM is typically performed in both the left lateral position and in a more physiological seated position.20,21 There is considerable variation amongst different institutions on how to perform HRAM, and a recent International Anorectal Physiology Working Group (IAPWG) has provided consensus recommendations for performing this test.22 The procedure for performing HRAM is reviewed elsewhere, but the key elements are summarized below.18
Push maneuver: On HRAM, after the assessment of resting and squeeze anal sphincter pressures, the patient is asked to push or bear down as if to defecate while lying in left lateral decubitus position. The best of two attempts that closely mimics a normal bearing down maneuver is used for categorizing patient’s defecatory pattern.18 In patients with DD, at least four distinct dyssynergia phenotypes have been recognized (Figure),23 though recent studies suggest eight patterns.24 Defecation index (maximum rectal pressure/minimum residual anal pressure when bearing down) greater than 1.2 is considered normal.18
Simulated defecation on commode: The subject is asked to attempt defecation while seated on a commode with intrarectal balloon filled with 60 cc of air, and both the defecation pattern(s) and defecation index are calculated. A lack of coordinated push effort is highly suggestive of DD.21
Rectoanal Inhibitory Reflex (RAIR): RAIR describes the reflex relaxation of the internal anal sphincter after rectal distension. RAIR is dependent on intact autonomic ganglia and myenteric plexus25and is mediated by the release of nitric oxide and vasoactive intestinal peptide.26 The absence of RAIR suggests Hirschsprung disease.22.27.28
Rectal sensory testing: Intermittent balloon distension of the rectum with incremental volumes of air induces a range of rectal sensations that include first sensation, desire to defecate, urgency to defecate, and maximum tolerable volume. Rectal hyposensitivity is diagnosed when two or more sensory thresholds are higher than those seen in normal subjects29.30 and likely results from disruption of afferent gut-brain pathways, cortical perception/rectal wall dysfunction, or both.29 Rectal hyposensitivity affects 40% of patients with constipation30and is associated with DD but not delayed colonic transit.31 Rectal hyposensitivity may also be seen in patients with diabetes or fecal incontinence.18 About two-thirds of patients with rectal hyposensitivity have rectal hypercompliance, and some have megarectum.32 Some patients with DD have coexisting irritable bowel syndrome (IBS) and may have rectal hypersensitivity.18,33 Rectal compliance is measured alongside rectal sensitivity analysis by plotting a graph between the change in intraballoon volume (mL) and change in intrarectal pressures (mm Hg) during incremental balloon distensions.18.34 Rectal hypercompliance may be seen in megarectum and dyssynergic defecation.34,35 Rectal hypocompliance may be seen in patients with inflammatory bowel disease, postpelvic radiation, chronic ischemia, and advanced age.18
Balloon expulsion test: This test is performed by placing a plastic probe with a balloon in the rectum and filling it with 50 cc of warm water. Patients are given 5 minutes to expel the balloon while sitting on a commode. Balloon expulsion time of more than 1 minute suggests a diagnosis of DD,21 although 2 minutes provides a higher level of agreement with manometric findings.36 Balloon type and body position can influence the results.37 Inability to expel the balloon with normal manometric findings is considered an inconclusive finding per the recent London Classification (i.e., it may be associated with generation of anorectal symptoms, but the clinical relevance of this finding is unclear as it may also be seen in healthy subjects).22
Defecography
Defecography is a dynamic fluoroscopic study performed in the sitting position after injecting 150 mL of barium paste into the patient’s rectum. Defecography provides useful information about structural changes (e.g., rectoceles, enteroceles, rectal prolapse, and intussusception), DD, and descending perineum syndrome.38 Methodological differences, radiation exposure, and poor interobserver agreement have limited its wider use; therefore, anorectal manometry and the balloon expulsion test are recommended for the initial evaluation of DD.39 Magnetic resonance defecography may be more useful.17,38
Colonic transit studies
Colonic transit study can be assessed using radiopaque markers, wireless motility capsule, or scintigraphy. Wireless motility capsule and scintigraphy have the advantage of determining gastric, small bowel, and whole gut transit times as well. About two-thirds of patients with DD have slow transit constipation (STC),6 which improves after treatment of DD.40 Hence, in patients with chronic constipation, evaluation and management of DD is recommended first. If symptoms persist, then consider colonic transit assessment.41 Given the overlapping nature of the conditions, documentation of STC at the outset could facilitate treatment of both.
Diagnostic criteria for DD
Patients should fulfill the following criteria for diagnosis of DD:42,43
- Fulfill symptom(s) diagnostic criteria for functional constipation and/or constipation-predominant IBS.
- Demonstrate dyssynergic pattern (Types I-IV; Figure) during attempted defecation on manometry recordings.
- Meet one or more of the following criteria:
- Inability to expel an artificial stool (50 mL water-filled balloon) within 1 minute.
- Inability to evacuate or retention of 50% or more of barium during defecography. (Some institutions use a prolonged colonic transit time: greater than 5 markers or 20% or higher marker retention on a plain abdominal x-Ray at 120 hours after ingestion of one radio-opaque marker capsule containing 24 radio-opaque markers.)
Treatment of DD
The treatment modalities for DD depend on several factors: patient’s age, comorbidities, underlying pathophysiology, and patient expectations. Treatment options include standard management of constipation, but biofeedback therapy is the mainstay.
Standard management
Medications that cause or worsen constipation should be avoided. The patient should consume adequate fluid and exercise regularly. Patients should receive instructions for timed toilet training (twice daily, 30 minutes after meals). Patients should push at about 50%-70% of their ability for no longer than 5 minutes and avoid postponing defecation or use of digital maneuvers to facilitate defecation.42 The patients should take 25 g of soluble fiber (e.g., psyllium) daily. Of note, the benefits of fiber can take days to weeks44 and may be limited in patients with STC and DD.45 Medications including laxatives and intestinal secretagogues (lubiprostone, linaclotide, plecanatide), and enterokinetic agents (prucalopride) can be used as adjunct therapy for management of DD.42 Their use is titrated during and after biofeedback therapy and may decrease after successful treatment.46
Biofeedback therapy
Biofeedback therapy involves operant conditioning techniques using either a solid state anorectal manometry system, electromyography, simulated balloon, or home biofeedback training devices.42,47 The goals of biofeedback therapy are to correct the abdominal pelvic muscle discoordination during defecation and improve rectal sensation to stool if impaired. Biofeedback therapy involves patient education and active training (typically six sessions, 1-2 weeks apart, with each about 30-60 minutes long), followed by a reinforcement stage (three sessions at 3, 6, and 12 months), though there are variations in training protocols.42
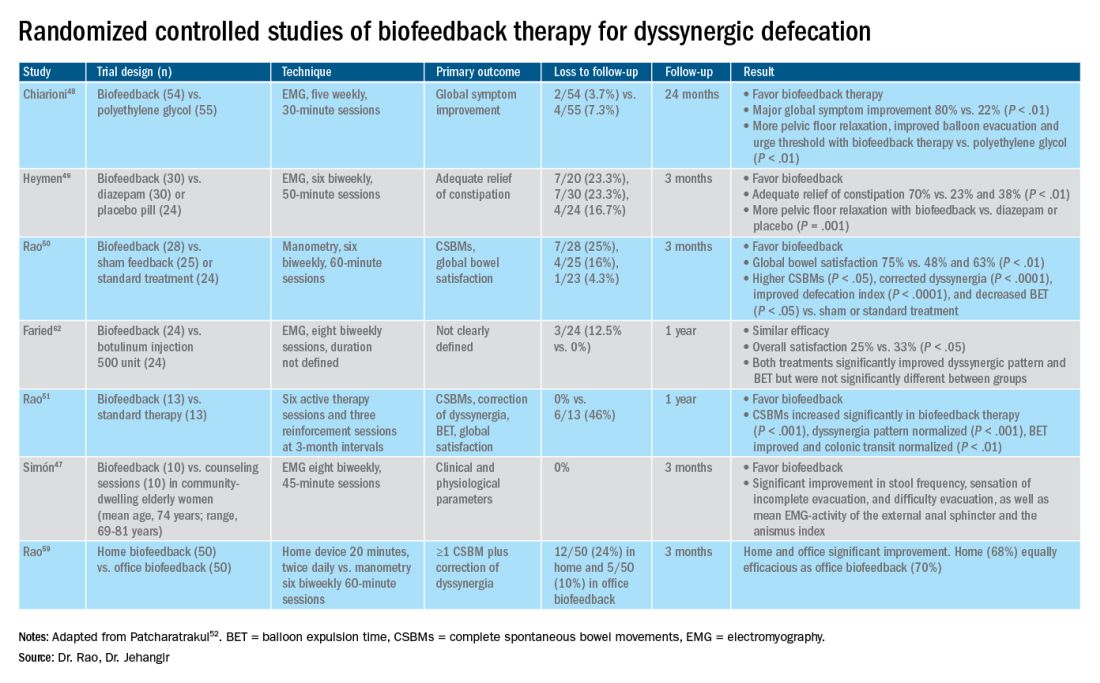
The success of biofeedback therapy depends on the patient’s motivation and the therapist’s skills.42 Compared with standard therapy (diet, exercise, pharmacotherapy), biofeedback therapy provides sustained improvement of bowel symptoms and anorectal function. Up to 70%-80% of DD patients show significant improvement of symptoms in randomized controlled trials (Table).48-52 Biofeedback therapy may also improve dyspeptic symptoms.53 Patients with harder stool consistency, greater willingness to participate, lower baseline bowel satisfaction, lower baseline anal sphincter relaxation, and prolonged balloon expulsion time, as well as patients who used digital maneuvers for defection, more commonly respond to biofeedback therapy.54,55 Longstanding laxative use has been associated with decreased response to biofeedback therapy.56 In patients with rectal hyposensitivity, barostat-assisted sensory training is more effective than a hand-held syringe technique.30 In patients with constipation predominant IBS and rectal hyposensitivity, sensory adaption training is more efficacious and better tolerated than escitalopram.30 Biofeedback therapy was afforded a grade A recommendation for treatment of DD by the American and European Societies of Neurogastroenterology and Motility.57
The access to office-based biofeedback therapy may be limited because of costs and low availability. The time required to attend multiple sessions may be burdensome for some patients, especially if they are taking time off from work. A recent study showed that patients with higher level of education may be less likely to adhere to biofeedback therapy.58 Recently, home biofeedback was shown to be noninferior to office biofeedback and was more cost-effective, which provides an alternative option for treating more patients.59
Endoscopic/surgical options
Other less effective treatment options for DD include botulinum toxin injection and myectomy.60-62 Botulinum toxin injection appears to have mixed effects with less than 50% of patients reporting symptomatic improvement, and it may cause fecal incontinence.60,63
Conclusion
DD is a common yet poorly recognized cause of constipation. Its clinical presentation overlaps with other lower-GI disorders. Its diagnosis requires detailed history, digital rectal examination, prospective stool diaries, anorectal manometry, and balloon expulsion tests. Biofeedback therapy offers excellent and sustained symptomatic improvement; however, access to office-based biofeedback is limited, and there is an urgent need for home-based biofeedback therapy programs.59
Dr. Rao is J. Harold Harrison Distinguished University Chair, professor of medicine, director of neurogastroenterology/motility, and director of digestive health at the Digestive Health Clinical Research Center Augusta (Georgia) University. He is supported by National Institutes of Health grants R01DK121003-02 and U01DK115572. Dr. Jehangir is a gastroenterology and Hepatology Fellow at the Digestive Health Clinical Research Center at Augusta University. They reported having no conflicts of interest.
References
1. Peery AF, et al. Gastroenterology. 2012;143(5):1179-1187.e3 .
2. Curtin B, et al. J Neurogastroenterol Motil. 2020 30;26(4):423-36.
3. Suares NC & Ford AC. Am J Gastroenterol. 2011 Sep;106(9):1582-91.
4. Mertz H, et al. Am J Gastroenterol. 1999;94(3):609-15.
5. Rao SS, et al. Am J Gastroenterol. 1998;93(7):1042-50.
6. Rao SSC, et al. J Clin Gastroenterol. 2004;38(8):680-5.
7. Nojkov B, et al. Am J Gastroenterol. 2019;114(11):1772-7.
8. Heaton KW, et al. Gut. 1992;33(6):818-24.
9. Prichard DO & Bharucha AE. 2018 Oct 15;7:F1000 Faculty Rev-1640.
10. Ashraf W, et al. Am J Gastroenterol. 1996;91(1):26-32.
11. Agachan F, et al.. Dis Colon Rectum. 1996;39(6):681-5.
12. Frank L, et al. Scand J Gastroenterol. 1999;34(9):870-7.
13. Marquis P, et al. Scand J Gastroenterol. 2005;40(5):540-51.
14. Yan Y, et al. Gastroenterology. 2020;158(6):S-400.
15. Rao SSC. Am J Gastroenterol. 2018;113(5):635-8.
16. Tantiphlachiva K, et al. Digital rectal examination is a useful tool for identifying patients with dyssynergia. Clin Gastroenterol Hepatol. 2010;8(11):955-60.
17. Carrington EV, et al. Nat Rev Gastroenterol Hepatol. 2018;15(5):309-23.
18. Tetangco EP, et al. Performing and analyzing high-resolution anorectal manometry. NeuroGastroLatam Rev. 2018;2:120-32.
19. Lee YY, et al. Curr Gastroenterol Rep. 2013;15(12):360.
20. Sharma M, et al. Neurogastroenterol Motil. 2020;32(10):e13910.
21. Rao SSC, et al.. Am J Gastroenterol. 2006;101(12):2790-6.
22. Carrington EV, et al. Neurogastroenterol Motil. 2020;32(1):e13679.
23. Rao SSC. Gastroenterol Clin North Am. 2008;37(3):569-86, viii.
24. Rao SSC, et al. Gastroenterology. 2016;150(4):S158-9.
25. Guinet A, et al. Int J Colorectal Dis. 2011;26(4):507-13.
26. Rattan S, et al. Gastroenterology. 1992;103(1):43-50.
27. Remes-Troche JM & Rao SSC. 2008;2(3):323-35.
28. Zaafouri H, et al..Int J Surgery. 2015. 2(1):9-17.
29. Remes-Troche JM, et al. Dis Colon Rectum. 2010;53(7):1047-54.
30. Rao SSC, et al. Gastroenterology. 2013;144(5):S-363.
31. Yu T, et al. Medicine (Baltimore). 2016;95(19):e3667.
32. Gladman MA, et al. Neurogastroenterol Motil. 2009;21(5):508-16, e4-5.
33. Lee KJ, et al. Digestion. 2006;73(2-3):133-41 .
34. Rao SSC, et al. Neurogastroenterol Motil. 2002;14(5):553-9.
35. Coss-Adame E, et al.. Clin Gastroenterol Hepatol. 2015;13(6):1143-1150.e1.
36. Chiarioni G, et al. Clin Gastroenterol Hepatol. 2014;12(12):2049-54.
37. Gu G, et al. Gastroenterology. 2018;154(6):S-545–S-546.
38. Savoye-Collet C, et al.. Gastroenterol Clin North Am. 2008;37(3):553-67, viii.
39. Videlock EJ, et al. Neurogastroenterol Motil. 2013;25(6):509-20.
40. Rao SSC, et al. Neurogastroenterol Motil. 2004;16(5):589-96.
41. Wald A, et al. Am J Gastroenterol. 2014;109(8):1141-57 ; (Quiz) 1058.
42. Rao SSC & Patcharatrakul T. J Neurogastroenterol Motil. 2016;22(3):423-35.
43. Rao SS, et al. Functional Anorectal Disorders. Gastroenterology. 2016. S0016-5085(16)00175-X.
44. Bharucha AE, et al.. Gastroenterology. 2013;144(1):218-38.
45. Voderholzer WA, et al. Am J Gastroenterol. 1997;92(1):95-8.
46. Lee HJ, et al. Neurogastroenterol Motil. 2015;27(6):787-95.
47. Simón MA & Bueno AM. J Clin Gastroenterol. 2017;51(10):e90-4.
48. Chiarioni G,et al.. Gastroenterology. 2006;130(3):657-64.
49. Heymen S, et al.. Dis Colon Rectum. 2007;50(4):428-41.
50. Rao SSC, et al. Clin Gastroenterol Hepatol. 2007;5(3):331-8.
51. Rao SSC, et al. Am J Gastroenterol. 2010;105(4):890-6.
52. Patcharatrakul T, et al. Biofeedback therapy. In Clinical and basic neurogastroenterology and motility. India: Stacy Masucci; 2020:517-32.
53. Huaman J-W, et al. Clin Gastroenterol Hepatol. 2020;18(11):2463-2470.e1.
54. Patcharatrakul T, et al. Clin Gastroenterol Hepatol. 2018;16(5):715-21.
55. Chaudhry A, et al. Gastroenterology. 2020;158(6):S-382–S-383.
56. Shim LSE, et al. Aliment Pharmacol Ther. 2011;33(11):1245-51.
57. Rao SSC, et al. Neurogastroenterol Motil. 2015;27(5):594-609.
58. Jangsirikul S, et al. Gastroenterology. 2020;158(6):S-383.
59. Rao SSC, et al. Am J Gastroenterol. 2019;114(6):938-44.
60. Ron Y, et al.. Dis Colon Rectum. 2001;44(12):1821-6.
61. Podzemny V, et al. World J Gastroenterol. 2015;21(4):1053-60.
62. Faried M, et al. J Gastrointest Surg. 2010;14(8):1235-43.
63. Hallan RI, et al. Lancet. 1988;2(8613):714-7.
Introduction
About 40% of the population experiences lower GI symptoms suggestive of gastrointestinal motility disorders.1,2 The global prevalence of chronic constipation is 18%, and the condition includes multiple overlapping subtypes.3 Evacuation disorders affect over half (59%) of patients and include dyssynergic defecation (DD).4 The inability to coordinate the abdominal, rectal, pelvic floor, and anal/puborectalis muscles to evacuate stools causes DD.5 The etiology of DD remains unclear and is often misdiagnosed. Clinically, the symptoms of DD overlap with other lower GI disorders, often leading to unnecessary and invasive procedures.2 We describe the clinical characteristics, diagnostic tools, treatment options, and evidence-based approach for the management of DD.
Clinical presentation
Over two-thirds of patients with DD acquire this disorder during adulthood, and one-third have symptoms from childhood.6 Though there is not usually an inciting event, 29% of patients report that symptoms began after events such as pregnancy or back injury,6 and opioid users have higher prevalence and severity of DD.7
Over 80% of patients report excessive straining, feelings of incomplete evacuation, and hard stools, and 50% report sensation of anal blockage or use of digital maneuvers.2 Other symptoms include infrequent bowel movements, abdominal pain, anal pain, and stool leakage.2 Evaluation of DD includes obtaining a detailed history utilizing the Bristol Stool Form Scale;8 however, patients’ recall of stool habit is often inaccurate, which results in suboptimal care.9,10 Prospective stool diaries can help to provide more objective assessment of patients’ symptoms, eliminate recall bias, and provide more reliable information. Several useful questionnaires are available for clinical and research purposes to characterize lower-GI symptoms, including the Constipation Scoring System,11 Patient Assessment of Constipation Symptoms (PAC-SYM),12 and Patient Assessment of Constipation Quality of Life (PAC-QOL).2,13 The Constipation Stool digital app enhances accuracy of data capture and offers a reliable and user-friendly method for recording bowel symptoms for patients, clinicians, and clinical investigators.14
Diagnosis
The diagnosis of DD requires careful physical and digital rectal examination together with anorectal manometry and a balloon expulsion test. Defecography and colonic transit studies provide additional assessment.
Physical examination
Abdominal examination should include palpation for stool in the colon and identification of abdominal mass or fecal impaction.2A high-quality digital rectal examination can help to identify patients who could benefit from physiological testing to confirm and treat DD.15 Rectal examination is performed by placing examiner’s lubricated gloved right index finger in a patient’s rectum, with the examiner’s left hand on patient’s abdomen, and asking the patient to push and bear down as if defecating.15 The contraction of the abdominal muscles is felt using the left hand, while the anal sphincter relaxation and degree of perineal descent are felt using the right-hand index finger.15 A diagnosis of dyssynergia is suspected if the digital rectal examination reveals two or more of the following abnormalities: inability to contract abdominal muscles (lack of push effort), inability to relax or paradoxical contraction of the anal sphincter and/or puborectalis, or absence of perineal descent.15 Digital rectal examination has good sensitivity (75%), specificity (87%), and positive predictive value (97%) for DD.16
High resolution anorectal manometry
Anorectal manometry (ARM) is the preferred method for the evaluation of defecatory disorders.17,18 ARM is best performed using the high-resolution anorectal manometry (HRAM) systems19 that consist of a flexible probe – 0.5-cm diameter with multiple circumferential sensors along the anal canal – and another two sensors inside a rectal balloon.18 It provides a topographic and waveform display of manometric pressure data (Figure). The 3D high-definition ARM probe is a rigid 1-cm probe that provides 3D topographic profiles.18 ARM is typically performed in both the left lateral position and in a more physiological seated position.20,21 There is considerable variation amongst different institutions on how to perform HRAM, and a recent International Anorectal Physiology Working Group (IAPWG) has provided consensus recommendations for performing this test.22 The procedure for performing HRAM is reviewed elsewhere, but the key elements are summarized below.18
Push maneuver: On HRAM, after the assessment of resting and squeeze anal sphincter pressures, the patient is asked to push or bear down as if to defecate while lying in left lateral decubitus position. The best of two attempts that closely mimics a normal bearing down maneuver is used for categorizing patient’s defecatory pattern.18 In patients with DD, at least four distinct dyssynergia phenotypes have been recognized (Figure),23 though recent studies suggest eight patterns.24 Defecation index (maximum rectal pressure/minimum residual anal pressure when bearing down) greater than 1.2 is considered normal.18
Simulated defecation on commode: The subject is asked to attempt defecation while seated on a commode with intrarectal balloon filled with 60 cc of air, and both the defecation pattern(s) and defecation index are calculated. A lack of coordinated push effort is highly suggestive of DD.21
Rectoanal Inhibitory Reflex (RAIR): RAIR describes the reflex relaxation of the internal anal sphincter after rectal distension. RAIR is dependent on intact autonomic ganglia and myenteric plexus25and is mediated by the release of nitric oxide and vasoactive intestinal peptide.26 The absence of RAIR suggests Hirschsprung disease.22.27.28
Rectal sensory testing: Intermittent balloon distension of the rectum with incremental volumes of air induces a range of rectal sensations that include first sensation, desire to defecate, urgency to defecate, and maximum tolerable volume. Rectal hyposensitivity is diagnosed when two or more sensory thresholds are higher than those seen in normal subjects29.30 and likely results from disruption of afferent gut-brain pathways, cortical perception/rectal wall dysfunction, or both.29 Rectal hyposensitivity affects 40% of patients with constipation30and is associated with DD but not delayed colonic transit.31 Rectal hyposensitivity may also be seen in patients with diabetes or fecal incontinence.18 About two-thirds of patients with rectal hyposensitivity have rectal hypercompliance, and some have megarectum.32 Some patients with DD have coexisting irritable bowel syndrome (IBS) and may have rectal hypersensitivity.18,33 Rectal compliance is measured alongside rectal sensitivity analysis by plotting a graph between the change in intraballoon volume (mL) and change in intrarectal pressures (mm Hg) during incremental balloon distensions.18.34 Rectal hypercompliance may be seen in megarectum and dyssynergic defecation.34,35 Rectal hypocompliance may be seen in patients with inflammatory bowel disease, postpelvic radiation, chronic ischemia, and advanced age.18
Balloon expulsion test: This test is performed by placing a plastic probe with a balloon in the rectum and filling it with 50 cc of warm water. Patients are given 5 minutes to expel the balloon while sitting on a commode. Balloon expulsion time of more than 1 minute suggests a diagnosis of DD,21 although 2 minutes provides a higher level of agreement with manometric findings.36 Balloon type and body position can influence the results.37 Inability to expel the balloon with normal manometric findings is considered an inconclusive finding per the recent London Classification (i.e., it may be associated with generation of anorectal symptoms, but the clinical relevance of this finding is unclear as it may also be seen in healthy subjects).22
Defecography
Defecography is a dynamic fluoroscopic study performed in the sitting position after injecting 150 mL of barium paste into the patient’s rectum. Defecography provides useful information about structural changes (e.g., rectoceles, enteroceles, rectal prolapse, and intussusception), DD, and descending perineum syndrome.38 Methodological differences, radiation exposure, and poor interobserver agreement have limited its wider use; therefore, anorectal manometry and the balloon expulsion test are recommended for the initial evaluation of DD.39 Magnetic resonance defecography may be more useful.17,38
Colonic transit studies
Colonic transit study can be assessed using radiopaque markers, wireless motility capsule, or scintigraphy. Wireless motility capsule and scintigraphy have the advantage of determining gastric, small bowel, and whole gut transit times as well. About two-thirds of patients with DD have slow transit constipation (STC),6 which improves after treatment of DD.40 Hence, in patients with chronic constipation, evaluation and management of DD is recommended first. If symptoms persist, then consider colonic transit assessment.41 Given the overlapping nature of the conditions, documentation of STC at the outset could facilitate treatment of both.
Diagnostic criteria for DD
Patients should fulfill the following criteria for diagnosis of DD:42,43
- Fulfill symptom(s) diagnostic criteria for functional constipation and/or constipation-predominant IBS.
- Demonstrate dyssynergic pattern (Types I-IV; Figure) during attempted defecation on manometry recordings.
- Meet one or more of the following criteria:
- Inability to expel an artificial stool (50 mL water-filled balloon) within 1 minute.
- Inability to evacuate or retention of 50% or more of barium during defecography. (Some institutions use a prolonged colonic transit time: greater than 5 markers or 20% or higher marker retention on a plain abdominal x-Ray at 120 hours after ingestion of one radio-opaque marker capsule containing 24 radio-opaque markers.)
Treatment of DD
The treatment modalities for DD depend on several factors: patient’s age, comorbidities, underlying pathophysiology, and patient expectations. Treatment options include standard management of constipation, but biofeedback therapy is the mainstay.
Standard management
Medications that cause or worsen constipation should be avoided. The patient should consume adequate fluid and exercise regularly. Patients should receive instructions for timed toilet training (twice daily, 30 minutes after meals). Patients should push at about 50%-70% of their ability for no longer than 5 minutes and avoid postponing defecation or use of digital maneuvers to facilitate defecation.42 The patients should take 25 g of soluble fiber (e.g., psyllium) daily. Of note, the benefits of fiber can take days to weeks44 and may be limited in patients with STC and DD.45 Medications including laxatives and intestinal secretagogues (lubiprostone, linaclotide, plecanatide), and enterokinetic agents (prucalopride) can be used as adjunct therapy for management of DD.42 Their use is titrated during and after biofeedback therapy and may decrease after successful treatment.46
Biofeedback therapy
Biofeedback therapy involves operant conditioning techniques using either a solid state anorectal manometry system, electromyography, simulated balloon, or home biofeedback training devices.42,47 The goals of biofeedback therapy are to correct the abdominal pelvic muscle discoordination during defecation and improve rectal sensation to stool if impaired. Biofeedback therapy involves patient education and active training (typically six sessions, 1-2 weeks apart, with each about 30-60 minutes long), followed by a reinforcement stage (three sessions at 3, 6, and 12 months), though there are variations in training protocols.42
The success of biofeedback therapy depends on the patient’s motivation and the therapist’s skills.42 Compared with standard therapy (diet, exercise, pharmacotherapy), biofeedback therapy provides sustained improvement of bowel symptoms and anorectal function. Up to 70%-80% of DD patients show significant improvement of symptoms in randomized controlled trials (Table).48-52 Biofeedback therapy may also improve dyspeptic symptoms.53 Patients with harder stool consistency, greater willingness to participate, lower baseline bowel satisfaction, lower baseline anal sphincter relaxation, and prolonged balloon expulsion time, as well as patients who used digital maneuvers for defection, more commonly respond to biofeedback therapy.54,55 Longstanding laxative use has been associated with decreased response to biofeedback therapy.56 In patients with rectal hyposensitivity, barostat-assisted sensory training is more effective than a hand-held syringe technique.30 In patients with constipation predominant IBS and rectal hyposensitivity, sensory adaption training is more efficacious and better tolerated than escitalopram.30 Biofeedback therapy was afforded a grade A recommendation for treatment of DD by the American and European Societies of Neurogastroenterology and Motility.57
The access to office-based biofeedback therapy may be limited because of costs and low availability. The time required to attend multiple sessions may be burdensome for some patients, especially if they are taking time off from work. A recent study showed that patients with higher level of education may be less likely to adhere to biofeedback therapy.58 Recently, home biofeedback was shown to be noninferior to office biofeedback and was more cost-effective, which provides an alternative option for treating more patients.59
Endoscopic/surgical options
Other less effective treatment options for DD include botulinum toxin injection and myectomy.60-62 Botulinum toxin injection appears to have mixed effects with less than 50% of patients reporting symptomatic improvement, and it may cause fecal incontinence.60,63
Conclusion
DD is a common yet poorly recognized cause of constipation. Its clinical presentation overlaps with other lower-GI disorders. Its diagnosis requires detailed history, digital rectal examination, prospective stool diaries, anorectal manometry, and balloon expulsion tests. Biofeedback therapy offers excellent and sustained symptomatic improvement; however, access to office-based biofeedback is limited, and there is an urgent need for home-based biofeedback therapy programs.59
Dr. Rao is J. Harold Harrison Distinguished University Chair, professor of medicine, director of neurogastroenterology/motility, and director of digestive health at the Digestive Health Clinical Research Center Augusta (Georgia) University. He is supported by National Institutes of Health grants R01DK121003-02 and U01DK115572. Dr. Jehangir is a gastroenterology and Hepatology Fellow at the Digestive Health Clinical Research Center at Augusta University. They reported having no conflicts of interest.
References
1. Peery AF, et al. Gastroenterology. 2012;143(5):1179-1187.e3 .
2. Curtin B, et al. J Neurogastroenterol Motil. 2020 30;26(4):423-36.
3. Suares NC & Ford AC. Am J Gastroenterol. 2011 Sep;106(9):1582-91.
4. Mertz H, et al. Am J Gastroenterol. 1999;94(3):609-15.
5. Rao SS, et al. Am J Gastroenterol. 1998;93(7):1042-50.
6. Rao SSC, et al. J Clin Gastroenterol. 2004;38(8):680-5.
7. Nojkov B, et al. Am J Gastroenterol. 2019;114(11):1772-7.
8. Heaton KW, et al. Gut. 1992;33(6):818-24.
9. Prichard DO & Bharucha AE. 2018 Oct 15;7:F1000 Faculty Rev-1640.
10. Ashraf W, et al. Am J Gastroenterol. 1996;91(1):26-32.
11. Agachan F, et al.. Dis Colon Rectum. 1996;39(6):681-5.
12. Frank L, et al. Scand J Gastroenterol. 1999;34(9):870-7.
13. Marquis P, et al. Scand J Gastroenterol. 2005;40(5):540-51.
14. Yan Y, et al. Gastroenterology. 2020;158(6):S-400.
15. Rao SSC. Am J Gastroenterol. 2018;113(5):635-8.
16. Tantiphlachiva K, et al. Digital rectal examination is a useful tool for identifying patients with dyssynergia. Clin Gastroenterol Hepatol. 2010;8(11):955-60.
17. Carrington EV, et al. Nat Rev Gastroenterol Hepatol. 2018;15(5):309-23.
18. Tetangco EP, et al. Performing and analyzing high-resolution anorectal manometry. NeuroGastroLatam Rev. 2018;2:120-32.
19. Lee YY, et al. Curr Gastroenterol Rep. 2013;15(12):360.
20. Sharma M, et al. Neurogastroenterol Motil. 2020;32(10):e13910.
21. Rao SSC, et al.. Am J Gastroenterol. 2006;101(12):2790-6.
22. Carrington EV, et al. Neurogastroenterol Motil. 2020;32(1):e13679.
23. Rao SSC. Gastroenterol Clin North Am. 2008;37(3):569-86, viii.
24. Rao SSC, et al. Gastroenterology. 2016;150(4):S158-9.
25. Guinet A, et al. Int J Colorectal Dis. 2011;26(4):507-13.
26. Rattan S, et al. Gastroenterology. 1992;103(1):43-50.
27. Remes-Troche JM & Rao SSC. 2008;2(3):323-35.
28. Zaafouri H, et al..Int J Surgery. 2015. 2(1):9-17.
29. Remes-Troche JM, et al. Dis Colon Rectum. 2010;53(7):1047-54.
30. Rao SSC, et al. Gastroenterology. 2013;144(5):S-363.
31. Yu T, et al. Medicine (Baltimore). 2016;95(19):e3667.
32. Gladman MA, et al. Neurogastroenterol Motil. 2009;21(5):508-16, e4-5.
33. Lee KJ, et al. Digestion. 2006;73(2-3):133-41 .
34. Rao SSC, et al. Neurogastroenterol Motil. 2002;14(5):553-9.
35. Coss-Adame E, et al.. Clin Gastroenterol Hepatol. 2015;13(6):1143-1150.e1.
36. Chiarioni G, et al. Clin Gastroenterol Hepatol. 2014;12(12):2049-54.
37. Gu G, et al. Gastroenterology. 2018;154(6):S-545–S-546.
38. Savoye-Collet C, et al.. Gastroenterol Clin North Am. 2008;37(3):553-67, viii.
39. Videlock EJ, et al. Neurogastroenterol Motil. 2013;25(6):509-20.
40. Rao SSC, et al. Neurogastroenterol Motil. 2004;16(5):589-96.
41. Wald A, et al. Am J Gastroenterol. 2014;109(8):1141-57 ; (Quiz) 1058.
42. Rao SSC & Patcharatrakul T. J Neurogastroenterol Motil. 2016;22(3):423-35.
43. Rao SS, et al. Functional Anorectal Disorders. Gastroenterology. 2016. S0016-5085(16)00175-X.
44. Bharucha AE, et al.. Gastroenterology. 2013;144(1):218-38.
45. Voderholzer WA, et al. Am J Gastroenterol. 1997;92(1):95-8.
46. Lee HJ, et al. Neurogastroenterol Motil. 2015;27(6):787-95.
47. Simón MA & Bueno AM. J Clin Gastroenterol. 2017;51(10):e90-4.
48. Chiarioni G,et al.. Gastroenterology. 2006;130(3):657-64.
49. Heymen S, et al.. Dis Colon Rectum. 2007;50(4):428-41.
50. Rao SSC, et al. Clin Gastroenterol Hepatol. 2007;5(3):331-8.
51. Rao SSC, et al. Am J Gastroenterol. 2010;105(4):890-6.
52. Patcharatrakul T, et al. Biofeedback therapy. In Clinical and basic neurogastroenterology and motility. India: Stacy Masucci; 2020:517-32.
53. Huaman J-W, et al. Clin Gastroenterol Hepatol. 2020;18(11):2463-2470.e1.
54. Patcharatrakul T, et al. Clin Gastroenterol Hepatol. 2018;16(5):715-21.
55. Chaudhry A, et al. Gastroenterology. 2020;158(6):S-382–S-383.
56. Shim LSE, et al. Aliment Pharmacol Ther. 2011;33(11):1245-51.
57. Rao SSC, et al. Neurogastroenterol Motil. 2015;27(5):594-609.
58. Jangsirikul S, et al. Gastroenterology. 2020;158(6):S-383.
59. Rao SSC, et al. Am J Gastroenterol. 2019;114(6):938-44.
60. Ron Y, et al.. Dis Colon Rectum. 2001;44(12):1821-6.
61. Podzemny V, et al. World J Gastroenterol. 2015;21(4):1053-60.
62. Faried M, et al. J Gastrointest Surg. 2010;14(8):1235-43.
63. Hallan RI, et al. Lancet. 1988;2(8613):714-7.
S1P-receptor modulator shows promise in phase 2b AD trial
, according to researchers who released their findings at the American Academy of Dermatology Virtual Meeting Experience.

The drug, called etrasimod, did not meet the primary endpoint for improvement in the Eczema Area and Severity Index. However, nearly a third (29.8%) of those treated with a 2-mg dose daily reached “clear” or “almost clear” skin at 12 weeks vs. 13% for placebo as measured with clinician-reported Validated Investigator Global Assessment (vIGA) scores of 0 or 1 (P = .0450), study presenter Emma Guttman-Yassky, MD, PhD, professor and chair, department of dermatology, Icahn School of Medicine at Mount Sinai, New York, noted in an interview.
“This was a short proof-of-concept study to show this mechanism is valid. The results are promising,” Dr. Guttman-Yassky said. “They tell us that this can be a valid treatment for atopic dermatitis, a completely new mechanism of action that has potential in improving and even modifying the disease.”
Arena Pharmaceuticals, which developed the drug, hopes to launch a phase 3 study of the medication.
The ADVISE study enrolled 140 people in the United States, Australia, and Canada with chronic, moderate to severe eczema lasting for at least a year. (Their average age was 43, 61% were female, and 60% were White). They were randomly assigned to cohorts who took 1 mg or 2 mg daily of etrasimod or placebo for 12 weeks.
Those in the 2-mg cohort saw their scores on the peak pruritus numeric rating scale (PP-NRS) fall by 15.3% at week 4, compared with 1% for placebo (P = .0380); at week 12, the scores fell by 34.1% among those on 2 mg vs. 23.9% for placebo (P = .15 49). At 12 weeks, patients on the 2-mg dose also had more improvement in the Dermatology Life Quality Index or DLQI (a 7.6-point decline in degree of impairment vs. 4.2 points for placebo, P = .0122) and in the Patient-Oriented Eczema Measure or POEM (8.4-point reduction versus 4 points for placebo, P = .0045).
“Basically, there was a dose response. It doesn’t show a plateau,” Dr. Guttman-Yassky said. “ I think the data will be even better in a longer study.”
In regards to adverse events, participants who took etrasimod reported nausea, constipation, back pain, and dizziness at levels above 5% and above the levels for the placebo.
The drug appears to work by preventing immune cells from entering the skin, Dr. Guttman-Yassky said, and may be able to treat existing lesions and prevent new ones from appearing. Etrasimod is also being explored as a treatment for ulcerative colitis, alopecia areata, and multiple sclerosis, she said.
Dr. Guttman-Yassky noted that 12 weeks is a short time in AD, and she said some participants left the study because it took place during the coronavirus pandemic.
“There’s a huge unmet need in atopic dermatitis,” she said. “We need more drugs and different classes of drugs to treat the disease in all patients.” While biologics are often helpful, she said, they don’t work in many cases. And “some patients just don’t want a biologic, no matter how much we tell them it’s safe, and they may want an oral medication,” she said.
Dr. Guttman-Yassky is a paid consultant and researcher for Arena.
, according to researchers who released their findings at the American Academy of Dermatology Virtual Meeting Experience.
The drug, called etrasimod, did not meet the primary endpoint for improvement in the Eczema Area and Severity Index. However, nearly a third (29.8%) of those treated with a 2-mg dose daily reached “clear” or “almost clear” skin at 12 weeks vs. 13% for placebo as measured with clinician-reported Validated Investigator Global Assessment (vIGA) scores of 0 or 1 (P = .0450), study presenter Emma Guttman-Yassky, MD, PhD, professor and chair, department of dermatology, Icahn School of Medicine at Mount Sinai, New York, noted in an interview.
“This was a short proof-of-concept study to show this mechanism is valid. The results are promising,” Dr. Guttman-Yassky said. “They tell us that this can be a valid treatment for atopic dermatitis, a completely new mechanism of action that has potential in improving and even modifying the disease.”
Arena Pharmaceuticals, which developed the drug, hopes to launch a phase 3 study of the medication.
The ADVISE study enrolled 140 people in the United States, Australia, and Canada with chronic, moderate to severe eczema lasting for at least a year. (Their average age was 43, 61% were female, and 60% were White). They were randomly assigned to cohorts who took 1 mg or 2 mg daily of etrasimod or placebo for 12 weeks.
Those in the 2-mg cohort saw their scores on the peak pruritus numeric rating scale (PP-NRS) fall by 15.3% at week 4, compared with 1% for placebo (P = .0380); at week 12, the scores fell by 34.1% among those on 2 mg vs. 23.9% for placebo (P = .15 49). At 12 weeks, patients on the 2-mg dose also had more improvement in the Dermatology Life Quality Index or DLQI (a 7.6-point decline in degree of impairment vs. 4.2 points for placebo, P = .0122) and in the Patient-Oriented Eczema Measure or POEM (8.4-point reduction versus 4 points for placebo, P = .0045).
“Basically, there was a dose response. It doesn’t show a plateau,” Dr. Guttman-Yassky said. “ I think the data will be even better in a longer study.”
In regards to adverse events, participants who took etrasimod reported nausea, constipation, back pain, and dizziness at levels above 5% and above the levels for the placebo.
The drug appears to work by preventing immune cells from entering the skin, Dr. Guttman-Yassky said, and may be able to treat existing lesions and prevent new ones from appearing. Etrasimod is also being explored as a treatment for ulcerative colitis, alopecia areata, and multiple sclerosis, she said.
Dr. Guttman-Yassky noted that 12 weeks is a short time in AD, and she said some participants left the study because it took place during the coronavirus pandemic.
“There’s a huge unmet need in atopic dermatitis,” she said. “We need more drugs and different classes of drugs to treat the disease in all patients.” While biologics are often helpful, she said, they don’t work in many cases. And “some patients just don’t want a biologic, no matter how much we tell them it’s safe, and they may want an oral medication,” she said.
Dr. Guttman-Yassky is a paid consultant and researcher for Arena.
REPORTING FROM AAD VMX 2021
IMvigor130: A treasure trove of data for urothelial carcinoma

A second interim overall survival (OS) analysis suggested that atezolizumab monotherapy provides a clinical benefit as first-line treatment for mUC patients with PD-L1–expressing immune cells representing at least 5% of the tumor area (IC2/3), including patients who are cisplatin ineligible.
The analysis also suggested that atezolizumab plus chemotherapy produces similar OS results as chemotherapy plus placebo, but patients receiving atezolizumab may do better with cisplatin-based chemotherapy than with carboplatin-based chemotherapy.
These results were reported in two presentations at the American Association for Cancer Research Annual Meeting 2021: Week 1.
Current guidelines from the National Comprehensive Cancer Network and the European Society for Medical Oncology recommend atezolizumab monotherapy for cisplatin-ineligible patients with mUC and PD-L1 IC2/3.
The ongoing phase 3 IMvigor130 trial was designed to compare atezolizumab plus gemcitabine/platinum chemotherapy, atezolizumab monotherapy, and placebo plus chemotherapy. Platinum-based chemotherapy included either cisplatin or carboplatin, per investigator choice.
Coprimary endpoints for IMvigor130 were progression-free survival (PFS) and OS for atezolizumab plus chemotherapy versus placebo plus chemotherapy. The hierarchical study design dictated that OS would only be assessed for the comparison of atezolizumab monotherapy versus placebo-chemotherapy in the overall and PD-L1 IC2/3 populations if there was statistical improvement in OS for the atezolizumab-chemotherapy arm over the placebo-chemotherapy arm.
Secondary endpoints were overall response rate (ORR; per RECIST 1.1), duration of response (DOR) for all patients, and PFS for the comparison between atezolizumab monotherapy and placebo-chemotherapy. Exploratory analyses were performed on cisplatin-ineligible patients by PD-L1 status.
At the time of the primary analysis, an OS benefit for atezolizumab-chemotherapy over placebo-chemotherapy was not observed. Therefore, the OS benefit of atezolizumab monotherapy versus placebo-chemotherapy was not assessed. However, a trend toward improved OS was noted with atezolizumab for PD-L1 IC2/3 patients, including cisplatin-ineligible patients.
Atezolizumab vs. placebo-chemo
Ian D. Davis, MBBS, PhD, of Monash University in Melbourne, presented the second interim analysis of OS with atezolizumab monotherapy versus placebo plus chemotherapy (Abstract CT040).
The median follow-up was 14.9 months for atezolizumab monotherapy (n = 360) and 11.8 months for placebo-chemotherapy (n = 359). The median OS was 15.2 months and 13.1 months, respectively (hazard ratio, 0.99; 95% confidence interval, 0.83-1.19). There was no apparent OS benefit of atezolizumab for any clinically selected subgroup.
The ORR was 23.4% for atezolizumab monotherapy and 44.1% for placebo-chemotherapy. The median DOR was more than 3.5 times longer for atezolizumab monotherapy than for placebo-chemotherapy – 29.6 months and 8.1 months, respectively.
Although there was no formal statistical comparison, exploratory subgroup analyses demonstrated that the median OS for the PD-L1 IC2/3 patients appeared higher in the atezolizumab monotherapy arm than in the placebo-chemotherapy arm – 27.5 months and 16.7 months, respectively.
Similarly, the median OS for cisplatin-ineligible PD-L1 IC2/3 patients appeared higher for atezolizumab monotherapy than for placebo-chemotherapy – 18.6 months and 10.0 months, respectively.
In terms of safety, atezolizumab monotherapy compared favorably with placebo plus chemotherapy. There were similar numbers of grade 3/4 adverse events and comparable adverse events leading to discontinuation of treatment in both arms.
The atezolizumab monotherapy arm had fewer adverse events leading to withdrawal from any treatment, when compared with the placebo-chemotherapy arm – 7% and 34%, respectively. Two patients in the atezolizumab arm and one in the placebo-chemotherapy died of treatment-related causes.
Atezolizumab-chemo vs. placebo-chemo
Matthew D. Galsky, MD, of Mount Sinai Health System and Icahn School of Medicine at Mount Sinai in New York, presented the second interim OS comparison of atezolizumab plus chemotherapy with placebo plus chemotherapy (Abstract CT042).
The primary analysis had shown a statistically significant improvement in PFS for patients on atezolizumab-chemotherapy, in comparison with placebo-chemotherapy, with encouraging OS improvement, but the boundary for declaring significance for the OS endpoint was not crossed (Lancet. 2020 May 16;395[10236]:1547-1557).
Because IMvigor130 included both patients who received cisplatin and patients who investigators deemed cisplatin ineligible, the second interim analysis included an exploratory analysis of whether there was a difference in outcome between patients who received or did not receive cisplatin.
At a median follow-up of 13.3 months, the median OS was not significantly different in the atezolizumab-chemotherapy arm (n = 451) and the placebo-chemotherapy arm (n = 400) – 16.1 months and 13.4 months, respectively (HR, 0.84; 95% CI, 0.71-1.00; P = .026).
There were no clinically or pathologically defined subgroups that experienced an OS benefit from atezolizumab-chemotherapy over placebo-chemotherapy.
As for subsequent nonprotocol therapy, 24% of the placebo-chemotherapy arm received an immune checkpoint inhibitor at progression, as did 7% of the atezolizumab-chemotherapy arm. There was no difference in receipt of an immune checkpoint inhibitor post progression among patients treated with cisplatin versus carboplatin.
The benefit of combining atezolizumab with chemotherapy appeared more substantial with cisplatin-based chemotherapy than with carboplatin-based treatment. With cisplatin, the median OS was 21.6 months for the atezolizumab-chemotherapy arm and 14.6 months for the placebo-chemotherapy arm. With carboplatin, the median OS was 14.3 months and 13.0 months, respectively.
PD-L1 status was prognostic for patients who received cisplatin, with lower OS being observed for patients with PD-L1 IC0/1 status and higher OS observed for patients with PD-L1 IC2/3 status. Atezolizumab plus cisplatin-based chemotherapy appeared superior to cisplatin-based chemotherapy alone in both PD-L1–low and –high groups.
Atezolizumab did not seem to benefit patients who were treated with carboplatin, and PD-L1 status did not seem to influence OS among the carboplatin-treated patients.
Although similar ORR results were seen with cisplatin and carboplatin, there appeared to be a longer median DOR among cisplatin-treated patients who received atezolizumab than among those who did not – 13.2 months and 8.3 months, respectively.
No such benefit from atezolizumab was seen in carboplatin-treated patients. The median DOR was 8.1 months among patients who received atezolizumab and 7.1 months among those who did not.
The overall safety profile for atezolizumab plus chemotherapy was consistent with prior reports of the combination. Treatment-related grade 3-5 adverse events were similar on the atezolizumab-chemotherapy arm and the placebo-chemotherapy arm.
The present and future
The investigators who presented the second interim analysis for OS of the IMvigor130 trial were appropriately modest in their conclusions. After all, the prespecified boundary for significant improvement in OS for the addition of atezolizumab to chemotherapy was not crossed. No change in guideline-based clinical practice would be appropriate at the present time.
The various exploratory analyses are hypothesis generating and invite potential mechanistic explanations. However, given the nonrandom allocation of patients to cisplatin- or carboplatin-based chemotherapy, unrecognized variables may have influenced any appearance of a difference in OS between the regimens.
In IMvigor130, treatment was given until unacceptable toxicity or disease progression. It is uncertain whether the current National Comprehensive Cancer Network category 1 recommendation of chemotherapy induction followed by immune checkpoint inhibitor maintenance therapy will prove superior to the IMvigor130 strategy.
Clearly – and concordant with current treatment guidelines – atezolizumab monotherapy can benefit some patients, though the response rate for atezolizumab monotherapy was lower than for chemotherapy (23.4% vs. 44.1%).
As noted by the session chair, Marina Chiara Garassino, MD, of the University of Chicago, the OS curves were initially superior for chemotherapy over atezolizumab. However, the apparent early OS benefit for chemotherapy dissipated over time and, among responders to atezolizumab, response duration was considerably longer than for chemotherapy.
IMvigor130 will ultimately have a final OS analysis to clarify the relative benefits of the various treatment strategies. Fortunately, this large phase 3 study will yield a treasure trove of data to inform future research and build on the advances of recent years for patients with advanced urothelial cancer.
IMvigor130 is sponsored by Hoffmann-La Roche. Dr. Davis, Dr. Galsky, and Dr. Garassino disclosed relationships with Hoffmann-La Roche and many other companies.
Dr. Lyss was a community-based medical oncologist and clinical researcher for more than 35 years before his recent retirement. His clinical and research interests were focused on breast and lung cancers, as well as expanding clinical trial access to medically underserved populations. He is based in St. Louis. He has no conflicts of interest.
AACR 2021
Bimekizumab tops adalimumab for plaque psoriasis
The interleukin-17A and 17F blocker has also racked up significant wins against ustekinumab and secukinumab, other standard biologic options for adults with moderate to severe plaque psoriasis, and is currently under review for the indication by the U.S. Food and Drug Administration and European Medicines Agency.
In the adalimumab trial, dubbed BE SURE, bimekizumab had higher clinical response rates than the tumor necrosis factor (TNF) blocker over the 24-week head-to-head phase of the 478-patient trial, with substantial improvements in both Psoriasis Area and Severity Index (PASI) 90 response and Investigator’s Global Assessment (IGA) scores of 0 or 1, which signifies clear or almost clear skin.
The results were published in the New England Journal of Medicine and scheduled to be presented at the American Academy of Dermatology Virtual Meeting Experience on April 24.
“The data look good,” said psoriasis specialist Steven Feldman, MD, PhD, professor of dermatology at Wake Forest School of Medicine in Winston-Salem, N.C., when asked for comment.
Bimekizumab “appears more effective than current options. The big question is safety. The 10%-20% rate of oral candidiasis is much higher than other treatments but should be entirely manageable, as long as there are no unknown worse candida issues.” In addition, that there were no cases of inflammatory bowel disease in BE SURE “is very encouraging, as that is one of the limitations for existing IL-17 blockers,” he said.
The trial was launched after previous reports suggested that IL-17A inhibition may be better than TNF blockade in controlling psoriasis, said investigators led by Richard Warren, MBChB, PhD, a dermatology professor at the University of Manchester (England).
Patients were assigned evenly to one of three regimens: subcutaneous bimekizumab at a dose of 320 mg every 4 weeks for 56 weeks; bimekizumab at 320 mg every 4 weeks for 16 weeks, then every 8 weeks out to 56 weeks; or subcutaneous adalimumab at a dose of 40 mg every 2 weeks for 24 weeks, followed by bimekizumab at a dose of 320 mg every 4 weeks to week 56.
At week 16, 86.2% of those in the bimekizumab group but just 47.2% in the adalimumab group had a PASI 90 response (P < .001), and 85.3% of the bimekizumab versus 57.2% in the adalimumab group had an IGA score of 0 or 1 (P < .001).
About 52% of the adalimumab group had a PASI 90 response at week 24, when they were switched to bimekizumab. By week 56, their PASI 90 response rate rose to 81.8%. Skin clearance was maintained through week 56 whether subjects were dosed every 4 or every 8 weeks with the interleukin blocker.
The incidence of oral candidiasis (9.5%-17.4% vs. 0% with adalimumab alone) was similar to other trials and likely because of the short circuiting of interleukin-17, which plays a role protecting against candida. Most cases were mild to moderate.
The increased risk of oral thrush with bimekizumab “may not be particularly clinically meaningful, especially if” it can be managed by an occasional fluconazole pill. It’s “reassuring … if that’s the biggest problem with the drug, or we may wonder if, in real life use, more severe, perhaps esophageal or systemic fungal infection may be observed,” Dr. Feldman said in a recent editorial.
“Not knowing the future may make some physicians reticent about using the drug when other options are available, at least until data are available on much larger numbers of exposed patients treated for longer periods of time,” he and his colleague William Huang, MD, also a dermatologist at Wake Forest, said.
One of the limits of the trial was that the head-to-head portion was only 24 weeks, “which was too brief for a comparison of safety between bimekizumab and adalimumab in a lifelong disease,” the investigators noted.
The mean age of the patients was 44.9 years, and the mean baseline PASI score was 19.8.
Although the initial dose of adalimumab in the study was 40 mg, labeling recommends an initial dose of 80 mg for the TNF blocker.
Bimekizumab is also being evaluated in phase 3 trials for psoriatic arthritis, ankylosing spondylitis, nonradiographic axial spondyloarthritis, and hidradenitis suppurativa, according to UCB Pharma.
The study was funded by UCB Pharma. The investigators had numerous disclosures, including Dr. Warren who reported grants and personal fees from the company. Dr. Feldman reported receiving research, speaking, and/or consulting support from UCB Pharma and other companies.
A version of this article first appeared on Medscape.com.
Nurses or physicians: Who are at highest suicide risk?
Female nurses are at significantly greater risk of dying by suicide than physicians in findings that contradict previous research suggesting doctors are at greatest risk.

Results of a large retrospective cohort study show that nurses of both sexes were 18% more likely to die by suicide, compared with individuals in the general population. In addition, compared with female physicians, the suicide risk among female nurses was 70% higher.
“The main takeaway is that the risk of suicide among nurses is twice that of the general population and even higher than that among physicians, a population known to be at high risk,” lead author Matthew Davis, MPH, PhD, associate professor, department of systems, populations, and leadership, University of Michigan, Ann Arbor, said in an interview.
The study was published online April 14, 2021, in JAMA Psychiatry.
Focus on physicians
Compared with the general public, health care workers are at higher risk for suicide, but most studies of suicide have focused on physicians, Dr. Davis said.
Although “there were several older studies hinting that there might be a difference in suicide risk among nurses,” the data were insufficient to “make an overall conclusion,” he noted.
For that reason, his group “set out to make the best estimates possible” by using a large dataset from the National Violent Death Reporting System of the Centers for Disease Control and Prevention spanning the years 2007-2018 and focusing on suicides by individuals aged 30 years and older (n = 159,372 suicides).
Additional workforce data were acquired from the Bureau of Labor Statistics and the Association of Medical Colleges State Physician Workforce Data.
An important area of focus was method of suicide.
“ and know how to use them to overdose, which also increases their risk,” Dr. Davis said in a press release.
Enormous job strain
The researchers identified 2,374 suicides among nurses, 857 suicides among physicians, and 156,141 suicides in the general population.
Compared with the general population, nurses who died by suicide were more likely to be women, less racially diverse (non-Hispanic White), and more likely to have been married.
Rates of suicide were higher among nurses than among the general population, with a sex-adjusted incidence for 2017-2018 of 23.8 per 100,000 versus 20.1 per 100,000 (relative risk, 1.18; 95% confidence interval, 1.03-1.36).
The difference between suicide rates among female nurses and among women in the general population was even more striking: In 2017-2018, the suicide incidence among nurses was 17.1 per 100,000 versus 8.6 per 100,000 in the population at large (RR, 1.99; 95% CI, 1.82-2.18).
“In absolute terms, being a female nurse was associated with an additional 8.5 suicides per 100,000 (7.0-10.0), compared with the general population,” the authors reported.
In contrast, overall physician suicide rates were not statistically different from those of the general population (RR, 1.01; 95% CI, 0.79-1.30) except during the period 2011-2012 (11.7 per 100,000; 95% CI, 6.6-16.8 vs. 7.5 per 100,000; 95% CI, 7.2-7.7).
Clinicians of both sexes were more likely to use poisoning and less likely to use a firearm, compared with individuals in the general population who died by suicide. For example, 24.9% (23.5%-26.4%) of nurse suicides involved poisoning, compared to 16.8% (16.6%-17.0%) of suicides in the general population.
Toxicology reports showed that the presence of antidepressants, benzodiazepines, barbiturates, and opiates was more common in clinician suicides than suicides in the general population.
Dr. Davis suggested the higher risk for suicide among nurses, compared with physicians, might be attributed to “high job demands – for example, nurses provide the majority of bedside care, work long shifts in stressful environments, and have less autonomy.
“Health care workers and friends and family of health care workers need to be aware of mental health issues and suicide risk that can be associated with the job and, most importantly, recognize those who may be struggling and encourage them to get help by calling the National Suicide Prevention Lifeline,” he said.
Other potential contributors include “avoidance of mental health services due to stigma and greater access to the means to commit suicide via medication,” Dr. Davis noted.
Benchmark research
Commenting on the study, Constance Guille, MD, MSCR, professor in the department of psychiatry and behavioral science, Medical University of South Carolina, Charleston, noted that nurses are “predominantly female” and that women tend to be twice as likely as men to experience depression, which is a major risk factor for suicide. Thus, this population is particularly vulnerable.
One reason the investigators did not find that suicide rates were higher among physicians is that the health care professionals whom the researchers studied were older than 30 years. Thus, the study “excludes younger physicians in early practice or training, who likely do have higher suicide rates than the general population,” she suggested.
Dr. Guille, who is the author of an accompanying editorial and was not involved with the study, recommended “taking a public health approach, implementing preventative interventions, identifying people at high risk, providing treatment for health care professionals struggling with mental health problems, and destigmatizing help seeking.”
She encouraged clinicians to “reach out to colleagues who are struggling in a way to help them seek services and check in with them because it’s helpful when peers reach out.”
Dr. Davis noted that these disturbing trends will likely increase in the aftermath of the COVID-19 pandemic. “The pandemic has placed enormous strain on the health care workforce, and we fear this may have made the situation even worse.”
The current findings “will serve as a benchmark for future comparisons,” he said.
No source of funding for the study was reported. Dr. Davis has received consulting fees as a statistical reviewer for the journal Regional Anesthesia and Pain Medicine. His coauthors disclosed no relevant financial relationships. Dr. Guille has received grants from the National Institute on Drug Abuse, the American Foundation on Suicide Prevention, and the Duke Endowment and serves on the advisory board and speakers bureau of Sage Therapeutics.
A version of this article first appeared on Medscape.com.
Female nurses are at significantly greater risk of dying by suicide than physicians in findings that contradict previous research suggesting doctors are at greatest risk.
Results of a large retrospective cohort study show that nurses of both sexes were 18% more likely to die by suicide, compared with individuals in the general population. In addition, compared with female physicians, the suicide risk among female nurses was 70% higher.
“The main takeaway is that the risk of suicide among nurses is twice that of the general population and even higher than that among physicians, a population known to be at high risk,” lead author Matthew Davis, MPH, PhD, associate professor, department of systems, populations, and leadership, University of Michigan, Ann Arbor, said in an interview.
The study was published online April 14, 2021, in JAMA Psychiatry.
Focus on physicians
Compared with the general public, health care workers are at higher risk for suicide, but most studies of suicide have focused on physicians, Dr. Davis said.
Although “there were several older studies hinting that there might be a difference in suicide risk among nurses,” the data were insufficient to “make an overall conclusion,” he noted.
For that reason, his group “set out to make the best estimates possible” by using a large dataset from the National Violent Death Reporting System of the Centers for Disease Control and Prevention spanning the years 2007-2018 and focusing on suicides by individuals aged 30 years and older (n = 159,372 suicides).
Additional workforce data were acquired from the Bureau of Labor Statistics and the Association of Medical Colleges State Physician Workforce Data.
An important area of focus was method of suicide.
“ and know how to use them to overdose, which also increases their risk,” Dr. Davis said in a press release.
Enormous job strain
The researchers identified 2,374 suicides among nurses, 857 suicides among physicians, and 156,141 suicides in the general population.
Compared with the general population, nurses who died by suicide were more likely to be women, less racially diverse (non-Hispanic White), and more likely to have been married.
Rates of suicide were higher among nurses than among the general population, with a sex-adjusted incidence for 2017-2018 of 23.8 per 100,000 versus 20.1 per 100,000 (relative risk, 1.18; 95% confidence interval, 1.03-1.36).
The difference between suicide rates among female nurses and among women in the general population was even more striking: In 2017-2018, the suicide incidence among nurses was 17.1 per 100,000 versus 8.6 per 100,000 in the population at large (RR, 1.99; 95% CI, 1.82-2.18).
“In absolute terms, being a female nurse was associated with an additional 8.5 suicides per 100,000 (7.0-10.0), compared with the general population,” the authors reported.
In contrast, overall physician suicide rates were not statistically different from those of the general population (RR, 1.01; 95% CI, 0.79-1.30) except during the period 2011-2012 (11.7 per 100,000; 95% CI, 6.6-16.8 vs. 7.5 per 100,000; 95% CI, 7.2-7.7).
Clinicians of both sexes were more likely to use poisoning and less likely to use a firearm, compared with individuals in the general population who died by suicide. For example, 24.9% (23.5%-26.4%) of nurse suicides involved poisoning, compared to 16.8% (16.6%-17.0%) of suicides in the general population.
Toxicology reports showed that the presence of antidepressants, benzodiazepines, barbiturates, and opiates was more common in clinician suicides than suicides in the general population.
Dr. Davis suggested the higher risk for suicide among nurses, compared with physicians, might be attributed to “high job demands – for example, nurses provide the majority of bedside care, work long shifts in stressful environments, and have less autonomy.
“Health care workers and friends and family of health care workers need to be aware of mental health issues and suicide risk that can be associated with the job and, most importantly, recognize those who may be struggling and encourage them to get help by calling the National Suicide Prevention Lifeline,” he said.
Other potential contributors include “avoidance of mental health services due to stigma and greater access to the means to commit suicide via medication,” Dr. Davis noted.
Benchmark research
Commenting on the study, Constance Guille, MD, MSCR, professor in the department of psychiatry and behavioral science, Medical University of South Carolina, Charleston, noted that nurses are “predominantly female” and that women tend to be twice as likely as men to experience depression, which is a major risk factor for suicide. Thus, this population is particularly vulnerable.
One reason the investigators did not find that suicide rates were higher among physicians is that the health care professionals whom the researchers studied were older than 30 years. Thus, the study “excludes younger physicians in early practice or training, who likely do have higher suicide rates than the general population,” she suggested.
Dr. Guille, who is the author of an accompanying editorial and was not involved with the study, recommended “taking a public health approach, implementing preventative interventions, identifying people at high risk, providing treatment for health care professionals struggling with mental health problems, and destigmatizing help seeking.”
She encouraged clinicians to “reach out to colleagues who are struggling in a way to help them seek services and check in with them because it’s helpful when peers reach out.”
Dr. Davis noted that these disturbing trends will likely increase in the aftermath of the COVID-19 pandemic. “The pandemic has placed enormous strain on the health care workforce, and we fear this may have made the situation even worse.”
The current findings “will serve as a benchmark for future comparisons,” he said.
No source of funding for the study was reported. Dr. Davis has received consulting fees as a statistical reviewer for the journal Regional Anesthesia and Pain Medicine. His coauthors disclosed no relevant financial relationships. Dr. Guille has received grants from the National Institute on Drug Abuse, the American Foundation on Suicide Prevention, and the Duke Endowment and serves on the advisory board and speakers bureau of Sage Therapeutics.
A version of this article first appeared on Medscape.com.
How about contraceptives for men?
With the introduction of new technology to vaccinate the world with the Pfizer and Moderna mRNA vaccines, I considered other health conditions that could benefit from new modalities. Unplanned pregnancies are a public health crisis, yet the burden falls solely on women to solve, burdening them with contraceptive practices to prevent unplanned pregnancy. With the insurrection of Row v. Wade and the new bills being pushed through states that are limiting abortion, perhaps the time has come for males to accept the responsibility for contraception to prevent unplanned pregnancy. The methods that currently exist for males are condoms and vasectomy. Other options are being explored – both nonhormonal and reversible contraception including daily pills, gels, and long-acting injections.

The pill for men has been under preliminary trials with promising results. This contraceptive pill contains dimethandrolone undecanoate, which is an androgen anabolic steroid progesterone once-daily pill that suppresses FSH and LH, causing a decrease in the production of testosterone and consequently sperm production.1 (Long, Lee, & Blithe, 2019). This pill is in long-term trials to determine the efficacy and side effects, including the impact on libido, liver, and kidney disease.
The injectable male contraceptive in trials now includes two different options. The first was a long-acting progestin, testosterone, and androgen combination. The male participants received an intramuscular injection every 8 weeks. Although the results of the study were promising – sperm production was effectively reduced, the side effects were too severe for participants to continue use. Side effects much like those of the female Depo-Provera injections included acne and mood disorders. Men experienced erectile dysfunction while at the same time having an increase in sex drive.2 (Em, 2018).
Recently, researchers in India have studied a nonhormonal injectable with promising outcomes. It prevented pregnancy in more than 97% of participants. This injectable polymer gel is placed into the male’s vas deferens to block sperm from leaving the body. This product inactivates sperm, essentially creating temporary sterilization for men. The benefit of this product, called RISUG (reversible inhibition of sperm under guidance), is a single injection that can be effective for 13 years. It can be reversed earlier if needed by injecting a dissolving gel into the male’s vas deferens.1,2 In the United States, there is an identical product called Vasalgel – a polymer injected into the vas deferens – also being studied for temporary infertility.
Another synthetic implanted androgen product being studied is 7 alpha-methyl-19-nortestosterone (MENT), a synthetic steroid that resembles testosterone but does not convert into testosterone and, consequently, does not stimulate prostate growth. It is administered via two subdermal implants and is effective for 12 months. The first subdermal implant releases the synthetic androgen, which is more potent than testosterone, and the other emits LH-releasing hormone.3 Studies demonstrate that MENT suppresses sperm production.1
Finally, studies are underway using transdermal gel applications to suppress sperm concentrations. The daily gel is absorbed through the skin after application to two different areas of the man’s body: the shoulders and upper arms. The daily application of the progestin product, Nestorone, and testosterone gel has been found to reduce sperm concentrations to < 1 x 10⁶/mL. Studies measured gonadal concentrations after 4 weeks.1 Users were happy with the use of a topical gel, with minimal side effects such as lower libido, weight gain, and changes in cholesterol, yet inconsistent use of the product resulted in lower than anticipated results.4
Male contraceptive options are long overdue to dramatically reduce the rate of unplanned pregnancies and the burden of contraception placed on women. Getting these products to market will be half the battle – getting men to commit to using these options and women to trust male compliance may further impede acceptance. Men have not had to carry the burden and economics of single parenting. Men interested in casual sex may now need to accept more responsibility for unplanned pregnancy and be proactive with prevention, particularly as abortion laws are being challenged.
Ms. Thew is medical director of the department of pediatrics division of adolescent medicine at the Medical College of Wisconsin in Milwaukee. She is a member of the editorial board for Pediatric News and has no relevant disclosures.
References
1. Long J E et al. Clin Chem. 2019;65(1):153-60.
2. Male birth control: Current options and new breakthroughs, SingleCare: Health Education. Aug. 6, 2018.
3. Sundaram K et al. Ann Med. 1993;25(2):199-205.
4. Anawalt BD et al. Andrology. 2019;7(6):878-87.
With the introduction of new technology to vaccinate the world with the Pfizer and Moderna mRNA vaccines, I considered other health conditions that could benefit from new modalities. Unplanned pregnancies are a public health crisis, yet the burden falls solely on women to solve, burdening them with contraceptive practices to prevent unplanned pregnancy. With the insurrection of Row v. Wade and the new bills being pushed through states that are limiting abortion, perhaps the time has come for males to accept the responsibility for contraception to prevent unplanned pregnancy. The methods that currently exist for males are condoms and vasectomy. Other options are being explored – both nonhormonal and reversible contraception including daily pills, gels, and long-acting injections.
The pill for men has been under preliminary trials with promising results. This contraceptive pill contains dimethandrolone undecanoate, which is an androgen anabolic steroid progesterone once-daily pill that suppresses FSH and LH, causing a decrease in the production of testosterone and consequently sperm production.1 (Long, Lee, & Blithe, 2019). This pill is in long-term trials to determine the efficacy and side effects, including the impact on libido, liver, and kidney disease.
The injectable male contraceptive in trials now includes two different options. The first was a long-acting progestin, testosterone, and androgen combination. The male participants received an intramuscular injection every 8 weeks. Although the results of the study were promising – sperm production was effectively reduced, the side effects were too severe for participants to continue use. Side effects much like those of the female Depo-Provera injections included acne and mood disorders. Men experienced erectile dysfunction while at the same time having an increase in sex drive.2 (Em, 2018).
Recently, researchers in India have studied a nonhormonal injectable with promising outcomes. It prevented pregnancy in more than 97% of participants. This injectable polymer gel is placed into the male’s vas deferens to block sperm from leaving the body. This product inactivates sperm, essentially creating temporary sterilization for men. The benefit of this product, called RISUG (reversible inhibition of sperm under guidance), is a single injection that can be effective for 13 years. It can be reversed earlier if needed by injecting a dissolving gel into the male’s vas deferens.1,2 In the United States, there is an identical product called Vasalgel – a polymer injected into the vas deferens – also being studied for temporary infertility.
Another synthetic implanted androgen product being studied is 7 alpha-methyl-19-nortestosterone (MENT), a synthetic steroid that resembles testosterone but does not convert into testosterone and, consequently, does not stimulate prostate growth. It is administered via two subdermal implants and is effective for 12 months. The first subdermal implant releases the synthetic androgen, which is more potent than testosterone, and the other emits LH-releasing hormone.3 Studies demonstrate that MENT suppresses sperm production.1
Finally, studies are underway using transdermal gel applications to suppress sperm concentrations. The daily gel is absorbed through the skin after application to two different areas of the man’s body: the shoulders and upper arms. The daily application of the progestin product, Nestorone, and testosterone gel has been found to reduce sperm concentrations to < 1 x 10⁶/mL. Studies measured gonadal concentrations after 4 weeks.1 Users were happy with the use of a topical gel, with minimal side effects such as lower libido, weight gain, and changes in cholesterol, yet inconsistent use of the product resulted in lower than anticipated results.4
Male contraceptive options are long overdue to dramatically reduce the rate of unplanned pregnancies and the burden of contraception placed on women. Getting these products to market will be half the battle – getting men to commit to using these options and women to trust male compliance may further impede acceptance. Men have not had to carry the burden and economics of single parenting. Men interested in casual sex may now need to accept more responsibility for unplanned pregnancy and be proactive with prevention, particularly as abortion laws are being challenged.
Ms. Thew is medical director of the department of pediatrics division of adolescent medicine at the Medical College of Wisconsin in Milwaukee. She is a member of the editorial board for Pediatric News and has no relevant disclosures.
References
1. Long J E et al. Clin Chem. 2019;65(1):153-60.
2. Male birth control: Current options and new breakthroughs, SingleCare: Health Education. Aug. 6, 2018.
3. Sundaram K et al. Ann Med. 1993;25(2):199-205.
4. Anawalt BD et al. Andrology. 2019;7(6):878-87.
Study: COVID-19 can kill months after infection
Long-haul COVID-19 patients face many health threats – including a higher chance of dying – up to 6 months after they catch the virus, according to a massive study published in the journal Nature.
Researchers examined more than 87,000 COVID-19 patients and nearly 5 million control patients in a federal database. They found COVID-19 patients had a 59% higher risk of death up to 6 months after infection, compared with noninfected people.
Those findings translate into about 8 extra deaths per 1,000 patients over 6 months, because many deaths caused by long-term COVID complications are not recorded as COVID-19 deaths, the researchers said. Among patients who were hospitalized and died after more than 30 days, there were 29 excess deaths per 1,000 patients over 6 months.
“As far as total pandemic death toll, these numbers suggest that the deaths we’re counting due to the immediate viral infection are only the tip of the iceberg,” Ziyad Al-Aly, MD, the senior author of the study and a director of the Clinical Epidemiology Center at the Veterans Affairs St. Louis Health Care System, said in a news release from the Washington University, St. Louis.
Johns Hopkins University in Baltimore says more than 3 million people worldwide and about 570,000 people in the United States have died of coronavirus-related reasons.
Long-haul COVID patients also had a much higher chance of getting sick, and not just in the respiratory system, according to the study.
The patients had a high rate of stroke and other nervous system ailments, mental health problems such as depression, the onset of diabetes, heart disease and other coronary problems, diarrhea and digestive disorders, kidney disease, blood clots, joint pain, hair loss, and general fatigue.
Patients often had clusters of these ailments. And the more severe the case of COVID-19, the higher the chance of long-term health problems, the study said.
Researchers based their study on health care databases of the U.S. Department of Veterans Affairs. Besides the 87,000 COVID patients, the database included about 5 million patients who didn’t catch COVID. The veterans in the study were about 88% men, but the large sample size included 8,880 women with confirmed cases, the news release said.
Dr. Al-Aly, an assistant professor at Washington University, said the study shows that long-haul COVID-19 could be “America’s next big health crisis.”
“Our study demonstrates that, up to 6 months after diagnosis, the risk of death following even a mild case of COVID-19 is not trivial and increases with disease severity,” he said. “Given that more than 30 million Americans have been infected with this virus, and given that the burden of long COVID-19 is substantial, the lingering effects of this disease will reverberate for many years and even decades.”
A version of this article first appeared on WebMD.com.