User login
The Journal of Clinical Outcomes Management® is an independent, peer-reviewed journal offering evidence-based, practical information for improving the quality, safety, and value of health care.
div[contains(@class, 'header__large-screen')]
div[contains(@class, 'read-next-article')]
div[contains(@class, 'nav-primary')]
nav[contains(@class, 'nav-primary')]
section[contains(@class, 'footer-nav-section-wrapper')]
footer[@id='footer']
div[contains(@class, 'main-prefix')]
section[contains(@class, 'nav-hidden')]
div[contains(@class, 'ce-card-content')]
nav[contains(@class, 'nav-ce-stack')]
Loneliness, social isolation in seniors need urgent attention
Health care systems need to take urgent action to address social isolation and loneliness among U.S. seniors, experts say.
A new report from the National Academies of Sciences, Engineering, and Medicine (NAS) points out that social isolation in this population is a major public health concern that contributes to heart disease, depression, and premature death.
The report authors note that the health care system remains an underused partner in preventing, identifying, and intervening in social isolation and loneliness among adults over age 50.
For seniors who are homebound, have no family, or do not belong to community or faith groups, a medical appointment or home health visit may be one of the few social interactions they have, the report notes.
Health care providers and systems may be “first responders” in recognizing lonely or socially isolated patients, committee chair Dan Blazer, MD, from Duke University School of Medicine, Durham, N.C., said during a press briefing.
As deadly as obesity, smoking
Committee member Julianne Holt-Lunstad, PhD, from Brigham Young University, Provo, Utah, noted that social isolation and loneliness are “distinctly different.”
Social isolation is defined as an objective lack of (or limited) social connections, while loneliness is a subjective perception of social isolation or the subjective feeling of being lonely.
Not all older adults are isolated or lonely, but they are more likely to face predisposing factors such as living alone and the loss of loved ones, she explained.
The issue may be compounded for LGBT, minority, and immigrant older adults, who may already face barriers to care, stigma, and discrimination. Social isolation and loneliness may also directly stem from chronic illness, hearing or vision loss, or mobility issues. In these cases, health care providers might be able to help prevent or reduce social isolation and loneliness by directly addressing the underlying health-related causes.
Holt-Lunstad told the briefing. The report offers a vision for how the health care system can identify people at risk of social isolation and loneliness, intervene, and engage other community partners.
It recommends that providers use validated tools to periodically assess patients who may be at risk for social isolation and loneliness and connect them to community resources for help.
The report also calls for greater education and training among health providers. Schools of health professions and training programs for direct care workers (eg, home health aides, nurse aides, and personal care aides) should incorporate social isolation and loneliness in their curricula, the report says.
It also offers recommendations for leveraging digital health and health technology, improving community partnerships, increasing funding for research, and creation of a national resource center under the Department of Health and Human Services.
Blazer said there remains “much to be learned” about what approaches to mitigating social isolation and loneliness work best in which populations.
The report, from the Committee on the Health and Medical Dimensions of Social Isolation and Loneliness in Older Adults, was sponsored by the AARP Foundation.
This article first appeared on Medscape.com.
Survey: 2020 will see more attacks on ACA
When physicians gaze into their crystal balls to predict what’s coming in 2020, they see continued efforts to defund the Affordable Care Act – meaning the ACA will still be around to be defunded – but they don’t see a lot of support for universal health care, according to health care market research company InCrowd.
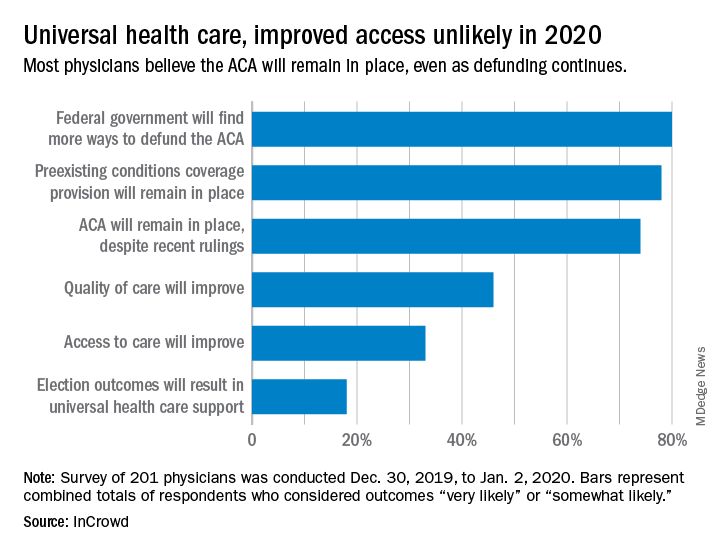
Expectations for universal health care came in at 18% of the 100 generalists and 101 specialists who responded to InCrowd’s fifth annual health care predictions survey, which left 82% who thought that “election outcomes will result in universal healthcare support” was somewhat or very unlikely in 2020.
One respondent, a specialist from California, commented that “the global data on universal healthcare for all shows that it results in overall improved population health. Unfortunately, we are so polarized in the US against universal healthcare driven by bias from health insurance companies and decision makers that are quick to ignore scientific data.”
This was the first time InCrowd asked physicians about universal health care, but ACA-related predictions have been included before, and all three scenarios presented were deemed to be increasingly likely, compared with 2019.
Respondents thought that federal government defunding was more likely to occur in 2020 (80%) than in 2019 (73%), but increased majorities also said that preexisting conditions coverage would continue (78% in 2020 vs. 70% in 2019) and that the ACA would remain in place (74% in 2020 vs. 60% in 2019), InCrowd reported after the survey, which was conducted from Dec. 30, 2019, to Jan. 2, 2020.
A respondent who thought the ACA will be eliminated said, “I have as many uninsured today as before the ACA. They are just different. Mainly younger patients who spend less in a year on healthcare than one month’s premium.” Another suggested that eliminateing it “will limit access to care and overload [emergency departments]. More people will die.”
Cost was addressed in a separate survey question that asked how physicians could help to reduce health care spending in 2020.
The leading answer, given by 37% of respondents, was for physicians to “inform themselves of costs and adapt cost-saving prescription practices.” Next came “limit use of expensive tests and scans” with 21%, followed by “prescribe generics when possible” at 20%, which was a substantial drop from the 38% it garnered in 2019, InCrowd noted.
“Participation in [shared savings] programs and risk-based incentive programs and pay-for-performance programs” would provide “better stewardship of resources,” a primary care physician from Michigan wrote.
When the survey turned to pharmaceutical industry predictions for 2020, cost was the major issue.
“What’s interesting about this year’s data is that we’re seeing less emphasis on the importance of bringing innovative, new therapies to market faster … versus expanding affordability, which was nearly a unanimous top priority for respondents,” Daniel S. Fitzgerald, InCrowd’s CEO and president, said in a separate statement.
When physicians gaze into their crystal balls to predict what’s coming in 2020, they see continued efforts to defund the Affordable Care Act – meaning the ACA will still be around to be defunded – but they don’t see a lot of support for universal health care, according to health care market research company InCrowd.
Expectations for universal health care came in at 18% of the 100 generalists and 101 specialists who responded to InCrowd’s fifth annual health care predictions survey, which left 82% who thought that “election outcomes will result in universal healthcare support” was somewhat or very unlikely in 2020.
One respondent, a specialist from California, commented that “the global data on universal healthcare for all shows that it results in overall improved population health. Unfortunately, we are so polarized in the US against universal healthcare driven by bias from health insurance companies and decision makers that are quick to ignore scientific data.”
This was the first time InCrowd asked physicians about universal health care, but ACA-related predictions have been included before, and all three scenarios presented were deemed to be increasingly likely, compared with 2019.
Respondents thought that federal government defunding was more likely to occur in 2020 (80%) than in 2019 (73%), but increased majorities also said that preexisting conditions coverage would continue (78% in 2020 vs. 70% in 2019) and that the ACA would remain in place (74% in 2020 vs. 60% in 2019), InCrowd reported after the survey, which was conducted from Dec. 30, 2019, to Jan. 2, 2020.
A respondent who thought the ACA will be eliminated said, “I have as many uninsured today as before the ACA. They are just different. Mainly younger patients who spend less in a year on healthcare than one month’s premium.” Another suggested that eliminateing it “will limit access to care and overload [emergency departments]. More people will die.”
Cost was addressed in a separate survey question that asked how physicians could help to reduce health care spending in 2020.
The leading answer, given by 37% of respondents, was for physicians to “inform themselves of costs and adapt cost-saving prescription practices.” Next came “limit use of expensive tests and scans” with 21%, followed by “prescribe generics when possible” at 20%, which was a substantial drop from the 38% it garnered in 2019, InCrowd noted.
“Participation in [shared savings] programs and risk-based incentive programs and pay-for-performance programs” would provide “better stewardship of resources,” a primary care physician from Michigan wrote.
When the survey turned to pharmaceutical industry predictions for 2020, cost was the major issue.
“What’s interesting about this year’s data is that we’re seeing less emphasis on the importance of bringing innovative, new therapies to market faster … versus expanding affordability, which was nearly a unanimous top priority for respondents,” Daniel S. Fitzgerald, InCrowd’s CEO and president, said in a separate statement.
Does screening by primary care providers effectively detect melanoma and other skin cancers?
EVIDENCE SUMMARY
No trials have directly assessed skin cancer morbidity associated with physician visual skin screening. A 2018 ecologic cohort study found no difference in melanoma mortality in a population undergoing a national screening program, although screening was associated with 41% more diagnoses of skin cancer.1 A 2012 cohort study found a reduction in melanoma mortality over 7 years associated with a population-based visual skin cancer screening program compared with similar populations that didn’t undergo specific screening.2 At 12-year follow-up, however, there was no longer a difference in mortality.
Primary care visual screening doesn’t decrease melanoma mortality
German researchers trained 1673 non-dermatologists (64% of general practitioners, obstetrician-gynecologists, and urologists in that region of Germany) and 116 dermatologists (98% in the region) to recognize skin cancer through whole-body visual inspection.1 They recruited and screened 360,000 adults (19% of the population older than 20 years; 74% women) and followed age- and sex-adjusted melanoma mortality over the next 10 years. Non-dermatologists performed most screening exams (77%); 37% of screened positive patients were lost to follow-up.
Melanoma mortality ultimately didn’t change in the screened region, compared with populations in other European countries without national screening programs. Screening detected approximately half of melanoma cases (585/1169) in the region and was associated with 41% greater detection of skin cancers compared with other countries.
Researchers recorded age-adjusted increases in incidence per 100,000 of melanoma from 14.2 (95% confidence interval [CI], 13.3-15.1) to 18 (95% CI, 16.6-19.4), melanoma in situ from 5.8 (95% CI, 5.2-6.4) to 8.5 (95% CI, 7.5-9.5), squamous cell carcinoma from 11.2 (95% CI, 10.6-11.8) to 12.9 (95% CI, 12.0-13.8), and basal cell carcinoma from 60.5 (95% CI, 59.0-62.1) to 78.4 (95% CI, 75.9-80.8).
Visual screening by primary care providers vs screening by dermatologists
A cohort study of 16,383 Australian adults found that visual screening by primary care physicians detected melanoma over 3 years with a sensitivity of 40.2% (95% CIs not supplied) and specificity of 86.1% (95% CI, 85.6-86.6%; positive predictive value = 1.4%).3
A second cohort study, enrolling 7436 adults, that evaluated visual screening by dermatologists and plastic surgeons over 2 years found a sensitivity for melanoma of 49% (95% CI, 34.4-63.7%) and a specificity of 97.6% (95% CI, 97.2-97.9%) with a positive predictive value of 11.9% (95% CI, 7.8-17.2%).4
Visual screening more often detects thinner melanomas
A 3-year case-control study (3762 cases, 3824 controls) that examined the association between visual skin screening by a physician (type of physician not specified) and thickness of melanomas detected found that thin melanomas (≤ 0.75 mm) were more common among screened patients compared with unscreened patients (odds ratio [OR] = 1.38; 95% CI, 1.22-1.56) and thicker melanomas (≥ 0.75 mm) were less common (OR = 0.86; 95% CI, 0.75-0.98).5
Continue to: A systematic review...
A systematic review of 8 observational cohort studies with a total of 200,000 patients found a consistent linear increase in melanoma mortality with increasing tumor thickness.6 The largest study (68,495 patients), which compared melanoma mortality for thinner (< 1 mm) and thicker lesions, reported risk ratios of 2.89 for lesion thicknesses of 1.01 to 2 mm (95% CI, 2.62-3.18); 4.69 for thicknesses of 2.01 to 4 mm (95% CI, 4.24-5.02); and 5.71 for thicknesses > 4 mm (95% CI, 5.10-6.39).
The downside of visual screening: False-positives
The 2012 cohort study, which reported outcomes from 16,000 biopsies performed following visual screening exams, found that 28 biopsies were performed for each diagnosis of melanoma and 9 to 10 biopsies for each basal cell carcinoma.2 Diagnosis rates (number of skin biopsies performed for each case of cancer diagnosed) were equal in men and women for both types of cancer. However, researchers observed more biopsies for each diagnosis of squamous cell carcinoma in women than men (56 vs 28 biopsies per case).
Younger patients underwent more biopsies than older patients for each diagnosis of skin cancer. Women 20 to 34 years of age underwent more biopsies than women 65 years or older for each diagnosis of melanoma (19 additional excisions) and basal cell carcinoma (134 additional excisions). Women 35 to 49 years of age underwent 565 more biopsies for each diagnosis of squamous cell carcinoma than women 65 years or older. Similar patterns applied to men 20 to 34 years of age compared with men 65 years or older (24 additional biopsies per melanoma, 109 per basal cell carcinoma, and 898 per squamous cell carcinoma).
RECOMMENDATIONS
The US Preventive Services Task Force recommendations, based on a systematic review of mostly cohort studies, state that the current evidence is insufficient to assess the balance of benefits and harms of clinician visual skin cancer screening.7,8
The American Academy of Dermatology states that skin cancer screening can save lives and supports research on the benefits and harms of screening in the primary care setting.9
Continue to: Editor's Takeaway
Editor’s Takeaway
Skin cancer screening by primary care physicians is associated with increased detection of skin cancers, including melanomas—even though we have no confirmation that it changes melanoma mortality. It is unclear what the appropriate rate of false-positive screening tests should be, but wider adoption of noninvasive diagnostic techniques such as dermoscopy might reduce unwarranted biopsies.
1. Kaiser M, Schiller J, Schreckenberger C. The effectiveness of a population-based skin cancer screening program: evidence from Germany. Eur J Health Econ. 2018:19:355-367.
2. Waldmann A, Nolte S, Weinstock MA, et al. Skin cancer screening participation and impact on melanoma incidence in Germany—an observational study on incidence trends in regions with and without population-based screening. Br J Cancer. 2012;106:970-974.
3. Aitken JF, Janda M, Elwood M, et al. Clinical outcomes from skin screening clinics within a community-based melanoma screening program. J Am Acad Dermatol. 2006:54:105-114.
4. Fritschi L, Dye SA, Katris P. Validity of melanoma diagnosis in a community-based screening program. Am J Epidemiol. 2006:164:385-390.
5. Aitken JF, Elwood M, Baade PD, et al. Clinical whole-body skin examination reduces the incidence of thick melanomas. Int J Cancer. 2010:126:450-458.
6. Wernli KJ, Henrikson NB, Morrison CC, et al. Screening for Skin Cancer in Adults: An Updated Systematic Evidence Review for the US Preventive Services Task Force. Rockville, MD: Agency for Healthcare Research and Quality; 2016. Evidence Synthesis 137.
7. Waldmann A, Nolte S, Geller AC, et al. Frequency of excisions and yields of malignant skin tumors in a population-based screening intervention of 360,288 whole-body examinations. Arch Dermatol. 2012:148:903-910.
8. US Preventive Services Task Force. Screening for Skin Cancer: US Preventive Services Task Force Recommendation Statement. JAMA. 2016;316:429-435.
9. Torres A. AAD statement on USPSTF recommendation on skin cancer screening. July 2016. https://www.aad.org/media/news-releases/aad-statement-on-uspstf 26. Accessed May 2018.
EVIDENCE SUMMARY
No trials have directly assessed skin cancer morbidity associated with physician visual skin screening. A 2018 ecologic cohort study found no difference in melanoma mortality in a population undergoing a national screening program, although screening was associated with 41% more diagnoses of skin cancer.1 A 2012 cohort study found a reduction in melanoma mortality over 7 years associated with a population-based visual skin cancer screening program compared with similar populations that didn’t undergo specific screening.2 At 12-year follow-up, however, there was no longer a difference in mortality.
Primary care visual screening doesn’t decrease melanoma mortality
German researchers trained 1673 non-dermatologists (64% of general practitioners, obstetrician-gynecologists, and urologists in that region of Germany) and 116 dermatologists (98% in the region) to recognize skin cancer through whole-body visual inspection.1 They recruited and screened 360,000 adults (19% of the population older than 20 years; 74% women) and followed age- and sex-adjusted melanoma mortality over the next 10 years. Non-dermatologists performed most screening exams (77%); 37% of screened positive patients were lost to follow-up.
Melanoma mortality ultimately didn’t change in the screened region, compared with populations in other European countries without national screening programs. Screening detected approximately half of melanoma cases (585/1169) in the region and was associated with 41% greater detection of skin cancers compared with other countries.
Researchers recorded age-adjusted increases in incidence per 100,000 of melanoma from 14.2 (95% confidence interval [CI], 13.3-15.1) to 18 (95% CI, 16.6-19.4), melanoma in situ from 5.8 (95% CI, 5.2-6.4) to 8.5 (95% CI, 7.5-9.5), squamous cell carcinoma from 11.2 (95% CI, 10.6-11.8) to 12.9 (95% CI, 12.0-13.8), and basal cell carcinoma from 60.5 (95% CI, 59.0-62.1) to 78.4 (95% CI, 75.9-80.8).
Visual screening by primary care providers vs screening by dermatologists
A cohort study of 16,383 Australian adults found that visual screening by primary care physicians detected melanoma over 3 years with a sensitivity of 40.2% (95% CIs not supplied) and specificity of 86.1% (95% CI, 85.6-86.6%; positive predictive value = 1.4%).3
A second cohort study, enrolling 7436 adults, that evaluated visual screening by dermatologists and plastic surgeons over 2 years found a sensitivity for melanoma of 49% (95% CI, 34.4-63.7%) and a specificity of 97.6% (95% CI, 97.2-97.9%) with a positive predictive value of 11.9% (95% CI, 7.8-17.2%).4
Visual screening more often detects thinner melanomas
A 3-year case-control study (3762 cases, 3824 controls) that examined the association between visual skin screening by a physician (type of physician not specified) and thickness of melanomas detected found that thin melanomas (≤ 0.75 mm) were more common among screened patients compared with unscreened patients (odds ratio [OR] = 1.38; 95% CI, 1.22-1.56) and thicker melanomas (≥ 0.75 mm) were less common (OR = 0.86; 95% CI, 0.75-0.98).5
Continue to: A systematic review...
A systematic review of 8 observational cohort studies with a total of 200,000 patients found a consistent linear increase in melanoma mortality with increasing tumor thickness.6 The largest study (68,495 patients), which compared melanoma mortality for thinner (< 1 mm) and thicker lesions, reported risk ratios of 2.89 for lesion thicknesses of 1.01 to 2 mm (95% CI, 2.62-3.18); 4.69 for thicknesses of 2.01 to 4 mm (95% CI, 4.24-5.02); and 5.71 for thicknesses > 4 mm (95% CI, 5.10-6.39).
The downside of visual screening: False-positives
The 2012 cohort study, which reported outcomes from 16,000 biopsies performed following visual screening exams, found that 28 biopsies were performed for each diagnosis of melanoma and 9 to 10 biopsies for each basal cell carcinoma.2 Diagnosis rates (number of skin biopsies performed for each case of cancer diagnosed) were equal in men and women for both types of cancer. However, researchers observed more biopsies for each diagnosis of squamous cell carcinoma in women than men (56 vs 28 biopsies per case).
Younger patients underwent more biopsies than older patients for each diagnosis of skin cancer. Women 20 to 34 years of age underwent more biopsies than women 65 years or older for each diagnosis of melanoma (19 additional excisions) and basal cell carcinoma (134 additional excisions). Women 35 to 49 years of age underwent 565 more biopsies for each diagnosis of squamous cell carcinoma than women 65 years or older. Similar patterns applied to men 20 to 34 years of age compared with men 65 years or older (24 additional biopsies per melanoma, 109 per basal cell carcinoma, and 898 per squamous cell carcinoma).
RECOMMENDATIONS
The US Preventive Services Task Force recommendations, based on a systematic review of mostly cohort studies, state that the current evidence is insufficient to assess the balance of benefits and harms of clinician visual skin cancer screening.7,8
The American Academy of Dermatology states that skin cancer screening can save lives and supports research on the benefits and harms of screening in the primary care setting.9
Continue to: Editor's Takeaway
Editor’s Takeaway
Skin cancer screening by primary care physicians is associated with increased detection of skin cancers, including melanomas—even though we have no confirmation that it changes melanoma mortality. It is unclear what the appropriate rate of false-positive screening tests should be, but wider adoption of noninvasive diagnostic techniques such as dermoscopy might reduce unwarranted biopsies.
1. Kaiser M, Schiller J, Schreckenberger C. The effectiveness of a population-based skin cancer screening program: evidence from Germany. Eur J Health Econ. 2018:19:355-367.
2. Waldmann A, Nolte S, Weinstock MA, et al. Skin cancer screening participation and impact on melanoma incidence in Germany—an observational study on incidence trends in regions with and without population-based screening. Br J Cancer. 2012;106:970-974.
3. Aitken JF, Janda M, Elwood M, et al. Clinical outcomes from skin screening clinics within a community-based melanoma screening program. J Am Acad Dermatol. 2006:54:105-114.
4. Fritschi L, Dye SA, Katris P. Validity of melanoma diagnosis in a community-based screening program. Am J Epidemiol. 2006:164:385-390.
5. Aitken JF, Elwood M, Baade PD, et al. Clinical whole-body skin examination reduces the incidence of thick melanomas. Int J Cancer. 2010:126:450-458.
6. Wernli KJ, Henrikson NB, Morrison CC, et al. Screening for Skin Cancer in Adults: An Updated Systematic Evidence Review for the US Preventive Services Task Force. Rockville, MD: Agency for Healthcare Research and Quality; 2016. Evidence Synthesis 137.
7. Waldmann A, Nolte S, Geller AC, et al. Frequency of excisions and yields of malignant skin tumors in a population-based screening intervention of 360,288 whole-body examinations. Arch Dermatol. 2012:148:903-910.
8. US Preventive Services Task Force. Screening for Skin Cancer: US Preventive Services Task Force Recommendation Statement. JAMA. 2016;316:429-435.
9. Torres A. AAD statement on USPSTF recommendation on skin cancer screening. July 2016. https://www.aad.org/media/news-releases/aad-statement-on-uspstf 26. Accessed May 2018.
EVIDENCE-BASED ANSWER:
Possibly. No trials have directly assessed detection of melanoma and other skin cancers by primary care providers.
Training a group comprised largely of primary care physicians to perform skin cancer screening was associated with a 41% increase in skin cancer diagnoses but no change in melanoma mortality.
Visual screening for melanoma by primary care physicians is 40% sensitive and 86% specific (compared with 49% and 98%, respectively, for dermatologists and plastic surgeons).
Melanomas found by visual screening are 38% more likely to be thin (≤ 0.75 mm) than melanomas discovered without screening, which correlates with improved outcomes.
Visual skin cancer screening overall is associated with false-positive rates as follows: 28 biopsies for each melanoma detected, 9 to 10 biopsies for each basal cell carcinoma, and 28 to 56 biopsies for squamous cell carcinoma. False-positive rates are higher for women—as much as double the rate for men—and younger patients—as much as 20-fold the rate for older patients (strength of recommendations for all foregoing statements: B, cohort studies).

FDA moves to expand coronavirus testing capacity; CDC clarifies testing criteria
The White House Coronavirus Task Force appeared at a press briefing March 2 to provide updates about testing strategies and public health coordination to address the current outbreak of the coronavirus COVID-19. Speaking at the briefing, led by Vice President Mike Pence, Centers for Disease Control and Prevention (CDC) director Robert Redfield, MD, said, “Working with our public health partners we continue to be able to identify new community cases and use our public health efforts to aggressively confirm, isolate, and do contact tracking.” Calling state, local, tribal, and territorial public health departments “the backbone of the public health system in our country,” Dr. Redfield noted that he expected many more confirmed COVID-19 cases to emerge.

At least some of the expected increase in confirmed cases of COVID-19 will occur because of expanded testing capacity, noted several of the task force members. On Feb. 29, the Food and Drug Administration issued a the virus that is causing the current outbreak of COVID-19.
Highly qualified laboratories, including both those run by public agencies and private labs, are now authorized to begin using their own validated test for the virus as long as they submit an Emergency Use Authorization (EUA) to the Food and Drug Administration within 15 days of notifying the agency of validation.
“To effectively respond to the COVID-19 outbreak, rapid detection of cases and contacts, appropriate clinical management and infection control, and implementation of community mitigation efforts are critical. This can best be achieved with wide availability of testing capabilities in health care settings, reference and commercial laboratories, and at the point of care,” the agency wrote in a press announcement of the expedited test expansion.
On Feb. 4, the Secretary of the Department of Health & Human Services declared a coronavirus public health emergency. The FDA was then authorized to allow individual laboratories with validated coronavirus tests to begin testing samples immediately. The goal is a more rapid and expanded testing capacity in the United States.
“The global emergence of COVID-19 is concerning, and we appreciate the efforts of the FDA to help bring more testing capability to the U.S.,” Nancy Messonnier, MD, director of the CDC’s National Center for Immunization and Respiratory Diseases (NCIRD), said in the press release.
The new guidance that permits the immediate use of clinical tests after individual development and validation, said the FDA, only applies to labs already certified to perform high complexity testing under Clinical Laboratory Improvement Amendments. Many governmental, academic, and private laboratories fall into this category, however.
“Under this policy, we expect certain laboratories who develop validated tests for coronavirus would begin using them right away prior to FDA review,” said Jeffrey Shuren, MD, JD, director of the FDA’s Center for Devices and Radiological Health. “We believe this action will support laboratories across the country working on this urgent public health situation,” he added in the press release.
“By the end of this week, close to a million tests will be available,” FDA Commissioner Stephen M. Hahn, MD, said during the March 2 briefing.*
Updated criteria
The CDC is maintaining updated criteria for the virus testing on its website. Testing criteria are based both on clinical features and epidemiologic risk.
Individuals with less severe clinical features – those who have either fever or signs and symptoms of lower respiratory disease such as cough or shortness of breath, but who don’t require hospitalization – should be tested if they have high epidemiologic risk. “High risk” is defined by the CDC as any individual, including health care workers, who has had close contact with a person with confirmed COVID-19 within the past 2 weeks. For health care workers, testing can be considered even if they have relatively mild respiratory symptoms or have had contact with a person who is suspected, but not yet confirmed, to have coronavirus.
In its testing guidance, the CDC recognizes that defining close contact is difficult. General guidelines are that individuals are considered to have been in close contact with a person who has COVID-19 if they were within about six feet of the person for a prolonged period, or cared for or have spent a prolonged amount of time in the same room or house as a person with confirmed COVID-19.
Individuals who have both fever and signs or symptoms of lower respiratory illness who require hospitalization should be tested if they have a history of travel from any affected geographic area within 14 days of the onset of their symptoms. The CDC now defines “affected geographic area” as any country or region that has at least a CDC Level 2 Travel Health Notice for COVID-19, so that the testing criteria themselves don’t need to be updated when new geographic areas are included in these alerts. As of March 3, China, Iran, Italy, Japan, and South Korea all have Level 2 or 3 travel alerts.
The CDC now recommends that any patient who has severe acute lower respiratory illness that requires hospitalization and doesn’t have an alternative diagnosis should be tested, even without any identified source of exposure.
“Despite seeing these new cases, the risk to the American people is low,” said the CDC’s Dr. Redfield. In response to a question from the press about how fast the coronavirus will spread across the United States, Dr. Redfield said, “From the beginning we’ve anticipated seeing community cases pop up.” He added that as these cases arise, testing and public health strategies will focus on unearthing linkages and contacts to learn how the virus is spreading. “We’ll use the public health strategies that we can to limit that transmission,” he said.
*An earlier version of this article misattributed this quote.
The White House Coronavirus Task Force appeared at a press briefing March 2 to provide updates about testing strategies and public health coordination to address the current outbreak of the coronavirus COVID-19. Speaking at the briefing, led by Vice President Mike Pence, Centers for Disease Control and Prevention (CDC) director Robert Redfield, MD, said, “Working with our public health partners we continue to be able to identify new community cases and use our public health efforts to aggressively confirm, isolate, and do contact tracking.” Calling state, local, tribal, and territorial public health departments “the backbone of the public health system in our country,” Dr. Redfield noted that he expected many more confirmed COVID-19 cases to emerge.
At least some of the expected increase in confirmed cases of COVID-19 will occur because of expanded testing capacity, noted several of the task force members. On Feb. 29, the Food and Drug Administration issued a the virus that is causing the current outbreak of COVID-19.
Highly qualified laboratories, including both those run by public agencies and private labs, are now authorized to begin using their own validated test for the virus as long as they submit an Emergency Use Authorization (EUA) to the Food and Drug Administration within 15 days of notifying the agency of validation.
“To effectively respond to the COVID-19 outbreak, rapid detection of cases and contacts, appropriate clinical management and infection control, and implementation of community mitigation efforts are critical. This can best be achieved with wide availability of testing capabilities in health care settings, reference and commercial laboratories, and at the point of care,” the agency wrote in a press announcement of the expedited test expansion.
On Feb. 4, the Secretary of the Department of Health & Human Services declared a coronavirus public health emergency. The FDA was then authorized to allow individual laboratories with validated coronavirus tests to begin testing samples immediately. The goal is a more rapid and expanded testing capacity in the United States.
“The global emergence of COVID-19 is concerning, and we appreciate the efforts of the FDA to help bring more testing capability to the U.S.,” Nancy Messonnier, MD, director of the CDC’s National Center for Immunization and Respiratory Diseases (NCIRD), said in the press release.
The new guidance that permits the immediate use of clinical tests after individual development and validation, said the FDA, only applies to labs already certified to perform high complexity testing under Clinical Laboratory Improvement Amendments. Many governmental, academic, and private laboratories fall into this category, however.
“Under this policy, we expect certain laboratories who develop validated tests for coronavirus would begin using them right away prior to FDA review,” said Jeffrey Shuren, MD, JD, director of the FDA’s Center for Devices and Radiological Health. “We believe this action will support laboratories across the country working on this urgent public health situation,” he added in the press release.
“By the end of this week, close to a million tests will be available,” FDA Commissioner Stephen M. Hahn, MD, said during the March 2 briefing.*
Updated criteria
The CDC is maintaining updated criteria for the virus testing on its website. Testing criteria are based both on clinical features and epidemiologic risk.
Individuals with less severe clinical features – those who have either fever or signs and symptoms of lower respiratory disease such as cough or shortness of breath, but who don’t require hospitalization – should be tested if they have high epidemiologic risk. “High risk” is defined by the CDC as any individual, including health care workers, who has had close contact with a person with confirmed COVID-19 within the past 2 weeks. For health care workers, testing can be considered even if they have relatively mild respiratory symptoms or have had contact with a person who is suspected, but not yet confirmed, to have coronavirus.
In its testing guidance, the CDC recognizes that defining close contact is difficult. General guidelines are that individuals are considered to have been in close contact with a person who has COVID-19 if they were within about six feet of the person for a prolonged period, or cared for or have spent a prolonged amount of time in the same room or house as a person with confirmed COVID-19.
Individuals who have both fever and signs or symptoms of lower respiratory illness who require hospitalization should be tested if they have a history of travel from any affected geographic area within 14 days of the onset of their symptoms. The CDC now defines “affected geographic area” as any country or region that has at least a CDC Level 2 Travel Health Notice for COVID-19, so that the testing criteria themselves don’t need to be updated when new geographic areas are included in these alerts. As of March 3, China, Iran, Italy, Japan, and South Korea all have Level 2 or 3 travel alerts.
The CDC now recommends that any patient who has severe acute lower respiratory illness that requires hospitalization and doesn’t have an alternative diagnosis should be tested, even without any identified source of exposure.
“Despite seeing these new cases, the risk to the American people is low,” said the CDC’s Dr. Redfield. In response to a question from the press about how fast the coronavirus will spread across the United States, Dr. Redfield said, “From the beginning we’ve anticipated seeing community cases pop up.” He added that as these cases arise, testing and public health strategies will focus on unearthing linkages and contacts to learn how the virus is spreading. “We’ll use the public health strategies that we can to limit that transmission,” he said.
*An earlier version of this article misattributed this quote.
FROM A PRESS BRIEFING BY THE WHITE HOUSE CORONAVIRUS TASK FORCE
Pembro ups survival in NSCLC: ‘Really extraordinary’ results
More than a third (35%) of patients with relapsed non–small cell lung cancer (NSCLC) treated with pembrolizumab (Keytruda, Merck) were still alive at 3 years, according to long-term results from a pivotal clinical trial.
The results also showed that, among the 10% of patients who completed all 35 cycles of pembrolizumab, the 3-year overall survival was approximately 99%, with progression-free survival (PFS) at around 70%.
“It is too soon to say that pembrolizumab is a potential cure...and we know that it doesn’t work for all patients, but the agent remains very, very promising,” said lead investigator Roy Herbst, MD, PhD, Department of Medical Oncology, Yale Comprehensive Cancer Center, New Haven, Connecticut.
These new results come from the KEYNOTE-010 trial, conducted in more than 1000 patients with NSCLC who had progressed on chemotherapy, randomized to receive immunotherapy with pembrolizumab or chemotherapy with docetaxel.
The results were published online on February 20 in the Journal of Clinical Oncology and were previously presented at the 2018 annual meeting of the European Society of Medical Oncology.
Overall survival at 3 years was 35% in patients with PD-L1 expression ≥ 50% in the tumor, and 23% in those with PD-L1 ≥ 1%.
This compares with 3-year overall survival of 11-13% with docetaxel.
These results are “really extraordinary,” Herbst commented to Medscape Medical News.
The 3-year overall survival rate of 35% in patients with PD-L1 ≥ 50% “is huge,” he said. “It really shows the durability of the response.”
Herbst commented that the “almost 100%” survival at 3 years among patients who completed 35 cycles of pembrolizumab shows that this treatment period (of about 2 years) is “probably about the right time to treat.”
“Currently, the agent is being used in all potential settings, before any other treatment, after other treatment, and with other treatments,” he said.
“Our hope is to find the very best way to use pembrolizumab to treat individual lung cancer patients, assessing how much PD-L1 a tumor expresses, what stage the patient is in, as well as other variables and biomarkers we are working on. This is the story of tailored therapy,” Herbst said.
Approached for comment, Solange Peters, MD, PhD, Oncology Department, Centre Hospitalier Universitaire Vaudois, Lausanne, Switzerland, said that the results are “very good” and “confirm the paradigms we have been seeing in melanoma,” with good long-term control, which is “very reassuring.”
However, she told Medscape Medical News that the trial raises an important question: «How long do you need to expose your patient with lung cancer to immunotherapy in order to get this long-term control?»
She said the “good news” is that, for the 10% of patients who completed 2 years of treatment per protocol, almost all of them are still alive at 3 years, “which is not observed with chemotherapy.”
The question for Peters is “more about the definition of long-term control,” as it was seen that almost one in three patients nevertheless had some form of progression.
This suggests that you have a group of people “who are nicely controlled, you stop the drug, and 1 year later a third of them have progressed.”
Peters said: “So how long do you need to treat these patients? I would say I still don’t know.”
“If I were one of these patients probably I would still want to continue [on the drug]. Of course, some might have progressed even while remaining on the drug, but the proportion who would have progressed is probably smaller than this one.”
Responses on Re-introduction of Therapy
The study also allowed patients who had completed 35 cycles of pembrolizumab to be restarted on the drug if they experienced progression.
The team found that, among 14 patients, 43% had a partial response and 36% had stable disease.
Herbst highlighted this finding and told Medscape Medical News that this «could be very important to physicians because they might want to think about using the drug again» in patients who have progressed on it.
He believes that the progression was not because of any resistance per se but rather a slowing down of the adaptive immune response.
“It’s just that it needs a boost,” he said, while noting that tissue specimens will nevertheless be required to demonstrate the theory.
Peters agreed that these results are “very promising,” but questioned their overall significance, as it is “a very small number of patients” from a subset whose disease was controlled while on treatment and then progressed after stopping.
She also pointed out that, in another study in patients with lung cancer (CheckMate-153), some patients were rechallenged with immunotherapy after having stopped treatment at 1 year “with very poor results.”
Peters said studies in melanoma have shown “rechallenge can be useful in a significant proportion of patients, but still you have not demonstrated that stopping and rechallenging is the same as not stopping.”
Study Details
KEYNOTE-010 involved patients with NSCLC from 202 centers in 24 countries with stage IIIB/IV disease expressing PD-L1 who had experienced disease progression after at least two cycles of platinum-based chemotherapy.
They were randomized 1:1:1 to open-label pembrolizumab 2 mg/kg, pembrolizumab 10 mg/kg, or docetaxel 75 mg/m2 every 3 weeks.
Pembrolizumab was continued for 35 treatment cycles over 2 years and docetaxel was continued for the maximum duration allowed by local regulators.
Patients who stopped pembrolizumab after a complete response or completing all 35 cycles, and who subsequently experienced disease progression, could receive up to 17 additional cycles over 1 year if they had not received another anticancer therapy in the meantime.
Among the 1,034 patients originally recruited between August 2013 and February 2015, 691 were assigned to pembrolizumab at 3 mg/kg or 10 mg/kg and 343 to docetaxel.
For the intention-to-treat analysis in 1033 patients, the mean duration of follow-up was 42.6 months, with a median treatment duration of 3.5 months in the pembrolizumab group and 2.0 months in the docetaxel group.
Compared with docetaxel, pembrolizumab was associated with a significant reduction in the risk of death, at a hazard ratio of 0.53 in patients with PD-L1 ≥ 50% and 0.69 in those with PD-L1 ≥ 1% (both P < .0001).
In patients with PD-L1 ≥ 50%, median overall survival was 16.9 months in those given pembrolizumab and 8.2 months with docetaxel. Among those with PD-L1 ≥ 1%, median overall survival was 11.8 months with pembrolizumab versus 8.4 months with docetaxel.
Overall survival on Kaplan-Meier analysis was 34.5% with pembrolizumab and 12.7% with docetaxel in the PD-L1 ≥ 50% group, and 22.9% versus 11.0% in the PD-L1 ≥ 1% group.
PFS significantly improved with pembrolizumab versus docetaxel, at a hazard ratio of 0.57 (P < .00001) among patients with PD-L1 ≥ 50% and 0.83 (P < .005) in those with PD-L1 ≥ 1%.
In terms of safety, 17.7% of patients who completed 2 years of pembrolizumab had grade 3-5 treatment-related adverse events, compared with 16.6% among all pembrolizumab-treated patients and 36.6% of those given docetaxel.
The team reports that 79 patients completed 35 cycles of pembrolizumab, with a median follow-up of 43.4 months.
Compared with the overall patient group, these patients were less likely to be aged ≥ 65 years and to have received two or more prior treatment lines, although they were more likely to be current or former smokers and to have squamous tumor histology.
Patients who completed 35 cycles had an objective response rate of 94.9%, and 91.0% were still alive at the data cutoff. Overall survival rates were 98.7% at 12 months and 86.3% at 24 months.
Of 71 patients eligible for analysis, 23 experienced progression after completing pembrolizumab, at PFS rates at 12 and 24 months of 72.5% and 57.7%, respectively.
A total of 14 patients were given a second course of pembrolizumab, of whom six had a partial response and five had stable disease. At the data cutoff, five patients had completed 17 additional cycles and 11 were alive.
Pembro Approved at Fixed Dose
One notable aspect of the study is that patients in the pembrolizumab arm were given two different doses of the drug based on body weight, whereas the drug is approved in the United States at a fixed dose of 200 mg.
Herbst told Medscape Medical News he considers the 200-mg dose to be appropriate.
“I didn’t think that the 3-mg versus 10-mg dose per kg that we used in our study made much difference in an average-sized person,” he said, adding that the 200-mg dose “is something a little bit more than 3 mg/kg.”
“So I think that this is clearly the right dos, and I don’t think more would make any difference,” he said.
The study was funded by Merck, the manufacturer of pembrolizumab. Herbst has reported having a consulting or advisory role for many pharmaceutical companies. Other coauthors have also reported relationships with industry, and some of the authors are Merck employees. Peters has reported receiving education grants, providing consultation, attending advisory boards, and/or providing lectures for many pharmaceutical companies.
This article first appeared on Medscape.com.
Prescription cascade more likely after CCBs than other hypertension meds
Elderly adults with hypertension who are newly prescribed a calcium-channel blocker (CCB), compared to other antihypertensive agents, are at least twice as likely to be given a loop diuretic over the following months, a large cohort study suggests.
The likelihood remained elevated for as long as a year after the start of a CCB and was more pronounced when comparing CCBs to any other kind of medication.
“Our findings suggest that many older adults who begin taking a CCB may subsequently experience a prescribing cascade” when loop diuretics are prescribed for peripheral edema, a known CCB adverse effect, that is misinterpreted as a new medical condition, Rachel D. Savage, PhD, Women’s College Hospital, Toronto, Canada, told theheart.org/Medscape Cardiology.
Edema caused by CCBs is caused by fluid redistribution, not overload, and “treating euvolemic individuals with a diuretic places them at increased risk of overdiuresis, leading to falls, urinary incontinence, acute kidney injury, electrolyte imbalances, and a cascade of other downstream consequences to which older adults are especially vulnerable,” explain Savage and coauthors of the analysis published online February 24 in JAMA Internal Medicine.
However, 1.4% of the cohort had been prescribed a loop diuretic, and 4.5% had been given any diuretic within 90 days after the start of CCBs. The corresponding rates were 0.7% and 3.4%, respectively, for patients who had started on ACE inhibitors or angiotensin receptor blocker (ARB) rather than a CCB.
Also, Savage observed, “the likelihood of being prescribed a loop diuretic following initiation of a CCB changed over time and was greatest 61 to 90 days postinitiation.” At that point, it was increased 2.4 times compared with initiation of an ACE inhibitor or an ARB in an adjusted analysis and increased almost 4 times compared with starting on any non-CCB agent.
Importantly, the actual prevalence of peripheral edema among those started on CCBs, ACE inhibitors, ARBs, or any non-CCB medication was not available in the data sets.
However, “the main message for clinicians is to consider medication side effects as a potential cause for new symptoms when patients present. We also encourage patients to ask prescribers about whether new symptoms could be caused by a medication,” senior author Lisa M. McCarthy, PharmD, told theheart.org/Medscape Cardiology.
“If a patient experiences peripheral edema while taking a CCB, we would encourage clinicians to consider whether the calcium-channel blocker is still necessary, whether it could be discontinued or the dose reduced, or whether the patient can be switched to another therapy,” she said.
Based on the current analysis, if the rate of CCB-induced peripheral edema is assumed to be 10%, which is consistent with the literature, then “potentially 7% to 14% of people who develop edema while taking a calcium channel blocker may then receive a loop diuretic,” an accompanying editorial notes.
“Patients with polypharmacy are at heightened risk of being exposed to [a] series of prescribing cascades if their current use of medications is not carefully discussed before the decision to add a new antihypertensive,” observe Timothy S. Anderson, MD, Beth Israel Deaconess Medical Center, Boston, Massachusetts, and Michael A. Steinman, MD, San Francisco Veterans Affairs Medical Center and University of California, San Francisco.
“The initial prescribing cascade can set off many other negative consequences, including adverse drug events, potentially avoidable diagnostic testing, and hospitalizations,” the editorialists caution.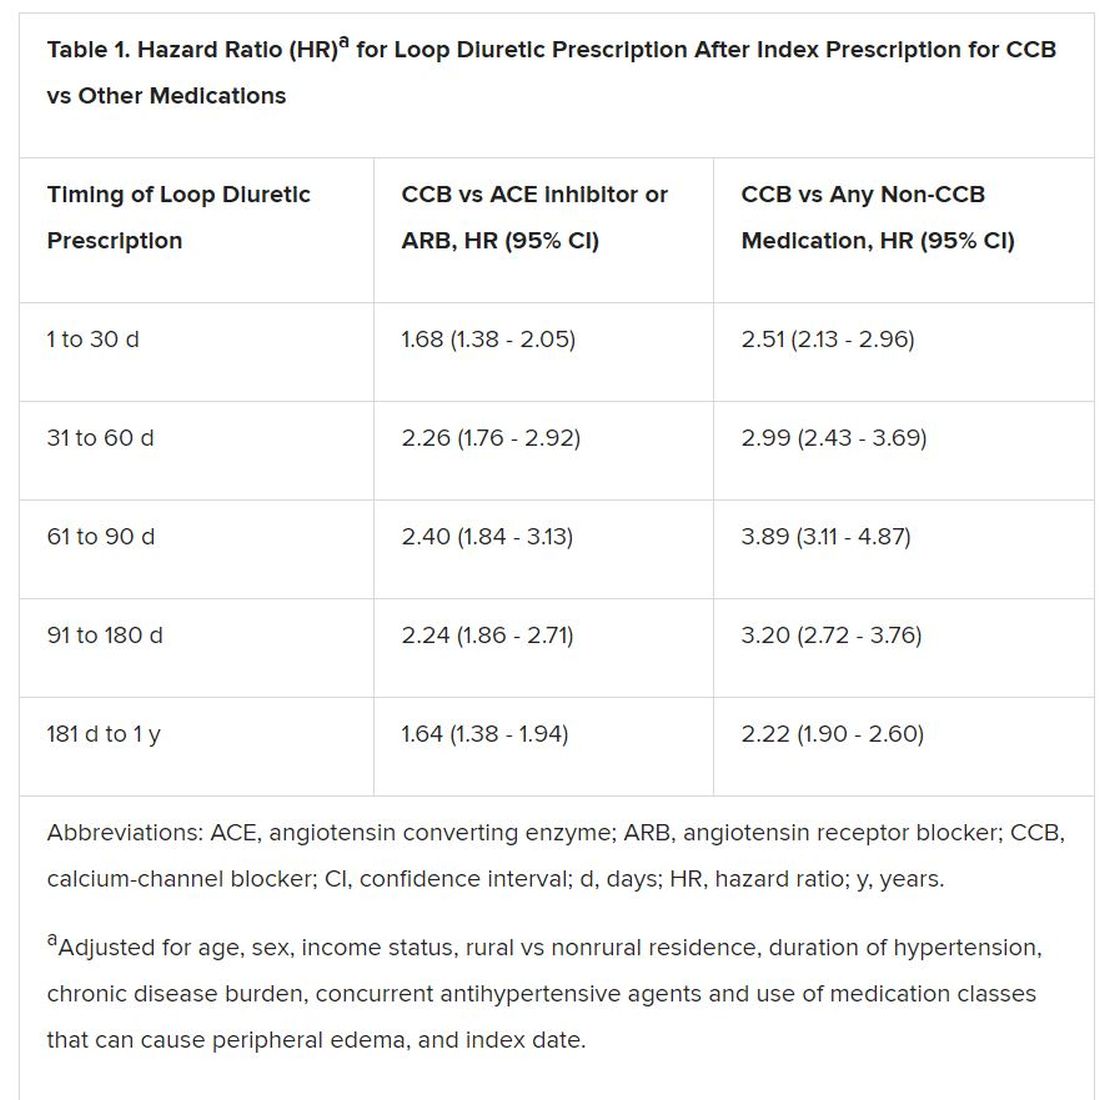
“Identifying prescribing cascades and their consequences is an important step to stem the tide of polypharmacy and inform deprescribing efforts.”
The analysis was based on administrative data from almost 340,000 adults in the community aged 66 years or older with hypertension and new drug prescriptions over 5 years ending in September 2016, the report notes. Their mean age was 74.5 years and 56.5% were women.
The data set included 41,086 patients who were newly prescribed a CCB; 66,494 who were newly prescribed an ACE inhibitor or ARB; and 231,439 newly prescribed any medication other than a CCB. The prescribed CCB was amlodipine in 79.6% of patients.
Although loop diuretics could possibly have been prescribed sometimes as a second-tier antihypertensive in the absence of peripheral edema, “we made efforts, through the design of our study, to limit this where possible,” Savage said in an interview.
For example, the focus was on loop diuretics, which aren’t generally recommended for blood-pressure lowering. Also, patients with heart failure and those with a recent history of diuretic or other antihypertensive medication use had been excluded, she said.
“As such, our cohort comprised individuals with new-onset or milder hypertension for whom diuretics would unlikely to be prescribed as part of guideline-based hypertension management.”
Although amlodipine was the most commonly prescribed CCB, the potential for a prescribing cascade seemed to be a class effect and to apply at a range of dosages.
That was unexpected, McCarthy observed, because “peripheral edema occurs more commonly in people taking dihydropyridine CCBs, like amlodipine, compared to non–dihydropyridine CCBs, such as verapamil and diltiazem.”
Savage, McCarthy, their coauthors, and the editorialists have disclosed no relevant financial relationships.
This article first appeared on Medscape.com.
Varied nightly bedtime, sleep duration linked to CVD risk
People who frequently alter the amount of sleep and time they go to bed each night are twofold more likely to develop cardiovascular disease, independent of traditional CVD risk factors, new research suggests.
Prior studies have focused on shift workers because night shift work will influence circadian rhythm and increase CVD risk. But it is increasingly recognized that circadian disruption may occur outside of shift work and accumulate over time, particularly given modern lifestyle factors such as increased use of mobile devices and television at night, said study coauthor Tianyi Huang, ScD, MSc, of Brigham and Women’s Hospital and Harvard Medical School in Boston, Massachusetts.
“Even if they tend to go to sleep at certain times, by following that lifestyle or behavior, it can interfere with their planned sleep timing,” he said.
“One thing that surprised me in this sample is that about one third of participants have irregular sleep patterns that can put them at increased risk of cardiovascular disease. So I think the prevalence is higher than expected,” Huang added.
As reported today in the Journal of the American College of Cardiology, the investigators used data from 7-day wrist actigraphy, 1 night of at-home polysomnography, and sleep questionnaires to assess sleep duration and sleep-onset timing among 1,992 Multi-Ethnic Study of Atherosclerosis () participants, aged 45 to 84 years, who were free of CVD and prospectively followed for a me MESA dian of 4.9 years.
A total of 786 patients (39.5%) had sleep duration standard deviation (SD) > 90 minutes and 510 (25.6%) had sleep-onset timing SD > 90 minutes.
During follow-up, there were 111 incident CVD events, including myocardial infarction, coronary heart disease death, stroke, and other coronary events.
Compared with people who had less than 1 hour of variation in sleep duration, the risk for incident CVD was 9% higher for people whose sleep duration varied 61 to 90 minutes (hazard ratio [HR], 1.09; 95% confidence interval [CI], 0.62 - 1.92), even after controlling for a variety of cardiovascular and sleep-related risk factors such as body mass index, systolic blood pressure, smoking status, total cholesterol, average sleep duration, insomnia symptoms, and sleep apnea.
Moreover, the adjusted CVD risk was substantially increased with 91 to 120 minutes of variation (HR, 1.59; 95% CI, 0.91 - 2.76) and more than 120 minutes of variation in sleep duration (HR, 2.14; 95% CI, 1.24 - 3.68).
Every 1-hour increase in sleep duration SD was associated with 36% higher CVD risk (95% CI; 1.07 - 1.73).
Compared with people with no more than a half hour of variation in nightly bedtimes, the adjusted hazard ratios for CVD were 1.16 (95% CI, 0.64 - 2.13), 1.52 (95% CI, 0.81 - 2.88), and 2.11 (95% CI, 1.13 - 3.91) when bedtimes varied by 31 to 60 minutes, 61 to 90 minutes, and more than 90 minutes.
For every 1-hour increase in sleep-onset timing SD, the risk of CVD was 18% higher (95% CI; 1.06 - 1.31).
“The results are similar for the regularity of sleep timing and the regularity of sleep duration, which means that both can contribute to circadian disruption and then lead to development of cardiovascular disease,” Huang said.
This is an important article and signals how sleep is an important marker and possibly a mediator of cardiovascular risk, said Harlan Krumholz, MD, of Yale School of Medicine in New Haven, Connecticut, who was not involved with the study.
“What I like about this is it’s a nice longitudinal, epidemiologic study with not just self-report, but sensor-detected sleep, that has been correlated with well-curated and adjudicated outcomes to give us a strong sense of this association,” he told theheart.org/Medscape Cardiology. “And also, that it goes beyond just the duration — they combine the duration and timing in order to give a fuller picture of sleep.”
Nevertheless, Krumholz said researchers are only at the beginning of being able to quantify the various dimensions of sleep and the degree to which sleep is a reflection of underlying physiologic issues, or whether patients are having erratic sleep patterns that are having a toxic effect on their overall health.
Questions also remain about the mechanism behind the association, whether the increased risk is universal or more harmful for some people, and the best way to measure factors during sleep that can most comprehensively and precisely predict risk.
“As we get more information flowing in from sensors, I think we will begin to develop more sophisticated approaches toward understanding risk, and it will be accompanied by other studies that will help us understand whether, again, this is a reflection of other processes that we should be paying attention to or whether it is a cause of disease and risk,” Krumholz said.
Subgroup analyses suggested positive associations between irregular sleep and CVD in African Americans, Hispanics, and Chinese Americans but not in whites. This could be because sleep irregularity, both timing and duration, was substantially higher in minorities, especially African Americans, but may also be as a result of chance because the study sample is relatively small, Huang explained.
The authors note that the overall findings are biologically plausible because of their previous work linking sleep irregularity with metabolic risk factors that predispose to atherosclerosis, such as obesity, diabetes, and hypertension. Participants with irregular sleep tended to have worse baseline cardiometabolic profiles, but this only explained a small portion of the associations between sleep irregularity and CVD, they note.
Other possible explanations include circadian clock genes, such as clock, per2 and bmal1, which have been shown experimentally to control a broad range of cardiovascular functions, from blood pressure and endothelial functions to vascular thrombosis and cardiac remodeling.
Irregular sleep may also influence the rhythms of the autonomic nervous system, and behavioral rhythms with regard to timing and/or amount of eating or exercise.
Further research is needed to understand the mechanisms driving the associations, the impact of sleep irregularity on individual CVD outcomes, and to determine whether a 7-day SD of more than 90 minutes for either sleep duration or sleep-onset timing can be used clinically as a threshold target for promoting cardiometabolically healthy sleep, Huang said.
“When providers communicate with their patients regarding strategies for CVD prevention, usually they focus on healthy diet and physical activity; and even when they talk about sleep, they talk about whether they have good sleep quality or sufficient sleep,” he said. “But one thing they should provide is advice regarding sleep regularity and [they should] recommend their patients follow a regular sleep pattern for the purpose of cardiovascular prevention.”
In a related editorial, Olaf Oldenburg, MD, Luderus-Kliniken Münster, Clemenshospital, Münster, Germany, and Jens Spiesshoefer, MD, Institute of Life Sciences, Scuola Superiore Sant’Anna, Pisa, Italy, write that the observed independent association between sleep irregularity and CVD “is a particularly striking finding given that impaired circadian rhythm is likely to be much more prevalent than the extreme example of shift work.”
They call on researchers to utilize big data to facilitate understanding of the association and say it is essential to test whether experimental data support the hypothesis that altered circadian rhythms would translate into unfavorable changes in 24-hour sympathovagal and neurohormonal balance, and ultimately CVD.
The present study “will, and should, stimulate much needed additional research on the association between sleep and CVD that may offer novel approaches to help improve the prognosis and daily symptom burden of patients with CVD, and might make sleep itself a therapeutic target in CVD,” the editorialists conclude.
This research was supported by contracts from the National Heart, Lung, and Blood Institute (NHLBI), and by grants from the National Center for Advancing Translational Sciences. The MESA Sleep Study was supported by an NHLBI grant. Huang was supported by a career development grant from the National Institutes of Health.
Krumholz and Oldenburg have disclosed no relevant financial relationships. Spiesshoefer is supported by grants from the Else-Kröner-Fresenius Stiftung, the Innovative Medical Research program at the University of Münster, and Deutsche Herzstiftung; and by young investigator research support from Scuola Superiore Sant’Anna Pisa. He also has received travel grants and lecture honoraria from Boehringer Ingelheim and Chiesi.
Source: J Am Coll Cardiol. 2020 Mar 2. doi: 10.1016/j.jacc.2019.12.054.
This article first appeared on Medscape.com.
Mammography does not reduce breast cancer deaths in women 75 and older
While more than half of women aged 75 years and older receive annual mammograms, they do not see a reduced risk of death from breast cancer, compared with women who have stopped regular screening, according to a study published in Annals of Internal Medicine.

The lack of benefit is not because older women’s cancer risk is low; a third of breast cancer deaths occur in women diagnosed at or after age 70 years, according to study author Xabier García-Albéniz, MD, PhD, of Harvard University in Boston, and colleagues.
The lack of benefit is not because mammography is less effective in women older than 75 years; indeed, it becomes a better diagnostic tool as women age, said Otis Brawley, MD, of Johns Hopkins University, Baltimore, the author of an editorial related to the study. Rather, the lack of benefit is because breast cancer treatment in older women is less successful, he clarified.
Study details
Dr. García-Albéniz and colleagues looked at data from 1,058,013 women enrolled in Medicare across the United States during 2000-2008. All subjects were aged 70-84 years and had a life expectancy of at least 10 years, at least one recent mammogram, and no history of breast cancer.
There are little randomized trial data available on mammography and breast cancer deaths for women in their early 70s and none for women older than 75 years. To compensate for this, the researchers aimed to emulate a prospective trial by looking at deaths over an 8-year period for women aged 70 and older who either continued annual screening or stopped it. The investigators conducted separate analyses for women aged 70-74 years and those 75-84 years of age.
Diagnoses of breast cancer were, not surprisingly, higher in the continued-screening group, but this did not translate to serious reductions in death.
In the continued-screening group, the estimated 8-year risk for breast cancer was 5.5% in women aged 70-74 and 5.8% in women aged 75-84 years. Among women who stopped screening, the estimated 8-year risk for breast cancer was 3.9% in both age groups.
Among women aged 70-74 years, the estimated 8-year risk for breast cancer death was slightly reduced with continued screening: 2.7 deaths per 1,000 women, compared with 3.7 deaths per 1,000 women for those who stopped screening. The risk difference was –1.0 deaths per 1,000 women, and the hazard ratio was 0.78.
Among women aged 75-84 years, there was no difference in estimated 8-year risk for breast cancer death. Women treated under a continued screening protocol had 3.8 deaths per 1,000, while the stop-screening group had 3.7 deaths per 1,000. The risk difference was 0.07 deaths per 1,000 women, and the hazard ratio was 1.00.
Interpreting the results
In the editorial accompanying this study, Dr. Brawley praised its design as “especially useful in breast cancer screening,” as “prospective randomized studies of mammography are not feasible and are perhaps no longer ethical in older women … because mammography is so widely accepted.”
In an interview, Dr. Brawley stressed that the findings do not argue for denying women aged 75 years and older mammography screening. Decisions about screening require a value judgment tailored to each individual patient’s perceived risks and benefits, he said.

In the absence of randomized trial evidence, “the jury will always be out” on the benefits of regular mammography for women 75 and older, Dr. Brawley said. “A clinical trial or a modeling study always tells you about an average person who doesn’t exist,” he added. “I predict that, in the future, we will have more parameters to tell us, ‘this is a person who’s 80 years old who is likely to benefit from screening; this is a person who is 75 years old who is unlikely to benefit.’ ”
And focusing too much on screening, he said, can divert attention from a key driver of breast cancer mortality in older women: inadequate treatment.
In the United States, Dr. Brawley said, “There’s a lot of emphasis on screening but fewer people writing about the fact that nearly 40% of American women get less than optimal treatment once they’re diagnosed.”
Dr. Brawley cited a 2013 modeling study showing that improvements in delivering current treatments would save more women even if screening rates remained unaltered (Cancer. 2013 Jul 15;119[14]:2541-8).
Among women in their 70s and 80s, Dr. Brawley said, some of the barriers to effective breast cancer care aren’t related to treatment efficacy but to travel and other logistical issues that can become more pronounced with age. “Unfortunately, there’s very little research on why, for women in their 70s and 80s, the treatments don’t work as well as they work in women 20 years younger,” he said.
Dr. García-Albéniz and colleagues’ study was funded by the National Institutes of Health. One coauthor reported financial ties to industry. Dr. Brawley discloses no conflicts of interest related to his editorial.
SOURCE: García-Albéniz X et al. Ann Intern Med 2020. doi: 10.7326/M18-1199.
While more than half of women aged 75 years and older receive annual mammograms, they do not see a reduced risk of death from breast cancer, compared with women who have stopped regular screening, according to a study published in Annals of Internal Medicine.
The lack of benefit is not because older women’s cancer risk is low; a third of breast cancer deaths occur in women diagnosed at or after age 70 years, according to study author Xabier García-Albéniz, MD, PhD, of Harvard University in Boston, and colleagues.
The lack of benefit is not because mammography is less effective in women older than 75 years; indeed, it becomes a better diagnostic tool as women age, said Otis Brawley, MD, of Johns Hopkins University, Baltimore, the author of an editorial related to the study. Rather, the lack of benefit is because breast cancer treatment in older women is less successful, he clarified.
Study details
Dr. García-Albéniz and colleagues looked at data from 1,058,013 women enrolled in Medicare across the United States during 2000-2008. All subjects were aged 70-84 years and had a life expectancy of at least 10 years, at least one recent mammogram, and no history of breast cancer.
There are little randomized trial data available on mammography and breast cancer deaths for women in their early 70s and none for women older than 75 years. To compensate for this, the researchers aimed to emulate a prospective trial by looking at deaths over an 8-year period for women aged 70 and older who either continued annual screening or stopped it. The investigators conducted separate analyses for women aged 70-74 years and those 75-84 years of age.
Diagnoses of breast cancer were, not surprisingly, higher in the continued-screening group, but this did not translate to serious reductions in death.
In the continued-screening group, the estimated 8-year risk for breast cancer was 5.5% in women aged 70-74 and 5.8% in women aged 75-84 years. Among women who stopped screening, the estimated 8-year risk for breast cancer was 3.9% in both age groups.
Among women aged 70-74 years, the estimated 8-year risk for breast cancer death was slightly reduced with continued screening: 2.7 deaths per 1,000 women, compared with 3.7 deaths per 1,000 women for those who stopped screening. The risk difference was –1.0 deaths per 1,000 women, and the hazard ratio was 0.78.
Among women aged 75-84 years, there was no difference in estimated 8-year risk for breast cancer death. Women treated under a continued screening protocol had 3.8 deaths per 1,000, while the stop-screening group had 3.7 deaths per 1,000. The risk difference was 0.07 deaths per 1,000 women, and the hazard ratio was 1.00.
Interpreting the results
In the editorial accompanying this study, Dr. Brawley praised its design as “especially useful in breast cancer screening,” as “prospective randomized studies of mammography are not feasible and are perhaps no longer ethical in older women … because mammography is so widely accepted.”
In an interview, Dr. Brawley stressed that the findings do not argue for denying women aged 75 years and older mammography screening. Decisions about screening require a value judgment tailored to each individual patient’s perceived risks and benefits, he said.
In the absence of randomized trial evidence, “the jury will always be out” on the benefits of regular mammography for women 75 and older, Dr. Brawley said. “A clinical trial or a modeling study always tells you about an average person who doesn’t exist,” he added. “I predict that, in the future, we will have more parameters to tell us, ‘this is a person who’s 80 years old who is likely to benefit from screening; this is a person who is 75 years old who is unlikely to benefit.’ ”
And focusing too much on screening, he said, can divert attention from a key driver of breast cancer mortality in older women: inadequate treatment.
In the United States, Dr. Brawley said, “There’s a lot of emphasis on screening but fewer people writing about the fact that nearly 40% of American women get less than optimal treatment once they’re diagnosed.”
Dr. Brawley cited a 2013 modeling study showing that improvements in delivering current treatments would save more women even if screening rates remained unaltered (Cancer. 2013 Jul 15;119[14]:2541-8).
Among women in their 70s and 80s, Dr. Brawley said, some of the barriers to effective breast cancer care aren’t related to treatment efficacy but to travel and other logistical issues that can become more pronounced with age. “Unfortunately, there’s very little research on why, for women in their 70s and 80s, the treatments don’t work as well as they work in women 20 years younger,” he said.
Dr. García-Albéniz and colleagues’ study was funded by the National Institutes of Health. One coauthor reported financial ties to industry. Dr. Brawley discloses no conflicts of interest related to his editorial.
SOURCE: García-Albéniz X et al. Ann Intern Med 2020. doi: 10.7326/M18-1199.
FROM ANNALS OF INTERNAL MEDICINE
ERAS protocol for cesarean delivery reduces opioid usage
GRAPEVINE, TEX. – An enhanced recovery after surgery (ERAS) pathway for cesarean delivery decreased postoperative opioid usage by 62% in one health care organization, researchers reported at the Pregnancy Meeting. The protocol incorporates a stepwise approach to pain control with no scheduled postoperative opioids.
Abington Jefferson Health, which includes two hospitals in Pennsylvania, implemented an ERAS pathway for all cesarean deliveries in October 2018. Kathryn Ruymann, MD, said at the meeting sponsored by the Society for Maternal-Fetal Medicine. Dr. Ruymann is an obstetrics and gynecology resident at Abington Jefferson Health.
Prior to the ERAS protocol, 99%-100% of patients took an opioid during the postoperative period. “With ERAS, 26% of patients never took an opioid during the postop period,” Dr. Ruymann and her associates reported. “Pain scores decreased with ERAS for postoperative days 1-3 and remained unchanged on day 4.”
One in 300 opioid-naive patients who receives opioids after cesarean delivery becomes a persistent user, one study has shown (Am J Obstet Gynecol. 2016 Sep; 215(3):353.e1-18). “ERAS pathways integrate evidence-based interventions before, during, and after surgery to optimize outcomes, specifically to decrease postoperative opioid use,” the researchers said.
While other surgical fields have adopted ERAS pathways, more research is needed in obstetrics, said Dr. Ruymann. More than 4,500 women deliver at Abington Jefferson Health each year, and about a third undergo cesarean deliveries.
The organization’s ERAS pathway incorporates preoperative education, fasting guidelines, and intraoperative analgesia, nausea prophylaxis, and antimicrobial therapy. Under the new protocol, postoperative analgesia includes scheduled administration of nonopioid medications, including celecoxib and acetaminophen. In addition, patients may take 5-10 mg of oxycodone orally every 4 hours as needed, and hydromorphone 0.4 mg IV as needed may be used for refractory pain. In addition, patients should resume eating as soon as tolerated and be out of bed within 4 hours after surgery, according to the protocol. Postoperative management of pruritus and instructions on how to wean off opioids at home are among the other elements of the enhanced recovery plan.
To examine postoperative opioid usage before and after implementation of the ERAS pathway, the investigators conducted a retrospective cohort study of 316 women who underwent cesarean delivery 3 months before the start of the ERAS pathway and 267 who underwent cesarean delivery 3 months after. The researchers used an application developed in Qlik Sense, a data analytics platform, to calculate opioid usage.
Mean postoperative opioid use decreased by 62%. The reduction in opioid use remained 8 months after starting the ERAS pathway.
“An ERAS pathway for [cesarean delivery] decreases postoperative opioid usage by integrating a multimodal stepwise approach to pain control and recovery,” the researchers said. “Standardized order sets and departmentwide education were crucial in the success of ERAS. Additional research is needed to evaluate the impact of unique components of ERAS in order to optimize this pathway.”
The researchers had no disclosures.
SOURCE: Ruymann K et al. Am J Obstet Gynecol. 2020 Jan;222(1):S212, Abstract 315.
REPORTING FROM THE PREGNANCY MEETING
Borderline personality disorder common in chronic pain patients
NATIONAL HARBOR, MD. – A significant proportion of patients who suffer from chronic pain also have features of borderline personality disorder (BPD), new research shows.
Results of a systematic literature review showed 23% of patients with chronic noncancer pain (CNCP) had some features of BPD, including difficulty maintaining relationships, as well as affect and mood instability.
“The fact that one-fourth of individuals with CNCP could have co-occurring BPD underscores the need for improved access to good psychological care,” lead investigator Fei Cao, MD, PhD, University of Missouri at Kansas City, said in an interview.
“If we treat the borderline personality disorder and address the psychiatric needs as well as the pain needs of the patient, then we will be able to treat their pain more successfully,” Cao said.
The findings were presented at the American Academy of Pain Medicine (AAPM) 2020 Annual Meeting.
Treatment resistance
Cao noted that a “significant number” of CNCP patients have at least some resistance to any type of pain treatment and speculated that BPD may increase treatment-resistant chronic pain.
Initially an anesthesiologist and pain medicine specialist, Cao later became a psychiatrist after recognizing the importance of addressing the underlying psychological needs of patients with chronic pain.
He noted that there is a strong psychological component to chronic pain and that many patients with chronic pain have suffered psychological trauma.
“You have to think about what may have happened to these patients. That is most important. I would not say these are difficult patients. I would say we just don’t know what happened to them,” he said.
To gain a better understanding of the prevalence of BPD in patients suffering from chronic pain and potentially provide some unexploited targets for chronic pain management, the investigators analyzed data from 11 studies published between 1994 and 2019. They found the prevalence of BPD among CNCP patients was 23.3%. Pain types included chronic headache (11.3%), arthritis (27.5%), and chronic spinal cord pain (24.3%).
We also have to treat their BPD. This can then make pain easier to control. Chronic pain management is often long-term and requires good compliance. A diagnosis of BPD might suggest poor compliance,” said Cao.
Screen for BPD
The study findings, he added, indicate a need to screen for BPD in patients with chronic pain. Interventions that are effective in the treatment of BPD and CNCP include cognitive-behavioral therapy, dialectical behavior therapy, antidepressants, and anticonvulsants.
“These should be considered as the first-line treatment in persons with comorbid pain and BPD,” Cao said.
Commenting on the findings, Ann E. Hansen, DVM, MD, Chronic Pain Wellness Center, Phoenix VA Health Care System, Arizona, said the study illustrates the multifactorial nature of chronic pain syndromes, and underscores the importance of a multidisciplinary approach to evaluation and treatment.
“The authors present data showing that BPD is a common diagnosis in patients with chronic pain, thus raising provider awareness to consider BPD and to involve behavioral health colleagues in comanaging these complex patients to achieve optimal outcomes,” Hansen said.
Cao and Hansen have disclosed no relevant financial relationships.
This article first appeared on Medscape.com.
SOURCE: Cao F et al. American Academy of Pain Medicine (AAPM) 2020 Annual Meeting, Abstract 505.
REPORTING FROM THE AAPM 2020 ANNUAL MEETING