User login
The Journal of Clinical Outcomes Management® is an independent, peer-reviewed journal offering evidence-based, practical information for improving the quality, safety, and value of health care.
div[contains(@class, 'header__large-screen')]
div[contains(@class, 'read-next-article')]
div[contains(@class, 'nav-primary')]
nav[contains(@class, 'nav-primary')]
section[contains(@class, 'footer-nav-section-wrapper')]
footer[@id='footer']
div[contains(@class, 'main-prefix')]
section[contains(@class, 'nav-hidden')]
div[contains(@class, 'ce-card-content')]
nav[contains(@class, 'nav-ce-stack')]
Blood test aims to measure COVID immunity
Scientists created a test that indirectly measures T-cell response – an important, long-term component of immunity that can last long after antibody levels fall off – to a challenge by the virus in whole blood.
The test mimics what can be done in a formal laboratory now but avoids some complicated steps and specialized training for lab personnel. This test, researchers said, is faster, can scale up to test many more people, and can be adapted to detect viral mutations as they emerge in the future.
The study explaining how all this works was published online in Nature Biotechnology.
The test, called dqTACT, could help predict the likelihood of “breakthrough” infections in people who are fully vaccinated and could help determine how frequently people who are immunocompromised might need to be revaccinated, the authors noted.
Infection with the coronavirus and other viruses can trigger a one-two punch from the immunity system – a fast antibody response followed by longer-lasting cellular immunity, including T cells, which “remember” the virus. Cellular immunity can trigger a quick response if the same virus ever shows up again.
The new test adds synthetic viral peptides – strings of amino acids that make up proteins – from the coronavirus to a blood sample. If there is no T-cell reaction within 24 hours, the test is negative. If the peptides trigger T cells, the test can measure the strength of the immune response.
The researchers validated the new test against traditional laboratory testing in 91 people, about half of whom never had COVID-19 and another half who were infected and recovered. The results matched well.
They also found the test predicted immune strength up to 8 months following a second dose of COVID-19 vaccine. Furthermore, T-cell response was greater among people who received two doses of a vaccine versus others who received only one immunization.
Studies are ongoing and designed to meet authorization requirements as part of future licensing from the Food and Drug Administration.
A version of this article first appeared on WebMD.com.
FROM NATURE BIOTECHNOLOGY
Exercise of any type boosts type 1 diabetes time in range
Adults with type 1 diabetes had significantly better glycemic control on days they exercised, regardless of exercise type, compared to days when they were inactive, according to a prospective study in nearly 500 individuals.
Different types of exercise, such as aerobic workouts, interval training, or resistance training, may have different immediate glycemic effects in adults with type 1 diabetes (T1D), but the impact of exercise type on the percentage of time diabetes patients maintain glucose in the 70-180 mg/dL range on days when they are active vs. inactive has not been well studied, Zoey Li said in a presentation at the annual scientific sessions of the American Diabetes Association.
In the Type 1 Diabetes Exercise Initiative (T1DEXI) study, Ms. Li and colleagues examined continuous glucose monitoring (CGM) data from 497 adults with T1D. The observational study included self-referred adults aged 18 years and older who had been living with T1D for at least 2 years. Participants were assigned to programs of aerobic exercise (defined as a target heart rate of 70%-80% of age-predicted maximum), interval exercise (defined as an interval heart rate of 80%-90% of age-predicted maximum), or resistance exercise (defined as muscle group fatigue after three sets of eight repetitions).
Participants completed the workouts at home via 30-minute videos at least six times over the 4-week study period. The study design involved an activity goal of at least 150 minutes per week, including the videos and self-reported usual activity, such as walking. The data were collected through an app designed for the study, a heart rate monitor, and a CGM.
The researchers compared glucose levels on days when the participants reported being active compared to days when they were sedentary. The goal of the study was to assess the effect of exercise type on time spent with glucose in the range of 70-180 mg/dL, defined as time in range (TIR).
The mean age of the participants was 37 years; 89% were White. The mean duration of diabetes was 18 years, and the mean hemoglobin A1c was 6.6%. “An astounding 95% were current continuous glucose monitoring [CGM] users,” said Ms. Li, a statistician at the Jaeb Center for Health Research in Tampa, Fla.
A total of 398 participants reported at least one exercise day and one sedentary day, for a total of 1,302 exercise days and 2,470 sedentary days.
Overall, the mean TIR was significantly higher on exercise days compared to sedentary days (75% vs. 70%, P < .001). The median time above 180 mg/dL also was significantly lower on exercise days compared to sedentary days (17% vs. 23%, P < .001), and mean glucose levels were 10 mg/dL lower on exercise days (145 mg/dL vs. 155 mg/dL)
“This all came with a slight hit to their time below range,” Ms. Li noted. The median time below 70 mg/dL was 1.1% on exercise days compared to 0.4% on sedentary days (P < .001). The percentage of days with hypoglycemic events was higher on exercise days compared to sedentary days (47% vs. 40%, P < .001), as they are related to time below 70 mg/dL, she added.
The differences for mean glucose level and TIR between exercise days and sedentary days were significant for each of the three exercise types, Ms. Li said.
“After establishing these glycemic trends, we looked at whether there were any factors that influenced the glycemic differences on exercise vs. sedentary days,” Ms. Li said.
Regardless of exercise type, age, sex, baseline A1c, diabetes duration, body mass index, insulin modality, CGM use, and percentage of time below range in the past 24 hours, there was higher TIR and higher hypoglycemia on exercise days compared to sedentary days.
Although the study was limited in part by the observational design, “with these data, we can better understand the glycemic benefits and disadvantages of exercise in adults with type 1 diabetes,” Ms. Li said.
Don’t forget the negative effects of exercise
“It is well known that the three types of exercise can modulate glucose levels. This can be very useful when attempting to reduce excessively high glucose levels, and when encouraging people to engage in frequent, regular, and consistent physical activity and exercise for general cardiovascular pulmonary and musculoskeletal health,” Helena W. Rodbard, MD, an endocrinologist in private practice in Rockville, Md., said in an interview.
“However, it was not known what effects various types of exercise would have on time in range (70-180 mg/dL) and time below range (< 70 mg/dL) measured over a full 24-hour period in people with type 1 diabetes,” said Dr. Rodbard, who was not involved with the study.
“I was surprised to see that the effect of the three different types of exercise were so similar,” Dr. Rodbard noted. “There had been previous reports suggesting that the time course of glucose could be different for these three types of exercise.”
The current study confirms prior knowledge that exercise can help reduce blood glucose, and increase TIR, said Dr. Rodbard. The study shows that TIR increases by roughly 5-7 percentage points (about 1 hour per day) and reduces mean glucose by 9-13 mg/dL irrespective of the three types of exercise,” she said. “There was a suggestion that the risk of increasing hypoglycemia below 70 mg/dL was less likely for resistance exercise than for the interval or aerobic types of exercise,” she noted.
As for additional research, “This study did not address the various ways in which one can mitigate the potentially deleterious effects of exercise, specifically with reference to rates of hypoglycemia, even mild symptomatic biochemical hypoglycemia,” said Dr. Rodbard. “Since the actual amount of time below 70 mg/dL is usually so small (0.3%-0.7% of the 1,440 minutes in the day, or about 5-10 minutes per day on average), it is difficult to measure and there is considerable variability between different people,” she emphasized. “Finding optimal and robust ways to achieve consistency in the reduction of glucose, between days within subjects, and between subjects, will need further examination of various types of protocols for diet, exercise and insulin administration, and of various methods for education of the patient,” she said.
The study was supported in part by the Leona M. and Harry B. Helmsley Charitable Trust. Ms. Li and Dr. Rodbard had no financial conflicts to disclose. Dr. Rodbard serves on the editorial advisory board of Clinical Endocrinology News.
FROM ADA 2022
For cancer prevention, not all plant-based diets are equal
researchers have found.
The study of more than 65,000 people showed that plant-based diets that were high in whole grains, fruits, and vegetables appear to be more protective against breast cancer than diets rich in processed plant-based products, such as juice and chips.
“Results suggest that the best plant-based diet for breast cancer prevention could be a healthy plant-based diet comprising fruit, vegetables, whole grains, nuts, and legumes,” said Sanam Shah, MBBS, FCPS, MPH, a doctoral candidate in epidemiology at Paris-Saclay University, who is the lead author of the new study. “In contrast, an unhealthy plant-based diet comprising higher intakes of primarily processed products of plant origin, such as refined grains, fruit juices, sweets, desserts, and potatoes, would be worse for breast cancer prevention.”
Dr. Shah’s group is presenting their research online at the annual meeting of the American Society for Nutrition.
Although the role of plant-based diets in cancer prevention has received extensive attention, Dr. Shah said few studies have assessed the influence of the quality of those diets on the risk of breast cancer.
Dr. Shah and colleagues conducted a prospective cohort study to investigate the link between healthy and unhealthy plant-based diets and breast cancer risk. Unlike other studies, the researchers also evaluated the effect of a gradual decrease in animal products in diets on health.
Dr. Shah’s group followed 65,574 postmenopausal women in France (mean age, 52.8 years) from 1993 to 2014. The researchers used self-reported food questionnaires to classify women into groups on the basis of adherence to a mostly plant or animal diet. Plant-based diets did not exclude meat but had more plant than animal products, Dr. Shah said. The researchers also grouped women on the basis of how healthy the plant-based diets were.
Over the 21-year study period, 3,968 women were diagnosed with breast cancer. Those who adhered to a more healthful plant-based diet had a 14% lower risk than average of developing breast cancer, while those who adhered to a less healthful plant-based diet had a 20% greater risk of developing the disease.
Nutritional quality varies greatly across plant-based foods. Quality plant-based diets should focus on variety to avoid nutritional deficiencies in iron, zinc, calcium, and vitamin B12, Dr. Shah said.
“The study by Shah and coworkers underscores the importance of considering more global aspects of the diet rather than single components when examining relationships between diet and health,” said Megan McCrory, PhD, research associate professor of nutrition at Boston University. “As the study illustrates, plant-based diets as a whole are not always healthy and may also contain less desirable nutrients and foods.”
Abstracts in the conference have been selected by a board of experts for presentation but have not yet been peer reviewed. All findings are to be regarded as preliminary until they are published in peer-reviewed articles. Dr. Shah and Dr. McCrory disclosed no relevant financial relationships.
A version of this article first appeared on Medscape.com.
FROM NUTRITION 2022
Sleep, not smoke, the key to COPD exacerbations?
, according to a study reported online in the journal Sleep.
Researchers followed 1,647 patients with confirmed COPD who were enrolled in the Subpopulations and Intermediate Outcome Measures in COPD Study (SPIROMICS). SPIROMICS is a multicenter study funded by the National Heart, Lung, and Blood Institute and the COPD Foundation and is designed to evaluate COPD subpopulations, outcomes, and biomarkers. All participants in the study were current or former smokers with confirmed COPD.
COPD exacerbations over a 3-year follow-up period were compared against reported sleep quality. The researchers used the Pittsburgh Sleep Quality Index (PSQI), a combination of seven sleep measures, including sleep duration, timing of sleep, and frequency of disturbances. The higher the score, the worse the quality of sleep.
Individuals who self-reported having poor-quality sleep had a 25%-95% higher risk of COPD exacerbations, compared with those who reported good-quality sleep, according to the results.
There was a significant association between PSQI score and total and mean exacerbations in the unadjusted analysis (incidence rate ratios, 1.09; 95% confidence interval, 1.05-1.13) and the analysis adjusted for demographics, medical comorbidities, disease severity, medication usage, and socioeconomic environmental exposure (IRR, 1.08; 95% CI, 1.03-1.13).
In addition, the PSQI score was independently associated with an increased risk of hospitalization, with a 7% increase in risk of hospitalization with each 1-point increase in PSQI, according to the researchers.
Surprising findings
These findings suggest that sleep quality may be a better predictor of flare-ups than the patient’s history of smoking, according to the researchers.
“Among those who already have COPD, knowing how they sleep at night will tell me much more about their risk of a flare-up than knowing whether they smoked for 40 versus 60 years. … That is very surprising and is not necessarily what I expected going into this study. Smoking is such a central process to COPD that I would have predicted it would be the more important predictor in the case of exacerbations,” said lead study author Aaron Baugh, MD, a practicing pulmonologist, and a clinical fellow at the University of California, San Francisco, in a National Institutes of Health press release on the study.
The study findings were applicable to all races and ethnicities studied, however the results may be particularly relevant to Black Americans, Dr. Baugh indicated, because past studies have shown that Black Americans tend to have poorer sleep quality than other races and ethnicities. With poorer sleep linked to worse COPD outcomes, the current study may help explain why Black Americans as a group tend to do worse when they have COPD, compared with other racial and ethnic groups, the researchers suggested.
The study was supported by the National Institutes of Health and the COPD Foundation. SPIROMICS was supported by NIH and the COPD Foundation as well as numerous pharmaceutical and biotechnology companies. The authors reported no other financial disclosures.
FROM SLEEP
Long-term erratic sleep may foretell cognitive problems
CHARLOTTE, N.C. – Erratic sleep patterns over years or even decades, along with a patient’s age and history of depression, may be harbingers of cognitive impairment later in life, an analysis of decades of data from a large sleep study has found.
“What we were a little surprised to find in this model was that sleep duration, whether short, long or average, was not significant, but the sleep variability – the change in sleep across those time measurements—was significantly impacting the incidence of cognitive impairment,” Samantha Keil, PhD, a postdoctoral fellow at the University of Washington, Seattle, reported at the at the annual meeting of the Associated Professional Sleep Societies.

The researchers analyzed sleep and cognition data collected over decades on 1,104 adults who participated in the Seattle Longitudinal Study. Study participants ranged from age 55 to over 100, with almost 80% of the study cohort aged 65 and older.
The Seattle Longitudinal Study first started gathering data in the 1950s. Participants in the study cohort underwent an extensive cognitive battery, which was added to the study in 1984 and gathered every 5-7 years, and completed a health behavioral questionnaire (HBQ), which was added in 1993 and administered every 3-5 years, Dr. Keil said. The HBQ included a question on average nightly sleep duration.
The study used a multivariable Cox proportional hazard regression model to evaluate the overall effect of average sleep duration and changes in sleep duration over time on cognitive impairment. Covariates used in the model included apolipoprotein E4 (APOE4) genotype, gender, years of education, ethnicity, and depression.
Dr. Keil said the model found, as expected, that the demographic variables of education, APOE status, and depression were significantly associated with cognitive impairment (hazard ratios of 1.11; 95% confidence interval [CI], 1.02-1.21; P = .01; and 2.08; 95% CI, 1.31-3.31; P < .005; and 1.08; 95% CI, 1.04-1.13; P < .005, respectively). Importantly, when evaluating the duration, change and variability of sleep, the researchers found that increased sleep variability was significantly associated with cognitive impairment (HR, 3.15; 95% CI, 1.69-5.87; P < .005).
Under this analysis, “sleep variability over time and not median sleep duration was associated with cognitive impairment,” she said. When sleep variability was added into the model, it improved the concordance score – a value that reflects the ability of a model to predict an outcome better than random chance – from .63 to .73 (a value of .5 indicates the model is no better at predicting an outcome than a random chance model; a value of .7 or greater indicates a good model).
Identification of sleep variability as a sleep pattern of interest in longitudinal studies is important, Dr. Keil said, because simply evaluating mean or median sleep duration across time might not account for a subject’s variable sleep phenotype. Most importantly, further evaluation of sleep variability with a linear regression prediction analysis (F statistic 8.796, P < .0001, adjusted R-squared .235) found that increased age, depression, and sleep variability significantly predicted cognitive impairment 10 years downstream. “Longitudinal sleep variability is perhaps for the first time being reported as significantly associated with the development of downstream cognitive impairment,” Dr. Keil said.
What makes this study unique, Dr. Keil said in an interview, is that it used self-reported longitudinal data gathered at 3- to 5-year intervals for up to 25 years, allowing for the assessment of variation of sleep duration across this entire time frame. “If you could use that shift in sleep duration as a point of therapeutic intervention, that would be really exciting,” she said.
Future research will evaluate how sleep variability and cognitive function are impacted by other variables gathered in the Seattle Longitudinal Study over the years, including factors such as diabetes and hypertension status, diet, alcohol and tobacco use, and marital and family status. Follow-up studies will be investigating the impact of sleep variability on neuropathologic disease progression and lymphatic system impairment, Dr. Keil said.
A newer approach
By linking sleep variability and daytime functioning, the study employs a “newer approach,” said Joseph M. Dzierzewski, PhD, director of behavioral medicine concentration in the department of psychology at Virginia Commonwealth University in Richmond. “While some previous work has examined night-to-night fluctuation in various sleep characteristics and cognitive functioning, what differentiates the present study from these previous works is the duration of the investigation,” he said. The “richness of data” in the Seattle Longitudinal Study and how it tracks sleep and cognition over years make it “quite unique and novel.”

Future studies, he said, should be deliberate in how they evaluate sleep and neurocognitive function across years. “Disentangling short-term moment-to-moment and day-to-day fluctuation, which may be more reversible in nature, from long-term, enduring month-to-month or year-to-year fluctuation, which may be more permanent, will be important for continuing to advance our understanding of these complex phenomena,” Dr. Dzierzewski said. “An additional important area of future investigation would be to continue the hunt for a common biological factor underpinning both sleep variability and Alzheimer’s disease.” That, he said, may help identify potential intervention targets.
Dr. Keil and Dr. Dzierzewski have no relevant disclosures.
CHARLOTTE, N.C. – Erratic sleep patterns over years or even decades, along with a patient’s age and history of depression, may be harbingers of cognitive impairment later in life, an analysis of decades of data from a large sleep study has found.
“What we were a little surprised to find in this model was that sleep duration, whether short, long or average, was not significant, but the sleep variability – the change in sleep across those time measurements—was significantly impacting the incidence of cognitive impairment,” Samantha Keil, PhD, a postdoctoral fellow at the University of Washington, Seattle, reported at the at the annual meeting of the Associated Professional Sleep Societies.
The researchers analyzed sleep and cognition data collected over decades on 1,104 adults who participated in the Seattle Longitudinal Study. Study participants ranged from age 55 to over 100, with almost 80% of the study cohort aged 65 and older.
The Seattle Longitudinal Study first started gathering data in the 1950s. Participants in the study cohort underwent an extensive cognitive battery, which was added to the study in 1984 and gathered every 5-7 years, and completed a health behavioral questionnaire (HBQ), which was added in 1993 and administered every 3-5 years, Dr. Keil said. The HBQ included a question on average nightly sleep duration.
The study used a multivariable Cox proportional hazard regression model to evaluate the overall effect of average sleep duration and changes in sleep duration over time on cognitive impairment. Covariates used in the model included apolipoprotein E4 (APOE4) genotype, gender, years of education, ethnicity, and depression.
Dr. Keil said the model found, as expected, that the demographic variables of education, APOE status, and depression were significantly associated with cognitive impairment (hazard ratios of 1.11; 95% confidence interval [CI], 1.02-1.21; P = .01; and 2.08; 95% CI, 1.31-3.31; P < .005; and 1.08; 95% CI, 1.04-1.13; P < .005, respectively). Importantly, when evaluating the duration, change and variability of sleep, the researchers found that increased sleep variability was significantly associated with cognitive impairment (HR, 3.15; 95% CI, 1.69-5.87; P < .005).
Under this analysis, “sleep variability over time and not median sleep duration was associated with cognitive impairment,” she said. When sleep variability was added into the model, it improved the concordance score – a value that reflects the ability of a model to predict an outcome better than random chance – from .63 to .73 (a value of .5 indicates the model is no better at predicting an outcome than a random chance model; a value of .7 or greater indicates a good model).
Identification of sleep variability as a sleep pattern of interest in longitudinal studies is important, Dr. Keil said, because simply evaluating mean or median sleep duration across time might not account for a subject’s variable sleep phenotype. Most importantly, further evaluation of sleep variability with a linear regression prediction analysis (F statistic 8.796, P < .0001, adjusted R-squared .235) found that increased age, depression, and sleep variability significantly predicted cognitive impairment 10 years downstream. “Longitudinal sleep variability is perhaps for the first time being reported as significantly associated with the development of downstream cognitive impairment,” Dr. Keil said.
What makes this study unique, Dr. Keil said in an interview, is that it used self-reported longitudinal data gathered at 3- to 5-year intervals for up to 25 years, allowing for the assessment of variation of sleep duration across this entire time frame. “If you could use that shift in sleep duration as a point of therapeutic intervention, that would be really exciting,” she said.
Future research will evaluate how sleep variability and cognitive function are impacted by other variables gathered in the Seattle Longitudinal Study over the years, including factors such as diabetes and hypertension status, diet, alcohol and tobacco use, and marital and family status. Follow-up studies will be investigating the impact of sleep variability on neuropathologic disease progression and lymphatic system impairment, Dr. Keil said.
A newer approach
By linking sleep variability and daytime functioning, the study employs a “newer approach,” said Joseph M. Dzierzewski, PhD, director of behavioral medicine concentration in the department of psychology at Virginia Commonwealth University in Richmond. “While some previous work has examined night-to-night fluctuation in various sleep characteristics and cognitive functioning, what differentiates the present study from these previous works is the duration of the investigation,” he said. The “richness of data” in the Seattle Longitudinal Study and how it tracks sleep and cognition over years make it “quite unique and novel.”
Future studies, he said, should be deliberate in how they evaluate sleep and neurocognitive function across years. “Disentangling short-term moment-to-moment and day-to-day fluctuation, which may be more reversible in nature, from long-term, enduring month-to-month or year-to-year fluctuation, which may be more permanent, will be important for continuing to advance our understanding of these complex phenomena,” Dr. Dzierzewski said. “An additional important area of future investigation would be to continue the hunt for a common biological factor underpinning both sleep variability and Alzheimer’s disease.” That, he said, may help identify potential intervention targets.
Dr. Keil and Dr. Dzierzewski have no relevant disclosures.
AT SLEEP 2022
Top children’s hospitals report includes rankings by region to aid families
Boston Children’s Hospital led the list of 10 children’s hospitals across the United States named to the Best Children’s Hospitals Honor Roll for 2022-2023, issued by U.S. News & World Report.
The 16th annual Best Children’s Hospitals rankings were published on June 14.
Rounding out the top 10 on the Honor Roll were Children’s Hospital of Philadelphia; Texas Children’s Hospital, Houston; Cincinnati Children’s Hospital Medical Center; Children’s Hospital Los Angeles; Children’s Hospital Colorado, Aurora; Children’s National Hospital, Washington, D.C.; Nationwide Children’s Hospital, Columbus, Ohio; UPMC Children’s Hospital of Pittsburgh; and Lucile Packard Children’s Hospital, Palo Alto, Calif.
The Honor Roll hospitals were chosen based on being highly ranked in multiple specialties, such as cancer, cardiology, and orthopedics.
For the second time, the rankings included top hospitals not only in each state, but also in seven multistate regions. The goal of the regional rankings is to help families identify the high-quality pediatric care centers closest to them, according to the U.S. News press release accompanying the rankings.
The top-ranked hospitals for the seven regions were Children’s Hospital Los Angeles (Pacific); Children’s Hospital Colorado, Aurora (Rocky Mountains); Texas Children’s Hospital, Houston (Southwest); Children’s Healthcare of Atlanta and Monroe Carell Jr. Children’s Hospital at Vanderbilt, Nashville, Tenn. (tie for Southeast); Cincinnati Children’s Hospital Medical Center (Midwest); Children’s Hospital of Philadelphia (Mid-Atlantic); and Boston Children’s Hospital (New England).
The 2022-2023 U.S. News rankings identify the top 50 centers across the United States in each of 10 pediatric specialties: cancer, cardiology/ heart surgery, diabetes/endocrinology, gastroenterology/gastrointestinal surgery, neonatology, nephrology, neurology/neurosurgery, orthopedics, pulmonology/lung surgery, and urology.
For the 2022-2023 rankings, U.S. News requested medical data and other information from 200 pediatric facilities across the United States; 119 responded and were evaluated in at least one specialty, and 90 were ranked in one or more specialties.
Approximately one-third of each hospital’s score was based on outcomes such as survival, infections, and surgical complications (although outcomes counted for 38.3% of scores for cardiology and heart surgery). Approximately 13% of the score was based on reputation/expert opinion, determined by an annual survey of experts in the 10 specialties (8% of scores for cardiology and heart surgery), and nearly 60% was based on patient safety, excellence, and family centeredness, according to a statement from U.S. News.
“The Best Children’s Hospitals rankings spotlight hospitals that excel in specialized care, offering parents and their pediatricians a helpful starting point in choosing the facility that’s best for their child,” said Ben Harder, chief of health analysis and managing editor at U.S. News, in a press release accompanying the rankings.
Also new to the ranking system this year was a measure to assess hospitals’ efforts to improve equity of care and to promote diversity and inclusion, which accounts for 2% of each hospital’s score in each specialty, according to U.S. News.
Adjunctive psychotherapy may offer no benefit in severe depression
Results of a cross-sectional, naturalistic, multicenter European study showed there were no significant differences in response rates between patients with major depressive disorder (MDD) who received combination treatment with psychotherapy and antidepressant medication in comparison with those who received antidepressant monotherapy, even when comparing different types of psychotherapy.

This “might emphasize the fundamental role of the underlying complex biological interrelationships in MDD and its treatment,” said study investigator Lucie Bartova, MD, PhD, Clinical Division of General Psychiatry, Medical University of Vienna.
However, she noted that patients who received psychotherapy in combination with antidepressants also had “beneficial sociodemographic and clinical characteristics,” which might reflect poorer access to “psychotherapeutic techniques for patients who are more severely ill and have less socioeconomic privilege.”
The resulting selection bias may cause patients with more severe illness to “fall by the wayside,” Dr. Bartova said.
Lead researcher Siegfried Kasper, MD, also from the Medical University of Vienna, agreed, saying in a press release that, by implication, “additional psychotherapy tends to be given to more highly educated and healthier patients, which may reflect the greater availability of psychotherapy to more socially and economically advantaged patients.”
The findings, some of which were previously published in the Journal of Psychiatry Research, were presented at the virtual European Psychiatric Association 2022 Congress.
Inconsistent guidelines
During her presentation, Dr. Bartova said that while “numerous effective antidepressant strategies are available for the treatment of MDD, many patients do not achieve a satisfactory treatment response,” which often leads to further management refinement and the use of off-label treatments.
She continued, saying that the “most obvious” approach in these situations is to try the available treatment options in a “systematic and individualized” manner, ideally by following recommended treatment algorithms.
Meta-analyses have suggested that standardized psychotherapy with fixed, regular sessions that follows an established rationale and is based on a defined school of thought is effective in MDD, “with at least moderate effects.”
Among the psychotherapy approaches, cognitive-behavioral therapy (CBT) is the “best and most investigated,” Dr. Bartova said, but international clinical practice guidelines “lack consistency” regarding recommendations for psychotherapy.
To examine the use and impact of psychotherapy for MDD patients, the researchers studied 1,410 adult inpatients and outpatients from 10 centers in eight countries who were surveyed between 2011 and 2016 by the European Group for the Study of Resistant Depression.
Participants were assessed via the Mini–International Neuropsychiatric Interview, the Montgomery-Åsberg Depression Rating Scale, and the Hamilton Depression Rating Scale.
Results showed that among 1,279 MDD patients who were included in the final analysis, 880 (68.8%) received only antidepressants, while 399 (31.2%) received some form of structured psychotherapy as part of their treatment.
These patients included 22.8% who received CBT, 3.4% who underwent psychoanalytic psychotherapy, and 1.3% who received systemic psychotherapy. The additional psychotherapy was not specified for 3.8%.
Dr. Bartova explained that the use of psychotherapy in combination pharmacologic treatment was significantly associated with younger age, higher educational attainment, and ongoing employment in comparison with antidepressant use alone (P < .001 for all).
In addition, combination therapy was associated with an earlier average age of MDD onset, lower severity of current depressive symptoms, a lower risk of suicidality, higher rates of additional melancholic features in the patients’ symptomatology, and higher rates of comorbid asthma and migraine (P < .001 for all).
There was also a significant association between the use of psychotherapy plus pharmacologic treatment and lower average daily doses of first-line antidepressant medication (P < .001), as well as more frequent administration of agomelatine (P < .001) and a trend toward greater use of vortioxetine (P = .006).
In contrast, among patients who received antidepressants alone, there was a trend toward higher rates of additional psychotic features (P = .054), and the patients were more likely to have received selective serotonin reuptake inhibitors as their first-line antidepressant medication (P < .001).
The researchers found there was no significant difference in rates of response, nonresponse, and treatment-resistant depression (TRD) between patients who received combination psychotherapy and pharmacotherapy and those who received antidepressants alone (P = .369).
Dr. Bartova showed that 25.8% of MDD patients who received combination therapy were classified as responders, compared with 23.5% of those given only antidepressants. Nonresponse was identified in 35.6% and 33.8% of patients, respectively, while 38.6% versus 42.7% had TRD.
Dr. Bartova and colleagues performed an additional analysis to determine whether there was any difference in response depending on the type of psychotherapy.
They divided patients who received combination therapy into those who had received CBT and those who had been given another form of psychotherapy.
Again, there were no significant differences in response, nonresponse, and TRD (P = .256). The response rate was 27.1% among patients given combination CBT, versus 22.4% among those who received another psychotherapy.
“Despite clinical guidelines and studies which advocate for psychotherapy and combining psychotherapy with antidepressants, this study shows that in real life, no added value can be demonstrated for psychotherapy in those already treated with antidepressants for severe depression,” Livia De Picker, MD, PhD, Collaborative Antwerp Psychiatric Research Institute, University of Antwerp, Belgium, said in the press release.
“This doesn’t necessarily mean that psychotherapy is not useful, but it is a clear sign that the way we are currently managing these depressed patients with psychotherapy is not effective and needs critical evaluation,” added Dr. De Picker, who was not involved in the research.
However, Michael E. Thase, MD, professor of psychiatry, University of Pennsylvania, Philadelphia, told this news organization that the current study “is a secondary analysis of a naturalistic study.”

Consequently, it is not possible to account for the “dose and duration, and quality, of the psychotherapy provided.”
Therefore, the findings simply suggest that “the kinds of psychotherapy provided to these patients was not so powerful that people who received it consistently did better than those who did not,” Dr. Thase said.
The European Group for the Study of Resistant Depression obtained an unrestricted grant sponsored by Lundbeck A/S. Dr. Bartova has relationships with AOP Orphan, Medizin Medien Austria, Universimed, Vertretungsnetz, Dialectica, Diagnosia, Schwabe, Janssen, Lundbeck, and Angelini. No other relevant financial relationships have been disclosed.
A version of this article first appeared on Medscape.com.
Results of a cross-sectional, naturalistic, multicenter European study showed there were no significant differences in response rates between patients with major depressive disorder (MDD) who received combination treatment with psychotherapy and antidepressant medication in comparison with those who received antidepressant monotherapy, even when comparing different types of psychotherapy.
This “might emphasize the fundamental role of the underlying complex biological interrelationships in MDD and its treatment,” said study investigator Lucie Bartova, MD, PhD, Clinical Division of General Psychiatry, Medical University of Vienna.
However, she noted that patients who received psychotherapy in combination with antidepressants also had “beneficial sociodemographic and clinical characteristics,” which might reflect poorer access to “psychotherapeutic techniques for patients who are more severely ill and have less socioeconomic privilege.”
The resulting selection bias may cause patients with more severe illness to “fall by the wayside,” Dr. Bartova said.
Lead researcher Siegfried Kasper, MD, also from the Medical University of Vienna, agreed, saying in a press release that, by implication, “additional psychotherapy tends to be given to more highly educated and healthier patients, which may reflect the greater availability of psychotherapy to more socially and economically advantaged patients.”
The findings, some of which were previously published in the Journal of Psychiatry Research, were presented at the virtual European Psychiatric Association 2022 Congress.
Inconsistent guidelines
During her presentation, Dr. Bartova said that while “numerous effective antidepressant strategies are available for the treatment of MDD, many patients do not achieve a satisfactory treatment response,” which often leads to further management refinement and the use of off-label treatments.
She continued, saying that the “most obvious” approach in these situations is to try the available treatment options in a “systematic and individualized” manner, ideally by following recommended treatment algorithms.
Meta-analyses have suggested that standardized psychotherapy with fixed, regular sessions that follows an established rationale and is based on a defined school of thought is effective in MDD, “with at least moderate effects.”
Among the psychotherapy approaches, cognitive-behavioral therapy (CBT) is the “best and most investigated,” Dr. Bartova said, but international clinical practice guidelines “lack consistency” regarding recommendations for psychotherapy.
To examine the use and impact of psychotherapy for MDD patients, the researchers studied 1,410 adult inpatients and outpatients from 10 centers in eight countries who were surveyed between 2011 and 2016 by the European Group for the Study of Resistant Depression.
Participants were assessed via the Mini–International Neuropsychiatric Interview, the Montgomery-Åsberg Depression Rating Scale, and the Hamilton Depression Rating Scale.
Results showed that among 1,279 MDD patients who were included in the final analysis, 880 (68.8%) received only antidepressants, while 399 (31.2%) received some form of structured psychotherapy as part of their treatment.
These patients included 22.8% who received CBT, 3.4% who underwent psychoanalytic psychotherapy, and 1.3% who received systemic psychotherapy. The additional psychotherapy was not specified for 3.8%.
Dr. Bartova explained that the use of psychotherapy in combination pharmacologic treatment was significantly associated with younger age, higher educational attainment, and ongoing employment in comparison with antidepressant use alone (P < .001 for all).
In addition, combination therapy was associated with an earlier average age of MDD onset, lower severity of current depressive symptoms, a lower risk of suicidality, higher rates of additional melancholic features in the patients’ symptomatology, and higher rates of comorbid asthma and migraine (P < .001 for all).
There was also a significant association between the use of psychotherapy plus pharmacologic treatment and lower average daily doses of first-line antidepressant medication (P < .001), as well as more frequent administration of agomelatine (P < .001) and a trend toward greater use of vortioxetine (P = .006).
In contrast, among patients who received antidepressants alone, there was a trend toward higher rates of additional psychotic features (P = .054), and the patients were more likely to have received selective serotonin reuptake inhibitors as their first-line antidepressant medication (P < .001).
The researchers found there was no significant difference in rates of response, nonresponse, and treatment-resistant depression (TRD) between patients who received combination psychotherapy and pharmacotherapy and those who received antidepressants alone (P = .369).
Dr. Bartova showed that 25.8% of MDD patients who received combination therapy were classified as responders, compared with 23.5% of those given only antidepressants. Nonresponse was identified in 35.6% and 33.8% of patients, respectively, while 38.6% versus 42.7% had TRD.
Dr. Bartova and colleagues performed an additional analysis to determine whether there was any difference in response depending on the type of psychotherapy.
They divided patients who received combination therapy into those who had received CBT and those who had been given another form of psychotherapy.
Again, there were no significant differences in response, nonresponse, and TRD (P = .256). The response rate was 27.1% among patients given combination CBT, versus 22.4% among those who received another psychotherapy.
“Despite clinical guidelines and studies which advocate for psychotherapy and combining psychotherapy with antidepressants, this study shows that in real life, no added value can be demonstrated for psychotherapy in those already treated with antidepressants for severe depression,” Livia De Picker, MD, PhD, Collaborative Antwerp Psychiatric Research Institute, University of Antwerp, Belgium, said in the press release.
“This doesn’t necessarily mean that psychotherapy is not useful, but it is a clear sign that the way we are currently managing these depressed patients with psychotherapy is not effective and needs critical evaluation,” added Dr. De Picker, who was not involved in the research.
However, Michael E. Thase, MD, professor of psychiatry, University of Pennsylvania, Philadelphia, told this news organization that the current study “is a secondary analysis of a naturalistic study.”
Consequently, it is not possible to account for the “dose and duration, and quality, of the psychotherapy provided.”
Therefore, the findings simply suggest that “the kinds of psychotherapy provided to these patients was not so powerful that people who received it consistently did better than those who did not,” Dr. Thase said.
The European Group for the Study of Resistant Depression obtained an unrestricted grant sponsored by Lundbeck A/S. Dr. Bartova has relationships with AOP Orphan, Medizin Medien Austria, Universimed, Vertretungsnetz, Dialectica, Diagnosia, Schwabe, Janssen, Lundbeck, and Angelini. No other relevant financial relationships have been disclosed.
A version of this article first appeared on Medscape.com.
FROM EPA 2022
Synthetic opioid use up almost 800% nationwide
The results of a national urine drug test (UDT) study come as the United States is reporting a record-high number of drug overdose deaths – more than 80% of which involved fentanyl or other synthetic opioids and prompting a push for better surveillance models.
Researchers found that UDTs can be used to accurately identify which drugs are circulating in a community, revealing in just a matter of days critically important drug use trends that current surveillance methods take a month or longer to report.

The faster turnaround could potentially allow clinicians and public health officials to be more proactive with targeted overdose prevention and harm-reduction strategies such as distribution of naloxone and fentanyl test strips.
“We’re talking about trying to come up with an early-warning system,” study author Steven Passik, PhD, vice president for scientific affairs for Millennium Health, San Diego, Calif., told this news organization. “We’re trying to find out if we can let people in the harm reduction and treatment space know about what might be coming weeks or a month or more in advance so that some interventions could be marshaled.”
The study was published online in JAMA Network Open.
Call for better surveillance
More than 100,000 people in the United States died of an unintended drug overdose in 2021, a record high and a 15% increase over 2020 figures, which also set a record.
Part of the federal government’s plan to address the crisis includes strengthening epidemiologic efforts by better collection and mining of public health surveillance data.
Sources currently used to detect drug use trends include mortality data, poison control centers, emergency departments, electronic health records, and crime laboratories. But analysis of these sources can take weeks or more.

“One of the real challenges in addressing and reducing overdose deaths has been the relative lack of accessible real-time data that can support agile responses to deployment of resources in a specific geographic region,” study coauthor Rebecca Jackson, MD, professor and associate dean for clinical and translational research at Ohio State University in Columbus, said in an interview.
Ohio State researchers partnered with scientists at Millennium Health, one of the largest urine test labs in the United States, on a cross-sectional study to find out if UDTs could be an accurate and speedier tool for drug surveillance.
They analyzed 500,000 unique urine samples from patients in substance use disorder (SUD) treatment facilities in all 50 states from 2013 to 2020, comparing levels of cocaine, heroin, methamphetamine, synthetic opioids, and other opioids found in the samples to levels of the same drugs from overdose mortality data at the national, state, and county level from the National Vital Statistics System.
On a national level, synthetic opioids and methamphetamine were highly correlated with overdose mortality data (Spearman’s rho = .96 for both). When synthetic opioids were coinvolved, methamphetamine (rho = .98), heroin (rho = .78), cocaine (rho = .94), and other opioids (rho = .83) were also highly correlated with overdose mortality data.
Similar correlations were found when examining state-level data from 24 states and at the county level upon analysis of 19 counties in Ohio.
A changing landscape
Researchers said the strong correlation between overdose deaths and UDT results for synthetic opioids and methamphetamine are likely explained by the drugs’ availability and lethality.
“The most important thing that we found was just the strength of the correlation, which goes right to the heart of why we considered correlation to be so critical,” lead author Penn Whitley, senior director of bioinformatics for Millennium Health, told this news organization. “We needed to demonstrate that there was a strong correlation of just the UDT positivity rates with mortality – in this case, fatal drug overdose rates – as a steppingstone to build out tools that could utilize UDT as a real-time data source.”
While the main goal of the study was to establish correlation between UDT results and national mortality data, the study also offers a view of a changing landscape in the opioid epidemic.
Overall, UDT positivity for total synthetic opioids increased from 2.1% in 2013 to 19.1% in 2020 (a 792.5% increase). Positivity rates for all included drug categories increased when synthetic opioids were present.
However, in the absence of synthetic opioids, UDT positivity decreased for almost all drug categories from 2013 to 2020 (from 7.7% to 4.7% for cocaine; 3.9% to 1.6% for heroin; 20.5% to 6.9% for other opioids).
Only methamphetamine positivity increased with or without involvement of synthetic opioids. With synthetic opioids, meth positivity rose from 0.1% in 2013 to 7.9% in 2020. Without them, meth positivity rates still rose, from 2.1% in 2013 to 13.1% in 2020.
The findings track with an earlier study showing methamphetamine-involved overdose deaths rose sharply between 2011 and 2018.
“The data from this manuscript support that the opioid epidemic is transitioning from an opioid epidemic to a polysubstance epidemic where illicit synthetic opioids, largely fentanyl, in combination with other substances are now responsible for upwards of 80% of OD deaths,” Dr. Jackson said.
In an accompanying editorial Jeffrey Brent, MD, PhD, clinical professor in internal medicine at the University of Colorado at Denver, Aurora, and Stephanie T. Weiss, MD, PhD, staff clinician in the Translational Addiction Medicine Branch at the National Institute on Drug Abuse, Baltimore, note that as new agents emerge, different harm-reduction strategies will be needed, adding that having a real-time tool to identify the trends will be key to preventing deaths.
“Surveillance systems are an integral component of reducing morbidity and mortality associated with illicit drug use. On local, regional, and national levels, information of this type is needed to most efficiently allocate limited resources to maximize benefit and save lives,” Dr. Brent and Dr. Weiss write.
The study was funded by Millennium Health and the National Center for Advancing Translational Sciences. Full disclosures are included in the original articles, but no sources reported conflicts related to the study.
A version of this article first appeared on Medscape.com.
The results of a national urine drug test (UDT) study come as the United States is reporting a record-high number of drug overdose deaths – more than 80% of which involved fentanyl or other synthetic opioids and prompting a push for better surveillance models.
Researchers found that UDTs can be used to accurately identify which drugs are circulating in a community, revealing in just a matter of days critically important drug use trends that current surveillance methods take a month or longer to report.
The faster turnaround could potentially allow clinicians and public health officials to be more proactive with targeted overdose prevention and harm-reduction strategies such as distribution of naloxone and fentanyl test strips.
“We’re talking about trying to come up with an early-warning system,” study author Steven Passik, PhD, vice president for scientific affairs for Millennium Health, San Diego, Calif., told this news organization. “We’re trying to find out if we can let people in the harm reduction and treatment space know about what might be coming weeks or a month or more in advance so that some interventions could be marshaled.”
The study was published online in JAMA Network Open.
Call for better surveillance
More than 100,000 people in the United States died of an unintended drug overdose in 2021, a record high and a 15% increase over 2020 figures, which also set a record.
Part of the federal government’s plan to address the crisis includes strengthening epidemiologic efforts by better collection and mining of public health surveillance data.
Sources currently used to detect drug use trends include mortality data, poison control centers, emergency departments, electronic health records, and crime laboratories. But analysis of these sources can take weeks or more.
“One of the real challenges in addressing and reducing overdose deaths has been the relative lack of accessible real-time data that can support agile responses to deployment of resources in a specific geographic region,” study coauthor Rebecca Jackson, MD, professor and associate dean for clinical and translational research at Ohio State University in Columbus, said in an interview.
Ohio State researchers partnered with scientists at Millennium Health, one of the largest urine test labs in the United States, on a cross-sectional study to find out if UDTs could be an accurate and speedier tool for drug surveillance.
They analyzed 500,000 unique urine samples from patients in substance use disorder (SUD) treatment facilities in all 50 states from 2013 to 2020, comparing levels of cocaine, heroin, methamphetamine, synthetic opioids, and other opioids found in the samples to levels of the same drugs from overdose mortality data at the national, state, and county level from the National Vital Statistics System.
On a national level, synthetic opioids and methamphetamine were highly correlated with overdose mortality data (Spearman’s rho = .96 for both). When synthetic opioids were coinvolved, methamphetamine (rho = .98), heroin (rho = .78), cocaine (rho = .94), and other opioids (rho = .83) were also highly correlated with overdose mortality data.
Similar correlations were found when examining state-level data from 24 states and at the county level upon analysis of 19 counties in Ohio.
A changing landscape
Researchers said the strong correlation between overdose deaths and UDT results for synthetic opioids and methamphetamine are likely explained by the drugs’ availability and lethality.
“The most important thing that we found was just the strength of the correlation, which goes right to the heart of why we considered correlation to be so critical,” lead author Penn Whitley, senior director of bioinformatics for Millennium Health, told this news organization. “We needed to demonstrate that there was a strong correlation of just the UDT positivity rates with mortality – in this case, fatal drug overdose rates – as a steppingstone to build out tools that could utilize UDT as a real-time data source.”
While the main goal of the study was to establish correlation between UDT results and national mortality data, the study also offers a view of a changing landscape in the opioid epidemic.
Overall, UDT positivity for total synthetic opioids increased from 2.1% in 2013 to 19.1% in 2020 (a 792.5% increase). Positivity rates for all included drug categories increased when synthetic opioids were present.
However, in the absence of synthetic opioids, UDT positivity decreased for almost all drug categories from 2013 to 2020 (from 7.7% to 4.7% for cocaine; 3.9% to 1.6% for heroin; 20.5% to 6.9% for other opioids).
Only methamphetamine positivity increased with or without involvement of synthetic opioids. With synthetic opioids, meth positivity rose from 0.1% in 2013 to 7.9% in 2020. Without them, meth positivity rates still rose, from 2.1% in 2013 to 13.1% in 2020.
The findings track with an earlier study showing methamphetamine-involved overdose deaths rose sharply between 2011 and 2018.
“The data from this manuscript support that the opioid epidemic is transitioning from an opioid epidemic to a polysubstance epidemic where illicit synthetic opioids, largely fentanyl, in combination with other substances are now responsible for upwards of 80% of OD deaths,” Dr. Jackson said.
In an accompanying editorial Jeffrey Brent, MD, PhD, clinical professor in internal medicine at the University of Colorado at Denver, Aurora, and Stephanie T. Weiss, MD, PhD, staff clinician in the Translational Addiction Medicine Branch at the National Institute on Drug Abuse, Baltimore, note that as new agents emerge, different harm-reduction strategies will be needed, adding that having a real-time tool to identify the trends will be key to preventing deaths.
“Surveillance systems are an integral component of reducing morbidity and mortality associated with illicit drug use. On local, regional, and national levels, information of this type is needed to most efficiently allocate limited resources to maximize benefit and save lives,” Dr. Brent and Dr. Weiss write.
The study was funded by Millennium Health and the National Center for Advancing Translational Sciences. Full disclosures are included in the original articles, but no sources reported conflicts related to the study.
A version of this article first appeared on Medscape.com.
Children and COVID: New cases hold steady in nonholiday week
The new-case count for the most recent reporting week – 87,644 for June 3-9 – did go up from the previous week, but by only 270 cases, the American Academy of Pediatrics and Children’s Hospital Association said in their weekly COVID report. That’s just 0.31% higher than a week ago and probably is affected by reduced testing and reporting because of Memorial Day, as the AAP and CHA noted earlier.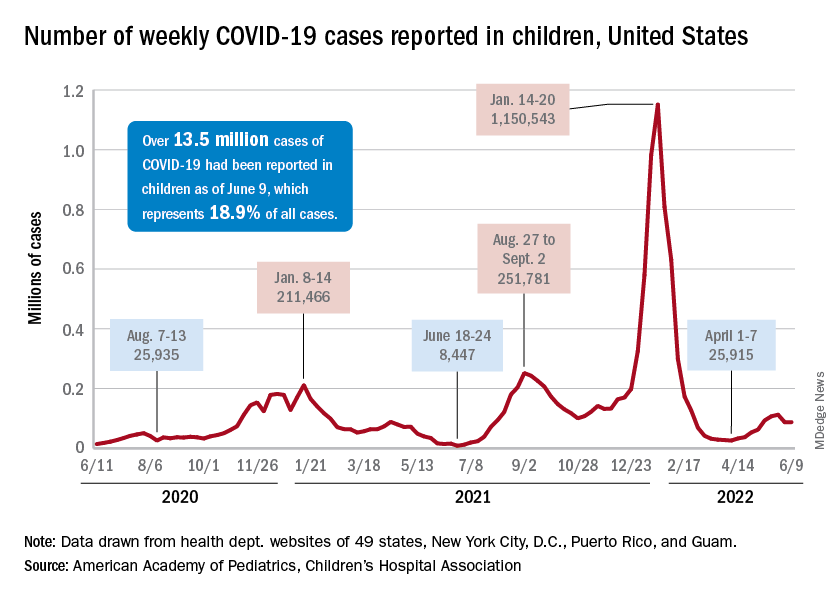
That hint of a continued decline accompanies the latest trend for new cases for all age groups: They have leveled out over the last month, with the moving 7-day daily average hovering around 100,000-110,000 since mid-May, data from the Centers for Disease Control and Prevention show.
The Food and Drug Administration, meanwhile, is in the news this week as two of its advisory panels take the next steps toward pediatric approvals of vaccines from Pfizer/BioNTtech and Moderna. The panels could advance the approvals of the Pfizer vaccine for children under the age of 5 years and the Moderna vaccine for children aged 6 months to 17 years.
Matthew Harris, MD, medical director of the COVID-19 vaccination program for Northwell Health in New Hyde Park, N.Y., emphasized the importance of vaccinations, as well as the continued challenge of convincing parents to get the shots for eligible children. “We still have a long way to go for primary vaccines and boosters for children 5 years and above,” he said in an interview.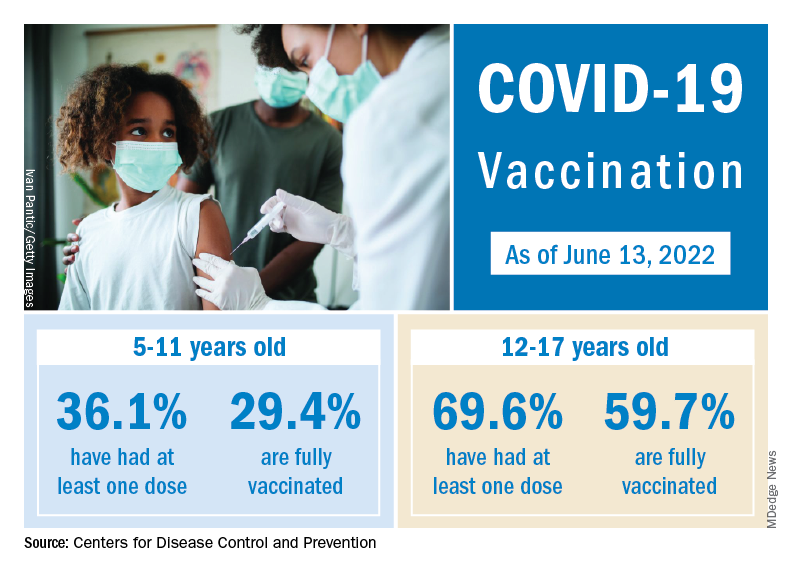
The vaccination effort against COVID-19 has stalled somewhat as interest has waned since the Omicron surge. Weekly initial vaccinations for children aged 5-11 years, which topped 100,000 as recently as mid-March, have been about 43,000 a week for the last 3 weeks, while 12- to 17-year-olds had around 27,000 or 28,000 initial vaccinations per week over that span, the AAP said in a separate report.
The latest data available from the CDC show that overall vaccine coverage levels for the younger group are only about half those of the 12- to 17-year-olds, both in terms of initial doses and completions. The 5- to 11-year-olds are not eligible for boosters yet, but 26.5% of the older children had received one as of June 13, according to the CDC’s COVID Data Tracker.
Breast cancer deaths take a big dip because of new medicines
CHICAGO – Progress in breast cancer treatment over the past 2 decades has reduced expected mortality from both early-stage and metastatic disease, according to a new model that looked at 10-year distant recurrence-free survival and survival time after metastatic diagnosis, among other factors.
“There has been an accelerating influx of new treatments for breast cancer starting around 1990. We wished to ask whether and to what extent decades of metastatic treatment advances may have affected population level breast cancer mortality,” said Jennifer Lee Caswell-Jin, MD, during a presentation of the study at the annual meeting of the American Society of Clinical Oncology.
“Our models find that metastatic treatments improved population-level survival in all breast cancer subtypes since 2000 with substantial variability by subtype," said Dr. Caswell-Jin, who is a medical oncologist with Stanford (Calif.) Medicine specializing in breast cancer.
The study is based on an analysis of four models from the Cancer Intervention and Surveillance Modeling Network (CISNET). The models simulated breast cancer mortality between 2000 and 2019 factoring in the use of mammography, efficacy and dissemination of estrogen receptor (ER) and HER2-specific treatments of early-stage (stages I-III) and metastatic (stage IV or distant recurrence) disease, but also non–cancer-related mortality. The models compared overall and ER/HER2-specific breast cancer mortality rates during this period with estimated rates with no screening or treatment, and then attributed mortality reductions to screening, early-stage, or metastatic treatment.
The results were compared with three clinical trials that tested therapies in different subtypes of metastatic disease. Dr. Caswell-Jin and colleagues adjusted the analysis to reflect expected differences between clinical trial populations and the broader population by sampling simulated patients who resembled the trial population.
The investigators found that, at 71%, the biggest drop in mortality rates were for women with ER+/HER2+ breast cancer, followed by 61% for women with ER-/HER2+ breast cancer and 59% for women with ER+/HER2– breast cancer. Triple-negative breast cancer – one of the most challenging breast cancers to treat – only saw a drop of 40% during this period. About 19% of the overall reduction in breast cancer mortality were caused by treatments after metastasis.
The median survival after a diagnosis of ER+/HER2– metastatic recurrence increased from 2 years in 2000 to 3.5 years in 2019. In triple-negative breast cancer, the increase was more modest, from 1.2 years in 2000 to 1.8 years in 2019. After a diagnosis of metastatic recurrence of ER+/HER2+ breast cancer, median survival increased from 2.3 years in 2000 to 4.8 years in 2019, and for ER–/HER2+ breast cancer, from 2.2 years in 2000 to 3.9 years in 2019.
“How much metastatic treatments contributed to the overall mortality reduction varied over time depending on what therapies were entering the metastatic setting at that time and what therapies were transitioning from the metastatic to early-stage setting,” Dr. Caswell-Jin said.
The study did not include sacituzumab govitecan for metastatic triple-negative breast cancer, or trastuzumab deruxtecan and tucatinib for HER2-positive disease, which were approved after 2020. “The numbers that we cite will be better today for triple-negative breast cancer because of those two drugs. And will be even better for HER2-positive breast cancer because of those two drugs,” she said.
During the Q&A portion of the presentation, Daniel Hayes, MD, the Stuart B. Padnos Professor of Breast Cancer Research at the University of Michigan Rogel Cancer Center, Ann Arbor, asked about the potential of CISNET as an in-practice diagnostic tool.
“We’ve traditionally told patients who have metastatic disease that they will not be cured. I told two patients that on Tuesday. Can CISNET modeling let us begin to see if there is indeed now, with the improved therapies we have, a group of patients who do appear to be cured, or is that not possible?” he asked.
Perhaps, Dr. Caswell-Jin said, in a very small population of older patients with HER2-positive breast cancer that did in fact occur, but to a very small degree.
AT ASCO 2022