User login
Curbside vs Formal Consultation
A curbside consultation is an informal process whereby a consultant is asked to provide information or advice about a patient's care without doing a formal assessment of the patient.14 Curbside consultations are common in the practice of medicine2, 3, 5 and are frequently requested by physicians caring for hospitalized patients. Several surveys have documented the quantity of curbside consultations requested of various subspecialties, the types of questions asked, the time it takes to respond, and physicians' perceptions about the quality of the information exchanged.111 While curbside consultations have a number of advantages, physicians' perceptions are that the information conveyed may be inaccurate or incomplete and that the advice offered may be erroneous.13, 5, 10, 12, 13
Cartmill and White14 performed a random audit of 10% of the telephone referrals they received for neurosurgical consultation over a 1‐year period and noted discrepancies between the Glascow Coma Scores reported during the telephone referrals and those noted in the medical records, but the frequency of these discrepancies was not reported. To our knowledge, no studies have compared the quality of the information provided in curbside consultations with that obtained in formal consultations that included direct face‐to‐face patient evaluations and primary data collection, and whether the advice provided in curbside and formal consultations on the same patient differed.
We performed a prospective cohort study to compare the information received by hospitalists during curbside consultations on hospitalized patients, with that obtained from formal consultations done the same day on the same patients, by different hospitalists who were unaware of any details regarding the curbside consultation. We also compared the advice provided by the 2 hospitalists following their curbside and formal consultations. Our hypotheses were that the information received during curbside consultations was frequently inaccurate or incomplete, that the recommendations made after the formal consultation would frequently differ from those made in the curbside consultation, and that these differences would have important implications on patient care.
METHODS
This was a quality improvement study conducted at Denver Health, a 500‐bed university‐affiliated urban safety net hospital from January 10, 2011 to January 9, 2012. The study design was a prospective cohort that included all curbside consultations on hospitalized patients received between 7 AM and 3 PM, on intermittently selected weekdays, by the Internal Medicine Consultation Service that was staffed by 18 hospitalists. Data were collected intermittently based upon hospitalist availability and was done to limit potential alterations in the consulting practices of the providers requesting consultations.
Consultations were defined as being curbside when the consulting provider asked for advice, suggestions, or opinions about a patient's care but did not ask the hospitalist to see the patient.15, 15 Consultations pertaining to administrative issues (eg, whether a patient should be admitted to an intensive care bed as opposed to an acute care floor bed) or on patients who were already being followed by a hospitalist were excluded.
The hospitalist receiving the curbside consultation was allowed to ask questions as they normally would, but could not verify the accuracy of the information received (eg, could not review any portion of the patient's medical record, such as notes or lab data). A standardized data collection sheet was used to record the service and level of training of the requesting provider, the medical issue(s) of concern, all clinical data offered by the provider, the number of questions asked by the hospitalist of the provider, and whether, on the basis of the information provided, the hospitalist felt that the question(s) being asked was (were) of sufficient complexity that a formal consultation should occur. The hospitalist then offered advice based upon the information given during the curbside consultation.
After completing the curbside consultation, the hospitalist requested verbal permission from the requesting provider to perform a formal consultation. If the request was approved, the hospitalist performing the curbside consultation contacted a different hospitalist who performed the formal consultation within the next few hours. The only information given to the second hospitalist was the patient's identifiers and the clinical question(s) being asked. The formal consultation included a complete face‐to‐face history and physical examination, a review of the patient's medical record, documentation of the provider's findings, and recommendations for care.
Upon completion of the formal consultation, the hospitalists who performed the curbside and the formal consultations met to review the advice each gave to the requesting provider and the information on which this advice was based. The 2 hospitalists jointly determined the following: (a) whether the information received during the curbside consultation was correct and complete, (b) whether the advice provided in the formal consultation differed from that provided in the curbside consultation, (c) whether the advice provided in the formal consultation dealt with issues other than one(s) leading to the curbside consultation, (d) whether differences in the recommendations given in the curbside versus the formal consultation changed patient management in a meaningful way, and (e) whether the curbside consultation alone was felt to be sufficient.
Information obtained by the hospitalist performing the formal consultation that was different from, or not included in, the information recorded during the curbside consultation was considered to be incorrect or incomplete, respectively. A change in management was defined as an alteration in the direction or type of care that the patient would have received as a result of the advice being given. A pulmonary and critical care physician, with >35 years of experience in inpatient medicine, reviewed the information provided in the curbside and formal consultations, and independently assessed whether the curbside consultation alone would have been sufficient and whether the formal consultation changed management.
Curbside consultations were neither solicited nor discouraged during the course of the study. The provider requesting the curbside consultation was not informed or debriefed about the study in an attempt to avoid affecting future consultation practices from that provider or service.
Associations were sought between the frequency of inaccurate or incomplete data and the requesting service and provider, the consultative category and medical issue, the number of questions asked by the hospitalist during the curbside consultation, and whether the hospitalist doing the curbside consultation thought that formal consultation was needed. A chi‐square test was used to analyze all associations. A P value of <0.05 was considered significant. All analyses were performed using SAS Enterprise Guide 4.3 (SAS Institute, Inc, Cary, NC) software. The study was approved by the Colorado Multiple Institutional Review Board.
RESULTS
Fifty curbside consultations were requested on a total of 215 study days. The requesting service declined formal consultation in 3 instances, leaving 47 curbside consultations that had a formal consultation. Curbside consultations came from a variety of services and providers, and addressed a variety of issues and concerns (Table 1).
| Curbside Consultations, N (%) | |
|---|---|
| 47 (100) | |
| |
| Requesting service | |
| Psychiatry | 21 (45) |
| Emergency Department | 9 (19) |
| Obstetrics/Gynecology | 5 (11) |
| Neurology | 4 (8) |
| Other (Orthopedics, Anesthesia, General Surgery, Neurosurgery, and Interventional Radiology) | 8 (17) |
| Requesting provider | |
| Resident | 25 (53) |
| Intern | 8 (17) |
| Attending | 9 (19) |
| Other | 5 (11) |
| Consultative issue* | |
| Diagnosis | 10 (21) |
| Treatment | 29 (62) |
| Evaluation | 20 (43) |
| Discharge | 13 (28) |
| Lab interpretation | 4 (9) |
| Medical concern* | |
| Cardiac | 27 (57) |
| Endocrine | 17 (36) |
| Infectious disease | 9 (19) |
| Pulmonary | 8 (17) |
| Gastroenterology | 6 (13) |
| Fluid and electrolyte | 6 (13) |
| Others | 23 (49) |
The hospitalists asked 0 to 2 questions during 8/47 (17%) of the curbside consultations, 3 to 5 questions during 26/47 (55%) consultations, and more than 5 questions during 13/47 (28%). Based on the information received during the curbside consultations, the hospitalists thought that the curbside consultations were insufficient for 18/47 (38%) of patients. In all instances, the opinions of the 2 hospitalists concurred with respect to this conclusion, and the independent reviewer agreed with this assessment in 17 of these 18 (94%).
The advice rendered in the formal consultations differed from that provided in 26/47 (55%) of the curbside consultations, and the formal consultation was thought to have changed management for 28/47 (60%) of patients (Table 2). The independent reviewer thought that the advice provided in the formal consultations changed management in 29/47 (62%) of the cases, and in 24/28 cases (86%) where the hospitalist felt that the formal consult changed management.
| Curbside Consultations, N (%) | |||
|---|---|---|---|
| Total | Accurate and Complete | Inaccurate or Incomplete | |
| 47 (100) | 23 (49) | 24 (51) | |
| |||
| Advice in formal consultation differed from advice in curbside consultation | 26 (55) | 7 (30) | 19 (79)* |
| Formal consultation changed management | 28 (60) | 6 (26) | 22 (92) |
| Minor change | 18 (64) | 6 (100) | 12 (55) |
| Major change | 10 (36) | 0 (0) | 10 (45) |
| Curbside consultation insufficient | 18 (38) | 2 (9) | 16 (67) |
Information was felt to be inaccurate or incomplete in 24/47 (51%) of the curbside consultations (13/47 inaccurate, 16/47 incomplete, 5/47 both inaccurate and incomplete), and when inaccurate or incomplete information was obtained, the advice given in the formal consultations more commonly differed from that provided in the curbside consultation (19/24, 79% vs 7/23, 30%; P < 0.001), and was more commonly felt to change management (22/24, 92% vs 6/23, 26%; P < 0.0001) (Table 2). No association was found between whether the curbside consultation contained complete or accurate information and the consulting service from which the curbside originated, the consulting provider, the consultative aspect(s) or medical issue(s) addressed, the number of questions asked by the hospitalist during the curbside consultation, nor whether the hospitalists felt that a formal consultation was needed.
DISCUSSION
The important findings of this study are that (a) the recommendations made by hospitalists in curbside versus formal consultations on the same patient frequently differ, (b) these differences frequently result in changes in clinical management, (c) the information presented in curbside consultations by providers is frequently inaccurate or incomplete, regardless of the providers specialty or seniority, (d) when inaccurate or incomplete information is received, the recommendations made in curbside and formal consultations differ more frequently, and (e) we found no way to predict whether the information provided in a curbside consultation was likely to be inaccurate or incomplete.
Our hospitalists thought that 38% of the curbside consultations they received should have had formal consultations. Manian and McKinsey7 reported that as many as 53% of questions asked of infectious disease consultants were thought to be too complex to be addressed in an informal consultation. Others, however, report that only 11%33% of curbside consultations were thought to require formal consultation.1, 9, 10, 16 Our hospitalists asked 3 or more questions of the consulting providers in more than 80% of the curbside consultations, suggesting that the curbside consultations we received might have had a higher complexity than those seen by others.
Our finding that information provided in curbside consultation was frequently inaccurate or incomplete is consistent with a number of previous studies reporting physicians' perceptions of the accuracy of curbside consultations.2, 3 Hospital medicine is not likely to be the only discipline affected by inaccurate curbside consultation practices, as surveys of specialists in infectious disease, gynecology, and neurosurgery report that practitioners in these disciplines have similar concerns.1, 10, 14 In a survey returned by 34 physicians, Myers1 found that 50% thought the information exchanged during curbside consultations was inaccurate, leading him to conclude that inaccuracies presented during curbside consultations required further study.
We found no way of predicting whether curbside consultations were likely to include inaccurate or incomplete information. This observation is consistent with the results of Bergus et al16 who found that the frequency of curbside consultations being converted to formal consultations was independent of the training status of the consulting physician, and with the data of Myers1 who found no way of predicting the likelihood that a curbside consultation should be converted to a formal consultation.
We found that formal consultations resulted in management changes more often than differences in recommendations (ie, 60% vs 55%, respectively). This small difference occurred because, on occasion, the formal consultations found issues to address other than the one(s) for which the curbside consultation was requested. In the majority of these instances, the management changes were minor and the curbside consultation was still felt to be sufficient.
In some instances, the advice given after the curbside and the formal consultations differed to only a minor extent (eg, varying recommendations for oral diabetes management). In other instances, however, the advice differed substantially (eg, change in antibiotic management in a septic patient with a multidrug resistant organism, when the original curbside question was for when to order a follow‐up chest roentgenogram for hypoxia; see Supporting Information, Appendix, in the online version of this article). In 26 patients (55%), formal consultation resulted in different medications being started or stopped, additional tests being performed, or different decisions being made about admission versus discharge.
Our study has a number of strengths. First, while a number of reports document that physicians' perceptions are that curbside consultations frequently contain errors,2, 3, 5, 12 to our knowledge this is the first study that prospectively compared the information collected and advice given in curbside versus formal consultation. Second, while this study was conducted as a quality improvement project, thereby requiring us to conclude that the results are not generalizable, the data presented were collected by 18 different hospitalists, reducing the potential of bias from an individual provider's knowledge base or practice. Third, there was excellent agreement between the independent reviewer and the 2 hospitalists who performed the curbside and formal consultations regarding whether a curbside consultation would have been sufficient, and whether the formal consultation changed patient management. Fourth, the study was conducted over a 1‐year period, which should have reduced potential bias arising from the increasing experience of residents requesting consultations as their training progressed.
Our study has several limitations. First, the number of curbside consultations we received during the study period (50 over 215 days) was lower than anticipated, and lower than the rates of consultation reported by others.1, 7, 9 This likely relates to the fact that, prior to beginning the study, Denver Health hospitalists already provided mandatory consultations for several surgical services (thereby reducing the number of curbside consultations received from these services), because curbside consultations received during evenings, nights, and weekends were not included in the study for reasons of convenience, and because we excluded all administrative curbside consultations. Our hospitalist service also provides consultative services 24 hours a day, thereby reducing the number of consultations received during daytime hours. Second, the frequency with which curbside consultations included inaccurate or incomplete information might be higher than what occurs in other hospitals, as Denver Health is an urban, university‐affiliated public hospital and the patients encountered may be more complex and trainees may be less adept at recognizing the information that would facilitate accurate curbside consultations (although we found no difference in the frequency with which inaccurate or incomplete information was provided as a function of the seniority of the requesting physician). Third, the disparity between curbside and formal consultations that we observed could have been biased by the Hawthorne effect. We attempted to address this by not providing the hospitalists who did the formal consultation with any information collected by the hospitalist involved with the curbside consultation, and by comparing the conclusions reached by the hospitalists performing the curbside and formal consultations with those of a third party reviewer. Fourth, while we found no association between the frequency of curbside consultations in which information was inaccurate or incomplete and the consulting service, there could be a selection bias of the consulting service requesting the curbside consultations as a result of the mandatory consultations already provided by our hospitalists. Finally, our study was not designed or adequately powered to determine why curbside consultations frequently have inaccurate or incomplete information.
In summary, we found that the information provided to hospitalists during a curbside consultation was often inaccurate and incomplete, and that these problems with information exchange adversely affected the accuracy of the resulting recommendations. While there are a number of advantages to curbside consultations,1, 3, 7, 10, 12, 13 our findings indicate that the risk associated with this practice is substantial.
Acknowledgements
Disclosure: Nothing to report.
- .Curbside consultation in infectious diseases: a prospective study.J Infect Dis.1984;150:797–802.
- ,,.Physicians' experiences and beliefs regarding informal consultation.JAMA.1998;280:900–904.
- ,,.Curbside consultation practices and attitudes among primary care physicians and medical subspecialists.JAMA.1998;280:905–909.
- ,,,,,.The complexity, relative value, and financial worth of curbside consultations in an academic infectious diseases unit.Clin Infect Dis.2010;51:651–655.
- ,.Curbside consultations. A closer look at a common practice.JAMA.1996;275:145–147.
- ,,,.Informal advice‐ and information‐seeking between physicians.J Med Educ.1981;56;174–180.
- ,.A prospective study of 2,092 “curbside” questions asked of two infectious disease consultants in private practice in the midwest.Clin Infect Dis.1996;22:303–307.
- ,,,,.Curbside consultation in endocrine practice: a prospective observational study.Endocrinologist.1996;6:328–331.
- ,,.Informal consultations provided to general internists by the gastroenterology department of an HMO.J Gen Intern Med.1998;13:435–438.
- .“Curbside” consultations in gynecologic oncology: a closer look at a common practice.Gynecol Oncol.1999;74:456–459.
- ,,, et al.Informal consultations in infectious diseases and clinical microbiology practice.Clin Microbiol Infect.2003;9:724–726.
- .Curbside consultations and the viaduct effect.JAMA.1998;280:929–930.
- .What do we really need to know about consultation and referral?J Gen Intern Med.1998;13:497–498.
- ,.Telephone advice for neurosurgical referrals. Who assumes duty of care?Br J Neurosurg.2001;15:453–455.
- ,.Malpractice liability for informal consultations.Fam Med.2003;35:476–481.
- ,,,.Does the structure of clinical questions affect the outcome of curbside consultations with specialty colleagues?Arch Fam Med.2000;9:541–547.
A curbside consultation is an informal process whereby a consultant is asked to provide information or advice about a patient's care without doing a formal assessment of the patient.14 Curbside consultations are common in the practice of medicine2, 3, 5 and are frequently requested by physicians caring for hospitalized patients. Several surveys have documented the quantity of curbside consultations requested of various subspecialties, the types of questions asked, the time it takes to respond, and physicians' perceptions about the quality of the information exchanged.111 While curbside consultations have a number of advantages, physicians' perceptions are that the information conveyed may be inaccurate or incomplete and that the advice offered may be erroneous.13, 5, 10, 12, 13
Cartmill and White14 performed a random audit of 10% of the telephone referrals they received for neurosurgical consultation over a 1‐year period and noted discrepancies between the Glascow Coma Scores reported during the telephone referrals and those noted in the medical records, but the frequency of these discrepancies was not reported. To our knowledge, no studies have compared the quality of the information provided in curbside consultations with that obtained in formal consultations that included direct face‐to‐face patient evaluations and primary data collection, and whether the advice provided in curbside and formal consultations on the same patient differed.
We performed a prospective cohort study to compare the information received by hospitalists during curbside consultations on hospitalized patients, with that obtained from formal consultations done the same day on the same patients, by different hospitalists who were unaware of any details regarding the curbside consultation. We also compared the advice provided by the 2 hospitalists following their curbside and formal consultations. Our hypotheses were that the information received during curbside consultations was frequently inaccurate or incomplete, that the recommendations made after the formal consultation would frequently differ from those made in the curbside consultation, and that these differences would have important implications on patient care.
METHODS
This was a quality improvement study conducted at Denver Health, a 500‐bed university‐affiliated urban safety net hospital from January 10, 2011 to January 9, 2012. The study design was a prospective cohort that included all curbside consultations on hospitalized patients received between 7 AM and 3 PM, on intermittently selected weekdays, by the Internal Medicine Consultation Service that was staffed by 18 hospitalists. Data were collected intermittently based upon hospitalist availability and was done to limit potential alterations in the consulting practices of the providers requesting consultations.
Consultations were defined as being curbside when the consulting provider asked for advice, suggestions, or opinions about a patient's care but did not ask the hospitalist to see the patient.15, 15 Consultations pertaining to administrative issues (eg, whether a patient should be admitted to an intensive care bed as opposed to an acute care floor bed) or on patients who were already being followed by a hospitalist were excluded.
The hospitalist receiving the curbside consultation was allowed to ask questions as they normally would, but could not verify the accuracy of the information received (eg, could not review any portion of the patient's medical record, such as notes or lab data). A standardized data collection sheet was used to record the service and level of training of the requesting provider, the medical issue(s) of concern, all clinical data offered by the provider, the number of questions asked by the hospitalist of the provider, and whether, on the basis of the information provided, the hospitalist felt that the question(s) being asked was (were) of sufficient complexity that a formal consultation should occur. The hospitalist then offered advice based upon the information given during the curbside consultation.
After completing the curbside consultation, the hospitalist requested verbal permission from the requesting provider to perform a formal consultation. If the request was approved, the hospitalist performing the curbside consultation contacted a different hospitalist who performed the formal consultation within the next few hours. The only information given to the second hospitalist was the patient's identifiers and the clinical question(s) being asked. The formal consultation included a complete face‐to‐face history and physical examination, a review of the patient's medical record, documentation of the provider's findings, and recommendations for care.
Upon completion of the formal consultation, the hospitalists who performed the curbside and the formal consultations met to review the advice each gave to the requesting provider and the information on which this advice was based. The 2 hospitalists jointly determined the following: (a) whether the information received during the curbside consultation was correct and complete, (b) whether the advice provided in the formal consultation differed from that provided in the curbside consultation, (c) whether the advice provided in the formal consultation dealt with issues other than one(s) leading to the curbside consultation, (d) whether differences in the recommendations given in the curbside versus the formal consultation changed patient management in a meaningful way, and (e) whether the curbside consultation alone was felt to be sufficient.
Information obtained by the hospitalist performing the formal consultation that was different from, or not included in, the information recorded during the curbside consultation was considered to be incorrect or incomplete, respectively. A change in management was defined as an alteration in the direction or type of care that the patient would have received as a result of the advice being given. A pulmonary and critical care physician, with >35 years of experience in inpatient medicine, reviewed the information provided in the curbside and formal consultations, and independently assessed whether the curbside consultation alone would have been sufficient and whether the formal consultation changed management.
Curbside consultations were neither solicited nor discouraged during the course of the study. The provider requesting the curbside consultation was not informed or debriefed about the study in an attempt to avoid affecting future consultation practices from that provider or service.
Associations were sought between the frequency of inaccurate or incomplete data and the requesting service and provider, the consultative category and medical issue, the number of questions asked by the hospitalist during the curbside consultation, and whether the hospitalist doing the curbside consultation thought that formal consultation was needed. A chi‐square test was used to analyze all associations. A P value of <0.05 was considered significant. All analyses were performed using SAS Enterprise Guide 4.3 (SAS Institute, Inc, Cary, NC) software. The study was approved by the Colorado Multiple Institutional Review Board.
RESULTS
Fifty curbside consultations were requested on a total of 215 study days. The requesting service declined formal consultation in 3 instances, leaving 47 curbside consultations that had a formal consultation. Curbside consultations came from a variety of services and providers, and addressed a variety of issues and concerns (Table 1).
| Curbside Consultations, N (%) | |
|---|---|
| 47 (100) | |
| |
| Requesting service | |
| Psychiatry | 21 (45) |
| Emergency Department | 9 (19) |
| Obstetrics/Gynecology | 5 (11) |
| Neurology | 4 (8) |
| Other (Orthopedics, Anesthesia, General Surgery, Neurosurgery, and Interventional Radiology) | 8 (17) |
| Requesting provider | |
| Resident | 25 (53) |
| Intern | 8 (17) |
| Attending | 9 (19) |
| Other | 5 (11) |
| Consultative issue* | |
| Diagnosis | 10 (21) |
| Treatment | 29 (62) |
| Evaluation | 20 (43) |
| Discharge | 13 (28) |
| Lab interpretation | 4 (9) |
| Medical concern* | |
| Cardiac | 27 (57) |
| Endocrine | 17 (36) |
| Infectious disease | 9 (19) |
| Pulmonary | 8 (17) |
| Gastroenterology | 6 (13) |
| Fluid and electrolyte | 6 (13) |
| Others | 23 (49) |
The hospitalists asked 0 to 2 questions during 8/47 (17%) of the curbside consultations, 3 to 5 questions during 26/47 (55%) consultations, and more than 5 questions during 13/47 (28%). Based on the information received during the curbside consultations, the hospitalists thought that the curbside consultations were insufficient for 18/47 (38%) of patients. In all instances, the opinions of the 2 hospitalists concurred with respect to this conclusion, and the independent reviewer agreed with this assessment in 17 of these 18 (94%).
The advice rendered in the formal consultations differed from that provided in 26/47 (55%) of the curbside consultations, and the formal consultation was thought to have changed management for 28/47 (60%) of patients (Table 2). The independent reviewer thought that the advice provided in the formal consultations changed management in 29/47 (62%) of the cases, and in 24/28 cases (86%) where the hospitalist felt that the formal consult changed management.
| Curbside Consultations, N (%) | |||
|---|---|---|---|
| Total | Accurate and Complete | Inaccurate or Incomplete | |
| 47 (100) | 23 (49) | 24 (51) | |
| |||
| Advice in formal consultation differed from advice in curbside consultation | 26 (55) | 7 (30) | 19 (79)* |
| Formal consultation changed management | 28 (60) | 6 (26) | 22 (92) |
| Minor change | 18 (64) | 6 (100) | 12 (55) |
| Major change | 10 (36) | 0 (0) | 10 (45) |
| Curbside consultation insufficient | 18 (38) | 2 (9) | 16 (67) |
Information was felt to be inaccurate or incomplete in 24/47 (51%) of the curbside consultations (13/47 inaccurate, 16/47 incomplete, 5/47 both inaccurate and incomplete), and when inaccurate or incomplete information was obtained, the advice given in the formal consultations more commonly differed from that provided in the curbside consultation (19/24, 79% vs 7/23, 30%; P < 0.001), and was more commonly felt to change management (22/24, 92% vs 6/23, 26%; P < 0.0001) (Table 2). No association was found between whether the curbside consultation contained complete or accurate information and the consulting service from which the curbside originated, the consulting provider, the consultative aspect(s) or medical issue(s) addressed, the number of questions asked by the hospitalist during the curbside consultation, nor whether the hospitalists felt that a formal consultation was needed.
DISCUSSION
The important findings of this study are that (a) the recommendations made by hospitalists in curbside versus formal consultations on the same patient frequently differ, (b) these differences frequently result in changes in clinical management, (c) the information presented in curbside consultations by providers is frequently inaccurate or incomplete, regardless of the providers specialty or seniority, (d) when inaccurate or incomplete information is received, the recommendations made in curbside and formal consultations differ more frequently, and (e) we found no way to predict whether the information provided in a curbside consultation was likely to be inaccurate or incomplete.
Our hospitalists thought that 38% of the curbside consultations they received should have had formal consultations. Manian and McKinsey7 reported that as many as 53% of questions asked of infectious disease consultants were thought to be too complex to be addressed in an informal consultation. Others, however, report that only 11%33% of curbside consultations were thought to require formal consultation.1, 9, 10, 16 Our hospitalists asked 3 or more questions of the consulting providers in more than 80% of the curbside consultations, suggesting that the curbside consultations we received might have had a higher complexity than those seen by others.
Our finding that information provided in curbside consultation was frequently inaccurate or incomplete is consistent with a number of previous studies reporting physicians' perceptions of the accuracy of curbside consultations.2, 3 Hospital medicine is not likely to be the only discipline affected by inaccurate curbside consultation practices, as surveys of specialists in infectious disease, gynecology, and neurosurgery report that practitioners in these disciplines have similar concerns.1, 10, 14 In a survey returned by 34 physicians, Myers1 found that 50% thought the information exchanged during curbside consultations was inaccurate, leading him to conclude that inaccuracies presented during curbside consultations required further study.
We found no way of predicting whether curbside consultations were likely to include inaccurate or incomplete information. This observation is consistent with the results of Bergus et al16 who found that the frequency of curbside consultations being converted to formal consultations was independent of the training status of the consulting physician, and with the data of Myers1 who found no way of predicting the likelihood that a curbside consultation should be converted to a formal consultation.
We found that formal consultations resulted in management changes more often than differences in recommendations (ie, 60% vs 55%, respectively). This small difference occurred because, on occasion, the formal consultations found issues to address other than the one(s) for which the curbside consultation was requested. In the majority of these instances, the management changes were minor and the curbside consultation was still felt to be sufficient.
In some instances, the advice given after the curbside and the formal consultations differed to only a minor extent (eg, varying recommendations for oral diabetes management). In other instances, however, the advice differed substantially (eg, change in antibiotic management in a septic patient with a multidrug resistant organism, when the original curbside question was for when to order a follow‐up chest roentgenogram for hypoxia; see Supporting Information, Appendix, in the online version of this article). In 26 patients (55%), formal consultation resulted in different medications being started or stopped, additional tests being performed, or different decisions being made about admission versus discharge.
Our study has a number of strengths. First, while a number of reports document that physicians' perceptions are that curbside consultations frequently contain errors,2, 3, 5, 12 to our knowledge this is the first study that prospectively compared the information collected and advice given in curbside versus formal consultation. Second, while this study was conducted as a quality improvement project, thereby requiring us to conclude that the results are not generalizable, the data presented were collected by 18 different hospitalists, reducing the potential of bias from an individual provider's knowledge base or practice. Third, there was excellent agreement between the independent reviewer and the 2 hospitalists who performed the curbside and formal consultations regarding whether a curbside consultation would have been sufficient, and whether the formal consultation changed patient management. Fourth, the study was conducted over a 1‐year period, which should have reduced potential bias arising from the increasing experience of residents requesting consultations as their training progressed.
Our study has several limitations. First, the number of curbside consultations we received during the study period (50 over 215 days) was lower than anticipated, and lower than the rates of consultation reported by others.1, 7, 9 This likely relates to the fact that, prior to beginning the study, Denver Health hospitalists already provided mandatory consultations for several surgical services (thereby reducing the number of curbside consultations received from these services), because curbside consultations received during evenings, nights, and weekends were not included in the study for reasons of convenience, and because we excluded all administrative curbside consultations. Our hospitalist service also provides consultative services 24 hours a day, thereby reducing the number of consultations received during daytime hours. Second, the frequency with which curbside consultations included inaccurate or incomplete information might be higher than what occurs in other hospitals, as Denver Health is an urban, university‐affiliated public hospital and the patients encountered may be more complex and trainees may be less adept at recognizing the information that would facilitate accurate curbside consultations (although we found no difference in the frequency with which inaccurate or incomplete information was provided as a function of the seniority of the requesting physician). Third, the disparity between curbside and formal consultations that we observed could have been biased by the Hawthorne effect. We attempted to address this by not providing the hospitalists who did the formal consultation with any information collected by the hospitalist involved with the curbside consultation, and by comparing the conclusions reached by the hospitalists performing the curbside and formal consultations with those of a third party reviewer. Fourth, while we found no association between the frequency of curbside consultations in which information was inaccurate or incomplete and the consulting service, there could be a selection bias of the consulting service requesting the curbside consultations as a result of the mandatory consultations already provided by our hospitalists. Finally, our study was not designed or adequately powered to determine why curbside consultations frequently have inaccurate or incomplete information.
In summary, we found that the information provided to hospitalists during a curbside consultation was often inaccurate and incomplete, and that these problems with information exchange adversely affected the accuracy of the resulting recommendations. While there are a number of advantages to curbside consultations,1, 3, 7, 10, 12, 13 our findings indicate that the risk associated with this practice is substantial.
Acknowledgements
Disclosure: Nothing to report.
A curbside consultation is an informal process whereby a consultant is asked to provide information or advice about a patient's care without doing a formal assessment of the patient.14 Curbside consultations are common in the practice of medicine2, 3, 5 and are frequently requested by physicians caring for hospitalized patients. Several surveys have documented the quantity of curbside consultations requested of various subspecialties, the types of questions asked, the time it takes to respond, and physicians' perceptions about the quality of the information exchanged.111 While curbside consultations have a number of advantages, physicians' perceptions are that the information conveyed may be inaccurate or incomplete and that the advice offered may be erroneous.13, 5, 10, 12, 13
Cartmill and White14 performed a random audit of 10% of the telephone referrals they received for neurosurgical consultation over a 1‐year period and noted discrepancies between the Glascow Coma Scores reported during the telephone referrals and those noted in the medical records, but the frequency of these discrepancies was not reported. To our knowledge, no studies have compared the quality of the information provided in curbside consultations with that obtained in formal consultations that included direct face‐to‐face patient evaluations and primary data collection, and whether the advice provided in curbside and formal consultations on the same patient differed.
We performed a prospective cohort study to compare the information received by hospitalists during curbside consultations on hospitalized patients, with that obtained from formal consultations done the same day on the same patients, by different hospitalists who were unaware of any details regarding the curbside consultation. We also compared the advice provided by the 2 hospitalists following their curbside and formal consultations. Our hypotheses were that the information received during curbside consultations was frequently inaccurate or incomplete, that the recommendations made after the formal consultation would frequently differ from those made in the curbside consultation, and that these differences would have important implications on patient care.
METHODS
This was a quality improvement study conducted at Denver Health, a 500‐bed university‐affiliated urban safety net hospital from January 10, 2011 to January 9, 2012. The study design was a prospective cohort that included all curbside consultations on hospitalized patients received between 7 AM and 3 PM, on intermittently selected weekdays, by the Internal Medicine Consultation Service that was staffed by 18 hospitalists. Data were collected intermittently based upon hospitalist availability and was done to limit potential alterations in the consulting practices of the providers requesting consultations.
Consultations were defined as being curbside when the consulting provider asked for advice, suggestions, or opinions about a patient's care but did not ask the hospitalist to see the patient.15, 15 Consultations pertaining to administrative issues (eg, whether a patient should be admitted to an intensive care bed as opposed to an acute care floor bed) or on patients who were already being followed by a hospitalist were excluded.
The hospitalist receiving the curbside consultation was allowed to ask questions as they normally would, but could not verify the accuracy of the information received (eg, could not review any portion of the patient's medical record, such as notes or lab data). A standardized data collection sheet was used to record the service and level of training of the requesting provider, the medical issue(s) of concern, all clinical data offered by the provider, the number of questions asked by the hospitalist of the provider, and whether, on the basis of the information provided, the hospitalist felt that the question(s) being asked was (were) of sufficient complexity that a formal consultation should occur. The hospitalist then offered advice based upon the information given during the curbside consultation.
After completing the curbside consultation, the hospitalist requested verbal permission from the requesting provider to perform a formal consultation. If the request was approved, the hospitalist performing the curbside consultation contacted a different hospitalist who performed the formal consultation within the next few hours. The only information given to the second hospitalist was the patient's identifiers and the clinical question(s) being asked. The formal consultation included a complete face‐to‐face history and physical examination, a review of the patient's medical record, documentation of the provider's findings, and recommendations for care.
Upon completion of the formal consultation, the hospitalists who performed the curbside and the formal consultations met to review the advice each gave to the requesting provider and the information on which this advice was based. The 2 hospitalists jointly determined the following: (a) whether the information received during the curbside consultation was correct and complete, (b) whether the advice provided in the formal consultation differed from that provided in the curbside consultation, (c) whether the advice provided in the formal consultation dealt with issues other than one(s) leading to the curbside consultation, (d) whether differences in the recommendations given in the curbside versus the formal consultation changed patient management in a meaningful way, and (e) whether the curbside consultation alone was felt to be sufficient.
Information obtained by the hospitalist performing the formal consultation that was different from, or not included in, the information recorded during the curbside consultation was considered to be incorrect or incomplete, respectively. A change in management was defined as an alteration in the direction or type of care that the patient would have received as a result of the advice being given. A pulmonary and critical care physician, with >35 years of experience in inpatient medicine, reviewed the information provided in the curbside and formal consultations, and independently assessed whether the curbside consultation alone would have been sufficient and whether the formal consultation changed management.
Curbside consultations were neither solicited nor discouraged during the course of the study. The provider requesting the curbside consultation was not informed or debriefed about the study in an attempt to avoid affecting future consultation practices from that provider or service.
Associations were sought between the frequency of inaccurate or incomplete data and the requesting service and provider, the consultative category and medical issue, the number of questions asked by the hospitalist during the curbside consultation, and whether the hospitalist doing the curbside consultation thought that formal consultation was needed. A chi‐square test was used to analyze all associations. A P value of <0.05 was considered significant. All analyses were performed using SAS Enterprise Guide 4.3 (SAS Institute, Inc, Cary, NC) software. The study was approved by the Colorado Multiple Institutional Review Board.
RESULTS
Fifty curbside consultations were requested on a total of 215 study days. The requesting service declined formal consultation in 3 instances, leaving 47 curbside consultations that had a formal consultation. Curbside consultations came from a variety of services and providers, and addressed a variety of issues and concerns (Table 1).
| Curbside Consultations, N (%) | |
|---|---|
| 47 (100) | |
| |
| Requesting service | |
| Psychiatry | 21 (45) |
| Emergency Department | 9 (19) |
| Obstetrics/Gynecology | 5 (11) |
| Neurology | 4 (8) |
| Other (Orthopedics, Anesthesia, General Surgery, Neurosurgery, and Interventional Radiology) | 8 (17) |
| Requesting provider | |
| Resident | 25 (53) |
| Intern | 8 (17) |
| Attending | 9 (19) |
| Other | 5 (11) |
| Consultative issue* | |
| Diagnosis | 10 (21) |
| Treatment | 29 (62) |
| Evaluation | 20 (43) |
| Discharge | 13 (28) |
| Lab interpretation | 4 (9) |
| Medical concern* | |
| Cardiac | 27 (57) |
| Endocrine | 17 (36) |
| Infectious disease | 9 (19) |
| Pulmonary | 8 (17) |
| Gastroenterology | 6 (13) |
| Fluid and electrolyte | 6 (13) |
| Others | 23 (49) |
The hospitalists asked 0 to 2 questions during 8/47 (17%) of the curbside consultations, 3 to 5 questions during 26/47 (55%) consultations, and more than 5 questions during 13/47 (28%). Based on the information received during the curbside consultations, the hospitalists thought that the curbside consultations were insufficient for 18/47 (38%) of patients. In all instances, the opinions of the 2 hospitalists concurred with respect to this conclusion, and the independent reviewer agreed with this assessment in 17 of these 18 (94%).
The advice rendered in the formal consultations differed from that provided in 26/47 (55%) of the curbside consultations, and the formal consultation was thought to have changed management for 28/47 (60%) of patients (Table 2). The independent reviewer thought that the advice provided in the formal consultations changed management in 29/47 (62%) of the cases, and in 24/28 cases (86%) where the hospitalist felt that the formal consult changed management.
| Curbside Consultations, N (%) | |||
|---|---|---|---|
| Total | Accurate and Complete | Inaccurate or Incomplete | |
| 47 (100) | 23 (49) | 24 (51) | |
| |||
| Advice in formal consultation differed from advice in curbside consultation | 26 (55) | 7 (30) | 19 (79)* |
| Formal consultation changed management | 28 (60) | 6 (26) | 22 (92) |
| Minor change | 18 (64) | 6 (100) | 12 (55) |
| Major change | 10 (36) | 0 (0) | 10 (45) |
| Curbside consultation insufficient | 18 (38) | 2 (9) | 16 (67) |
Information was felt to be inaccurate or incomplete in 24/47 (51%) of the curbside consultations (13/47 inaccurate, 16/47 incomplete, 5/47 both inaccurate and incomplete), and when inaccurate or incomplete information was obtained, the advice given in the formal consultations more commonly differed from that provided in the curbside consultation (19/24, 79% vs 7/23, 30%; P < 0.001), and was more commonly felt to change management (22/24, 92% vs 6/23, 26%; P < 0.0001) (Table 2). No association was found between whether the curbside consultation contained complete or accurate information and the consulting service from which the curbside originated, the consulting provider, the consultative aspect(s) or medical issue(s) addressed, the number of questions asked by the hospitalist during the curbside consultation, nor whether the hospitalists felt that a formal consultation was needed.
DISCUSSION
The important findings of this study are that (a) the recommendations made by hospitalists in curbside versus formal consultations on the same patient frequently differ, (b) these differences frequently result in changes in clinical management, (c) the information presented in curbside consultations by providers is frequently inaccurate or incomplete, regardless of the providers specialty or seniority, (d) when inaccurate or incomplete information is received, the recommendations made in curbside and formal consultations differ more frequently, and (e) we found no way to predict whether the information provided in a curbside consultation was likely to be inaccurate or incomplete.
Our hospitalists thought that 38% of the curbside consultations they received should have had formal consultations. Manian and McKinsey7 reported that as many as 53% of questions asked of infectious disease consultants were thought to be too complex to be addressed in an informal consultation. Others, however, report that only 11%33% of curbside consultations were thought to require formal consultation.1, 9, 10, 16 Our hospitalists asked 3 or more questions of the consulting providers in more than 80% of the curbside consultations, suggesting that the curbside consultations we received might have had a higher complexity than those seen by others.
Our finding that information provided in curbside consultation was frequently inaccurate or incomplete is consistent with a number of previous studies reporting physicians' perceptions of the accuracy of curbside consultations.2, 3 Hospital medicine is not likely to be the only discipline affected by inaccurate curbside consultation practices, as surveys of specialists in infectious disease, gynecology, and neurosurgery report that practitioners in these disciplines have similar concerns.1, 10, 14 In a survey returned by 34 physicians, Myers1 found that 50% thought the information exchanged during curbside consultations was inaccurate, leading him to conclude that inaccuracies presented during curbside consultations required further study.
We found no way of predicting whether curbside consultations were likely to include inaccurate or incomplete information. This observation is consistent with the results of Bergus et al16 who found that the frequency of curbside consultations being converted to formal consultations was independent of the training status of the consulting physician, and with the data of Myers1 who found no way of predicting the likelihood that a curbside consultation should be converted to a formal consultation.
We found that formal consultations resulted in management changes more often than differences in recommendations (ie, 60% vs 55%, respectively). This small difference occurred because, on occasion, the formal consultations found issues to address other than the one(s) for which the curbside consultation was requested. In the majority of these instances, the management changes were minor and the curbside consultation was still felt to be sufficient.
In some instances, the advice given after the curbside and the formal consultations differed to only a minor extent (eg, varying recommendations for oral diabetes management). In other instances, however, the advice differed substantially (eg, change in antibiotic management in a septic patient with a multidrug resistant organism, when the original curbside question was for when to order a follow‐up chest roentgenogram for hypoxia; see Supporting Information, Appendix, in the online version of this article). In 26 patients (55%), formal consultation resulted in different medications being started or stopped, additional tests being performed, or different decisions being made about admission versus discharge.
Our study has a number of strengths. First, while a number of reports document that physicians' perceptions are that curbside consultations frequently contain errors,2, 3, 5, 12 to our knowledge this is the first study that prospectively compared the information collected and advice given in curbside versus formal consultation. Second, while this study was conducted as a quality improvement project, thereby requiring us to conclude that the results are not generalizable, the data presented were collected by 18 different hospitalists, reducing the potential of bias from an individual provider's knowledge base or practice. Third, there was excellent agreement between the independent reviewer and the 2 hospitalists who performed the curbside and formal consultations regarding whether a curbside consultation would have been sufficient, and whether the formal consultation changed patient management. Fourth, the study was conducted over a 1‐year period, which should have reduced potential bias arising from the increasing experience of residents requesting consultations as their training progressed.
Our study has several limitations. First, the number of curbside consultations we received during the study period (50 over 215 days) was lower than anticipated, and lower than the rates of consultation reported by others.1, 7, 9 This likely relates to the fact that, prior to beginning the study, Denver Health hospitalists already provided mandatory consultations for several surgical services (thereby reducing the number of curbside consultations received from these services), because curbside consultations received during evenings, nights, and weekends were not included in the study for reasons of convenience, and because we excluded all administrative curbside consultations. Our hospitalist service also provides consultative services 24 hours a day, thereby reducing the number of consultations received during daytime hours. Second, the frequency with which curbside consultations included inaccurate or incomplete information might be higher than what occurs in other hospitals, as Denver Health is an urban, university‐affiliated public hospital and the patients encountered may be more complex and trainees may be less adept at recognizing the information that would facilitate accurate curbside consultations (although we found no difference in the frequency with which inaccurate or incomplete information was provided as a function of the seniority of the requesting physician). Third, the disparity between curbside and formal consultations that we observed could have been biased by the Hawthorne effect. We attempted to address this by not providing the hospitalists who did the formal consultation with any information collected by the hospitalist involved with the curbside consultation, and by comparing the conclusions reached by the hospitalists performing the curbside and formal consultations with those of a third party reviewer. Fourth, while we found no association between the frequency of curbside consultations in which information was inaccurate or incomplete and the consulting service, there could be a selection bias of the consulting service requesting the curbside consultations as a result of the mandatory consultations already provided by our hospitalists. Finally, our study was not designed or adequately powered to determine why curbside consultations frequently have inaccurate or incomplete information.
In summary, we found that the information provided to hospitalists during a curbside consultation was often inaccurate and incomplete, and that these problems with information exchange adversely affected the accuracy of the resulting recommendations. While there are a number of advantages to curbside consultations,1, 3, 7, 10, 12, 13 our findings indicate that the risk associated with this practice is substantial.
Acknowledgements
Disclosure: Nothing to report.
- .Curbside consultation in infectious diseases: a prospective study.J Infect Dis.1984;150:797–802.
- ,,.Physicians' experiences and beliefs regarding informal consultation.JAMA.1998;280:900–904.
- ,,.Curbside consultation practices and attitudes among primary care physicians and medical subspecialists.JAMA.1998;280:905–909.
- ,,,,,.The complexity, relative value, and financial worth of curbside consultations in an academic infectious diseases unit.Clin Infect Dis.2010;51:651–655.
- ,.Curbside consultations. A closer look at a common practice.JAMA.1996;275:145–147.
- ,,,.Informal advice‐ and information‐seeking between physicians.J Med Educ.1981;56;174–180.
- ,.A prospective study of 2,092 “curbside” questions asked of two infectious disease consultants in private practice in the midwest.Clin Infect Dis.1996;22:303–307.
- ,,,,.Curbside consultation in endocrine practice: a prospective observational study.Endocrinologist.1996;6:328–331.
- ,,.Informal consultations provided to general internists by the gastroenterology department of an HMO.J Gen Intern Med.1998;13:435–438.
- .“Curbside” consultations in gynecologic oncology: a closer look at a common practice.Gynecol Oncol.1999;74:456–459.
- ,,, et al.Informal consultations in infectious diseases and clinical microbiology practice.Clin Microbiol Infect.2003;9:724–726.
- .Curbside consultations and the viaduct effect.JAMA.1998;280:929–930.
- .What do we really need to know about consultation and referral?J Gen Intern Med.1998;13:497–498.
- ,.Telephone advice for neurosurgical referrals. Who assumes duty of care?Br J Neurosurg.2001;15:453–455.
- ,.Malpractice liability for informal consultations.Fam Med.2003;35:476–481.
- ,,,.Does the structure of clinical questions affect the outcome of curbside consultations with specialty colleagues?Arch Fam Med.2000;9:541–547.
- .Curbside consultation in infectious diseases: a prospective study.J Infect Dis.1984;150:797–802.
- ,,.Physicians' experiences and beliefs regarding informal consultation.JAMA.1998;280:900–904.
- ,,.Curbside consultation practices and attitudes among primary care physicians and medical subspecialists.JAMA.1998;280:905–909.
- ,,,,,.The complexity, relative value, and financial worth of curbside consultations in an academic infectious diseases unit.Clin Infect Dis.2010;51:651–655.
- ,.Curbside consultations. A closer look at a common practice.JAMA.1996;275:145–147.
- ,,,.Informal advice‐ and information‐seeking between physicians.J Med Educ.1981;56;174–180.
- ,.A prospective study of 2,092 “curbside” questions asked of two infectious disease consultants in private practice in the midwest.Clin Infect Dis.1996;22:303–307.
- ,,,,.Curbside consultation in endocrine practice: a prospective observational study.Endocrinologist.1996;6:328–331.
- ,,.Informal consultations provided to general internists by the gastroenterology department of an HMO.J Gen Intern Med.1998;13:435–438.
- .“Curbside” consultations in gynecologic oncology: a closer look at a common practice.Gynecol Oncol.1999;74:456–459.
- ,,, et al.Informal consultations in infectious diseases and clinical microbiology practice.Clin Microbiol Infect.2003;9:724–726.
- .Curbside consultations and the viaduct effect.JAMA.1998;280:929–930.
- .What do we really need to know about consultation and referral?J Gen Intern Med.1998;13:497–498.
- ,.Telephone advice for neurosurgical referrals. Who assumes duty of care?Br J Neurosurg.2001;15:453–455.
- ,.Malpractice liability for informal consultations.Fam Med.2003;35:476–481.
- ,,,.Does the structure of clinical questions affect the outcome of curbside consultations with specialty colleagues?Arch Fam Med.2000;9:541–547.
Copyright © 2012 Society of Hospital Medicine
Social Media Options
There have been four revolutions that have fundamentally changed the way we communicate, according to Clay Shirky, a New York University professor and social media theorist: the printing press, the telephone and telegraph, television and radio, and social media.
On rating sites, such as Yelp and DrScore, and social networking sites, such as LinkedIn and Twitter, patients are connecting and sharing information about their health and about you. You have a choice: You can participate in that conversation, or you can let it happen without you.
In a survey of 4,000 physicians, QuantiaMD found that nearly 90% of physicians reported using Facebook for personal use and 67% used it professionally. So what about the other 33%?
Physicians cite many barriers to using social media. The most common include lack of time, failure to see return on investment, concerns about patient safety, and not knowing where to begin.
While there are scores of social media options available to physicians, I recommend starting with the following: having a website or blog and using Facebook, Twitter, LinkedIn, and YouTube or Vimeo. These sites will help you to engage with and educate your patients and prospective patients, market and build your practice, gain professional clout, and protect your online reputation.
• Website/Blog. Having a static practice website that is never updated is passé. Sure, your website should include information about scheduling, hours, and products, but it should also be regularly updated with new information. In this way, your website can also serve as your blog, a place where you can post articles on topics of interest to your current and prospective patients. It’s best to start with a website/blog so you can create relevant content to share on social media sites.
• Facebook. The rock star of social networking sites was launched in 2004 and recently reached over 1 billion active users. Your patients, current and prospective, as well as your competition, are on Facebook. And you should be, too. Facebook allows for you to have both personal and professional pages, to add friends, to categorize friends, and to even "unfriend" friends. You can exchange both public and private messages, and unlike Twitter, you have the ability to monitor what others post on your page; and you can delete inappropriate material when necessary.
• Twitter. This online social networking site allows users to create messages that are up to 140 characters, known as "tweets." As such, it can be challenging for a newbie to know what to say, how to say it cleverly enough to get "retweeted" or shared, and how to get people engaged long-term. Benefits for physicians, however, include engaging in real-time conversation, sharing breaking news, and discovering hot topics.
• LinkedIn. This social networking site is used primarily by professionals and is effective for making business contacts, hiring, and networking.
• Video. You should consider having a YouTube or Vimeo account because a video post is 50 times more likely to get picked up in a Google search than is a written post, and because 3 billion videos are watched on YouTube every day. Video also allows prospective patients to get to know you and increases your visibility as an educator and expert in the field.
You can ignore all of this and hope it goes away, but the younger generation of physicians entering the field today isn’t. Or you could contract out your social media work to a professional company. Or you and your staff could do it. I’ll speak about these options in future columns.
DR. BENABIO is in private practice in San Diego. Visit his consumer health blog or connect with him on Twitter @Dermdoc and on Facebook (DermDoc).
There have been four revolutions that have fundamentally changed the way we communicate, according to Clay Shirky, a New York University professor and social media theorist: the printing press, the telephone and telegraph, television and radio, and social media.
On rating sites, such as Yelp and DrScore, and social networking sites, such as LinkedIn and Twitter, patients are connecting and sharing information about their health and about you. You have a choice: You can participate in that conversation, or you can let it happen without you.
In a survey of 4,000 physicians, QuantiaMD found that nearly 90% of physicians reported using Facebook for personal use and 67% used it professionally. So what about the other 33%?
Physicians cite many barriers to using social media. The most common include lack of time, failure to see return on investment, concerns about patient safety, and not knowing where to begin.
While there are scores of social media options available to physicians, I recommend starting with the following: having a website or blog and using Facebook, Twitter, LinkedIn, and YouTube or Vimeo. These sites will help you to engage with and educate your patients and prospective patients, market and build your practice, gain professional clout, and protect your online reputation.
• Website/Blog. Having a static practice website that is never updated is passé. Sure, your website should include information about scheduling, hours, and products, but it should also be regularly updated with new information. In this way, your website can also serve as your blog, a place where you can post articles on topics of interest to your current and prospective patients. It’s best to start with a website/blog so you can create relevant content to share on social media sites.
• Facebook. The rock star of social networking sites was launched in 2004 and recently reached over 1 billion active users. Your patients, current and prospective, as well as your competition, are on Facebook. And you should be, too. Facebook allows for you to have both personal and professional pages, to add friends, to categorize friends, and to even "unfriend" friends. You can exchange both public and private messages, and unlike Twitter, you have the ability to monitor what others post on your page; and you can delete inappropriate material when necessary.
• Twitter. This online social networking site allows users to create messages that are up to 140 characters, known as "tweets." As such, it can be challenging for a newbie to know what to say, how to say it cleverly enough to get "retweeted" or shared, and how to get people engaged long-term. Benefits for physicians, however, include engaging in real-time conversation, sharing breaking news, and discovering hot topics.
• LinkedIn. This social networking site is used primarily by professionals and is effective for making business contacts, hiring, and networking.
• Video. You should consider having a YouTube or Vimeo account because a video post is 50 times more likely to get picked up in a Google search than is a written post, and because 3 billion videos are watched on YouTube every day. Video also allows prospective patients to get to know you and increases your visibility as an educator and expert in the field.
You can ignore all of this and hope it goes away, but the younger generation of physicians entering the field today isn’t. Or you could contract out your social media work to a professional company. Or you and your staff could do it. I’ll speak about these options in future columns.
DR. BENABIO is in private practice in San Diego. Visit his consumer health blog or connect with him on Twitter @Dermdoc and on Facebook (DermDoc).
There have been four revolutions that have fundamentally changed the way we communicate, according to Clay Shirky, a New York University professor and social media theorist: the printing press, the telephone and telegraph, television and radio, and social media.
On rating sites, such as Yelp and DrScore, and social networking sites, such as LinkedIn and Twitter, patients are connecting and sharing information about their health and about you. You have a choice: You can participate in that conversation, or you can let it happen without you.
In a survey of 4,000 physicians, QuantiaMD found that nearly 90% of physicians reported using Facebook for personal use and 67% used it professionally. So what about the other 33%?
Physicians cite many barriers to using social media. The most common include lack of time, failure to see return on investment, concerns about patient safety, and not knowing where to begin.
While there are scores of social media options available to physicians, I recommend starting with the following: having a website or blog and using Facebook, Twitter, LinkedIn, and YouTube or Vimeo. These sites will help you to engage with and educate your patients and prospective patients, market and build your practice, gain professional clout, and protect your online reputation.
• Website/Blog. Having a static practice website that is never updated is passé. Sure, your website should include information about scheduling, hours, and products, but it should also be regularly updated with new information. In this way, your website can also serve as your blog, a place where you can post articles on topics of interest to your current and prospective patients. It’s best to start with a website/blog so you can create relevant content to share on social media sites.
• Facebook. The rock star of social networking sites was launched in 2004 and recently reached over 1 billion active users. Your patients, current and prospective, as well as your competition, are on Facebook. And you should be, too. Facebook allows for you to have both personal and professional pages, to add friends, to categorize friends, and to even "unfriend" friends. You can exchange both public and private messages, and unlike Twitter, you have the ability to monitor what others post on your page; and you can delete inappropriate material when necessary.
• Twitter. This online social networking site allows users to create messages that are up to 140 characters, known as "tweets." As such, it can be challenging for a newbie to know what to say, how to say it cleverly enough to get "retweeted" or shared, and how to get people engaged long-term. Benefits for physicians, however, include engaging in real-time conversation, sharing breaking news, and discovering hot topics.
• LinkedIn. This social networking site is used primarily by professionals and is effective for making business contacts, hiring, and networking.
• Video. You should consider having a YouTube or Vimeo account because a video post is 50 times more likely to get picked up in a Google search than is a written post, and because 3 billion videos are watched on YouTube every day. Video also allows prospective patients to get to know you and increases your visibility as an educator and expert in the field.
You can ignore all of this and hope it goes away, but the younger generation of physicians entering the field today isn’t. Or you could contract out your social media work to a professional company. Or you and your staff could do it. I’ll speak about these options in future columns.
DR. BENABIO is in private practice in San Diego. Visit his consumer health blog or connect with him on Twitter @Dermdoc and on Facebook (DermDoc).

ONLINE EXCLUSIVE: Listen to Derek C. Angus discuss incorporating hospitalists into a tiered system of ICU care
Click here to listen to Dr. Angus
Click here to listen to Dr. Angus
Click here to listen to Dr. Angus
ONLINE EXCLUSIVE: Listen to Joaquin Cigarroa, MD, of Oregon Health & Science University, discuss the overlap of cardiology and hospital medicine
Click here to listen to Dr. Cigarroa
Click here to listen to Dr. Cigarroa
Click here to listen to Dr. Cigarroa
ONLINE EXCLUSIVE: Daniel Dressler, MD, MSc, SFHM, discusses the differences in opinion over the SHM/SCCM critical care fellowship proposal
Click here to listen to Dr. Dressler
Click here to listen to Dr. Dressler
Click here to listen to Dr. Dressler
Special Skills Hospitalists Need for the Intensive Care Unit
Critical-care experts point to three types of competency that are crucial for any hospitalist working within an ICU environment. First, hospitalists need a solid knowledge base of the pharmacology, physiology, and pathophysiology of critical illnesses and conditions such as renal failure, respiratory failure, cardiac failure, sepsis, and seizures.
Second, providers need to acquire an array of psychomotor and interpersonal skills. Core skills like endotracheal intubation, chest-tube placement, and arterial and central venous catheterization are essential. But so are broader abilities like bringing people together to work as a team, says Timothy Buchman, PhD, MD, director of Emory University’s Center for Critical Care in Atlanta.

“Does that sound familiar? It’s what hospitalists do,” he says. “So the conceptual structure of a high-functioning intensivist team is nearly identical to the conceptual structure of a high-functioning hospitalist team; it’s just located in a smaller area, with a higher acuity patient population.”
Dr. Siegal emphasizes the importance of inpatient procedural skills, which he says are no longer emphasized in internal-medicine training. “The good news is, those skills are definable, are fairly easily taught, and are simply a matter of repetition,” he says.
Finally, hospitalists need to adopt the right attitude about what care is or isn’t possible for critically-ill patients, and how families can be integrated into complex, culturally-sensitive decision-making about difficult topics such as organ donation.
“That’s very different when the patient is unable to speak for him or herself,” Dr. Buchman says. “There’s a list of what I would call attitudinal competencies, which is longer than I think most people understand it to be to be an effective clinician. … Although all of them, to some degree, overlap with experience during residency training, they are often at a complexity level that can only be mastered through additional training.”
Bryn Nelson is a freelance medical writer in Seattle.
Critical-care experts point to three types of competency that are crucial for any hospitalist working within an ICU environment. First, hospitalists need a solid knowledge base of the pharmacology, physiology, and pathophysiology of critical illnesses and conditions such as renal failure, respiratory failure, cardiac failure, sepsis, and seizures.
Second, providers need to acquire an array of psychomotor and interpersonal skills. Core skills like endotracheal intubation, chest-tube placement, and arterial and central venous catheterization are essential. But so are broader abilities like bringing people together to work as a team, says Timothy Buchman, PhD, MD, director of Emory University’s Center for Critical Care in Atlanta.
“Does that sound familiar? It’s what hospitalists do,” he says. “So the conceptual structure of a high-functioning intensivist team is nearly identical to the conceptual structure of a high-functioning hospitalist team; it’s just located in a smaller area, with a higher acuity patient population.”
Dr. Siegal emphasizes the importance of inpatient procedural skills, which he says are no longer emphasized in internal-medicine training. “The good news is, those skills are definable, are fairly easily taught, and are simply a matter of repetition,” he says.
Finally, hospitalists need to adopt the right attitude about what care is or isn’t possible for critically-ill patients, and how families can be integrated into complex, culturally-sensitive decision-making about difficult topics such as organ donation.
“That’s very different when the patient is unable to speak for him or herself,” Dr. Buchman says. “There’s a list of what I would call attitudinal competencies, which is longer than I think most people understand it to be to be an effective clinician. … Although all of them, to some degree, overlap with experience during residency training, they are often at a complexity level that can only be mastered through additional training.”
Bryn Nelson is a freelance medical writer in Seattle.
Critical-care experts point to three types of competency that are crucial for any hospitalist working within an ICU environment. First, hospitalists need a solid knowledge base of the pharmacology, physiology, and pathophysiology of critical illnesses and conditions such as renal failure, respiratory failure, cardiac failure, sepsis, and seizures.
Second, providers need to acquire an array of psychomotor and interpersonal skills. Core skills like endotracheal intubation, chest-tube placement, and arterial and central venous catheterization are essential. But so are broader abilities like bringing people together to work as a team, says Timothy Buchman, PhD, MD, director of Emory University’s Center for Critical Care in Atlanta.
“Does that sound familiar? It’s what hospitalists do,” he says. “So the conceptual structure of a high-functioning intensivist team is nearly identical to the conceptual structure of a high-functioning hospitalist team; it’s just located in a smaller area, with a higher acuity patient population.”
Dr. Siegal emphasizes the importance of inpatient procedural skills, which he says are no longer emphasized in internal-medicine training. “The good news is, those skills are definable, are fairly easily taught, and are simply a matter of repetition,” he says.
Finally, hospitalists need to adopt the right attitude about what care is or isn’t possible for critically-ill patients, and how families can be integrated into complex, culturally-sensitive decision-making about difficult topics such as organ donation.
“That’s very different when the patient is unable to speak for him or herself,” Dr. Buchman says. “There’s a list of what I would call attitudinal competencies, which is longer than I think most people understand it to be to be an effective clinician. … Although all of them, to some degree, overlap with experience during residency training, they are often at a complexity level that can only be mastered through additional training.”
Bryn Nelson is a freelance medical writer in Seattle.
Penalties for Hospitals with Excessive Readmissions Take Effect
The new era of penalizing hospitals for higher-than-predicted 30-day avoidable readmissions rates has begun. Under the federal Hospital Readmissions Reduction Program, some calculate a hospital's excessive readmissions rate for each applicable condition.
Penalties for the current fiscal year—FY 2013, which began Oct. 1, 2012—will be based on discharges that occurred during the three-year period from July 1, 2008, to June 30, 2011, according to the program guidelines. For hospitals that don't improve, the penalty grows to a maximum 2% next year (FY14) and 3% in FY15.
Hospitalists are not penalized directly for readmissions, and many hospitalists are wondering about the extent to which they're responsible for a readmission after the patient leaves the hospital, notes Mark Williams, MD, FACP, MHM, chief of the division of hospital medicine at Northwestern University’s Feinberg School of Medicine in Chicago.
Dr. Williams is the principal investigator of SHM’s Project BOOST (Better Outcomes for Older Adults through Safe Transitions), one of several national quality initiatives that teach hospitals and other healthcare providers how to improve transitions of care through such techniques as patient coaching and community partnerships.
"These new penalties mean that hospitals will start talking to their physicians about readmissions, and looking for methods to incentivize the hospitalists to get involved in preventing them," Dr. Williams says.
The new era of penalizing hospitals for higher-than-predicted 30-day avoidable readmissions rates has begun. Under the federal Hospital Readmissions Reduction Program, some calculate a hospital's excessive readmissions rate for each applicable condition.
Penalties for the current fiscal year—FY 2013, which began Oct. 1, 2012—will be based on discharges that occurred during the three-year period from July 1, 2008, to June 30, 2011, according to the program guidelines. For hospitals that don't improve, the penalty grows to a maximum 2% next year (FY14) and 3% in FY15.
Hospitalists are not penalized directly for readmissions, and many hospitalists are wondering about the extent to which they're responsible for a readmission after the patient leaves the hospital, notes Mark Williams, MD, FACP, MHM, chief of the division of hospital medicine at Northwestern University’s Feinberg School of Medicine in Chicago.
Dr. Williams is the principal investigator of SHM’s Project BOOST (Better Outcomes for Older Adults through Safe Transitions), one of several national quality initiatives that teach hospitals and other healthcare providers how to improve transitions of care through such techniques as patient coaching and community partnerships.
"These new penalties mean that hospitals will start talking to their physicians about readmissions, and looking for methods to incentivize the hospitalists to get involved in preventing them," Dr. Williams says.
The new era of penalizing hospitals for higher-than-predicted 30-day avoidable readmissions rates has begun. Under the federal Hospital Readmissions Reduction Program, some calculate a hospital's excessive readmissions rate for each applicable condition.
Penalties for the current fiscal year—FY 2013, which began Oct. 1, 2012—will be based on discharges that occurred during the three-year period from July 1, 2008, to June 30, 2011, according to the program guidelines. For hospitals that don't improve, the penalty grows to a maximum 2% next year (FY14) and 3% in FY15.
Hospitalists are not penalized directly for readmissions, and many hospitalists are wondering about the extent to which they're responsible for a readmission after the patient leaves the hospital, notes Mark Williams, MD, FACP, MHM, chief of the division of hospital medicine at Northwestern University’s Feinberg School of Medicine in Chicago.
Dr. Williams is the principal investigator of SHM’s Project BOOST (Better Outcomes for Older Adults through Safe Transitions), one of several national quality initiatives that teach hospitals and other healthcare providers how to improve transitions of care through such techniques as patient coaching and community partnerships.
"These new penalties mean that hospitals will start talking to their physicians about readmissions, and looking for methods to incentivize the hospitalists to get involved in preventing them," Dr. Williams says.
Study: Neurohospitalists Benefit Academic Medical Centers
Bringing a neurohospitalist service into an academic medical center can reduce neurological patients' length of stay (LOS) at the facility, according to a study in Neurology.
The retrospective cohort study, "Effect of a Neurohospitalist Service on Outcomes at an Academic Medical Center," found that the mean LOS dropped to 4.6 days while the neurohospitalist service was in place, compared with 6.3 days during the pre-neurohospitalist period. However, adding the service didn't significantly reduce the median cost of care delivery ($6,758 vs. $7,241; P=0.25) or in-hospital mortality rate (1.6% vs. 1.2%; P=0.61), the study noted.
Lead author Vanja Douglas, MD, health sciences assistant clinical professor in the department of neurology at the University of California at San Francisco (UCSF) School of Medicine, says the study's impact is limited by its single-center universe of data. The study was conducted at a UCSF Medical Center in October 2006, but Dr. Douglas hopes similar studies at other academic or community centers will replicate the findings.
"If the current model people have in place is not necessarily focused on outcomes like LOS and cost, then making a change to a neurohospitalist model is likely to positively affect those outcomes," says Dr. Douglas, editor in chief of The Neurohospitalist.
Investigators tracked administrative data starting 21 months before UCSF added a neurohospitalist service and 27 months after. The service was comprised of one neurohospitalist focused solely on inpatients, which allowed other staff neurologists to focus on consultative cases throughout the hospital. Dr. Douglas says as HM groups look to improve their scope of practice and bottom line, studies such as his can lay the groundwork to make the investment.
"A lot of the groups that contract with hospitals are interested in partnering with subspecialty hospitalists," Dr. Douglas adds. "A neurohospitalist model has the potential to work, and the potential to improve outcomes."
Bringing a neurohospitalist service into an academic medical center can reduce neurological patients' length of stay (LOS) at the facility, according to a study in Neurology.
The retrospective cohort study, "Effect of a Neurohospitalist Service on Outcomes at an Academic Medical Center," found that the mean LOS dropped to 4.6 days while the neurohospitalist service was in place, compared with 6.3 days during the pre-neurohospitalist period. However, adding the service didn't significantly reduce the median cost of care delivery ($6,758 vs. $7,241; P=0.25) or in-hospital mortality rate (1.6% vs. 1.2%; P=0.61), the study noted.
Lead author Vanja Douglas, MD, health sciences assistant clinical professor in the department of neurology at the University of California at San Francisco (UCSF) School of Medicine, says the study's impact is limited by its single-center universe of data. The study was conducted at a UCSF Medical Center in October 2006, but Dr. Douglas hopes similar studies at other academic or community centers will replicate the findings.
"If the current model people have in place is not necessarily focused on outcomes like LOS and cost, then making a change to a neurohospitalist model is likely to positively affect those outcomes," says Dr. Douglas, editor in chief of The Neurohospitalist.
Investigators tracked administrative data starting 21 months before UCSF added a neurohospitalist service and 27 months after. The service was comprised of one neurohospitalist focused solely on inpatients, which allowed other staff neurologists to focus on consultative cases throughout the hospital. Dr. Douglas says as HM groups look to improve their scope of practice and bottom line, studies such as his can lay the groundwork to make the investment.
"A lot of the groups that contract with hospitals are interested in partnering with subspecialty hospitalists," Dr. Douglas adds. "A neurohospitalist model has the potential to work, and the potential to improve outcomes."
Bringing a neurohospitalist service into an academic medical center can reduce neurological patients' length of stay (LOS) at the facility, according to a study in Neurology.
The retrospective cohort study, "Effect of a Neurohospitalist Service on Outcomes at an Academic Medical Center," found that the mean LOS dropped to 4.6 days while the neurohospitalist service was in place, compared with 6.3 days during the pre-neurohospitalist period. However, adding the service didn't significantly reduce the median cost of care delivery ($6,758 vs. $7,241; P=0.25) or in-hospital mortality rate (1.6% vs. 1.2%; P=0.61), the study noted.
Lead author Vanja Douglas, MD, health sciences assistant clinical professor in the department of neurology at the University of California at San Francisco (UCSF) School of Medicine, says the study's impact is limited by its single-center universe of data. The study was conducted at a UCSF Medical Center in October 2006, but Dr. Douglas hopes similar studies at other academic or community centers will replicate the findings.
"If the current model people have in place is not necessarily focused on outcomes like LOS and cost, then making a change to a neurohospitalist model is likely to positively affect those outcomes," says Dr. Douglas, editor in chief of The Neurohospitalist.
Investigators tracked administrative data starting 21 months before UCSF added a neurohospitalist service and 27 months after. The service was comprised of one neurohospitalist focused solely on inpatients, which allowed other staff neurologists to focus on consultative cases throughout the hospital. Dr. Douglas says as HM groups look to improve their scope of practice and bottom line, studies such as his can lay the groundwork to make the investment.
"A lot of the groups that contract with hospitals are interested in partnering with subspecialty hospitalists," Dr. Douglas adds. "A neurohospitalist model has the potential to work, and the potential to improve outcomes."
Seasonality
Did you notice that your practice was slower than normal last February? In fact, if you plot your patient census over a few years, you will probably discover that it dips every February. And you will discover other slow periods, like December, and busy months during other parts of the year.
Seasonal fluctuations are a reality in every business, including private medical practices. Why are people more or less willing to spend money at certain times of the year? Analysts usually blame slow business during January and February on reluctance to buy products or services after the holiday season. They attribute summer peaks to everything from warm weather to an increased propensity to buy when students are on vacation. It is not always easy – or necessary – to explain seasonality. The point is that such behavior patterns do exist.
It would seem that this behavior would be easy to change through advertising or by sending out an e-mail blast, but, unfortunately, altering a seasonal pattern is not an option for a small private practice. It can be done, but it is a deep-pockets game requiring long, expensive campaigns that are only practical for a large, nationwide corporation.
Take soup, for example. For many years, canned soup was purchased and consumed almost exclusively during the winter months because it was universally perceived as a cold-weather product. After years of pervasive advertising extolling its nutritional virtues (remember Campbell’s slogan "Soup is good food"?), the soup industry succeeded in convincing the public to buy their product year round. Obviously, that kind of large-scale behavior modification is not practical for a local medical practice.
Does that mean that there is nothing we can do about our practices’ seasonal variations? Not at all, but we must work within the realities of our patients’ seasonal behavior, rather than attempting to change that behavior outright.
Plotting seasonality is easy: You can make a graph using Microsoft Excel in a few minutes. Ask your office manager or accountant for month-by-month billing figures for the last 2-3 years. (Make sure it’s the amount billed, not collected, since the latter lags the former by several weeks at least.) Plot those figures on the vertical arm and time (in months) on the horizontal. Alternatively, you can plot patient visits per month. I do both.
Once you know your seasonality, review your options, which could mean modifying your own habits when necessary. If you typically take a vacation in August, for example, you many want to reconsider if August is one of your busiest months. Consider vacationing during predictable slow periods instead.
Although I have said that you can’t change most seasonal behavior, it is possible to "retrain" some of your long-time, loyal patients to come in during slower periods for at least some of their care. Use insurance company rules as a financial incentive, where possible. Many of my patients are on Medicare, so I send a notice to all of them in early November, encouraging them to come in during December (one of my light months) before their deductible has to be paid again.
If you advertise your services, do the bulk of it during your busiest months. That might seem counterintuitive: Why not advertise during slow periods to fill the empty slots? Because you cannot change seasonal behavior with a low-budget, local advertising campaign; physicians who attempt it invariably get a poor response. Advertise during your busy periods, when seasonal patterns predict that potential patients are more willing to spend money and are more likely to respond to your message.
Then, try to flatten your seasonal dips by persuading as many existing patients as possible to return during slower seasons. You can then encourage new patients to make appointments when they are receptive to purchasing new services, which would be the seasonal peaks. Once in your practice, some of them can then be shifted into slower periods, especially for predictable, periodic care.
Dr. Eastern practices dermatology and dermatologic surgery in Belleville, N.J. To respond to this column, e-mail Dr. Eastern at our editorial offices at [email protected].
Did you notice that your practice was slower than normal last February? In fact, if you plot your patient census over a few years, you will probably discover that it dips every February. And you will discover other slow periods, like December, and busy months during other parts of the year.
Seasonal fluctuations are a reality in every business, including private medical practices. Why are people more or less willing to spend money at certain times of the year? Analysts usually blame slow business during January and February on reluctance to buy products or services after the holiday season. They attribute summer peaks to everything from warm weather to an increased propensity to buy when students are on vacation. It is not always easy – or necessary – to explain seasonality. The point is that such behavior patterns do exist.
It would seem that this behavior would be easy to change through advertising or by sending out an e-mail blast, but, unfortunately, altering a seasonal pattern is not an option for a small private practice. It can be done, but it is a deep-pockets game requiring long, expensive campaigns that are only practical for a large, nationwide corporation.
Take soup, for example. For many years, canned soup was purchased and consumed almost exclusively during the winter months because it was universally perceived as a cold-weather product. After years of pervasive advertising extolling its nutritional virtues (remember Campbell’s slogan "Soup is good food"?), the soup industry succeeded in convincing the public to buy their product year round. Obviously, that kind of large-scale behavior modification is not practical for a local medical practice.
Does that mean that there is nothing we can do about our practices’ seasonal variations? Not at all, but we must work within the realities of our patients’ seasonal behavior, rather than attempting to change that behavior outright.
Plotting seasonality is easy: You can make a graph using Microsoft Excel in a few minutes. Ask your office manager or accountant for month-by-month billing figures for the last 2-3 years. (Make sure it’s the amount billed, not collected, since the latter lags the former by several weeks at least.) Plot those figures on the vertical arm and time (in months) on the horizontal. Alternatively, you can plot patient visits per month. I do both.
Once you know your seasonality, review your options, which could mean modifying your own habits when necessary. If you typically take a vacation in August, for example, you many want to reconsider if August is one of your busiest months. Consider vacationing during predictable slow periods instead.
Although I have said that you can’t change most seasonal behavior, it is possible to "retrain" some of your long-time, loyal patients to come in during slower periods for at least some of their care. Use insurance company rules as a financial incentive, where possible. Many of my patients are on Medicare, so I send a notice to all of them in early November, encouraging them to come in during December (one of my light months) before their deductible has to be paid again.
If you advertise your services, do the bulk of it during your busiest months. That might seem counterintuitive: Why not advertise during slow periods to fill the empty slots? Because you cannot change seasonal behavior with a low-budget, local advertising campaign; physicians who attempt it invariably get a poor response. Advertise during your busy periods, when seasonal patterns predict that potential patients are more willing to spend money and are more likely to respond to your message.
Then, try to flatten your seasonal dips by persuading as many existing patients as possible to return during slower seasons. You can then encourage new patients to make appointments when they are receptive to purchasing new services, which would be the seasonal peaks. Once in your practice, some of them can then be shifted into slower periods, especially for predictable, periodic care.
Dr. Eastern practices dermatology and dermatologic surgery in Belleville, N.J. To respond to this column, e-mail Dr. Eastern at our editorial offices at [email protected].
Did you notice that your practice was slower than normal last February? In fact, if you plot your patient census over a few years, you will probably discover that it dips every February. And you will discover other slow periods, like December, and busy months during other parts of the year.
Seasonal fluctuations are a reality in every business, including private medical practices. Why are people more or less willing to spend money at certain times of the year? Analysts usually blame slow business during January and February on reluctance to buy products or services after the holiday season. They attribute summer peaks to everything from warm weather to an increased propensity to buy when students are on vacation. It is not always easy – or necessary – to explain seasonality. The point is that such behavior patterns do exist.
It would seem that this behavior would be easy to change through advertising or by sending out an e-mail blast, but, unfortunately, altering a seasonal pattern is not an option for a small private practice. It can be done, but it is a deep-pockets game requiring long, expensive campaigns that are only practical for a large, nationwide corporation.
Take soup, for example. For many years, canned soup was purchased and consumed almost exclusively during the winter months because it was universally perceived as a cold-weather product. After years of pervasive advertising extolling its nutritional virtues (remember Campbell’s slogan "Soup is good food"?), the soup industry succeeded in convincing the public to buy their product year round. Obviously, that kind of large-scale behavior modification is not practical for a local medical practice.
Does that mean that there is nothing we can do about our practices’ seasonal variations? Not at all, but we must work within the realities of our patients’ seasonal behavior, rather than attempting to change that behavior outright.
Plotting seasonality is easy: You can make a graph using Microsoft Excel in a few minutes. Ask your office manager or accountant for month-by-month billing figures for the last 2-3 years. (Make sure it’s the amount billed, not collected, since the latter lags the former by several weeks at least.) Plot those figures on the vertical arm and time (in months) on the horizontal. Alternatively, you can plot patient visits per month. I do both.
Once you know your seasonality, review your options, which could mean modifying your own habits when necessary. If you typically take a vacation in August, for example, you many want to reconsider if August is one of your busiest months. Consider vacationing during predictable slow periods instead.
Although I have said that you can’t change most seasonal behavior, it is possible to "retrain" some of your long-time, loyal patients to come in during slower periods for at least some of their care. Use insurance company rules as a financial incentive, where possible. Many of my patients are on Medicare, so I send a notice to all of them in early November, encouraging them to come in during December (one of my light months) before their deductible has to be paid again.
If you advertise your services, do the bulk of it during your busiest months. That might seem counterintuitive: Why not advertise during slow periods to fill the empty slots? Because you cannot change seasonal behavior with a low-budget, local advertising campaign; physicians who attempt it invariably get a poor response. Advertise during your busy periods, when seasonal patterns predict that potential patients are more willing to spend money and are more likely to respond to your message.
Then, try to flatten your seasonal dips by persuading as many existing patients as possible to return during slower seasons. You can then encourage new patients to make appointments when they are receptive to purchasing new services, which would be the seasonal peaks. Once in your practice, some of them can then be shifted into slower periods, especially for predictable, periodic care.
Dr. Eastern practices dermatology and dermatologic surgery in Belleville, N.J. To respond to this column, e-mail Dr. Eastern at our editorial offices at [email protected].
VIP Quality Improvement Network
Currently, 3%5% of infants under a year of age will be admitted to a hospital for acute viral bronchiolitis each year, making it the leading cause of hospitalization in children.15 The American Academy of Pediatrics guideline on the diagnosis and management of bronchiolitis advocates primarily supportive care for this self‐limited disease.6 Specifically, the routine use of therapies such as bronchodilators and corticosteroids are not recommended, nor is routine evaluation with diagnostic testing.6 Numerous studies have established the presence of unwarranted variation in most aspects of bronchiolitis care,713 and the current evidence does not support the routine usage of specific interventions in inpatients.1418
Acute bronchiolitis accounts for direct inpatient medical costs of over $500 million per year.19 Based on estimates from the Healthcare Utilization Project Kids' Inpatient Database, acute bronchiolitis is second only to respiratory distress syndrome as the most expensive disease of hospitalized children.1 Although charges may not correlate directly with costs or even the actual intensity of resource utilization, the national bill, based on charges, is approximately 1.4 billion dollars per year.1 Either way, the leading cause of hospitalization in children is expensive and suffers from dramatic variation in care characterized by overutilization of ineffective interventions.
Evidence‐based guidelines for bronchiolitis are readily available and their successful adoption within larger, academic children's hospitals has been demonstrated.2028 However, upwards of 70% of all children in this country are cared for outside of freestanding children's hospitals,1 and very little has been published about wide dissemination of evidence‐based guidelines in these settings.29 In 2008, the Value in Inpatient Pediatrics (VIP) network was created, as an inclusive pediatric inpatient quality improvement collaborative with a focus on linking academic and community‐based hospitalist groups, to disseminate evidence‐based management strategies for bronchiolitis. We hypothesized that group norming, through benchmarking and public goal setting at the level of the hospitalist group, would decrease overall utilization of nonevidence‐based therapies. Specifically, we were trying to decrease the utilization of bronchodilators, steroids, chest physiotherapy, chest radiography, and viral testing in hospitalized children diagnosed with uncomplicated bronchiolitis.
METHODS
Beginning in early 2008, we recruited pediatric hospitalists into a voluntary bronchiolitis quality improvement collaborative from within the community of hospitalists created by the American Academy of Pediatrics Section on Hospital Medicine. Participants were recruited through open calls at national conferences and mass e‐mails to the section membership through the listserve. The guiding principle for the collaborative was the idea that institutional adoption of evidence‐based disease‐management strategies would result in higher value of care, and that this process could be facilitated by benchmarking local performance against norms created within the larger community. We used group consensus to identify the therapies and tests to benchmark, although the chosen measures meshed with those addressed in the American Academy of Pediatrics (AAP) clinical practice guideline. Use of bronchodilators, corticosteroids, chest physiotherapy, chest radiography, and viral testing were all felt to be significantly overutilized in participating clinical sites. We were unaware of any published national targets for utilization of these therapies or tests, and none of the participating hospitalist groups was actively benchmarking their utilization against any peer group at the start of the project. Length of stay, rates of readmission within 72 hours of discharge, and variable direct costs were chosen as balancing measures for the project.
We collected data on hospitalizations for bronchiolitis for 4 calendar years, from 2007 through 2010, based on the following inclusion criteria: children under 24 months of age, hospitalized for the primary diagnosis of acute viral bronchiolitis as defined by International Classification of Diseases, Ninth Revision (ICD‐9) codes 466.11 and 466.19. We specifically included patients who were in observation status as well as those in inpatient status, and excluded all intensive care unit admissions. Other exclusions were specific ICD‐9 codes for: chronic lung diseases, asthma, chromosomal abnormalities, heart disease, and neurological diseases. We then tracked overall utilization of any bronchodilator (albuterol, levalbuterol, epinephrine, or ipratropium) during the hospitalization, including the emergency department; total number of bronchodilator doses per patient; utilization of any corticosteroids (inhaled or systemic); chest radiography; respiratory syncytial virus (RSV) testing; and chest physiotherapy; as well as variable direct costs per hospitalization for each center. A standardized toolkit was provided to participating centers to facilitate data collection. Data was sought from administrative sources, collected in aggregate form and not at the patient level, and no protected health information was collected as part of the project. The project was categorized as exempt by the University of Texas Health Science Center San Antonio Institutional Review Board, the location of the data repository.
The project began in 2008, though we requested that centers provide 2007 data to supplement our baseline. We held the first group meeting in July 2009 and began the facilitated sharing of resources to promote evidence‐based care, such as guidelines, protocols, respiratory scores, and patient handouts, across sites using data from 2007 and 2008 as our baseline for benchmarking and later assessing any improvement. Centers adopted guidelines at their own pace and we did not require guideline adoption for continued participation. We provided summaries of the available literature by topic, in the event that site leaders wished to give institutional grand rounds or other presentations. All dissemination of guidelines or protocols was done based on the request of the center, and no specific resource was created or sanctioned by the group, though the AAP Guideline for the Diagnosis and Management of Bronchiolitis6 remained a guiding document. Some of our centers participated in more extensive collaborative projects which involved small‐group goal setting, adoption of similar protocols, and conference calls, though this never encompassed more than 25% of the network.
The main product of the project was a yearly report benchmarking each hospital against the network average on each of our chosen utilization measures. The first report was disseminated in July 2009 and included data on calendar year 2007 and 2008, which we considered our group baseline. Most institutions began local Plan‐Do‐Study‐Act (PDSA) cycles by mid‐2009 using the data we provided as they benchmarked their performance against other members of the collaborative, and these continued through 2010. Hospitals were coded and remained anonymous. However, we publicly honored the high performers within the network at a yearly meeting, and urged these centers to share their tools and strategies, which was facilitated through a project Web site.30 All participation was voluntary, and all costs were borne by individuals or their respective centers.
In order to assess data quality, we undertook a validation project for calendar year 2009. We requested local direct chart review of a 10% sample, or a minimum of 10 charts, to confirm reported utilization rates for the therapies and tests we tracked. Any center with less than 80% accuracy was then asked to review data collection methods and make adjustments accordingly. One center identified and resolved a significant data discrepancy and 2 centers refused to participate in the validation project, citing their participation in a large national database for which there was already a very rigorous data validation process (Child Health Corporation of America's Pediatric Health Information System database). Given that we did not uncover major discrepancies in data quality within our network, we did not request further data validation but rather promoted year‐to‐year consistency of collection methods, seeking to collect the same type/quality of data that hospitals use in their own internal performance assessments.
Statistical analyses were performed using GraphPad InStat, version 3.0 (GraphPad Software, San Diego, CA). Descriptive statistics (including interquartile range ([IQR], the range from 25th to 75th percentile of the data) are provided. Analysis of process measures over the series of years was performed using repeated measures analysis of variance (ANOVA), as were intra‐hospital comparisons for all measures. Hospitals were not weighted by volume of admissions, ie, the unit of analysis was the hospital and not individual hospitalizations. Data were analyzed for normality using the method of Kolmogorov and Smirnoff, and in cases where normality was not satisfied (steroids and chest physiotherapy), the data were transformed and nonparametric methods were used. Post‐test adjustment for multiple comparisons was done using the TukeyKramer test in cases where ANOVA P values were <0.05. Fisher's exact test was used to analyze contingency tables for categorical variables such as presence or absence of a protocol.
RESULTS
Data encompassing 11,568 bronchiolitis hospitalizations in 17 centers, for calendar years 2007 to 2010, were analyzed for this report. A total of 31 centers ever participated in the project; however, this report is restricted to centers who participated for the entirety of the project from 2008 through 2010, and who consented to have their data reported. Specifically, 18 centers met inclusion criteria and 1 center opted out of the project, leaving the 17 centers described in Table 1. The overall network makeup shifted each year, but was always more than 80% non‐freestanding children's hospitals and approximately 30% urban, as defined as located in a population center of more than 1 million. A large majority of the participants did not have a local bronchiolitis protocol or guideline at the start of the project, although 88% of participants adopted some form of protocolized care by 2010. Calendar years 2007 and 2008 served as our network baseline, with most interventions (in institutions where they occurred) begun by calendar year 2009. The level of intervention varied greatly among institutions, with a few institutions doing nothing more than benchmarking their performance.
| Participating Centers (Alphabetically by State) | Type of Facility | Average Yearly Bronchiolitis Admissions | Approximate Medicaid (%) | Guideline Prior to Joining Project? | Location |
|---|---|---|---|---|---|
| |||||
| Scottsdale Healthcare Scottsdale, AZ | PEDS | 133 | 26 | No | Suburban |
| Shands Hospital for Children at the University of Florida Gainesville, FL | CHWH | 107 | 59 | No | Suburban |
| Children's Hospital of Illinois Peoria, IL | CHWH | 97 | 15 | No | Suburban |
| Kentucky Children's Hospital Lexington, KY | CHWH | 135 | 60 | Yes | Suburban |
| Our Lady of the Lake Baton Rouge, LA | CHWH | 138 | 70 | No | Suburban |
| The Barbara Bush Children's Hospital Portland, ME | CHWH | 31 | 41 | Yes | Suburban |
| Franklin Square Hospital Center Baltimore, MD | PEDS | 66 | 40 | No | Suburban |
| Anne Arundel Medical Center Annapolis, MD | CHWH | 56 | 36 | No | Suburban |
| Children's Hospital at Montefiore Bronx, NY | CHWH | 220 | 65 | No | Urban |
| Mission Children's Hospital Asheville, NC | CHWH | 112 | 21 | Yes | Suburban |
| Cleveland Clinic Children's Hospital Cleveland, OH | CHWH | 58 | 24 | Yes | Urban |
| Palmetto Health Children's Hospital Columbia, SC | CHWH | 181 | 60 | No | Suburban |
| East Tennessee Children's Hospital Knoxville, TN | FSCH | 373 | 60 | No | Suburban |
| Texas Children's Hospital Houston, TX | FSCH | 619 | 60 | Yes | Urban |
| Christus Santa Rosa Children's Hospital San Antonio, TX | CHWH | 390 | 71 | No | Urban |
| Children's Hospital of The Kings' Daughters Norfolk, VA | FSCH | 303 | 60 | No | Suburban |
| Children's Hospital of Richmond Richmond, VA | CHWH | 40 | 60 | No | Urban |
Mean length of stay (LOS), readmission rates, and variable direct costs did not differ significantly during the project time period. Mean LOS for the network ranged from a low of 2.4 days (IQR, 2.22.8 days) to a high of 2.7 days (IQR, 2.43.1 days), and mean readmission rates ranged from 1.2% (IQR, 0.7%1.8%) to 1.7% (IQR, 0.7%2.5%) during the project. Mean variable direct costs ranged from $1639 (IQR, $1383$1864) to $1767 (IQR, $1365$2320).
Table 2 describes the mean overall utilization of bronchodilators, chest radiography, RSV testing, steroids, and chest physiotherapy among the group from 2007 to 2010. By 2010, we saw a 46% decline in the volume of bronchodilator used within the network, a 3.6 (95% confidence interval [CI] 1.45.8) dose per patient absolute decrease (P < 0.01). We also saw a 12% (95% CI 5%25%) absolute decline in the overall percentage of patients exposed to any bronchodilator (P < 0.01). Finally, there was a 10% (95% CI 3%18%) absolute decline in the overall utilization of any chest physiotherapy (P < 0.01). The project did not demonstrate a significant impact on utilization of corticosteroids, chest radiography, or viral testing, although several centers achieved significant decreases on a local level (data not shown).
| Utilization Measure | 2007 | 2008 | 2009 | 2010 |
|---|---|---|---|---|
| No. (IQR) | No. (IQR) | No. (IQR) | No. (IQR) | |
| ||||
| Bronchodilator doses per patient (P < 0.01) | 7.9 (4.69.8) | 6.4 (4.08.4) | 5.7 (3.67.6) | 4.3 (3.05.9) |
| Any bronchodilators (P < 0.01) | 70% (59%83%) | 67% (56%77%) | 68% (61%76%) | 58% (46%69%) |
| Chest physiotherapy (P < 0.01) | 14% (5%19%) | 10% (1%8%) | 7% (2%6%) | 4% (1%7%) |
| Chest radiography (P = NS) | 64% (54%81%) | 66% (55%79%) | 64% (60%73%) | 59% (50%73%) |
| Any steroids (P = NS) | 21% (14%26%) | 20% (15%28%) | 21% (14%22%) | 16% (13%25%) |
| RSV testing (P = NS) | 64% (52%84%) | 61% (49%78%) | 62% (50%78%) | 57% (44%75%) |
We analyzed within‐hospital trends as well. Figure 1 describes intra‐hospital change over the course of the project for overall bronchodilator usage. In this analysis, 15 of 17 hospitals (88%) achieved a significant decrease in overall bronchodilator utilization by 2010. (Hospitals 27 and 29 were unable to provide 2007 baseline data.) For doses per patient, 15 of 17 institutions provided data on this measure, and 12 of 15 (80%) achieved significant decreases (Figure 2). Of note, the institutions failing to achieve significant decreases in bronchodilator utilization entered the project with utilization rates that were already significantly below network mean at the start of the project. (Institutions failing to improve are denoted with an asterisk in Figures 1 and 2.) Since most institutions made significant improvements in bronchodilator utilization over time, we looked for correlates of failure to decrease utilization. The strongest association for failure to improve during the project period was use of a protocol prior to joining the network (odds ratio [OR] = 11, 95% CI 261).
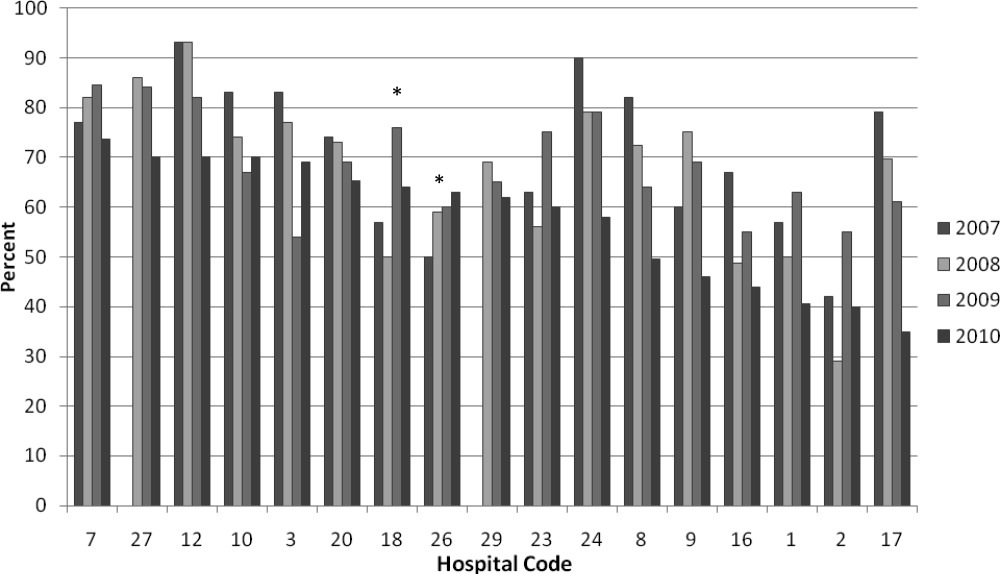
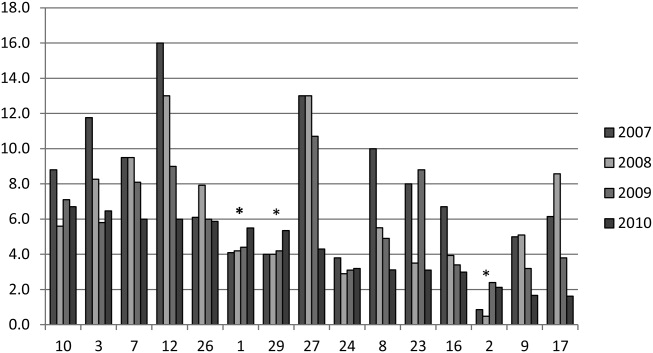
DISCUSSION
We demonstrated a significant decline in utilization of bronchodilators and chest physiotherapy in inpatient bronchiolitis within a voluntary quality collaborative focused on benchmarking without employing intensive interventions. This observation is important in that it demonstrates real‐world efficacy for our methods. Prior literature has clearly demonstrated that local bronchiolitis guidelines are effective; however, our data on over 11,000 hospitalizations from a broad array of inpatient settings continue to show a high rate of overutilization. We facilitated dissemination and sharing of guideline‐related tools primarily electronically, and capitalized on perceived peer‐group frustration with inefficient management of a high‐volume, high‐utilization disease. While the project leadership had varying degrees of advanced training in quality improvement methodology, the majority of the site leaders were self‐taught and trained while on the job. Our inclusive collaborative had some success using pragmatic and low‐resource methods which we believe is a novel approach to the issue of overutilization.
These considerations are highlighted given the pressing need to find more efficient and scalable means of bending the cost curve of healthcare in the United States. Learning collaboratives are a relatively new model for improvement, with some history in pediatrics,31, 32 and are attractive because of their potential to generate both widespread capacity for change as well as direct improvement. Both cystic fibrosis31 and neonatology collaboratives32 have been celebrated for their positive impacts on children's healthcare, and both are testaments to the power inherent in creating a community of like‐minded individuals. One of the most popular models for learning collaboratives remains the Institute for Healthcare Improvement's Breakthrough Series; however, this model is resource intensive in that it typically involves large teams and several yearly face‐to‐face meetings, with significant monetary investment on the part of hospitals. On the other hand, virtual collaboratives have produced mixed results with respect to quality improvement,33 so there is a continued need to maximize our learning about what works efficiently. Our collaborative was able to successfully disseminate tools developed in large academic institutions to be applied in smaller and more varied settings, where resources for quality improvement activities were limited.
One possible reason for any successes in this project was the existence of a well‐known guideline for the management of bronchiolitis published by the American Academy of Pediatrics in 2006. This guideline recommends primarily symptomatic care, and has a statement supporting the contention that routine use of our targeted therapies is unnecessary. It allows for a trial of bronchodilator, but specifically states that all trials should be accompanied by the use of an objective measure of improvement (typically interpreted to mean a respiratory distress score). A guideline sanctioned by an important national organization of pediatricians was invaluable, and we believe that it should serve as a basis for any nationally promoted inpatient quality measure for this very common pediatric illness. The existence of the AAP guideline also highlights the possibility that our results are merely representative of secular trends in utilization in bronchiolitis care, since we had no control group. The available literature on national guidelines has shown mixed and quite modest impacts in other countries.28, 34 Most of our group took active steps to operationalize the guidelines as part of their participation in this collaborative, though they might have done similar work anyway due to the increasing importance of quality improvement in hospitalist culture over the years of the project.
The project did not demonstrate any impact on steroid utilization, or on rates of obtaining chest radiography or viral testing, despite expressly targeting these widely overused interventions. These modalities are often employed in the emergency department and, as a collaborative of pediatric hospitalists, we did not have specific emergency department participation which we recognize as a major weakness and potential impediment to further progress. We hope to collaborate with our respective emergency departments in the future on these particular measures. We also noted that many institutions were inflexible about foregoing viral testing, due to infection control issues arising from the need to cohort patients in shared rooms based on RSV positivity during the busy winter months. A few institutions were able to alter their infection control policies using the strategy of assuming all children with bronchiolitis had RSV (ie, choosing to use both contact precautions and to wear a mask when entering rooms), though this was not universally popular. Finally, we recognize a missed opportunity in not collecting dose per patient level data for steroids, which might have allowed us to distinguish hospitals with ongoing inpatient utilization of steroids from those with only emergency department usage.
Another significant limitation of this project was the lack of annual assessments of data quality. However, we believe our findings are still useful and important, even with this obvious limitation. Most quality improvement work is done using hospital‐supplied data gleaned from administrative databases, exactly the sources used in this project. Key decisions are made in most hospitals in the country based on data of similar quality. Further limitations of the project relate to the issue of replicability. The disease process we addressed is a major source of frustration to pediatric hospitalists, and our sample likely consisted of the most highly motivated individuals, as they sought out and joined a group with the express purpose of decreasing unnecessary utilization in bronchiolitis. We believe this limitation highlights the likely need for quality measures to emerge organically out of a community of practice when resources are limited, ie, we do not believe we would have had significant success using our methods with an unpopular or externally imposed quality measure.
Although a detailed analysis of costs was beyond the scope of the current project, it is possible that decreased utilization resulted in overall cost savings, despite the fact that our data did not demonstrate a significant change in network‐level average variable direct costs related to bronchiolitis. It has been suggested that such savings may be particularly difficult to demonstrate objectively, especially when the principal costs targeted are labor‐based.35 LOS did not significantly vary during the project, whereas the use of labor‐intensive therapies like nebulized bronchodilators and chest physiotherapy declined. It is, however, quite possible that the decreased utilization we demonstrated was accompanied by a concomitant increase in utilization of other unmeasured therapies.
CONCLUSIONS
A volunteer, peer‐group collaborative focused on benchmarking decreased utilization of bronchodilators and chest physiotherapy in bronchiolitis, though had no impact on overuse of other unnecessary therapies and tests.
Acknowledgements
The following authors have participated in the production of this work by: Conception and design of project: Ralston, Garber, Narang, Shen, Pate; Acquisition of data: Ralston, Garber, Narang, Pope, Lossius, Croland, Bennett, Jewell, Krugman, Robbins, Nazif, Liewehr, Miller, Marks, Pappas, Pardue, Quinonez, Fine, Ryan; Analysis and interpretation of data: Ralston, Garber, Narang, Shen, Pate, Pope, Lossius, Croland, Bennett, Jewell, Krugman, Robbins, Nazif, Liewehr, Miller, Marks, Pappas, Pardue, Quinonez, Fine, Ryan; Drafting the article: Ralston, Garber, Shen; Revising it critically for important intellectual content, and final approval of the version to be published: Ralston, Garber, Narang, Shen, Pate, Pope, Lossius, Croland, Bennett, Jewell, Krugman, Robbins, Nazif, Liewehr, Miller, Marks, Pappas, Pardue, Quinonez, Fine, Ryan.
Disclosures: The VIP network receives financial/administrative support from the American Academy of Pediatrics through the Quality Improvement Innovations Network. Dr Ralston receives financial support from the American Academy of Pediatrics as editor of the AAP publication, Hospital Pediatrics. Drs Garber, Narang, Shen, Pate, Pope, Lossius, Croland, Bennett, Jewell, Krugman, Robbins, Nazif, Liewehr, Miller, Marks, Pappas, Pardue, Quinonez, Fine, and Ryan report no conflicts.
- HCUPnet. Kids Inpatient Database 2006. Available at: http://hcupnet.ahrq.gov/. Accessed February 6, 2011.
- , . Recent trends in severe respiratory syncytial virus (RSV) among US infants, 1997 to 2000. J Pediatr. 2003;143:S127–S132.
- , , , , . Infectious disease hospitalizations among infants in the United States. Pediatrics. 2008;121:244–252.
- , . Bronchiolitis. Lancet. 2006;368:312–322.
- , , , , . Rates of hospitalization for respiratory syncytial virus infection among children in Medicaid. J Pediatr. 2000;137:865–870.
- Subcommittee on the Diagnosis and Management of Bronchiolitis, 2004–2006. Clinical practice guideline: diagnosis and management of bronchiolitis. Pediatrics. 2006;118:1774–1793.
- , , . Bronchiolitis in US emergency departments 1992 to 2000: epidemiology and practice variation. Pediatr Emerg Care. 2005;21:242–247.
- , , , et al. Practice variation among pediatric emergency departments in the treatment of bronchiolitis. Acad Emerg Med. 2004;11:353–360.
- , , , . Bronchiolitis management preferences and the influence of pulse oximetry and respiratory rate on the decision to admit. Pediatrics. 2003;111:e45–e51.
- , , , , , . Variations in management of common inpatient pediatric illnesses: hospitalists and community pediatricians. Pediatrics. 2006;118:441–447.
- , , , , . Variation in pediatric hospitalists' use of proven and unproven therapies: a study from the Pediatric Research in Inpatient Settings (PRIS) network. J Hosp Med. 2008;3:292–298.
- , , , et al. Pediatric Investigators Collaborative Network on Infections in Canada (PICNIC) study of admission and management variation in patients hospitalized with respiratory syncytial viral lower respiratory tract infection. J Pediatr. 1996;129:390–395.
- , , , , . Effect of practice variation on resource utilization in infants hospitalized for viral lower respiratory illness. Pediatrics. 2001;108:851–855.
- , . Bronchodilators for bronchiolitis. Cochrane Database Syst Rev. 2010 Dec 8;(12):CD001266.
- , , . Chest physiotherapy for acute bronchiolitis in pediatric patients between 0 and 24 months old. Cochrane Database Syst Rev. 2007 Jan 24;(1):CD004873.
- , , , et al. Epinephrine for bronchiolitis. Cochrane Database Syst Rev. 2011 Jun 15;(6):CD003123.
- , , , et al. Glucocorticoids for acute bronchiolitis in infants and young children. Cochrane Database Syst Rev. 2010 Oct 6;(10):CD004878.
- , , , . Efficacy of interventions for bronchiolitis in critically ill infants: a systematic review and meta‐analysis. Pediatr Crit Care Med. 2004;5:482–489.
- , , . Direct medical costs of bronchiolitis hospitalizations in the United States. Pediatrics. 2006;118(6):2418–2423.
- , , , et al. Evaluation of an evidence‐based guideline for bronchiolitis. Pediatrics. 1999;104(6):1334–1341.
- , , . Standardizing the care of bronchiolitis. Arch Pediatr Adolesc Med. 1998;152(8):739–744.
- , , , , , . Decreasing overuse of therapies in the treatment of bronchiolitis by incorporating evidence at the point of care. J Pediatr. 2004;144:703–710.
- , , , , , . Effect of point of care information on inpatient management of bronchiolitis. BMC Pediatr. 2007;7:4.
- , , , et al. A clinical pathway for bronchiolitis is effective in reducing readmission rates. J Pediatr. 2005;147:622–626.
- , , , et al. Sustaining the implementation of an evidence‐based guideline for bronchiolitis. Arch Pediatr Adolesc Med. 2000;154:1001–1007.
- , , , , , . Assessment of the French Consensus Conference for Acute Viral Bronchiolitis on outpatient management: progress between 2003 and 2008 [in French]. Arch Pediatr. 2010;17:125–131.
- , , , , , . Impact of a bronchiolitis guideline: a multisite demonstration project. Chest. 2002;121:1789–1797.
- , , , . Management of acute bronchiolitis: can evidence based guidelines alter clinical practice? Thorax. 2008;63:1103–1109.
- , . The “3 T's” roadmap to transform US health care: the “how” of high quality care. JAMA. 2008;299(19):2319–2321.
- The VIP Network. Available at: http://www.vipnetwork.webs.com. Accessed October 5, 2010.
- , . A story of success: continuous quality improvement in cystic fibrosis in the USA. Thorax. 2011;66:1106–1168.
- , , , , , . NICU practices and outcomes associated with 9 years of quality improvement collaboratives. Pediatrics. 2010;125:437–446.
- , , , et al. Quality improvement projects target health care‐associated infections: comparing virtual collaborative and toolkit approaches. J Hosp Med. 2011;6:271–278.
- , , , , . Impact of consensus development conference guidelines on primary care of bronchiolitis: are national guidelines being followed? J Eval Clin Pract. 2007;13:651–656.
- , , , . The savings illusion—why clinical quality improvement fails to deliver bottom‐line results. N Engl J Med. 2011;365:e48.
Currently, 3%5% of infants under a year of age will be admitted to a hospital for acute viral bronchiolitis each year, making it the leading cause of hospitalization in children.15 The American Academy of Pediatrics guideline on the diagnosis and management of bronchiolitis advocates primarily supportive care for this self‐limited disease.6 Specifically, the routine use of therapies such as bronchodilators and corticosteroids are not recommended, nor is routine evaluation with diagnostic testing.6 Numerous studies have established the presence of unwarranted variation in most aspects of bronchiolitis care,713 and the current evidence does not support the routine usage of specific interventions in inpatients.1418
Acute bronchiolitis accounts for direct inpatient medical costs of over $500 million per year.19 Based on estimates from the Healthcare Utilization Project Kids' Inpatient Database, acute bronchiolitis is second only to respiratory distress syndrome as the most expensive disease of hospitalized children.1 Although charges may not correlate directly with costs or even the actual intensity of resource utilization, the national bill, based on charges, is approximately 1.4 billion dollars per year.1 Either way, the leading cause of hospitalization in children is expensive and suffers from dramatic variation in care characterized by overutilization of ineffective interventions.
Evidence‐based guidelines for bronchiolitis are readily available and their successful adoption within larger, academic children's hospitals has been demonstrated.2028 However, upwards of 70% of all children in this country are cared for outside of freestanding children's hospitals,1 and very little has been published about wide dissemination of evidence‐based guidelines in these settings.29 In 2008, the Value in Inpatient Pediatrics (VIP) network was created, as an inclusive pediatric inpatient quality improvement collaborative with a focus on linking academic and community‐based hospitalist groups, to disseminate evidence‐based management strategies for bronchiolitis. We hypothesized that group norming, through benchmarking and public goal setting at the level of the hospitalist group, would decrease overall utilization of nonevidence‐based therapies. Specifically, we were trying to decrease the utilization of bronchodilators, steroids, chest physiotherapy, chest radiography, and viral testing in hospitalized children diagnosed with uncomplicated bronchiolitis.
METHODS
Beginning in early 2008, we recruited pediatric hospitalists into a voluntary bronchiolitis quality improvement collaborative from within the community of hospitalists created by the American Academy of Pediatrics Section on Hospital Medicine. Participants were recruited through open calls at national conferences and mass e‐mails to the section membership through the listserve. The guiding principle for the collaborative was the idea that institutional adoption of evidence‐based disease‐management strategies would result in higher value of care, and that this process could be facilitated by benchmarking local performance against norms created within the larger community. We used group consensus to identify the therapies and tests to benchmark, although the chosen measures meshed with those addressed in the American Academy of Pediatrics (AAP) clinical practice guideline. Use of bronchodilators, corticosteroids, chest physiotherapy, chest radiography, and viral testing were all felt to be significantly overutilized in participating clinical sites. We were unaware of any published national targets for utilization of these therapies or tests, and none of the participating hospitalist groups was actively benchmarking their utilization against any peer group at the start of the project. Length of stay, rates of readmission within 72 hours of discharge, and variable direct costs were chosen as balancing measures for the project.
We collected data on hospitalizations for bronchiolitis for 4 calendar years, from 2007 through 2010, based on the following inclusion criteria: children under 24 months of age, hospitalized for the primary diagnosis of acute viral bronchiolitis as defined by International Classification of Diseases, Ninth Revision (ICD‐9) codes 466.11 and 466.19. We specifically included patients who were in observation status as well as those in inpatient status, and excluded all intensive care unit admissions. Other exclusions were specific ICD‐9 codes for: chronic lung diseases, asthma, chromosomal abnormalities, heart disease, and neurological diseases. We then tracked overall utilization of any bronchodilator (albuterol, levalbuterol, epinephrine, or ipratropium) during the hospitalization, including the emergency department; total number of bronchodilator doses per patient; utilization of any corticosteroids (inhaled or systemic); chest radiography; respiratory syncytial virus (RSV) testing; and chest physiotherapy; as well as variable direct costs per hospitalization for each center. A standardized toolkit was provided to participating centers to facilitate data collection. Data was sought from administrative sources, collected in aggregate form and not at the patient level, and no protected health information was collected as part of the project. The project was categorized as exempt by the University of Texas Health Science Center San Antonio Institutional Review Board, the location of the data repository.
The project began in 2008, though we requested that centers provide 2007 data to supplement our baseline. We held the first group meeting in July 2009 and began the facilitated sharing of resources to promote evidence‐based care, such as guidelines, protocols, respiratory scores, and patient handouts, across sites using data from 2007 and 2008 as our baseline for benchmarking and later assessing any improvement. Centers adopted guidelines at their own pace and we did not require guideline adoption for continued participation. We provided summaries of the available literature by topic, in the event that site leaders wished to give institutional grand rounds or other presentations. All dissemination of guidelines or protocols was done based on the request of the center, and no specific resource was created or sanctioned by the group, though the AAP Guideline for the Diagnosis and Management of Bronchiolitis6 remained a guiding document. Some of our centers participated in more extensive collaborative projects which involved small‐group goal setting, adoption of similar protocols, and conference calls, though this never encompassed more than 25% of the network.
The main product of the project was a yearly report benchmarking each hospital against the network average on each of our chosen utilization measures. The first report was disseminated in July 2009 and included data on calendar year 2007 and 2008, which we considered our group baseline. Most institutions began local Plan‐Do‐Study‐Act (PDSA) cycles by mid‐2009 using the data we provided as they benchmarked their performance against other members of the collaborative, and these continued through 2010. Hospitals were coded and remained anonymous. However, we publicly honored the high performers within the network at a yearly meeting, and urged these centers to share their tools and strategies, which was facilitated through a project Web site.30 All participation was voluntary, and all costs were borne by individuals or their respective centers.
In order to assess data quality, we undertook a validation project for calendar year 2009. We requested local direct chart review of a 10% sample, or a minimum of 10 charts, to confirm reported utilization rates for the therapies and tests we tracked. Any center with less than 80% accuracy was then asked to review data collection methods and make adjustments accordingly. One center identified and resolved a significant data discrepancy and 2 centers refused to participate in the validation project, citing their participation in a large national database for which there was already a very rigorous data validation process (Child Health Corporation of America's Pediatric Health Information System database). Given that we did not uncover major discrepancies in data quality within our network, we did not request further data validation but rather promoted year‐to‐year consistency of collection methods, seeking to collect the same type/quality of data that hospitals use in their own internal performance assessments.
Statistical analyses were performed using GraphPad InStat, version 3.0 (GraphPad Software, San Diego, CA). Descriptive statistics (including interquartile range ([IQR], the range from 25th to 75th percentile of the data) are provided. Analysis of process measures over the series of years was performed using repeated measures analysis of variance (ANOVA), as were intra‐hospital comparisons for all measures. Hospitals were not weighted by volume of admissions, ie, the unit of analysis was the hospital and not individual hospitalizations. Data were analyzed for normality using the method of Kolmogorov and Smirnoff, and in cases where normality was not satisfied (steroids and chest physiotherapy), the data were transformed and nonparametric methods were used. Post‐test adjustment for multiple comparisons was done using the TukeyKramer test in cases where ANOVA P values were <0.05. Fisher's exact test was used to analyze contingency tables for categorical variables such as presence or absence of a protocol.
RESULTS
Data encompassing 11,568 bronchiolitis hospitalizations in 17 centers, for calendar years 2007 to 2010, were analyzed for this report. A total of 31 centers ever participated in the project; however, this report is restricted to centers who participated for the entirety of the project from 2008 through 2010, and who consented to have their data reported. Specifically, 18 centers met inclusion criteria and 1 center opted out of the project, leaving the 17 centers described in Table 1. The overall network makeup shifted each year, but was always more than 80% non‐freestanding children's hospitals and approximately 30% urban, as defined as located in a population center of more than 1 million. A large majority of the participants did not have a local bronchiolitis protocol or guideline at the start of the project, although 88% of participants adopted some form of protocolized care by 2010. Calendar years 2007 and 2008 served as our network baseline, with most interventions (in institutions where they occurred) begun by calendar year 2009. The level of intervention varied greatly among institutions, with a few institutions doing nothing more than benchmarking their performance.
| Participating Centers (Alphabetically by State) | Type of Facility | Average Yearly Bronchiolitis Admissions | Approximate Medicaid (%) | Guideline Prior to Joining Project? | Location |
|---|---|---|---|---|---|
| |||||
| Scottsdale Healthcare Scottsdale, AZ | PEDS | 133 | 26 | No | Suburban |
| Shands Hospital for Children at the University of Florida Gainesville, FL | CHWH | 107 | 59 | No | Suburban |
| Children's Hospital of Illinois Peoria, IL | CHWH | 97 | 15 | No | Suburban |
| Kentucky Children's Hospital Lexington, KY | CHWH | 135 | 60 | Yes | Suburban |
| Our Lady of the Lake Baton Rouge, LA | CHWH | 138 | 70 | No | Suburban |
| The Barbara Bush Children's Hospital Portland, ME | CHWH | 31 | 41 | Yes | Suburban |
| Franklin Square Hospital Center Baltimore, MD | PEDS | 66 | 40 | No | Suburban |
| Anne Arundel Medical Center Annapolis, MD | CHWH | 56 | 36 | No | Suburban |
| Children's Hospital at Montefiore Bronx, NY | CHWH | 220 | 65 | No | Urban |
| Mission Children's Hospital Asheville, NC | CHWH | 112 | 21 | Yes | Suburban |
| Cleveland Clinic Children's Hospital Cleveland, OH | CHWH | 58 | 24 | Yes | Urban |
| Palmetto Health Children's Hospital Columbia, SC | CHWH | 181 | 60 | No | Suburban |
| East Tennessee Children's Hospital Knoxville, TN | FSCH | 373 | 60 | No | Suburban |
| Texas Children's Hospital Houston, TX | FSCH | 619 | 60 | Yes | Urban |
| Christus Santa Rosa Children's Hospital San Antonio, TX | CHWH | 390 | 71 | No | Urban |
| Children's Hospital of The Kings' Daughters Norfolk, VA | FSCH | 303 | 60 | No | Suburban |
| Children's Hospital of Richmond Richmond, VA | CHWH | 40 | 60 | No | Urban |
Mean length of stay (LOS), readmission rates, and variable direct costs did not differ significantly during the project time period. Mean LOS for the network ranged from a low of 2.4 days (IQR, 2.22.8 days) to a high of 2.7 days (IQR, 2.43.1 days), and mean readmission rates ranged from 1.2% (IQR, 0.7%1.8%) to 1.7% (IQR, 0.7%2.5%) during the project. Mean variable direct costs ranged from $1639 (IQR, $1383$1864) to $1767 (IQR, $1365$2320).
Table 2 describes the mean overall utilization of bronchodilators, chest radiography, RSV testing, steroids, and chest physiotherapy among the group from 2007 to 2010. By 2010, we saw a 46% decline in the volume of bronchodilator used within the network, a 3.6 (95% confidence interval [CI] 1.45.8) dose per patient absolute decrease (P < 0.01). We also saw a 12% (95% CI 5%25%) absolute decline in the overall percentage of patients exposed to any bronchodilator (P < 0.01). Finally, there was a 10% (95% CI 3%18%) absolute decline in the overall utilization of any chest physiotherapy (P < 0.01). The project did not demonstrate a significant impact on utilization of corticosteroids, chest radiography, or viral testing, although several centers achieved significant decreases on a local level (data not shown).
| Utilization Measure | 2007 | 2008 | 2009 | 2010 |
|---|---|---|---|---|
| No. (IQR) | No. (IQR) | No. (IQR) | No. (IQR) | |
| ||||
| Bronchodilator doses per patient (P < 0.01) | 7.9 (4.69.8) | 6.4 (4.08.4) | 5.7 (3.67.6) | 4.3 (3.05.9) |
| Any bronchodilators (P < 0.01) | 70% (59%83%) | 67% (56%77%) | 68% (61%76%) | 58% (46%69%) |
| Chest physiotherapy (P < 0.01) | 14% (5%19%) | 10% (1%8%) | 7% (2%6%) | 4% (1%7%) |
| Chest radiography (P = NS) | 64% (54%81%) | 66% (55%79%) | 64% (60%73%) | 59% (50%73%) |
| Any steroids (P = NS) | 21% (14%26%) | 20% (15%28%) | 21% (14%22%) | 16% (13%25%) |
| RSV testing (P = NS) | 64% (52%84%) | 61% (49%78%) | 62% (50%78%) | 57% (44%75%) |
We analyzed within‐hospital trends as well. Figure 1 describes intra‐hospital change over the course of the project for overall bronchodilator usage. In this analysis, 15 of 17 hospitals (88%) achieved a significant decrease in overall bronchodilator utilization by 2010. (Hospitals 27 and 29 were unable to provide 2007 baseline data.) For doses per patient, 15 of 17 institutions provided data on this measure, and 12 of 15 (80%) achieved significant decreases (Figure 2). Of note, the institutions failing to achieve significant decreases in bronchodilator utilization entered the project with utilization rates that were already significantly below network mean at the start of the project. (Institutions failing to improve are denoted with an asterisk in Figures 1 and 2.) Since most institutions made significant improvements in bronchodilator utilization over time, we looked for correlates of failure to decrease utilization. The strongest association for failure to improve during the project period was use of a protocol prior to joining the network (odds ratio [OR] = 11, 95% CI 261).
DISCUSSION
We demonstrated a significant decline in utilization of bronchodilators and chest physiotherapy in inpatient bronchiolitis within a voluntary quality collaborative focused on benchmarking without employing intensive interventions. This observation is important in that it demonstrates real‐world efficacy for our methods. Prior literature has clearly demonstrated that local bronchiolitis guidelines are effective; however, our data on over 11,000 hospitalizations from a broad array of inpatient settings continue to show a high rate of overutilization. We facilitated dissemination and sharing of guideline‐related tools primarily electronically, and capitalized on perceived peer‐group frustration with inefficient management of a high‐volume, high‐utilization disease. While the project leadership had varying degrees of advanced training in quality improvement methodology, the majority of the site leaders were self‐taught and trained while on the job. Our inclusive collaborative had some success using pragmatic and low‐resource methods which we believe is a novel approach to the issue of overutilization.
These considerations are highlighted given the pressing need to find more efficient and scalable means of bending the cost curve of healthcare in the United States. Learning collaboratives are a relatively new model for improvement, with some history in pediatrics,31, 32 and are attractive because of their potential to generate both widespread capacity for change as well as direct improvement. Both cystic fibrosis31 and neonatology collaboratives32 have been celebrated for their positive impacts on children's healthcare, and both are testaments to the power inherent in creating a community of like‐minded individuals. One of the most popular models for learning collaboratives remains the Institute for Healthcare Improvement's Breakthrough Series; however, this model is resource intensive in that it typically involves large teams and several yearly face‐to‐face meetings, with significant monetary investment on the part of hospitals. On the other hand, virtual collaboratives have produced mixed results with respect to quality improvement,33 so there is a continued need to maximize our learning about what works efficiently. Our collaborative was able to successfully disseminate tools developed in large academic institutions to be applied in smaller and more varied settings, where resources for quality improvement activities were limited.
One possible reason for any successes in this project was the existence of a well‐known guideline for the management of bronchiolitis published by the American Academy of Pediatrics in 2006. This guideline recommends primarily symptomatic care, and has a statement supporting the contention that routine use of our targeted therapies is unnecessary. It allows for a trial of bronchodilator, but specifically states that all trials should be accompanied by the use of an objective measure of improvement (typically interpreted to mean a respiratory distress score). A guideline sanctioned by an important national organization of pediatricians was invaluable, and we believe that it should serve as a basis for any nationally promoted inpatient quality measure for this very common pediatric illness. The existence of the AAP guideline also highlights the possibility that our results are merely representative of secular trends in utilization in bronchiolitis care, since we had no control group. The available literature on national guidelines has shown mixed and quite modest impacts in other countries.28, 34 Most of our group took active steps to operationalize the guidelines as part of their participation in this collaborative, though they might have done similar work anyway due to the increasing importance of quality improvement in hospitalist culture over the years of the project.
The project did not demonstrate any impact on steroid utilization, or on rates of obtaining chest radiography or viral testing, despite expressly targeting these widely overused interventions. These modalities are often employed in the emergency department and, as a collaborative of pediatric hospitalists, we did not have specific emergency department participation which we recognize as a major weakness and potential impediment to further progress. We hope to collaborate with our respective emergency departments in the future on these particular measures. We also noted that many institutions were inflexible about foregoing viral testing, due to infection control issues arising from the need to cohort patients in shared rooms based on RSV positivity during the busy winter months. A few institutions were able to alter their infection control policies using the strategy of assuming all children with bronchiolitis had RSV (ie, choosing to use both contact precautions and to wear a mask when entering rooms), though this was not universally popular. Finally, we recognize a missed opportunity in not collecting dose per patient level data for steroids, which might have allowed us to distinguish hospitals with ongoing inpatient utilization of steroids from those with only emergency department usage.
Another significant limitation of this project was the lack of annual assessments of data quality. However, we believe our findings are still useful and important, even with this obvious limitation. Most quality improvement work is done using hospital‐supplied data gleaned from administrative databases, exactly the sources used in this project. Key decisions are made in most hospitals in the country based on data of similar quality. Further limitations of the project relate to the issue of replicability. The disease process we addressed is a major source of frustration to pediatric hospitalists, and our sample likely consisted of the most highly motivated individuals, as they sought out and joined a group with the express purpose of decreasing unnecessary utilization in bronchiolitis. We believe this limitation highlights the likely need for quality measures to emerge organically out of a community of practice when resources are limited, ie, we do not believe we would have had significant success using our methods with an unpopular or externally imposed quality measure.
Although a detailed analysis of costs was beyond the scope of the current project, it is possible that decreased utilization resulted in overall cost savings, despite the fact that our data did not demonstrate a significant change in network‐level average variable direct costs related to bronchiolitis. It has been suggested that such savings may be particularly difficult to demonstrate objectively, especially when the principal costs targeted are labor‐based.35 LOS did not significantly vary during the project, whereas the use of labor‐intensive therapies like nebulized bronchodilators and chest physiotherapy declined. It is, however, quite possible that the decreased utilization we demonstrated was accompanied by a concomitant increase in utilization of other unmeasured therapies.
CONCLUSIONS
A volunteer, peer‐group collaborative focused on benchmarking decreased utilization of bronchodilators and chest physiotherapy in bronchiolitis, though had no impact on overuse of other unnecessary therapies and tests.
Acknowledgements
The following authors have participated in the production of this work by: Conception and design of project: Ralston, Garber, Narang, Shen, Pate; Acquisition of data: Ralston, Garber, Narang, Pope, Lossius, Croland, Bennett, Jewell, Krugman, Robbins, Nazif, Liewehr, Miller, Marks, Pappas, Pardue, Quinonez, Fine, Ryan; Analysis and interpretation of data: Ralston, Garber, Narang, Shen, Pate, Pope, Lossius, Croland, Bennett, Jewell, Krugman, Robbins, Nazif, Liewehr, Miller, Marks, Pappas, Pardue, Quinonez, Fine, Ryan; Drafting the article: Ralston, Garber, Shen; Revising it critically for important intellectual content, and final approval of the version to be published: Ralston, Garber, Narang, Shen, Pate, Pope, Lossius, Croland, Bennett, Jewell, Krugman, Robbins, Nazif, Liewehr, Miller, Marks, Pappas, Pardue, Quinonez, Fine, Ryan.
Disclosures: The VIP network receives financial/administrative support from the American Academy of Pediatrics through the Quality Improvement Innovations Network. Dr Ralston receives financial support from the American Academy of Pediatrics as editor of the AAP publication, Hospital Pediatrics. Drs Garber, Narang, Shen, Pate, Pope, Lossius, Croland, Bennett, Jewell, Krugman, Robbins, Nazif, Liewehr, Miller, Marks, Pappas, Pardue, Quinonez, Fine, and Ryan report no conflicts.
Currently, 3%5% of infants under a year of age will be admitted to a hospital for acute viral bronchiolitis each year, making it the leading cause of hospitalization in children.15 The American Academy of Pediatrics guideline on the diagnosis and management of bronchiolitis advocates primarily supportive care for this self‐limited disease.6 Specifically, the routine use of therapies such as bronchodilators and corticosteroids are not recommended, nor is routine evaluation with diagnostic testing.6 Numerous studies have established the presence of unwarranted variation in most aspects of bronchiolitis care,713 and the current evidence does not support the routine usage of specific interventions in inpatients.1418
Acute bronchiolitis accounts for direct inpatient medical costs of over $500 million per year.19 Based on estimates from the Healthcare Utilization Project Kids' Inpatient Database, acute bronchiolitis is second only to respiratory distress syndrome as the most expensive disease of hospitalized children.1 Although charges may not correlate directly with costs or even the actual intensity of resource utilization, the national bill, based on charges, is approximately 1.4 billion dollars per year.1 Either way, the leading cause of hospitalization in children is expensive and suffers from dramatic variation in care characterized by overutilization of ineffective interventions.
Evidence‐based guidelines for bronchiolitis are readily available and their successful adoption within larger, academic children's hospitals has been demonstrated.2028 However, upwards of 70% of all children in this country are cared for outside of freestanding children's hospitals,1 and very little has been published about wide dissemination of evidence‐based guidelines in these settings.29 In 2008, the Value in Inpatient Pediatrics (VIP) network was created, as an inclusive pediatric inpatient quality improvement collaborative with a focus on linking academic and community‐based hospitalist groups, to disseminate evidence‐based management strategies for bronchiolitis. We hypothesized that group norming, through benchmarking and public goal setting at the level of the hospitalist group, would decrease overall utilization of nonevidence‐based therapies. Specifically, we were trying to decrease the utilization of bronchodilators, steroids, chest physiotherapy, chest radiography, and viral testing in hospitalized children diagnosed with uncomplicated bronchiolitis.
METHODS
Beginning in early 2008, we recruited pediatric hospitalists into a voluntary bronchiolitis quality improvement collaborative from within the community of hospitalists created by the American Academy of Pediatrics Section on Hospital Medicine. Participants were recruited through open calls at national conferences and mass e‐mails to the section membership through the listserve. The guiding principle for the collaborative was the idea that institutional adoption of evidence‐based disease‐management strategies would result in higher value of care, and that this process could be facilitated by benchmarking local performance against norms created within the larger community. We used group consensus to identify the therapies and tests to benchmark, although the chosen measures meshed with those addressed in the American Academy of Pediatrics (AAP) clinical practice guideline. Use of bronchodilators, corticosteroids, chest physiotherapy, chest radiography, and viral testing were all felt to be significantly overutilized in participating clinical sites. We were unaware of any published national targets for utilization of these therapies or tests, and none of the participating hospitalist groups was actively benchmarking their utilization against any peer group at the start of the project. Length of stay, rates of readmission within 72 hours of discharge, and variable direct costs were chosen as balancing measures for the project.
We collected data on hospitalizations for bronchiolitis for 4 calendar years, from 2007 through 2010, based on the following inclusion criteria: children under 24 months of age, hospitalized for the primary diagnosis of acute viral bronchiolitis as defined by International Classification of Diseases, Ninth Revision (ICD‐9) codes 466.11 and 466.19. We specifically included patients who were in observation status as well as those in inpatient status, and excluded all intensive care unit admissions. Other exclusions were specific ICD‐9 codes for: chronic lung diseases, asthma, chromosomal abnormalities, heart disease, and neurological diseases. We then tracked overall utilization of any bronchodilator (albuterol, levalbuterol, epinephrine, or ipratropium) during the hospitalization, including the emergency department; total number of bronchodilator doses per patient; utilization of any corticosteroids (inhaled or systemic); chest radiography; respiratory syncytial virus (RSV) testing; and chest physiotherapy; as well as variable direct costs per hospitalization for each center. A standardized toolkit was provided to participating centers to facilitate data collection. Data was sought from administrative sources, collected in aggregate form and not at the patient level, and no protected health information was collected as part of the project. The project was categorized as exempt by the University of Texas Health Science Center San Antonio Institutional Review Board, the location of the data repository.
The project began in 2008, though we requested that centers provide 2007 data to supplement our baseline. We held the first group meeting in July 2009 and began the facilitated sharing of resources to promote evidence‐based care, such as guidelines, protocols, respiratory scores, and patient handouts, across sites using data from 2007 and 2008 as our baseline for benchmarking and later assessing any improvement. Centers adopted guidelines at their own pace and we did not require guideline adoption for continued participation. We provided summaries of the available literature by topic, in the event that site leaders wished to give institutional grand rounds or other presentations. All dissemination of guidelines or protocols was done based on the request of the center, and no specific resource was created or sanctioned by the group, though the AAP Guideline for the Diagnosis and Management of Bronchiolitis6 remained a guiding document. Some of our centers participated in more extensive collaborative projects which involved small‐group goal setting, adoption of similar protocols, and conference calls, though this never encompassed more than 25% of the network.
The main product of the project was a yearly report benchmarking each hospital against the network average on each of our chosen utilization measures. The first report was disseminated in July 2009 and included data on calendar year 2007 and 2008, which we considered our group baseline. Most institutions began local Plan‐Do‐Study‐Act (PDSA) cycles by mid‐2009 using the data we provided as they benchmarked their performance against other members of the collaborative, and these continued through 2010. Hospitals were coded and remained anonymous. However, we publicly honored the high performers within the network at a yearly meeting, and urged these centers to share their tools and strategies, which was facilitated through a project Web site.30 All participation was voluntary, and all costs were borne by individuals or their respective centers.
In order to assess data quality, we undertook a validation project for calendar year 2009. We requested local direct chart review of a 10% sample, or a minimum of 10 charts, to confirm reported utilization rates for the therapies and tests we tracked. Any center with less than 80% accuracy was then asked to review data collection methods and make adjustments accordingly. One center identified and resolved a significant data discrepancy and 2 centers refused to participate in the validation project, citing their participation in a large national database for which there was already a very rigorous data validation process (Child Health Corporation of America's Pediatric Health Information System database). Given that we did not uncover major discrepancies in data quality within our network, we did not request further data validation but rather promoted year‐to‐year consistency of collection methods, seeking to collect the same type/quality of data that hospitals use in their own internal performance assessments.
Statistical analyses were performed using GraphPad InStat, version 3.0 (GraphPad Software, San Diego, CA). Descriptive statistics (including interquartile range ([IQR], the range from 25th to 75th percentile of the data) are provided. Analysis of process measures over the series of years was performed using repeated measures analysis of variance (ANOVA), as were intra‐hospital comparisons for all measures. Hospitals were not weighted by volume of admissions, ie, the unit of analysis was the hospital and not individual hospitalizations. Data were analyzed for normality using the method of Kolmogorov and Smirnoff, and in cases where normality was not satisfied (steroids and chest physiotherapy), the data were transformed and nonparametric methods were used. Post‐test adjustment for multiple comparisons was done using the TukeyKramer test in cases where ANOVA P values were <0.05. Fisher's exact test was used to analyze contingency tables for categorical variables such as presence or absence of a protocol.
RESULTS
Data encompassing 11,568 bronchiolitis hospitalizations in 17 centers, for calendar years 2007 to 2010, were analyzed for this report. A total of 31 centers ever participated in the project; however, this report is restricted to centers who participated for the entirety of the project from 2008 through 2010, and who consented to have their data reported. Specifically, 18 centers met inclusion criteria and 1 center opted out of the project, leaving the 17 centers described in Table 1. The overall network makeup shifted each year, but was always more than 80% non‐freestanding children's hospitals and approximately 30% urban, as defined as located in a population center of more than 1 million. A large majority of the participants did not have a local bronchiolitis protocol or guideline at the start of the project, although 88% of participants adopted some form of protocolized care by 2010. Calendar years 2007 and 2008 served as our network baseline, with most interventions (in institutions where they occurred) begun by calendar year 2009. The level of intervention varied greatly among institutions, with a few institutions doing nothing more than benchmarking their performance.
| Participating Centers (Alphabetically by State) | Type of Facility | Average Yearly Bronchiolitis Admissions | Approximate Medicaid (%) | Guideline Prior to Joining Project? | Location |
|---|---|---|---|---|---|
| |||||
| Scottsdale Healthcare Scottsdale, AZ | PEDS | 133 | 26 | No | Suburban |
| Shands Hospital for Children at the University of Florida Gainesville, FL | CHWH | 107 | 59 | No | Suburban |
| Children's Hospital of Illinois Peoria, IL | CHWH | 97 | 15 | No | Suburban |
| Kentucky Children's Hospital Lexington, KY | CHWH | 135 | 60 | Yes | Suburban |
| Our Lady of the Lake Baton Rouge, LA | CHWH | 138 | 70 | No | Suburban |
| The Barbara Bush Children's Hospital Portland, ME | CHWH | 31 | 41 | Yes | Suburban |
| Franklin Square Hospital Center Baltimore, MD | PEDS | 66 | 40 | No | Suburban |
| Anne Arundel Medical Center Annapolis, MD | CHWH | 56 | 36 | No | Suburban |
| Children's Hospital at Montefiore Bronx, NY | CHWH | 220 | 65 | No | Urban |
| Mission Children's Hospital Asheville, NC | CHWH | 112 | 21 | Yes | Suburban |
| Cleveland Clinic Children's Hospital Cleveland, OH | CHWH | 58 | 24 | Yes | Urban |
| Palmetto Health Children's Hospital Columbia, SC | CHWH | 181 | 60 | No | Suburban |
| East Tennessee Children's Hospital Knoxville, TN | FSCH | 373 | 60 | No | Suburban |
| Texas Children's Hospital Houston, TX | FSCH | 619 | 60 | Yes | Urban |
| Christus Santa Rosa Children's Hospital San Antonio, TX | CHWH | 390 | 71 | No | Urban |
| Children's Hospital of The Kings' Daughters Norfolk, VA | FSCH | 303 | 60 | No | Suburban |
| Children's Hospital of Richmond Richmond, VA | CHWH | 40 | 60 | No | Urban |
Mean length of stay (LOS), readmission rates, and variable direct costs did not differ significantly during the project time period. Mean LOS for the network ranged from a low of 2.4 days (IQR, 2.22.8 days) to a high of 2.7 days (IQR, 2.43.1 days), and mean readmission rates ranged from 1.2% (IQR, 0.7%1.8%) to 1.7% (IQR, 0.7%2.5%) during the project. Mean variable direct costs ranged from $1639 (IQR, $1383$1864) to $1767 (IQR, $1365$2320).
Table 2 describes the mean overall utilization of bronchodilators, chest radiography, RSV testing, steroids, and chest physiotherapy among the group from 2007 to 2010. By 2010, we saw a 46% decline in the volume of bronchodilator used within the network, a 3.6 (95% confidence interval [CI] 1.45.8) dose per patient absolute decrease (P < 0.01). We also saw a 12% (95% CI 5%25%) absolute decline in the overall percentage of patients exposed to any bronchodilator (P < 0.01). Finally, there was a 10% (95% CI 3%18%) absolute decline in the overall utilization of any chest physiotherapy (P < 0.01). The project did not demonstrate a significant impact on utilization of corticosteroids, chest radiography, or viral testing, although several centers achieved significant decreases on a local level (data not shown).
| Utilization Measure | 2007 | 2008 | 2009 | 2010 |
|---|---|---|---|---|
| No. (IQR) | No. (IQR) | No. (IQR) | No. (IQR) | |
| ||||
| Bronchodilator doses per patient (P < 0.01) | 7.9 (4.69.8) | 6.4 (4.08.4) | 5.7 (3.67.6) | 4.3 (3.05.9) |
| Any bronchodilators (P < 0.01) | 70% (59%83%) | 67% (56%77%) | 68% (61%76%) | 58% (46%69%) |
| Chest physiotherapy (P < 0.01) | 14% (5%19%) | 10% (1%8%) | 7% (2%6%) | 4% (1%7%) |
| Chest radiography (P = NS) | 64% (54%81%) | 66% (55%79%) | 64% (60%73%) | 59% (50%73%) |
| Any steroids (P = NS) | 21% (14%26%) | 20% (15%28%) | 21% (14%22%) | 16% (13%25%) |
| RSV testing (P = NS) | 64% (52%84%) | 61% (49%78%) | 62% (50%78%) | 57% (44%75%) |
We analyzed within‐hospital trends as well. Figure 1 describes intra‐hospital change over the course of the project for overall bronchodilator usage. In this analysis, 15 of 17 hospitals (88%) achieved a significant decrease in overall bronchodilator utilization by 2010. (Hospitals 27 and 29 were unable to provide 2007 baseline data.) For doses per patient, 15 of 17 institutions provided data on this measure, and 12 of 15 (80%) achieved significant decreases (Figure 2). Of note, the institutions failing to achieve significant decreases in bronchodilator utilization entered the project with utilization rates that were already significantly below network mean at the start of the project. (Institutions failing to improve are denoted with an asterisk in Figures 1 and 2.) Since most institutions made significant improvements in bronchodilator utilization over time, we looked for correlates of failure to decrease utilization. The strongest association for failure to improve during the project period was use of a protocol prior to joining the network (odds ratio [OR] = 11, 95% CI 261).
DISCUSSION
We demonstrated a significant decline in utilization of bronchodilators and chest physiotherapy in inpatient bronchiolitis within a voluntary quality collaborative focused on benchmarking without employing intensive interventions. This observation is important in that it demonstrates real‐world efficacy for our methods. Prior literature has clearly demonstrated that local bronchiolitis guidelines are effective; however, our data on over 11,000 hospitalizations from a broad array of inpatient settings continue to show a high rate of overutilization. We facilitated dissemination and sharing of guideline‐related tools primarily electronically, and capitalized on perceived peer‐group frustration with inefficient management of a high‐volume, high‐utilization disease. While the project leadership had varying degrees of advanced training in quality improvement methodology, the majority of the site leaders were self‐taught and trained while on the job. Our inclusive collaborative had some success using pragmatic and low‐resource methods which we believe is a novel approach to the issue of overutilization.
These considerations are highlighted given the pressing need to find more efficient and scalable means of bending the cost curve of healthcare in the United States. Learning collaboratives are a relatively new model for improvement, with some history in pediatrics,31, 32 and are attractive because of their potential to generate both widespread capacity for change as well as direct improvement. Both cystic fibrosis31 and neonatology collaboratives32 have been celebrated for their positive impacts on children's healthcare, and both are testaments to the power inherent in creating a community of like‐minded individuals. One of the most popular models for learning collaboratives remains the Institute for Healthcare Improvement's Breakthrough Series; however, this model is resource intensive in that it typically involves large teams and several yearly face‐to‐face meetings, with significant monetary investment on the part of hospitals. On the other hand, virtual collaboratives have produced mixed results with respect to quality improvement,33 so there is a continued need to maximize our learning about what works efficiently. Our collaborative was able to successfully disseminate tools developed in large academic institutions to be applied in smaller and more varied settings, where resources for quality improvement activities were limited.
One possible reason for any successes in this project was the existence of a well‐known guideline for the management of bronchiolitis published by the American Academy of Pediatrics in 2006. This guideline recommends primarily symptomatic care, and has a statement supporting the contention that routine use of our targeted therapies is unnecessary. It allows for a trial of bronchodilator, but specifically states that all trials should be accompanied by the use of an objective measure of improvement (typically interpreted to mean a respiratory distress score). A guideline sanctioned by an important national organization of pediatricians was invaluable, and we believe that it should serve as a basis for any nationally promoted inpatient quality measure for this very common pediatric illness. The existence of the AAP guideline also highlights the possibility that our results are merely representative of secular trends in utilization in bronchiolitis care, since we had no control group. The available literature on national guidelines has shown mixed and quite modest impacts in other countries.28, 34 Most of our group took active steps to operationalize the guidelines as part of their participation in this collaborative, though they might have done similar work anyway due to the increasing importance of quality improvement in hospitalist culture over the years of the project.
The project did not demonstrate any impact on steroid utilization, or on rates of obtaining chest radiography or viral testing, despite expressly targeting these widely overused interventions. These modalities are often employed in the emergency department and, as a collaborative of pediatric hospitalists, we did not have specific emergency department participation which we recognize as a major weakness and potential impediment to further progress. We hope to collaborate with our respective emergency departments in the future on these particular measures. We also noted that many institutions were inflexible about foregoing viral testing, due to infection control issues arising from the need to cohort patients in shared rooms based on RSV positivity during the busy winter months. A few institutions were able to alter their infection control policies using the strategy of assuming all children with bronchiolitis had RSV (ie, choosing to use both contact precautions and to wear a mask when entering rooms), though this was not universally popular. Finally, we recognize a missed opportunity in not collecting dose per patient level data for steroids, which might have allowed us to distinguish hospitals with ongoing inpatient utilization of steroids from those with only emergency department usage.
Another significant limitation of this project was the lack of annual assessments of data quality. However, we believe our findings are still useful and important, even with this obvious limitation. Most quality improvement work is done using hospital‐supplied data gleaned from administrative databases, exactly the sources used in this project. Key decisions are made in most hospitals in the country based on data of similar quality. Further limitations of the project relate to the issue of replicability. The disease process we addressed is a major source of frustration to pediatric hospitalists, and our sample likely consisted of the most highly motivated individuals, as they sought out and joined a group with the express purpose of decreasing unnecessary utilization in bronchiolitis. We believe this limitation highlights the likely need for quality measures to emerge organically out of a community of practice when resources are limited, ie, we do not believe we would have had significant success using our methods with an unpopular or externally imposed quality measure.
Although a detailed analysis of costs was beyond the scope of the current project, it is possible that decreased utilization resulted in overall cost savings, despite the fact that our data did not demonstrate a significant change in network‐level average variable direct costs related to bronchiolitis. It has been suggested that such savings may be particularly difficult to demonstrate objectively, especially when the principal costs targeted are labor‐based.35 LOS did not significantly vary during the project, whereas the use of labor‐intensive therapies like nebulized bronchodilators and chest physiotherapy declined. It is, however, quite possible that the decreased utilization we demonstrated was accompanied by a concomitant increase in utilization of other unmeasured therapies.
CONCLUSIONS
A volunteer, peer‐group collaborative focused on benchmarking decreased utilization of bronchodilators and chest physiotherapy in bronchiolitis, though had no impact on overuse of other unnecessary therapies and tests.
Acknowledgements
The following authors have participated in the production of this work by: Conception and design of project: Ralston, Garber, Narang, Shen, Pate; Acquisition of data: Ralston, Garber, Narang, Pope, Lossius, Croland, Bennett, Jewell, Krugman, Robbins, Nazif, Liewehr, Miller, Marks, Pappas, Pardue, Quinonez, Fine, Ryan; Analysis and interpretation of data: Ralston, Garber, Narang, Shen, Pate, Pope, Lossius, Croland, Bennett, Jewell, Krugman, Robbins, Nazif, Liewehr, Miller, Marks, Pappas, Pardue, Quinonez, Fine, Ryan; Drafting the article: Ralston, Garber, Shen; Revising it critically for important intellectual content, and final approval of the version to be published: Ralston, Garber, Narang, Shen, Pate, Pope, Lossius, Croland, Bennett, Jewell, Krugman, Robbins, Nazif, Liewehr, Miller, Marks, Pappas, Pardue, Quinonez, Fine, Ryan.
Disclosures: The VIP network receives financial/administrative support from the American Academy of Pediatrics through the Quality Improvement Innovations Network. Dr Ralston receives financial support from the American Academy of Pediatrics as editor of the AAP publication, Hospital Pediatrics. Drs Garber, Narang, Shen, Pate, Pope, Lossius, Croland, Bennett, Jewell, Krugman, Robbins, Nazif, Liewehr, Miller, Marks, Pappas, Pardue, Quinonez, Fine, and Ryan report no conflicts.
- HCUPnet. Kids Inpatient Database 2006. Available at: http://hcupnet.ahrq.gov/. Accessed February 6, 2011.
- , . Recent trends in severe respiratory syncytial virus (RSV) among US infants, 1997 to 2000. J Pediatr. 2003;143:S127–S132.
- , , , , . Infectious disease hospitalizations among infants in the United States. Pediatrics. 2008;121:244–252.
- , . Bronchiolitis. Lancet. 2006;368:312–322.
- , , , , . Rates of hospitalization for respiratory syncytial virus infection among children in Medicaid. J Pediatr. 2000;137:865–870.
- Subcommittee on the Diagnosis and Management of Bronchiolitis, 2004–2006. Clinical practice guideline: diagnosis and management of bronchiolitis. Pediatrics. 2006;118:1774–1793.
- , , . Bronchiolitis in US emergency departments 1992 to 2000: epidemiology and practice variation. Pediatr Emerg Care. 2005;21:242–247.
- , , , et al. Practice variation among pediatric emergency departments in the treatment of bronchiolitis. Acad Emerg Med. 2004;11:353–360.
- , , , . Bronchiolitis management preferences and the influence of pulse oximetry and respiratory rate on the decision to admit. Pediatrics. 2003;111:e45–e51.
- , , , , , . Variations in management of common inpatient pediatric illnesses: hospitalists and community pediatricians. Pediatrics. 2006;118:441–447.
- , , , , . Variation in pediatric hospitalists' use of proven and unproven therapies: a study from the Pediatric Research in Inpatient Settings (PRIS) network. J Hosp Med. 2008;3:292–298.
- , , , et al. Pediatric Investigators Collaborative Network on Infections in Canada (PICNIC) study of admission and management variation in patients hospitalized with respiratory syncytial viral lower respiratory tract infection. J Pediatr. 1996;129:390–395.
- , , , , . Effect of practice variation on resource utilization in infants hospitalized for viral lower respiratory illness. Pediatrics. 2001;108:851–855.
- , . Bronchodilators for bronchiolitis. Cochrane Database Syst Rev. 2010 Dec 8;(12):CD001266.
- , , . Chest physiotherapy for acute bronchiolitis in pediatric patients between 0 and 24 months old. Cochrane Database Syst Rev. 2007 Jan 24;(1):CD004873.
- , , , et al. Epinephrine for bronchiolitis. Cochrane Database Syst Rev. 2011 Jun 15;(6):CD003123.
- , , , et al. Glucocorticoids for acute bronchiolitis in infants and young children. Cochrane Database Syst Rev. 2010 Oct 6;(10):CD004878.
- , , , . Efficacy of interventions for bronchiolitis in critically ill infants: a systematic review and meta‐analysis. Pediatr Crit Care Med. 2004;5:482–489.
- , , . Direct medical costs of bronchiolitis hospitalizations in the United States. Pediatrics. 2006;118(6):2418–2423.
- , , , et al. Evaluation of an evidence‐based guideline for bronchiolitis. Pediatrics. 1999;104(6):1334–1341.
- , , . Standardizing the care of bronchiolitis. Arch Pediatr Adolesc Med. 1998;152(8):739–744.
- , , , , , . Decreasing overuse of therapies in the treatment of bronchiolitis by incorporating evidence at the point of care. J Pediatr. 2004;144:703–710.
- , , , , , . Effect of point of care information on inpatient management of bronchiolitis. BMC Pediatr. 2007;7:4.
- , , , et al. A clinical pathway for bronchiolitis is effective in reducing readmission rates. J Pediatr. 2005;147:622–626.
- , , , et al. Sustaining the implementation of an evidence‐based guideline for bronchiolitis. Arch Pediatr Adolesc Med. 2000;154:1001–1007.
- , , , , , . Assessment of the French Consensus Conference for Acute Viral Bronchiolitis on outpatient management: progress between 2003 and 2008 [in French]. Arch Pediatr. 2010;17:125–131.
- , , , , , . Impact of a bronchiolitis guideline: a multisite demonstration project. Chest. 2002;121:1789–1797.
- , , , . Management of acute bronchiolitis: can evidence based guidelines alter clinical practice? Thorax. 2008;63:1103–1109.
- , . The “3 T's” roadmap to transform US health care: the “how” of high quality care. JAMA. 2008;299(19):2319–2321.
- The VIP Network. Available at: http://www.vipnetwork.webs.com. Accessed October 5, 2010.
- , . A story of success: continuous quality improvement in cystic fibrosis in the USA. Thorax. 2011;66:1106–1168.
- , , , , , . NICU practices and outcomes associated with 9 years of quality improvement collaboratives. Pediatrics. 2010;125:437–446.
- , , , et al. Quality improvement projects target health care‐associated infections: comparing virtual collaborative and toolkit approaches. J Hosp Med. 2011;6:271–278.
- , , , , . Impact of consensus development conference guidelines on primary care of bronchiolitis: are national guidelines being followed? J Eval Clin Pract. 2007;13:651–656.
- , , , . The savings illusion—why clinical quality improvement fails to deliver bottom‐line results. N Engl J Med. 2011;365:e48.
- HCUPnet. Kids Inpatient Database 2006. Available at: http://hcupnet.ahrq.gov/. Accessed February 6, 2011.
- , . Recent trends in severe respiratory syncytial virus (RSV) among US infants, 1997 to 2000. J Pediatr. 2003;143:S127–S132.
- , , , , . Infectious disease hospitalizations among infants in the United States. Pediatrics. 2008;121:244–252.
- , . Bronchiolitis. Lancet. 2006;368:312–322.
- , , , , . Rates of hospitalization for respiratory syncytial virus infection among children in Medicaid. J Pediatr. 2000;137:865–870.
- Subcommittee on the Diagnosis and Management of Bronchiolitis, 2004–2006. Clinical practice guideline: diagnosis and management of bronchiolitis. Pediatrics. 2006;118:1774–1793.
- , , . Bronchiolitis in US emergency departments 1992 to 2000: epidemiology and practice variation. Pediatr Emerg Care. 2005;21:242–247.
- , , , et al. Practice variation among pediatric emergency departments in the treatment of bronchiolitis. Acad Emerg Med. 2004;11:353–360.
- , , , . Bronchiolitis management preferences and the influence of pulse oximetry and respiratory rate on the decision to admit. Pediatrics. 2003;111:e45–e51.
- , , , , , . Variations in management of common inpatient pediatric illnesses: hospitalists and community pediatricians. Pediatrics. 2006;118:441–447.
- , , , , . Variation in pediatric hospitalists' use of proven and unproven therapies: a study from the Pediatric Research in Inpatient Settings (PRIS) network. J Hosp Med. 2008;3:292–298.
- , , , et al. Pediatric Investigators Collaborative Network on Infections in Canada (PICNIC) study of admission and management variation in patients hospitalized with respiratory syncytial viral lower respiratory tract infection. J Pediatr. 1996;129:390–395.
- , , , , . Effect of practice variation on resource utilization in infants hospitalized for viral lower respiratory illness. Pediatrics. 2001;108:851–855.
- , . Bronchodilators for bronchiolitis. Cochrane Database Syst Rev. 2010 Dec 8;(12):CD001266.
- , , . Chest physiotherapy for acute bronchiolitis in pediatric patients between 0 and 24 months old. Cochrane Database Syst Rev. 2007 Jan 24;(1):CD004873.
- , , , et al. Epinephrine for bronchiolitis. Cochrane Database Syst Rev. 2011 Jun 15;(6):CD003123.
- , , , et al. Glucocorticoids for acute bronchiolitis in infants and young children. Cochrane Database Syst Rev. 2010 Oct 6;(10):CD004878.
- , , , . Efficacy of interventions for bronchiolitis in critically ill infants: a systematic review and meta‐analysis. Pediatr Crit Care Med. 2004;5:482–489.
- , , . Direct medical costs of bronchiolitis hospitalizations in the United States. Pediatrics. 2006;118(6):2418–2423.
- , , , et al. Evaluation of an evidence‐based guideline for bronchiolitis. Pediatrics. 1999;104(6):1334–1341.
- , , . Standardizing the care of bronchiolitis. Arch Pediatr Adolesc Med. 1998;152(8):739–744.
- , , , , , . Decreasing overuse of therapies in the treatment of bronchiolitis by incorporating evidence at the point of care. J Pediatr. 2004;144:703–710.
- , , , , , . Effect of point of care information on inpatient management of bronchiolitis. BMC Pediatr. 2007;7:4.
- , , , et al. A clinical pathway for bronchiolitis is effective in reducing readmission rates. J Pediatr. 2005;147:622–626.
- , , , et al. Sustaining the implementation of an evidence‐based guideline for bronchiolitis. Arch Pediatr Adolesc Med. 2000;154:1001–1007.
- , , , , , . Assessment of the French Consensus Conference for Acute Viral Bronchiolitis on outpatient management: progress between 2003 and 2008 [in French]. Arch Pediatr. 2010;17:125–131.
- , , , , , . Impact of a bronchiolitis guideline: a multisite demonstration project. Chest. 2002;121:1789–1797.
- , , , . Management of acute bronchiolitis: can evidence based guidelines alter clinical practice? Thorax. 2008;63:1103–1109.
- , . The “3 T's” roadmap to transform US health care: the “how” of high quality care. JAMA. 2008;299(19):2319–2321.
- The VIP Network. Available at: http://www.vipnetwork.webs.com. Accessed October 5, 2010.
- , . A story of success: continuous quality improvement in cystic fibrosis in the USA. Thorax. 2011;66:1106–1168.
- , , , , , . NICU practices and outcomes associated with 9 years of quality improvement collaboratives. Pediatrics. 2010;125:437–446.
- , , , et al. Quality improvement projects target health care‐associated infections: comparing virtual collaborative and toolkit approaches. J Hosp Med. 2011;6:271–278.
- , , , , . Impact of consensus development conference guidelines on primary care of bronchiolitis: are national guidelines being followed? J Eval Clin Pract. 2007;13:651–656.
- , , , . The savings illusion—why clinical quality improvement fails to deliver bottom‐line results. N Engl J Med. 2011;365:e48.
Copyright © 2012 Society of Hospital Medicine