User login
Can Lapatinib Prevent Brain Metastases from Breast Cancer? Data 'Inconclusive'
VIENNA – Mixed results in phase II and III clinical trials leave open the question of whether lapatinib can prevent brain metastases in women with HER2-positive breast cancer.
Lapatinib (Tykerb) did not decrease the development of brain metastases when compared with trastuzumab (Herceptin) – each added to capecitabine (Xeloda) – in the open-label phase III CEREBREL trial. The results were inconclusive, however, for the primary end point of the incidence of central nervous system events as a first sign of relapse.
Favorable findings were reported from the 45-patient phase II LANDSCAPE study. Two-thirds of patients had an objective CNS response to up-front lapatinib plus capecitabine in the single-arm study.
Investigators from both trials reported outcomes at the European Society for Medical Oncology Congress.
‘No Conclusion Can Be Made...’
In the CEREBREL trial, 251 women were treated with lapatinib in combination with capecitabine. Eight (3%) exhibited CNS progression as the first site of relapse. In comparison, 12 (5%) of 250 women given trastuzumab plus capecitabine exhibited CNS progression (P = .360).
The incidence of CNS progression at any time (7% vs. 6%, respectively) and the median time to first CNS progression (5.7 vs. 4.4 months) also did not differ significantly.

"No conclusion should be made from these results," said Dr. Xavier Pivot of the Université de Franche-Comté in Besançon, France.
Dr. Pivot noted that a very low rate of CNS events had occurred in the trial because of the stringent accrual process, undermining the conclusions that can be drawn.
Trial Excluded Asymptomatic Brain Metastases
"The CEREBREL study was a front-line study, but the problem was that asymptomatic brain metastases were being screened out of the population," Dr. Stephen Johnston, who was not involved the study, commented in an interview.
"The overall incidence of brain metastases that they found in the study was a lot lower than they were anticipating, so they were never going to meet their end point," added Dr. Johnston, a consultant medical oncologist and director of clinical research and development at the Royal Marsden and the Institute of Cancer Research in London.
CEREBREL enrolled 540 of a planned 650 women with HER2-positive metastatic breast cancer who had received prior treatment with an anthracycline or taxane but who had no CNS metastases. To ensure that no metastases were present, patients had a baseline MRI scan, with 20% of women excluded because they had asymptomatic lesions.
In total, 271 women received lapatinib (1,250 mg/day) plus capecitabine (2,000 mg/m2/day on days 1-14 every 21 days) and 269 trastuzumab (6 mg/kg every 21 days) plus capecitabine (2,500 mg/m2/day on days 1-14 every 21 days).
PFS Longer with Trastuzumab and Capecitabine
The trial results also showed that median progression-free survival (PFS) was longer in patients who received trastuzumab in combination with the chemotherapy than in those who received lapatinib (8 months vs. 6.6 months, hazard ratio 1.3, P = .021).
This effect dissipated, however, when prior treatment with trastuzumab was considered; it had been received by 62% of patients in the lapatinib-containing arm and 59% of patients in the trastuzumab-containing arm.
While there was no difference in PFS among patients who had previously been treated with trastuzumab, those who had never received the drug before the trial appeared to obtain a greater benefit.
Commenting on these data, Dr. Johnston noted that they do seem to suggest that the combination of lapatinib and capecitabine was not equivalent and was actually inferior to trastuzumab plus capecitabine.
Nevertheless, "I think the question about the effects of lapatinib on brain metastases is still relevant," he said.
"We’re doing a trial [LANTERN] of lapatinib-capecitabine versus continuing the trastuzumab and adding in capecitabine, to see if switching the HER2-targeting keeps the brain disease under control for longer," Dr. Johnston explained. "This is where lapatinib may still have a role."
LANDSCAPE Results Favorable
The primary hypothesis of the phase II LANDSCAPE study was that up-front treatment with lapatinib might help prevent brain metastasis in HER2-positive metastatic breast cancer and delay the need for whole-brain radiation and its associated neurotoxicity, said study investigator Dr. Thomas Bachelot, on behalf of the Unicancer Federation Française group.
Dr. Bachelot of INSERM in Lyon said the response and overall survival results compared favorably with published data for whole-brain radiotherapy (WBRT).
Two thirds (66%) of patients treated with lapatinib and capecitabine exhibited a CNS objective response: 46% achieved a reduction in brain metastases of 50%-80%, and 20% exhibited a reduction in brain metastases of 80% or more. The median time to progression was 5.5 months, and the median time to WBRT was 7.8 months. Median overall survival was 17 months.
"This strategy could help delay whole-brain radiotherapy and its associated [neurological] toxicity," Dr. Bachelot concluded, noting that the up-front use of lapatinib and capecitabine warrants further evaluation.
The first analysis of the LANDSCAPE trial was presented at the American Society of Clinical Oncology (ASCO) in 2011.
Both the CEREBREL and LANDSCAPE studies were supported by funding from GlaxoSmithKline. All authors have received research support or consultancy fees from GlaxoSmithKline and Roche. Dr. Bachelot and Dr. Johnston have also received consultancy fees from Novartis.
VIENNA – Mixed results in phase II and III clinical trials leave open the question of whether lapatinib can prevent brain metastases in women with HER2-positive breast cancer.
Lapatinib (Tykerb) did not decrease the development of brain metastases when compared with trastuzumab (Herceptin) – each added to capecitabine (Xeloda) – in the open-label phase III CEREBREL trial. The results were inconclusive, however, for the primary end point of the incidence of central nervous system events as a first sign of relapse.
Favorable findings were reported from the 45-patient phase II LANDSCAPE study. Two-thirds of patients had an objective CNS response to up-front lapatinib plus capecitabine in the single-arm study.
Investigators from both trials reported outcomes at the European Society for Medical Oncology Congress.
‘No Conclusion Can Be Made...’
In the CEREBREL trial, 251 women were treated with lapatinib in combination with capecitabine. Eight (3%) exhibited CNS progression as the first site of relapse. In comparison, 12 (5%) of 250 women given trastuzumab plus capecitabine exhibited CNS progression (P = .360).
The incidence of CNS progression at any time (7% vs. 6%, respectively) and the median time to first CNS progression (5.7 vs. 4.4 months) also did not differ significantly.
"No conclusion should be made from these results," said Dr. Xavier Pivot of the Université de Franche-Comté in Besançon, France.
Dr. Pivot noted that a very low rate of CNS events had occurred in the trial because of the stringent accrual process, undermining the conclusions that can be drawn.
Trial Excluded Asymptomatic Brain Metastases
"The CEREBREL study was a front-line study, but the problem was that asymptomatic brain metastases were being screened out of the population," Dr. Stephen Johnston, who was not involved the study, commented in an interview.
"The overall incidence of brain metastases that they found in the study was a lot lower than they were anticipating, so they were never going to meet their end point," added Dr. Johnston, a consultant medical oncologist and director of clinical research and development at the Royal Marsden and the Institute of Cancer Research in London.
CEREBREL enrolled 540 of a planned 650 women with HER2-positive metastatic breast cancer who had received prior treatment with an anthracycline or taxane but who had no CNS metastases. To ensure that no metastases were present, patients had a baseline MRI scan, with 20% of women excluded because they had asymptomatic lesions.
In total, 271 women received lapatinib (1,250 mg/day) plus capecitabine (2,000 mg/m2/day on days 1-14 every 21 days) and 269 trastuzumab (6 mg/kg every 21 days) plus capecitabine (2,500 mg/m2/day on days 1-14 every 21 days).
PFS Longer with Trastuzumab and Capecitabine
The trial results also showed that median progression-free survival (PFS) was longer in patients who received trastuzumab in combination with the chemotherapy than in those who received lapatinib (8 months vs. 6.6 months, hazard ratio 1.3, P = .021).
This effect dissipated, however, when prior treatment with trastuzumab was considered; it had been received by 62% of patients in the lapatinib-containing arm and 59% of patients in the trastuzumab-containing arm.
While there was no difference in PFS among patients who had previously been treated with trastuzumab, those who had never received the drug before the trial appeared to obtain a greater benefit.
Commenting on these data, Dr. Johnston noted that they do seem to suggest that the combination of lapatinib and capecitabine was not equivalent and was actually inferior to trastuzumab plus capecitabine.
Nevertheless, "I think the question about the effects of lapatinib on brain metastases is still relevant," he said.
"We’re doing a trial [LANTERN] of lapatinib-capecitabine versus continuing the trastuzumab and adding in capecitabine, to see if switching the HER2-targeting keeps the brain disease under control for longer," Dr. Johnston explained. "This is where lapatinib may still have a role."
LANDSCAPE Results Favorable
The primary hypothesis of the phase II LANDSCAPE study was that up-front treatment with lapatinib might help prevent brain metastasis in HER2-positive metastatic breast cancer and delay the need for whole-brain radiation and its associated neurotoxicity, said study investigator Dr. Thomas Bachelot, on behalf of the Unicancer Federation Française group.
Dr. Bachelot of INSERM in Lyon said the response and overall survival results compared favorably with published data for whole-brain radiotherapy (WBRT).
Two thirds (66%) of patients treated with lapatinib and capecitabine exhibited a CNS objective response: 46% achieved a reduction in brain metastases of 50%-80%, and 20% exhibited a reduction in brain metastases of 80% or more. The median time to progression was 5.5 months, and the median time to WBRT was 7.8 months. Median overall survival was 17 months.
"This strategy could help delay whole-brain radiotherapy and its associated [neurological] toxicity," Dr. Bachelot concluded, noting that the up-front use of lapatinib and capecitabine warrants further evaluation.
The first analysis of the LANDSCAPE trial was presented at the American Society of Clinical Oncology (ASCO) in 2011.
Both the CEREBREL and LANDSCAPE studies were supported by funding from GlaxoSmithKline. All authors have received research support or consultancy fees from GlaxoSmithKline and Roche. Dr. Bachelot and Dr. Johnston have also received consultancy fees from Novartis.
VIENNA – Mixed results in phase II and III clinical trials leave open the question of whether lapatinib can prevent brain metastases in women with HER2-positive breast cancer.
Lapatinib (Tykerb) did not decrease the development of brain metastases when compared with trastuzumab (Herceptin) – each added to capecitabine (Xeloda) – in the open-label phase III CEREBREL trial. The results were inconclusive, however, for the primary end point of the incidence of central nervous system events as a first sign of relapse.
Favorable findings were reported from the 45-patient phase II LANDSCAPE study. Two-thirds of patients had an objective CNS response to up-front lapatinib plus capecitabine in the single-arm study.
Investigators from both trials reported outcomes at the European Society for Medical Oncology Congress.
‘No Conclusion Can Be Made...’
In the CEREBREL trial, 251 women were treated with lapatinib in combination with capecitabine. Eight (3%) exhibited CNS progression as the first site of relapse. In comparison, 12 (5%) of 250 women given trastuzumab plus capecitabine exhibited CNS progression (P = .360).
The incidence of CNS progression at any time (7% vs. 6%, respectively) and the median time to first CNS progression (5.7 vs. 4.4 months) also did not differ significantly.
"No conclusion should be made from these results," said Dr. Xavier Pivot of the Université de Franche-Comté in Besançon, France.
Dr. Pivot noted that a very low rate of CNS events had occurred in the trial because of the stringent accrual process, undermining the conclusions that can be drawn.
Trial Excluded Asymptomatic Brain Metastases
"The CEREBREL study was a front-line study, but the problem was that asymptomatic brain metastases were being screened out of the population," Dr. Stephen Johnston, who was not involved the study, commented in an interview.
"The overall incidence of brain metastases that they found in the study was a lot lower than they were anticipating, so they were never going to meet their end point," added Dr. Johnston, a consultant medical oncologist and director of clinical research and development at the Royal Marsden and the Institute of Cancer Research in London.
CEREBREL enrolled 540 of a planned 650 women with HER2-positive metastatic breast cancer who had received prior treatment with an anthracycline or taxane but who had no CNS metastases. To ensure that no metastases were present, patients had a baseline MRI scan, with 20% of women excluded because they had asymptomatic lesions.
In total, 271 women received lapatinib (1,250 mg/day) plus capecitabine (2,000 mg/m2/day on days 1-14 every 21 days) and 269 trastuzumab (6 mg/kg every 21 days) plus capecitabine (2,500 mg/m2/day on days 1-14 every 21 days).
PFS Longer with Trastuzumab and Capecitabine
The trial results also showed that median progression-free survival (PFS) was longer in patients who received trastuzumab in combination with the chemotherapy than in those who received lapatinib (8 months vs. 6.6 months, hazard ratio 1.3, P = .021).
This effect dissipated, however, when prior treatment with trastuzumab was considered; it had been received by 62% of patients in the lapatinib-containing arm and 59% of patients in the trastuzumab-containing arm.
While there was no difference in PFS among patients who had previously been treated with trastuzumab, those who had never received the drug before the trial appeared to obtain a greater benefit.
Commenting on these data, Dr. Johnston noted that they do seem to suggest that the combination of lapatinib and capecitabine was not equivalent and was actually inferior to trastuzumab plus capecitabine.
Nevertheless, "I think the question about the effects of lapatinib on brain metastases is still relevant," he said.
"We’re doing a trial [LANTERN] of lapatinib-capecitabine versus continuing the trastuzumab and adding in capecitabine, to see if switching the HER2-targeting keeps the brain disease under control for longer," Dr. Johnston explained. "This is where lapatinib may still have a role."
LANDSCAPE Results Favorable
The primary hypothesis of the phase II LANDSCAPE study was that up-front treatment with lapatinib might help prevent brain metastasis in HER2-positive metastatic breast cancer and delay the need for whole-brain radiation and its associated neurotoxicity, said study investigator Dr. Thomas Bachelot, on behalf of the Unicancer Federation Française group.
Dr. Bachelot of INSERM in Lyon said the response and overall survival results compared favorably with published data for whole-brain radiotherapy (WBRT).
Two thirds (66%) of patients treated with lapatinib and capecitabine exhibited a CNS objective response: 46% achieved a reduction in brain metastases of 50%-80%, and 20% exhibited a reduction in brain metastases of 80% or more. The median time to progression was 5.5 months, and the median time to WBRT was 7.8 months. Median overall survival was 17 months.
"This strategy could help delay whole-brain radiotherapy and its associated [neurological] toxicity," Dr. Bachelot concluded, noting that the up-front use of lapatinib and capecitabine warrants further evaluation.
The first analysis of the LANDSCAPE trial was presented at the American Society of Clinical Oncology (ASCO) in 2011.
Both the CEREBREL and LANDSCAPE studies were supported by funding from GlaxoSmithKline. All authors have received research support or consultancy fees from GlaxoSmithKline and Roche. Dr. Bachelot and Dr. Johnston have also received consultancy fees from Novartis.
AT THE EUROPEAN SOCIETY FOR MEDICAL ONCOLOGY CONGRESS
Major Findings: The primary end point of CNS as first site of relapse was no different comparing lapatinib-capecitabine (3%) vs. trastuzumab-capecitabine (5%) in the CEREBREL trial. The LANDSCAPE study showed a CNS objective response in 66% of patients treated with up-front lapatinib plus capecitabine.
Data Source: CEREBREL was an open-label phase III study, and LANDSCAPE was a phase II study. Both enrolled women with metastatic breast cancer.
Disclosures: Both studies were supported by funding from GlaxoSmithKline. All authors have received research support or consultancy fees from GlaxoSmithKline and Roche. Dr. Bachelot and Dr. Johnston have also received consultancy fees from Novartis.

Society of Hospital Medicine Joins Fight to Delay Medicare Cuts that Reduce Pay for Hospitalists
SHM has joined scores of medical societies pushing Congress to stop pending cuts to Medicare that would directly impact hospitalists.
Scheduled to go into effect at the start of the New Year, the cuts include sequestration, which would reduce hospitalists' Medicare payments by 2%, and slash funding to the National Institutes of Health (NIH) and the Centers for Disease Control and Prevention (CDC). This is in addition to a 27% cut to Medicare physician payment rates resulting from Medicare's sustainable growth rate (SGR) formula.
In a letter last month to congressional leaders [PDF], and an accompanying note to society members, SHM said hospitalists need to lobby legislators "to find a reasonable and measured solution to deficit reduction that does not include arbitrary across-the-board cuts to Medicare providers."
"Congress needs to know we're not happy," says SHM board member Eric Siegal, MD, SFHM, board liaison SHM's Public Policy Committee. "The only way that we are going to get them to change their behavior is if enough of us mobilize, and make enough noise to make it clear that we are not going to stand for this anymore."
Dr. Siegal says that because Congress has repeatedly delayed draconian cuts, there is a general consensus that another delay is likely. But Dr. Siegal also notes lobbying is still necessary to ensure that will happen. SHM has previously supported a meaningful replacement to the SGR, which has yet to receive significant action in Congress.
"What the entire healthcare community needs to push for is a solution," Dr. Siegal adds. "It's very hard to develop any kind of a strategy for how you're going to deliver care if every X number of months you have to worry [whether] you're going to take a massive cut in your compensation."
SHM has joined scores of medical societies pushing Congress to stop pending cuts to Medicare that would directly impact hospitalists.
Scheduled to go into effect at the start of the New Year, the cuts include sequestration, which would reduce hospitalists' Medicare payments by 2%, and slash funding to the National Institutes of Health (NIH) and the Centers for Disease Control and Prevention (CDC). This is in addition to a 27% cut to Medicare physician payment rates resulting from Medicare's sustainable growth rate (SGR) formula.
In a letter last month to congressional leaders [PDF], and an accompanying note to society members, SHM said hospitalists need to lobby legislators "to find a reasonable and measured solution to deficit reduction that does not include arbitrary across-the-board cuts to Medicare providers."
"Congress needs to know we're not happy," says SHM board member Eric Siegal, MD, SFHM, board liaison SHM's Public Policy Committee. "The only way that we are going to get them to change their behavior is if enough of us mobilize, and make enough noise to make it clear that we are not going to stand for this anymore."
Dr. Siegal says that because Congress has repeatedly delayed draconian cuts, there is a general consensus that another delay is likely. But Dr. Siegal also notes lobbying is still necessary to ensure that will happen. SHM has previously supported a meaningful replacement to the SGR, which has yet to receive significant action in Congress.
"What the entire healthcare community needs to push for is a solution," Dr. Siegal adds. "It's very hard to develop any kind of a strategy for how you're going to deliver care if every X number of months you have to worry [whether] you're going to take a massive cut in your compensation."
SHM has joined scores of medical societies pushing Congress to stop pending cuts to Medicare that would directly impact hospitalists.
Scheduled to go into effect at the start of the New Year, the cuts include sequestration, which would reduce hospitalists' Medicare payments by 2%, and slash funding to the National Institutes of Health (NIH) and the Centers for Disease Control and Prevention (CDC). This is in addition to a 27% cut to Medicare physician payment rates resulting from Medicare's sustainable growth rate (SGR) formula.
In a letter last month to congressional leaders [PDF], and an accompanying note to society members, SHM said hospitalists need to lobby legislators "to find a reasonable and measured solution to deficit reduction that does not include arbitrary across-the-board cuts to Medicare providers."
"Congress needs to know we're not happy," says SHM board member Eric Siegal, MD, SFHM, board liaison SHM's Public Policy Committee. "The only way that we are going to get them to change their behavior is if enough of us mobilize, and make enough noise to make it clear that we are not going to stand for this anymore."
Dr. Siegal says that because Congress has repeatedly delayed draconian cuts, there is a general consensus that another delay is likely. But Dr. Siegal also notes lobbying is still necessary to ensure that will happen. SHM has previously supported a meaningful replacement to the SGR, which has yet to receive significant action in Congress.
"What the entire healthcare community needs to push for is a solution," Dr. Siegal adds. "It's very hard to develop any kind of a strategy for how you're going to deliver care if every X number of months you have to worry [whether] you're going to take a massive cut in your compensation."
In the Literature: Research You Need to Know
Clinical question: What is the impact, and sustainability, of chlorhexidine bathing on central-venous-catheter-associated bloodstream infections?
Background: Chlorhexidine bathing has been associated with reductions in healthcare-associated bloodstream infections, including vancomycin-resistant enterococci and methicillin-resistant Staphylococcus aureus. No prospective studies have evaluated the impact and sustainability of chlorhexidine bathing.
Study design: Prospective, three-phase study.
Setting: Medical-surgical ICUs and respiratory-care units at five New York hospitals.
Synopsis: In the pre-intervention phase (six to nine months, 1,808 admissions), patients were bathed with soap and water or nonmedicated bathing cloths. In the intervention phase (eight months, 1,832 admissions), patients were bathed with 2% chlorhexidine cloths. In the post-intervention phase (12 months, 2,834 admissions), chlorhexidine bathing was continued without oversight by researchers.
During the intervention phase, there were significantly fewer central-venous-catheter-associated bloodstream infections (2.6/1,000 catheter days vs. 6.4/1,000 pre-intervention). The reductions in bloodstream infections were sustained during the post-intervention period (2.9/1,000 catheter days). Compliance with chlorhexidine bathing was 82% and 88% during the intervention and post-intervention phases, and was well tolerated by the patients.
Limitations of this study include lack of patient-specific data and severity of illness data, as well as lack of randomization and blinding. Although not evaluated in this study, the savings associated with decreased bloodstream infections likely outweigh the cost of chlorhexidine bathing.
Bottom line: Chlorhexidine bathing is a well-tolerated, sustainable intervention that significantly reduces central-venous-catheter-associated bloodstream infections.
Citation: Montecalvo MA, McKenna D, Yarrish R, et al. Chlorhexidine bathing to reduce central venous catheter-associated bloodstream infection: impact and sustainability.Am J Med. 2012;125(5):505-511.
For more physician reviews of recent HM-relevant literature, visit our website.
Clinical question: What is the impact, and sustainability, of chlorhexidine bathing on central-venous-catheter-associated bloodstream infections?
Background: Chlorhexidine bathing has been associated with reductions in healthcare-associated bloodstream infections, including vancomycin-resistant enterococci and methicillin-resistant Staphylococcus aureus. No prospective studies have evaluated the impact and sustainability of chlorhexidine bathing.
Study design: Prospective, three-phase study.
Setting: Medical-surgical ICUs and respiratory-care units at five New York hospitals.
Synopsis: In the pre-intervention phase (six to nine months, 1,808 admissions), patients were bathed with soap and water or nonmedicated bathing cloths. In the intervention phase (eight months, 1,832 admissions), patients were bathed with 2% chlorhexidine cloths. In the post-intervention phase (12 months, 2,834 admissions), chlorhexidine bathing was continued without oversight by researchers.
During the intervention phase, there were significantly fewer central-venous-catheter-associated bloodstream infections (2.6/1,000 catheter days vs. 6.4/1,000 pre-intervention). The reductions in bloodstream infections were sustained during the post-intervention period (2.9/1,000 catheter days). Compliance with chlorhexidine bathing was 82% and 88% during the intervention and post-intervention phases, and was well tolerated by the patients.
Limitations of this study include lack of patient-specific data and severity of illness data, as well as lack of randomization and blinding. Although not evaluated in this study, the savings associated with decreased bloodstream infections likely outweigh the cost of chlorhexidine bathing.
Bottom line: Chlorhexidine bathing is a well-tolerated, sustainable intervention that significantly reduces central-venous-catheter-associated bloodstream infections.
Citation: Montecalvo MA, McKenna D, Yarrish R, et al. Chlorhexidine bathing to reduce central venous catheter-associated bloodstream infection: impact and sustainability.Am J Med. 2012;125(5):505-511.
For more physician reviews of recent HM-relevant literature, visit our website.
Clinical question: What is the impact, and sustainability, of chlorhexidine bathing on central-venous-catheter-associated bloodstream infections?
Background: Chlorhexidine bathing has been associated with reductions in healthcare-associated bloodstream infections, including vancomycin-resistant enterococci and methicillin-resistant Staphylococcus aureus. No prospective studies have evaluated the impact and sustainability of chlorhexidine bathing.
Study design: Prospective, three-phase study.
Setting: Medical-surgical ICUs and respiratory-care units at five New York hospitals.
Synopsis: In the pre-intervention phase (six to nine months, 1,808 admissions), patients were bathed with soap and water or nonmedicated bathing cloths. In the intervention phase (eight months, 1,832 admissions), patients were bathed with 2% chlorhexidine cloths. In the post-intervention phase (12 months, 2,834 admissions), chlorhexidine bathing was continued without oversight by researchers.
During the intervention phase, there were significantly fewer central-venous-catheter-associated bloodstream infections (2.6/1,000 catheter days vs. 6.4/1,000 pre-intervention). The reductions in bloodstream infections were sustained during the post-intervention period (2.9/1,000 catheter days). Compliance with chlorhexidine bathing was 82% and 88% during the intervention and post-intervention phases, and was well tolerated by the patients.
Limitations of this study include lack of patient-specific data and severity of illness data, as well as lack of randomization and blinding. Although not evaluated in this study, the savings associated with decreased bloodstream infections likely outweigh the cost of chlorhexidine bathing.
Bottom line: Chlorhexidine bathing is a well-tolerated, sustainable intervention that significantly reduces central-venous-catheter-associated bloodstream infections.
Citation: Montecalvo MA, McKenna D, Yarrish R, et al. Chlorhexidine bathing to reduce central venous catheter-associated bloodstream infection: impact and sustainability.Am J Med. 2012;125(5):505-511.
For more physician reviews of recent HM-relevant literature, visit our website.
Anti-TNF Resistant Crohn's Disease May Respond to Ustekinumab
Ustekinumab induced a clinical response in patients with moderate to severe Crohn’s disease that was resistant to tumor necrosis factor antagonists, in a phase IIb clinical trial published online Oct. 17 in the New England Journal of Medicine.
However, the agent did not improve remission rates, compared with placebo, said Dr. William J. Sandborn, professor of medicine and chief of the division of gastroenterology at the University of California San Diego, La Jolla, and his associates.

"A sizable proportion" of patients with moderate to severe Crohn’s disease do not respond to TNF antagonists, have an unsustained response, or must discontinue the medications because of adverse effects. After ustekinumab showed efficacy in such patients in a phase IIa clinical study, Dr. Sandborn and his colleagues performed a 36-week double-blind phase II2b trial in 526 adults at 153 medical centers in 12 countries.
Ustekinumab, a human IgG monoclonal antibody that inhibits the receptors for interleukin-12 and interleukin-23 on T cells, natural killer cells, and antigen-presenting cells, has Food and Drug Administration approval for use in plaque psoriasis. This clinical trial was sponsored by an affiliate of the manufacturer, Janssen Biotech.
During an 8-week induction phase, the study subjects were randomly assigned to receive intravenous placebo (132 patients) or ustekinumab in 1-mg/kg (131 patients), 3-mg/kg (132 patients), or 6-mg/kg (131 patients) doses. Then, during weeks 8-36, the study subjects who showed a response to induction therapy and those who did not show a response were separately randomized to receive either subcutaneous ustekinumab (90 mg) or placebo at week 8 and week 16, as maintenance therapy.
Treatment efficacy was assessed at week 22, and patients were followed through week 36 for a safety analysis. A total of 36.1% of the subjects discontinued the study before week 36.
The primary end point was a clinical response, defined as a decrease of 100 points or more on the Crohn’s Disease Activity Index (CDAI) score.
A total of 39.7% of patients receiving the 6-mg induction dose showed a clinical response, which was significantly greater than the 23.5% of patients receiving placebo, the investigators said (New Engl. J. Med. 2012 [doi:10.1056/NEJMoa1203572]).
A greater number of patients receiving the lower doses of ustekinumab than receiving placebo showed a clinical response, but the differences between these low-dose groups and the placebo group did not reach statistical significance.
The 6-mg/kg dose was effective across most demographic and disease characteristics, judging from the findings of a subgroup analysis. It was consistently effective in patients who had failed on their first attempt at therapy with TNF antagonists, patients who had failed on two or more TNF antagonists, and patients who had only had a transient response to TNF antagonists.
However, rates of clinical remission did not differ significantly between patients receiving ustekinumab and those receiving placebo, Dr. Sandborn and his associates said.
At all follow-up visits, the proportion of patients who had a 70-point clinical response was significantly higher, the reductions in mean CDAI scores were significantly greater, and the reductions in C-reactive protein levels were significantly greater in patients receiving 6 mg per kg of ustekinumab than in the placebo group.
As a maintenance therapy, 90 mg of subcutaneous ustekinumab appeared to be effective in patients who responded to the induction dose of the agent. The proportion of patients who showed a clinical response at week 22 was 69.4% in those receiving maintenance ustekinumab, significantly greater than the 42.5% response rate among those receiving maintenance placebo.
Among patients who responded to induction-phase ustekinumab, 41.7% of those who also received maintenance ustekinumab achieved clinical remission at week 22, compared with only 27.4% of those who received maintenance placebo.
Similarly, among patients who showed a response to induction ustekinumab, reductions in both CDAI scores and CRP levels were sustained if they continued on maintenance ustekinumab but were not sustained if they continued on placebo for the maintenance period.
However, patients who did not show a response to induction ustekinumab also did not benefit from additional ustekinumab in the maintenance phase of the study.
The results of the safety analysis were "somewhat limited" by the small sample size and the short duration of treatment. No deaths, serious opportunistic infections, or major adverse cardiovascular events were reported, "but large studies of longer duration are needed to assess uncommon adverse events," the investigators said.
Of note, one patient receiving ustekinumab as both induction and maintenance therapy developed a basal cell carcinoma. Among patients taking ustekinumab in the induction phase of the study, six developed serious infections: Clostridium difficile, viral gastroenteritis, UTI, anal abscess, vaginal abscess, and a staph infection of a central catheter.
This study was sponsored by Janssen Research and Development; Janssen Biotech makes ustekinumab. Dr. Sandborn and his associates reported numerous ties to industry sources.
Ustekinumab induced a clinical response in patients with moderate to severe Crohn’s disease that was resistant to tumor necrosis factor antagonists, in a phase IIb clinical trial published online Oct. 17 in the New England Journal of Medicine.
However, the agent did not improve remission rates, compared with placebo, said Dr. William J. Sandborn, professor of medicine and chief of the division of gastroenterology at the University of California San Diego, La Jolla, and his associates.
"A sizable proportion" of patients with moderate to severe Crohn’s disease do not respond to TNF antagonists, have an unsustained response, or must discontinue the medications because of adverse effects. After ustekinumab showed efficacy in such patients in a phase IIa clinical study, Dr. Sandborn and his colleagues performed a 36-week double-blind phase II2b trial in 526 adults at 153 medical centers in 12 countries.
Ustekinumab, a human IgG monoclonal antibody that inhibits the receptors for interleukin-12 and interleukin-23 on T cells, natural killer cells, and antigen-presenting cells, has Food and Drug Administration approval for use in plaque psoriasis. This clinical trial was sponsored by an affiliate of the manufacturer, Janssen Biotech.
During an 8-week induction phase, the study subjects were randomly assigned to receive intravenous placebo (132 patients) or ustekinumab in 1-mg/kg (131 patients), 3-mg/kg (132 patients), or 6-mg/kg (131 patients) doses. Then, during weeks 8-36, the study subjects who showed a response to induction therapy and those who did not show a response were separately randomized to receive either subcutaneous ustekinumab (90 mg) or placebo at week 8 and week 16, as maintenance therapy.
Treatment efficacy was assessed at week 22, and patients were followed through week 36 for a safety analysis. A total of 36.1% of the subjects discontinued the study before week 36.
The primary end point was a clinical response, defined as a decrease of 100 points or more on the Crohn’s Disease Activity Index (CDAI) score.
A total of 39.7% of patients receiving the 6-mg induction dose showed a clinical response, which was significantly greater than the 23.5% of patients receiving placebo, the investigators said (New Engl. J. Med. 2012 [doi:10.1056/NEJMoa1203572]).
A greater number of patients receiving the lower doses of ustekinumab than receiving placebo showed a clinical response, but the differences between these low-dose groups and the placebo group did not reach statistical significance.
The 6-mg/kg dose was effective across most demographic and disease characteristics, judging from the findings of a subgroup analysis. It was consistently effective in patients who had failed on their first attempt at therapy with TNF antagonists, patients who had failed on two or more TNF antagonists, and patients who had only had a transient response to TNF antagonists.
However, rates of clinical remission did not differ significantly between patients receiving ustekinumab and those receiving placebo, Dr. Sandborn and his associates said.
At all follow-up visits, the proportion of patients who had a 70-point clinical response was significantly higher, the reductions in mean CDAI scores were significantly greater, and the reductions in C-reactive protein levels were significantly greater in patients receiving 6 mg per kg of ustekinumab than in the placebo group.
As a maintenance therapy, 90 mg of subcutaneous ustekinumab appeared to be effective in patients who responded to the induction dose of the agent. The proportion of patients who showed a clinical response at week 22 was 69.4% in those receiving maintenance ustekinumab, significantly greater than the 42.5% response rate among those receiving maintenance placebo.
Among patients who responded to induction-phase ustekinumab, 41.7% of those who also received maintenance ustekinumab achieved clinical remission at week 22, compared with only 27.4% of those who received maintenance placebo.
Similarly, among patients who showed a response to induction ustekinumab, reductions in both CDAI scores and CRP levels were sustained if they continued on maintenance ustekinumab but were not sustained if they continued on placebo for the maintenance period.
However, patients who did not show a response to induction ustekinumab also did not benefit from additional ustekinumab in the maintenance phase of the study.
The results of the safety analysis were "somewhat limited" by the small sample size and the short duration of treatment. No deaths, serious opportunistic infections, or major adverse cardiovascular events were reported, "but large studies of longer duration are needed to assess uncommon adverse events," the investigators said.
Of note, one patient receiving ustekinumab as both induction and maintenance therapy developed a basal cell carcinoma. Among patients taking ustekinumab in the induction phase of the study, six developed serious infections: Clostridium difficile, viral gastroenteritis, UTI, anal abscess, vaginal abscess, and a staph infection of a central catheter.
This study was sponsored by Janssen Research and Development; Janssen Biotech makes ustekinumab. Dr. Sandborn and his associates reported numerous ties to industry sources.
Ustekinumab induced a clinical response in patients with moderate to severe Crohn’s disease that was resistant to tumor necrosis factor antagonists, in a phase IIb clinical trial published online Oct. 17 in the New England Journal of Medicine.
However, the agent did not improve remission rates, compared with placebo, said Dr. William J. Sandborn, professor of medicine and chief of the division of gastroenterology at the University of California San Diego, La Jolla, and his associates.
"A sizable proportion" of patients with moderate to severe Crohn’s disease do not respond to TNF antagonists, have an unsustained response, or must discontinue the medications because of adverse effects. After ustekinumab showed efficacy in such patients in a phase IIa clinical study, Dr. Sandborn and his colleagues performed a 36-week double-blind phase II2b trial in 526 adults at 153 medical centers in 12 countries.
Ustekinumab, a human IgG monoclonal antibody that inhibits the receptors for interleukin-12 and interleukin-23 on T cells, natural killer cells, and antigen-presenting cells, has Food and Drug Administration approval for use in plaque psoriasis. This clinical trial was sponsored by an affiliate of the manufacturer, Janssen Biotech.
During an 8-week induction phase, the study subjects were randomly assigned to receive intravenous placebo (132 patients) or ustekinumab in 1-mg/kg (131 patients), 3-mg/kg (132 patients), or 6-mg/kg (131 patients) doses. Then, during weeks 8-36, the study subjects who showed a response to induction therapy and those who did not show a response were separately randomized to receive either subcutaneous ustekinumab (90 mg) or placebo at week 8 and week 16, as maintenance therapy.
Treatment efficacy was assessed at week 22, and patients were followed through week 36 for a safety analysis. A total of 36.1% of the subjects discontinued the study before week 36.
The primary end point was a clinical response, defined as a decrease of 100 points or more on the Crohn’s Disease Activity Index (CDAI) score.
A total of 39.7% of patients receiving the 6-mg induction dose showed a clinical response, which was significantly greater than the 23.5% of patients receiving placebo, the investigators said (New Engl. J. Med. 2012 [doi:10.1056/NEJMoa1203572]).
A greater number of patients receiving the lower doses of ustekinumab than receiving placebo showed a clinical response, but the differences between these low-dose groups and the placebo group did not reach statistical significance.
The 6-mg/kg dose was effective across most demographic and disease characteristics, judging from the findings of a subgroup analysis. It was consistently effective in patients who had failed on their first attempt at therapy with TNF antagonists, patients who had failed on two or more TNF antagonists, and patients who had only had a transient response to TNF antagonists.
However, rates of clinical remission did not differ significantly between patients receiving ustekinumab and those receiving placebo, Dr. Sandborn and his associates said.
At all follow-up visits, the proportion of patients who had a 70-point clinical response was significantly higher, the reductions in mean CDAI scores were significantly greater, and the reductions in C-reactive protein levels were significantly greater in patients receiving 6 mg per kg of ustekinumab than in the placebo group.
As a maintenance therapy, 90 mg of subcutaneous ustekinumab appeared to be effective in patients who responded to the induction dose of the agent. The proportion of patients who showed a clinical response at week 22 was 69.4% in those receiving maintenance ustekinumab, significantly greater than the 42.5% response rate among those receiving maintenance placebo.
Among patients who responded to induction-phase ustekinumab, 41.7% of those who also received maintenance ustekinumab achieved clinical remission at week 22, compared with only 27.4% of those who received maintenance placebo.
Similarly, among patients who showed a response to induction ustekinumab, reductions in both CDAI scores and CRP levels were sustained if they continued on maintenance ustekinumab but were not sustained if they continued on placebo for the maintenance period.
However, patients who did not show a response to induction ustekinumab also did not benefit from additional ustekinumab in the maintenance phase of the study.
The results of the safety analysis were "somewhat limited" by the small sample size and the short duration of treatment. No deaths, serious opportunistic infections, or major adverse cardiovascular events were reported, "but large studies of longer duration are needed to assess uncommon adverse events," the investigators said.
Of note, one patient receiving ustekinumab as both induction and maintenance therapy developed a basal cell carcinoma. Among patients taking ustekinumab in the induction phase of the study, six developed serious infections: Clostridium difficile, viral gastroenteritis, UTI, anal abscess, vaginal abscess, and a staph infection of a central catheter.
This study was sponsored by Janssen Research and Development; Janssen Biotech makes ustekinumab. Dr. Sandborn and his associates reported numerous ties to industry sources.
FROM THE NEW ENGLAND JOURNAL OF MEDICINE
Major Finding: Of patients with moderate to severe Crohn's disease who received ustekinumab (6 mg/kg), 39.7% showed a decrease of 100 points or more in CDAI score, compared with 23.5% of those who received placebo.
Data Source: The data come from a 36-week,international phase IIb randomized clinical trial comparing 3 doses of ustekinumab with placebo in 526 adults who had refractory Crohn’ disease.
Disclosures: This study was sponsored by Janssen Research and Development; Janssen Biotech makes ustekinumab. Dr. Sandborn and his associates reported numerous ties to industry sources.

Get the Government to Fund Your ACO Start-Up Costs
There seems to be a cruel irony at work: It is generally recognized that a primary care physician–based accountable care organization stands the greatest chance of successfully squeezing the waste out of our health care system – yet that same system has historically deprived primary care of the means to finance an ACO.
Worse, most of the payments that are necessary to fund and sustain ACOs are deferred for more than a year, because they come from savings created during the prior year. It is the proverbial "you can’t get there from here" problem.
How do we avoid this "Catch-22," in which the primary care–driven ACO model is best suited to meet the goals of ACOs but often is least able to afford the costs of creating ACOs?
The answer may be the federal government. There are several viable options available to have the government effectively fund 100% of your ACO start-up costs.
Consider the following:
• Meaningful use incentives. Why not have the government pay for your ACO technology platform? If you think ahead, the health information exchange you will want for your ACO will likely qualify you for stage 2 and stage 3 meaningful use incentives. You can earn up to $44,000 over 5 years from Medicare, or up to $63,750 over 6 years from Medicaid. Instead of data being a burden under fee for service, access to and exchange capability of data will be a huge asset.
You will need to make these investments anyway. If you have your ACO game plan in place, much of what you and your colleagues do to meet the meaningful use criteria can be used to fund your ACO.
• Advance payment model program. The Centers for Medicare and Medicaid Services apparently recognized the "you can’t get there from here" dilemma by creating the advance payment model program. Physician-run ACOs in rural areas have been singled out to receive enough up-front funding to completely pay for the development and implementation of the Medicare Shared Savings Program (MSSP) ACO until shared savings payments kick in.
In addition to the MSSP application, ACOs that wish to receive advance funding from the CMS Innovation Center must also complete the advance payment model application. The advance payment model is open to only two types of ACOs: ACOs that do not include any inpatient facilities and have less than $50 million in total annual revenue; and ACOs in which the only inpatient facilities are critical access hospitals and/or Medicare low-volume rural hospitals, and that have less than $80 million in total annual revenue. ACOs that are co-owned with a health plan will be ineligible, regardless of whether they also fall into one of the above categories.
The advance payment model application consists of two primary sections: the ACO’s financial characteristics; and the ACO’s investment plan.
With respect to the financial characteristics, the ACO will need to list the total annual revenue and total Medicaid revenue for each ACO participant during the preceding 3 years. The information submitted by the ACO will need to be based on either federal tax returns or audited financial statements.
The second key section of the advance payment model application is the ACO investment plan. The ACO must explain how it intends to use the advance payment funds awarded from CMS.
Specifically, the investment plan must include:
• A description of the types of staffing and infrastructure that the ACO will acquire and/or expand using the funding available through the advance payment model.
• The timing of such acquisitions or expansions, and the estimated unit costs.
• A description of how such investments build on staff and infrastructure the ACO already has or plans to acquire through its own upcoming investments.
• An explanation of how each investment will support the ACO in achieving the three-part aim of better health, better health care, and lower per capita costs for Medicare beneficiaries.
The advance payment model money may not be renewed once the initial $1 billion budgeted amount is exhausted. But if the results and return on investment are as powerful as predicted for the targeted ACOs, this could be viewed as a sound investment by CMS.
At current levels, an ACO will receive an up-front fixed amount of $250,000, a variable $36/member, and then $8/member per month. This will be repaid if there are ACO shared savings later on.
Beyond the dollars and cents impact, the APM program is vivid evidence for primary care physicians of just how promising CMS believes physician-directed ACOs are.
Primary care physicians are starting to understand the professional and financial rewards behind ACOs. They should not be dismayed by lack of funding. The payers know that funding these ACOs is a smart "investment" in reforming our inefficient and wasteful current system.
Mr. Bobbitt is a senior partner and head of the Health Law Group at the Smith Anderson law firm in Raleigh, N.C. He has many years’ experience assisting physicians forming integrated delivery systems. He has spoken and written nationally to primary care physicians on the strategies and practicalities of forming or joining ACOs. This article is meant to be educational and does not constitute legal advice. For additional information, readers may contact the author at bbobbitt@smithlaw.com or 919-821-6612.
There seems to be a cruel irony at work: It is generally recognized that a primary care physician–based accountable care organization stands the greatest chance of successfully squeezing the waste out of our health care system – yet that same system has historically deprived primary care of the means to finance an ACO.
Worse, most of the payments that are necessary to fund and sustain ACOs are deferred for more than a year, because they come from savings created during the prior year. It is the proverbial "you can’t get there from here" problem.
How do we avoid this "Catch-22," in which the primary care–driven ACO model is best suited to meet the goals of ACOs but often is least able to afford the costs of creating ACOs?
The answer may be the federal government. There are several viable options available to have the government effectively fund 100% of your ACO start-up costs.
Consider the following:
• Meaningful use incentives. Why not have the government pay for your ACO technology platform? If you think ahead, the health information exchange you will want for your ACO will likely qualify you for stage 2 and stage 3 meaningful use incentives. You can earn up to $44,000 over 5 years from Medicare, or up to $63,750 over 6 years from Medicaid. Instead of data being a burden under fee for service, access to and exchange capability of data will be a huge asset.
You will need to make these investments anyway. If you have your ACO game plan in place, much of what you and your colleagues do to meet the meaningful use criteria can be used to fund your ACO.
• Advance payment model program. The Centers for Medicare and Medicaid Services apparently recognized the "you can’t get there from here" dilemma by creating the advance payment model program. Physician-run ACOs in rural areas have been singled out to receive enough up-front funding to completely pay for the development and implementation of the Medicare Shared Savings Program (MSSP) ACO until shared savings payments kick in.
In addition to the MSSP application, ACOs that wish to receive advance funding from the CMS Innovation Center must also complete the advance payment model application. The advance payment model is open to only two types of ACOs: ACOs that do not include any inpatient facilities and have less than $50 million in total annual revenue; and ACOs in which the only inpatient facilities are critical access hospitals and/or Medicare low-volume rural hospitals, and that have less than $80 million in total annual revenue. ACOs that are co-owned with a health plan will be ineligible, regardless of whether they also fall into one of the above categories.
The advance payment model application consists of two primary sections: the ACO’s financial characteristics; and the ACO’s investment plan.
With respect to the financial characteristics, the ACO will need to list the total annual revenue and total Medicaid revenue for each ACO participant during the preceding 3 years. The information submitted by the ACO will need to be based on either federal tax returns or audited financial statements.
The second key section of the advance payment model application is the ACO investment plan. The ACO must explain how it intends to use the advance payment funds awarded from CMS.
Specifically, the investment plan must include:
• A description of the types of staffing and infrastructure that the ACO will acquire and/or expand using the funding available through the advance payment model.
• The timing of such acquisitions or expansions, and the estimated unit costs.
• A description of how such investments build on staff and infrastructure the ACO already has or plans to acquire through its own upcoming investments.
• An explanation of how each investment will support the ACO in achieving the three-part aim of better health, better health care, and lower per capita costs for Medicare beneficiaries.
The advance payment model money may not be renewed once the initial $1 billion budgeted amount is exhausted. But if the results and return on investment are as powerful as predicted for the targeted ACOs, this could be viewed as a sound investment by CMS.
At current levels, an ACO will receive an up-front fixed amount of $250,000, a variable $36/member, and then $8/member per month. This will be repaid if there are ACO shared savings later on.
Beyond the dollars and cents impact, the APM program is vivid evidence for primary care physicians of just how promising CMS believes physician-directed ACOs are.
Primary care physicians are starting to understand the professional and financial rewards behind ACOs. They should not be dismayed by lack of funding. The payers know that funding these ACOs is a smart "investment" in reforming our inefficient and wasteful current system.
Mr. Bobbitt is a senior partner and head of the Health Law Group at the Smith Anderson law firm in Raleigh, N.C. He has many years’ experience assisting physicians forming integrated delivery systems. He has spoken and written nationally to primary care physicians on the strategies and practicalities of forming or joining ACOs. This article is meant to be educational and does not constitute legal advice. For additional information, readers may contact the author at bbobbitt@smithlaw.com or 919-821-6612.
There seems to be a cruel irony at work: It is generally recognized that a primary care physician–based accountable care organization stands the greatest chance of successfully squeezing the waste out of our health care system – yet that same system has historically deprived primary care of the means to finance an ACO.
Worse, most of the payments that are necessary to fund and sustain ACOs are deferred for more than a year, because they come from savings created during the prior year. It is the proverbial "you can’t get there from here" problem.
How do we avoid this "Catch-22," in which the primary care–driven ACO model is best suited to meet the goals of ACOs but often is least able to afford the costs of creating ACOs?
The answer may be the federal government. There are several viable options available to have the government effectively fund 100% of your ACO start-up costs.
Consider the following:
• Meaningful use incentives. Why not have the government pay for your ACO technology platform? If you think ahead, the health information exchange you will want for your ACO will likely qualify you for stage 2 and stage 3 meaningful use incentives. You can earn up to $44,000 over 5 years from Medicare, or up to $63,750 over 6 years from Medicaid. Instead of data being a burden under fee for service, access to and exchange capability of data will be a huge asset.
You will need to make these investments anyway. If you have your ACO game plan in place, much of what you and your colleagues do to meet the meaningful use criteria can be used to fund your ACO.
• Advance payment model program. The Centers for Medicare and Medicaid Services apparently recognized the "you can’t get there from here" dilemma by creating the advance payment model program. Physician-run ACOs in rural areas have been singled out to receive enough up-front funding to completely pay for the development and implementation of the Medicare Shared Savings Program (MSSP) ACO until shared savings payments kick in.
In addition to the MSSP application, ACOs that wish to receive advance funding from the CMS Innovation Center must also complete the advance payment model application. The advance payment model is open to only two types of ACOs: ACOs that do not include any inpatient facilities and have less than $50 million in total annual revenue; and ACOs in which the only inpatient facilities are critical access hospitals and/or Medicare low-volume rural hospitals, and that have less than $80 million in total annual revenue. ACOs that are co-owned with a health plan will be ineligible, regardless of whether they also fall into one of the above categories.
The advance payment model application consists of two primary sections: the ACO’s financial characteristics; and the ACO’s investment plan.
With respect to the financial characteristics, the ACO will need to list the total annual revenue and total Medicaid revenue for each ACO participant during the preceding 3 years. The information submitted by the ACO will need to be based on either federal tax returns or audited financial statements.
The second key section of the advance payment model application is the ACO investment plan. The ACO must explain how it intends to use the advance payment funds awarded from CMS.
Specifically, the investment plan must include:
• A description of the types of staffing and infrastructure that the ACO will acquire and/or expand using the funding available through the advance payment model.
• The timing of such acquisitions or expansions, and the estimated unit costs.
• A description of how such investments build on staff and infrastructure the ACO already has or plans to acquire through its own upcoming investments.
• An explanation of how each investment will support the ACO in achieving the three-part aim of better health, better health care, and lower per capita costs for Medicare beneficiaries.
The advance payment model money may not be renewed once the initial $1 billion budgeted amount is exhausted. But if the results and return on investment are as powerful as predicted for the targeted ACOs, this could be viewed as a sound investment by CMS.
At current levels, an ACO will receive an up-front fixed amount of $250,000, a variable $36/member, and then $8/member per month. This will be repaid if there are ACO shared savings later on.
Beyond the dollars and cents impact, the APM program is vivid evidence for primary care physicians of just how promising CMS believes physician-directed ACOs are.
Primary care physicians are starting to understand the professional and financial rewards behind ACOs. They should not be dismayed by lack of funding. The payers know that funding these ACOs is a smart "investment" in reforming our inefficient and wasteful current system.
Mr. Bobbitt is a senior partner and head of the Health Law Group at the Smith Anderson law firm in Raleigh, N.C. He has many years’ experience assisting physicians forming integrated delivery systems. He has spoken and written nationally to primary care physicians on the strategies and practicalities of forming or joining ACOs. This article is meant to be educational and does not constitute legal advice. For additional information, readers may contact the author at bbobbitt@smithlaw.com or 919-821-6612.

Topical Fluorocarbon Speeds Tattoo Removal Process
ATLANTA – Applying the topical fluorocarbon perfluorodecalin prior to Q-switched laser treatment for tattoo removal allows for immediate retreatment of the tattoo, thereby improving results while decreasing overall treatment time, according to Dr. Roy Geronemus.
The findings have important implications for improving outcomes and patient satisfaction, given that tattoo removal can require 10-20 sessions, depending on factors such as the age and colors of the tattoo, and that tattoos – and thus tattoo removal – continue to increase in popularity, he said. "For a busy practice or impatient patients like we have in New York, this has been a nice advance," Dr. Geronemus said at the annual meeting of the American Society for Dermatologic Surgery.

The approach builds on the "R20 technique" described earlier this year in a study published in the Journal of the American Academy of Dermatology. R20 involves the use of multiple treatment passes that are made at 20-minute intervals.
Typically, after an initial pass, tiny white bubbles form in the superficial papillary dermis, appearing as a whitening of the skin. Retreatment while these bubbles are present elicits a limited reaction.
The R20 technique was developed when investigators found that the bubbles disappear after 20 minutes, and, thus, tested the technique in a study of 12 adults. The patients were randomized to a single treatment pass with a Q-switched alexandrite laser (5.5 J/cm2, 755 nm, 100-nanosecond pulse duration, 3-mm spot size) or to four passes at 20 minute intervals.
The first treatment caused an immediate whitening reaction, but little or no whitening occurred after subsequent passes at 20-minute intervals. However, at 90-day follow-up, significant improvement was seen in the R20 group, compared with the single-treatment group, and light microscopy demonstrated greater dispersion of tattoo ink with the R20 approach. (J. Am. Acad. Dermatol. 2012;66:271-7).
Despite the increased efficacy using this approach, the time required to complete four passes at 20-minute intervals makes it impractical in the clinical setting, said Dr. Geronemus, a dermatologist in private practice in New York.
"So with this idea in mind, we began to look at a concept that would allow us to re-treat tattoos immediately without waiting 20 minutes," he said, explaining that topical perfluorodecalin helps dissolve the gas seen after the application of the Q-switched laser and speeds the resolution of the whitening.
"Rather than waiting 20 minutes, the gas dissolves almost immediately, allowing you to re-treat, and we’re now re-treating three or four times in a matter of minutes rather than waiting the 80 minutes that the R20 technique would take for a four-time treatment session," he said.
In his experience, results with perfluorodecalin are comparable to those seen with the R20 technique – but with greater convenience for the patient.
His observations were confirmed on optical coherence tomography scanning, which demonstrated that cavitation levels are indeed reduced by the use of perfluorodecalin.
Dr. Geronemus is an investigator for Cutera, Cynosure, Palomar, Solta Medical, and Syneron. He is also on the medical advisory board for Cynosure, Lumenis, Photomedex, Syneron, and Zeltiq. He reported that he is a Zeltiq shareholder.
ATLANTA – Applying the topical fluorocarbon perfluorodecalin prior to Q-switched laser treatment for tattoo removal allows for immediate retreatment of the tattoo, thereby improving results while decreasing overall treatment time, according to Dr. Roy Geronemus.
The findings have important implications for improving outcomes and patient satisfaction, given that tattoo removal can require 10-20 sessions, depending on factors such as the age and colors of the tattoo, and that tattoos – and thus tattoo removal – continue to increase in popularity, he said. "For a busy practice or impatient patients like we have in New York, this has been a nice advance," Dr. Geronemus said at the annual meeting of the American Society for Dermatologic Surgery.
The approach builds on the "R20 technique" described earlier this year in a study published in the Journal of the American Academy of Dermatology. R20 involves the use of multiple treatment passes that are made at 20-minute intervals.
Typically, after an initial pass, tiny white bubbles form in the superficial papillary dermis, appearing as a whitening of the skin. Retreatment while these bubbles are present elicits a limited reaction.
The R20 technique was developed when investigators found that the bubbles disappear after 20 minutes, and, thus, tested the technique in a study of 12 adults. The patients were randomized to a single treatment pass with a Q-switched alexandrite laser (5.5 J/cm2, 755 nm, 100-nanosecond pulse duration, 3-mm spot size) or to four passes at 20 minute intervals.
The first treatment caused an immediate whitening reaction, but little or no whitening occurred after subsequent passes at 20-minute intervals. However, at 90-day follow-up, significant improvement was seen in the R20 group, compared with the single-treatment group, and light microscopy demonstrated greater dispersion of tattoo ink with the R20 approach. (J. Am. Acad. Dermatol. 2012;66:271-7).
Despite the increased efficacy using this approach, the time required to complete four passes at 20-minute intervals makes it impractical in the clinical setting, said Dr. Geronemus, a dermatologist in private practice in New York.
"So with this idea in mind, we began to look at a concept that would allow us to re-treat tattoos immediately without waiting 20 minutes," he said, explaining that topical perfluorodecalin helps dissolve the gas seen after the application of the Q-switched laser and speeds the resolution of the whitening.
"Rather than waiting 20 minutes, the gas dissolves almost immediately, allowing you to re-treat, and we’re now re-treating three or four times in a matter of minutes rather than waiting the 80 minutes that the R20 technique would take for a four-time treatment session," he said.
In his experience, results with perfluorodecalin are comparable to those seen with the R20 technique – but with greater convenience for the patient.
His observations were confirmed on optical coherence tomography scanning, which demonstrated that cavitation levels are indeed reduced by the use of perfluorodecalin.
Dr. Geronemus is an investigator for Cutera, Cynosure, Palomar, Solta Medical, and Syneron. He is also on the medical advisory board for Cynosure, Lumenis, Photomedex, Syneron, and Zeltiq. He reported that he is a Zeltiq shareholder.
ATLANTA – Applying the topical fluorocarbon perfluorodecalin prior to Q-switched laser treatment for tattoo removal allows for immediate retreatment of the tattoo, thereby improving results while decreasing overall treatment time, according to Dr. Roy Geronemus.
The findings have important implications for improving outcomes and patient satisfaction, given that tattoo removal can require 10-20 sessions, depending on factors such as the age and colors of the tattoo, and that tattoos – and thus tattoo removal – continue to increase in popularity, he said. "For a busy practice or impatient patients like we have in New York, this has been a nice advance," Dr. Geronemus said at the annual meeting of the American Society for Dermatologic Surgery.
The approach builds on the "R20 technique" described earlier this year in a study published in the Journal of the American Academy of Dermatology. R20 involves the use of multiple treatment passes that are made at 20-minute intervals.
Typically, after an initial pass, tiny white bubbles form in the superficial papillary dermis, appearing as a whitening of the skin. Retreatment while these bubbles are present elicits a limited reaction.
The R20 technique was developed when investigators found that the bubbles disappear after 20 minutes, and, thus, tested the technique in a study of 12 adults. The patients were randomized to a single treatment pass with a Q-switched alexandrite laser (5.5 J/cm2, 755 nm, 100-nanosecond pulse duration, 3-mm spot size) or to four passes at 20 minute intervals.
The first treatment caused an immediate whitening reaction, but little or no whitening occurred after subsequent passes at 20-minute intervals. However, at 90-day follow-up, significant improvement was seen in the R20 group, compared with the single-treatment group, and light microscopy demonstrated greater dispersion of tattoo ink with the R20 approach. (J. Am. Acad. Dermatol. 2012;66:271-7).
Despite the increased efficacy using this approach, the time required to complete four passes at 20-minute intervals makes it impractical in the clinical setting, said Dr. Geronemus, a dermatologist in private practice in New York.
"So with this idea in mind, we began to look at a concept that would allow us to re-treat tattoos immediately without waiting 20 minutes," he said, explaining that topical perfluorodecalin helps dissolve the gas seen after the application of the Q-switched laser and speeds the resolution of the whitening.
"Rather than waiting 20 minutes, the gas dissolves almost immediately, allowing you to re-treat, and we’re now re-treating three or four times in a matter of minutes rather than waiting the 80 minutes that the R20 technique would take for a four-time treatment session," he said.
In his experience, results with perfluorodecalin are comparable to those seen with the R20 technique – but with greater convenience for the patient.
His observations were confirmed on optical coherence tomography scanning, which demonstrated that cavitation levels are indeed reduced by the use of perfluorodecalin.
Dr. Geronemus is an investigator for Cutera, Cynosure, Palomar, Solta Medical, and Syneron. He is also on the medical advisory board for Cynosure, Lumenis, Photomedex, Syneron, and Zeltiq. He reported that he is a Zeltiq shareholder.
EXPERT ANALYSIS FROM THE ANNUAL MEETING OF THE AMERICAN SOCIETY FOR DERMATOLOGIC SURGERY

Bedside Tools to ID Severe C. difficile Fall Short
SAN FRANCISCO – A side-by-side comparison of three bedside tools used to identify severe cases of Clostridium difficile infection yielded no clear winner, a reminder that judgment at diagnosis is still the clinician’s best bet.
Criteria from the Infectious Diseases Society of America were more sensitive but the least specific than both the Hines Veterans Affairs (VA) and the ATLAS severity scoring systems, Thien-Ly Doan, Pharm.D. explained in an interview at the annual Interscience Conference on Antimicrobial Agents and Chemotherapy.

The Hines VA system for stratifying patients missed 19 of 44 severe/complicated cases of C. difficile infection. The ATLAS scoring system (which incorporates five parameters: age, temperature, leukocytosis, albumin, and systemic concomitant antibiotic use) missed 14 of the 44 cases in a retrospective chart review of 109 patients hospitalized for more than a day with confirmed C. difficile infection.
The IDSA guidelines missed only 5 of the 44 severe/complicated infections, but they cast such a wide net that anyone with a white count above 15,000 cells/mm3 or an elevated creatinine (1.5 times or greater than the premorbid level) is considered to have severe C. difficile infection, she said.
Use of the IDSA guidelines could increase unnecessary use of vancomycin instead of metronidazole, said Dr. Doan, a clinical coordinator at Long Island Jewish Medical Center, New Hyde Park, N.Y.
The IDSA criteria suggested that nearly 60% of the 109 patients had severe infection. However, the 44 severe/complicated C. difficile patients comprised just 40% of the study population. They were defined in the study as patients who were in critical care or whose infections were refractory to treatment and who had ileus, severe pancolitis/toxic megacolon, a WBC of 15,000 cells/mL with hypotension, surgery related to C. difficile infection, or who had died from infection.
Dr. Doan and her associates compared the three stratification systems in evaluating the charts of adults with C. difficile infection at the medical center, who had a mean age of 71 years. A total of 74% of patients were on the medicine service, 22% were in critical care, and 4% were on the surgical service; 34% were female.
The Centers for Disease Control and Prevention also offer severity criteria, but these require the observation of clinical end points and thus are ineffective for assessing patients at initial presentation, she said in a poster presentation at the meeting, sponsored by the American Society for Microbiology.
The Hines VA scoring system, in addition to missing the most severe cases, also gives a great deal of weight to diagnostic imaging, which "makes it impractical at our institution," she said. The Hines VA tool incorporates temperature, the presence of ileus, systolic blood pressure, leukocytosis, and abnormal CT findings to stratify patients by severity.
"We’re going to continue relying on the clinician’s assessment at the bedside at the time of diagnosis to evaluate whether cases are severe or not severe, and not use any of these tools that are available," Dr. Doan said.
A good bedside tool sure would be nice, though, to have a good, objective way of identifying severe C. difficile infection, she added. In a large health system, order sets could be developed based on the tool’s findings "so that everybody would be on the same page in terms of treatment," she said. None of the current tools are good enough for that.
Severe cases of C. difficile are on the rise because of increasing prevalence of the hypervirulent NAP1/BI/027 strain, she noted.
A number of clinicians at the meeting approached her with their own versions of bedside tools for identifying severe C. difficile infection, which Dr. Doan and her associates may evaluate next. They also may compare the tools on different subpopulations of patients with severe infection, such as only patients whose death or surgery was related to C. difficile infection.
Dr. Doan reported having no financial disclosures.
Reported mortality from Clostridium difficile infection (CDI) in the United States has increased dramatically in recent years (Emerg. Infect. Dis. 2007;13: 1417-9). Current guidelines call for the use of oral vancomy-cin as first-line therapy in severe CDI while metronidazole may be used in milder disease (Infect. Control Hosp. Epidemiol. 2010;31:431-55). Thus, it becomes important for therapy to identify those with potentially severe CDI early in their clinical course. However, a systematic review published in 2012 that specifically looked at clinical prediction rules (CPRs) for poor outcomes in CDI concluded that the available tools are inadequate for the task (PLoS One 2012;7:e30258).
The study by Dr. Doan and colleagues assessed the utility of bedside severity-of-illness tools in the treatment of patients with CDI. This was a retrospective chart review of 109 patients hospitalized for more than a day with confirmed CDI. Three CPRs were assessed: The Hines VA system , ; the ATLAS scoring system; and the Infectious Diseases Society of America (IDSA) guidelines. . Sensitivity in detecting severe outcomes of CDI were 57%, 68%, and 89%, respectively. However, the most sensitive CPR, the IDSA guideline, showed poor specificity because it categorized 60% of all subjects as severe. Thus, the IDSA guideline will encourage more widespread use of oral vancomycin in CDI.
Therefore, we lack a risk-scoring system for severe CDI that is easy to use, sensitive, specific, and validated. Such a prediction tool is essential to allow us to follow the current CDI treatment guidelines.
CIARAN P. KELLY, M.D., is director of gastroenterology training and is medical director of the Celiac Center at Beth Israel Deaconess Medical Center, Boston. SAURABH SETHI, M.D., is a fellow in gastroenterology and hepatology at Beth Israe Deaconess. Dr. Kelly reported serving as a consultant or scientific advisor for, being a member of an advisory board for, or receiving research support from many companies developing drugs for C. difficile. Dr. Sethi had no relevant financial disclosures.
Reported mortality from Clostridium difficile infection (CDI) in the United States has increased dramatically in recent years (Emerg. Infect. Dis. 2007;13: 1417-9). Current guidelines call for the use of oral vancomy-cin as first-line therapy in severe CDI while metronidazole may be used in milder disease (Infect. Control Hosp. Epidemiol. 2010;31:431-55). Thus, it becomes important for therapy to identify those with potentially severe CDI early in their clinical course. However, a systematic review published in 2012 that specifically looked at clinical prediction rules (CPRs) for poor outcomes in CDI concluded that the available tools are inadequate for the task (PLoS One 2012;7:e30258).
The study by Dr. Doan and colleagues assessed the utility of bedside severity-of-illness tools in the treatment of patients with CDI. This was a retrospective chart review of 109 patients hospitalized for more than a day with confirmed CDI. Three CPRs were assessed: The Hines VA system , ; the ATLAS scoring system; and the Infectious Diseases Society of America (IDSA) guidelines. . Sensitivity in detecting severe outcomes of CDI were 57%, 68%, and 89%, respectively. However, the most sensitive CPR, the IDSA guideline, showed poor specificity because it categorized 60% of all subjects as severe. Thus, the IDSA guideline will encourage more widespread use of oral vancomycin in CDI.
Therefore, we lack a risk-scoring system for severe CDI that is easy to use, sensitive, specific, and validated. Such a prediction tool is essential to allow us to follow the current CDI treatment guidelines.
CIARAN P. KELLY, M.D., is director of gastroenterology training and is medical director of the Celiac Center at Beth Israel Deaconess Medical Center, Boston. SAURABH SETHI, M.D., is a fellow in gastroenterology and hepatology at Beth Israe Deaconess. Dr. Kelly reported serving as a consultant or scientific advisor for, being a member of an advisory board for, or receiving research support from many companies developing drugs for C. difficile. Dr. Sethi had no relevant financial disclosures.
Reported mortality from Clostridium difficile infection (CDI) in the United States has increased dramatically in recent years (Emerg. Infect. Dis. 2007;13: 1417-9). Current guidelines call for the use of oral vancomy-cin as first-line therapy in severe CDI while metronidazole may be used in milder disease (Infect. Control Hosp. Epidemiol. 2010;31:431-55). Thus, it becomes important for therapy to identify those with potentially severe CDI early in their clinical course. However, a systematic review published in 2012 that specifically looked at clinical prediction rules (CPRs) for poor outcomes in CDI concluded that the available tools are inadequate for the task (PLoS One 2012;7:e30258).
The study by Dr. Doan and colleagues assessed the utility of bedside severity-of-illness tools in the treatment of patients with CDI. This was a retrospective chart review of 109 patients hospitalized for more than a day with confirmed CDI. Three CPRs were assessed: The Hines VA system , ; the ATLAS scoring system; and the Infectious Diseases Society of America (IDSA) guidelines. . Sensitivity in detecting severe outcomes of CDI were 57%, 68%, and 89%, respectively. However, the most sensitive CPR, the IDSA guideline, showed poor specificity because it categorized 60% of all subjects as severe. Thus, the IDSA guideline will encourage more widespread use of oral vancomycin in CDI.
Therefore, we lack a risk-scoring system for severe CDI that is easy to use, sensitive, specific, and validated. Such a prediction tool is essential to allow us to follow the current CDI treatment guidelines.
CIARAN P. KELLY, M.D., is director of gastroenterology training and is medical director of the Celiac Center at Beth Israel Deaconess Medical Center, Boston. SAURABH SETHI, M.D., is a fellow in gastroenterology and hepatology at Beth Israe Deaconess. Dr. Kelly reported serving as a consultant or scientific advisor for, being a member of an advisory board for, or receiving research support from many companies developing drugs for C. difficile. Dr. Sethi had no relevant financial disclosures.
SAN FRANCISCO – A side-by-side comparison of three bedside tools used to identify severe cases of Clostridium difficile infection yielded no clear winner, a reminder that judgment at diagnosis is still the clinician’s best bet.
Criteria from the Infectious Diseases Society of America were more sensitive but the least specific than both the Hines Veterans Affairs (VA) and the ATLAS severity scoring systems, Thien-Ly Doan, Pharm.D. explained in an interview at the annual Interscience Conference on Antimicrobial Agents and Chemotherapy.
The Hines VA system for stratifying patients missed 19 of 44 severe/complicated cases of C. difficile infection. The ATLAS scoring system (which incorporates five parameters: age, temperature, leukocytosis, albumin, and systemic concomitant antibiotic use) missed 14 of the 44 cases in a retrospective chart review of 109 patients hospitalized for more than a day with confirmed C. difficile infection.
The IDSA guidelines missed only 5 of the 44 severe/complicated infections, but they cast such a wide net that anyone with a white count above 15,000 cells/mm3 or an elevated creatinine (1.5 times or greater than the premorbid level) is considered to have severe C. difficile infection, she said.
Use of the IDSA guidelines could increase unnecessary use of vancomycin instead of metronidazole, said Dr. Doan, a clinical coordinator at Long Island Jewish Medical Center, New Hyde Park, N.Y.
The IDSA criteria suggested that nearly 60% of the 109 patients had severe infection. However, the 44 severe/complicated C. difficile patients comprised just 40% of the study population. They were defined in the study as patients who were in critical care or whose infections were refractory to treatment and who had ileus, severe pancolitis/toxic megacolon, a WBC of 15,000 cells/mL with hypotension, surgery related to C. difficile infection, or who had died from infection.
Dr. Doan and her associates compared the three stratification systems in evaluating the charts of adults with C. difficile infection at the medical center, who had a mean age of 71 years. A total of 74% of patients were on the medicine service, 22% were in critical care, and 4% were on the surgical service; 34% were female.
The Centers for Disease Control and Prevention also offer severity criteria, but these require the observation of clinical end points and thus are ineffective for assessing patients at initial presentation, she said in a poster presentation at the meeting, sponsored by the American Society for Microbiology.
The Hines VA scoring system, in addition to missing the most severe cases, also gives a great deal of weight to diagnostic imaging, which "makes it impractical at our institution," she said. The Hines VA tool incorporates temperature, the presence of ileus, systolic blood pressure, leukocytosis, and abnormal CT findings to stratify patients by severity.
"We’re going to continue relying on the clinician’s assessment at the bedside at the time of diagnosis to evaluate whether cases are severe or not severe, and not use any of these tools that are available," Dr. Doan said.
A good bedside tool sure would be nice, though, to have a good, objective way of identifying severe C. difficile infection, she added. In a large health system, order sets could be developed based on the tool’s findings "so that everybody would be on the same page in terms of treatment," she said. None of the current tools are good enough for that.
Severe cases of C. difficile are on the rise because of increasing prevalence of the hypervirulent NAP1/BI/027 strain, she noted.
A number of clinicians at the meeting approached her with their own versions of bedside tools for identifying severe C. difficile infection, which Dr. Doan and her associates may evaluate next. They also may compare the tools on different subpopulations of patients with severe infection, such as only patients whose death or surgery was related to C. difficile infection.
Dr. Doan reported having no financial disclosures.
SAN FRANCISCO – A side-by-side comparison of three bedside tools used to identify severe cases of Clostridium difficile infection yielded no clear winner, a reminder that judgment at diagnosis is still the clinician’s best bet.
Criteria from the Infectious Diseases Society of America were more sensitive but the least specific than both the Hines Veterans Affairs (VA) and the ATLAS severity scoring systems, Thien-Ly Doan, Pharm.D. explained in an interview at the annual Interscience Conference on Antimicrobial Agents and Chemotherapy.
The Hines VA system for stratifying patients missed 19 of 44 severe/complicated cases of C. difficile infection. The ATLAS scoring system (which incorporates five parameters: age, temperature, leukocytosis, albumin, and systemic concomitant antibiotic use) missed 14 of the 44 cases in a retrospective chart review of 109 patients hospitalized for more than a day with confirmed C. difficile infection.
The IDSA guidelines missed only 5 of the 44 severe/complicated infections, but they cast such a wide net that anyone with a white count above 15,000 cells/mm3 or an elevated creatinine (1.5 times or greater than the premorbid level) is considered to have severe C. difficile infection, she said.
Use of the IDSA guidelines could increase unnecessary use of vancomycin instead of metronidazole, said Dr. Doan, a clinical coordinator at Long Island Jewish Medical Center, New Hyde Park, N.Y.
The IDSA criteria suggested that nearly 60% of the 109 patients had severe infection. However, the 44 severe/complicated C. difficile patients comprised just 40% of the study population. They were defined in the study as patients who were in critical care or whose infections were refractory to treatment and who had ileus, severe pancolitis/toxic megacolon, a WBC of 15,000 cells/mL with hypotension, surgery related to C. difficile infection, or who had died from infection.
Dr. Doan and her associates compared the three stratification systems in evaluating the charts of adults with C. difficile infection at the medical center, who had a mean age of 71 years. A total of 74% of patients were on the medicine service, 22% were in critical care, and 4% were on the surgical service; 34% were female.
The Centers for Disease Control and Prevention also offer severity criteria, but these require the observation of clinical end points and thus are ineffective for assessing patients at initial presentation, she said in a poster presentation at the meeting, sponsored by the American Society for Microbiology.
The Hines VA scoring system, in addition to missing the most severe cases, also gives a great deal of weight to diagnostic imaging, which "makes it impractical at our institution," she said. The Hines VA tool incorporates temperature, the presence of ileus, systolic blood pressure, leukocytosis, and abnormal CT findings to stratify patients by severity.
"We’re going to continue relying on the clinician’s assessment at the bedside at the time of diagnosis to evaluate whether cases are severe or not severe, and not use any of these tools that are available," Dr. Doan said.
A good bedside tool sure would be nice, though, to have a good, objective way of identifying severe C. difficile infection, she added. In a large health system, order sets could be developed based on the tool’s findings "so that everybody would be on the same page in terms of treatment," she said. None of the current tools are good enough for that.
Severe cases of C. difficile are on the rise because of increasing prevalence of the hypervirulent NAP1/BI/027 strain, she noted.
A number of clinicians at the meeting approached her with their own versions of bedside tools for identifying severe C. difficile infection, which Dr. Doan and her associates may evaluate next. They also may compare the tools on different subpopulations of patients with severe infection, such as only patients whose death or surgery was related to C. difficile infection.
Dr. Doan reported having no financial disclosures.
AT THE ANNUAL INTERSCIENCE CONFERENCE ON ANTIMICROBIAL AGENTS AND CHEMOTHERAPY

What Keeps You Awake at Night?
"The greatest enemy of knowledge is the illusion of knowledge." – Stephen Hawking
In my fellowship, I had a challenging RA case. This woman was in her 50s, and usually she was quite dynamic, personable, and spunky. But the disease was wearing her down. She developed methotrexate pneumonitis. Leflunomide gave her severe diarrhea. She got frequent upper respiratory tract infections from etanercept. We could not get her prednisone dose lower than 15 mg/day. Whenever we saw her in clinic and she had encountered a new glitch in her treatment, my preceptor would say to her "you keep me up at night." Disturbed to hear this, I wondered how insecure I would be as a newly minted rheumatologist if my preceptor, with her decades of practice, still had uncertainties.
I feel like in these, the first 3 years of practice after training, I have an inordinate number of patients who keep me up at night. They come in all shapes and sizes. Even cases that I think are straightforward frequently end up being anything but.
I like treating patients with polymyalgia rheumatica, for example, because the relief they get from a little prednisone is so dramatic and immediate. Seems straightforward, no? But I get anxious about the diagnosis sometimes – what if I’m missing a paraneoplastic syndrome? Not infrequently there are patients who absolutely refuse to go on prednisone, and I worry about them, too. Or I get anxious about tapering, because I’ve had it happen often enough that their symptoms recur at 3 mg of prednisone and I need to put them on a DMARD, none of which have any conclusive evidence of efficacy.
Rheumatoid arthritis is not always easy, either. I have had my share of refractory cases, which, in this age of different varieties of biologics, is even more frustrating. (Although, for the life of me, I cannot imagine what it must have been like to practice before the age of biologics!) It’s even worse for refractory psoriatic arthritis, for which there are fewer drug options available.
And what about scleroderma? I watched a patient’s hands progress from being simply puffy at presentation to being contracted, with severe skin tightening and skin ulcerations over the PIP joints, in just 2 years. We are lucky to be close enough to Boston that I could send the patient to a medical center there to receive an investigational therapy, which seemed to lessen the patient’s symptoms somewhat. Unfortunately, she developed urinary bladder cancer and is now ineligible to receive the experimental anti-TGF-beta in an open label extension.
But perhaps my most insomnia-inducing patient is a lovely 70-year-old man with a new diagnosis of dermatomyositis. His antinuclear antibody was negative, and he had no myositis-specific antibodies. We knew we should be looking for a malignancy, but a CT of the chest, abdomen, and pelvis was negative. A colonoscopy was next, but if that did not turn anything up, what would be next? Do we keep searching? How do we know where to look?
Worse, the pulse of methylprednisolone did not work completely, and he ended up needing a percutaneous endoscopic gastrostomy tube because he failed his swallow evaluation miserably. I was really saddened by all this. It made me feel small and insignificant in the face of such a terrible disease.
In that process of placing a PEG tube, we serendipitously found, on biopsy, adenocarcinoma at the gastroesophageal junction. Though this was, indeed, terrible news, it was a source of comfort for me that we had found the malignancy and would at least have a target for treatment.
I know he will not be my last dermatomyositis patient, and there are no prescribed guidelines for searching for a malignancy. How can we possibly find something if we have no idea what it is or where it might be?
I can think of so many more lupus, spondyloarthritis, temporal arteritis, even mechanical back pain patients who worry me, to say nothing of the not-insignificant number of patients for whom the diagnosis is uncertain. True, my learning curve has been steep in these first 3 years, but the more patients I see, the more striking the large number of phenotypes of our diseases. It’s quite humbling and has kept me up more nights than I expected.
Dr. Chan practices rheumatology in Pawtucket, R.I. E-mail her at [email protected].
"The greatest enemy of knowledge is the illusion of knowledge." – Stephen Hawking
In my fellowship, I had a challenging RA case. This woman was in her 50s, and usually she was quite dynamic, personable, and spunky. But the disease was wearing her down. She developed methotrexate pneumonitis. Leflunomide gave her severe diarrhea. She got frequent upper respiratory tract infections from etanercept. We could not get her prednisone dose lower than 15 mg/day. Whenever we saw her in clinic and she had encountered a new glitch in her treatment, my preceptor would say to her "you keep me up at night." Disturbed to hear this, I wondered how insecure I would be as a newly minted rheumatologist if my preceptor, with her decades of practice, still had uncertainties.
I feel like in these, the first 3 years of practice after training, I have an inordinate number of patients who keep me up at night. They come in all shapes and sizes. Even cases that I think are straightforward frequently end up being anything but.
I like treating patients with polymyalgia rheumatica, for example, because the relief they get from a little prednisone is so dramatic and immediate. Seems straightforward, no? But I get anxious about the diagnosis sometimes – what if I’m missing a paraneoplastic syndrome? Not infrequently there are patients who absolutely refuse to go on prednisone, and I worry about them, too. Or I get anxious about tapering, because I’ve had it happen often enough that their symptoms recur at 3 mg of prednisone and I need to put them on a DMARD, none of which have any conclusive evidence of efficacy.
Rheumatoid arthritis is not always easy, either. I have had my share of refractory cases, which, in this age of different varieties of biologics, is even more frustrating. (Although, for the life of me, I cannot imagine what it must have been like to practice before the age of biologics!) It’s even worse for refractory psoriatic arthritis, for which there are fewer drug options available.
And what about scleroderma? I watched a patient’s hands progress from being simply puffy at presentation to being contracted, with severe skin tightening and skin ulcerations over the PIP joints, in just 2 years. We are lucky to be close enough to Boston that I could send the patient to a medical center there to receive an investigational therapy, which seemed to lessen the patient’s symptoms somewhat. Unfortunately, she developed urinary bladder cancer and is now ineligible to receive the experimental anti-TGF-beta in an open label extension.
But perhaps my most insomnia-inducing patient is a lovely 70-year-old man with a new diagnosis of dermatomyositis. His antinuclear antibody was negative, and he had no myositis-specific antibodies. We knew we should be looking for a malignancy, but a CT of the chest, abdomen, and pelvis was negative. A colonoscopy was next, but if that did not turn anything up, what would be next? Do we keep searching? How do we know where to look?
Worse, the pulse of methylprednisolone did not work completely, and he ended up needing a percutaneous endoscopic gastrostomy tube because he failed his swallow evaluation miserably. I was really saddened by all this. It made me feel small and insignificant in the face of such a terrible disease.
In that process of placing a PEG tube, we serendipitously found, on biopsy, adenocarcinoma at the gastroesophageal junction. Though this was, indeed, terrible news, it was a source of comfort for me that we had found the malignancy and would at least have a target for treatment.
I know he will not be my last dermatomyositis patient, and there are no prescribed guidelines for searching for a malignancy. How can we possibly find something if we have no idea what it is or where it might be?
I can think of so many more lupus, spondyloarthritis, temporal arteritis, even mechanical back pain patients who worry me, to say nothing of the not-insignificant number of patients for whom the diagnosis is uncertain. True, my learning curve has been steep in these first 3 years, but the more patients I see, the more striking the large number of phenotypes of our diseases. It’s quite humbling and has kept me up more nights than I expected.
Dr. Chan practices rheumatology in Pawtucket, R.I. E-mail her at [email protected].
"The greatest enemy of knowledge is the illusion of knowledge." – Stephen Hawking
In my fellowship, I had a challenging RA case. This woman was in her 50s, and usually she was quite dynamic, personable, and spunky. But the disease was wearing her down. She developed methotrexate pneumonitis. Leflunomide gave her severe diarrhea. She got frequent upper respiratory tract infections from etanercept. We could not get her prednisone dose lower than 15 mg/day. Whenever we saw her in clinic and she had encountered a new glitch in her treatment, my preceptor would say to her "you keep me up at night." Disturbed to hear this, I wondered how insecure I would be as a newly minted rheumatologist if my preceptor, with her decades of practice, still had uncertainties.
I feel like in these, the first 3 years of practice after training, I have an inordinate number of patients who keep me up at night. They come in all shapes and sizes. Even cases that I think are straightforward frequently end up being anything but.
I like treating patients with polymyalgia rheumatica, for example, because the relief they get from a little prednisone is so dramatic and immediate. Seems straightforward, no? But I get anxious about the diagnosis sometimes – what if I’m missing a paraneoplastic syndrome? Not infrequently there are patients who absolutely refuse to go on prednisone, and I worry about them, too. Or I get anxious about tapering, because I’ve had it happen often enough that their symptoms recur at 3 mg of prednisone and I need to put them on a DMARD, none of which have any conclusive evidence of efficacy.
Rheumatoid arthritis is not always easy, either. I have had my share of refractory cases, which, in this age of different varieties of biologics, is even more frustrating. (Although, for the life of me, I cannot imagine what it must have been like to practice before the age of biologics!) It’s even worse for refractory psoriatic arthritis, for which there are fewer drug options available.
And what about scleroderma? I watched a patient’s hands progress from being simply puffy at presentation to being contracted, with severe skin tightening and skin ulcerations over the PIP joints, in just 2 years. We are lucky to be close enough to Boston that I could send the patient to a medical center there to receive an investigational therapy, which seemed to lessen the patient’s symptoms somewhat. Unfortunately, she developed urinary bladder cancer and is now ineligible to receive the experimental anti-TGF-beta in an open label extension.
But perhaps my most insomnia-inducing patient is a lovely 70-year-old man with a new diagnosis of dermatomyositis. His antinuclear antibody was negative, and he had no myositis-specific antibodies. We knew we should be looking for a malignancy, but a CT of the chest, abdomen, and pelvis was negative. A colonoscopy was next, but if that did not turn anything up, what would be next? Do we keep searching? How do we know where to look?
Worse, the pulse of methylprednisolone did not work completely, and he ended up needing a percutaneous endoscopic gastrostomy tube because he failed his swallow evaluation miserably. I was really saddened by all this. It made me feel small and insignificant in the face of such a terrible disease.
In that process of placing a PEG tube, we serendipitously found, on biopsy, adenocarcinoma at the gastroesophageal junction. Though this was, indeed, terrible news, it was a source of comfort for me that we had found the malignancy and would at least have a target for treatment.
I know he will not be my last dermatomyositis patient, and there are no prescribed guidelines for searching for a malignancy. How can we possibly find something if we have no idea what it is or where it might be?
I can think of so many more lupus, spondyloarthritis, temporal arteritis, even mechanical back pain patients who worry me, to say nothing of the not-insignificant number of patients for whom the diagnosis is uncertain. True, my learning curve has been steep in these first 3 years, but the more patients I see, the more striking the large number of phenotypes of our diseases. It’s quite humbling and has kept me up more nights than I expected.
Dr. Chan practices rheumatology in Pawtucket, R.I. E-mail her at [email protected].

Communicating Discharge Instructions
Discharge from the hospital is a vulnerable time for patients. Nearly 1 in 5 patients experiences an adverse event during this transition, with a third of these being likely preventable.1, 2 Comprehensive discharge instructions are necessary to ensure a smooth transition from hospital to home, as the responsibility for care shifts from providers to the patient and caregivers. Unfortunately, patients often go home without understanding critical information about their hospital stay, such as their discharge diagnosis or medication changes,3, 4 leaving them both dissatisfied with their discharge instructions5 and at risk for hospital readmission.
Efforts to improve discharge education have focused on increasing communication between care provider and patient. The use of designated discharge coordinators,6, 7 implementation of teach‐back techniques to assess and confirm understanding,8 and adoption of patient‐centered educational materials all offer tools to improve communication with patients. However, guidelines for communication between providers and their shared role in patient discharge education, particularly between nurses and physicians, are scarce. Daily interdisciplinary rounds9 and shared electronic health records are potential ways to foster such communication, but the methods and frequency with which providers communicate about discharge instructions with each other is poorly understood. Furthermore, despite a common set of goals for discharge instructions,10, 11 it is unclear where the responsibility to provide these elements lies: with nurses, physicians, neither, or both.
Understanding perceptions and communication practices of providers in their delivery of discharge instructions is an important first step in defining responsibilities and improving accountability for discharge education. In this study, we surveyed nurses and physicians about their discharge education practices to better understand how each group sees their own role in discharge teaching, and how these findings may generate recommendations to improve future practices.
METHODS
Setting and Subjects
University of California, San Francisco Medical Center (UCSFMC) is a 600‐bed tertiary care academic teaching hospital. We surveyed interns, hospitalists on a teaching service, and day‐shift nurses from the inpatient medical service, based on care they provided at UCSFMC from July 2010 to February 2011. The 3 groups are the primary providers at our institution who deliver discharge education. The study was approved by our Institutional Review Board (IRB), the Committee on Human Research.
Survey Development
We developed a survey tool based on a literature review and expert input from local institutional leaders in nursing, residency training, and hospital medicine. The aims of the survey tool were to: 1) assess perceptions and practice of the nurse and physician role in patient discharge education; 2) describe the current practice of physiciannurse communication at discharge; and 3) assess openness to new communication tools.
Specific elements of discharge education assessed in the survey were established from the existing literature,10, 11 and our local best practices (see Supporting Information, Text Box, in the online version of this article). Prior to survey administration, we conducted informal focus groups of interns, hospitalists, and day‐shift nurses, and piloted the survey to assure clarity in the questions and proposed responses.
The survey asked respondents to assign responsibility for the discharge education elements to the physician, nurse, both, or neither, and then to describe their current practice in patient education and in physiciannurse communication. The frequency that respondents provide discharge education to patients and the frequency of nursephysician communication around the elements of discharge education were assessed using Likert scales (1 = never, 2 = rarely, 3 = sometimes, 4 = often, 5 = always). Finally, the survey asked respondents about their interest in tools to improve provider communication at discharge.
Survey Administration
Surveys were administered on paper and electronically, the latter using a commercial online survey tool. Paper surveys were circulated at nurse staff meetings on the 2 units in January and February 2011, with links to an electronic survey sent by e‐mail for those unable to attend. Electronic surveys were distributed via e‐mail to all interns and hospitalists in January 2011. The mid‐year time period was selected to ensure that all interns had provided clinical care at this hospital site. Two reminder e‐mails were sent to non‐respondents.
Data Analysis
Paper‐based surveys were subsequently entered into the online survey tool. Student t tests were used to compare Likert scale means between 2 provider groups, while analysis of variance (ANOVA) was used to compare differences between nurses, interns, and hospitalists. Chi‐squared analysis was used to compare dichotomous variables of agreement and disagreement.
Likert scales of education to patients were dichotomized into frequent education (that provided often or always) versus infrequent education (that provided never, rarely, or sometimes). Likert scales of communication between nurses were similarly dichotomized. Correlation between frequent education to patients (often or always) and the frequency of communication between nurses and physicians (often or always) was assessed using Pearson's r.
RESULTS
One hundred twenty‐nine providers responded to the survey with an overall survey response rate of 129/184 (70%). Forty‐five (64%) nurses, 56 (71%) interns, and 28 (78%) hospitalists participated. We organized the results into 4 sections based on the survey's question domains. First, we analyzed providers' (defined as nurses, interns, and hospitalists) perceived responsibility for the elements of patient discharge education (see Supporting Information, Text Box, in the online version of this article). Second, we examined how providers' responsibility compared to their reported practice. Third, we looked at the communication between nurses and physicians on the care team around these shared elements of discharge education. Lastly, we looked at providers' willingness to adopt tools to improve nursephysician communication around the time of discharge.
Perceived Responsibility for Discharge Education
Providers felt that most elements of discharge education were a shared responsibility, accounting for 58% of the responses to all the questions. Nurses, however, were the most likely to respond that the elements of discharge education were a shared responsibility, with 64% of all nursing responses indicating that the discharge education elements were a shared responsibility, compared to 54% of intern's responses and 55% of hospitalist's responses (P < 0.005). Correspondingly, nurses also responded least often that items were primarily a nursing responsibility (10% of all responses), compared to interns (12% of all responses) and hospitalists (18% of all responses) (nurses vs hospitalists, P < 0.001). No single elements were responsible for these differences, instead Table 1 demonstrates this trend across most elements. Hospitalists, despite their increased experience in discharging patients, were less likely than interns to respond that elements of discharge education were a physician's responsibility (21% vs 32% of all responses, P < 0.001).
| Nursing Responsibility (%) | Combined (%) | Physician Responsibility (%) | |||||||
|---|---|---|---|---|---|---|---|---|---|
| Nurse N = 45 | Intern N = 56 | Hospitalist N = 28 | Nurse N = 45 | Intern N = 56 | Hospitalist N = 28 | Nurse N = 45 | Intern N = 56 | Hospitalist N = 28 | |
| |||||||||
| Medication teaching and schedule | 33 | 29 | 33 | 55 | 58 | 52 | 0 | 0 | 0 |
| Contact information for postdischarge questions | 28 | 45 | 33 | 60 | 44 | 59 | 12 | 9 | 4 |
| Instructions for self‐care (eg, diet, activity, wound care) | 23 | 30 | 43 | 77 | 62 | 57 | 0 | 7 | 0 |
| Follow‐up appointment dates and times | 9 | 20 | 46 | 86 | 82 | 50 | 5 | 0 | 0 |
| Signs and symptoms that may develop and when to seek care (eg, call physician, 911) | 18 | 11 | 19 | 82 | 67 | 70 | 0 | 20 | 11 |
| Symptom management at home (eg, pain, SOB, nausea) | 11 | 2 | 21 | 89 | 69 | 75 | 0 | 29 | 4 |
| Home health services ordered | 5 | 9 | 21 | 79 | 65 | 54 | 14 | 22 | 0 |
| Reason for follow‐up appointments | 2 | 4 | 11 | 77 | 67 | 68 | 20 | 29 | 21 |
| Changes to medication regimen made during hospitalization | 2 | 2 | 4 | 66 | 53 | 79 | 30 | 43 | 18 |
| Discharge medical diagnoses | 0 | 0 | 0 | 60 | 56 | 61 | 40 | 45 | 39 |
| Explanation of diagnosis in lay terms | 0 | 0 | 0 | 69 | 45 | 64 | 31 | 55 | 36 |
| Summary of hospital findings and treatments (eg, CT scan results, response to antibiotics) | 0 | 0 | 0 | 18 | 11 | 18 | 82 | 88 | 71 |
| Pending results from studies during hospitalization | 0 | 2 | 0 | 12 | 27 | 29 | 88 | 66 | 68 |
The majority of providers were in agreement that 9 of the 13 elements were a shared nursephysician responsibility, with varying degrees of consensus. All groups also agreed that 2 of the elements, summary of hospital findings and pending results from studies during hospitalization, should be primarily the physician's responsibility. However, there was disagreement on the remaining 2 items. The majority of interns viewed the explanation of the diagnosis in lay terms as a physician responsibility (55%), compared to a minority of nurses (31%) and hospitalists (36%) (P < 0.05). Interns were also more likely than others to view providing contact information for questions after discharge as a uniquely nursing responsibility (45%), compared to nurses (28%) and hospitalists (33%) who viewed this as shared responsibility; this difference was not statistically significant.
Discharge Education by Providers on the Care Team
Despite nurses' reluctance to claim sole responsibility for elements of discharge education, nurses on the whole reported providing discharge education more often than either interns or hospitalists (P < 0.05). Figure 1 illustrates each group's reported practice of communicating specific discharge education on a Likert scale. For the 9 elements viewed as a shared responsibility and the 2 elements where there was disagreement, nurses reported communicating most items significantly more often than both interns and hospitalists (P < 0.001 for all elements except reason for follow‐up appointments, explanation of diagnosis in lay terms, and changes to medication regimen made during hospitalization). Items that were reported to be a physician responsibility were communicated more often by interns and hospitalists than nurses (P < 0.005), but were the items least often communicated by any care provider. Hospitalists did not report communicating any items significantly more than interns.
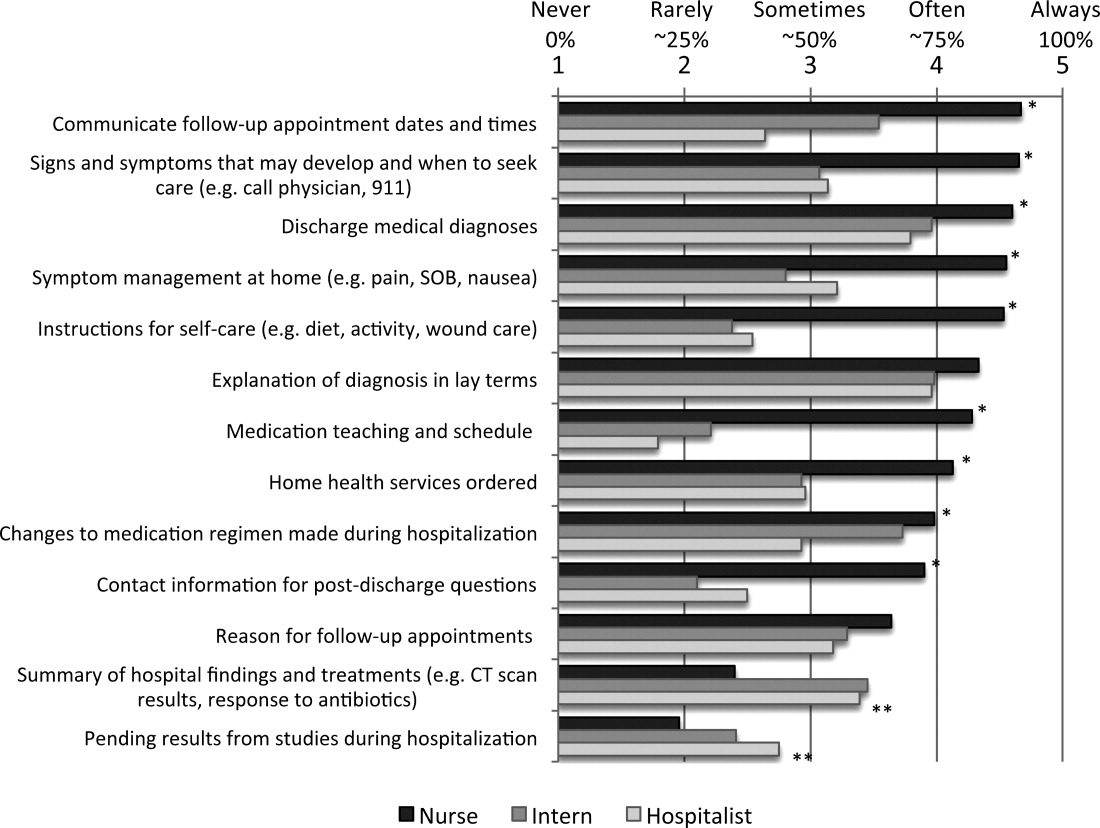
Communication Between Nurses and Physicians
Overall, communication between nurses and physicians was infrequent, with the 64% of nurses, 64% of interns, and 70% of hospitalists reporting that they never or rarely communicate with the other around any discharge education elements. Hospitalists were not more likely than interns to report communicating with nurses on any items, instead reported communicating with nurses around follow‐up appointments and home health services significantly less often (P < 0.05). There was a statistically significant increase in communication by all providers around items of shared responsibility, compared to items viewed as the responsibility of the physicians (14% vs 5.0% increase in communicated often or always; P < 0.001). Elements on which nurses and physicians communicated often or always were also discharge education elements reported as more often provided to patients (r = 0.577).
Potential Solutions for Sharing Discharge Information
Overall, both nurses, interns, and hospitalists were very open to proposed methods of enhancing their communication at discharge. Compared to interns and hospitalists, nurses were more likely to support communication tools, and significantly more in favor of verbal communication, discharge summary availability at the time of discharge, and access to a physician handoff tool. Only 1 solution, a standardized checklist, was favored more by interns and hospitalists, but the difference was not statistically significant. Verbal communication with the other group on the day of discharge was supported most strongly, with 100% of nurses, and 81% of interns and hospitalists reporting being likely or very likely to use this strategy. The least supported item by all groups was using white boards to communicate discharge information (Table 2).
| Likelihood of Using the Proposed Strategies | ||||
|---|---|---|---|---|
| Nurse | Intern | Hospitalist | P (ANOVA) | |
| ||||
| Verbal communication between providers on day of discharge | 4.8 | 4.2 | 4.1 | <0.001 |
| Discharge summary available at time of discharge | 4.7 | 3.8 | 4.4 | <0.001 |
| Discharge information in physician sign‐out tool | 4.3 | 3.8 | 3.2 | <0.001 |
| Nurse participation in daily physician rounds on the floor | 4.2 | 4.1 | 4.6 | 0.057 |
| Standardized checklist for discharges | 3.6 | 4.0 | 4.2 | 0.122 |
| Discharge information on white boards | 3.4 | 3.0 | 3.3 | 0.259 |
DISCUSSION
Our study demonstrated that nurses, interns, and hospitalists all feel that they play a pivotal role in discharge education. Compared to both interns and hospitalists, nurses were more likely to view discharge education as a shared responsibility, but nurses also reported providing more discharge education to patients. The elements of discharge education deemed a physician responsibility were reported as the least often provided to patients. Despite the majority of responses indicating that discharge education is a shared nursephysician responsibility, reported provider communication about discharge education was infrequent. Arguing for more communication, elements for which nurses and physicians perceived communicating more frequently were also more often reportedly conveyed to patients. The summative findings suggest that inconsistent discharge education and communication between providers may be leading to patients who are not regularly receiving complete discharge information. Nurses, interns, and hospitalists, however, were all very engaged in potential solutions to improve discharge communication, providing opportunities for immediate impact.
The question becomes where to start. Poor discharge instructions are associated with increased hospital readmission,10 and comprehensive discharge education is a suggested strategy to reduce preventable readmissions.12 Academic hospitalists, despite likely having witnessed the negative impact of poor discharge education, were not more likely than interns to report educating patients, nor did they report communicating more often with nurses. In teaching institutions, specifically, discharge education is being provided by multiple physicians: interns, residents, and hospitalists who may not have clearly defined roles in providing discharge education.13 Thus, providing comprehensive discharge instructions may require a hardwired system to ensure all elements of discharge education are addressed.
Further, our increasing dependence on technology may paradoxically necessitate more formal structures for in‐person communication, as the ability to enter discharge orders remotely leads to less frequent direct communication. Fortunately, as institutions move to computerized systems for discharge orders and instructions, there are increasing opportunities for a standardized approach to the elements of discharge education. While these results may suggest that one individual should be solely responsible for discharge education, trials using teams of nurse practitioners to facilitate transitions of care found no difference in patient length of stay or 30‐day readmission rates.14, 15
Formal systems that increase communication in high‐risk circumstances remain a focus in patient safety, and have been implemented successfully in procedural settings and with handoffs in patient care.1618 A prominent example is operating room time‐outs, which implemented a structured tool and shared process to increase nursephysician communication and reduce mortality.19 Since elements of discharge education with more frequent communication between nurses and physicians were more often conveyed to patients, our results suggest that a discharge time‐out might offer similar benefit. Fortunately, nurses and physicians rated verbal communication as the most desirable solution to share discharge education information. While not formally evaluated, one solution may be adoption of the previously described critical conversation, a structured format and a consistent time for communication that ensures both nurses and physicians understand what education needs to be provided to patients and by whom.20 The 13 discharge elements outlined in our study now provide a starting point for defining specific discussion points at discharge, delineation of who should communicate each element, and the basis for developing an operational discharge time‐out.
There are several limitations to our study. First, the survey instrument was not previously used or validated. However, we did seek formal and structured input while developing our survey, and conducted pilot testing to ensure clarity and comprehension with representatives of all study groups. Second, the 13 discharge education elements we included do not represent a comprehensive list, and were chosen based on our literature review and best practices at our institution. Third, our cross‐sectional study only captures perceptions and practices during a single time point, and may not adequately capture the greater continuum of true practice. Finally, our results may not be generalizable outside UCSFMC or other academic medical centers, particularly if other institutions have employed specific structures for discharge, such as a dedicated discharge coordinator.
CONCLUSION
Discharging patients is a complex process and one in which multiple providers and poor systems contribute to the redesign challenges. Providing high‐quality discharge education instructions to patients is an important step in making a complex process safer. Poor communication between nurses and physicians, complicated by ambiguous perceptions of responsibility for specific information, offers an opportunity for improvement efforts. We should not let well thought out treatment plans fail due to poor patient education on discharge. Our findings argue for a more systematic approach to the discharge education provided by nurses, interns, and hospitalists.
- ,,,,.The incidence and severity of adverse events affecting patients after discharge from the hospital.Ann Intern Med.2003;138(3):161–167.
- ,,, et al.Adverse events among medical patients after discharge from hospital.Can Med Assoc J.2004;170(3):345–349.
- ,.Patients' understanding of their treatment plans and diagnosis at discharge.Mayo Clin Proc.2005;80(8):991–994.
- ,,.Functional health literacy and understanding of medications at discharge.Mayo Clin Proc.2008;83(5):554–558.
- ,,,.Patients' perception of hospital care in the United States.N Engl J Med.2008;359(18):1921–1931.
- ,,, et al.Comprehensive discharge planning and home follow‐up of hospitalized elders: a randomized clinical trial.JAMA.1999;281(7):613–620.
- ,,, et al.A reengineered hospital discharge program to decrease rehospitalization: a randomized trial.Ann Intern Med.2009;150(3):178–187.
- ,,, et al.Closing the loop: physician communication with diabetic patients who have low health literacy.Arch Intern Med.2003;163(1):83–90.
- ,,, et al.Structured interdisciplinary rounds in a medical teaching unit: improving patient safety.Arch Intern Med.2011;171(7):678–684.
- ,,, et al.Transition of care for hospitalized elderly patients—development of a discharge checklist for hospitalists.J Hosp Med.2006;1(6):354–360.
- ,,,.Promoting effective transitions of care at hospital discharge: a review of key issues for hospitalists.J Hosp Med.2007;2(5):314–323.
- ,,,.Redefining readmission risk factors for general medicine patients.J Hosp Med.2011;6(2):54–60.
- ,,,,.“Out of sight, out of mind”: housestaff perceptions of quality‐limiting factors in discharge care at teaching hospitals.J Hosp Med.2012;7:376–381.
- ,,,,.To the hospital and back home again: a nurse practitioner‐based transitional care program for hospitalized homebound people.J Am Geriatr Soc.2011;59(3):544–551.
- ,,, et al.Improving the discharge process by embedding a discharge facilitator in a resident team.J Hosp Med.2011;6(9):494–500.
- ,,,,,.The potential for improved teamwork to reduce medical errors in the emergency department. The MedTeams Research Consortium.Ann Emerg Med.1999;34(3):373–383.
- ,,, et al.Association between nurse‐physician collaboration and patient outcomes in three intensive care units.Crit Care Med.1999;27(9):1991–1998.
- ,,,,.Risk‐adjusted morbidity in teaching hospitals correlates with reported levels of communication and collaboration on surgical teams but not with scale measures of teamwork climate, safety climate, or working conditions.J Am Coll Surg.2007;205(6):778–784.
- ,,, et al.A surgical safety checklist to reduce morbidity and mortality in a global population.N Engl J Med.2009;360(5):491–499.
- ,,,,,.Critical conversations: a call for a nonprocedural “time out.”J Hosp Med.2011;6(4):225–230.
Discharge from the hospital is a vulnerable time for patients. Nearly 1 in 5 patients experiences an adverse event during this transition, with a third of these being likely preventable.1, 2 Comprehensive discharge instructions are necessary to ensure a smooth transition from hospital to home, as the responsibility for care shifts from providers to the patient and caregivers. Unfortunately, patients often go home without understanding critical information about their hospital stay, such as their discharge diagnosis or medication changes,3, 4 leaving them both dissatisfied with their discharge instructions5 and at risk for hospital readmission.
Efforts to improve discharge education have focused on increasing communication between care provider and patient. The use of designated discharge coordinators,6, 7 implementation of teach‐back techniques to assess and confirm understanding,8 and adoption of patient‐centered educational materials all offer tools to improve communication with patients. However, guidelines for communication between providers and their shared role in patient discharge education, particularly between nurses and physicians, are scarce. Daily interdisciplinary rounds9 and shared electronic health records are potential ways to foster such communication, but the methods and frequency with which providers communicate about discharge instructions with each other is poorly understood. Furthermore, despite a common set of goals for discharge instructions,10, 11 it is unclear where the responsibility to provide these elements lies: with nurses, physicians, neither, or both.
Understanding perceptions and communication practices of providers in their delivery of discharge instructions is an important first step in defining responsibilities and improving accountability for discharge education. In this study, we surveyed nurses and physicians about their discharge education practices to better understand how each group sees their own role in discharge teaching, and how these findings may generate recommendations to improve future practices.
METHODS
Setting and Subjects
University of California, San Francisco Medical Center (UCSFMC) is a 600‐bed tertiary care academic teaching hospital. We surveyed interns, hospitalists on a teaching service, and day‐shift nurses from the inpatient medical service, based on care they provided at UCSFMC from July 2010 to February 2011. The 3 groups are the primary providers at our institution who deliver discharge education. The study was approved by our Institutional Review Board (IRB), the Committee on Human Research.
Survey Development
We developed a survey tool based on a literature review and expert input from local institutional leaders in nursing, residency training, and hospital medicine. The aims of the survey tool were to: 1) assess perceptions and practice of the nurse and physician role in patient discharge education; 2) describe the current practice of physiciannurse communication at discharge; and 3) assess openness to new communication tools.
Specific elements of discharge education assessed in the survey were established from the existing literature,10, 11 and our local best practices (see Supporting Information, Text Box, in the online version of this article). Prior to survey administration, we conducted informal focus groups of interns, hospitalists, and day‐shift nurses, and piloted the survey to assure clarity in the questions and proposed responses.
The survey asked respondents to assign responsibility for the discharge education elements to the physician, nurse, both, or neither, and then to describe their current practice in patient education and in physiciannurse communication. The frequency that respondents provide discharge education to patients and the frequency of nursephysician communication around the elements of discharge education were assessed using Likert scales (1 = never, 2 = rarely, 3 = sometimes, 4 = often, 5 = always). Finally, the survey asked respondents about their interest in tools to improve provider communication at discharge.
Survey Administration
Surveys were administered on paper and electronically, the latter using a commercial online survey tool. Paper surveys were circulated at nurse staff meetings on the 2 units in January and February 2011, with links to an electronic survey sent by e‐mail for those unable to attend. Electronic surveys were distributed via e‐mail to all interns and hospitalists in January 2011. The mid‐year time period was selected to ensure that all interns had provided clinical care at this hospital site. Two reminder e‐mails were sent to non‐respondents.
Data Analysis
Paper‐based surveys were subsequently entered into the online survey tool. Student t tests were used to compare Likert scale means between 2 provider groups, while analysis of variance (ANOVA) was used to compare differences between nurses, interns, and hospitalists. Chi‐squared analysis was used to compare dichotomous variables of agreement and disagreement.
Likert scales of education to patients were dichotomized into frequent education (that provided often or always) versus infrequent education (that provided never, rarely, or sometimes). Likert scales of communication between nurses were similarly dichotomized. Correlation between frequent education to patients (often or always) and the frequency of communication between nurses and physicians (often or always) was assessed using Pearson's r.
RESULTS
One hundred twenty‐nine providers responded to the survey with an overall survey response rate of 129/184 (70%). Forty‐five (64%) nurses, 56 (71%) interns, and 28 (78%) hospitalists participated. We organized the results into 4 sections based on the survey's question domains. First, we analyzed providers' (defined as nurses, interns, and hospitalists) perceived responsibility for the elements of patient discharge education (see Supporting Information, Text Box, in the online version of this article). Second, we examined how providers' responsibility compared to their reported practice. Third, we looked at the communication between nurses and physicians on the care team around these shared elements of discharge education. Lastly, we looked at providers' willingness to adopt tools to improve nursephysician communication around the time of discharge.
Perceived Responsibility for Discharge Education
Providers felt that most elements of discharge education were a shared responsibility, accounting for 58% of the responses to all the questions. Nurses, however, were the most likely to respond that the elements of discharge education were a shared responsibility, with 64% of all nursing responses indicating that the discharge education elements were a shared responsibility, compared to 54% of intern's responses and 55% of hospitalist's responses (P < 0.005). Correspondingly, nurses also responded least often that items were primarily a nursing responsibility (10% of all responses), compared to interns (12% of all responses) and hospitalists (18% of all responses) (nurses vs hospitalists, P < 0.001). No single elements were responsible for these differences, instead Table 1 demonstrates this trend across most elements. Hospitalists, despite their increased experience in discharging patients, were less likely than interns to respond that elements of discharge education were a physician's responsibility (21% vs 32% of all responses, P < 0.001).
| Nursing Responsibility (%) | Combined (%) | Physician Responsibility (%) | |||||||
|---|---|---|---|---|---|---|---|---|---|
| Nurse N = 45 | Intern N = 56 | Hospitalist N = 28 | Nurse N = 45 | Intern N = 56 | Hospitalist N = 28 | Nurse N = 45 | Intern N = 56 | Hospitalist N = 28 | |
| |||||||||
| Medication teaching and schedule | 33 | 29 | 33 | 55 | 58 | 52 | 0 | 0 | 0 |
| Contact information for postdischarge questions | 28 | 45 | 33 | 60 | 44 | 59 | 12 | 9 | 4 |
| Instructions for self‐care (eg, diet, activity, wound care) | 23 | 30 | 43 | 77 | 62 | 57 | 0 | 7 | 0 |
| Follow‐up appointment dates and times | 9 | 20 | 46 | 86 | 82 | 50 | 5 | 0 | 0 |
| Signs and symptoms that may develop and when to seek care (eg, call physician, 911) | 18 | 11 | 19 | 82 | 67 | 70 | 0 | 20 | 11 |
| Symptom management at home (eg, pain, SOB, nausea) | 11 | 2 | 21 | 89 | 69 | 75 | 0 | 29 | 4 |
| Home health services ordered | 5 | 9 | 21 | 79 | 65 | 54 | 14 | 22 | 0 |
| Reason for follow‐up appointments | 2 | 4 | 11 | 77 | 67 | 68 | 20 | 29 | 21 |
| Changes to medication regimen made during hospitalization | 2 | 2 | 4 | 66 | 53 | 79 | 30 | 43 | 18 |
| Discharge medical diagnoses | 0 | 0 | 0 | 60 | 56 | 61 | 40 | 45 | 39 |
| Explanation of diagnosis in lay terms | 0 | 0 | 0 | 69 | 45 | 64 | 31 | 55 | 36 |
| Summary of hospital findings and treatments (eg, CT scan results, response to antibiotics) | 0 | 0 | 0 | 18 | 11 | 18 | 82 | 88 | 71 |
| Pending results from studies during hospitalization | 0 | 2 | 0 | 12 | 27 | 29 | 88 | 66 | 68 |
The majority of providers were in agreement that 9 of the 13 elements were a shared nursephysician responsibility, with varying degrees of consensus. All groups also agreed that 2 of the elements, summary of hospital findings and pending results from studies during hospitalization, should be primarily the physician's responsibility. However, there was disagreement on the remaining 2 items. The majority of interns viewed the explanation of the diagnosis in lay terms as a physician responsibility (55%), compared to a minority of nurses (31%) and hospitalists (36%) (P < 0.05). Interns were also more likely than others to view providing contact information for questions after discharge as a uniquely nursing responsibility (45%), compared to nurses (28%) and hospitalists (33%) who viewed this as shared responsibility; this difference was not statistically significant.
Discharge Education by Providers on the Care Team
Despite nurses' reluctance to claim sole responsibility for elements of discharge education, nurses on the whole reported providing discharge education more often than either interns or hospitalists (P < 0.05). Figure 1 illustrates each group's reported practice of communicating specific discharge education on a Likert scale. For the 9 elements viewed as a shared responsibility and the 2 elements where there was disagreement, nurses reported communicating most items significantly more often than both interns and hospitalists (P < 0.001 for all elements except reason for follow‐up appointments, explanation of diagnosis in lay terms, and changes to medication regimen made during hospitalization). Items that were reported to be a physician responsibility were communicated more often by interns and hospitalists than nurses (P < 0.005), but were the items least often communicated by any care provider. Hospitalists did not report communicating any items significantly more than interns.
Communication Between Nurses and Physicians
Overall, communication between nurses and physicians was infrequent, with the 64% of nurses, 64% of interns, and 70% of hospitalists reporting that they never or rarely communicate with the other around any discharge education elements. Hospitalists were not more likely than interns to report communicating with nurses on any items, instead reported communicating with nurses around follow‐up appointments and home health services significantly less often (P < 0.05). There was a statistically significant increase in communication by all providers around items of shared responsibility, compared to items viewed as the responsibility of the physicians (14% vs 5.0% increase in communicated often or always; P < 0.001). Elements on which nurses and physicians communicated often or always were also discharge education elements reported as more often provided to patients (r = 0.577).
Potential Solutions for Sharing Discharge Information
Overall, both nurses, interns, and hospitalists were very open to proposed methods of enhancing their communication at discharge. Compared to interns and hospitalists, nurses were more likely to support communication tools, and significantly more in favor of verbal communication, discharge summary availability at the time of discharge, and access to a physician handoff tool. Only 1 solution, a standardized checklist, was favored more by interns and hospitalists, but the difference was not statistically significant. Verbal communication with the other group on the day of discharge was supported most strongly, with 100% of nurses, and 81% of interns and hospitalists reporting being likely or very likely to use this strategy. The least supported item by all groups was using white boards to communicate discharge information (Table 2).
| Likelihood of Using the Proposed Strategies | ||||
|---|---|---|---|---|
| Nurse | Intern | Hospitalist | P (ANOVA) | |
| ||||
| Verbal communication between providers on day of discharge | 4.8 | 4.2 | 4.1 | <0.001 |
| Discharge summary available at time of discharge | 4.7 | 3.8 | 4.4 | <0.001 |
| Discharge information in physician sign‐out tool | 4.3 | 3.8 | 3.2 | <0.001 |
| Nurse participation in daily physician rounds on the floor | 4.2 | 4.1 | 4.6 | 0.057 |
| Standardized checklist for discharges | 3.6 | 4.0 | 4.2 | 0.122 |
| Discharge information on white boards | 3.4 | 3.0 | 3.3 | 0.259 |
DISCUSSION
Our study demonstrated that nurses, interns, and hospitalists all feel that they play a pivotal role in discharge education. Compared to both interns and hospitalists, nurses were more likely to view discharge education as a shared responsibility, but nurses also reported providing more discharge education to patients. The elements of discharge education deemed a physician responsibility were reported as the least often provided to patients. Despite the majority of responses indicating that discharge education is a shared nursephysician responsibility, reported provider communication about discharge education was infrequent. Arguing for more communication, elements for which nurses and physicians perceived communicating more frequently were also more often reportedly conveyed to patients. The summative findings suggest that inconsistent discharge education and communication between providers may be leading to patients who are not regularly receiving complete discharge information. Nurses, interns, and hospitalists, however, were all very engaged in potential solutions to improve discharge communication, providing opportunities for immediate impact.
The question becomes where to start. Poor discharge instructions are associated with increased hospital readmission,10 and comprehensive discharge education is a suggested strategy to reduce preventable readmissions.12 Academic hospitalists, despite likely having witnessed the negative impact of poor discharge education, were not more likely than interns to report educating patients, nor did they report communicating more often with nurses. In teaching institutions, specifically, discharge education is being provided by multiple physicians: interns, residents, and hospitalists who may not have clearly defined roles in providing discharge education.13 Thus, providing comprehensive discharge instructions may require a hardwired system to ensure all elements of discharge education are addressed.
Further, our increasing dependence on technology may paradoxically necessitate more formal structures for in‐person communication, as the ability to enter discharge orders remotely leads to less frequent direct communication. Fortunately, as institutions move to computerized systems for discharge orders and instructions, there are increasing opportunities for a standardized approach to the elements of discharge education. While these results may suggest that one individual should be solely responsible for discharge education, trials using teams of nurse practitioners to facilitate transitions of care found no difference in patient length of stay or 30‐day readmission rates.14, 15
Formal systems that increase communication in high‐risk circumstances remain a focus in patient safety, and have been implemented successfully in procedural settings and with handoffs in patient care.1618 A prominent example is operating room time‐outs, which implemented a structured tool and shared process to increase nursephysician communication and reduce mortality.19 Since elements of discharge education with more frequent communication between nurses and physicians were more often conveyed to patients, our results suggest that a discharge time‐out might offer similar benefit. Fortunately, nurses and physicians rated verbal communication as the most desirable solution to share discharge education information. While not formally evaluated, one solution may be adoption of the previously described critical conversation, a structured format and a consistent time for communication that ensures both nurses and physicians understand what education needs to be provided to patients and by whom.20 The 13 discharge elements outlined in our study now provide a starting point for defining specific discussion points at discharge, delineation of who should communicate each element, and the basis for developing an operational discharge time‐out.
There are several limitations to our study. First, the survey instrument was not previously used or validated. However, we did seek formal and structured input while developing our survey, and conducted pilot testing to ensure clarity and comprehension with representatives of all study groups. Second, the 13 discharge education elements we included do not represent a comprehensive list, and were chosen based on our literature review and best practices at our institution. Third, our cross‐sectional study only captures perceptions and practices during a single time point, and may not adequately capture the greater continuum of true practice. Finally, our results may not be generalizable outside UCSFMC or other academic medical centers, particularly if other institutions have employed specific structures for discharge, such as a dedicated discharge coordinator.
CONCLUSION
Discharging patients is a complex process and one in which multiple providers and poor systems contribute to the redesign challenges. Providing high‐quality discharge education instructions to patients is an important step in making a complex process safer. Poor communication between nurses and physicians, complicated by ambiguous perceptions of responsibility for specific information, offers an opportunity for improvement efforts. We should not let well thought out treatment plans fail due to poor patient education on discharge. Our findings argue for a more systematic approach to the discharge education provided by nurses, interns, and hospitalists.
Discharge from the hospital is a vulnerable time for patients. Nearly 1 in 5 patients experiences an adverse event during this transition, with a third of these being likely preventable.1, 2 Comprehensive discharge instructions are necessary to ensure a smooth transition from hospital to home, as the responsibility for care shifts from providers to the patient and caregivers. Unfortunately, patients often go home without understanding critical information about their hospital stay, such as their discharge diagnosis or medication changes,3, 4 leaving them both dissatisfied with their discharge instructions5 and at risk for hospital readmission.
Efforts to improve discharge education have focused on increasing communication between care provider and patient. The use of designated discharge coordinators,6, 7 implementation of teach‐back techniques to assess and confirm understanding,8 and adoption of patient‐centered educational materials all offer tools to improve communication with patients. However, guidelines for communication between providers and their shared role in patient discharge education, particularly between nurses and physicians, are scarce. Daily interdisciplinary rounds9 and shared electronic health records are potential ways to foster such communication, but the methods and frequency with which providers communicate about discharge instructions with each other is poorly understood. Furthermore, despite a common set of goals for discharge instructions,10, 11 it is unclear where the responsibility to provide these elements lies: with nurses, physicians, neither, or both.
Understanding perceptions and communication practices of providers in their delivery of discharge instructions is an important first step in defining responsibilities and improving accountability for discharge education. In this study, we surveyed nurses and physicians about their discharge education practices to better understand how each group sees their own role in discharge teaching, and how these findings may generate recommendations to improve future practices.
METHODS
Setting and Subjects
University of California, San Francisco Medical Center (UCSFMC) is a 600‐bed tertiary care academic teaching hospital. We surveyed interns, hospitalists on a teaching service, and day‐shift nurses from the inpatient medical service, based on care they provided at UCSFMC from July 2010 to February 2011. The 3 groups are the primary providers at our institution who deliver discharge education. The study was approved by our Institutional Review Board (IRB), the Committee on Human Research.
Survey Development
We developed a survey tool based on a literature review and expert input from local institutional leaders in nursing, residency training, and hospital medicine. The aims of the survey tool were to: 1) assess perceptions and practice of the nurse and physician role in patient discharge education; 2) describe the current practice of physiciannurse communication at discharge; and 3) assess openness to new communication tools.
Specific elements of discharge education assessed in the survey were established from the existing literature,10, 11 and our local best practices (see Supporting Information, Text Box, in the online version of this article). Prior to survey administration, we conducted informal focus groups of interns, hospitalists, and day‐shift nurses, and piloted the survey to assure clarity in the questions and proposed responses.
The survey asked respondents to assign responsibility for the discharge education elements to the physician, nurse, both, or neither, and then to describe their current practice in patient education and in physiciannurse communication. The frequency that respondents provide discharge education to patients and the frequency of nursephysician communication around the elements of discharge education were assessed using Likert scales (1 = never, 2 = rarely, 3 = sometimes, 4 = often, 5 = always). Finally, the survey asked respondents about their interest in tools to improve provider communication at discharge.
Survey Administration
Surveys were administered on paper and electronically, the latter using a commercial online survey tool. Paper surveys were circulated at nurse staff meetings on the 2 units in January and February 2011, with links to an electronic survey sent by e‐mail for those unable to attend. Electronic surveys were distributed via e‐mail to all interns and hospitalists in January 2011. The mid‐year time period was selected to ensure that all interns had provided clinical care at this hospital site. Two reminder e‐mails were sent to non‐respondents.
Data Analysis
Paper‐based surveys were subsequently entered into the online survey tool. Student t tests were used to compare Likert scale means between 2 provider groups, while analysis of variance (ANOVA) was used to compare differences between nurses, interns, and hospitalists. Chi‐squared analysis was used to compare dichotomous variables of agreement and disagreement.
Likert scales of education to patients were dichotomized into frequent education (that provided often or always) versus infrequent education (that provided never, rarely, or sometimes). Likert scales of communication between nurses were similarly dichotomized. Correlation between frequent education to patients (often or always) and the frequency of communication between nurses and physicians (often or always) was assessed using Pearson's r.
RESULTS
One hundred twenty‐nine providers responded to the survey with an overall survey response rate of 129/184 (70%). Forty‐five (64%) nurses, 56 (71%) interns, and 28 (78%) hospitalists participated. We organized the results into 4 sections based on the survey's question domains. First, we analyzed providers' (defined as nurses, interns, and hospitalists) perceived responsibility for the elements of patient discharge education (see Supporting Information, Text Box, in the online version of this article). Second, we examined how providers' responsibility compared to their reported practice. Third, we looked at the communication between nurses and physicians on the care team around these shared elements of discharge education. Lastly, we looked at providers' willingness to adopt tools to improve nursephysician communication around the time of discharge.
Perceived Responsibility for Discharge Education
Providers felt that most elements of discharge education were a shared responsibility, accounting for 58% of the responses to all the questions. Nurses, however, were the most likely to respond that the elements of discharge education were a shared responsibility, with 64% of all nursing responses indicating that the discharge education elements were a shared responsibility, compared to 54% of intern's responses and 55% of hospitalist's responses (P < 0.005). Correspondingly, nurses also responded least often that items were primarily a nursing responsibility (10% of all responses), compared to interns (12% of all responses) and hospitalists (18% of all responses) (nurses vs hospitalists, P < 0.001). No single elements were responsible for these differences, instead Table 1 demonstrates this trend across most elements. Hospitalists, despite their increased experience in discharging patients, were less likely than interns to respond that elements of discharge education were a physician's responsibility (21% vs 32% of all responses, P < 0.001).
| Nursing Responsibility (%) | Combined (%) | Physician Responsibility (%) | |||||||
|---|---|---|---|---|---|---|---|---|---|
| Nurse N = 45 | Intern N = 56 | Hospitalist N = 28 | Nurse N = 45 | Intern N = 56 | Hospitalist N = 28 | Nurse N = 45 | Intern N = 56 | Hospitalist N = 28 | |
| |||||||||
| Medication teaching and schedule | 33 | 29 | 33 | 55 | 58 | 52 | 0 | 0 | 0 |
| Contact information for postdischarge questions | 28 | 45 | 33 | 60 | 44 | 59 | 12 | 9 | 4 |
| Instructions for self‐care (eg, diet, activity, wound care) | 23 | 30 | 43 | 77 | 62 | 57 | 0 | 7 | 0 |
| Follow‐up appointment dates and times | 9 | 20 | 46 | 86 | 82 | 50 | 5 | 0 | 0 |
| Signs and symptoms that may develop and when to seek care (eg, call physician, 911) | 18 | 11 | 19 | 82 | 67 | 70 | 0 | 20 | 11 |
| Symptom management at home (eg, pain, SOB, nausea) | 11 | 2 | 21 | 89 | 69 | 75 | 0 | 29 | 4 |
| Home health services ordered | 5 | 9 | 21 | 79 | 65 | 54 | 14 | 22 | 0 |
| Reason for follow‐up appointments | 2 | 4 | 11 | 77 | 67 | 68 | 20 | 29 | 21 |
| Changes to medication regimen made during hospitalization | 2 | 2 | 4 | 66 | 53 | 79 | 30 | 43 | 18 |
| Discharge medical diagnoses | 0 | 0 | 0 | 60 | 56 | 61 | 40 | 45 | 39 |
| Explanation of diagnosis in lay terms | 0 | 0 | 0 | 69 | 45 | 64 | 31 | 55 | 36 |
| Summary of hospital findings and treatments (eg, CT scan results, response to antibiotics) | 0 | 0 | 0 | 18 | 11 | 18 | 82 | 88 | 71 |
| Pending results from studies during hospitalization | 0 | 2 | 0 | 12 | 27 | 29 | 88 | 66 | 68 |
The majority of providers were in agreement that 9 of the 13 elements were a shared nursephysician responsibility, with varying degrees of consensus. All groups also agreed that 2 of the elements, summary of hospital findings and pending results from studies during hospitalization, should be primarily the physician's responsibility. However, there was disagreement on the remaining 2 items. The majority of interns viewed the explanation of the diagnosis in lay terms as a physician responsibility (55%), compared to a minority of nurses (31%) and hospitalists (36%) (P < 0.05). Interns were also more likely than others to view providing contact information for questions after discharge as a uniquely nursing responsibility (45%), compared to nurses (28%) and hospitalists (33%) who viewed this as shared responsibility; this difference was not statistically significant.
Discharge Education by Providers on the Care Team
Despite nurses' reluctance to claim sole responsibility for elements of discharge education, nurses on the whole reported providing discharge education more often than either interns or hospitalists (P < 0.05). Figure 1 illustrates each group's reported practice of communicating specific discharge education on a Likert scale. For the 9 elements viewed as a shared responsibility and the 2 elements where there was disagreement, nurses reported communicating most items significantly more often than both interns and hospitalists (P < 0.001 for all elements except reason for follow‐up appointments, explanation of diagnosis in lay terms, and changes to medication regimen made during hospitalization). Items that were reported to be a physician responsibility were communicated more often by interns and hospitalists than nurses (P < 0.005), but were the items least often communicated by any care provider. Hospitalists did not report communicating any items significantly more than interns.
Communication Between Nurses and Physicians
Overall, communication between nurses and physicians was infrequent, with the 64% of nurses, 64% of interns, and 70% of hospitalists reporting that they never or rarely communicate with the other around any discharge education elements. Hospitalists were not more likely than interns to report communicating with nurses on any items, instead reported communicating with nurses around follow‐up appointments and home health services significantly less often (P < 0.05). There was a statistically significant increase in communication by all providers around items of shared responsibility, compared to items viewed as the responsibility of the physicians (14% vs 5.0% increase in communicated often or always; P < 0.001). Elements on which nurses and physicians communicated often or always were also discharge education elements reported as more often provided to patients (r = 0.577).
Potential Solutions for Sharing Discharge Information
Overall, both nurses, interns, and hospitalists were very open to proposed methods of enhancing their communication at discharge. Compared to interns and hospitalists, nurses were more likely to support communication tools, and significantly more in favor of verbal communication, discharge summary availability at the time of discharge, and access to a physician handoff tool. Only 1 solution, a standardized checklist, was favored more by interns and hospitalists, but the difference was not statistically significant. Verbal communication with the other group on the day of discharge was supported most strongly, with 100% of nurses, and 81% of interns and hospitalists reporting being likely or very likely to use this strategy. The least supported item by all groups was using white boards to communicate discharge information (Table 2).
| Likelihood of Using the Proposed Strategies | ||||
|---|---|---|---|---|
| Nurse | Intern | Hospitalist | P (ANOVA) | |
| ||||
| Verbal communication between providers on day of discharge | 4.8 | 4.2 | 4.1 | <0.001 |
| Discharge summary available at time of discharge | 4.7 | 3.8 | 4.4 | <0.001 |
| Discharge information in physician sign‐out tool | 4.3 | 3.8 | 3.2 | <0.001 |
| Nurse participation in daily physician rounds on the floor | 4.2 | 4.1 | 4.6 | 0.057 |
| Standardized checklist for discharges | 3.6 | 4.0 | 4.2 | 0.122 |
| Discharge information on white boards | 3.4 | 3.0 | 3.3 | 0.259 |
DISCUSSION
Our study demonstrated that nurses, interns, and hospitalists all feel that they play a pivotal role in discharge education. Compared to both interns and hospitalists, nurses were more likely to view discharge education as a shared responsibility, but nurses also reported providing more discharge education to patients. The elements of discharge education deemed a physician responsibility were reported as the least often provided to patients. Despite the majority of responses indicating that discharge education is a shared nursephysician responsibility, reported provider communication about discharge education was infrequent. Arguing for more communication, elements for which nurses and physicians perceived communicating more frequently were also more often reportedly conveyed to patients. The summative findings suggest that inconsistent discharge education and communication between providers may be leading to patients who are not regularly receiving complete discharge information. Nurses, interns, and hospitalists, however, were all very engaged in potential solutions to improve discharge communication, providing opportunities for immediate impact.
The question becomes where to start. Poor discharge instructions are associated with increased hospital readmission,10 and comprehensive discharge education is a suggested strategy to reduce preventable readmissions.12 Academic hospitalists, despite likely having witnessed the negative impact of poor discharge education, were not more likely than interns to report educating patients, nor did they report communicating more often with nurses. In teaching institutions, specifically, discharge education is being provided by multiple physicians: interns, residents, and hospitalists who may not have clearly defined roles in providing discharge education.13 Thus, providing comprehensive discharge instructions may require a hardwired system to ensure all elements of discharge education are addressed.
Further, our increasing dependence on technology may paradoxically necessitate more formal structures for in‐person communication, as the ability to enter discharge orders remotely leads to less frequent direct communication. Fortunately, as institutions move to computerized systems for discharge orders and instructions, there are increasing opportunities for a standardized approach to the elements of discharge education. While these results may suggest that one individual should be solely responsible for discharge education, trials using teams of nurse practitioners to facilitate transitions of care found no difference in patient length of stay or 30‐day readmission rates.14, 15
Formal systems that increase communication in high‐risk circumstances remain a focus in patient safety, and have been implemented successfully in procedural settings and with handoffs in patient care.1618 A prominent example is operating room time‐outs, which implemented a structured tool and shared process to increase nursephysician communication and reduce mortality.19 Since elements of discharge education with more frequent communication between nurses and physicians were more often conveyed to patients, our results suggest that a discharge time‐out might offer similar benefit. Fortunately, nurses and physicians rated verbal communication as the most desirable solution to share discharge education information. While not formally evaluated, one solution may be adoption of the previously described critical conversation, a structured format and a consistent time for communication that ensures both nurses and physicians understand what education needs to be provided to patients and by whom.20 The 13 discharge elements outlined in our study now provide a starting point for defining specific discussion points at discharge, delineation of who should communicate each element, and the basis for developing an operational discharge time‐out.
There are several limitations to our study. First, the survey instrument was not previously used or validated. However, we did seek formal and structured input while developing our survey, and conducted pilot testing to ensure clarity and comprehension with representatives of all study groups. Second, the 13 discharge education elements we included do not represent a comprehensive list, and were chosen based on our literature review and best practices at our institution. Third, our cross‐sectional study only captures perceptions and practices during a single time point, and may not adequately capture the greater continuum of true practice. Finally, our results may not be generalizable outside UCSFMC or other academic medical centers, particularly if other institutions have employed specific structures for discharge, such as a dedicated discharge coordinator.
CONCLUSION
Discharging patients is a complex process and one in which multiple providers and poor systems contribute to the redesign challenges. Providing high‐quality discharge education instructions to patients is an important step in making a complex process safer. Poor communication between nurses and physicians, complicated by ambiguous perceptions of responsibility for specific information, offers an opportunity for improvement efforts. We should not let well thought out treatment plans fail due to poor patient education on discharge. Our findings argue for a more systematic approach to the discharge education provided by nurses, interns, and hospitalists.
- ,,,,.The incidence and severity of adverse events affecting patients after discharge from the hospital.Ann Intern Med.2003;138(3):161–167.
- ,,, et al.Adverse events among medical patients after discharge from hospital.Can Med Assoc J.2004;170(3):345–349.
- ,.Patients' understanding of their treatment plans and diagnosis at discharge.Mayo Clin Proc.2005;80(8):991–994.
- ,,.Functional health literacy and understanding of medications at discharge.Mayo Clin Proc.2008;83(5):554–558.
- ,,,.Patients' perception of hospital care in the United States.N Engl J Med.2008;359(18):1921–1931.
- ,,, et al.Comprehensive discharge planning and home follow‐up of hospitalized elders: a randomized clinical trial.JAMA.1999;281(7):613–620.
- ,,, et al.A reengineered hospital discharge program to decrease rehospitalization: a randomized trial.Ann Intern Med.2009;150(3):178–187.
- ,,, et al.Closing the loop: physician communication with diabetic patients who have low health literacy.Arch Intern Med.2003;163(1):83–90.
- ,,, et al.Structured interdisciplinary rounds in a medical teaching unit: improving patient safety.Arch Intern Med.2011;171(7):678–684.
- ,,, et al.Transition of care for hospitalized elderly patients—development of a discharge checklist for hospitalists.J Hosp Med.2006;1(6):354–360.
- ,,,.Promoting effective transitions of care at hospital discharge: a review of key issues for hospitalists.J Hosp Med.2007;2(5):314–323.
- ,,,.Redefining readmission risk factors for general medicine patients.J Hosp Med.2011;6(2):54–60.
- ,,,,.“Out of sight, out of mind”: housestaff perceptions of quality‐limiting factors in discharge care at teaching hospitals.J Hosp Med.2012;7:376–381.
- ,,,,.To the hospital and back home again: a nurse practitioner‐based transitional care program for hospitalized homebound people.J Am Geriatr Soc.2011;59(3):544–551.
- ,,, et al.Improving the discharge process by embedding a discharge facilitator in a resident team.J Hosp Med.2011;6(9):494–500.
- ,,,,,.The potential for improved teamwork to reduce medical errors in the emergency department. The MedTeams Research Consortium.Ann Emerg Med.1999;34(3):373–383.
- ,,, et al.Association between nurse‐physician collaboration and patient outcomes in three intensive care units.Crit Care Med.1999;27(9):1991–1998.
- ,,,,.Risk‐adjusted morbidity in teaching hospitals correlates with reported levels of communication and collaboration on surgical teams but not with scale measures of teamwork climate, safety climate, or working conditions.J Am Coll Surg.2007;205(6):778–784.
- ,,, et al.A surgical safety checklist to reduce morbidity and mortality in a global population.N Engl J Med.2009;360(5):491–499.
- ,,,,,.Critical conversations: a call for a nonprocedural “time out.”J Hosp Med.2011;6(4):225–230.
- ,,,,.The incidence and severity of adverse events affecting patients after discharge from the hospital.Ann Intern Med.2003;138(3):161–167.
- ,,, et al.Adverse events among medical patients after discharge from hospital.Can Med Assoc J.2004;170(3):345–349.
- ,.Patients' understanding of their treatment plans and diagnosis at discharge.Mayo Clin Proc.2005;80(8):991–994.
- ,,.Functional health literacy and understanding of medications at discharge.Mayo Clin Proc.2008;83(5):554–558.
- ,,,.Patients' perception of hospital care in the United States.N Engl J Med.2008;359(18):1921–1931.
- ,,, et al.Comprehensive discharge planning and home follow‐up of hospitalized elders: a randomized clinical trial.JAMA.1999;281(7):613–620.
- ,,, et al.A reengineered hospital discharge program to decrease rehospitalization: a randomized trial.Ann Intern Med.2009;150(3):178–187.
- ,,, et al.Closing the loop: physician communication with diabetic patients who have low health literacy.Arch Intern Med.2003;163(1):83–90.
- ,,, et al.Structured interdisciplinary rounds in a medical teaching unit: improving patient safety.Arch Intern Med.2011;171(7):678–684.
- ,,, et al.Transition of care for hospitalized elderly patients—development of a discharge checklist for hospitalists.J Hosp Med.2006;1(6):354–360.
- ,,,.Promoting effective transitions of care at hospital discharge: a review of key issues for hospitalists.J Hosp Med.2007;2(5):314–323.
- ,,,.Redefining readmission risk factors for general medicine patients.J Hosp Med.2011;6(2):54–60.
- ,,,,.“Out of sight, out of mind”: housestaff perceptions of quality‐limiting factors in discharge care at teaching hospitals.J Hosp Med.2012;7:376–381.
- ,,,,.To the hospital and back home again: a nurse practitioner‐based transitional care program for hospitalized homebound people.J Am Geriatr Soc.2011;59(3):544–551.
- ,,, et al.Improving the discharge process by embedding a discharge facilitator in a resident team.J Hosp Med.2011;6(9):494–500.
- ,,,,,.The potential for improved teamwork to reduce medical errors in the emergency department. The MedTeams Research Consortium.Ann Emerg Med.1999;34(3):373–383.
- ,,, et al.Association between nurse‐physician collaboration and patient outcomes in three intensive care units.Crit Care Med.1999;27(9):1991–1998.
- ,,,,.Risk‐adjusted morbidity in teaching hospitals correlates with reported levels of communication and collaboration on surgical teams but not with scale measures of teamwork climate, safety climate, or working conditions.J Am Coll Surg.2007;205(6):778–784.
- ,,, et al.A surgical safety checklist to reduce morbidity and mortality in a global population.N Engl J Med.2009;360(5):491–499.
- ,,,,,.Critical conversations: a call for a nonprocedural “time out.”J Hosp Med.2011;6(4):225–230.
Copyright © 2012 Society of Hospital Medicine
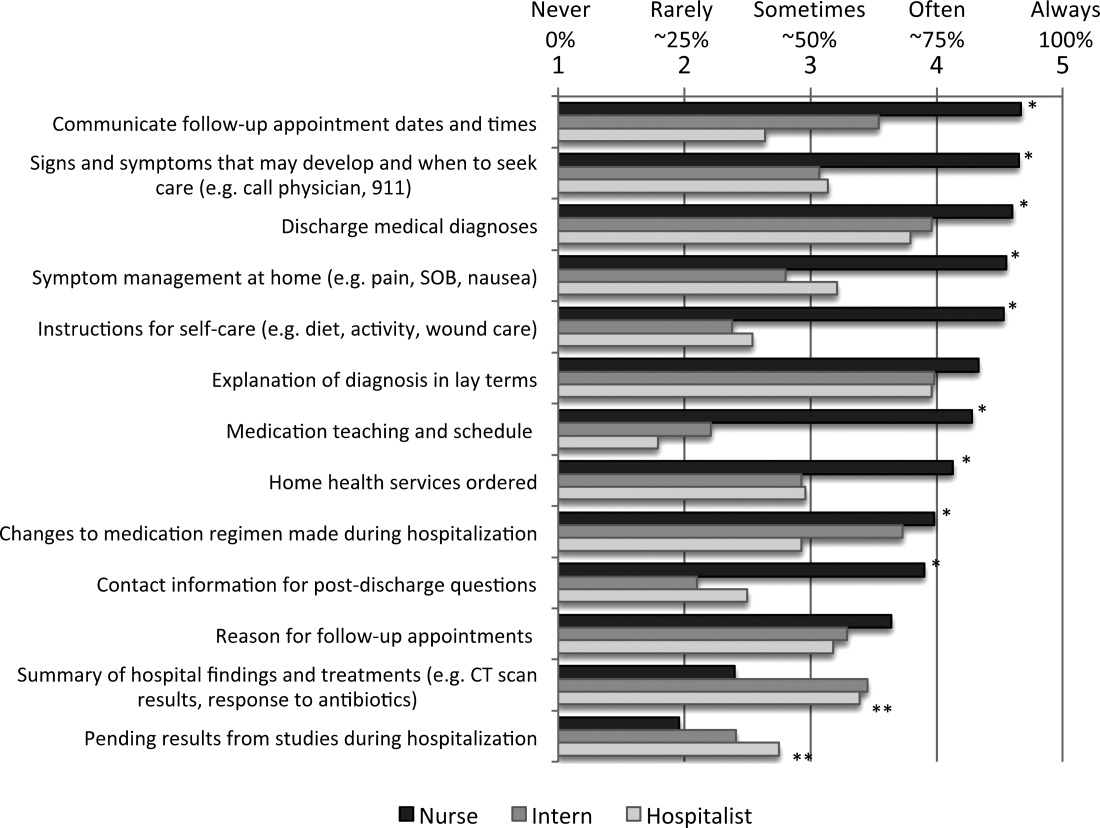
Nutrition
Malnutrition is present in 20% to 50% of hospitalized patients.1, 2 Despite simple, validated screening tools, malnutrition tends to be underdiagnosed.3, 4 Over 90% of elderly patients transitioning from an acute care hospital to a subacute care facility are either malnourished or at risk of malnutrition.5 Malnutrition has been associated with increased risk of nosocomial infections,6 worsened discharge functional status,7 and higher mortality,8 as well as longer lengths of stay7, 8 and higher hospital costs.2
Malnutrition describes either overnutrition or undernutrition that causes a change in body composition and decreased function.9 Malnutrition in hospitalized patients is typically related to undernutrition due to either reduced intake or increased metabolic rate. Reasons for reduced intake include poor appetite, reduced ability to chew or swallow, and nil per os (NPO) status. Patients with acute or chronic illnesses may either be malnourished on admission, or develop malnutrition within a few days of hospital admission, due to the effects of the inflammatory state on metabolism. Given that malnutrition is potentially modifiable, it is important to screen for malnutrition and, when present, develop, implement, and monitor a nutrition care plan10 (Figure 1).
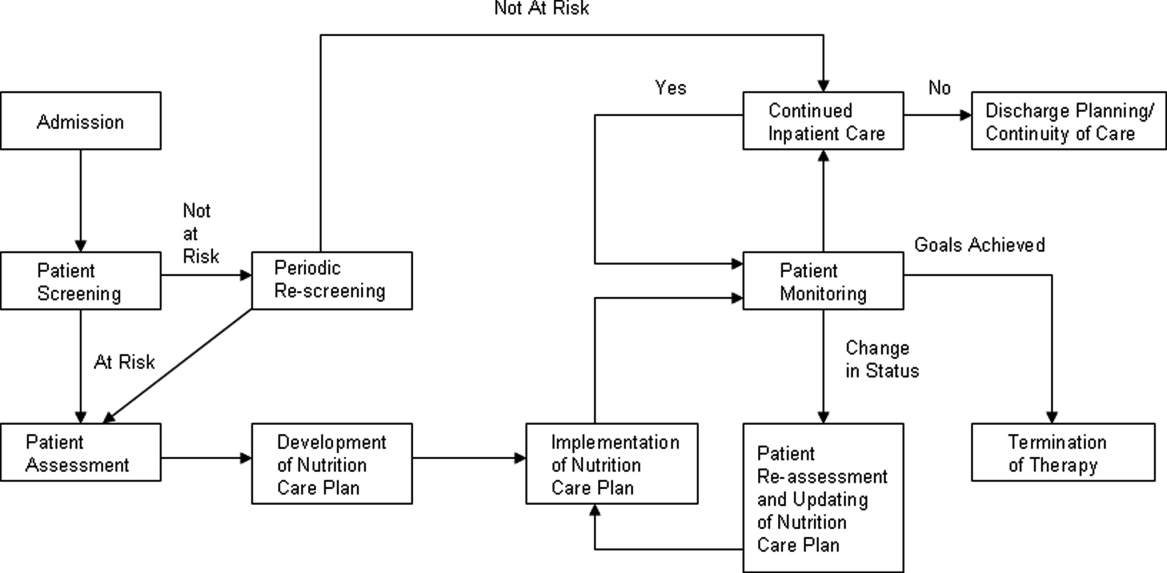
The purpose of this review is to provide the hospitalist with an overview of screening, assessment, and development and implementation of a nutrition care plan in the acutely ill hospitalized patient.
PATIENT SCREENING
Nutrition screening identifies patients with nutritional deficits who may benefit from further detailed nutrition assessment and intervention.11 The Joint Commission requires that all patients admitted to acute care hospitals be screened for risk of malnutrition within 24 hours.12 Those considered at risk for malnutrition have significant weight changes, chronic disease or an acute inflammatory process, or have been unable to ingest adequate calories for 7 days.13
Those not at risk should be regularly rescreened throughout their hospital stay. The American Society of Parenteral and Enteral Nutrition (ASPEN) recommends that institutions create and approve a screening process according to the patient population served.10 There are several tools validated for use in the acute care setting.14 Many institutions trigger an automatic nutrition consult when certain screening criteria are met.
PATIENT ASSESSMENT
Nutrition assessment should be performed by a dietitian or nutrition consult provider in patients who screen at risk for malnutrition to characterize and determine the cause of nutritional deficits.10 The nutrition assessment identifies history and physical examination elements to diagnose malnutrition. An ASPEN consensus statement recommends the diagnosis of malnutrition if 2 or more of the following are present: insufficient energy intake, weight loss, loss of muscle mass, loss of subcutaneous fat, localized or generalized fluid accumulation, and decreased functional status measured by hand‐grip strength.9 The nutrition assessment should also consider how long the patient has been without adequate nutrition, document baseline nutrition parameters,15 and estimate caloric requirements to determine nutrition support therapy needs.10 Nutrition assessment typically includes the following components.
History
A careful history elicits the majority of information needed to determine the cause and severity of malnutrition.16 Patients should be questioned about a typical day's oral intake prior to hospitalization, and about factors that affect their intake such as sensory deficits, fine motor dysfunction, or chewing and swallowing difficulties, which often decline in chronically ill and elderly patients. Nutrition may be affected by financial difficulties or limited social support, and access to food should be assessed.
Physical Findings
Weight loss is the best physical exam predictor of malnutrition risk, although nutritional depletion can occur in a very short time in acutely ill or injured patients before substantial weight loss has occurred. The likelihood of malnutrition is increased if a patient has: a body mass index (BMI) 18.5 kg/m2; unintentional loss of >2.3 kg (5 lb) or 5% of body weight over 1 month; and unintentional loss of >4.5 kg (10 lb) or 10% of body weight over 6 months.17 Weight loss may be masked by fluid retention from chronic conditions, such as heart failure, or from volume resuscitation in the acutely ill patient.9, 16
Body mass index can be misleading, as age‐related height loss may artificially increase BMI, and height may be difficult to accurately measure in a kyphotic, unsteady, or bedridden patient. The clinician may find evidence of loss of subcutaneous fat or muscle mass in patients with chronic illness, but these findings may not be evident in the acutely ill patient.9 Other physical exam assessments of malnutrition, such as arm span, skinfold thickness, and arm circumference are not reliable.16
Laboratory Tests
Biochemical markers, including transferrin, albumin, and prealbumin, have not been proven as accurate predictors of nutrition status because they may change as a result of other factors not related to nutrition.15, 18 Serum albumin, for example, may be more reflective of the degree of metabolic stress.19 Prealbumin has a serum half‐life much shorter than albumin or transferrin (approximately 2448 hours) and is perhaps the most useful protein marker to assess the adequacy of nutritional replacement after the inflammatory state is resolved.18
Calculating Caloric Requirements
Energy expenditure measurement is considered the gold standard to determine patients' caloric needs. Actual measurement by methods such as indirect calorimetry, which measures oxygen consumption and carbon dioxide production, and calculates energy expenditure, is challenging in everyday clinical settings. Predictive equations often are used as alternative methods to estimate patients' caloric requirements.20 There is no consensus among the 3 North American societies' guidelines (the Canadian Clinical Practice Guidelines; the American Dietetics Association's evidence‐based guideline for critical illness; and the Society of Critical Care Medicine and American Society of Parenteral and Enteral Nutrition's joint guideline) as to the best method.21
In the simplest equation, caloric needs are estimated by calories per kilogram.22 In obese patients, using actual body weight will overestimate needs, but using ideal body weight may cause underfeeding. A small study comparing predictive equations in obese hospitalized patients found the Harris‐Benedict equations (H‐BE) using adjusted body weight and a stress factor to be most accurate, but only in 50% of patients.23 Most clinicians are familiar with the H‐BE, but alternatives such as calories per kilogram or the Mifflin St.‐Jeor equation24 are often used (S. Brantley (May 5, 2012), S. Lundy (May 23, 2012), personal communication).
Indications for Nutritional Intervention
In adults without preexisting malnutrition, inadequate nutritional intake for approximately 714 days should prompt nutritional intervention.25, 26 This timeline should be shorter (37 days) in those with lower energy reserves (eg, underweight or recent weight loss) or significant catabolic stress (eg, acutely ill patients).27, 28 Other patient populations shown to benefit from nutritional intervention include: postoperative patients who are anticipated to be NPO for more than 7 days or to be taking less than 60% of estimated caloric needs by postoperative day 10; preoperative patients with severe malnutrition29; those with gastrointestinal cancer undergoing elective surgery30; and stroke patients with persistent dysphagia for more than 7 days.31
DEVELOPMENT OF A NUTRITION CARE PLAN
The formal nutrition assessment of the at‐risk patient derives the information needed for the development of a nutrition care plan. This plan guides the provision of nutrition therapy, the intervention, the monitoring protocols, evaluation, and reassessment of nutrition goals or termination of specialized nutrition support.10 Assessments for adequacy of nutritional repletion are best done by repeated screening and physical examinations.18
IMPLEMENTATION OF NUTRITION CARE PLAN
Nutritional interventions include dietary modifications, enteral nutrition, and parenteral nutrition.
Dietary Modifications
The purpose of the diet is to provide the necessary nutrients to the body in a well‐tolerated form. Diets can be modified to provide for individual requirements, personal eating patterns and food preferences, and disease process and digestive capacity. Dietary adjustments include change in consistency of foods (eg, pureed, mechanical soft), increase or decrease in energy value, increase or decrease in the type of food or nutrient consumed (eg, sodium restriction, fiber enhancement), elimination of specific foods (eg, gluten‐free diet), adjustment in protein, fat, and carbohydrate content (eg, ketogenic diet, renal diet, cholesterol‐lowering diet), and adjustment of the number and frequency of meals.32
Dietary supplementation (eg, Boost, Ensure) is common practice in persons diagnosed with such conditions as cancer, diabetes, and cardiovascular disease. Supplements enhance the diet by increasing the total daily intake of a vitamin, a mineral, an amino acid, an herb or other botanical33, and should not be used as a meal substitute.34 These supplements are varied in content of calories, protein, vitamins, and minerals. Various flavors and consistencies are also available. Several oral supplements are reviewed in Table 1.
| Oral Supplement* (Serving Size; mL) | Kcal/svg | Protein (g/svg) | Fat (g/svg) | CHO (g/svg) | Na (mg/svg) | K (mg/svg) | Ca (mg/svg) | Phos (mg/svg) | Mg (mg/svg) |
|---|---|---|---|---|---|---|---|---|---|
| |||||||||
| Boost Original (237) | 240 | 10 | 4 | 41 | 150 | 460 | 300 | 300 | 100 |
| Ensure Nutrition Shake (237) | 250 | 9 | 6 | 40 | 200 | 370 | 300 | 250 | 100 |
| Carnation Instant Breakfast Ready to Drink (325) | 250 | 14 | 5 | 34 | 180 | 330 | 500 | 500 | 120 |
| Resource Breeze (fruit‐flavored) clear liquid (237) | 250 | 9 | 0 | 54 | 80 | 10 | 10 | 150 | 1 |
| Glucerna 1.0 Ready to Drink low‐CHO (237) | 240 | 10 | 13 | 23 | 220 | 370 | 170 | 170 | 67 |
| Re/Gen low K and Phos (180) | 375 | 12 | 17 | 47 | 180 | 23 | 15 | 68 | 3 |
Enteral Nutrition
Enteral nutrition (EN) support should be provided to patients who have functioning gastrointestinal (GI) tracts but are unable to take adequate calories orally. Compared to parenteral nutrition (PN), EN is associated with favorable improvements in inflammatory cytokines, acute phase proteins, hyperglycemia, insulin resistance, nosocomial infections, mortality, and cost.35 Enteral feeds are more physiologic than parenteral feeds, maintain GI structure and integrity, and avoid intravenous (IV) access complications. Patients with normal nutritional status on admission who require EN should be receiving over 50% of their caloric needs within the first week of hospital stay.25 Malnourished patients should reach this minimum goal within 35 days of admission.27, 28 EN is not contraindicated in the absence of bowel sounds or in the presence of increased gastric residuals.35 Withholding enteral feedings for gastric residual volumes 250 mL36, 37 or reduced bowel sounds can result in inadequate caloric intake or inappropriate use of PN.27
Gastric feedings are more physiologic than small bowel feedings, can be given by bolus or continuous infusion, and can be given by tubes that are easy to place at the bedside. Post‐pyloric feedings (nasoduodenal or nasojejunal) may be associated with a lower risk of pneumonia, and should be considered in high‐risk patients such as those receiving continuous sedatives or neuromuscular blockers.36 Post‐pyloric tube placement usually requires endoscopy, fluoroscopy, or electromagnetic guidance. Percutaneous feeding tubes (gastrostomy or jejunostomy) should be considered in those who require tube feedings for longer than 30 days.38
Assessment of patient requirements and disease state, as well as extensive knowledge of available formulas, is important in the selection of the appropriate enteral formula.39 Standardized formulas are used for most patients. The provision of adequate water must be considered with these formulas, particularly in the long‐term care and home settings.40 Many specialized formulas are designed for a particular disease state or condition, some of which are further reviewed in Table 2.
| Formula | Kcal/mL | Protein (g/L) | Fat (g/L) | CHO (g/L) | Osmolality (mOsm/kg H2O) | Na (mEq/L) | K (mEq/L) | Ca (mg/L) | Mg (mg/L) | Phos (mg/L) |
|---|---|---|---|---|---|---|---|---|---|---|
| ||||||||||
| Nutren 1.0‐low residue | 1 | 40 | 38 | 127 | 315 | 38 | 32 | 668 | 268 | 668 |
| Osmolite 1.0 Cal low residue | 1 | 44.3 | 34.7 | 143.9 | 300 | 40.4 | 40.2 | 760 | 305 | 1760 |
| Replete high protein, low residue | 1 | 62.4 | 34 | 112 | 300 | 38.1 | 38.5 | 1000 | 400 | 1000 |
| Replete Fiber high protein with fiber | 1 | 62.4 | 34 | 112 | 310 | 38.1 | 38.5 | 1000 | 400 | 1000 |
| Osmolite 1.5 low residue, calorically dense | 1.5 | 62.7 | 49.1 | 203.6 | 525 | 60.9 | 46 | 1000 | 400 | 1000 |
| Two Cal calorie and protein dense | 2 | 83.5 | 91 | 219 | 725 | 64 | 63 | 1050 | 425 | 1050 |
| Vivonex RTF‐elemental | 1 | 50 | 11.6 | 176 | 630 | 30.4 | 31 | 668 | 268 | 668 |
| Nepro with Carb Steady‐for electrolyte, fluid restriction (eg, dialysis) | 1.8 | 81 | 96 | 161 | 745 | 46 | 27 | 1060 | 210 | 720 |
| Nutren Glytrol low CHO | 1 | 45.2 | 47.6 | 100 | 280 | 32.2 | 35.9 | 720 | 286 | 720 |
| NutriHep‐for hepatic disease | 1.5 | 40 | 21.2 | 290 | 790 | 160 | 33.9 | 956 | 376 | 1000 |
If concerned about formula tolerance, one solution is to initiate the formula at a low rate and increase to the goal rate over 2448 hours. Dilution of enteral formulas is not necessary to assure optimal tolerance. Continuous feedings are recommended for most patients initially and after tolerance has been established, bolus feedings can be attempted if the feeding tube terminates in the stomach. Bolus feedings, where 240480 mL of formula are delivered through a syringe over 1015 minutes, may be more physiological for patients. This regimen can be repeated 46 times daily to meet nutrition goals.41
Parenteral Nutrition
PN provides macronutrients such as carbohydrates, protein, and fat; micronutrients such as vitamins, minerals, electrolytes, and trace elements are added in appropriate concentrations. PN may also provide the patient's daily fluid needs. The timing of PN initiation depends upon the patient's initial nutritional status. ASPEN does not recommend PN during the first 7 days of hospitalization in critically ill patients with normal nutritional status. If the patient is not receiving 100% of caloric needs from EN after 7 days, supplemental PN should be considered. However, if on admission a patient is already malnourished and EN is not feasible, PN should be initiated and continued until the patient is receiving at least 60% of caloric needs by enteral route.42 This includes patients with intestinal obstruction, ileus, peritonitis, malabsorption, high output enterocutaneous fistulae, intestinal ischemia, intractable vomiting and diarrhea, severe shock, and fulminant sepsis.10, 43
Standardized commercial PN products are available and reduce the number of steps required between ordering and administration, as compared to customized PN, which is compounded for a particular patient. However, despite improved efficiency and lower cost, there is no evidence that standardized preparations are safer to patients than customized solutions. Institutions utilizing standardized PN must also have a mechanism to customize formulas for those with complex needs.44
Creating a customized parenteral solution involves several basic steps. Total caloric requirement may be estimated using a predictive formula, as previously discussed; calories/kg of ideal body weight is the simplest method. Most hospitalized patients require 2030 calories/kg/d. Daily fluid requirement may be based on kilocalories (kcal) delivered, or by ideal body weight (eg, 1 mL/kcal or 3040 mL/kg). More fluid may be needed in patients with significant sensible or insensible losses; those with renal failure or heart failure should receive less fluid.
Protein needs are calculated by multiplying ideal body weight (kg) by estimated protein needs in g/kg/d (1.22 g/kg/d for catabolic patients). Protein should provide approximately 20% of total calories. Protein restriction is not required in renal impairment; acutely ill patients on renal replacement therapy should receive 1.51.8 g/kg/d. In hepatic failure patients, protein should be restricted only if hepatic encephalopathy fails to improve with other measures.
Knowing the protein, kcal, and fluid needs of the patient, the practitioner divides the remaining non‐protein calories between carbohydrates and fat. Approximately 70%85% of non‐protein calories should be provided as carbohydrates (dextrose), up to 7 g/kg/d. The other 15%30% are as fat, in lipid solutions, providing a maximum of 2.5 g/kg/d. Lipid solutions are provided as either 10% (1.1 kcal/mL) or 20% (2.2 kcal/mL) concentrations.43, 44 Propofol's contribution to fat intake complicates estimating total fat intake in critically ill patients.45
Standardized parenteral multivitamin preparations are available; the clinician must determine if preparations containing vitamin K are appropriate. Of the trace elements, copper and manganese should be restricted in hepatobiliary disease.44
Acutely ill patients receive PN as a 24‐hour infusion, to minimize its impact on volume status and energy expenditure,46 providing 50% of needs on infusion day one and reaching goal within 4872 hours, rather than cyclic infusions over shorter intervals. Daily assessments of vital signs, intake and output, and weight are necessary to monitor volume status.
Once a patient is taking at least 60% of caloric needs either by mouth or by EN, PN can be discontinued. Tapering the infusion is not required, as abrupt discontinuation has not been demonstrated to cause symptomatic hypoglycemia.47, 48
PATIENT MONITORING
Laboratory monitoring with nutrition support should include baseline electrolytes, glucose, renal function, coagulation studies, triglycerides, magnesium, phosphorus, cholesterol, platelet count, and hepatobiliary enzymes. Electrolytes, calcium, magnesium, and phosphorus should be checked daily for 3 days and, if normal, should then be checked biweekly. Capillary glucose should be monitored several times a day until stable. Weekly triglycerides, albumin, cholesterol, coagulation studies, and liver enzymes should also be checked in patients while on parenteral nutrition.25 Patients at risk for refeeding syndrome should have potassium, phosphate, calcium, and magnesium measured daily for 7 days, with repletion as necessary. These electrolytes should be monitored 3 times the following week if stable.49
Patients should be monitored clinically for gastrointestinal tolerance of enteral nutrition. All 3 North American guidelines recommend monitoring gastric residual volumes (GRV); however, there is no consensus on the volume considered to require intervention. Motility agents are recommended as first line treatment of high GRV.36, 37, 42 If high GRV continues, tube feeding should be held, and tube placement, medications, and metabolic assessment should be reviewed. Placement of a transpyloric feeding tube may be indicated.50
Adverse Effects and Complications of Nutrition Support
Regarding EN, complications include those related to tube placement and maintenance, infections, and medical complications of the feeds themselves. Some of the adverse effects of the enteral formulas may be attenuated. Diarrhea, which occurs in up to 20% of patients, may be avoided with slow feed advancement, use of low‐osmotic formulas, or fiber additives.51 Gastric distention and abdominal pain may improve with slow feed advancement and continuous (rather than bolus) feeds. Small‐bore tubes and acid‐reducing medications may decrease gastroesophageal reflux, and aspiration pneumonia may be avoided by semi‐recumbent positioning and post‐pyloric feeding.52
Complications of PN may be grouped as mechanical, infectious, and metabolic. The mechanical complications of central line placement include pneumothorax, arterial puncture, hematoma, air embolism, and line malpositioning. Catheter‐related deep venous thrombosis may occur. Patients on PN through a central line are at risk for central line‐associated bloodstream infections.25 The metabolic complications such as hyperglycemia, electrolyte disorders, hepatic steatosis, and volume overload may have severe consequences, such as heart failure or neuromuscular dysfunction, thus they require close attention.53
A complication of nutrition support that may occur regardless of route is the refeeding syndrome. Refeeding syndrome describes fluid shifts and electrolyte abnormalities that occur after initiation of oral, enteral, or parenteral nutrition in a malnourished or starved patient.54, 55 There are no formal criteria for diagnosing refeeding syndrome.
In the starved state, the body switches from carbohydrate to protein and fat metabolism. Reintroduction of carbohydrates stimulates insulin release with glycogen, fat, and protein synthesis. Associated uptake of glucose, potassium, magnesium, phosphate, and water into cells causes electrolyte and fluid abnormalities. Although hypophosphatemia is the hallmark of refeeding syndrome, it is not pathognomonic. Additional disturbances include hypokalemia, hyperglycemia, hypomagnesemia, thiamine deficiency, and fluid imbalance.49 Patients at risk of refeeding should have serum electrolytes, magnesium, phosphorus, and glucose checked before nutrition support starts. The degree of laboratory abnormalities, if any, and the clinical course of refeeding guides the frequency of subsequent blood tests.56 These consequences of refeeding can adversely affect every major organ system and may result in death.57
Starvation physiology underlies all risk factors for refeeding syndrome. In hospitalized patients, those at risk for refeeding include, but are not limited to, the elderly, oncology patients, postoperative patients, alcohol‐dependent patients, those with malabsorptive states, those who are fasting or chronically malnourished, and those on diuretic therapy.54, 57 The National Institute for Health and Clinical Excellence (NICE) of England and Wales has published criteria to identify patients at high risk for refeeding (Table 3).56 Identification of at‐risk patients and attention to their nutritional needs prevents refeeding syndrome.
|
| Patient has 1 or more of the following: |
| BMI 16 kg/m2 |
| Unintentional weight loss >15% within the last 36 mo |
| Little or no nutritional intake for more than 10 d |
| Low levels of potassium, phosphate, or magnesium prior to feeding |
| Or patient has 2 or more of the following: |
| BMI 18.5 kg/m2 |
| Unintentional weight loss >10% within the last 36 mo |
| Little or no nutritional intake for more than 5 d |
| A history of alcohol abuse or drugs including insulin, chemotherapy, antacids, or diuretics |
ASPEN and NICE have each issued guidelines for initiating nutrition support in patients at risk for refeeding. ASPEN guidelines recommend feeding start at approximately 25% of the estimated goal, with advancement to goal over 35 days. ASPEN recommends fluid and electrolyte status be monitored as needed.50 The NICE guidelines recommend starting nutrition support at a maximum of 10 kcal/kg/d with slow increase to meet or exceed full needs by 47 days. For extremely malnourished patients (eg, BMI 14 kg/m2, or negligible intake for >15 days), they recommend starting at 5 kcal/kg/d. For patients at high risk of developing refeeding syndrome, the NICE guidelines recommend vitamin repletion immediately before and during the first 10 days of feeding (thiamine, vitamin B, and a balanced multivitamin/trace element supplement). Cardiac monitoring is recommended for this group as well as any patients who are at risk for cardiac arrhythmias. Careful monitoring of fluid balance and restoring circulatory volume is recommended, as is repletion of potassium, phosphate, and magnesium.56
TERMINATION OF THERAPY
Termination of nutrition support often involves transitioning from one mode of support to another. PN can be discontinued when oral or enteral intake reaches 60% of total calories; enteral intake can be discontinued when oral intake reaches the same level. However, the patient should be observed maintaining their intake; if they cannot, nutrition support should be resumed.12
TRANSITION OF CARE PLAN
Patients discharged from the hospital on enteral or parenteral nutrition require the support of a coordinated multidisciplinary team including dietitians, home nutrition delivery companies, primary care physicians trained in specialized nutrition support, community pharmacists, and other healthcare professionals, if indicated. These relationships should be established prior to discharge, with education about the patient's individualized nutrition plan, and training with the equipment and supplies.10, 56
CONCLUSION
This review provides an overview of managing the at‐risk or malnourished patient by describing the processes of screening, assessment, and development and implementation of a nutrition care plan in the acutely ill hospitalized patient. Malnutrition is a relatively common, yet underdiagnosed entity that impacts patient outcomes, length of stay, hospital costs, and readmissions. Acute illness in a patient already nutritionally debilitated by chronic disease may cause rapid depletion in nutritional stores. Hospitals are required to screen patients for malnutrition on admission and at regular intervals, and to develop and implement a nutrition care plan for those at risk. The plan guides how nutrition therapy is provided, monitored for adequacy and adverse effects, and assessed for achievement of nutritional goals. It encompasses the use of dietary modifications, and enteral and parenteral nutrition. Clinicians must be aware of serious but avoidable adverse effects, particularly refeeding syndrome in malnourished patients. Prior to discharge, the patient should have already been transitioned from EN or PN to taking adequate amounts of calories by mouth; otherwise, careful discharge planning to educate the patients and/or caregivers, and coordinate the necessary multidisciplinary community services is necessary.
Acknowledgements
The authors express their appreciation to Ms Susan Lundy, for her helpful and timely information, and Ms Lisa Boucher, for her invaluable assistance with this manuscript and its submission.
Disclosures: Susan Brantley is on the Speaker's Bureau for Nestle Nutrition and for Abbott Nutrition. Authors Kirkland, Kashiwagi, Scheurer, and Varkey have nothing to report.
- ,,, et al.Prevalence of malnutrition on admission to four hospitals in England. The Malnutrition Prevalence Group.Clin Nutr.2000;19(3):191–195.
- ,.The impact of malnutrition on morbidity, mortality, length of hospital stay and costs evaluated through a multivariate model analysis.Clin Nutr.2003;22(3):235–239.
- ,,,.Malnutrition among hospitalized patients. A problem of physician awareness.Arch Intern Med.1987;147(8):1462–1465.
- ,,,,.Malnutrition is prevalent in hospitalized medical patients: are housestaff identifying the malnourished patient?Nutrition.2006;22(4):350–354.
- ,,, et al.Malnutrition in subacute care.Am J Clin Nutr.2002;75(2):308–313.
- ,,, et al.Malnutrition is an independent factor associated with nosocomial infections.Br J Nutr.2004;92(1):105–111.
- ,.Impact of body mass index on outcomes following critical care.Chest.2003;123(4):1202–1207.
- ,,, et al.EuroOOPS: an international, multicentre study to implement nutritional risk screening and evaluate clinical outcome.Clin Nutr.2008;27(3):340–349.
- ,,,,.Consensus statement: Academy of Nutrition and Dietetics and American Society for Parenteral and Enteral Nutrition: characteristics recommended for the identification and documentation of adult malnutrition (undernutrition).J Parenter Enteral Nutr.2012;36(3):275–283.
- ,,, et al.Standards for nutrition support: adult hospitalized patients.Nutr Clin Pract.2010;25(4):403–414.
- American Society for Parenteral and Enteral Nutrition (A.S.P.E.N.), Board of Directors and Clinical Practice Committee. Definition of Terms, Style, and Conventions used in A.S.P.E.N. Board of Directors‐Approved Documents. May2012. Available at: http://www.nutritioncare.org/Library.aspx. Accessed June 29, 2012.
- Joint Commission on Accreditation of Healthcare Organizations.Comprehensive Accreditation for Hospitals.Chicago, IL:Joint Commission on Accreditation for Healthcare Organizations;2007.
- ,.Nutrition screening and assessment. In: Gottschlich MM, ed.The ASPEN Nutrition Support Core Curriculum: A Case‐Based Approach—The Adult Patient.1st ed.Silver Spring, MD:American Society for Parenteral and Enteral Nutrition;2007:163–186.
- .Nutrition screening tools for hospitalized patients.Nutr Clin Pract.2008;23(4):373–382.
- .Nutrition screening and assessment. In: Skipper A, ed.Dietitian's Handbook of Enteral and Parenteral Nutrition.3rd ed.Sudbury, MA:Jones 2012:4–21.
- ,.Nutritional assessment in the hospitalized patient.Curr Opin Clin Nutr Metab Care.2003;6(5):531–538.
- ,,,,.Nutritional and metabolic assessment of the hospitalized patient.J Parenter Enteral Nutr.1977;1(1):11–22.
- ,,.Hepatic proteins and nutrition assessment.J Am Diet Assoc.2004;104(8):1258–1264.
- .The albumin‐nutrition connection: separating myth from fact.Nutrition.2002;18(2):199–200.
- ,.Predictive equations for energy needs for the critically ill.Respir Care.2009;54(4):509–521.
- ,,, et al.Guidelines, guidelines, guidelines: what are we to do with all of these North American guidelines?J Parenter Enteral Nutr.2010;34(6):625–643.
- ,,, et al.Applied nutrition in ICU patients. A consensus statement of the American College of Chest Physicians.Chest.1997;111(3):769–778.
- ,,,,.Comparison of resting energy expenditure prediction methods with measured resting energy expenditure in obese, hospitalized adults.J Parenter Enteral Nutr.2009;33(2):168–175.
- ,,,,,.A new predictive equation for resting energy expenditure in healthy individuals.Am J Clin Nutr.1990;51(2):241–247.
- American Society for Parenteral and Enteral Nutrition.Guidelines for the use of parenteral and enteral nutrition in adult and pediatric patients.J Parenter Enteral Nutr.2002;26(suppl):1SA–138SA.
- ,,.American Gastroenterological Association technical review on tube feeding for enteral nutrition.Gastroenterology.1995;108(4):1282–1301.
- ,,, et al.ESPEN guidelines on enteral nutrition: intensive care.Clin Nutr.2006;25(2):210–223.
- ,.Nutritional support. In: Shojania KG, Duncan BW, McDonald KM, et al, eds.Making Health Care Safer: A Critical Analysis of Patient Safety Practices. Evidence Report/Technology Assessment Number 43.Rockville, MD:Agency for Healthcare Research and Quality, US Department of Health and Human Services, July2001. AHRQ Publication 01‐E058. Available at: http://www.ahrq.gov.
- Veterans Affairs Total Parenteral Nutrition Cooperative Study Group.Perioperative total parenteral nutrition in surgical patients.N Engl J Med.1991;328(8):525–532.
- ,,,,.Does enteral nutrition affect clinical outcome? A systematic review of the randomized trials.Am J Gastroenterol.2007;102(2):412–429.
- ,,,.Nutrition in the stroke patient.Nutr Clin Pract.2011;26(3):242–252.
- ,,.Nutrition diagnosis and intervention. In: Mahan LK, Escott‐Stump S, eds.Krause's Food and Nutrition Therapy.12th ed.St Louis, MO:Saunders Elsevier;2008:454–469.
- Dietary Supplement Health and Education Act (DSHEA) of 1994. Available at: http://www.gpo.gov/fdsys/pkg/BILLS‐103s784es/pdf/BILLS‐103s784es.pdf. Accessed June 29,2012.
- .Intervention: dietary supplementation and integrative care. In: Mahan LK, Escott‐Stump S, eds.Krause's Food and Nutrition Therapy.12th ed.St Louis, MO:Saunders Elsevier;2008:470–474.
- ,,, et al.Guidelines for the provision and assessment of nutrition support therapy in the adult critically ill patient: Society of Critical Care Medicine and American Society for Parenteral and Enteral Nutrition: executive summary.Crit Care Med.2009;37(5):1757–1761.
- ,,,,;for the. Canadian Critical Care Clinical Practice Guidelines Committee.Canadian clinical practice guidelines for nutrition support in mechanically ventilated, critically ill adult patients.J Parenter Enteral Nutr.2003;27(5):355–373.
- American Dietetic Association Evidence Library. Critical Illness. Available at: http://www.adaevidencelibrary.com/template.cfm?key=767115(5 suppl):64S–70S.
- .Enteral nutrition. In: Skipper A, ed.Dietitian's Handbook of Enteral and Parenteral Nutrition.3rd ed.Sudbury, MA:Jones 2012:259–280.
- .Enteral formula selection. In: Charney P, Malone A, eds.ADA Pocket Guide to Enteral Nutrition.Chicago, IL:American Dietetic Association;2006:63–122.
- ,.Overview of enteral nutrition. In: Gottschlich MM, ed.The ASPEN Nutrition Support Core Curriculum: A Case‐Based Approach—The Adult Patient.1st ed.Silver Spring, MD:American Society for Parenteral and Enteral Nutrition;2007:187–208.
- ,,, et al.Guidelines for the provision and assessment of nutrition support therapy in the adult critically ill patient: Society of Critical Care Medicine (SCCM) and American Society for Parenteral and Enteral Nutrition (A.S.P.E.N.).J Parenter Enteral Nutr.2009;33(3):277–316.
- ,,,,,.ESPEN guidelines on parenteral nutrition: surgery.Clin Nutr.2009;28(4):378–386.
- ,,, et al.Safe practices for parenteral nutrition.J Parenter Enteral Nutr.2004;28(6):S39–S70.
- ,,,,,.Contribution of calories from propofol to total energy intake.J Am Diet Assoc.1995;95(9 supplement):A25.
- ,,,.Metabolic and thermogenic response to continuous and cyclic total parenteral nutrition in traumatised and infected patients.Clin Nutr.1994;13(5):291–301.
- ,,.The effect of abrupt cessation of total parenteral nutrition on serum glucose: a randomized trial.Am Surg.2000;66(9):866–869.
- ,,,,.The effect of acute discontinuation of total parenteral nutrition.Ann Surg.1986;204(5):524–529.
- ,,.Refeeding syndrome: what it is, and how to prevent and treat it.BMJ.2008;336(7659):1495–1498.
- ,,, et al.Enteral nutrition practice recommendations.J Parenter Enteral Nutr.2009;33(2):122–167.
- ,,.Control of diarrhea by fiber‐enriched diet in ICU patients on enteral nutrition: a prospective randomized controlled trial.Clin Nutr.2004;23(6):1344–1352.
- ,,,,,.Supine body position as a risk factor for nosocomial pneumonia in mechanically ventilated patients: a randomised trial.Lancet.1999;354(9193):1851–1858.
- .Parenteral nutrition in the critically ill patient.N Engl J Med.2009;361(11):1088–1097.
- ,,,.Refeeding syndrome: treatment considerations based on collective analysis of literature case reports.Nutrition.2010;26(2):156–167.
- ,,.Re‐feeding syndrome in head and neck cancer‐prevention and management.Oral Oncol.2011;47(9):792–796.
- Nutrition Support in Adults. NICE Clinical Guideline No. 32. 2006. Available at: http://guidance.nice.org.uk/CG32/NICEGuidance. Accessed November 29,2011.
- ,,.The importance of the refeeding syndrome.Nutrition.2001;17(7–8):632–637.
Malnutrition is present in 20% to 50% of hospitalized patients.1, 2 Despite simple, validated screening tools, malnutrition tends to be underdiagnosed.3, 4 Over 90% of elderly patients transitioning from an acute care hospital to a subacute care facility are either malnourished or at risk of malnutrition.5 Malnutrition has been associated with increased risk of nosocomial infections,6 worsened discharge functional status,7 and higher mortality,8 as well as longer lengths of stay7, 8 and higher hospital costs.2
Malnutrition describes either overnutrition or undernutrition that causes a change in body composition and decreased function.9 Malnutrition in hospitalized patients is typically related to undernutrition due to either reduced intake or increased metabolic rate. Reasons for reduced intake include poor appetite, reduced ability to chew or swallow, and nil per os (NPO) status. Patients with acute or chronic illnesses may either be malnourished on admission, or develop malnutrition within a few days of hospital admission, due to the effects of the inflammatory state on metabolism. Given that malnutrition is potentially modifiable, it is important to screen for malnutrition and, when present, develop, implement, and monitor a nutrition care plan10 (Figure 1).
The purpose of this review is to provide the hospitalist with an overview of screening, assessment, and development and implementation of a nutrition care plan in the acutely ill hospitalized patient.
PATIENT SCREENING
Nutrition screening identifies patients with nutritional deficits who may benefit from further detailed nutrition assessment and intervention.11 The Joint Commission requires that all patients admitted to acute care hospitals be screened for risk of malnutrition within 24 hours.12 Those considered at risk for malnutrition have significant weight changes, chronic disease or an acute inflammatory process, or have been unable to ingest adequate calories for 7 days.13
Those not at risk should be regularly rescreened throughout their hospital stay. The American Society of Parenteral and Enteral Nutrition (ASPEN) recommends that institutions create and approve a screening process according to the patient population served.10 There are several tools validated for use in the acute care setting.14 Many institutions trigger an automatic nutrition consult when certain screening criteria are met.
PATIENT ASSESSMENT
Nutrition assessment should be performed by a dietitian or nutrition consult provider in patients who screen at risk for malnutrition to characterize and determine the cause of nutritional deficits.10 The nutrition assessment identifies history and physical examination elements to diagnose malnutrition. An ASPEN consensus statement recommends the diagnosis of malnutrition if 2 or more of the following are present: insufficient energy intake, weight loss, loss of muscle mass, loss of subcutaneous fat, localized or generalized fluid accumulation, and decreased functional status measured by hand‐grip strength.9 The nutrition assessment should also consider how long the patient has been without adequate nutrition, document baseline nutrition parameters,15 and estimate caloric requirements to determine nutrition support therapy needs.10 Nutrition assessment typically includes the following components.
History
A careful history elicits the majority of information needed to determine the cause and severity of malnutrition.16 Patients should be questioned about a typical day's oral intake prior to hospitalization, and about factors that affect their intake such as sensory deficits, fine motor dysfunction, or chewing and swallowing difficulties, which often decline in chronically ill and elderly patients. Nutrition may be affected by financial difficulties or limited social support, and access to food should be assessed.
Physical Findings
Weight loss is the best physical exam predictor of malnutrition risk, although nutritional depletion can occur in a very short time in acutely ill or injured patients before substantial weight loss has occurred. The likelihood of malnutrition is increased if a patient has: a body mass index (BMI) 18.5 kg/m2; unintentional loss of >2.3 kg (5 lb) or 5% of body weight over 1 month; and unintentional loss of >4.5 kg (10 lb) or 10% of body weight over 6 months.17 Weight loss may be masked by fluid retention from chronic conditions, such as heart failure, or from volume resuscitation in the acutely ill patient.9, 16
Body mass index can be misleading, as age‐related height loss may artificially increase BMI, and height may be difficult to accurately measure in a kyphotic, unsteady, or bedridden patient. The clinician may find evidence of loss of subcutaneous fat or muscle mass in patients with chronic illness, but these findings may not be evident in the acutely ill patient.9 Other physical exam assessments of malnutrition, such as arm span, skinfold thickness, and arm circumference are not reliable.16
Laboratory Tests
Biochemical markers, including transferrin, albumin, and prealbumin, have not been proven as accurate predictors of nutrition status because they may change as a result of other factors not related to nutrition.15, 18 Serum albumin, for example, may be more reflective of the degree of metabolic stress.19 Prealbumin has a serum half‐life much shorter than albumin or transferrin (approximately 2448 hours) and is perhaps the most useful protein marker to assess the adequacy of nutritional replacement after the inflammatory state is resolved.18
Calculating Caloric Requirements
Energy expenditure measurement is considered the gold standard to determine patients' caloric needs. Actual measurement by methods such as indirect calorimetry, which measures oxygen consumption and carbon dioxide production, and calculates energy expenditure, is challenging in everyday clinical settings. Predictive equations often are used as alternative methods to estimate patients' caloric requirements.20 There is no consensus among the 3 North American societies' guidelines (the Canadian Clinical Practice Guidelines; the American Dietetics Association's evidence‐based guideline for critical illness; and the Society of Critical Care Medicine and American Society of Parenteral and Enteral Nutrition's joint guideline) as to the best method.21
In the simplest equation, caloric needs are estimated by calories per kilogram.22 In obese patients, using actual body weight will overestimate needs, but using ideal body weight may cause underfeeding. A small study comparing predictive equations in obese hospitalized patients found the Harris‐Benedict equations (H‐BE) using adjusted body weight and a stress factor to be most accurate, but only in 50% of patients.23 Most clinicians are familiar with the H‐BE, but alternatives such as calories per kilogram or the Mifflin St.‐Jeor equation24 are often used (S. Brantley (May 5, 2012), S. Lundy (May 23, 2012), personal communication).
Indications for Nutritional Intervention
In adults without preexisting malnutrition, inadequate nutritional intake for approximately 714 days should prompt nutritional intervention.25, 26 This timeline should be shorter (37 days) in those with lower energy reserves (eg, underweight or recent weight loss) or significant catabolic stress (eg, acutely ill patients).27, 28 Other patient populations shown to benefit from nutritional intervention include: postoperative patients who are anticipated to be NPO for more than 7 days or to be taking less than 60% of estimated caloric needs by postoperative day 10; preoperative patients with severe malnutrition29; those with gastrointestinal cancer undergoing elective surgery30; and stroke patients with persistent dysphagia for more than 7 days.31
DEVELOPMENT OF A NUTRITION CARE PLAN
The formal nutrition assessment of the at‐risk patient derives the information needed for the development of a nutrition care plan. This plan guides the provision of nutrition therapy, the intervention, the monitoring protocols, evaluation, and reassessment of nutrition goals or termination of specialized nutrition support.10 Assessments for adequacy of nutritional repletion are best done by repeated screening and physical examinations.18
IMPLEMENTATION OF NUTRITION CARE PLAN
Nutritional interventions include dietary modifications, enteral nutrition, and parenteral nutrition.
Dietary Modifications
The purpose of the diet is to provide the necessary nutrients to the body in a well‐tolerated form. Diets can be modified to provide for individual requirements, personal eating patterns and food preferences, and disease process and digestive capacity. Dietary adjustments include change in consistency of foods (eg, pureed, mechanical soft), increase or decrease in energy value, increase or decrease in the type of food or nutrient consumed (eg, sodium restriction, fiber enhancement), elimination of specific foods (eg, gluten‐free diet), adjustment in protein, fat, and carbohydrate content (eg, ketogenic diet, renal diet, cholesterol‐lowering diet), and adjustment of the number and frequency of meals.32
Dietary supplementation (eg, Boost, Ensure) is common practice in persons diagnosed with such conditions as cancer, diabetes, and cardiovascular disease. Supplements enhance the diet by increasing the total daily intake of a vitamin, a mineral, an amino acid, an herb or other botanical33, and should not be used as a meal substitute.34 These supplements are varied in content of calories, protein, vitamins, and minerals. Various flavors and consistencies are also available. Several oral supplements are reviewed in Table 1.
| Oral Supplement* (Serving Size; mL) | Kcal/svg | Protein (g/svg) | Fat (g/svg) | CHO (g/svg) | Na (mg/svg) | K (mg/svg) | Ca (mg/svg) | Phos (mg/svg) | Mg (mg/svg) |
|---|---|---|---|---|---|---|---|---|---|
| |||||||||
| Boost Original (237) | 240 | 10 | 4 | 41 | 150 | 460 | 300 | 300 | 100 |
| Ensure Nutrition Shake (237) | 250 | 9 | 6 | 40 | 200 | 370 | 300 | 250 | 100 |
| Carnation Instant Breakfast Ready to Drink (325) | 250 | 14 | 5 | 34 | 180 | 330 | 500 | 500 | 120 |
| Resource Breeze (fruit‐flavored) clear liquid (237) | 250 | 9 | 0 | 54 | 80 | 10 | 10 | 150 | 1 |
| Glucerna 1.0 Ready to Drink low‐CHO (237) | 240 | 10 | 13 | 23 | 220 | 370 | 170 | 170 | 67 |
| Re/Gen low K and Phos (180) | 375 | 12 | 17 | 47 | 180 | 23 | 15 | 68 | 3 |
Enteral Nutrition
Enteral nutrition (EN) support should be provided to patients who have functioning gastrointestinal (GI) tracts but are unable to take adequate calories orally. Compared to parenteral nutrition (PN), EN is associated with favorable improvements in inflammatory cytokines, acute phase proteins, hyperglycemia, insulin resistance, nosocomial infections, mortality, and cost.35 Enteral feeds are more physiologic than parenteral feeds, maintain GI structure and integrity, and avoid intravenous (IV) access complications. Patients with normal nutritional status on admission who require EN should be receiving over 50% of their caloric needs within the first week of hospital stay.25 Malnourished patients should reach this minimum goal within 35 days of admission.27, 28 EN is not contraindicated in the absence of bowel sounds or in the presence of increased gastric residuals.35 Withholding enteral feedings for gastric residual volumes 250 mL36, 37 or reduced bowel sounds can result in inadequate caloric intake or inappropriate use of PN.27
Gastric feedings are more physiologic than small bowel feedings, can be given by bolus or continuous infusion, and can be given by tubes that are easy to place at the bedside. Post‐pyloric feedings (nasoduodenal or nasojejunal) may be associated with a lower risk of pneumonia, and should be considered in high‐risk patients such as those receiving continuous sedatives or neuromuscular blockers.36 Post‐pyloric tube placement usually requires endoscopy, fluoroscopy, or electromagnetic guidance. Percutaneous feeding tubes (gastrostomy or jejunostomy) should be considered in those who require tube feedings for longer than 30 days.38
Assessment of patient requirements and disease state, as well as extensive knowledge of available formulas, is important in the selection of the appropriate enteral formula.39 Standardized formulas are used for most patients. The provision of adequate water must be considered with these formulas, particularly in the long‐term care and home settings.40 Many specialized formulas are designed for a particular disease state or condition, some of which are further reviewed in Table 2.
| Formula | Kcal/mL | Protein (g/L) | Fat (g/L) | CHO (g/L) | Osmolality (mOsm/kg H2O) | Na (mEq/L) | K (mEq/L) | Ca (mg/L) | Mg (mg/L) | Phos (mg/L) |
|---|---|---|---|---|---|---|---|---|---|---|
| ||||||||||
| Nutren 1.0‐low residue | 1 | 40 | 38 | 127 | 315 | 38 | 32 | 668 | 268 | 668 |
| Osmolite 1.0 Cal low residue | 1 | 44.3 | 34.7 | 143.9 | 300 | 40.4 | 40.2 | 760 | 305 | 1760 |
| Replete high protein, low residue | 1 | 62.4 | 34 | 112 | 300 | 38.1 | 38.5 | 1000 | 400 | 1000 |
| Replete Fiber high protein with fiber | 1 | 62.4 | 34 | 112 | 310 | 38.1 | 38.5 | 1000 | 400 | 1000 |
| Osmolite 1.5 low residue, calorically dense | 1.5 | 62.7 | 49.1 | 203.6 | 525 | 60.9 | 46 | 1000 | 400 | 1000 |
| Two Cal calorie and protein dense | 2 | 83.5 | 91 | 219 | 725 | 64 | 63 | 1050 | 425 | 1050 |
| Vivonex RTF‐elemental | 1 | 50 | 11.6 | 176 | 630 | 30.4 | 31 | 668 | 268 | 668 |
| Nepro with Carb Steady‐for electrolyte, fluid restriction (eg, dialysis) | 1.8 | 81 | 96 | 161 | 745 | 46 | 27 | 1060 | 210 | 720 |
| Nutren Glytrol low CHO | 1 | 45.2 | 47.6 | 100 | 280 | 32.2 | 35.9 | 720 | 286 | 720 |
| NutriHep‐for hepatic disease | 1.5 | 40 | 21.2 | 290 | 790 | 160 | 33.9 | 956 | 376 | 1000 |
If concerned about formula tolerance, one solution is to initiate the formula at a low rate and increase to the goal rate over 2448 hours. Dilution of enteral formulas is not necessary to assure optimal tolerance. Continuous feedings are recommended for most patients initially and after tolerance has been established, bolus feedings can be attempted if the feeding tube terminates in the stomach. Bolus feedings, where 240480 mL of formula are delivered through a syringe over 1015 minutes, may be more physiological for patients. This regimen can be repeated 46 times daily to meet nutrition goals.41
Parenteral Nutrition
PN provides macronutrients such as carbohydrates, protein, and fat; micronutrients such as vitamins, minerals, electrolytes, and trace elements are added in appropriate concentrations. PN may also provide the patient's daily fluid needs. The timing of PN initiation depends upon the patient's initial nutritional status. ASPEN does not recommend PN during the first 7 days of hospitalization in critically ill patients with normal nutritional status. If the patient is not receiving 100% of caloric needs from EN after 7 days, supplemental PN should be considered. However, if on admission a patient is already malnourished and EN is not feasible, PN should be initiated and continued until the patient is receiving at least 60% of caloric needs by enteral route.42 This includes patients with intestinal obstruction, ileus, peritonitis, malabsorption, high output enterocutaneous fistulae, intestinal ischemia, intractable vomiting and diarrhea, severe shock, and fulminant sepsis.10, 43
Standardized commercial PN products are available and reduce the number of steps required between ordering and administration, as compared to customized PN, which is compounded for a particular patient. However, despite improved efficiency and lower cost, there is no evidence that standardized preparations are safer to patients than customized solutions. Institutions utilizing standardized PN must also have a mechanism to customize formulas for those with complex needs.44
Creating a customized parenteral solution involves several basic steps. Total caloric requirement may be estimated using a predictive formula, as previously discussed; calories/kg of ideal body weight is the simplest method. Most hospitalized patients require 2030 calories/kg/d. Daily fluid requirement may be based on kilocalories (kcal) delivered, or by ideal body weight (eg, 1 mL/kcal or 3040 mL/kg). More fluid may be needed in patients with significant sensible or insensible losses; those with renal failure or heart failure should receive less fluid.
Protein needs are calculated by multiplying ideal body weight (kg) by estimated protein needs in g/kg/d (1.22 g/kg/d for catabolic patients). Protein should provide approximately 20% of total calories. Protein restriction is not required in renal impairment; acutely ill patients on renal replacement therapy should receive 1.51.8 g/kg/d. In hepatic failure patients, protein should be restricted only if hepatic encephalopathy fails to improve with other measures.
Knowing the protein, kcal, and fluid needs of the patient, the practitioner divides the remaining non‐protein calories between carbohydrates and fat. Approximately 70%85% of non‐protein calories should be provided as carbohydrates (dextrose), up to 7 g/kg/d. The other 15%30% are as fat, in lipid solutions, providing a maximum of 2.5 g/kg/d. Lipid solutions are provided as either 10% (1.1 kcal/mL) or 20% (2.2 kcal/mL) concentrations.43, 44 Propofol's contribution to fat intake complicates estimating total fat intake in critically ill patients.45
Standardized parenteral multivitamin preparations are available; the clinician must determine if preparations containing vitamin K are appropriate. Of the trace elements, copper and manganese should be restricted in hepatobiliary disease.44
Acutely ill patients receive PN as a 24‐hour infusion, to minimize its impact on volume status and energy expenditure,46 providing 50% of needs on infusion day one and reaching goal within 4872 hours, rather than cyclic infusions over shorter intervals. Daily assessments of vital signs, intake and output, and weight are necessary to monitor volume status.
Once a patient is taking at least 60% of caloric needs either by mouth or by EN, PN can be discontinued. Tapering the infusion is not required, as abrupt discontinuation has not been demonstrated to cause symptomatic hypoglycemia.47, 48
PATIENT MONITORING
Laboratory monitoring with nutrition support should include baseline electrolytes, glucose, renal function, coagulation studies, triglycerides, magnesium, phosphorus, cholesterol, platelet count, and hepatobiliary enzymes. Electrolytes, calcium, magnesium, and phosphorus should be checked daily for 3 days and, if normal, should then be checked biweekly. Capillary glucose should be monitored several times a day until stable. Weekly triglycerides, albumin, cholesterol, coagulation studies, and liver enzymes should also be checked in patients while on parenteral nutrition.25 Patients at risk for refeeding syndrome should have potassium, phosphate, calcium, and magnesium measured daily for 7 days, with repletion as necessary. These electrolytes should be monitored 3 times the following week if stable.49
Patients should be monitored clinically for gastrointestinal tolerance of enteral nutrition. All 3 North American guidelines recommend monitoring gastric residual volumes (GRV); however, there is no consensus on the volume considered to require intervention. Motility agents are recommended as first line treatment of high GRV.36, 37, 42 If high GRV continues, tube feeding should be held, and tube placement, medications, and metabolic assessment should be reviewed. Placement of a transpyloric feeding tube may be indicated.50
Adverse Effects and Complications of Nutrition Support
Regarding EN, complications include those related to tube placement and maintenance, infections, and medical complications of the feeds themselves. Some of the adverse effects of the enteral formulas may be attenuated. Diarrhea, which occurs in up to 20% of patients, may be avoided with slow feed advancement, use of low‐osmotic formulas, or fiber additives.51 Gastric distention and abdominal pain may improve with slow feed advancement and continuous (rather than bolus) feeds. Small‐bore tubes and acid‐reducing medications may decrease gastroesophageal reflux, and aspiration pneumonia may be avoided by semi‐recumbent positioning and post‐pyloric feeding.52
Complications of PN may be grouped as mechanical, infectious, and metabolic. The mechanical complications of central line placement include pneumothorax, arterial puncture, hematoma, air embolism, and line malpositioning. Catheter‐related deep venous thrombosis may occur. Patients on PN through a central line are at risk for central line‐associated bloodstream infections.25 The metabolic complications such as hyperglycemia, electrolyte disorders, hepatic steatosis, and volume overload may have severe consequences, such as heart failure or neuromuscular dysfunction, thus they require close attention.53
A complication of nutrition support that may occur regardless of route is the refeeding syndrome. Refeeding syndrome describes fluid shifts and electrolyte abnormalities that occur after initiation of oral, enteral, or parenteral nutrition in a malnourished or starved patient.54, 55 There are no formal criteria for diagnosing refeeding syndrome.
In the starved state, the body switches from carbohydrate to protein and fat metabolism. Reintroduction of carbohydrates stimulates insulin release with glycogen, fat, and protein synthesis. Associated uptake of glucose, potassium, magnesium, phosphate, and water into cells causes electrolyte and fluid abnormalities. Although hypophosphatemia is the hallmark of refeeding syndrome, it is not pathognomonic. Additional disturbances include hypokalemia, hyperglycemia, hypomagnesemia, thiamine deficiency, and fluid imbalance.49 Patients at risk of refeeding should have serum electrolytes, magnesium, phosphorus, and glucose checked before nutrition support starts. The degree of laboratory abnormalities, if any, and the clinical course of refeeding guides the frequency of subsequent blood tests.56 These consequences of refeeding can adversely affect every major organ system and may result in death.57
Starvation physiology underlies all risk factors for refeeding syndrome. In hospitalized patients, those at risk for refeeding include, but are not limited to, the elderly, oncology patients, postoperative patients, alcohol‐dependent patients, those with malabsorptive states, those who are fasting or chronically malnourished, and those on diuretic therapy.54, 57 The National Institute for Health and Clinical Excellence (NICE) of England and Wales has published criteria to identify patients at high risk for refeeding (Table 3).56 Identification of at‐risk patients and attention to their nutritional needs prevents refeeding syndrome.
|
| Patient has 1 or more of the following: |
| BMI 16 kg/m2 |
| Unintentional weight loss >15% within the last 36 mo |
| Little or no nutritional intake for more than 10 d |
| Low levels of potassium, phosphate, or magnesium prior to feeding |
| Or patient has 2 or more of the following: |
| BMI 18.5 kg/m2 |
| Unintentional weight loss >10% within the last 36 mo |
| Little or no nutritional intake for more than 5 d |
| A history of alcohol abuse or drugs including insulin, chemotherapy, antacids, or diuretics |
ASPEN and NICE have each issued guidelines for initiating nutrition support in patients at risk for refeeding. ASPEN guidelines recommend feeding start at approximately 25% of the estimated goal, with advancement to goal over 35 days. ASPEN recommends fluid and electrolyte status be monitored as needed.50 The NICE guidelines recommend starting nutrition support at a maximum of 10 kcal/kg/d with slow increase to meet or exceed full needs by 47 days. For extremely malnourished patients (eg, BMI 14 kg/m2, or negligible intake for >15 days), they recommend starting at 5 kcal/kg/d. For patients at high risk of developing refeeding syndrome, the NICE guidelines recommend vitamin repletion immediately before and during the first 10 days of feeding (thiamine, vitamin B, and a balanced multivitamin/trace element supplement). Cardiac monitoring is recommended for this group as well as any patients who are at risk for cardiac arrhythmias. Careful monitoring of fluid balance and restoring circulatory volume is recommended, as is repletion of potassium, phosphate, and magnesium.56
TERMINATION OF THERAPY
Termination of nutrition support often involves transitioning from one mode of support to another. PN can be discontinued when oral or enteral intake reaches 60% of total calories; enteral intake can be discontinued when oral intake reaches the same level. However, the patient should be observed maintaining their intake; if they cannot, nutrition support should be resumed.12
TRANSITION OF CARE PLAN
Patients discharged from the hospital on enteral or parenteral nutrition require the support of a coordinated multidisciplinary team including dietitians, home nutrition delivery companies, primary care physicians trained in specialized nutrition support, community pharmacists, and other healthcare professionals, if indicated. These relationships should be established prior to discharge, with education about the patient's individualized nutrition plan, and training with the equipment and supplies.10, 56
CONCLUSION
This review provides an overview of managing the at‐risk or malnourished patient by describing the processes of screening, assessment, and development and implementation of a nutrition care plan in the acutely ill hospitalized patient. Malnutrition is a relatively common, yet underdiagnosed entity that impacts patient outcomes, length of stay, hospital costs, and readmissions. Acute illness in a patient already nutritionally debilitated by chronic disease may cause rapid depletion in nutritional stores. Hospitals are required to screen patients for malnutrition on admission and at regular intervals, and to develop and implement a nutrition care plan for those at risk. The plan guides how nutrition therapy is provided, monitored for adequacy and adverse effects, and assessed for achievement of nutritional goals. It encompasses the use of dietary modifications, and enteral and parenteral nutrition. Clinicians must be aware of serious but avoidable adverse effects, particularly refeeding syndrome in malnourished patients. Prior to discharge, the patient should have already been transitioned from EN or PN to taking adequate amounts of calories by mouth; otherwise, careful discharge planning to educate the patients and/or caregivers, and coordinate the necessary multidisciplinary community services is necessary.
Acknowledgements
The authors express their appreciation to Ms Susan Lundy, for her helpful and timely information, and Ms Lisa Boucher, for her invaluable assistance with this manuscript and its submission.
Disclosures: Susan Brantley is on the Speaker's Bureau for Nestle Nutrition and for Abbott Nutrition. Authors Kirkland, Kashiwagi, Scheurer, and Varkey have nothing to report.
Malnutrition is present in 20% to 50% of hospitalized patients.1, 2 Despite simple, validated screening tools, malnutrition tends to be underdiagnosed.3, 4 Over 90% of elderly patients transitioning from an acute care hospital to a subacute care facility are either malnourished or at risk of malnutrition.5 Malnutrition has been associated with increased risk of nosocomial infections,6 worsened discharge functional status,7 and higher mortality,8 as well as longer lengths of stay7, 8 and higher hospital costs.2
Malnutrition describes either overnutrition or undernutrition that causes a change in body composition and decreased function.9 Malnutrition in hospitalized patients is typically related to undernutrition due to either reduced intake or increased metabolic rate. Reasons for reduced intake include poor appetite, reduced ability to chew or swallow, and nil per os (NPO) status. Patients with acute or chronic illnesses may either be malnourished on admission, or develop malnutrition within a few days of hospital admission, due to the effects of the inflammatory state on metabolism. Given that malnutrition is potentially modifiable, it is important to screen for malnutrition and, when present, develop, implement, and monitor a nutrition care plan10 (Figure 1).
The purpose of this review is to provide the hospitalist with an overview of screening, assessment, and development and implementation of a nutrition care plan in the acutely ill hospitalized patient.
PATIENT SCREENING
Nutrition screening identifies patients with nutritional deficits who may benefit from further detailed nutrition assessment and intervention.11 The Joint Commission requires that all patients admitted to acute care hospitals be screened for risk of malnutrition within 24 hours.12 Those considered at risk for malnutrition have significant weight changes, chronic disease or an acute inflammatory process, or have been unable to ingest adequate calories for 7 days.13
Those not at risk should be regularly rescreened throughout their hospital stay. The American Society of Parenteral and Enteral Nutrition (ASPEN) recommends that institutions create and approve a screening process according to the patient population served.10 There are several tools validated for use in the acute care setting.14 Many institutions trigger an automatic nutrition consult when certain screening criteria are met.
PATIENT ASSESSMENT
Nutrition assessment should be performed by a dietitian or nutrition consult provider in patients who screen at risk for malnutrition to characterize and determine the cause of nutritional deficits.10 The nutrition assessment identifies history and physical examination elements to diagnose malnutrition. An ASPEN consensus statement recommends the diagnosis of malnutrition if 2 or more of the following are present: insufficient energy intake, weight loss, loss of muscle mass, loss of subcutaneous fat, localized or generalized fluid accumulation, and decreased functional status measured by hand‐grip strength.9 The nutrition assessment should also consider how long the patient has been without adequate nutrition, document baseline nutrition parameters,15 and estimate caloric requirements to determine nutrition support therapy needs.10 Nutrition assessment typically includes the following components.
History
A careful history elicits the majority of information needed to determine the cause and severity of malnutrition.16 Patients should be questioned about a typical day's oral intake prior to hospitalization, and about factors that affect their intake such as sensory deficits, fine motor dysfunction, or chewing and swallowing difficulties, which often decline in chronically ill and elderly patients. Nutrition may be affected by financial difficulties or limited social support, and access to food should be assessed.
Physical Findings
Weight loss is the best physical exam predictor of malnutrition risk, although nutritional depletion can occur in a very short time in acutely ill or injured patients before substantial weight loss has occurred. The likelihood of malnutrition is increased if a patient has: a body mass index (BMI) 18.5 kg/m2; unintentional loss of >2.3 kg (5 lb) or 5% of body weight over 1 month; and unintentional loss of >4.5 kg (10 lb) or 10% of body weight over 6 months.17 Weight loss may be masked by fluid retention from chronic conditions, such as heart failure, or from volume resuscitation in the acutely ill patient.9, 16
Body mass index can be misleading, as age‐related height loss may artificially increase BMI, and height may be difficult to accurately measure in a kyphotic, unsteady, or bedridden patient. The clinician may find evidence of loss of subcutaneous fat or muscle mass in patients with chronic illness, but these findings may not be evident in the acutely ill patient.9 Other physical exam assessments of malnutrition, such as arm span, skinfold thickness, and arm circumference are not reliable.16
Laboratory Tests
Biochemical markers, including transferrin, albumin, and prealbumin, have not been proven as accurate predictors of nutrition status because they may change as a result of other factors not related to nutrition.15, 18 Serum albumin, for example, may be more reflective of the degree of metabolic stress.19 Prealbumin has a serum half‐life much shorter than albumin or transferrin (approximately 2448 hours) and is perhaps the most useful protein marker to assess the adequacy of nutritional replacement after the inflammatory state is resolved.18
Calculating Caloric Requirements
Energy expenditure measurement is considered the gold standard to determine patients' caloric needs. Actual measurement by methods such as indirect calorimetry, which measures oxygen consumption and carbon dioxide production, and calculates energy expenditure, is challenging in everyday clinical settings. Predictive equations often are used as alternative methods to estimate patients' caloric requirements.20 There is no consensus among the 3 North American societies' guidelines (the Canadian Clinical Practice Guidelines; the American Dietetics Association's evidence‐based guideline for critical illness; and the Society of Critical Care Medicine and American Society of Parenteral and Enteral Nutrition's joint guideline) as to the best method.21
In the simplest equation, caloric needs are estimated by calories per kilogram.22 In obese patients, using actual body weight will overestimate needs, but using ideal body weight may cause underfeeding. A small study comparing predictive equations in obese hospitalized patients found the Harris‐Benedict equations (H‐BE) using adjusted body weight and a stress factor to be most accurate, but only in 50% of patients.23 Most clinicians are familiar with the H‐BE, but alternatives such as calories per kilogram or the Mifflin St.‐Jeor equation24 are often used (S. Brantley (May 5, 2012), S. Lundy (May 23, 2012), personal communication).
Indications for Nutritional Intervention
In adults without preexisting malnutrition, inadequate nutritional intake for approximately 714 days should prompt nutritional intervention.25, 26 This timeline should be shorter (37 days) in those with lower energy reserves (eg, underweight or recent weight loss) or significant catabolic stress (eg, acutely ill patients).27, 28 Other patient populations shown to benefit from nutritional intervention include: postoperative patients who are anticipated to be NPO for more than 7 days or to be taking less than 60% of estimated caloric needs by postoperative day 10; preoperative patients with severe malnutrition29; those with gastrointestinal cancer undergoing elective surgery30; and stroke patients with persistent dysphagia for more than 7 days.31
DEVELOPMENT OF A NUTRITION CARE PLAN
The formal nutrition assessment of the at‐risk patient derives the information needed for the development of a nutrition care plan. This plan guides the provision of nutrition therapy, the intervention, the monitoring protocols, evaluation, and reassessment of nutrition goals or termination of specialized nutrition support.10 Assessments for adequacy of nutritional repletion are best done by repeated screening and physical examinations.18
IMPLEMENTATION OF NUTRITION CARE PLAN
Nutritional interventions include dietary modifications, enteral nutrition, and parenteral nutrition.
Dietary Modifications
The purpose of the diet is to provide the necessary nutrients to the body in a well‐tolerated form. Diets can be modified to provide for individual requirements, personal eating patterns and food preferences, and disease process and digestive capacity. Dietary adjustments include change in consistency of foods (eg, pureed, mechanical soft), increase or decrease in energy value, increase or decrease in the type of food or nutrient consumed (eg, sodium restriction, fiber enhancement), elimination of specific foods (eg, gluten‐free diet), adjustment in protein, fat, and carbohydrate content (eg, ketogenic diet, renal diet, cholesterol‐lowering diet), and adjustment of the number and frequency of meals.32
Dietary supplementation (eg, Boost, Ensure) is common practice in persons diagnosed with such conditions as cancer, diabetes, and cardiovascular disease. Supplements enhance the diet by increasing the total daily intake of a vitamin, a mineral, an amino acid, an herb or other botanical33, and should not be used as a meal substitute.34 These supplements are varied in content of calories, protein, vitamins, and minerals. Various flavors and consistencies are also available. Several oral supplements are reviewed in Table 1.
| Oral Supplement* (Serving Size; mL) | Kcal/svg | Protein (g/svg) | Fat (g/svg) | CHO (g/svg) | Na (mg/svg) | K (mg/svg) | Ca (mg/svg) | Phos (mg/svg) | Mg (mg/svg) |
|---|---|---|---|---|---|---|---|---|---|
| |||||||||
| Boost Original (237) | 240 | 10 | 4 | 41 | 150 | 460 | 300 | 300 | 100 |
| Ensure Nutrition Shake (237) | 250 | 9 | 6 | 40 | 200 | 370 | 300 | 250 | 100 |
| Carnation Instant Breakfast Ready to Drink (325) | 250 | 14 | 5 | 34 | 180 | 330 | 500 | 500 | 120 |
| Resource Breeze (fruit‐flavored) clear liquid (237) | 250 | 9 | 0 | 54 | 80 | 10 | 10 | 150 | 1 |
| Glucerna 1.0 Ready to Drink low‐CHO (237) | 240 | 10 | 13 | 23 | 220 | 370 | 170 | 170 | 67 |
| Re/Gen low K and Phos (180) | 375 | 12 | 17 | 47 | 180 | 23 | 15 | 68 | 3 |
Enteral Nutrition
Enteral nutrition (EN) support should be provided to patients who have functioning gastrointestinal (GI) tracts but are unable to take adequate calories orally. Compared to parenteral nutrition (PN), EN is associated with favorable improvements in inflammatory cytokines, acute phase proteins, hyperglycemia, insulin resistance, nosocomial infections, mortality, and cost.35 Enteral feeds are more physiologic than parenteral feeds, maintain GI structure and integrity, and avoid intravenous (IV) access complications. Patients with normal nutritional status on admission who require EN should be receiving over 50% of their caloric needs within the first week of hospital stay.25 Malnourished patients should reach this minimum goal within 35 days of admission.27, 28 EN is not contraindicated in the absence of bowel sounds or in the presence of increased gastric residuals.35 Withholding enteral feedings for gastric residual volumes 250 mL36, 37 or reduced bowel sounds can result in inadequate caloric intake or inappropriate use of PN.27
Gastric feedings are more physiologic than small bowel feedings, can be given by bolus or continuous infusion, and can be given by tubes that are easy to place at the bedside. Post‐pyloric feedings (nasoduodenal or nasojejunal) may be associated with a lower risk of pneumonia, and should be considered in high‐risk patients such as those receiving continuous sedatives or neuromuscular blockers.36 Post‐pyloric tube placement usually requires endoscopy, fluoroscopy, or electromagnetic guidance. Percutaneous feeding tubes (gastrostomy or jejunostomy) should be considered in those who require tube feedings for longer than 30 days.38
Assessment of patient requirements and disease state, as well as extensive knowledge of available formulas, is important in the selection of the appropriate enteral formula.39 Standardized formulas are used for most patients. The provision of adequate water must be considered with these formulas, particularly in the long‐term care and home settings.40 Many specialized formulas are designed for a particular disease state or condition, some of which are further reviewed in Table 2.
| Formula | Kcal/mL | Protein (g/L) | Fat (g/L) | CHO (g/L) | Osmolality (mOsm/kg H2O) | Na (mEq/L) | K (mEq/L) | Ca (mg/L) | Mg (mg/L) | Phos (mg/L) |
|---|---|---|---|---|---|---|---|---|---|---|
| ||||||||||
| Nutren 1.0‐low residue | 1 | 40 | 38 | 127 | 315 | 38 | 32 | 668 | 268 | 668 |
| Osmolite 1.0 Cal low residue | 1 | 44.3 | 34.7 | 143.9 | 300 | 40.4 | 40.2 | 760 | 305 | 1760 |
| Replete high protein, low residue | 1 | 62.4 | 34 | 112 | 300 | 38.1 | 38.5 | 1000 | 400 | 1000 |
| Replete Fiber high protein with fiber | 1 | 62.4 | 34 | 112 | 310 | 38.1 | 38.5 | 1000 | 400 | 1000 |
| Osmolite 1.5 low residue, calorically dense | 1.5 | 62.7 | 49.1 | 203.6 | 525 | 60.9 | 46 | 1000 | 400 | 1000 |
| Two Cal calorie and protein dense | 2 | 83.5 | 91 | 219 | 725 | 64 | 63 | 1050 | 425 | 1050 |
| Vivonex RTF‐elemental | 1 | 50 | 11.6 | 176 | 630 | 30.4 | 31 | 668 | 268 | 668 |
| Nepro with Carb Steady‐for electrolyte, fluid restriction (eg, dialysis) | 1.8 | 81 | 96 | 161 | 745 | 46 | 27 | 1060 | 210 | 720 |
| Nutren Glytrol low CHO | 1 | 45.2 | 47.6 | 100 | 280 | 32.2 | 35.9 | 720 | 286 | 720 |
| NutriHep‐for hepatic disease | 1.5 | 40 | 21.2 | 290 | 790 | 160 | 33.9 | 956 | 376 | 1000 |
If concerned about formula tolerance, one solution is to initiate the formula at a low rate and increase to the goal rate over 2448 hours. Dilution of enteral formulas is not necessary to assure optimal tolerance. Continuous feedings are recommended for most patients initially and after tolerance has been established, bolus feedings can be attempted if the feeding tube terminates in the stomach. Bolus feedings, where 240480 mL of formula are delivered through a syringe over 1015 minutes, may be more physiological for patients. This regimen can be repeated 46 times daily to meet nutrition goals.41
Parenteral Nutrition
PN provides macronutrients such as carbohydrates, protein, and fat; micronutrients such as vitamins, minerals, electrolytes, and trace elements are added in appropriate concentrations. PN may also provide the patient's daily fluid needs. The timing of PN initiation depends upon the patient's initial nutritional status. ASPEN does not recommend PN during the first 7 days of hospitalization in critically ill patients with normal nutritional status. If the patient is not receiving 100% of caloric needs from EN after 7 days, supplemental PN should be considered. However, if on admission a patient is already malnourished and EN is not feasible, PN should be initiated and continued until the patient is receiving at least 60% of caloric needs by enteral route.42 This includes patients with intestinal obstruction, ileus, peritonitis, malabsorption, high output enterocutaneous fistulae, intestinal ischemia, intractable vomiting and diarrhea, severe shock, and fulminant sepsis.10, 43
Standardized commercial PN products are available and reduce the number of steps required between ordering and administration, as compared to customized PN, which is compounded for a particular patient. However, despite improved efficiency and lower cost, there is no evidence that standardized preparations are safer to patients than customized solutions. Institutions utilizing standardized PN must also have a mechanism to customize formulas for those with complex needs.44
Creating a customized parenteral solution involves several basic steps. Total caloric requirement may be estimated using a predictive formula, as previously discussed; calories/kg of ideal body weight is the simplest method. Most hospitalized patients require 2030 calories/kg/d. Daily fluid requirement may be based on kilocalories (kcal) delivered, or by ideal body weight (eg, 1 mL/kcal or 3040 mL/kg). More fluid may be needed in patients with significant sensible or insensible losses; those with renal failure or heart failure should receive less fluid.
Protein needs are calculated by multiplying ideal body weight (kg) by estimated protein needs in g/kg/d (1.22 g/kg/d for catabolic patients). Protein should provide approximately 20% of total calories. Protein restriction is not required in renal impairment; acutely ill patients on renal replacement therapy should receive 1.51.8 g/kg/d. In hepatic failure patients, protein should be restricted only if hepatic encephalopathy fails to improve with other measures.
Knowing the protein, kcal, and fluid needs of the patient, the practitioner divides the remaining non‐protein calories between carbohydrates and fat. Approximately 70%85% of non‐protein calories should be provided as carbohydrates (dextrose), up to 7 g/kg/d. The other 15%30% are as fat, in lipid solutions, providing a maximum of 2.5 g/kg/d. Lipid solutions are provided as either 10% (1.1 kcal/mL) or 20% (2.2 kcal/mL) concentrations.43, 44 Propofol's contribution to fat intake complicates estimating total fat intake in critically ill patients.45
Standardized parenteral multivitamin preparations are available; the clinician must determine if preparations containing vitamin K are appropriate. Of the trace elements, copper and manganese should be restricted in hepatobiliary disease.44
Acutely ill patients receive PN as a 24‐hour infusion, to minimize its impact on volume status and energy expenditure,46 providing 50% of needs on infusion day one and reaching goal within 4872 hours, rather than cyclic infusions over shorter intervals. Daily assessments of vital signs, intake and output, and weight are necessary to monitor volume status.
Once a patient is taking at least 60% of caloric needs either by mouth or by EN, PN can be discontinued. Tapering the infusion is not required, as abrupt discontinuation has not been demonstrated to cause symptomatic hypoglycemia.47, 48
PATIENT MONITORING
Laboratory monitoring with nutrition support should include baseline electrolytes, glucose, renal function, coagulation studies, triglycerides, magnesium, phosphorus, cholesterol, platelet count, and hepatobiliary enzymes. Electrolytes, calcium, magnesium, and phosphorus should be checked daily for 3 days and, if normal, should then be checked biweekly. Capillary glucose should be monitored several times a day until stable. Weekly triglycerides, albumin, cholesterol, coagulation studies, and liver enzymes should also be checked in patients while on parenteral nutrition.25 Patients at risk for refeeding syndrome should have potassium, phosphate, calcium, and magnesium measured daily for 7 days, with repletion as necessary. These electrolytes should be monitored 3 times the following week if stable.49
Patients should be monitored clinically for gastrointestinal tolerance of enteral nutrition. All 3 North American guidelines recommend monitoring gastric residual volumes (GRV); however, there is no consensus on the volume considered to require intervention. Motility agents are recommended as first line treatment of high GRV.36, 37, 42 If high GRV continues, tube feeding should be held, and tube placement, medications, and metabolic assessment should be reviewed. Placement of a transpyloric feeding tube may be indicated.50
Adverse Effects and Complications of Nutrition Support
Regarding EN, complications include those related to tube placement and maintenance, infections, and medical complications of the feeds themselves. Some of the adverse effects of the enteral formulas may be attenuated. Diarrhea, which occurs in up to 20% of patients, may be avoided with slow feed advancement, use of low‐osmotic formulas, or fiber additives.51 Gastric distention and abdominal pain may improve with slow feed advancement and continuous (rather than bolus) feeds. Small‐bore tubes and acid‐reducing medications may decrease gastroesophageal reflux, and aspiration pneumonia may be avoided by semi‐recumbent positioning and post‐pyloric feeding.52
Complications of PN may be grouped as mechanical, infectious, and metabolic. The mechanical complications of central line placement include pneumothorax, arterial puncture, hematoma, air embolism, and line malpositioning. Catheter‐related deep venous thrombosis may occur. Patients on PN through a central line are at risk for central line‐associated bloodstream infections.25 The metabolic complications such as hyperglycemia, electrolyte disorders, hepatic steatosis, and volume overload may have severe consequences, such as heart failure or neuromuscular dysfunction, thus they require close attention.53
A complication of nutrition support that may occur regardless of route is the refeeding syndrome. Refeeding syndrome describes fluid shifts and electrolyte abnormalities that occur after initiation of oral, enteral, or parenteral nutrition in a malnourished or starved patient.54, 55 There are no formal criteria for diagnosing refeeding syndrome.
In the starved state, the body switches from carbohydrate to protein and fat metabolism. Reintroduction of carbohydrates stimulates insulin release with glycogen, fat, and protein synthesis. Associated uptake of glucose, potassium, magnesium, phosphate, and water into cells causes electrolyte and fluid abnormalities. Although hypophosphatemia is the hallmark of refeeding syndrome, it is not pathognomonic. Additional disturbances include hypokalemia, hyperglycemia, hypomagnesemia, thiamine deficiency, and fluid imbalance.49 Patients at risk of refeeding should have serum electrolytes, magnesium, phosphorus, and glucose checked before nutrition support starts. The degree of laboratory abnormalities, if any, and the clinical course of refeeding guides the frequency of subsequent blood tests.56 These consequences of refeeding can adversely affect every major organ system and may result in death.57
Starvation physiology underlies all risk factors for refeeding syndrome. In hospitalized patients, those at risk for refeeding include, but are not limited to, the elderly, oncology patients, postoperative patients, alcohol‐dependent patients, those with malabsorptive states, those who are fasting or chronically malnourished, and those on diuretic therapy.54, 57 The National Institute for Health and Clinical Excellence (NICE) of England and Wales has published criteria to identify patients at high risk for refeeding (Table 3).56 Identification of at‐risk patients and attention to their nutritional needs prevents refeeding syndrome.
|
| Patient has 1 or more of the following: |
| BMI 16 kg/m2 |
| Unintentional weight loss >15% within the last 36 mo |
| Little or no nutritional intake for more than 10 d |
| Low levels of potassium, phosphate, or magnesium prior to feeding |
| Or patient has 2 or more of the following: |
| BMI 18.5 kg/m2 |
| Unintentional weight loss >10% within the last 36 mo |
| Little or no nutritional intake for more than 5 d |
| A history of alcohol abuse or drugs including insulin, chemotherapy, antacids, or diuretics |
ASPEN and NICE have each issued guidelines for initiating nutrition support in patients at risk for refeeding. ASPEN guidelines recommend feeding start at approximately 25% of the estimated goal, with advancement to goal over 35 days. ASPEN recommends fluid and electrolyte status be monitored as needed.50 The NICE guidelines recommend starting nutrition support at a maximum of 10 kcal/kg/d with slow increase to meet or exceed full needs by 47 days. For extremely malnourished patients (eg, BMI 14 kg/m2, or negligible intake for >15 days), they recommend starting at 5 kcal/kg/d. For patients at high risk of developing refeeding syndrome, the NICE guidelines recommend vitamin repletion immediately before and during the first 10 days of feeding (thiamine, vitamin B, and a balanced multivitamin/trace element supplement). Cardiac monitoring is recommended for this group as well as any patients who are at risk for cardiac arrhythmias. Careful monitoring of fluid balance and restoring circulatory volume is recommended, as is repletion of potassium, phosphate, and magnesium.56
TERMINATION OF THERAPY
Termination of nutrition support often involves transitioning from one mode of support to another. PN can be discontinued when oral or enteral intake reaches 60% of total calories; enteral intake can be discontinued when oral intake reaches the same level. However, the patient should be observed maintaining their intake; if they cannot, nutrition support should be resumed.12
TRANSITION OF CARE PLAN
Patients discharged from the hospital on enteral or parenteral nutrition require the support of a coordinated multidisciplinary team including dietitians, home nutrition delivery companies, primary care physicians trained in specialized nutrition support, community pharmacists, and other healthcare professionals, if indicated. These relationships should be established prior to discharge, with education about the patient's individualized nutrition plan, and training with the equipment and supplies.10, 56
CONCLUSION
This review provides an overview of managing the at‐risk or malnourished patient by describing the processes of screening, assessment, and development and implementation of a nutrition care plan in the acutely ill hospitalized patient. Malnutrition is a relatively common, yet underdiagnosed entity that impacts patient outcomes, length of stay, hospital costs, and readmissions. Acute illness in a patient already nutritionally debilitated by chronic disease may cause rapid depletion in nutritional stores. Hospitals are required to screen patients for malnutrition on admission and at regular intervals, and to develop and implement a nutrition care plan for those at risk. The plan guides how nutrition therapy is provided, monitored for adequacy and adverse effects, and assessed for achievement of nutritional goals. It encompasses the use of dietary modifications, and enteral and parenteral nutrition. Clinicians must be aware of serious but avoidable adverse effects, particularly refeeding syndrome in malnourished patients. Prior to discharge, the patient should have already been transitioned from EN or PN to taking adequate amounts of calories by mouth; otherwise, careful discharge planning to educate the patients and/or caregivers, and coordinate the necessary multidisciplinary community services is necessary.
Acknowledgements
The authors express their appreciation to Ms Susan Lundy, for her helpful and timely information, and Ms Lisa Boucher, for her invaluable assistance with this manuscript and its submission.
Disclosures: Susan Brantley is on the Speaker's Bureau for Nestle Nutrition and for Abbott Nutrition. Authors Kirkland, Kashiwagi, Scheurer, and Varkey have nothing to report.
- ,,, et al.Prevalence of malnutrition on admission to four hospitals in England. The Malnutrition Prevalence Group.Clin Nutr.2000;19(3):191–195.
- ,.The impact of malnutrition on morbidity, mortality, length of hospital stay and costs evaluated through a multivariate model analysis.Clin Nutr.2003;22(3):235–239.
- ,,,.Malnutrition among hospitalized patients. A problem of physician awareness.Arch Intern Med.1987;147(8):1462–1465.
- ,,,,.Malnutrition is prevalent in hospitalized medical patients: are housestaff identifying the malnourished patient?Nutrition.2006;22(4):350–354.
- ,,, et al.Malnutrition in subacute care.Am J Clin Nutr.2002;75(2):308–313.
- ,,, et al.Malnutrition is an independent factor associated with nosocomial infections.Br J Nutr.2004;92(1):105–111.
- ,.Impact of body mass index on outcomes following critical care.Chest.2003;123(4):1202–1207.
- ,,, et al.EuroOOPS: an international, multicentre study to implement nutritional risk screening and evaluate clinical outcome.Clin Nutr.2008;27(3):340–349.
- ,,,,.Consensus statement: Academy of Nutrition and Dietetics and American Society for Parenteral and Enteral Nutrition: characteristics recommended for the identification and documentation of adult malnutrition (undernutrition).J Parenter Enteral Nutr.2012;36(3):275–283.
- ,,, et al.Standards for nutrition support: adult hospitalized patients.Nutr Clin Pract.2010;25(4):403–414.
- American Society for Parenteral and Enteral Nutrition (A.S.P.E.N.), Board of Directors and Clinical Practice Committee. Definition of Terms, Style, and Conventions used in A.S.P.E.N. Board of Directors‐Approved Documents. May2012. Available at: http://www.nutritioncare.org/Library.aspx. Accessed June 29, 2012.
- Joint Commission on Accreditation of Healthcare Organizations.Comprehensive Accreditation for Hospitals.Chicago, IL:Joint Commission on Accreditation for Healthcare Organizations;2007.
- ,.Nutrition screening and assessment. In: Gottschlich MM, ed.The ASPEN Nutrition Support Core Curriculum: A Case‐Based Approach—The Adult Patient.1st ed.Silver Spring, MD:American Society for Parenteral and Enteral Nutrition;2007:163–186.
- .Nutrition screening tools for hospitalized patients.Nutr Clin Pract.2008;23(4):373–382.
- .Nutrition screening and assessment. In: Skipper A, ed.Dietitian's Handbook of Enteral and Parenteral Nutrition.3rd ed.Sudbury, MA:Jones 2012:4–21.
- ,.Nutritional assessment in the hospitalized patient.Curr Opin Clin Nutr Metab Care.2003;6(5):531–538.
- ,,,,.Nutritional and metabolic assessment of the hospitalized patient.J Parenter Enteral Nutr.1977;1(1):11–22.
- ,,.Hepatic proteins and nutrition assessment.J Am Diet Assoc.2004;104(8):1258–1264.
- .The albumin‐nutrition connection: separating myth from fact.Nutrition.2002;18(2):199–200.
- ,.Predictive equations for energy needs for the critically ill.Respir Care.2009;54(4):509–521.
- ,,, et al.Guidelines, guidelines, guidelines: what are we to do with all of these North American guidelines?J Parenter Enteral Nutr.2010;34(6):625–643.
- ,,, et al.Applied nutrition in ICU patients. A consensus statement of the American College of Chest Physicians.Chest.1997;111(3):769–778.
- ,,,,.Comparison of resting energy expenditure prediction methods with measured resting energy expenditure in obese, hospitalized adults.J Parenter Enteral Nutr.2009;33(2):168–175.
- ,,,,,.A new predictive equation for resting energy expenditure in healthy individuals.Am J Clin Nutr.1990;51(2):241–247.
- American Society for Parenteral and Enteral Nutrition.Guidelines for the use of parenteral and enteral nutrition in adult and pediatric patients.J Parenter Enteral Nutr.2002;26(suppl):1SA–138SA.
- ,,.American Gastroenterological Association technical review on tube feeding for enteral nutrition.Gastroenterology.1995;108(4):1282–1301.
- ,,, et al.ESPEN guidelines on enteral nutrition: intensive care.Clin Nutr.2006;25(2):210–223.
- ,.Nutritional support. In: Shojania KG, Duncan BW, McDonald KM, et al, eds.Making Health Care Safer: A Critical Analysis of Patient Safety Practices. Evidence Report/Technology Assessment Number 43.Rockville, MD:Agency for Healthcare Research and Quality, US Department of Health and Human Services, July2001. AHRQ Publication 01‐E058. Available at: http://www.ahrq.gov.
- Veterans Affairs Total Parenteral Nutrition Cooperative Study Group.Perioperative total parenteral nutrition in surgical patients.N Engl J Med.1991;328(8):525–532.
- ,,,,.Does enteral nutrition affect clinical outcome? A systematic review of the randomized trials.Am J Gastroenterol.2007;102(2):412–429.
- ,,,.Nutrition in the stroke patient.Nutr Clin Pract.2011;26(3):242–252.
- ,,.Nutrition diagnosis and intervention. In: Mahan LK, Escott‐Stump S, eds.Krause's Food and Nutrition Therapy.12th ed.St Louis, MO:Saunders Elsevier;2008:454–469.
- Dietary Supplement Health and Education Act (DSHEA) of 1994. Available at: http://www.gpo.gov/fdsys/pkg/BILLS‐103s784es/pdf/BILLS‐103s784es.pdf. Accessed June 29,2012.
- .Intervention: dietary supplementation and integrative care. In: Mahan LK, Escott‐Stump S, eds.Krause's Food and Nutrition Therapy.12th ed.St Louis, MO:Saunders Elsevier;2008:470–474.
- ,,, et al.Guidelines for the provision and assessment of nutrition support therapy in the adult critically ill patient: Society of Critical Care Medicine and American Society for Parenteral and Enteral Nutrition: executive summary.Crit Care Med.2009;37(5):1757–1761.
- ,,,,;for the. Canadian Critical Care Clinical Practice Guidelines Committee.Canadian clinical practice guidelines for nutrition support in mechanically ventilated, critically ill adult patients.J Parenter Enteral Nutr.2003;27(5):355–373.
- American Dietetic Association Evidence Library. Critical Illness. Available at: http://www.adaevidencelibrary.com/template.cfm?key=767115(5 suppl):64S–70S.
- .Enteral nutrition. In: Skipper A, ed.Dietitian's Handbook of Enteral and Parenteral Nutrition.3rd ed.Sudbury, MA:Jones 2012:259–280.
- .Enteral formula selection. In: Charney P, Malone A, eds.ADA Pocket Guide to Enteral Nutrition.Chicago, IL:American Dietetic Association;2006:63–122.
- ,.Overview of enteral nutrition. In: Gottschlich MM, ed.The ASPEN Nutrition Support Core Curriculum: A Case‐Based Approach—The Adult Patient.1st ed.Silver Spring, MD:American Society for Parenteral and Enteral Nutrition;2007:187–208.
- ,,, et al.Guidelines for the provision and assessment of nutrition support therapy in the adult critically ill patient: Society of Critical Care Medicine (SCCM) and American Society for Parenteral and Enteral Nutrition (A.S.P.E.N.).J Parenter Enteral Nutr.2009;33(3):277–316.
- ,,,,,.ESPEN guidelines on parenteral nutrition: surgery.Clin Nutr.2009;28(4):378–386.
- ,,, et al.Safe practices for parenteral nutrition.J Parenter Enteral Nutr.2004;28(6):S39–S70.
- ,,,,,.Contribution of calories from propofol to total energy intake.J Am Diet Assoc.1995;95(9 supplement):A25.
- ,,,.Metabolic and thermogenic response to continuous and cyclic total parenteral nutrition in traumatised and infected patients.Clin Nutr.1994;13(5):291–301.
- ,,.The effect of abrupt cessation of total parenteral nutrition on serum glucose: a randomized trial.Am Surg.2000;66(9):866–869.
- ,,,,.The effect of acute discontinuation of total parenteral nutrition.Ann Surg.1986;204(5):524–529.
- ,,.Refeeding syndrome: what it is, and how to prevent and treat it.BMJ.2008;336(7659):1495–1498.
- ,,, et al.Enteral nutrition practice recommendations.J Parenter Enteral Nutr.2009;33(2):122–167.
- ,,.Control of diarrhea by fiber‐enriched diet in ICU patients on enteral nutrition: a prospective randomized controlled trial.Clin Nutr.2004;23(6):1344–1352.
- ,,,,,.Supine body position as a risk factor for nosocomial pneumonia in mechanically ventilated patients: a randomised trial.Lancet.1999;354(9193):1851–1858.
- .Parenteral nutrition in the critically ill patient.N Engl J Med.2009;361(11):1088–1097.
- ,,,.Refeeding syndrome: treatment considerations based on collective analysis of literature case reports.Nutrition.2010;26(2):156–167.
- ,,.Re‐feeding syndrome in head and neck cancer‐prevention and management.Oral Oncol.2011;47(9):792–796.
- Nutrition Support in Adults. NICE Clinical Guideline No. 32. 2006. Available at: http://guidance.nice.org.uk/CG32/NICEGuidance. Accessed November 29,2011.
- ,,.The importance of the refeeding syndrome.Nutrition.2001;17(7–8):632–637.
- ,,, et al.Prevalence of malnutrition on admission to four hospitals in England. The Malnutrition Prevalence Group.Clin Nutr.2000;19(3):191–195.
- ,.The impact of malnutrition on morbidity, mortality, length of hospital stay and costs evaluated through a multivariate model analysis.Clin Nutr.2003;22(3):235–239.
- ,,,.Malnutrition among hospitalized patients. A problem of physician awareness.Arch Intern Med.1987;147(8):1462–1465.
- ,,,,.Malnutrition is prevalent in hospitalized medical patients: are housestaff identifying the malnourished patient?Nutrition.2006;22(4):350–354.
- ,,, et al.Malnutrition in subacute care.Am J Clin Nutr.2002;75(2):308–313.
- ,,, et al.Malnutrition is an independent factor associated with nosocomial infections.Br J Nutr.2004;92(1):105–111.
- ,.Impact of body mass index on outcomes following critical care.Chest.2003;123(4):1202–1207.
- ,,, et al.EuroOOPS: an international, multicentre study to implement nutritional risk screening and evaluate clinical outcome.Clin Nutr.2008;27(3):340–349.
- ,,,,.Consensus statement: Academy of Nutrition and Dietetics and American Society for Parenteral and Enteral Nutrition: characteristics recommended for the identification and documentation of adult malnutrition (undernutrition).J Parenter Enteral Nutr.2012;36(3):275–283.
- ,,, et al.Standards for nutrition support: adult hospitalized patients.Nutr Clin Pract.2010;25(4):403–414.
- American Society for Parenteral and Enteral Nutrition (A.S.P.E.N.), Board of Directors and Clinical Practice Committee. Definition of Terms, Style, and Conventions used in A.S.P.E.N. Board of Directors‐Approved Documents. May2012. Available at: http://www.nutritioncare.org/Library.aspx. Accessed June 29, 2012.
- Joint Commission on Accreditation of Healthcare Organizations.Comprehensive Accreditation for Hospitals.Chicago, IL:Joint Commission on Accreditation for Healthcare Organizations;2007.
- ,.Nutrition screening and assessment. In: Gottschlich MM, ed.The ASPEN Nutrition Support Core Curriculum: A Case‐Based Approach—The Adult Patient.1st ed.Silver Spring, MD:American Society for Parenteral and Enteral Nutrition;2007:163–186.
- .Nutrition screening tools for hospitalized patients.Nutr Clin Pract.2008;23(4):373–382.
- .Nutrition screening and assessment. In: Skipper A, ed.Dietitian's Handbook of Enteral and Parenteral Nutrition.3rd ed.Sudbury, MA:Jones 2012:4–21.
- ,.Nutritional assessment in the hospitalized patient.Curr Opin Clin Nutr Metab Care.2003;6(5):531–538.
- ,,,,.Nutritional and metabolic assessment of the hospitalized patient.J Parenter Enteral Nutr.1977;1(1):11–22.
- ,,.Hepatic proteins and nutrition assessment.J Am Diet Assoc.2004;104(8):1258–1264.
- .The albumin‐nutrition connection: separating myth from fact.Nutrition.2002;18(2):199–200.
- ,.Predictive equations for energy needs for the critically ill.Respir Care.2009;54(4):509–521.
- ,,, et al.Guidelines, guidelines, guidelines: what are we to do with all of these North American guidelines?J Parenter Enteral Nutr.2010;34(6):625–643.
- ,,, et al.Applied nutrition in ICU patients. A consensus statement of the American College of Chest Physicians.Chest.1997;111(3):769–778.
- ,,,,.Comparison of resting energy expenditure prediction methods with measured resting energy expenditure in obese, hospitalized adults.J Parenter Enteral Nutr.2009;33(2):168–175.
- ,,,,,.A new predictive equation for resting energy expenditure in healthy individuals.Am J Clin Nutr.1990;51(2):241–247.
- American Society for Parenteral and Enteral Nutrition.Guidelines for the use of parenteral and enteral nutrition in adult and pediatric patients.J Parenter Enteral Nutr.2002;26(suppl):1SA–138SA.
- ,,.American Gastroenterological Association technical review on tube feeding for enteral nutrition.Gastroenterology.1995;108(4):1282–1301.
- ,,, et al.ESPEN guidelines on enteral nutrition: intensive care.Clin Nutr.2006;25(2):210–223.
- ,.Nutritional support. In: Shojania KG, Duncan BW, McDonald KM, et al, eds.Making Health Care Safer: A Critical Analysis of Patient Safety Practices. Evidence Report/Technology Assessment Number 43.Rockville, MD:Agency for Healthcare Research and Quality, US Department of Health and Human Services, July2001. AHRQ Publication 01‐E058. Available at: http://www.ahrq.gov.
- Veterans Affairs Total Parenteral Nutrition Cooperative Study Group.Perioperative total parenteral nutrition in surgical patients.N Engl J Med.1991;328(8):525–532.
- ,,,,.Does enteral nutrition affect clinical outcome? A systematic review of the randomized trials.Am J Gastroenterol.2007;102(2):412–429.
- ,,,.Nutrition in the stroke patient.Nutr Clin Pract.2011;26(3):242–252.
- ,,.Nutrition diagnosis and intervention. In: Mahan LK, Escott‐Stump S, eds.Krause's Food and Nutrition Therapy.12th ed.St Louis, MO:Saunders Elsevier;2008:454–469.
- Dietary Supplement Health and Education Act (DSHEA) of 1994. Available at: http://www.gpo.gov/fdsys/pkg/BILLS‐103s784es/pdf/BILLS‐103s784es.pdf. Accessed June 29,2012.
- .Intervention: dietary supplementation and integrative care. In: Mahan LK, Escott‐Stump S, eds.Krause's Food and Nutrition Therapy.12th ed.St Louis, MO:Saunders Elsevier;2008:470–474.
- ,,, et al.Guidelines for the provision and assessment of nutrition support therapy in the adult critically ill patient: Society of Critical Care Medicine and American Society for Parenteral and Enteral Nutrition: executive summary.Crit Care Med.2009;37(5):1757–1761.
- ,,,,;for the. Canadian Critical Care Clinical Practice Guidelines Committee.Canadian clinical practice guidelines for nutrition support in mechanically ventilated, critically ill adult patients.J Parenter Enteral Nutr.2003;27(5):355–373.
- American Dietetic Association Evidence Library. Critical Illness. Available at: http://www.adaevidencelibrary.com/template.cfm?key=767115(5 suppl):64S–70S.
- .Enteral nutrition. In: Skipper A, ed.Dietitian's Handbook of Enteral and Parenteral Nutrition.3rd ed.Sudbury, MA:Jones 2012:259–280.
- .Enteral formula selection. In: Charney P, Malone A, eds.ADA Pocket Guide to Enteral Nutrition.Chicago, IL:American Dietetic Association;2006:63–122.
- ,.Overview of enteral nutrition. In: Gottschlich MM, ed.The ASPEN Nutrition Support Core Curriculum: A Case‐Based Approach—The Adult Patient.1st ed.Silver Spring, MD:American Society for Parenteral and Enteral Nutrition;2007:187–208.
- ,,, et al.Guidelines for the provision and assessment of nutrition support therapy in the adult critically ill patient: Society of Critical Care Medicine (SCCM) and American Society for Parenteral and Enteral Nutrition (A.S.P.E.N.).J Parenter Enteral Nutr.2009;33(3):277–316.
- ,,,,,.ESPEN guidelines on parenteral nutrition: surgery.Clin Nutr.2009;28(4):378–386.
- ,,, et al.Safe practices for parenteral nutrition.J Parenter Enteral Nutr.2004;28(6):S39–S70.
- ,,,,,.Contribution of calories from propofol to total energy intake.J Am Diet Assoc.1995;95(9 supplement):A25.
- ,,,.Metabolic and thermogenic response to continuous and cyclic total parenteral nutrition in traumatised and infected patients.Clin Nutr.1994;13(5):291–301.
- ,,.The effect of abrupt cessation of total parenteral nutrition on serum glucose: a randomized trial.Am Surg.2000;66(9):866–869.
- ,,,,.The effect of acute discontinuation of total parenteral nutrition.Ann Surg.1986;204(5):524–529.
- ,,.Refeeding syndrome: what it is, and how to prevent and treat it.BMJ.2008;336(7659):1495–1498.
- ,,, et al.Enteral nutrition practice recommendations.J Parenter Enteral Nutr.2009;33(2):122–167.
- ,,.Control of diarrhea by fiber‐enriched diet in ICU patients on enteral nutrition: a prospective randomized controlled trial.Clin Nutr.2004;23(6):1344–1352.
- ,,,,,.Supine body position as a risk factor for nosocomial pneumonia in mechanically ventilated patients: a randomised trial.Lancet.1999;354(9193):1851–1858.
- .Parenteral nutrition in the critically ill patient.N Engl J Med.2009;361(11):1088–1097.
- ,,,.Refeeding syndrome: treatment considerations based on collective analysis of literature case reports.Nutrition.2010;26(2):156–167.
- ,,.Re‐feeding syndrome in head and neck cancer‐prevention and management.Oral Oncol.2011;47(9):792–796.
- Nutrition Support in Adults. NICE Clinical Guideline No. 32. 2006. Available at: http://guidance.nice.org.uk/CG32/NICEGuidance. Accessed November 29,2011.
- ,,.The importance of the refeeding syndrome.Nutrition.2001;17(7–8):632–637.