User login
Richard Franki is the associate editor who writes and creates graphs. He started with the company in 1987, when it was known as the International Medical News Group. In his years as a journalist, Richard has worked for Cap Cities/ABC, Disney, Harcourt, Elsevier, Quadrant, Frontline, and Internet Brands. In the 1990s, he was a contributor to the ill-fated Indications column, predecessor of Livin' on the MDedge.
Thanksgiving took a bite out of HealthCare.gov
Health care insurance may have taken a bit of a back seat to turkey and shopping last week as according to the Centers for Medicare & Medicaid Services.
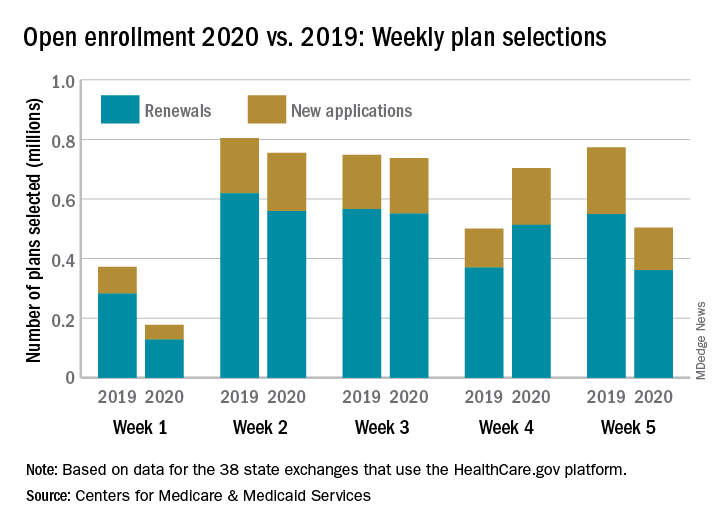
Consumers selected 28% fewer plans during week 5 (Nov. 24-30) of Open Enrollment 2020 than in week 4. A similar drop of 33% occurred last year between week 3 of open enrollment and week 4, which included Thanksgiving and Black Friday, CMS data show.
Through week 5, total plans selections for 2020 health insurance coverage came in at almost 2.9 million, which is down about 10% from last year’s 5-week total of 3.2 million for 2019 coverage.
The HealthCare.gov platform is being used by 38 states for the 2020 benefit year, and so far Florida residents have selected the most plans, almost 797,000. Texas is next with just over 400,000 selections, followed by Georgia with 173,000 and North Carolina with 162,000, CMS reported Dec. 4.
Health care insurance may have taken a bit of a back seat to turkey and shopping last week as according to the Centers for Medicare & Medicaid Services.
Consumers selected 28% fewer plans during week 5 (Nov. 24-30) of Open Enrollment 2020 than in week 4. A similar drop of 33% occurred last year between week 3 of open enrollment and week 4, which included Thanksgiving and Black Friday, CMS data show.
Through week 5, total plans selections for 2020 health insurance coverage came in at almost 2.9 million, which is down about 10% from last year’s 5-week total of 3.2 million for 2019 coverage.
The HealthCare.gov platform is being used by 38 states for the 2020 benefit year, and so far Florida residents have selected the most plans, almost 797,000. Texas is next with just over 400,000 selections, followed by Georgia with 173,000 and North Carolina with 162,000, CMS reported Dec. 4.
Childproofing your protocols, and what’s the deal with airline water?
Childproof your study protocols
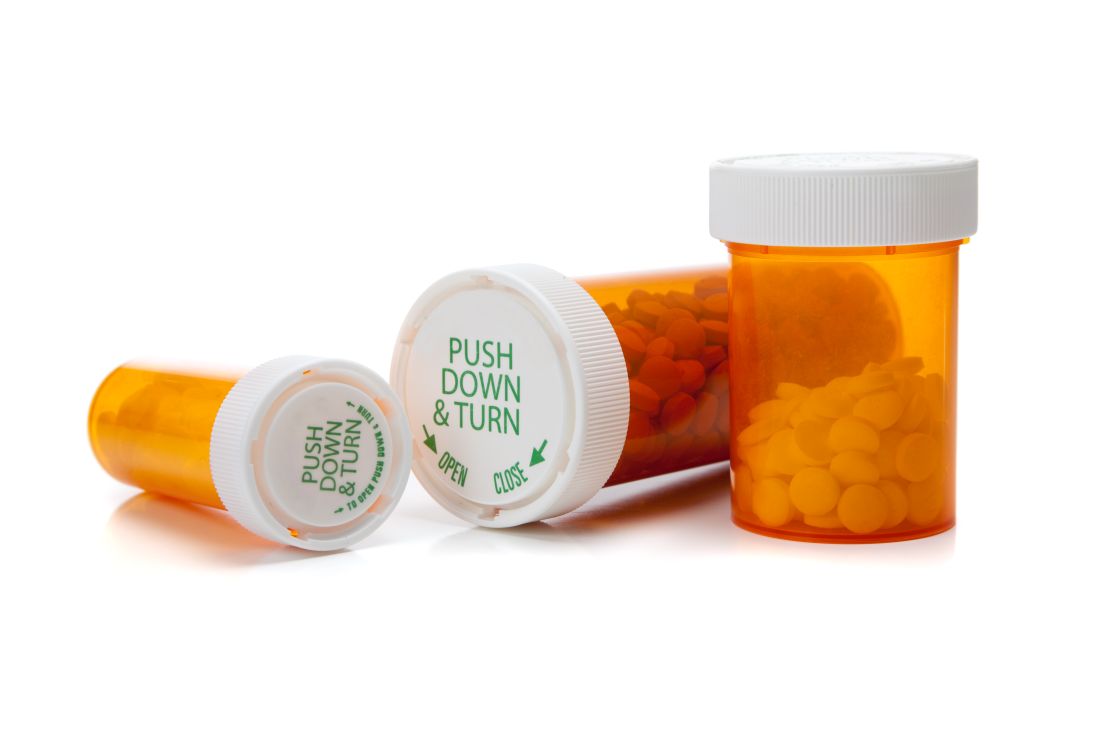
Childproof caps on medicine bottles. Like a bank vault lock to third-rate thieves, they’re an impregnable line of defense between inquisitive little hands and heavy-duty pharmaceuticals.
So, you can imagine the delight with which parents learned that their children’s education at an Illinois elementary school included a test of their ability to spring drugs from their fortress-like bottling.
In a quest to advance scientific understanding, a junior high student recruited some of the school’s kindergartners and first graders as participants in a science fair experiment. The hypothesis: “Childproof” medicine bottles were anything but.
The junior high scientist collected data on how quickly the study subjects could defeat assorted bottles. And, being a kindly soul, the adolescent researcher demonstrated techniques for achieving a state of, ahem, pharmaceutical openness.
While teachers were present during the experiment, parental permission slips were not. As any principal or institutional review board knows, informed consent is kind of a big deal.
Surprised parents learned of the experiment only when their kids deftly demonstrated their newfound pill skills. One shocked parent even shared a video of his daughter defeating a childproof lid.
Pharmacies, of course, would remind us all that their bottles are at best “child resistant,” not childproof. It’s a distinction lost on us here at the Bureau of LOTME, however. We’re desperately viewing that how-to video for tips on liberating our statins from the “child resistant” bottle our millennial pharmacist clearly superglued the cap onto.
What’s the deal with airline food?
You probably thought Jerry Seinfeld’s immortal query was rhetorical. No one actually knows what the deal is with airline food, right?

Enter Charles Platkin, PhD, JD, MPH, executive director of the Hunter College NYC Food Policy Center, and editor of DietDetective.com. Not only does he know the deal, he publishes a study detailing the healthiness of the food offered by 11 airlines every year, based on criteria such as healthy nutrients and calorie levels of meals, level of transparency, improvement and maintenance of healthy offerings, and water health.
For the 2018-2019 edition, there’s a tie at the top between Alaska Airlines and Air Canada, both scoring 4 out of 5 on Dr. Platkin’s “Health Score,” both well ahead of Delta and JetBlue in second place with a score of 2.9.
At the bottom? Southwest Airlines, with a paltry 1.7, edging out Spirit and Hawaiian Airlines.
Our personal favorite tidbit from the study has to be the poor scores in water health. Spirit managed to score a measly 1 out of 5 in the water health subscore, and several airlines were below 2. An actual quote from the study: “The quality of drinking water varies by airline, and many have provided passengers with unhealthy water. In general, it’s probably best to avoid drinking coffee and tea on board since they are made with galley water.”
While Hawaiian can take some comfort because they didn’t finish dead last, Dr. Platkin did award them his special “Shame on You” award for not providing all their nutritional information. You can try to hide, Hawaiian Airlines, but Dr. Platkin will find you.
Use the Force, Jack Nicklaus
We here at LOTME usually strive to provide an insightful and up-to-date wrap-up of the latest news on cutting-edge research, clinical breakthroughs, and impolite bodily functions. But right now, we want to talk about something really important: your golf game.

There’s an old saying in golf: Drive for show, putt for dough. That cliché may need a bit of updating, though, now that investigators in Ireland (where they are pretty serious about their golf) have brought science to the party.
Their research indicates that it may be possible for golfers to improve their putting without practicing. Without physically practicing, that is. Without going to the golf course. Just think about it: Golfers can putt better by, you know … just thinking about it.
Imagining the feel of an action without actually performing it is known as kinesthetic imagery ability, and it just might have an effect on putting, researchers from the physical education and sports sciences department at the University of Limerick and Lero, the Science Foundation Ireland Research Centre for Software, reported in Psychology of Sport and Exercise.
In a group of 44 skilled golfers, half watched video of an expert golfer putting in a lab environment “while listening to a motor imagery script consisting of short sentences describing key visual and kinesthetic feelings associated with performing the putting.” Then all the golfers took 40 putts from 15 feet in the lab.
The good kinesthetic imagers in the bunch improved their putting consistency more than subjects with poorer kinesthetic imagery ability and subjects from the nonintervention group.
So, here’s the new and improved old saying for golfers: Drive for show, use your kinesthetic imagery ability for dough. Yup, that’ll definitely catch on.
Childproof your study protocols
Childproof caps on medicine bottles. Like a bank vault lock to third-rate thieves, they’re an impregnable line of defense between inquisitive little hands and heavy-duty pharmaceuticals.
So, you can imagine the delight with which parents learned that their children’s education at an Illinois elementary school included a test of their ability to spring drugs from their fortress-like bottling.
In a quest to advance scientific understanding, a junior high student recruited some of the school’s kindergartners and first graders as participants in a science fair experiment. The hypothesis: “Childproof” medicine bottles were anything but.
The junior high scientist collected data on how quickly the study subjects could defeat assorted bottles. And, being a kindly soul, the adolescent researcher demonstrated techniques for achieving a state of, ahem, pharmaceutical openness.
While teachers were present during the experiment, parental permission slips were not. As any principal or institutional review board knows, informed consent is kind of a big deal.
Surprised parents learned of the experiment only when their kids deftly demonstrated their newfound pill skills. One shocked parent even shared a video of his daughter defeating a childproof lid.
Pharmacies, of course, would remind us all that their bottles are at best “child resistant,” not childproof. It’s a distinction lost on us here at the Bureau of LOTME, however. We’re desperately viewing that how-to video for tips on liberating our statins from the “child resistant” bottle our millennial pharmacist clearly superglued the cap onto.
What’s the deal with airline food?
You probably thought Jerry Seinfeld’s immortal query was rhetorical. No one actually knows what the deal is with airline food, right?
Enter Charles Platkin, PhD, JD, MPH, executive director of the Hunter College NYC Food Policy Center, and editor of DietDetective.com. Not only does he know the deal, he publishes a study detailing the healthiness of the food offered by 11 airlines every year, based on criteria such as healthy nutrients and calorie levels of meals, level of transparency, improvement and maintenance of healthy offerings, and water health.
For the 2018-2019 edition, there’s a tie at the top between Alaska Airlines and Air Canada, both scoring 4 out of 5 on Dr. Platkin’s “Health Score,” both well ahead of Delta and JetBlue in second place with a score of 2.9.
At the bottom? Southwest Airlines, with a paltry 1.7, edging out Spirit and Hawaiian Airlines.
Our personal favorite tidbit from the study has to be the poor scores in water health. Spirit managed to score a measly 1 out of 5 in the water health subscore, and several airlines were below 2. An actual quote from the study: “The quality of drinking water varies by airline, and many have provided passengers with unhealthy water. In general, it’s probably best to avoid drinking coffee and tea on board since they are made with galley water.”
While Hawaiian can take some comfort because they didn’t finish dead last, Dr. Platkin did award them his special “Shame on You” award for not providing all their nutritional information. You can try to hide, Hawaiian Airlines, but Dr. Platkin will find you.
Use the Force, Jack Nicklaus
We here at LOTME usually strive to provide an insightful and up-to-date wrap-up of the latest news on cutting-edge research, clinical breakthroughs, and impolite bodily functions. But right now, we want to talk about something really important: your golf game.
There’s an old saying in golf: Drive for show, putt for dough. That cliché may need a bit of updating, though, now that investigators in Ireland (where they are pretty serious about their golf) have brought science to the party.
Their research indicates that it may be possible for golfers to improve their putting without practicing. Without physically practicing, that is. Without going to the golf course. Just think about it: Golfers can putt better by, you know … just thinking about it.
Imagining the feel of an action without actually performing it is known as kinesthetic imagery ability, and it just might have an effect on putting, researchers from the physical education and sports sciences department at the University of Limerick and Lero, the Science Foundation Ireland Research Centre for Software, reported in Psychology of Sport and Exercise.
In a group of 44 skilled golfers, half watched video of an expert golfer putting in a lab environment “while listening to a motor imagery script consisting of short sentences describing key visual and kinesthetic feelings associated with performing the putting.” Then all the golfers took 40 putts from 15 feet in the lab.
The good kinesthetic imagers in the bunch improved their putting consistency more than subjects with poorer kinesthetic imagery ability and subjects from the nonintervention group.
So, here’s the new and improved old saying for golfers: Drive for show, use your kinesthetic imagery ability for dough. Yup, that’ll definitely catch on.
2019-2020 flu season starts off full throttle
For the week ending Nov. 23, there were five states, along with Puerto Rico, at the highest level of the Centers for Disease Control and Prevention’s 1-10 scale of flu activity. That’s more than any year since 2012, including the pandemic season of 2017-2018, according to CDC data, and may suggest either an early peak or the beginning of a particularly bad winter.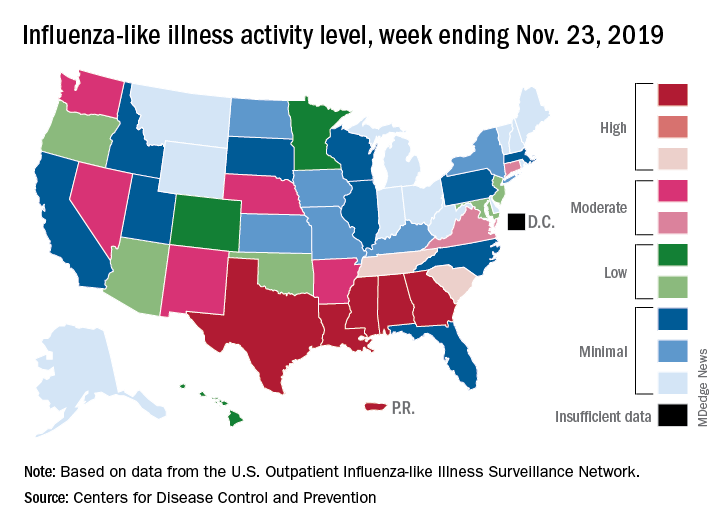
“Nationally, ILI [influenza-like illness] activity has been at or above baseline for 3 weeks; however, the amount of influenza activity across the country varies with the south and parts of the west seeing elevated activity while other parts of the country are still seeing low activity,” the CDC’s influenza division said in its weekly FluView report.
The five highest-activity states – Alabama, Georgia, Louisiana, Mississippi, and Texas – are all at level 10, and they join two others – South Carolina and Tennessee, which are at level 8 – in the “high” range from 8-10 on the ILI activity scale; Puerto Rico also is at level 10. ILI is defined as “fever (temperature of 100° F [37.8° C] or greater) and a cough and/or a sore throat without a known cause other than influenza,” the CDC said.
The activity scale is based on the percentage of outpatient visits for ILI in each state, which is reported to the CDC’s Outpatient Influenza-like Illness Surveillance Network (ILINet) each week. The national rate for the week ending Nov. 23 was 2.9%, which is above the new-for-this-season baseline rate of 2.4%. For the three previous flu seasons, the national baseline was 2.2%, having been raised from its previous level of 2.1% in 2015-2016, CDC data show.
The peak month of flu activity occurs most often in February – 15 times from 1982-1983 to 2017-2018 – but there were seven peaks in December and six each in January and March over that time period, along with one peak each in October and November, the CDC said. The October peak occurred during the H1N1 pandemic year of 2009, when the national outpatient ILI rate climbed to just over 7.7%.
Large state disparities seen for lung cancer screening
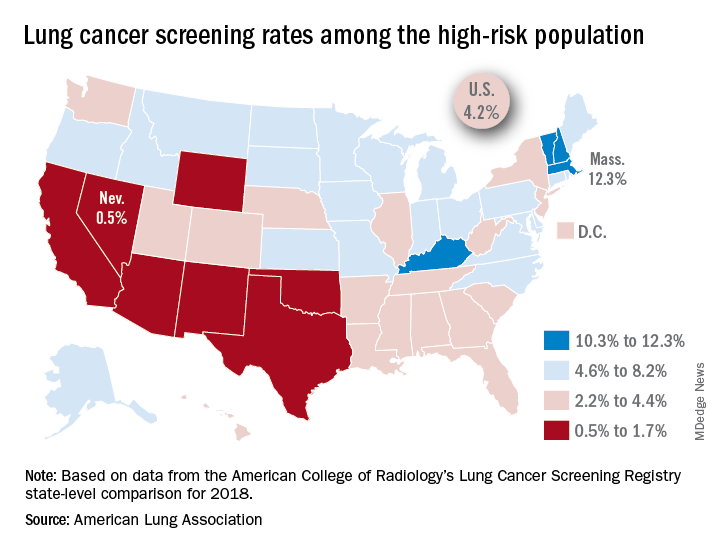
That disparity might suggest that Massachusetts has an exceptionally high rate, but it’s only 12.3%. And that means Nevada’s rate is very low, which it is: Only 0.5% of those at high risk are getting screened with annual low-dose CT scans, the ALA said in its 2019 State of Lung Cancer report.
“[The low rate of screening] may be because of a lack of access or low awareness and knowledge among patients and providers. As rates vary tremendously between states, it is clear that more can be done to increase screening rates,” the ALA stated.
Nationally, the screening rate is 4.2% among those at high risk for lung cancer, but “if everyone currently eligible were screened, close to 48,000 lives could be saved,” the ALA noted in its report.
Six states other than Nevada are below the 2% mark: Arizona, California, New Mexico, Oklahoma, Texas, and Wyoming. Besides Massachusetts, the three other states above 10% are Kentucky, New Hampshire, and Vermont, according to data from the American College of Radiology’s Lung Cancer Screening Registry state-level comparison for 2018.
For individuals at high risk for lung cancer – those aged 55-80 years who have at least a 30 pack-year history and either still smoke or have quit within 15 years – “screening with annual low-dose CT scans can reduce the lung cancer death rate by up to 20% by detecting tumors at early stages when the cancer is more likely to be curable,” the ALA wrote.
Survey: Cancer-related pain, opioid use up since 2018
Cancer-related pain was more common among patients in 2019 than in 2018, as was the use of prescription opioids, according to the American Society of Clinical Oncology.
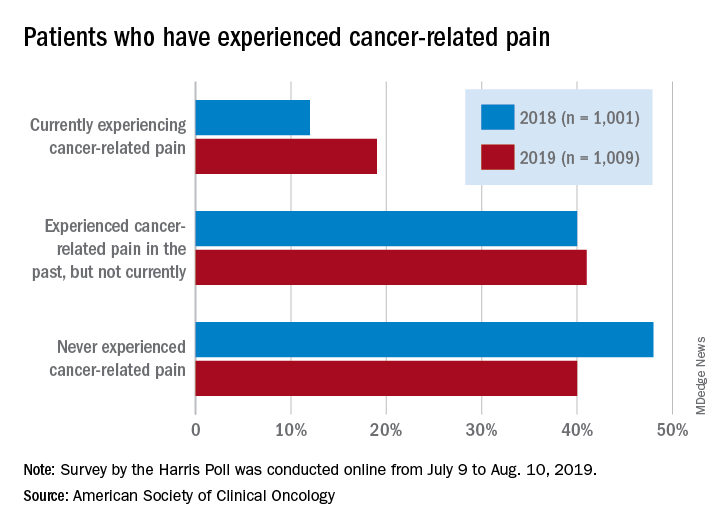
Patients who have/had cancer were significantly more likely to report that they were currently experiencing cancer-related pain in 2019 (19%) than in 2018 (12%), but there was only a slight increase in patients who said that they had experienced cancer-related pain in the past, the society reported in its National Cancer Opinion Survey.
When asked about methods used to manage pain, nausea, and other symptoms, patients diagnosed with cancer most often said that they had not used anything in the last 12 months, although this response was significantly less common in 2019 (48%) than in 2018 (55%). Over-the-counter pain relievers were the most common method used (24% in 2019 and 22% in 2018), followed by vitamins/minerals/herbs (18% in 2019 and 17% in 2018), ASCO said.
Prescription opioids were the third most popular choice for symptom management both years, but use was significantly higher in 2019 (17%) than in 2018 (12%). Also showing a significant increase from 2018 to 2019 was use of medical marijuana, which went from 5% to 10%, ASCO said.
The survey was conducted online for ASCO by the Harris Poll from July 9 to Aug. 10, 2019. The total sample consisted of 4,815 U.S. adults, of whom 1,009 had been diagnosed with cancer.
Cancer-related pain was more common among patients in 2019 than in 2018, as was the use of prescription opioids, according to the American Society of Clinical Oncology.
Patients who have/had cancer were significantly more likely to report that they were currently experiencing cancer-related pain in 2019 (19%) than in 2018 (12%), but there was only a slight increase in patients who said that they had experienced cancer-related pain in the past, the society reported in its National Cancer Opinion Survey.
When asked about methods used to manage pain, nausea, and other symptoms, patients diagnosed with cancer most often said that they had not used anything in the last 12 months, although this response was significantly less common in 2019 (48%) than in 2018 (55%). Over-the-counter pain relievers were the most common method used (24% in 2019 and 22% in 2018), followed by vitamins/minerals/herbs (18% in 2019 and 17% in 2018), ASCO said.
Prescription opioids were the third most popular choice for symptom management both years, but use was significantly higher in 2019 (17%) than in 2018 (12%). Also showing a significant increase from 2018 to 2019 was use of medical marijuana, which went from 5% to 10%, ASCO said.
The survey was conducted online for ASCO by the Harris Poll from July 9 to Aug. 10, 2019. The total sample consisted of 4,815 U.S. adults, of whom 1,009 had been diagnosed with cancer.
Open enrollment 2020: Activity down on Healthcare.gov
The number of health insurance plans selected on Healthcare.gov during week 3 of the 2020 open enrollment was down slightly, compared with week 2 of this year and week 3 of last year, according to the Centers for Medicare & Medicaid Services.
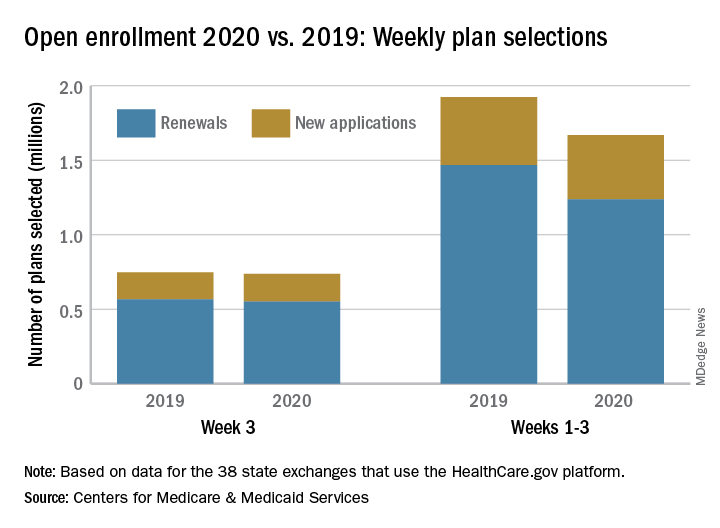
CMS said Nov. 20, 2019, in its weekly enrollment snapshot. This number represents a slight dip in the number of plans selected during week 2, which was 754,967, according to a statement from the CMS.
The breakdown for week 3 looks like this: 550,706 consumers renewed existing coverage and 186,646 people who were not covered in 2019 selected new plans for 2020. For week 2, the first full week of this year’s open enrollment, the corresponding numbers were 558,962 and 196,005. Adding in the 2 days of week 1 brings the cumulative count to 1,669,401 plans selected for the year, the CMS reported. Last year, the total after week 3 was 1,924,476.
There are 38 states using the Healthcare.gov platform this year, and CMS reported their plan selection totals for the first time. Florida had the most plans selected with 463,066 this season, followed by Texas with 229,167 and Georgia with 105,653. California and New York do not use the federal market exchange.
The weekly reports “provide point-in-time estimates of weekly plan selections, call center activity, and visits to HealthCare.gov or CuidadoDeSalud.gov,” the CMS noted, so “the final number of plan selections associated with enrollment activity during a reporting period may change due to plan modifications or cancellations.”
The number of health insurance plans selected on Healthcare.gov during week 3 of the 2020 open enrollment was down slightly, compared with week 2 of this year and week 3 of last year, according to the Centers for Medicare & Medicaid Services.
CMS said Nov. 20, 2019, in its weekly enrollment snapshot. This number represents a slight dip in the number of plans selected during week 2, which was 754,967, according to a statement from the CMS.
The breakdown for week 3 looks like this: 550,706 consumers renewed existing coverage and 186,646 people who were not covered in 2019 selected new plans for 2020. For week 2, the first full week of this year’s open enrollment, the corresponding numbers were 558,962 and 196,005. Adding in the 2 days of week 1 brings the cumulative count to 1,669,401 plans selected for the year, the CMS reported. Last year, the total after week 3 was 1,924,476.
There are 38 states using the Healthcare.gov platform this year, and CMS reported their plan selection totals for the first time. Florida had the most plans selected with 463,066 this season, followed by Texas with 229,167 and Georgia with 105,653. California and New York do not use the federal market exchange.
The weekly reports “provide point-in-time estimates of weekly plan selections, call center activity, and visits to HealthCare.gov or CuidadoDeSalud.gov,” the CMS noted, so “the final number of plan selections associated with enrollment activity during a reporting period may change due to plan modifications or cancellations.”
Grading Dr. Google and treating malaria by the bowlful
Google: A hypochondriac’s dream
Thanks to Google, we have basically free and unlimited access to a huge amount of information right at our fingertips. So when you’re laid up at home with a cold that seems to be taking a turn for the worse, it’s only natural to pull out your phone and ask Google all about your strange new symptoms. After all, the doctor’s office is so far away, and it costs money and time, and who even wants to deal with doctors anyway?

According to a survey commissioned by LetsGetChecked, you’d hardly be alone in turning to Dr. Google. Although 51% of the 2,000 survey respondents consulted a doctor as their first choice for medical help, 65% admitted that they use Google to self-diagnose, 26% have no primary care physician, and about 60% actively avoid doctor’s offices.
So, for the two-thirds of Americans who made an appointment with the good internet doctor, how did things turn out? Not well. About three-quarters reported worrying more afterward, and 43% of all survey respondents managed to convince themselves that they had contracted a serious illness. And the information they looked up? It was wrong more than 60% of the time.
As it turns out, a trained medical professional is actually better than a search engine. Now all we need to do is make accessing health care cheaper, more convenient, and easier to understand. No problem, right?
Better the second time around?
“What’s this stuff?”
“Recycled water. Supposed to taste just like regular water.”
“Did you drink it?”
“I’m not gonna drink it. You drink it.”
“I’m not gonna drink it.”
“Let’s get Mikey!”
“He won’t drink it. He hates everything.”
This time, the kids were right. Mikey did hate the recycled wastewater, or to be more accurate, he was disgusted by it. Like most people, he supports the idea of water conservation but is too disgusted by the source of recycled water to drink it, according to investigators at the University of California, Riverside.
In three separate experiments, volunteers were shown videos about water. One was about water conservation, another was about the urban myth that crocodiles live in New York City sewers, and the third was an educational video demonstrating that recycled wastewater is contaminant free.
In the first experiment, half of the subjects watched the conservation video and half watched the NYC sewer video. Afterward, nearly all participants in each group said no thanks to recycling. In the second experiment, subjects from the two video-watching groups were all shown the third video on recycled water’s purity. That led to a small but insubstantial increase in willingness to use recycled water.
In the third experiment, each of three groups watched one of the videos. Afterward, all subjects were asked to sign a petition supporting conservation and were offered a bottle of water labeled “SMARTdrop – Pure Recycled Water.” About two-thirds of each group signed the petition and took the bottle despite the investigators’ expectation that the group watching the water purity video would have greater acceptance.
Messaging involving water scarcity and conservation alone may not be enough in this case. Instead, the researchers urged “a focus on the more visceral roadblock of disgust.”
Maybe, or maybe not. For now, let’s get back to Mikey and company.
“Don’t tell the kids it’s the recycled wastewater you’ve been trying to get them to drink. You’re the only one who has to know.”
Chicken soup for the malarial soul
A nice hot cup of soup: The refuge of concerned parents who managed to resist looking at Google and decided that their child’s cold wasn’t actually stage IV lung cancer. It’s good, and it’s good for you. But just how good for you? Could the healing powers of soup be harnessed to treat something like, say, malaria?

The research, published in Archives of Disease in Childhood, has perhaps the most adorable setup of any study our cold, stony hearts at LOTME world headquarters have ever seen. The researchers went to a London primary school and asked a group of students to bring in homemade soup for testing and analysis. The students obliged, bringing in dozens of unique soups, of which 56 were tested for 72 hours against the deadliest malaria species, Plasmodium falciparum.
Not every soup was effective, but extracts from five broths were able to halt growth of sexually immature parasites by more than 50%, two of which were about as effective as dihydroartemisinin, a leading antimalarial drug. In addition, four other broths were more than 50% effective at blocking sexual maturation.
The researchers noted that they haven’t analyzed the ingredients of the soups yet and that the utility of soup in combating malaria will depend on a number of factors; regardless, we hope those kids got some serious extra credit. Curing malaria is way more impressive than knowing that mitochondria are the powerhouse of the cell.

Google: A hypochondriac’s dream
Thanks to Google, we have basically free and unlimited access to a huge amount of information right at our fingertips. So when you’re laid up at home with a cold that seems to be taking a turn for the worse, it’s only natural to pull out your phone and ask Google all about your strange new symptoms. After all, the doctor’s office is so far away, and it costs money and time, and who even wants to deal with doctors anyway?
According to a survey commissioned by LetsGetChecked, you’d hardly be alone in turning to Dr. Google. Although 51% of the 2,000 survey respondents consulted a doctor as their first choice for medical help, 65% admitted that they use Google to self-diagnose, 26% have no primary care physician, and about 60% actively avoid doctor’s offices.
So, for the two-thirds of Americans who made an appointment with the good internet doctor, how did things turn out? Not well. About three-quarters reported worrying more afterward, and 43% of all survey respondents managed to convince themselves that they had contracted a serious illness. And the information they looked up? It was wrong more than 60% of the time.
As it turns out, a trained medical professional is actually better than a search engine. Now all we need to do is make accessing health care cheaper, more convenient, and easier to understand. No problem, right?
Better the second time around?
“What’s this stuff?”
“Recycled water. Supposed to taste just like regular water.”
“Did you drink it?”
“I’m not gonna drink it. You drink it.”
“I’m not gonna drink it.”
“Let’s get Mikey!”
“He won’t drink it. He hates everything.”
This time, the kids were right. Mikey did hate the recycled wastewater, or to be more accurate, he was disgusted by it. Like most people, he supports the idea of water conservation but is too disgusted by the source of recycled water to drink it, according to investigators at the University of California, Riverside.
In three separate experiments, volunteers were shown videos about water. One was about water conservation, another was about the urban myth that crocodiles live in New York City sewers, and the third was an educational video demonstrating that recycled wastewater is contaminant free.
In the first experiment, half of the subjects watched the conservation video and half watched the NYC sewer video. Afterward, nearly all participants in each group said no thanks to recycling. In the second experiment, subjects from the two video-watching groups were all shown the third video on recycled water’s purity. That led to a small but insubstantial increase in willingness to use recycled water.
In the third experiment, each of three groups watched one of the videos. Afterward, all subjects were asked to sign a petition supporting conservation and were offered a bottle of water labeled “SMARTdrop – Pure Recycled Water.” About two-thirds of each group signed the petition and took the bottle despite the investigators’ expectation that the group watching the water purity video would have greater acceptance.
Messaging involving water scarcity and conservation alone may not be enough in this case. Instead, the researchers urged “a focus on the more visceral roadblock of disgust.”
Maybe, or maybe not. For now, let’s get back to Mikey and company.
“Don’t tell the kids it’s the recycled wastewater you’ve been trying to get them to drink. You’re the only one who has to know.”
Chicken soup for the malarial soul
A nice hot cup of soup: The refuge of concerned parents who managed to resist looking at Google and decided that their child’s cold wasn’t actually stage IV lung cancer. It’s good, and it’s good for you. But just how good for you? Could the healing powers of soup be harnessed to treat something like, say, malaria?
The research, published in Archives of Disease in Childhood, has perhaps the most adorable setup of any study our cold, stony hearts at LOTME world headquarters have ever seen. The researchers went to a London primary school and asked a group of students to bring in homemade soup for testing and analysis. The students obliged, bringing in dozens of unique soups, of which 56 were tested for 72 hours against the deadliest malaria species, Plasmodium falciparum.
Not every soup was effective, but extracts from five broths were able to halt growth of sexually immature parasites by more than 50%, two of which were about as effective as dihydroartemisinin, a leading antimalarial drug. In addition, four other broths were more than 50% effective at blocking sexual maturation.
The researchers noted that they haven’t analyzed the ingredients of the soups yet and that the utility of soup in combating malaria will depend on a number of factors; regardless, we hope those kids got some serious extra credit. Curing malaria is way more impressive than knowing that mitochondria are the powerhouse of the cell.
Not all lung cancer patients receive treatment
In the United States, just over 15% of patients with lung cancer receive no treatment, according to the American Lung Association.
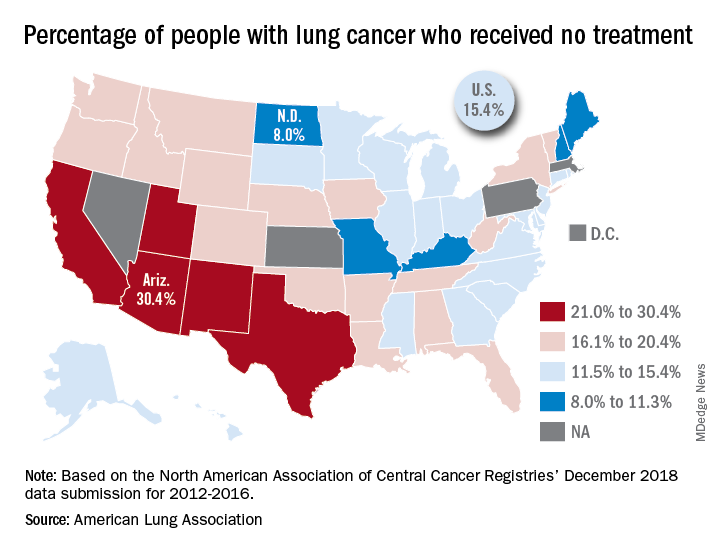
“This can happen for multiple reasons, such as the tumor having spread too far, poor health, or refusal of treatment,” the ALA said in its 2019 State of Lung Cancer report.
On the state level, the disparities were considerable. Arizona had the highest rate of nontreatment at 30.4%, followed by the neighboring states of New Mexico (24.2%) and California (24.0%). The lowest rate in the country, 8.0%, came from North Dakota, with Missouri next at 9.4% and Maine third at 9.6%, based on data from the North American Association of Central Cancer Registries’ December 2018 data submission, which covered the years from 2012 to 2016.
Although some cases of lung cancer may be unavoidable, “no one should go untreated because of lack of provider or patient knowledge, stigma associated with lung cancer, fatalism after diagnosis, or cost of treatment. Dismantling these and other barriers is important to reducing the percent of untreated patients,” the ALA said.
In the United States, just over 15% of patients with lung cancer receive no treatment, according to the American Lung Association.
“This can happen for multiple reasons, such as the tumor having spread too far, poor health, or refusal of treatment,” the ALA said in its 2019 State of Lung Cancer report.
On the state level, the disparities were considerable. Arizona had the highest rate of nontreatment at 30.4%, followed by the neighboring states of New Mexico (24.2%) and California (24.0%). The lowest rate in the country, 8.0%, came from North Dakota, with Missouri next at 9.4% and Maine third at 9.6%, based on data from the North American Association of Central Cancer Registries’ December 2018 data submission, which covered the years from 2012 to 2016.
Although some cases of lung cancer may be unavoidable, “no one should go untreated because of lack of provider or patient knowledge, stigma associated with lung cancer, fatalism after diagnosis, or cost of treatment. Dismantling these and other barriers is important to reducing the percent of untreated patients,” the ALA said.
Inpatient care declining among family physicians
and by 2017, only one of four FPs was practicing hospital medicine, according to the American Academy of Family Physicians.
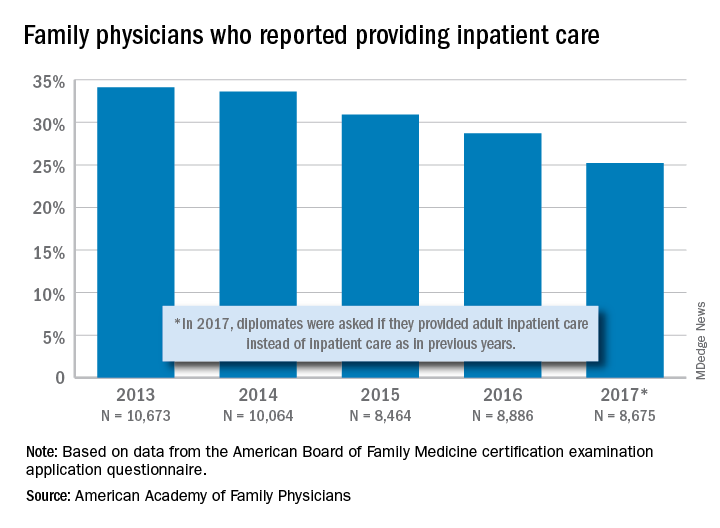
The share of family physicians who provided hospital care went from 34.1% in 2013 to 25.2% in 2017, for a relative decrease of 26% that left only a quarter of FPs seeing inpatients, based on data from the annual American Board of Family Medicine certification exam application questionnaire. For the 5-year period, 46,762 individuals were included in the study sample of FPs in direct patient care.
“As observed in other domains (prenatal care, home visits, nursing home care, and obstetric care), this study adds to the evidence demonstrating contracting scope of practice among FPs,” Anuradha Jetty, MPH, of the AAFP’s Robert Graham Center in Washington, D.C., and associates said in a recent Policy Brief published in the Journal of the American Board of Family Medicine.
Much of that contraction is occurring among new family physicians who can’t “find positions that allow them to use all their expertise,” the investigators said in a separate statement. The AAFP had previously reported that about 40% of family physicians had full hospital privileges in 2018, compared with 56% in 2012.
Many new FPs now work in large multispecialty practices or hospital systems, and “[some] of these employers dictate scope of practice, limiting family physicians to coordinating outpatient care and relying on subspecialists or hospitalists to provide inpatient care,” they noted.
and by 2017, only one of four FPs was practicing hospital medicine, according to the American Academy of Family Physicians.
The share of family physicians who provided hospital care went from 34.1% in 2013 to 25.2% in 2017, for a relative decrease of 26% that left only a quarter of FPs seeing inpatients, based on data from the annual American Board of Family Medicine certification exam application questionnaire. For the 5-year period, 46,762 individuals were included in the study sample of FPs in direct patient care.
“As observed in other domains (prenatal care, home visits, nursing home care, and obstetric care), this study adds to the evidence demonstrating contracting scope of practice among FPs,” Anuradha Jetty, MPH, of the AAFP’s Robert Graham Center in Washington, D.C., and associates said in a recent Policy Brief published in the Journal of the American Board of Family Medicine.
Much of that contraction is occurring among new family physicians who can’t “find positions that allow them to use all their expertise,” the investigators said in a separate statement. The AAFP had previously reported that about 40% of family physicians had full hospital privileges in 2018, compared with 56% in 2012.
Many new FPs now work in large multispecialty practices or hospital systems, and “[some] of these employers dictate scope of practice, limiting family physicians to coordinating outpatient care and relying on subspecialists or hospitalists to provide inpatient care,” they noted.
Support for medical marijuana transcends political affiliation
There is not much common ground between Republicans and Democrats these days, but both sides strongly supported the use of medical marijuana in a recent survey by the American Society of Clinical Oncology.
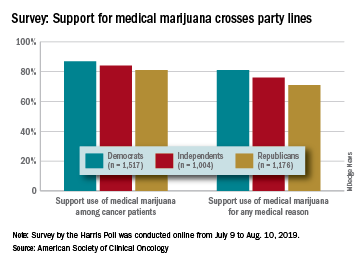
Overall support of medical marijuana among all 4,001 respondents was higher (84%) for use among cancer patients, but 76% also supported its use for any medical reason, according to data from the survey conducted for ASCO by the Harris Poll.
The differences in support between Republicans and Democrats were significant, but both parties were over 80% for marijuana use by cancer patients and over 70% for use for any medical reason. In both cases, the independents in between mirrored the overall population, with support at 84% and 76%, respectively, ASCO said.
Support for medical marijuana also was consistent based on the respondents’ cancer experience. For use by cancer patients, those who were current or previous patients were at 84%, caregivers (those providing unpaid care to an immediate family member or loved one with cancer) and other family members/loved ones were both at 87%, and those with no cancer experiences were at 82%, the survey results showed.
Use of marijuana for any medical reason was supported by 72% of current/previous patients, 79% of family members and loved ones, 80% of caregivers, and 74% of those with no cancer experience, ASCO reported.
In a question asked only of current or previous patients, 62% said that they are/were open to use of marijuana to alleviate cancer-related pain, nausea, or other symptoms, and 60% said that they wished they had more information about the benefits of medical marijuana use, according to the results of the survey, which was conducted online from July 9 to Aug. 10, 2019.
There is not much common ground between Republicans and Democrats these days, but both sides strongly supported the use of medical marijuana in a recent survey by the American Society of Clinical Oncology.
Overall support of medical marijuana among all 4,001 respondents was higher (84%) for use among cancer patients, but 76% also supported its use for any medical reason, according to data from the survey conducted for ASCO by the Harris Poll.
The differences in support between Republicans and Democrats were significant, but both parties were over 80% for marijuana use by cancer patients and over 70% for use for any medical reason. In both cases, the independents in between mirrored the overall population, with support at 84% and 76%, respectively, ASCO said.
Support for medical marijuana also was consistent based on the respondents’ cancer experience. For use by cancer patients, those who were current or previous patients were at 84%, caregivers (those providing unpaid care to an immediate family member or loved one with cancer) and other family members/loved ones were both at 87%, and those with no cancer experiences were at 82%, the survey results showed.
Use of marijuana for any medical reason was supported by 72% of current/previous patients, 79% of family members and loved ones, 80% of caregivers, and 74% of those with no cancer experience, ASCO reported.
In a question asked only of current or previous patients, 62% said that they are/were open to use of marijuana to alleviate cancer-related pain, nausea, or other symptoms, and 60% said that they wished they had more information about the benefits of medical marijuana use, according to the results of the survey, which was conducted online from July 9 to Aug. 10, 2019.