User login
Richard Franki is the associate editor who writes and creates graphs. He started with the company in 1987, when it was known as the International Medical News Group. In his years as a journalist, Richard has worked for Cap Cities/ABC, Disney, Harcourt, Elsevier, Quadrant, Frontline, and Internet Brands. In the 1990s, he was a contributor to the ill-fated Indications column, predecessor of Livin' on the MDedge.
Weekly COVID-19 cases in children dropped 22%
according to new data from the American Academy of Pediatrics and the Children’s Hospital Association.
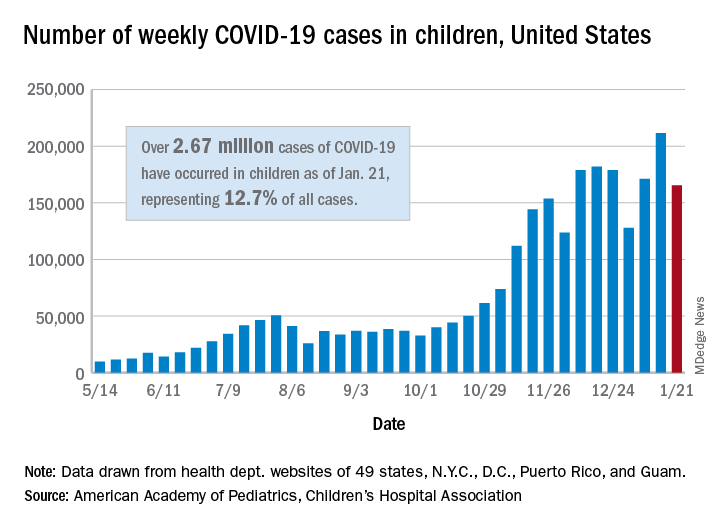
The 165,000 new cases reported during the week of Jan. 15-21 were down by almost 22% from the previous week’s 211,000, when the new-case count reached its highest point in the pandemic, the AAP and CHA said in their weekly COVID-19 report.
Cumulative cases in children now stand at just over 2.67 million, and children represent 12.7% of all COVID-19 cases reported by 49 states (excluding New York), the District of Columbia, New York City, Puerto Rico, and Guam. For the week of Jan. 15-21, children made up 14.8% of all new cases, the highest proportion since late September, the AAP/CHA data show.
The cumulative rate of infection among children is up to 3,556 per 100,000 nationally, with states ranging from 943 per 100,000 in Hawaii to 8,195 in North Dakota. California has the most reported cases at 383,000, while Vermont has the fewest at 1,820, the two organizations reported.
There were 14 more deaths among children in the last week, bringing the total to 205 in the 43 states (plus New York City and Guam) reporting such data. Children represent just 0.06% of all coronavirus-related deaths, and only 0.01% of all cases in children have resulted in death, the AAP and CHA said. There are still 10 states where no children have died from COVID-19.
Although severe illness appears to be rare in children, the AAP and CHA noted, “there is an urgent need to collect more data on longer-term impacts of the pandemic on children, including ways the virus may harm the long-term physical health of infected children, as well as its emotional and mental health effects.”
according to new data from the American Academy of Pediatrics and the Children’s Hospital Association.

The 165,000 new cases reported during the week of Jan. 15-21 were down by almost 22% from the previous week’s 211,000, when the new-case count reached its highest point in the pandemic, the AAP and CHA said in their weekly COVID-19 report.
Cumulative cases in children now stand at just over 2.67 million, and children represent 12.7% of all COVID-19 cases reported by 49 states (excluding New York), the District of Columbia, New York City, Puerto Rico, and Guam. For the week of Jan. 15-21, children made up 14.8% of all new cases, the highest proportion since late September, the AAP/CHA data show.
The cumulative rate of infection among children is up to 3,556 per 100,000 nationally, with states ranging from 943 per 100,000 in Hawaii to 8,195 in North Dakota. California has the most reported cases at 383,000, while Vermont has the fewest at 1,820, the two organizations reported.
There were 14 more deaths among children in the last week, bringing the total to 205 in the 43 states (plus New York City and Guam) reporting such data. Children represent just 0.06% of all coronavirus-related deaths, and only 0.01% of all cases in children have resulted in death, the AAP and CHA said. There are still 10 states where no children have died from COVID-19.
Although severe illness appears to be rare in children, the AAP and CHA noted, “there is an urgent need to collect more data on longer-term impacts of the pandemic on children, including ways the virus may harm the long-term physical health of infected children, as well as its emotional and mental health effects.”
according to new data from the American Academy of Pediatrics and the Children’s Hospital Association.

The 165,000 new cases reported during the week of Jan. 15-21 were down by almost 22% from the previous week’s 211,000, when the new-case count reached its highest point in the pandemic, the AAP and CHA said in their weekly COVID-19 report.
Cumulative cases in children now stand at just over 2.67 million, and children represent 12.7% of all COVID-19 cases reported by 49 states (excluding New York), the District of Columbia, New York City, Puerto Rico, and Guam. For the week of Jan. 15-21, children made up 14.8% of all new cases, the highest proportion since late September, the AAP/CHA data show.
The cumulative rate of infection among children is up to 3,556 per 100,000 nationally, with states ranging from 943 per 100,000 in Hawaii to 8,195 in North Dakota. California has the most reported cases at 383,000, while Vermont has the fewest at 1,820, the two organizations reported.
There were 14 more deaths among children in the last week, bringing the total to 205 in the 43 states (plus New York City and Guam) reporting such data. Children represent just 0.06% of all coronavirus-related deaths, and only 0.01% of all cases in children have resulted in death, the AAP and CHA said. There are still 10 states where no children have died from COVID-19.
Although severe illness appears to be rare in children, the AAP and CHA noted, “there is an urgent need to collect more data on longer-term impacts of the pandemic on children, including ways the virus may harm the long-term physical health of infected children, as well as its emotional and mental health effects.”
COVID-19 in children: Latest weekly increase is largest yet
according to a report from the American Academy of Pediatrics and the Children’s Hospital Association.
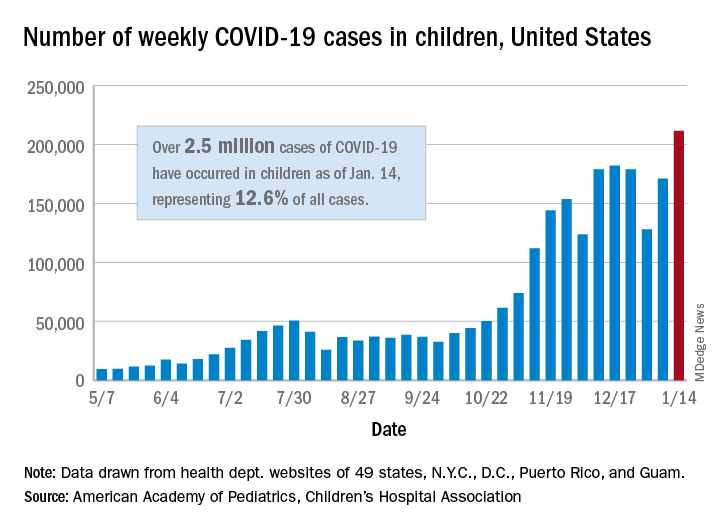
There were 211,466 new cases reported in children during the week of Jan. 8-14, topping the previous high (Dec. 11-17) by almost 30,000. Those new cases bring the total for the pandemic to over 2.5 million children infected with the coronavirus, which represents 12.6% of all reported cases, the AAP and the CHA said Jan. 19 in their weekly COVID-19 report.
The rise in cases also brought an increase in the proportion reported among children. The week before (Jan. 1-7), cases in children were 12.9% of all cases reported, but the most recent week saw that number rise to 14.5% of all cases, the highest it’s been since early October, based on data collected from the health department websites of 49 states (excluding New York), the District of Columbia, New York City, Puerto Rio, and Guam.
The corresponding figures for severe illness continue to be low: Children represent 1.8% of all hospitalizations from COVID-19 in 24 states and New York City and 0.06% of all deaths in 43 states and New York City. Three deaths were reported for the week of Jan. 8-14, making for a total of 191 since the pandemic started, the AAP and CHA said in their report.
Among the states, California has the most overall cases at just over 350,000, Wyoming has the highest proportion of cases in children (20.3%), and North Dakota has the highest rate of infection (over 8,100 per 100,000 children). The infection rate for the nation is now above 3,300 per 100,000 children, and 11 states reported rates over 5,000, according to the AAP and the CHA.
according to a report from the American Academy of Pediatrics and the Children’s Hospital Association.

There were 211,466 new cases reported in children during the week of Jan. 8-14, topping the previous high (Dec. 11-17) by almost 30,000. Those new cases bring the total for the pandemic to over 2.5 million children infected with the coronavirus, which represents 12.6% of all reported cases, the AAP and the CHA said Jan. 19 in their weekly COVID-19 report.
The rise in cases also brought an increase in the proportion reported among children. The week before (Jan. 1-7), cases in children were 12.9% of all cases reported, but the most recent week saw that number rise to 14.5% of all cases, the highest it’s been since early October, based on data collected from the health department websites of 49 states (excluding New York), the District of Columbia, New York City, Puerto Rio, and Guam.
The corresponding figures for severe illness continue to be low: Children represent 1.8% of all hospitalizations from COVID-19 in 24 states and New York City and 0.06% of all deaths in 43 states and New York City. Three deaths were reported for the week of Jan. 8-14, making for a total of 191 since the pandemic started, the AAP and CHA said in their report.
Among the states, California has the most overall cases at just over 350,000, Wyoming has the highest proportion of cases in children (20.3%), and North Dakota has the highest rate of infection (over 8,100 per 100,000 children). The infection rate for the nation is now above 3,300 per 100,000 children, and 11 states reported rates over 5,000, according to the AAP and the CHA.
according to a report from the American Academy of Pediatrics and the Children’s Hospital Association.

There were 211,466 new cases reported in children during the week of Jan. 8-14, topping the previous high (Dec. 11-17) by almost 30,000. Those new cases bring the total for the pandemic to over 2.5 million children infected with the coronavirus, which represents 12.6% of all reported cases, the AAP and the CHA said Jan. 19 in their weekly COVID-19 report.
The rise in cases also brought an increase in the proportion reported among children. The week before (Jan. 1-7), cases in children were 12.9% of all cases reported, but the most recent week saw that number rise to 14.5% of all cases, the highest it’s been since early October, based on data collected from the health department websites of 49 states (excluding New York), the District of Columbia, New York City, Puerto Rio, and Guam.
The corresponding figures for severe illness continue to be low: Children represent 1.8% of all hospitalizations from COVID-19 in 24 states and New York City and 0.06% of all deaths in 43 states and New York City. Three deaths were reported for the week of Jan. 8-14, making for a total of 191 since the pandemic started, the AAP and CHA said in their report.
Among the states, California has the most overall cases at just over 350,000, Wyoming has the highest proportion of cases in children (20.3%), and North Dakota has the highest rate of infection (over 8,100 per 100,000 children). The infection rate for the nation is now above 3,300 per 100,000 children, and 11 states reported rates over 5,000, according to the AAP and the CHA.
COVID-19 symptoms persist months after acute infection
, according to a follow-up study involving 1,733 patients.
“Patients with COVID-19 had symptoms of fatigue or muscle weakness, sleep difficulties, and anxiety or depression,” and those with “more severe illness during their hospital stay had increasingly impaired pulmonary diffusion capacities and abnormal chest imaging manifestations,” Chaolin Huang, MD, of Jin Yin-tan Hospital in Wuhan, China, and associates wrote in the Lancet.
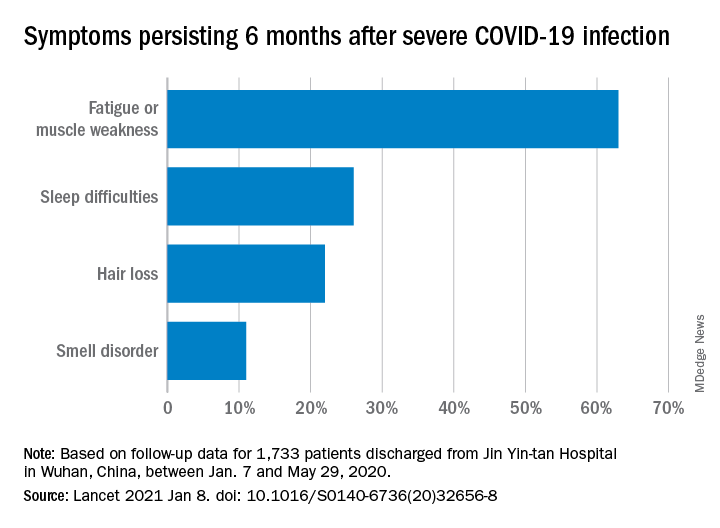
Fatigue or muscle weakness, reported by 63% of patients, was the most common symptom, followed by sleep difficulties, hair loss, and smell disorder. Altogether, 76% of those examined 6 months after discharge from Jin Yin-tan hospital – the first designated for patients with COVID-19 in Wuhan – reported at least one symptom, they said.
Symptoms were more common in women than men: 81% vs. 73% had at least one symptom, and 66% vs. 59% had fatigue or muscle weakness. Women were also more likely than men to report anxiety or depression at follow-up: 28% vs. 18% (23% overall), the investigators said.
Patients with the most severe COVID-19 were 2.4 times as likely to report any symptom later, compared with those who had the least severe levels of infection. Among the 349 participants who completed a lung function test at follow-up, lung diffusion impairment was seen in 56% of those with the most severe illness and 22% of those with the lowest level, Dr. Huang and associates reported.
In a different subset of 94 patients from whom plasma samples were collected, the “seropositivity and median titres of the neutralising antibodies were significantly lower than at the acute phase,” raising concern for reinfection, they said.
The results of the study, the investigators noted, “support that those with severe disease need post-discharge care. Longer follow-up studies in a larger population are necessary to understand the full spectrum of health consequences from COVID-19.”
, according to a follow-up study involving 1,733 patients.

“Patients with COVID-19 had symptoms of fatigue or muscle weakness, sleep difficulties, and anxiety or depression,” and those with “more severe illness during their hospital stay had increasingly impaired pulmonary diffusion capacities and abnormal chest imaging manifestations,” Chaolin Huang, MD, of Jin Yin-tan Hospital in Wuhan, China, and associates wrote in the Lancet.
Fatigue or muscle weakness, reported by 63% of patients, was the most common symptom, followed by sleep difficulties, hair loss, and smell disorder. Altogether, 76% of those examined 6 months after discharge from Jin Yin-tan hospital – the first designated for patients with COVID-19 in Wuhan – reported at least one symptom, they said.
Symptoms were more common in women than men: 81% vs. 73% had at least one symptom, and 66% vs. 59% had fatigue or muscle weakness. Women were also more likely than men to report anxiety or depression at follow-up: 28% vs. 18% (23% overall), the investigators said.
Patients with the most severe COVID-19 were 2.4 times as likely to report any symptom later, compared with those who had the least severe levels of infection. Among the 349 participants who completed a lung function test at follow-up, lung diffusion impairment was seen in 56% of those with the most severe illness and 22% of those with the lowest level, Dr. Huang and associates reported.
In a different subset of 94 patients from whom plasma samples were collected, the “seropositivity and median titres of the neutralising antibodies were significantly lower than at the acute phase,” raising concern for reinfection, they said.
The results of the study, the investigators noted, “support that those with severe disease need post-discharge care. Longer follow-up studies in a larger population are necessary to understand the full spectrum of health consequences from COVID-19.”
, according to a follow-up study involving 1,733 patients.

“Patients with COVID-19 had symptoms of fatigue or muscle weakness, sleep difficulties, and anxiety or depression,” and those with “more severe illness during their hospital stay had increasingly impaired pulmonary diffusion capacities and abnormal chest imaging manifestations,” Chaolin Huang, MD, of Jin Yin-tan Hospital in Wuhan, China, and associates wrote in the Lancet.
Fatigue or muscle weakness, reported by 63% of patients, was the most common symptom, followed by sleep difficulties, hair loss, and smell disorder. Altogether, 76% of those examined 6 months after discharge from Jin Yin-tan hospital – the first designated for patients with COVID-19 in Wuhan – reported at least one symptom, they said.
Symptoms were more common in women than men: 81% vs. 73% had at least one symptom, and 66% vs. 59% had fatigue or muscle weakness. Women were also more likely than men to report anxiety or depression at follow-up: 28% vs. 18% (23% overall), the investigators said.
Patients with the most severe COVID-19 were 2.4 times as likely to report any symptom later, compared with those who had the least severe levels of infection. Among the 349 participants who completed a lung function test at follow-up, lung diffusion impairment was seen in 56% of those with the most severe illness and 22% of those with the lowest level, Dr. Huang and associates reported.
In a different subset of 94 patients from whom plasma samples were collected, the “seropositivity and median titres of the neutralising antibodies were significantly lower than at the acute phase,” raising concern for reinfection, they said.
The results of the study, the investigators noted, “support that those with severe disease need post-discharge care. Longer follow-up studies in a larger population are necessary to understand the full spectrum of health consequences from COVID-19.”
FROM THE LANCET
COVID-19 in children: Weekly cases trending downward
The United States added over 171,000 new COVID-19 cases in children during the week ending Jan. 7, but that figure is lower than 3 of the previous 4 weeks, according to a report from the American Academy of Pediatrics and the Children’s Hospital Association.
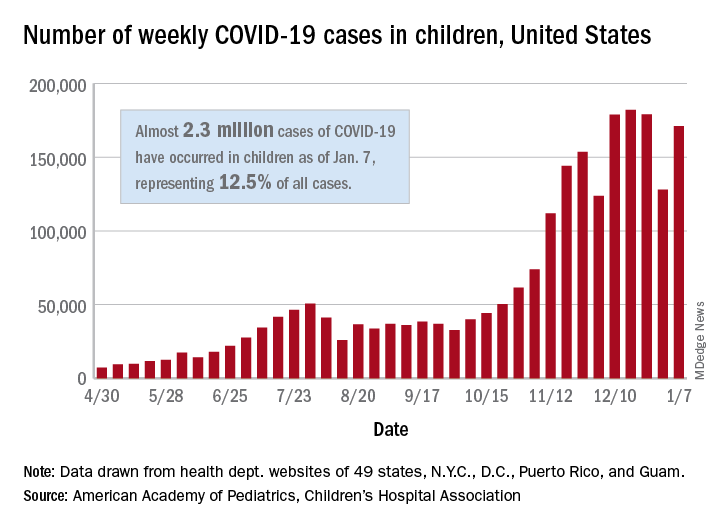
Despite an increase compared with the week ending Dec. 31, the most recent weekly total is down from the high of 182,000 cases reported for the week ending Dec. 17, based on data collected from the health department websites of 49 states (excluding New York), the District of Columbia, New York City, Puerto Rico, and Guam.
Those jurisdictions have recorded a total of almost 2.3 million COVID-19 cases in children since the beginning of the pandemic, which amounts to 12.5% of reported cases among all ages. The 171,000 child cases for the most recent week represented 12.9% of the more than 1.3 million cases nationwide, the AAP and CHA said in their latest weekly update.
The United States now has a rate of 3,055 COVID-19 cases per 100,000 children in the population, the report shows, with 31 states above that figure and 14 states reporting rates above 4,500 per 100,000 children.
Severe illness, however, continues to be rare among children. So far, children represent 1.8% of all hospitalizations in the jurisdictions reporting such data (24 states and New York City), and just 0.9% of infected children have been hospitalized. There have been 188 deaths among children in 42 states and New York City, which makes up just 0.06% of the total for all ages in those jurisdictions, the AAP and CHA reported.
There are 13 states that have reported no coronavirus-related deaths in children, while Texas (34), New York City (21), Arizona (17), and Illinois (11) are the only jurisdictions with 10 or more. Nevada has the highest proportion of child deaths to all deaths at 0.2%, with Arizona and Nebraska next at 0.18%, according to the AAP/CHA report.
The United States added over 171,000 new COVID-19 cases in children during the week ending Jan. 7, but that figure is lower than 3 of the previous 4 weeks, according to a report from the American Academy of Pediatrics and the Children’s Hospital Association.

Despite an increase compared with the week ending Dec. 31, the most recent weekly total is down from the high of 182,000 cases reported for the week ending Dec. 17, based on data collected from the health department websites of 49 states (excluding New York), the District of Columbia, New York City, Puerto Rico, and Guam.
Those jurisdictions have recorded a total of almost 2.3 million COVID-19 cases in children since the beginning of the pandemic, which amounts to 12.5% of reported cases among all ages. The 171,000 child cases for the most recent week represented 12.9% of the more than 1.3 million cases nationwide, the AAP and CHA said in their latest weekly update.
The United States now has a rate of 3,055 COVID-19 cases per 100,000 children in the population, the report shows, with 31 states above that figure and 14 states reporting rates above 4,500 per 100,000 children.
Severe illness, however, continues to be rare among children. So far, children represent 1.8% of all hospitalizations in the jurisdictions reporting such data (24 states and New York City), and just 0.9% of infected children have been hospitalized. There have been 188 deaths among children in 42 states and New York City, which makes up just 0.06% of the total for all ages in those jurisdictions, the AAP and CHA reported.
There are 13 states that have reported no coronavirus-related deaths in children, while Texas (34), New York City (21), Arizona (17), and Illinois (11) are the only jurisdictions with 10 or more. Nevada has the highest proportion of child deaths to all deaths at 0.2%, with Arizona and Nebraska next at 0.18%, according to the AAP/CHA report.
The United States added over 171,000 new COVID-19 cases in children during the week ending Jan. 7, but that figure is lower than 3 of the previous 4 weeks, according to a report from the American Academy of Pediatrics and the Children’s Hospital Association.

Despite an increase compared with the week ending Dec. 31, the most recent weekly total is down from the high of 182,000 cases reported for the week ending Dec. 17, based on data collected from the health department websites of 49 states (excluding New York), the District of Columbia, New York City, Puerto Rico, and Guam.
Those jurisdictions have recorded a total of almost 2.3 million COVID-19 cases in children since the beginning of the pandemic, which amounts to 12.5% of reported cases among all ages. The 171,000 child cases for the most recent week represented 12.9% of the more than 1.3 million cases nationwide, the AAP and CHA said in their latest weekly update.
The United States now has a rate of 3,055 COVID-19 cases per 100,000 children in the population, the report shows, with 31 states above that figure and 14 states reporting rates above 4,500 per 100,000 children.
Severe illness, however, continues to be rare among children. So far, children represent 1.8% of all hospitalizations in the jurisdictions reporting such data (24 states and New York City), and just 0.9% of infected children have been hospitalized. There have been 188 deaths among children in 42 states and New York City, which makes up just 0.06% of the total for all ages in those jurisdictions, the AAP and CHA reported.
There are 13 states that have reported no coronavirus-related deaths in children, while Texas (34), New York City (21), Arizona (17), and Illinois (11) are the only jurisdictions with 10 or more. Nevada has the highest proportion of child deaths to all deaths at 0.2%, with Arizona and Nebraska next at 0.18%, according to the AAP/CHA report.
No increase seen in children’s cumulative COVID-19 burden
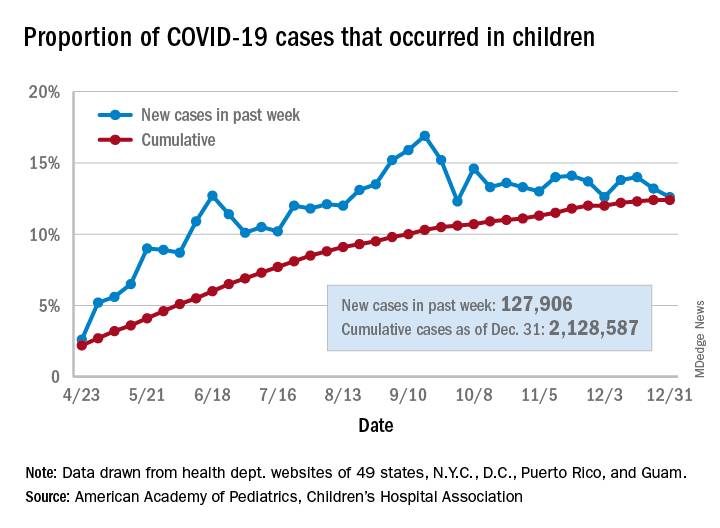
Children’s share of the cumulative COVID-19 burden remained at 12.4% for a second consecutive week, the AAP and CHA said in their weekly report. The last full week of 2020 also marked the second consecutive drop in new cases, although that may be holiday related.
There were almost 128,000 new cases of COVID-19 reported in children for the week, down from 179,000 cases the week before (Dec. 24) and down from the pandemic high of 182,000 reported 2 weeks earlier (Dec.17), based on data from 49 state health departments (excluding New York), along with the District of Columbia, New York City, Puerto Rico, and Guam.
Children’s proportion of new cases for the week, 12.6%, is at its lowest point since early October after dropping for the second week in a row. The cumulative rate of COVID-19 infection, however, is now 2,828 cases per 100,000 children, up from 2,658 the previous week, the AAP and CHA said.
State-level metrics show that North Dakota has the highest cumulative rate at 7,851 per 100,000 children and Hawaii the lowest at 828. Wyoming’s cumulative proportion of child cases, 20.3%, is the highest in the country, while Florida, which uses an age range of 0-14 years for children, is the lowest at 7.1%. California’s total of 268,000 cases is almost double the number of second-place Illinois (138,000), the AAP/CHA data show.
Cumulative child deaths from COVID-19 are up to 179 in the jurisdictions reporting such data (43 states and New York City). That represents just 0.6% of all coronavirus-related deaths and has changed little over the last several months – never rising higher than 0.7% or dropping below 0.6% since early July, according to the report.
Pandemic packed a year of distress into 1 month
The first month of the coronavirus pandemic created almost as much psychological distress among American adults as they had experienced in the year before February 2019, according to the results of two representative surveys.
“The 30-day prevalence of SD [serious distress] in May 2020 did not differ from the past-year prevalence of SD assessed with the same instrument [the Kessler-6 distress scale] in February 2019. In other words, equal numbers of people experienced SD in 30-days during the pandemic as experienced SD over an entire year prior to the pandemic,” Joshua Breslau, PhD, and associates at the Rand Corporation wrote in Preventive Medicine.
In May of 2020, the prevalence of SD was 10.1% in the previous month among 1,870 adults aged 20 years and older who had participated in the two Rand American Life Panel surveys, the first occurring in February 2019. In that earlier poll, 10.9% of the 2,555 respondents said that they experienced SD in the worst month of the previous year, the investigators said.
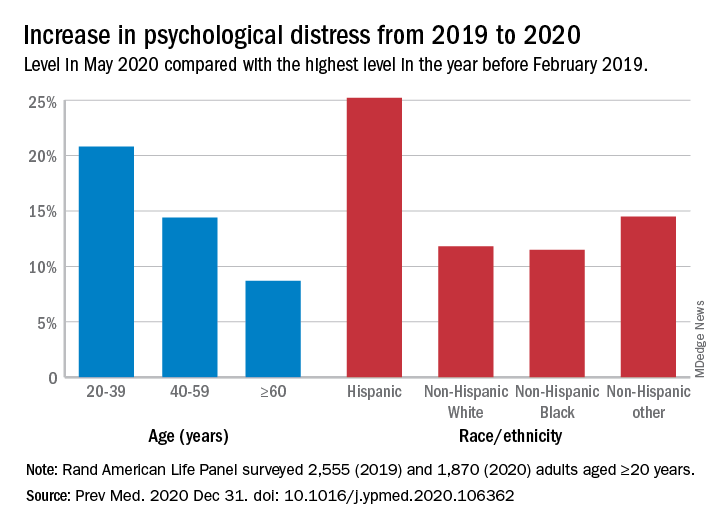
The prevalence of overall psychological distress increased by 12.8% from February 2019 to May 2020, with increases higher among women (17.7%) than men (10.6%); adults under age 60 years, compared with those over 60 (see graph); and Hispanics, compared with other races/ethnicities. Disparities also were seen among income groups: Distress rose 10.2% for those earning over $100,000, compared with 15.4% for those making less than $35,000 and 18.2% for Americans earning between $35,000 and $60,000, the researchers reported.
A high level of stress in the prepandemic survey strongly predicted serious distress during the pandemic. “Risk for SD during the pandemic among those with SD during a year before the pandemic was almost 3 times higher than among those reporting mild/moderate distress and 15 times higher than among those reporting no/low distress during the prepandemic year,” they noted.
Distress levels often return to normal after a disaster, Dr. Breslau and associates pointed out, but “the pandemic’s influence on economic stressors, disruption of usual activities and subsequent effects on population health may continue for an extended period and affect different regions of the country at different points in time.”
SOURCE: Breslau J et al. Prev Med. 2020 Dec 31. doi: 10.1016/j.ypmed.2020.106362.
The first month of the coronavirus pandemic created almost as much psychological distress among American adults as they had experienced in the year before February 2019, according to the results of two representative surveys.

“The 30-day prevalence of SD [serious distress] in May 2020 did not differ from the past-year prevalence of SD assessed with the same instrument [the Kessler-6 distress scale] in February 2019. In other words, equal numbers of people experienced SD in 30-days during the pandemic as experienced SD over an entire year prior to the pandemic,” Joshua Breslau, PhD, and associates at the Rand Corporation wrote in Preventive Medicine.
In May of 2020, the prevalence of SD was 10.1% in the previous month among 1,870 adults aged 20 years and older who had participated in the two Rand American Life Panel surveys, the first occurring in February 2019. In that earlier poll, 10.9% of the 2,555 respondents said that they experienced SD in the worst month of the previous year, the investigators said.
The prevalence of overall psychological distress increased by 12.8% from February 2019 to May 2020, with increases higher among women (17.7%) than men (10.6%); adults under age 60 years, compared with those over 60 (see graph); and Hispanics, compared with other races/ethnicities. Disparities also were seen among income groups: Distress rose 10.2% for those earning over $100,000, compared with 15.4% for those making less than $35,000 and 18.2% for Americans earning between $35,000 and $60,000, the researchers reported.
A high level of stress in the prepandemic survey strongly predicted serious distress during the pandemic. “Risk for SD during the pandemic among those with SD during a year before the pandemic was almost 3 times higher than among those reporting mild/moderate distress and 15 times higher than among those reporting no/low distress during the prepandemic year,” they noted.
Distress levels often return to normal after a disaster, Dr. Breslau and associates pointed out, but “the pandemic’s influence on economic stressors, disruption of usual activities and subsequent effects on population health may continue for an extended period and affect different regions of the country at different points in time.”
SOURCE: Breslau J et al. Prev Med. 2020 Dec 31. doi: 10.1016/j.ypmed.2020.106362.
The first month of the coronavirus pandemic created almost as much psychological distress among American adults as they had experienced in the year before February 2019, according to the results of two representative surveys.

“The 30-day prevalence of SD [serious distress] in May 2020 did not differ from the past-year prevalence of SD assessed with the same instrument [the Kessler-6 distress scale] in February 2019. In other words, equal numbers of people experienced SD in 30-days during the pandemic as experienced SD over an entire year prior to the pandemic,” Joshua Breslau, PhD, and associates at the Rand Corporation wrote in Preventive Medicine.
In May of 2020, the prevalence of SD was 10.1% in the previous month among 1,870 adults aged 20 years and older who had participated in the two Rand American Life Panel surveys, the first occurring in February 2019. In that earlier poll, 10.9% of the 2,555 respondents said that they experienced SD in the worst month of the previous year, the investigators said.
The prevalence of overall psychological distress increased by 12.8% from February 2019 to May 2020, with increases higher among women (17.7%) than men (10.6%); adults under age 60 years, compared with those over 60 (see graph); and Hispanics, compared with other races/ethnicities. Disparities also were seen among income groups: Distress rose 10.2% for those earning over $100,000, compared with 15.4% for those making less than $35,000 and 18.2% for Americans earning between $35,000 and $60,000, the researchers reported.
A high level of stress in the prepandemic survey strongly predicted serious distress during the pandemic. “Risk for SD during the pandemic among those with SD during a year before the pandemic was almost 3 times higher than among those reporting mild/moderate distress and 15 times higher than among those reporting no/low distress during the prepandemic year,” they noted.
Distress levels often return to normal after a disaster, Dr. Breslau and associates pointed out, but “the pandemic’s influence on economic stressors, disruption of usual activities and subsequent effects on population health may continue for an extended period and affect different regions of the country at different points in time.”
SOURCE: Breslau J et al. Prev Med. 2020 Dec 31. doi: 10.1016/j.ypmed.2020.106362.
FROM PREVENTIVE MEDICINE
New pediatric cases down as U.S. tops 2 million children with COVID-19
The United States exceeded 2 million reported cases of COVID-19 in children just 6 weeks after recording its 1 millionth case, according to a report from the American Academy of Pediatrics and the Children’s Hospital Association.
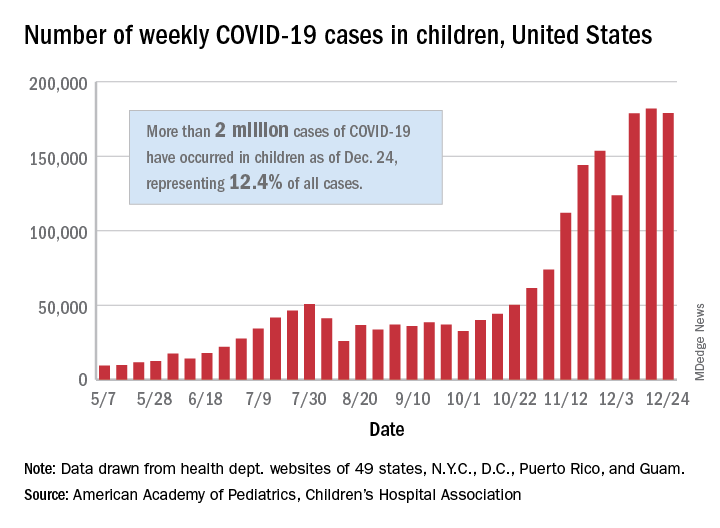
The total number of cases in children was 2,000,681 as of Dec. 24, which represents 12.4% of all cases reported by the health departments of 49 states (excluding New York), the District of Columbia, New York City, Puerto Rico, and Guam, the AAP and CHA stated Dec. 29.
The case count for just the latest week, 178,935, was actually down 1.7% from the 182,018 reported the week before, marking the second drop since the beginning of December. The first came during the week ending Dec. 3, when the number of cases dropped more than 19% from the previous week, based on data from the AAP/CHA report.
The cumulative national rate of coronavirus infection is now 2,658 cases per 100,000 children, and “13 states have reported more than 4,000 cases per 100,000,” the two groups said.
The highest rate for any state can be found in North Dakota, which has had 7,722 cases of COVID-19 per 100,000 children. Wyoming has the highest proportion of cases in children at 20.5%, and California has reported the most cases overall, 234,174, the report shows.
Data on testing, hospitalization, and mortality were not included in the Dec. 29 report because of the holiday but will be available in the next edition, scheduled for release on Jan. 5, 2021.
The United States exceeded 2 million reported cases of COVID-19 in children just 6 weeks after recording its 1 millionth case, according to a report from the American Academy of Pediatrics and the Children’s Hospital Association.

The total number of cases in children was 2,000,681 as of Dec. 24, which represents 12.4% of all cases reported by the health departments of 49 states (excluding New York), the District of Columbia, New York City, Puerto Rico, and Guam, the AAP and CHA stated Dec. 29.
The case count for just the latest week, 178,935, was actually down 1.7% from the 182,018 reported the week before, marking the second drop since the beginning of December. The first came during the week ending Dec. 3, when the number of cases dropped more than 19% from the previous week, based on data from the AAP/CHA report.
The cumulative national rate of coronavirus infection is now 2,658 cases per 100,000 children, and “13 states have reported more than 4,000 cases per 100,000,” the two groups said.
The highest rate for any state can be found in North Dakota, which has had 7,722 cases of COVID-19 per 100,000 children. Wyoming has the highest proportion of cases in children at 20.5%, and California has reported the most cases overall, 234,174, the report shows.
Data on testing, hospitalization, and mortality were not included in the Dec. 29 report because of the holiday but will be available in the next edition, scheduled for release on Jan. 5, 2021.
The United States exceeded 2 million reported cases of COVID-19 in children just 6 weeks after recording its 1 millionth case, according to a report from the American Academy of Pediatrics and the Children’s Hospital Association.

The total number of cases in children was 2,000,681 as of Dec. 24, which represents 12.4% of all cases reported by the health departments of 49 states (excluding New York), the District of Columbia, New York City, Puerto Rico, and Guam, the AAP and CHA stated Dec. 29.
The case count for just the latest week, 178,935, was actually down 1.7% from the 182,018 reported the week before, marking the second drop since the beginning of December. The first came during the week ending Dec. 3, when the number of cases dropped more than 19% from the previous week, based on data from the AAP/CHA report.
The cumulative national rate of coronavirus infection is now 2,658 cases per 100,000 children, and “13 states have reported more than 4,000 cases per 100,000,” the two groups said.
The highest rate for any state can be found in North Dakota, which has had 7,722 cases of COVID-19 per 100,000 children. Wyoming has the highest proportion of cases in children at 20.5%, and California has reported the most cases overall, 234,174, the report shows.
Data on testing, hospitalization, and mortality were not included in the Dec. 29 report because of the holiday but will be available in the next edition, scheduled for release on Jan. 5, 2021.
Child abuse visits to EDs declined in 2020, but not admissions
but the visits in 2020 were significantly more likely to result in hospitalization, based on analysis of a national ED database.
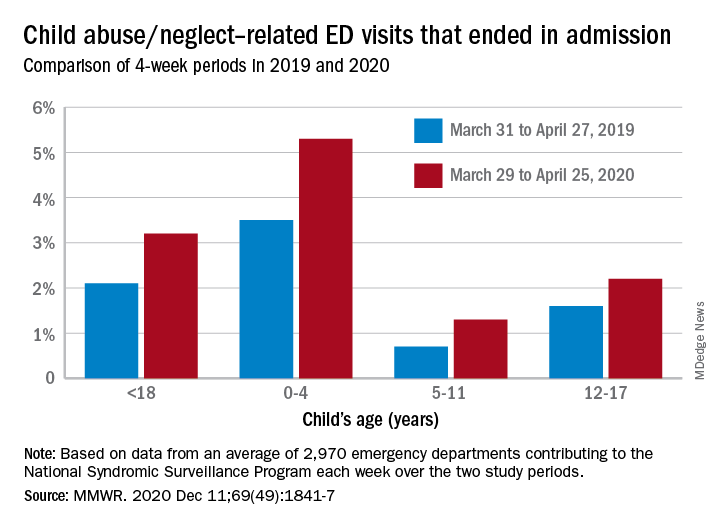
The number of ED visits involving child abuse and neglect was down by 53% during the 4-week period from March 29 to April 25, 2020, compared with the 4 weeks from March 31 to April 27, 2019. The proportion of those ED visits that ended in hospitalizations, however, increased from 2.1% in 2019 to 3.2% in 2020, Elizabeth Swedo, MD, and associates at the Centers for Disease Control and Prevention said in the Morbidity and Mortality Weekly Report.
“ED visits related to suspected or confirmed child abuse and neglect decreased beginning the week of March 15, 2020, coinciding with the declaration of a national emergency related to COVID-19 and implementation of community mitigation measures,” they wrote.
An earlier study involving the same database (the National Syndromic Surveillance Program) showed that, over the two same 4-week periods, the volume of all ED visits in 2020 was down 72% for children aged 10 years and younger and 71% for those aged 11-14 years.
In the current study, however, all age subgroups had significant increases in hospital admissions. The proportion of ED visits related to child abuse and neglect that resulted in hospitalization rose from 3.5% in 2019 to 5.3% in 2020 among ages 0-4 years, 0.7% to 1.3% for ages 5-11 years, and 1.6% to 2.2% for adolescents aged 12-17, Dr. Swedo and associates reported.
The absence of a corresponding drop in hospitalizations may be tied to risk factors related to the pandemic, “such as loss of income, increased stress related to parental child care and schooling responsibilities, and increased substance use and mental health conditions among adults,” the investigators added.
The National Syndromic Surveillance Program receives daily data from 3,310 EDs in 47 states, but the number of facilities meeting the investigators’ criteria averaged 2,970 a week for the 8 weeks of the study period.
SOURCE: Swedo E et al. MMWR. 2020 Dec. 11;69(49):1841-7.
but the visits in 2020 were significantly more likely to result in hospitalization, based on analysis of a national ED database.

The number of ED visits involving child abuse and neglect was down by 53% during the 4-week period from March 29 to April 25, 2020, compared with the 4 weeks from March 31 to April 27, 2019. The proportion of those ED visits that ended in hospitalizations, however, increased from 2.1% in 2019 to 3.2% in 2020, Elizabeth Swedo, MD, and associates at the Centers for Disease Control and Prevention said in the Morbidity and Mortality Weekly Report.
“ED visits related to suspected or confirmed child abuse and neglect decreased beginning the week of March 15, 2020, coinciding with the declaration of a national emergency related to COVID-19 and implementation of community mitigation measures,” they wrote.
An earlier study involving the same database (the National Syndromic Surveillance Program) showed that, over the two same 4-week periods, the volume of all ED visits in 2020 was down 72% for children aged 10 years and younger and 71% for those aged 11-14 years.
In the current study, however, all age subgroups had significant increases in hospital admissions. The proportion of ED visits related to child abuse and neglect that resulted in hospitalization rose from 3.5% in 2019 to 5.3% in 2020 among ages 0-4 years, 0.7% to 1.3% for ages 5-11 years, and 1.6% to 2.2% for adolescents aged 12-17, Dr. Swedo and associates reported.
The absence of a corresponding drop in hospitalizations may be tied to risk factors related to the pandemic, “such as loss of income, increased stress related to parental child care and schooling responsibilities, and increased substance use and mental health conditions among adults,” the investigators added.
The National Syndromic Surveillance Program receives daily data from 3,310 EDs in 47 states, but the number of facilities meeting the investigators’ criteria averaged 2,970 a week for the 8 weeks of the study period.
SOURCE: Swedo E et al. MMWR. 2020 Dec. 11;69(49):1841-7.
but the visits in 2020 were significantly more likely to result in hospitalization, based on analysis of a national ED database.

The number of ED visits involving child abuse and neglect was down by 53% during the 4-week period from March 29 to April 25, 2020, compared with the 4 weeks from March 31 to April 27, 2019. The proportion of those ED visits that ended in hospitalizations, however, increased from 2.1% in 2019 to 3.2% in 2020, Elizabeth Swedo, MD, and associates at the Centers for Disease Control and Prevention said in the Morbidity and Mortality Weekly Report.
“ED visits related to suspected or confirmed child abuse and neglect decreased beginning the week of March 15, 2020, coinciding with the declaration of a national emergency related to COVID-19 and implementation of community mitigation measures,” they wrote.
An earlier study involving the same database (the National Syndromic Surveillance Program) showed that, over the two same 4-week periods, the volume of all ED visits in 2020 was down 72% for children aged 10 years and younger and 71% for those aged 11-14 years.
In the current study, however, all age subgroups had significant increases in hospital admissions. The proportion of ED visits related to child abuse and neglect that resulted in hospitalization rose from 3.5% in 2019 to 5.3% in 2020 among ages 0-4 years, 0.7% to 1.3% for ages 5-11 years, and 1.6% to 2.2% for adolescents aged 12-17, Dr. Swedo and associates reported.
The absence of a corresponding drop in hospitalizations may be tied to risk factors related to the pandemic, “such as loss of income, increased stress related to parental child care and schooling responsibilities, and increased substance use and mental health conditions among adults,” the investigators added.
The National Syndromic Surveillance Program receives daily data from 3,310 EDs in 47 states, but the number of facilities meeting the investigators’ criteria averaged 2,970 a week for the 8 weeks of the study period.
SOURCE: Swedo E et al. MMWR. 2020 Dec. 11;69(49):1841-7.
FROM MMWR
Latest rise in child COVID-19 cases is relatively small
For the seventh week out of the last eight, more new cases of COVID-19 in children were reported in the United States than any week before, according to a report from the American Academy of Pediatrics and the Children’s Hospital Association.
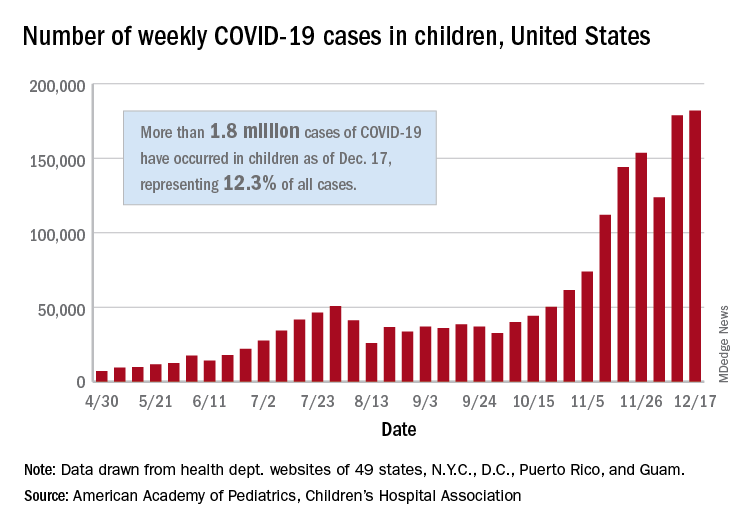
There were just over 182,000 new cases of COVID-19 in children during the week ending Dec. 17, topping the previous high of almost 179,000 set the previous week. – a stretch of 11 weeks that has produced only one decline, based on data from the latest AAP/CHA weekly report.
As of Dec. 17, there had been over 1.8 million cases of COVID-19 in children, which represents 12.3% of all U.S. cases. For the week, 14% of all cases occurred in children, which was up slightly from 13.8% the week before (Dec. 10). The overall rate of coronavirus infection is now 2,420 cases per 100,000 children in the population, the AAP and CHA said.
A total of 30 states are above that national rate, with North Dakota the highest at 7,515 cases per 100,000 children, followed by South Dakota (5,618), Wyoming (5,157), Wisconsin (5,106), and Tennessee (4,994). Wyoming has the highest proportion of cases occurring in children at 20.8%, but that is down from 23.4% in mid-November, based on data collected by the AAP and CHA from the health department websites of 49 states (New York does not provide age distributions), the District of Columbia, New York City, Puerto Rico, and Guam.
In the last 2 weeks, however, the largest percent increases in new cases came in states with low-to-average rates of cumulative child infection. California, Connecticut, Delaware, Maine, Maryland, New Hampshire, and Vermont all saw increases of over 35% from Dec. 3 to Dec. 17, while the smallest increases occurred in Hawaii, North Dakota, and Wyoming, the AAP and CHA reported.
For the seventh week out of the last eight, more new cases of COVID-19 in children were reported in the United States than any week before, according to a report from the American Academy of Pediatrics and the Children’s Hospital Association.

There were just over 182,000 new cases of COVID-19 in children during the week ending Dec. 17, topping the previous high of almost 179,000 set the previous week. – a stretch of 11 weeks that has produced only one decline, based on data from the latest AAP/CHA weekly report.
As of Dec. 17, there had been over 1.8 million cases of COVID-19 in children, which represents 12.3% of all U.S. cases. For the week, 14% of all cases occurred in children, which was up slightly from 13.8% the week before (Dec. 10). The overall rate of coronavirus infection is now 2,420 cases per 100,000 children in the population, the AAP and CHA said.
A total of 30 states are above that national rate, with North Dakota the highest at 7,515 cases per 100,000 children, followed by South Dakota (5,618), Wyoming (5,157), Wisconsin (5,106), and Tennessee (4,994). Wyoming has the highest proportion of cases occurring in children at 20.8%, but that is down from 23.4% in mid-November, based on data collected by the AAP and CHA from the health department websites of 49 states (New York does not provide age distributions), the District of Columbia, New York City, Puerto Rico, and Guam.
In the last 2 weeks, however, the largest percent increases in new cases came in states with low-to-average rates of cumulative child infection. California, Connecticut, Delaware, Maine, Maryland, New Hampshire, and Vermont all saw increases of over 35% from Dec. 3 to Dec. 17, while the smallest increases occurred in Hawaii, North Dakota, and Wyoming, the AAP and CHA reported.
For the seventh week out of the last eight, more new cases of COVID-19 in children were reported in the United States than any week before, according to a report from the American Academy of Pediatrics and the Children’s Hospital Association.

There were just over 182,000 new cases of COVID-19 in children during the week ending Dec. 17, topping the previous high of almost 179,000 set the previous week. – a stretch of 11 weeks that has produced only one decline, based on data from the latest AAP/CHA weekly report.
As of Dec. 17, there had been over 1.8 million cases of COVID-19 in children, which represents 12.3% of all U.S. cases. For the week, 14% of all cases occurred in children, which was up slightly from 13.8% the week before (Dec. 10). The overall rate of coronavirus infection is now 2,420 cases per 100,000 children in the population, the AAP and CHA said.
A total of 30 states are above that national rate, with North Dakota the highest at 7,515 cases per 100,000 children, followed by South Dakota (5,618), Wyoming (5,157), Wisconsin (5,106), and Tennessee (4,994). Wyoming has the highest proportion of cases occurring in children at 20.8%, but that is down from 23.4% in mid-November, based on data collected by the AAP and CHA from the health department websites of 49 states (New York does not provide age distributions), the District of Columbia, New York City, Puerto Rico, and Guam.
In the last 2 weeks, however, the largest percent increases in new cases came in states with low-to-average rates of cumulative child infection. California, Connecticut, Delaware, Maine, Maryland, New Hampshire, and Vermont all saw increases of over 35% from Dec. 3 to Dec. 17, while the smallest increases occurred in Hawaii, North Dakota, and Wyoming, the AAP and CHA reported.
Parents favored virtual learning over in-person school attendance
Parents of school-aged children were generally more comfortable with full-time virtual learning in schools in the fall of 2020, compared with full-capacity in-person attendance, according to a survey conducted in July.
Those of racial/ethnic minorities, however, “were less likely to feel that schools should reopen for all students and were more concerned about” several aspects of in-person instruction than were White parents, Leah K. Gilbert, MD, and associates at the Centers for Disease Control and Prevention’s COVID-19 Response Team said in the Morbidity and Mortality Weekly Report.
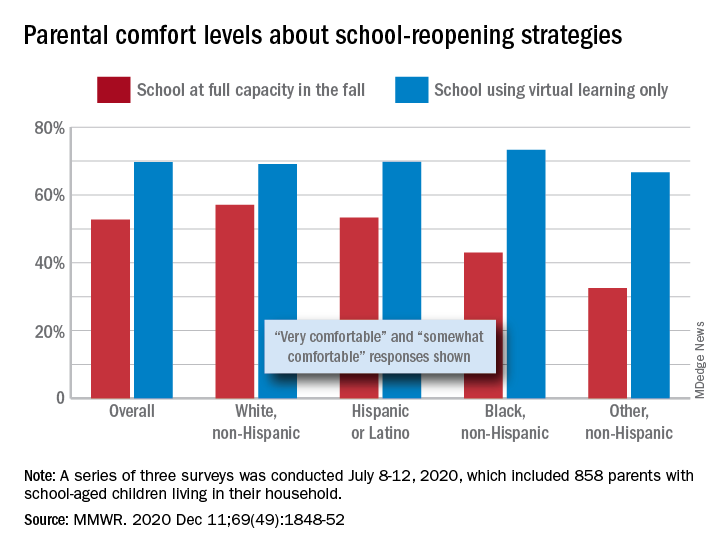
A slim majority, just under 53% of the 858 parents surveyed, said that they were very or somewhat comfortable with their children returning to schools that were reopening at full capacity, while almost 70% said they were very/somewhat comfortable with schools going exclusively with virtual learning, the investigators reported.
The question about full-capacity attendance in particular showed considerable variation by race and ethnicity, with 57% of White parents saying they were very/somewhat comfortable, versus 53% of Hispanic or Latino parents, 43% of Black parents, and 32.5% of parents of other races/ethnicities (American Indian/Alaska Native, Asian, or multiracial).
Comfort levels were closer regarding virtual learning: Parents of other races/ethnicities were lowest at 67% and Black parents were highest at 73%. When asked about schools reopening at 50% capacity and 50% virtual learning, Black parents were again lowest at 58% with strong or moderate comfort and White parents were highest at 68%, Dr. Gilbert and associates said.
“Although the majority of parent respondents had concerns about both school reopening for in-person instruction and virtual learning, the perceived risk for SARS-CoV-2 infection and poor health outcomes might account for the differences in parental attitudes and concerns by race and ethnicity,” they wrote.
SOURCE: Gilbert LK et al. MMWR. 2020 Dec 11;69(49):1848-52.
Parents of school-aged children were generally more comfortable with full-time virtual learning in schools in the fall of 2020, compared with full-capacity in-person attendance, according to a survey conducted in July.

Those of racial/ethnic minorities, however, “were less likely to feel that schools should reopen for all students and were more concerned about” several aspects of in-person instruction than were White parents, Leah K. Gilbert, MD, and associates at the Centers for Disease Control and Prevention’s COVID-19 Response Team said in the Morbidity and Mortality Weekly Report.
A slim majority, just under 53% of the 858 parents surveyed, said that they were very or somewhat comfortable with their children returning to schools that were reopening at full capacity, while almost 70% said they were very/somewhat comfortable with schools going exclusively with virtual learning, the investigators reported.
The question about full-capacity attendance in particular showed considerable variation by race and ethnicity, with 57% of White parents saying they were very/somewhat comfortable, versus 53% of Hispanic or Latino parents, 43% of Black parents, and 32.5% of parents of other races/ethnicities (American Indian/Alaska Native, Asian, or multiracial).
Comfort levels were closer regarding virtual learning: Parents of other races/ethnicities were lowest at 67% and Black parents were highest at 73%. When asked about schools reopening at 50% capacity and 50% virtual learning, Black parents were again lowest at 58% with strong or moderate comfort and White parents were highest at 68%, Dr. Gilbert and associates said.
“Although the majority of parent respondents had concerns about both school reopening for in-person instruction and virtual learning, the perceived risk for SARS-CoV-2 infection and poor health outcomes might account for the differences in parental attitudes and concerns by race and ethnicity,” they wrote.
SOURCE: Gilbert LK et al. MMWR. 2020 Dec 11;69(49):1848-52.
Parents of school-aged children were generally more comfortable with full-time virtual learning in schools in the fall of 2020, compared with full-capacity in-person attendance, according to a survey conducted in July.

Those of racial/ethnic minorities, however, “were less likely to feel that schools should reopen for all students and were more concerned about” several aspects of in-person instruction than were White parents, Leah K. Gilbert, MD, and associates at the Centers for Disease Control and Prevention’s COVID-19 Response Team said in the Morbidity and Mortality Weekly Report.
A slim majority, just under 53% of the 858 parents surveyed, said that they were very or somewhat comfortable with their children returning to schools that were reopening at full capacity, while almost 70% said they were very/somewhat comfortable with schools going exclusively with virtual learning, the investigators reported.
The question about full-capacity attendance in particular showed considerable variation by race and ethnicity, with 57% of White parents saying they were very/somewhat comfortable, versus 53% of Hispanic or Latino parents, 43% of Black parents, and 32.5% of parents of other races/ethnicities (American Indian/Alaska Native, Asian, or multiracial).
Comfort levels were closer regarding virtual learning: Parents of other races/ethnicities were lowest at 67% and Black parents were highest at 73%. When asked about schools reopening at 50% capacity and 50% virtual learning, Black parents were again lowest at 58% with strong or moderate comfort and White parents were highest at 68%, Dr. Gilbert and associates said.
“Although the majority of parent respondents had concerns about both school reopening for in-person instruction and virtual learning, the perceived risk for SARS-CoV-2 infection and poor health outcomes might account for the differences in parental attitudes and concerns by race and ethnicity,” they wrote.
SOURCE: Gilbert LK et al. MMWR. 2020 Dec 11;69(49):1848-52.
FROM MMWR