User login
Doug Brunk is a San Diego-based award-winning reporter who began covering health care in 1991. Before joining the company, he wrote for the health sciences division of Columbia University and was an associate editor at Contemporary Long Term Care magazine when it won a Jesse H. Neal Award. His work has been syndicated by the Los Angeles Times and he is the author of two books related to the University of Kentucky Wildcats men's basketball program. Doug has a master’s degree in magazine journalism from the S.I. Newhouse School of Public Communications at Syracuse University. Follow him on Twitter @dougbrunk.
Legislative, educational interventions influenced vaccine status of California kindergartners
After California lawmakers implemented policies to limit and eventually eliminate nonmedical exemptions for childhood vaccinations, the proportion of kindergartners who were not up to date for recommended vaccinations fell from 10% in 2013 to 5% in 2017.

At the same time, the
The findings come from an observational study that used cross-sectional school-entry data from 2000 to 2017 to calculate the rates of kindergartners attending California schools who were not up to date on required vaccinations.
“Large-scale vaccination programs that included school-entry mandates have been essential to maintaining high levels of immunization coverage and low rates of vaccine-preventable diseases,” researchers led by S. Cassandra Pingali, MPH, MS, wrote in JAMA. “However, an increasing number of parents are not vaccinating their children over concerns about potential adverse effects. These parental actions threaten the herd immunity established by decades of high vaccine uptake and increase the potential for disease outbreaks.”
Ms. Pingali, of the department of epidemiology at Emory University, Atlanta, and colleagues conducted an observational analysis of California kindergartners who were not up to date on one or more of the required vaccinations during the course of three interventions implemented in the state. The first was Assembly Bill 2109 (AB 2109), which was passed in 2014. It required parents to show proof they had discussed the risks of not vaccinating their children with a health care practitioner before they obtained a personal belief exemption. The second intervention was a campaign carried out in 2015 by the California Department of Public Health and local health departments, designed to educate school staff on the proper application of the conditional admission criteria, which allowed students additional time to catch up on vaccination. The third intervention was the implementation of Senate bill 277 (SB 277), which banned all personal belief exemptions.
Between 2000 and 2017, the researchers reported that the yearly mean kindergarten enrollment in California was 517,962 and the mean number of schools was 7,278. Over this time, the yearly rate of students without up-to-date vaccination status rose from 8% during 2000 to 10% during 2013, before decreasing to 5% during 2017. Ms. Pingali and associates also found that average percentage chance of any within-school contact for a student without up-to-date vaccination status with another student with the same status was 19% during 2000, and increased steadily to 26% during 2014, the first year of AB 2109. The values decreased to 3% (the first year of SB 277), before increasing slightly to 5% during 2017.
“Across the interventions, the percentage of kindergartners attending schools with an up-to-date vaccination status percentage that was greater than the herd immunity threshold also increased for various vaccine-preventable diseases,” the researchers wrote. “Overall, the results suggest that the risk of disease outbreak via potential contact among susceptible children decreased over the course of the interventions.”
The way Matthew M. Davis, MD and Seema K. Shah, JD, see it, the current outbreak of measles in the United States is rooted in the failure of parents to vaccinate their children against the disease based on their beliefs rather than medical contraindications.
“The public health implications of such decisions are amplified because parents who share belief systems about childhood vaccinations tend to congregate socially and residentially, thereby forming clusters of unvaccinated children who are at elevated health risks when exposed to vaccine-preventable diseases,” the authors wrote in an accompanying editorial.
While the study reported by Pingali et al. did not measure actual outbreaks of disease, “reductions in children’s risk of contracting measles are a promising outcome in California resulting from policy changes,” wrote Dr. Davis and Ms. Shah, both of Northwestern University, Chicago (JAMA. 2019;322[1]:33-4). “Yet, because of the ease of domestic and international travel, the mobile nature of young families, and the inability of all states to implement this approach, changes made in each state for nonmedical exemptions may not ensure sufficiently high protection against measles for children across all jurisdictions in the United States. Although states have historically made their own decisions about vaccination exemptions linked to day care or school entry because states exercise primary authority over educational matters, childhood vaccination is a national matter in many respects.”
The best way to remedy the current system failure regarding measles vaccination, they continued, may be to adopt a unified national approach to prohibit nonmedical exemptions. They pointed to the fact that the United States previously achieved virtual eradication of measles as recently as 2000. “Following that achievement, state-level policy changes relaxed immunization requirements and set the stage for progressively larger outbreaks in the United States in recent years. Such system failures result when the products, processes, and people (including the public) that comprise systems do not function or behave in ways that protect health optimally.”
The study was supported by a grant from the National Institutes of Health. One coauthor reported having received consulting fees from Merck and grants from Pfizer and Walgreens. Another reported receiving grants from Pfizer, Merck, GlaxoSmithKline, Sanofi Pasteur, Protein Science, Dynavax, and MedImmune. The remaining coauthors reported no relevant financial disclosures.
The editorialists reported having no financial disclosures.
SOURCE: Pingali SC et al. JAMA. 2019 Jul 2. doi: 10.1001/jama.2019.7924.
After California lawmakers implemented policies to limit and eventually eliminate nonmedical exemptions for childhood vaccinations, the proportion of kindergartners who were not up to date for recommended vaccinations fell from 10% in 2013 to 5% in 2017.
At the same time, the
The findings come from an observational study that used cross-sectional school-entry data from 2000 to 2017 to calculate the rates of kindergartners attending California schools who were not up to date on required vaccinations.
“Large-scale vaccination programs that included school-entry mandates have been essential to maintaining high levels of immunization coverage and low rates of vaccine-preventable diseases,” researchers led by S. Cassandra Pingali, MPH, MS, wrote in JAMA. “However, an increasing number of parents are not vaccinating their children over concerns about potential adverse effects. These parental actions threaten the herd immunity established by decades of high vaccine uptake and increase the potential for disease outbreaks.”
Ms. Pingali, of the department of epidemiology at Emory University, Atlanta, and colleagues conducted an observational analysis of California kindergartners who were not up to date on one or more of the required vaccinations during the course of three interventions implemented in the state. The first was Assembly Bill 2109 (AB 2109), which was passed in 2014. It required parents to show proof they had discussed the risks of not vaccinating their children with a health care practitioner before they obtained a personal belief exemption. The second intervention was a campaign carried out in 2015 by the California Department of Public Health and local health departments, designed to educate school staff on the proper application of the conditional admission criteria, which allowed students additional time to catch up on vaccination. The third intervention was the implementation of Senate bill 277 (SB 277), which banned all personal belief exemptions.
Between 2000 and 2017, the researchers reported that the yearly mean kindergarten enrollment in California was 517,962 and the mean number of schools was 7,278. Over this time, the yearly rate of students without up-to-date vaccination status rose from 8% during 2000 to 10% during 2013, before decreasing to 5% during 2017. Ms. Pingali and associates also found that average percentage chance of any within-school contact for a student without up-to-date vaccination status with another student with the same status was 19% during 2000, and increased steadily to 26% during 2014, the first year of AB 2109. The values decreased to 3% (the first year of SB 277), before increasing slightly to 5% during 2017.
“Across the interventions, the percentage of kindergartners attending schools with an up-to-date vaccination status percentage that was greater than the herd immunity threshold also increased for various vaccine-preventable diseases,” the researchers wrote. “Overall, the results suggest that the risk of disease outbreak via potential contact among susceptible children decreased over the course of the interventions.”
The way Matthew M. Davis, MD and Seema K. Shah, JD, see it, the current outbreak of measles in the United States is rooted in the failure of parents to vaccinate their children against the disease based on their beliefs rather than medical contraindications.
“The public health implications of such decisions are amplified because parents who share belief systems about childhood vaccinations tend to congregate socially and residentially, thereby forming clusters of unvaccinated children who are at elevated health risks when exposed to vaccine-preventable diseases,” the authors wrote in an accompanying editorial.
While the study reported by Pingali et al. did not measure actual outbreaks of disease, “reductions in children’s risk of contracting measles are a promising outcome in California resulting from policy changes,” wrote Dr. Davis and Ms. Shah, both of Northwestern University, Chicago (JAMA. 2019;322[1]:33-4). “Yet, because of the ease of domestic and international travel, the mobile nature of young families, and the inability of all states to implement this approach, changes made in each state for nonmedical exemptions may not ensure sufficiently high protection against measles for children across all jurisdictions in the United States. Although states have historically made their own decisions about vaccination exemptions linked to day care or school entry because states exercise primary authority over educational matters, childhood vaccination is a national matter in many respects.”
The best way to remedy the current system failure regarding measles vaccination, they continued, may be to adopt a unified national approach to prohibit nonmedical exemptions. They pointed to the fact that the United States previously achieved virtual eradication of measles as recently as 2000. “Following that achievement, state-level policy changes relaxed immunization requirements and set the stage for progressively larger outbreaks in the United States in recent years. Such system failures result when the products, processes, and people (including the public) that comprise systems do not function or behave in ways that protect health optimally.”
The study was supported by a grant from the National Institutes of Health. One coauthor reported having received consulting fees from Merck and grants from Pfizer and Walgreens. Another reported receiving grants from Pfizer, Merck, GlaxoSmithKline, Sanofi Pasteur, Protein Science, Dynavax, and MedImmune. The remaining coauthors reported no relevant financial disclosures.
The editorialists reported having no financial disclosures.
SOURCE: Pingali SC et al. JAMA. 2019 Jul 2. doi: 10.1001/jama.2019.7924.
FROM JAMA
Study eyes narcolepsy’s impact on patient quality of life
SAN ANTONIO – Narcolepsy adversely impacts one’s health-related quality of life in a variety of ways, from elevated levels of depression to negative social stigma, results from a mixed methods study suggest.

“Despite established pharmacological treatments to reduce narcolepsy symptoms, health-related quality of life remains poor,” the study’s first author, Jason C. Ong, PhD, said at the annual meeting of the Associated Professional Sleep Societies. “The impact these symptoms have on functioning, the disease burden, and psychosocial functioning in particular is very important. Psychosocial functioning is particularly poor.”
Previous research has shown that people with narcolepsy have two- to four times the rate of psychiatric comorbidities and that health-related stigma is a predictor of depression and poor functioning, said Dr. Ong, a psychologist with the Center for Circadian and Sleep Medicine at the Northwestern University Feinberg School of Medicine, Chicago. In an effort to assess current practices for addressing the psychosocial needs of persons with narcolepsy and to identify potential strategies that could be used to develop a psychosocial intervention, he and his associates conducted a mixed methods study to examine how narcolepsy symptoms impact health-related quality of life and the appropriateness of different health-related quality of life measures for the disorder. “Our long-term goal is to see if we can use this information to help inform the feasibility of a psychosocial intervention to improve health-related quality of life,” he said.
For the study, 29 adults with an established diagnosis of narcolepsy completed online versions of the Patient Health Questionnaire-9 (PHQ-9), the Patient Reported Outcomes Measurement Information System (PROMIS), the 36-item Short Form Survey (SF-36), and the Epworth Sleepiness Scale (ESS). They also participated in a focus group, which consisted of questions pertaining to quality of life for persons with narcolepsy, current practices for addressing psychosocial health of affected individuals, and suggestions for developing a psychosocial intervention. The researchers used thematic analysis to reduce the qualitative data to key themes.
Most of the study participants (93%) were female, 90% were white, their mean age was 31, and their mean time since narcolepsy diagnosis was 4.3 years. Clinically significant elevations on the PROMIS scale, defined as a t-score of greater than 60, were reported for depression (t-score of 64.8), anxiety (66.3), fatigue (68.3), and sleep impairment (66.9). Elevations in depressive symptoms were reported on the PHQ-9 (a mean of 15.79), “which corresponds to moderately severe levels,” Dr. Ong said. “The ESS was highly elevated and fit well with the scales for sleep impairment as well as fatigue on the PROMIS. Overall, there was nice congruence across these measures.”
On the SF-36, the researchers observed that there were deficits in physical and emotional aspects of role limitations, and in energy/fatigue. “One thing we did find was a significant difference in general functioning, where patients with type 1 narcolepsy were worse off than those with type 2 narcolepsy (P less than .05).”
Qualitative data from focus groups revealed several key themes, including the perception that narcolepsy is poorly understood by the public and health care providers.
“People have the perception that if you have narcolepsy, you just feel fine and then you fall asleep,” Dr. Ong said. “They don’t understand that it’s a constant thing. Negative social stigma was also common. As a result, we found a lot of negative impact on self-esteem and self-efficacy. People talked about being hesitant to tell other people about their diagnosis, feeling that they’re ashamed of having narcolepsy. They felt less capable. One person said, ‘I get tired trying to explain why I’m tired.’”
Another common theme that emerged was the challenge of optimal treatment for their narcolepsy. Most patients met with sleep doctors or clinics every 3-6 months. “They said that this was generally good for discussing medications and symptom management, but there didn’t seem to be much time to talk about psychosocial aspects,” Dr. Ong said. “That seemed to be one area of need. There was also a strong dissatisfaction with mental health providers. People talked about how their mental health provider really didn’t understand narcolepsy. It did seem to reduce rapport and the ability to trust their therapist. Some talked about the challenges of accessibility. In some cases, people said their narcolepsy symptoms created challenges with appointment attendance.”
In terms of preferences for a psychosocial intervention, respondents generally “preferred some kind of online or Internet delivery,” he said. “They prefer a team approach with a clinician who’s knowledgeable about both sleep and mental health.”
Dr. Ong acknowledged certain limitations of the study, including its small sample size and the fact that it was not adequately powered to detect differences between type 1 and type 2 narcolepsy.
The study was funded by a grant from Wake Up Narcolepsy. Dr. Ong reported having no relevant financial disclosures.
SOURCE: Ong J et al., SLEEP 2019, abstract 0624.
SAN ANTONIO – Narcolepsy adversely impacts one’s health-related quality of life in a variety of ways, from elevated levels of depression to negative social stigma, results from a mixed methods study suggest.
“Despite established pharmacological treatments to reduce narcolepsy symptoms, health-related quality of life remains poor,” the study’s first author, Jason C. Ong, PhD, said at the annual meeting of the Associated Professional Sleep Societies. “The impact these symptoms have on functioning, the disease burden, and psychosocial functioning in particular is very important. Psychosocial functioning is particularly poor.”
Previous research has shown that people with narcolepsy have two- to four times the rate of psychiatric comorbidities and that health-related stigma is a predictor of depression and poor functioning, said Dr. Ong, a psychologist with the Center for Circadian and Sleep Medicine at the Northwestern University Feinberg School of Medicine, Chicago. In an effort to assess current practices for addressing the psychosocial needs of persons with narcolepsy and to identify potential strategies that could be used to develop a psychosocial intervention, he and his associates conducted a mixed methods study to examine how narcolepsy symptoms impact health-related quality of life and the appropriateness of different health-related quality of life measures for the disorder. “Our long-term goal is to see if we can use this information to help inform the feasibility of a psychosocial intervention to improve health-related quality of life,” he said.
For the study, 29 adults with an established diagnosis of narcolepsy completed online versions of the Patient Health Questionnaire-9 (PHQ-9), the Patient Reported Outcomes Measurement Information System (PROMIS), the 36-item Short Form Survey (SF-36), and the Epworth Sleepiness Scale (ESS). They also participated in a focus group, which consisted of questions pertaining to quality of life for persons with narcolepsy, current practices for addressing psychosocial health of affected individuals, and suggestions for developing a psychosocial intervention. The researchers used thematic analysis to reduce the qualitative data to key themes.
Most of the study participants (93%) were female, 90% were white, their mean age was 31, and their mean time since narcolepsy diagnosis was 4.3 years. Clinically significant elevations on the PROMIS scale, defined as a t-score of greater than 60, were reported for depression (t-score of 64.8), anxiety (66.3), fatigue (68.3), and sleep impairment (66.9). Elevations in depressive symptoms were reported on the PHQ-9 (a mean of 15.79), “which corresponds to moderately severe levels,” Dr. Ong said. “The ESS was highly elevated and fit well with the scales for sleep impairment as well as fatigue on the PROMIS. Overall, there was nice congruence across these measures.”
On the SF-36, the researchers observed that there were deficits in physical and emotional aspects of role limitations, and in energy/fatigue. “One thing we did find was a significant difference in general functioning, where patients with type 1 narcolepsy were worse off than those with type 2 narcolepsy (P less than .05).”
Qualitative data from focus groups revealed several key themes, including the perception that narcolepsy is poorly understood by the public and health care providers.
“People have the perception that if you have narcolepsy, you just feel fine and then you fall asleep,” Dr. Ong said. “They don’t understand that it’s a constant thing. Negative social stigma was also common. As a result, we found a lot of negative impact on self-esteem and self-efficacy. People talked about being hesitant to tell other people about their diagnosis, feeling that they’re ashamed of having narcolepsy. They felt less capable. One person said, ‘I get tired trying to explain why I’m tired.’”
Another common theme that emerged was the challenge of optimal treatment for their narcolepsy. Most patients met with sleep doctors or clinics every 3-6 months. “They said that this was generally good for discussing medications and symptom management, but there didn’t seem to be much time to talk about psychosocial aspects,” Dr. Ong said. “That seemed to be one area of need. There was also a strong dissatisfaction with mental health providers. People talked about how their mental health provider really didn’t understand narcolepsy. It did seem to reduce rapport and the ability to trust their therapist. Some talked about the challenges of accessibility. In some cases, people said their narcolepsy symptoms created challenges with appointment attendance.”
In terms of preferences for a psychosocial intervention, respondents generally “preferred some kind of online or Internet delivery,” he said. “They prefer a team approach with a clinician who’s knowledgeable about both sleep and mental health.”
Dr. Ong acknowledged certain limitations of the study, including its small sample size and the fact that it was not adequately powered to detect differences between type 1 and type 2 narcolepsy.
The study was funded by a grant from Wake Up Narcolepsy. Dr. Ong reported having no relevant financial disclosures.
SOURCE: Ong J et al., SLEEP 2019, abstract 0624.
REPORTING FROM SLEEP 2019
Subset of patients benefits from in-hospital sleep apnea screening
SAN ANTONIO – In the clinical opinion of Richard J. Schwab, MD,
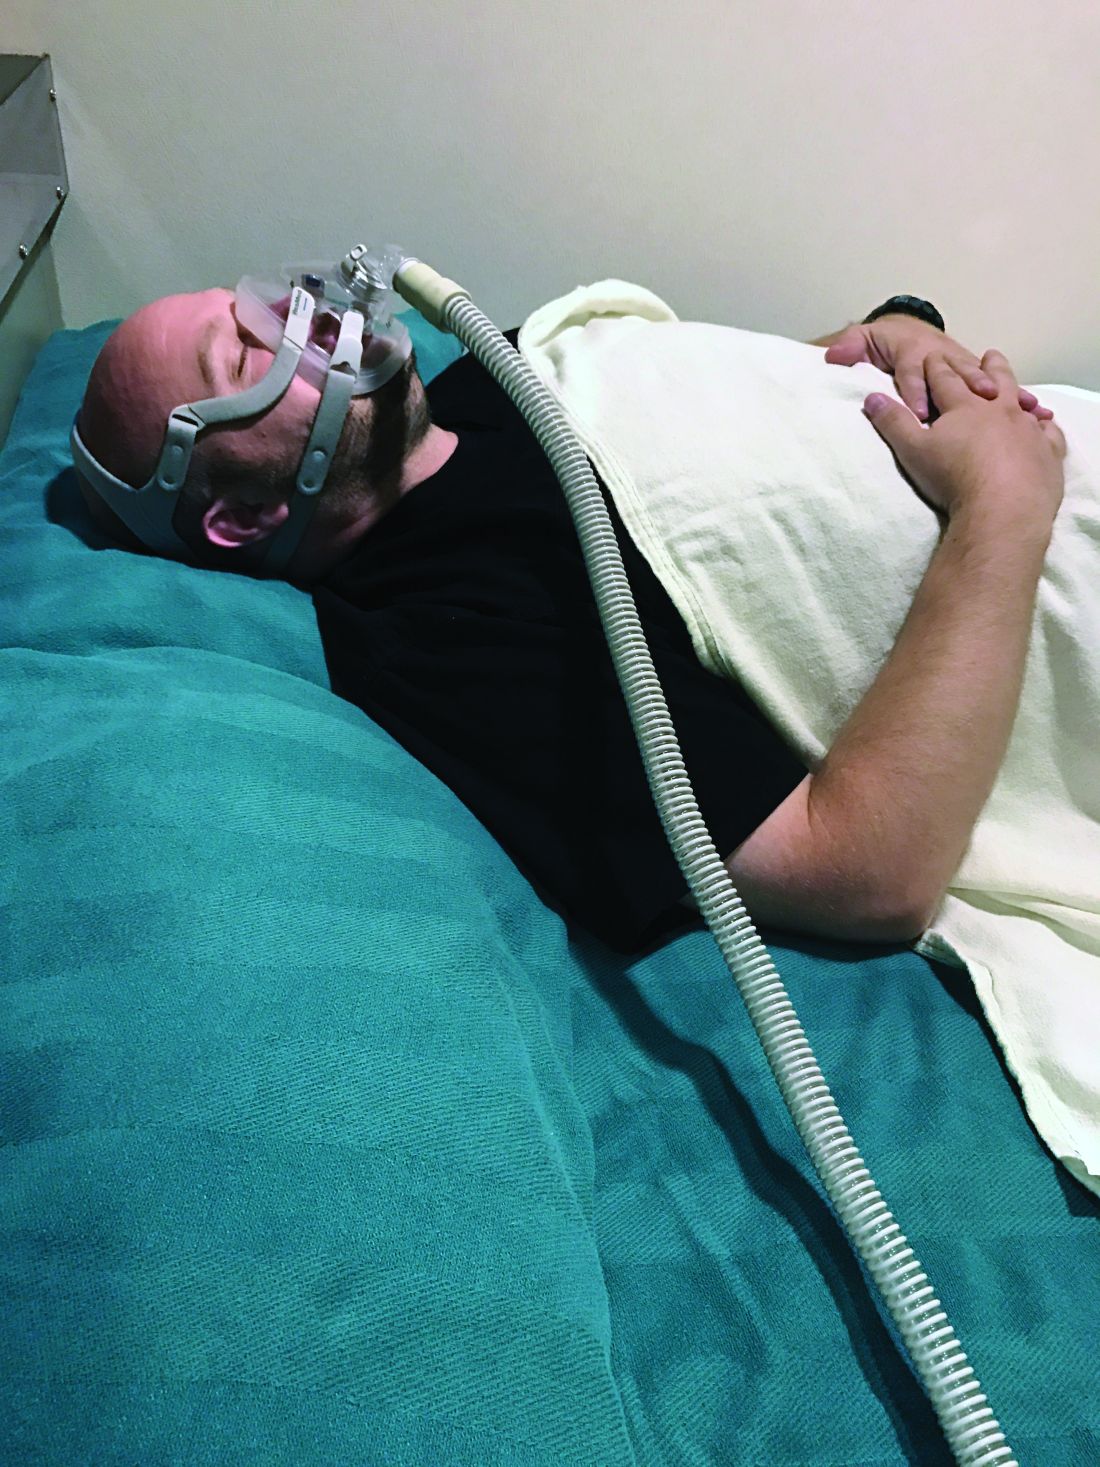
“Many diseases are adversely affected by sleep apnea, including myocardial infarction, hypertension, a cerebrovascular accident, pulmonary hypertension, atrial fibrillation, diabetes, and congestive heart failure,” Dr. Schwab, interim chief of the University of Pennsylvania Perelman School of Medicine’s Division of Sleep Medicine, said at the annual meeting of the Associated Professional Sleep Societies.
“Continuous positive airway pressure [CPAP] may help heart failure patients and reduce 30-day readmission rates, which has important financial implications in the University of Pennsylvania Health system. CPAP may also decrease the rapid responses and cardiac arrests at night,” he said.
A few years ago, Dr. Schwab and his associates set out to determine whether PAP adherence in cardiac patients with sleep-disordered breathing reduced readmission rates 30 days after discharge (J Clin Sleep Med. 2014;10:1051-59). They evaluated 104 consecutive cardiovascular hospitalized patients reporting symptoms of sleep-disordered breathing (SDB) between January of 2012 and March of 2013, and collected demographic data, SDB type, PAP adherence, and data regarding 30-day hospital readmission/ED visits. Apnea was scored when there was a 90% or greater cessation of airflow detected through the nasal pressure sensor. Hypopnea was scored when there was at least a 50% reduction in airflow with an associated 3% or greater oxyhemoglobin desaturation. Central apnea (CSA) was scored when there was a 90% or greater cessation of airflow detected through the nasal pressure sensor and no effort in the thorax and abdomen. If more than 50% of the apneas were central, the SDB was classified as CSA. If more than 50% of apneas were obstructive in nature, it was considered obstructive sleep apnea (OSA).
The mean age of the patients was 59 years, 63% were male, their mean body mass index was 34 kg/m2, 87% had heart failure, and 82% had hypertension. Of the 104 patients, 81 had SDB and 23 did not. The 30-day readmission rate was 29% in patients who did not use PAP, 30% in partial users, and 0% in full users (P = .0246).
The researchers found that 81 patients (78%) had sleep disordered breathing. Of these, 65 (80%) had OSA while 16 (20%) had CSA. The study demonstrated that performing inpatient sleep studies was feasible. “Our study indicated that SDB is common in hospitalized cardiac patients, with the majority of patients manifesting OSA,” said Dr. Schwab, medical director of the Penn Sleep Centers. “The data suggest that hospital readmission and ED visits 30 days after discharge were significantly lower in patients with cardiac disease and SDB who adhere to PAP treatment than those who are not adherent.”
Dr. Schwab is part of a research team conducting a longer study with ResMed to examine 30-, 60-, and 90-day readmission rates in cardiac inpatients newly diagnosed with OSA and started on auto-PAP (APAP). They plan to evaluate the ejection fraction during hospitalization and in follow-up, as well as the effect of an in-laboratory sleep study at 1 month. The long-term follow-up is planned for 3 years.
Launching an inpatient sleep apnea consult service in the hospital makes sense, Dr. Schwab continued, because home sleep studies are approved for the diagnosis of sleep apnea, APAP can determine optimal CPAP settings, insurance will cover CPAP with a home or inpatient sleep study, and patients can get CPAP/APAP at or before discharge. “Sleep techs or respiratory therapists can perform these sleep studies,” he said. At Penn, a nurse practitioner (NP) runs this service using the Alice NightOne home sleep testing device and the WatchPAT portable sleep apnea diagnostic device.
The notion of performing in-hospital sleep studies should be an easy sell to cardiologists and hospital administrators, Dr. Schwab said, because the program will decrease hospital readmissions, “which is going to save the hospital a lot of money. In addition, these patients can come back for in-laboratory sleep studies. There is also increased revenue from the consults and progress notes, and the professional fee for sleep study interpretation. The most challenging part of the inpatient sleep consult service is trying to get these patients to follow up in the sleep center with the NP.”
Dr. Schwab is an investigator for the recently launched Penn Medicine Nudge Unit Project, which is funded by the National Institutes of Health. The project includes a multidisciplinary team of providers from the Hospital of the University of Pennsylvania, Penn Presbyterian Medical Center, and Penn Medicine Risk Management. If an inpatient has a BMI of 35 kg/m2 or greater, the clinician will be “nudged” via an enterprise messaging system (EMS) prompt to order an inpatient sleep oximetry. “They have to respond to that nudge,” Dr. Schwab said. “If the oximetry is consistent for sleep apnea, there will be another nudge to consult with the sleep medicine team. If the oximetry is negative, they will be nudged to get an outpatient consult with the sleep medicine team.” For patients undergoing preadmission testing for any type of surgery who score 4 or more on the STOP-Bang questionnaire (Chest 2016;149:631-38), the clinician is “nudged” to order an outpatient sleep consultation.
Benefits to such an approach, he said, include a decrease in resource allocation, shorter hospital stays, patient perceived improvement in quality of sleep, improved patient survey scores, and the fact that apnea treatment may decrease the need for rapid response. “It also reduces medical-legal concerns, improves patient outcomes, decreases readmissions, and generates revenue from inpatient and outpatient sleep studies,” Dr. Schwab said. Barriers to such an approach include the fact that there is no defined pathway at many institutions for recognizing and referring suspected OSA patients. “There is often a lack of care coordination between primary providers and sleep medicine, and sleep is viewed as ambulatory care, not as a part of inpatient care,” he said.
Last year, Dr. Schwab and his colleagues at UPenn conducted a pilot study to develop and test a pathway for identifying OSA in high-risk inpatient and preadmission patient populations. Of 389 patients admitted between Aug. 20 and Sept. 20 of 2018, 43 had a BMI of 35 kg/m2 or greater. Of these, 10 were screened with oximetry and 8 were positive for severe apnea. Of these eight cases, five inpatient consults were ordered, one outpatient consult was ordered, one patient had no consult ordered, and one patient was discharged before the consult was ordered.
Dr. Schwab also performed a pilot study in patients undergoing preoperative testing with the STOP-Bang questionnaire. “When we piloted this, there were over 200 patients who could have been sent to the outpatient sleep consult service, and we referred none,” Dr. Schwab said. “We are just starting to implement a program to screen them. We can treat these people for their sleep apnea and prevent chronic adverse sequelae associated with this disease.”
Both the inpatient and outpatient screening programs for sleep apnea are built within their electronic medical record. “Building this within your EMR requires effort, but it’s doable,” he said.
Dr. Schwab disclosed that he has received grants from the National Institutes of Health, ResMed, and Inspire Medical Systems.
SAN ANTONIO – In the clinical opinion of Richard J. Schwab, MD,
“Many diseases are adversely affected by sleep apnea, including myocardial infarction, hypertension, a cerebrovascular accident, pulmonary hypertension, atrial fibrillation, diabetes, and congestive heart failure,” Dr. Schwab, interim chief of the University of Pennsylvania Perelman School of Medicine’s Division of Sleep Medicine, said at the annual meeting of the Associated Professional Sleep Societies.
“Continuous positive airway pressure [CPAP] may help heart failure patients and reduce 30-day readmission rates, which has important financial implications in the University of Pennsylvania Health system. CPAP may also decrease the rapid responses and cardiac arrests at night,” he said.
A few years ago, Dr. Schwab and his associates set out to determine whether PAP adherence in cardiac patients with sleep-disordered breathing reduced readmission rates 30 days after discharge (J Clin Sleep Med. 2014;10:1051-59). They evaluated 104 consecutive cardiovascular hospitalized patients reporting symptoms of sleep-disordered breathing (SDB) between January of 2012 and March of 2013, and collected demographic data, SDB type, PAP adherence, and data regarding 30-day hospital readmission/ED visits. Apnea was scored when there was a 90% or greater cessation of airflow detected through the nasal pressure sensor. Hypopnea was scored when there was at least a 50% reduction in airflow with an associated 3% or greater oxyhemoglobin desaturation. Central apnea (CSA) was scored when there was a 90% or greater cessation of airflow detected through the nasal pressure sensor and no effort in the thorax and abdomen. If more than 50% of the apneas were central, the SDB was classified as CSA. If more than 50% of apneas were obstructive in nature, it was considered obstructive sleep apnea (OSA).
The mean age of the patients was 59 years, 63% were male, their mean body mass index was 34 kg/m2, 87% had heart failure, and 82% had hypertension. Of the 104 patients, 81 had SDB and 23 did not. The 30-day readmission rate was 29% in patients who did not use PAP, 30% in partial users, and 0% in full users (P = .0246).
The researchers found that 81 patients (78%) had sleep disordered breathing. Of these, 65 (80%) had OSA while 16 (20%) had CSA. The study demonstrated that performing inpatient sleep studies was feasible. “Our study indicated that SDB is common in hospitalized cardiac patients, with the majority of patients manifesting OSA,” said Dr. Schwab, medical director of the Penn Sleep Centers. “The data suggest that hospital readmission and ED visits 30 days after discharge were significantly lower in patients with cardiac disease and SDB who adhere to PAP treatment than those who are not adherent.”
Dr. Schwab is part of a research team conducting a longer study with ResMed to examine 30-, 60-, and 90-day readmission rates in cardiac inpatients newly diagnosed with OSA and started on auto-PAP (APAP). They plan to evaluate the ejection fraction during hospitalization and in follow-up, as well as the effect of an in-laboratory sleep study at 1 month. The long-term follow-up is planned for 3 years.
Launching an inpatient sleep apnea consult service in the hospital makes sense, Dr. Schwab continued, because home sleep studies are approved for the diagnosis of sleep apnea, APAP can determine optimal CPAP settings, insurance will cover CPAP with a home or inpatient sleep study, and patients can get CPAP/APAP at or before discharge. “Sleep techs or respiratory therapists can perform these sleep studies,” he said. At Penn, a nurse practitioner (NP) runs this service using the Alice NightOne home sleep testing device and the WatchPAT portable sleep apnea diagnostic device.
The notion of performing in-hospital sleep studies should be an easy sell to cardiologists and hospital administrators, Dr. Schwab said, because the program will decrease hospital readmissions, “which is going to save the hospital a lot of money. In addition, these patients can come back for in-laboratory sleep studies. There is also increased revenue from the consults and progress notes, and the professional fee for sleep study interpretation. The most challenging part of the inpatient sleep consult service is trying to get these patients to follow up in the sleep center with the NP.”
Dr. Schwab is an investigator for the recently launched Penn Medicine Nudge Unit Project, which is funded by the National Institutes of Health. The project includes a multidisciplinary team of providers from the Hospital of the University of Pennsylvania, Penn Presbyterian Medical Center, and Penn Medicine Risk Management. If an inpatient has a BMI of 35 kg/m2 or greater, the clinician will be “nudged” via an enterprise messaging system (EMS) prompt to order an inpatient sleep oximetry. “They have to respond to that nudge,” Dr. Schwab said. “If the oximetry is consistent for sleep apnea, there will be another nudge to consult with the sleep medicine team. If the oximetry is negative, they will be nudged to get an outpatient consult with the sleep medicine team.” For patients undergoing preadmission testing for any type of surgery who score 4 or more on the STOP-Bang questionnaire (Chest 2016;149:631-38), the clinician is “nudged” to order an outpatient sleep consultation.
Benefits to such an approach, he said, include a decrease in resource allocation, shorter hospital stays, patient perceived improvement in quality of sleep, improved patient survey scores, and the fact that apnea treatment may decrease the need for rapid response. “It also reduces medical-legal concerns, improves patient outcomes, decreases readmissions, and generates revenue from inpatient and outpatient sleep studies,” Dr. Schwab said. Barriers to such an approach include the fact that there is no defined pathway at many institutions for recognizing and referring suspected OSA patients. “There is often a lack of care coordination between primary providers and sleep medicine, and sleep is viewed as ambulatory care, not as a part of inpatient care,” he said.
Last year, Dr. Schwab and his colleagues at UPenn conducted a pilot study to develop and test a pathway for identifying OSA in high-risk inpatient and preadmission patient populations. Of 389 patients admitted between Aug. 20 and Sept. 20 of 2018, 43 had a BMI of 35 kg/m2 or greater. Of these, 10 were screened with oximetry and 8 were positive for severe apnea. Of these eight cases, five inpatient consults were ordered, one outpatient consult was ordered, one patient had no consult ordered, and one patient was discharged before the consult was ordered.
Dr. Schwab also performed a pilot study in patients undergoing preoperative testing with the STOP-Bang questionnaire. “When we piloted this, there were over 200 patients who could have been sent to the outpatient sleep consult service, and we referred none,” Dr. Schwab said. “We are just starting to implement a program to screen them. We can treat these people for their sleep apnea and prevent chronic adverse sequelae associated with this disease.”
Both the inpatient and outpatient screening programs for sleep apnea are built within their electronic medical record. “Building this within your EMR requires effort, but it’s doable,” he said.
Dr. Schwab disclosed that he has received grants from the National Institutes of Health, ResMed, and Inspire Medical Systems.
EXPERT ANALYSIS FROM SLEEP 2019
Briefest flash of light can alter the human circadian system
SAN ANTONIO –

“This becomes a complementary way to help people with various kinds of circadian phase disorders,” the study’s first author, Jamie M. Zeitzer, PhD, said during an interview at the annual meeting of the Associated Professional Sleep Societies. “Right now under ideal laboratory circumstances, you can change someone’s circadian timing by about 3 hours. That’s not happening in the real world; that’s what you do in a lab. That’s with very bright light for 6 hours and very dim light the rest of the time.”
In an effort to build on previous literature related to circadian phase shifting and continuous light exposure in rodents and in humans, Dr. Zeitzer, of the department of psychiatry and behavioral sciences at Stanford (Calif.) University, and colleagues enrolled 56 healthy young men and women in their 20s and 30s to take part in two parallel 16-day studies. For the first 14 days, study participants maintained a regular sleep/wake cycle at home as confirmed through actigraphy and sleep logs. They spent the final 2 days in a specialized time-isolation laboratory, during which the phase of the circadian pacemaker (salivary melatonin onset) was determined in constant routine conditions on evening one and two; light exposure occurred between these two phase determinations on night one.
Light exposure consisted of 1 hour of a sequence of light flashes delivered through a pair of modified welding goggles during enforced wake starting 2 hours after habitual bedtime. Flashes were presented every 15 seconds and varied either by duration (from 10 microseconds to 10 seconds at a fixed intensity of 2,200 lux) or intensity (a range between 3 and 9,500 lux, with a duration fixed at 2 milliseconds).
Dr. Zeitzer and colleagues observed no significant difference in the phase shift created between flashes that were given at 10 microseconds and flashes that were given at 10 seconds. “That’s a six-log unit variation,” he said during a presentation of the results at the meeting. “There are a million times more photons given in 10-second flashes over the hour than there are in the 10-microsecond flashes. Despite the fact that there are a million more photons, you get the exact same phase shift in both of these conditions. You need very little light in order to generate these phase shifts. You’re talking about less than 1 second of light stretched out over 1 hour.”
The researchers also observed that flash intensity showed a sigmoidal relationship with phase shifting, with a half-maximal shift observed at 8 lux and 90% of the maximal shift occurring after exposure to flashes as dim as 50 lux. None of the flash sequences caused acute suppression of melatonin.
“We did not anticipate the invariance, that anything from 10 microseconds to 10 seconds gives us no difference [in phase shifting],” Dr. Zeitzer said. “That was surprising. I thought that more light would be slightly less effective in terms of photons but still give a bigger [phase] shift, but that didn’t happen. In the intensity response, we see things are more sensitive to light flashes than they are to continuous light, which is also surprising. It implies that a different part of the eye is responding to light flashes than it is to continuous light. It provides more information about how to minimize the amount of light we’re using and maximize the amount of shift.”
Which photoreceptors underlie the responses remains unclear, he continued, “but given the characteristics of photoreceptors, our hypothesis is that flashes are being mediated through a cone cell response, while the response to continuous light is being primarily mediated through a melanopsin response. A future question we plan to investigate is, can selective sequential simultaneous activation of different photoreceptors create enhanced phase shifts?”
The study was supported by the Department of Defense. Dr. Zeitzer reported having no financial disclosures.
SAN ANTONIO –
“This becomes a complementary way to help people with various kinds of circadian phase disorders,” the study’s first author, Jamie M. Zeitzer, PhD, said during an interview at the annual meeting of the Associated Professional Sleep Societies. “Right now under ideal laboratory circumstances, you can change someone’s circadian timing by about 3 hours. That’s not happening in the real world; that’s what you do in a lab. That’s with very bright light for 6 hours and very dim light the rest of the time.”
In an effort to build on previous literature related to circadian phase shifting and continuous light exposure in rodents and in humans, Dr. Zeitzer, of the department of psychiatry and behavioral sciences at Stanford (Calif.) University, and colleagues enrolled 56 healthy young men and women in their 20s and 30s to take part in two parallel 16-day studies. For the first 14 days, study participants maintained a regular sleep/wake cycle at home as confirmed through actigraphy and sleep logs. They spent the final 2 days in a specialized time-isolation laboratory, during which the phase of the circadian pacemaker (salivary melatonin onset) was determined in constant routine conditions on evening one and two; light exposure occurred between these two phase determinations on night one.
Light exposure consisted of 1 hour of a sequence of light flashes delivered through a pair of modified welding goggles during enforced wake starting 2 hours after habitual bedtime. Flashes were presented every 15 seconds and varied either by duration (from 10 microseconds to 10 seconds at a fixed intensity of 2,200 lux) or intensity (a range between 3 and 9,500 lux, with a duration fixed at 2 milliseconds).
Dr. Zeitzer and colleagues observed no significant difference in the phase shift created between flashes that were given at 10 microseconds and flashes that were given at 10 seconds. “That’s a six-log unit variation,” he said during a presentation of the results at the meeting. “There are a million times more photons given in 10-second flashes over the hour than there are in the 10-microsecond flashes. Despite the fact that there are a million more photons, you get the exact same phase shift in both of these conditions. You need very little light in order to generate these phase shifts. You’re talking about less than 1 second of light stretched out over 1 hour.”
The researchers also observed that flash intensity showed a sigmoidal relationship with phase shifting, with a half-maximal shift observed at 8 lux and 90% of the maximal shift occurring after exposure to flashes as dim as 50 lux. None of the flash sequences caused acute suppression of melatonin.
“We did not anticipate the invariance, that anything from 10 microseconds to 10 seconds gives us no difference [in phase shifting],” Dr. Zeitzer said. “That was surprising. I thought that more light would be slightly less effective in terms of photons but still give a bigger [phase] shift, but that didn’t happen. In the intensity response, we see things are more sensitive to light flashes than they are to continuous light, which is also surprising. It implies that a different part of the eye is responding to light flashes than it is to continuous light. It provides more information about how to minimize the amount of light we’re using and maximize the amount of shift.”
Which photoreceptors underlie the responses remains unclear, he continued, “but given the characteristics of photoreceptors, our hypothesis is that flashes are being mediated through a cone cell response, while the response to continuous light is being primarily mediated through a melanopsin response. A future question we plan to investigate is, can selective sequential simultaneous activation of different photoreceptors create enhanced phase shifts?”
The study was supported by the Department of Defense. Dr. Zeitzer reported having no financial disclosures.
REPORTING FROM SLEEP 2019
Key clinical point: When distributed as flashes, the human circadian system can be phase shifted by extraordinarily brief and dim light.
Major finding: The researchers observed no significant difference in the phase shift created between flashes that were given at 10 microseconds and flashes that were given at 10 seconds.
Study details: Two parallel 16-day studies involving 56 healthy men and women in their 20s and 30s.
Disclosures: The study was supported by the Department of Defense. Dr. Zeitzer reported having no financial disclosures.
Sleep quality linked to gut microbiome biodiversity
SAN ANTONIO – , according to results from a population sample of adults.
“These findings are preliminary and very early in the growth of this field,” lead study author Erika W. Hagen, PhD, said during an interview at the annual meeting of the Associated Professional Sleep Societies
According to Dr. Hagen, an epidemiologist at the University of Wisconsin–Madison, experimental studies in mice have shown that disturbed sleep is associated with gut microbiota composition, and a few small experimental studies in humans have found associations between curtailed sleep and measures of gut microbiota richness and diversity.
In an effort to examine associations of subjectively and objectively assessed sleep metrics with indices of gut microbiome richness and diversity, Dr. Hagen and colleagues assessed 482 individuals who participated in the Survey of the Health of Wisconsin and completed in-home study visits in 2016. They provided fecal samples, participated in a week-long wrist actigraphy protocol to measure sleep, and completed questionnaires about sleep, diet, and other health and sociodemographic factors, and an assessment of physical activity by waist-worn actigraphy.
Metrics of species richness included the Chao1 and the ACE, which estimate the number of species. Metrics of the diversity of the gut microbiome included the Inverse Simpson index and the Shannon index. All metrics were regressed on self-reported sleep duration, extreme daytime sleepiness, the Epworth Sleepiness Scale (ESS), and actigraphy-measured sleep duration and wake after sleep onset (WASO). Next, the researchers estimated associations between each of the sleep and diversity measures separately, adjusting for age and sex and then additionally adjusting for body mass index, moderate-vigorous physical activity, and dietary fat and fiber.
The mean age of the 482 subjects was 56 years, 57% were female, and the mean body mass index was 30 kg/m2. After the researchers adjusted for gender and age, they found that greater WASO was statistically significantly associated with lower richness and alpha diversity (P less than .05). These associations remained significant on the Chao1 measure and borderline significant on the ACE and Shannon measures after further adjustment for BMI, physical activity, and dietary fiber and fat. For example, 60 minutes greater WASO was associated with an approximate 26% population standard deviation reduction in microbial richness as measured by Chao1. In fully-adjusted models, greater daytime sleepiness was associated with lower richness and diversity on all indices (P = .01-.06). The ESS and sleep duration were not associated with microbiota richness or diversity.
“Our results suggest that sleep quality is associated with gut microbiome richness and diversity,” Dr. Hagen said. “Our results are in line with other research on this topic. What’s interesting is how your sleep over a period of time is affecting these measures of your microbiome. That’s something people can do something about with [eating] habits over time. What would be great is to collect longitudinal data so that you could characterize sleep over a longer period of time, but also so you could measure the microbiome at different time points to see what’s changing with changes in sleep. That would be interesting to untangle.”
She acknowledged certain limitations of the study, including the small sample size and the cross-sectional design. The study was supported by the University of Wisconsin School of Medicine and Public Health through the Wisconsin Partnership Program.
SOURCE: Hagen EW et al. SLEEP 2019, Abstract 0106.
REPORTING FROM SLEEP 2019
Key clinical point: Better quality of sleep, but not duration of sleep, was associated with greater species richness and diversity of the gut microbiome.
Major finding: In fully adjusted models, greater daytime sleepiness was associated with lower richness and diversity of the gut microbiome on all indices (P = .01-.06).
Study details: An assessment of 482 individuals who participated in the Survey of the Health of Wisconsin.
Disclosures: The study was supported by the University of Wisconsin School of Medicine and Public Health through the Wisconsin Partnership Program.
Source: Hagen EW et al. SLEEP 2019, Abstract 0106.
Mortality risk from mild to moderate OSA modified by age
SAN ANTONIO – , results from a large longitudinal analysis showed.

“The association between severe OSA and significant morbidity and mortality – particularly cardiovascular in nature – is well established,” the study’s first author, Alexandros N. Vgontzas, MD, said at the annual meeting of the Associated Professional Sleep Societies. “In contrast, mild to moderate OSA is highly prevalent in the general population but its association with morbidity and mortality is not well established.”
In an effort to examine the association between mild to moderate OSA and all-cause mortality, Dr. Vgontzas and colleagues drew from the Penn State Adult Cohort, a random general population sample of 1,741 men and women who were studied in the sleep lab with an 8-hour polysomnography at baseline and followed for a mean of 19.2 years for all-cause mortality.
The researchers retrieved mortality data from the Centers for Disease Control and Prevention’s National Death Index and defined mild OSA as an apnea/hypopnea index (AHI) of 5-14.9 events per hour, while moderate OSA was defined as an AHI of 15-29.9 events per hour. They used Cox proportional hazards regression to estimate all-cause mortality and adjusted for race, sex, body mass index, smoking, hypertension, diabetes, heart problems, and stroke.
Dr. Vgontzas, of the Sleep Research and Treatment Center at Penn State University, Hershey, Pa., reported that 596 individuals have died since the study began. On adjusted analysis, patients with an AHI between 5 and 29 were 1.28 times as likely to die overall (P = .019). The researchers found that the association with mortality was stronger among patients younger than age 60, compared with those aged 60 and older. The hazard ratio was 1.44 for study participants younger than age 60 (P = .027), and 1.14 for those aged 60 and older (P = .34).
“Mild to moderate sleep apnea is associated with significant all-cause mortality risk, but the strength of the association decreases markedly with age,” Dr. Vgontzas concluded. “These findings are in line with previous findings that the association of mild to moderate OSA with cardiometabolic risk is modified by age and suggests that OSA in older adults is a distinctly different phenotype than in the young and middle-aged.”
The explanation for the association remains unclear. “Is it because the people of older age have some kind of genetic protection, or is because their sleep apnea is milder?” he asked. “We don’t have the data to tell.”
Dr. Vgontzas reported having no financial disclosures.
SOURCE: Vgontzas A et al. SLEEP 2019, abstract 0504.
SAN ANTONIO – , results from a large longitudinal analysis showed.
“The association between severe OSA and significant morbidity and mortality – particularly cardiovascular in nature – is well established,” the study’s first author, Alexandros N. Vgontzas, MD, said at the annual meeting of the Associated Professional Sleep Societies. “In contrast, mild to moderate OSA is highly prevalent in the general population but its association with morbidity and mortality is not well established.”
In an effort to examine the association between mild to moderate OSA and all-cause mortality, Dr. Vgontzas and colleagues drew from the Penn State Adult Cohort, a random general population sample of 1,741 men and women who were studied in the sleep lab with an 8-hour polysomnography at baseline and followed for a mean of 19.2 years for all-cause mortality.
The researchers retrieved mortality data from the Centers for Disease Control and Prevention’s National Death Index and defined mild OSA as an apnea/hypopnea index (AHI) of 5-14.9 events per hour, while moderate OSA was defined as an AHI of 15-29.9 events per hour. They used Cox proportional hazards regression to estimate all-cause mortality and adjusted for race, sex, body mass index, smoking, hypertension, diabetes, heart problems, and stroke.
Dr. Vgontzas, of the Sleep Research and Treatment Center at Penn State University, Hershey, Pa., reported that 596 individuals have died since the study began. On adjusted analysis, patients with an AHI between 5 and 29 were 1.28 times as likely to die overall (P = .019). The researchers found that the association with mortality was stronger among patients younger than age 60, compared with those aged 60 and older. The hazard ratio was 1.44 for study participants younger than age 60 (P = .027), and 1.14 for those aged 60 and older (P = .34).
“Mild to moderate sleep apnea is associated with significant all-cause mortality risk, but the strength of the association decreases markedly with age,” Dr. Vgontzas concluded. “These findings are in line with previous findings that the association of mild to moderate OSA with cardiometabolic risk is modified by age and suggests that OSA in older adults is a distinctly different phenotype than in the young and middle-aged.”
The explanation for the association remains unclear. “Is it because the people of older age have some kind of genetic protection, or is because their sleep apnea is milder?” he asked. “We don’t have the data to tell.”
Dr. Vgontzas reported having no financial disclosures.
SOURCE: Vgontzas A et al. SLEEP 2019, abstract 0504.
REPORTING FROM SLEEP 2019
Key clinical point: Among adults with mild to moderate obstructive sleep apnea, the risk of mortality is highest among those younger than age 60.
Major finding: The hazard ratio for mortality was 1.44 for study participants younger than age 60 (P = .027), and 1.14 for those aged 60 and older (P = .34).
Study details: An analysis of 1,741 men and women from the Penn State Adult Cohort.
Disclosures: Dr. Vgontzas reported having no financial disclosures.
Source: Vgontzas A et al. SLEEP 2019, Abstract 0504.
Daytime eating schedule found to help with weight management
SAN ANTONIO – In adults of normal weight, a small controlled study has shown that a , independent of caloric intake.

The findings come from an 8-week controlled trial presented at the annual meeting of the Associated Professional Sleep Societies, which set out to examine the impact of a daytime versus delayed eating schedule on body mass, adiposity, and energy homeostasis in adults of normal weight.
“It is best to stop eating as early as possible in the day, and to not eat late at night,” the study’s first author, Namni Goel, PhD, said in an interview at the meeting. “There’s an open question in our field: Should you stop eating at 7:00 p.m.? 8:00 p.m.? My own feeling is, the longer it is between when you stop eating and go to bed, the better off you are metabolically.”
Dr. Goel, associate professor in the division of sleep and chronobiology in the department of psychiatry at the University of Pennsylvania, Philadelphia, and colleagues enrolled 12 healthy adults to participate in a randomized cross-over study in free-living conditions. Three meals and two snacks consisting of comparable energy and macronutrient content were provided during two 8-week counterbalanced phases: 1) daytime eating (food consumed between 8:00 a.m. and 7:00 p.m, and 2) delayed eating (food consumed between 12:00 p.m. and 11:00 p.m. A 2-week washout period occurred between the conditions. “What we wanted to do is just manipulate the timing of eating and we provided all of the meals so we could control the caloric intake,” Dr. Goel said.
The researchers asked participants to maintain a sleep-wake cycle between 11:00 p.m. and 9:00 a.m. (verified by wrist actigraphy) and to limit physical activity. They assessed weight, adiposity, energy metabolism, and hormonal markers during four inpatient visits: 1) baseline; 2) after the first eating condition; 3) after the washout period, before the second eating condition began; and 4) after the second eating condition. They used two-way analysis of variance and Cohen’s d effect sizes to examine changes in anthropometrics and metabolic measures affected by eating schedule (daytime vs. delayed) and time (before vs. after each eating schedule).
The mean age of 12 study participants was 26 years; five were females. Their mean body mass index was 21.9 kg/m2. Dr. Goel reported that participants had excellent adherence to assigned eating schedules, with no differences between the conditions. Weight was decreased on the daytime vs. delayed eating schedule. Specifically, Cohen’s d effect sizes were 0.57 overall: 1.16 for females and 0.33 for males, all in the small to large range. Resting energy expenditure, respiratory quotient, and trunk fat percentage/leg fat percentage were decreased on the daytime vs. delayed eating condition, with Cohen’s d effect sizes of 0.45-1.02, all in the medium to large range. In addition, total cholesterol and insulin were decreased on the daytime eating condition (medium effect sizes of 0.60 and 0.57, respectively), while triglycerides and glucose were increased on the delayed condition (medium effect sizes of 0.46 and 0.52, respectively).
Weight, adiposity, energy metabolism, and hormonal measures did not differ significantly between the pre-daytime and pre-delayed eating conditions, suggesting that they returned to pre-condition levels after the washout period.
“One of the things we’re advocating is that with consistent daytime eating, you can lose weight and/or remain at weight maintenance,” Dr. Goel said. “Consistency is very important. Across 8 weeks, you’re becoming metabolically healthier because you’re not eating that late-night meal or snack. We had shown in previous sleep loss studies that people were eating 500 calories late in the evening on consecutive nights and gaining a substantial amount of weight.”
She and her colleagues are currently enrolling obese individuals into a similarly designed trial, “where we expect much bigger changes metabolically,” she said. The study was funded by a grant from the National Institutes of Health. Dr. Goel reported having no financial disclosures.
SOURCE: Goel N et al. SLEEP 2019, Abstract 0036.
SAN ANTONIO – In adults of normal weight, a small controlled study has shown that a , independent of caloric intake.
The findings come from an 8-week controlled trial presented at the annual meeting of the Associated Professional Sleep Societies, which set out to examine the impact of a daytime versus delayed eating schedule on body mass, adiposity, and energy homeostasis in adults of normal weight.
“It is best to stop eating as early as possible in the day, and to not eat late at night,” the study’s first author, Namni Goel, PhD, said in an interview at the meeting. “There’s an open question in our field: Should you stop eating at 7:00 p.m.? 8:00 p.m.? My own feeling is, the longer it is between when you stop eating and go to bed, the better off you are metabolically.”
Dr. Goel, associate professor in the division of sleep and chronobiology in the department of psychiatry at the University of Pennsylvania, Philadelphia, and colleagues enrolled 12 healthy adults to participate in a randomized cross-over study in free-living conditions. Three meals and two snacks consisting of comparable energy and macronutrient content were provided during two 8-week counterbalanced phases: 1) daytime eating (food consumed between 8:00 a.m. and 7:00 p.m, and 2) delayed eating (food consumed between 12:00 p.m. and 11:00 p.m. A 2-week washout period occurred between the conditions. “What we wanted to do is just manipulate the timing of eating and we provided all of the meals so we could control the caloric intake,” Dr. Goel said.
The researchers asked participants to maintain a sleep-wake cycle between 11:00 p.m. and 9:00 a.m. (verified by wrist actigraphy) and to limit physical activity. They assessed weight, adiposity, energy metabolism, and hormonal markers during four inpatient visits: 1) baseline; 2) after the first eating condition; 3) after the washout period, before the second eating condition began; and 4) after the second eating condition. They used two-way analysis of variance and Cohen’s d effect sizes to examine changes in anthropometrics and metabolic measures affected by eating schedule (daytime vs. delayed) and time (before vs. after each eating schedule).
The mean age of 12 study participants was 26 years; five were females. Their mean body mass index was 21.9 kg/m2. Dr. Goel reported that participants had excellent adherence to assigned eating schedules, with no differences between the conditions. Weight was decreased on the daytime vs. delayed eating schedule. Specifically, Cohen’s d effect sizes were 0.57 overall: 1.16 for females and 0.33 for males, all in the small to large range. Resting energy expenditure, respiratory quotient, and trunk fat percentage/leg fat percentage were decreased on the daytime vs. delayed eating condition, with Cohen’s d effect sizes of 0.45-1.02, all in the medium to large range. In addition, total cholesterol and insulin were decreased on the daytime eating condition (medium effect sizes of 0.60 and 0.57, respectively), while triglycerides and glucose were increased on the delayed condition (medium effect sizes of 0.46 and 0.52, respectively).
Weight, adiposity, energy metabolism, and hormonal measures did not differ significantly between the pre-daytime and pre-delayed eating conditions, suggesting that they returned to pre-condition levels after the washout period.
“One of the things we’re advocating is that with consistent daytime eating, you can lose weight and/or remain at weight maintenance,” Dr. Goel said. “Consistency is very important. Across 8 weeks, you’re becoming metabolically healthier because you’re not eating that late-night meal or snack. We had shown in previous sleep loss studies that people were eating 500 calories late in the evening on consecutive nights and gaining a substantial amount of weight.”
She and her colleagues are currently enrolling obese individuals into a similarly designed trial, “where we expect much bigger changes metabolically,” she said. The study was funded by a grant from the National Institutes of Health. Dr. Goel reported having no financial disclosures.
SOURCE: Goel N et al. SLEEP 2019, Abstract 0036.
REPORTING FROM SLEEP 2019
Key clinical point: A daytime eating schedule is likely beneficial for weight management and metabolic health.
Major finding: Weight was decreased on the daytime vs. delayed eating schedule with Cohen’s d effect of 0.57 overall: 1.16 for females and 0.33 for males, all in the small to large range.
Study details: A randomized trial of 12 healthy adults with normal body weight.
Disclosures: The study was funded by a grant from the National Institutes of Health. Dr. Goel reported having no financial disclosures.
Source: Goel N et al. SLEEP 2019, Abstract 0036.
FDA warns about fecal microbiota for transplantation
Officials at the Food and Drug Administration have issued a safety alert regarding the use of fecal microbiota for transplantation (FMT) and the risk of serious adverse reactions because of transmission of multidrug-resistant organisms (MDROs).

According to the alert, which was issued on June 13, 2019, the agency became aware of two immunocompromised adult patients who received investigational FMT and developed infections caused by extended-spectrum beta-lactamase (EBSL)–producing Escherichia coli. One of the patients died.
“This is certainly a theoretical risk that we’ve known about,” Lea Ann Chen, MD, a gastroenterologist at New York University, said in an interview. “This announcement is important, because we probably don’t counsel patients specifically about this risk. We say there is a risk for transmission of infectious agents in general, but I think that probably very few counsel patients about a risk for transmission of MDROs.”
The donor stool and FMT used in the two patients were not tested for ESBL-producing gram-negative organisms prior to use. As a result of these serious adverse reactions, the FDA has determined that certain donor screening and stool testing protections are needed for any investigational use of FMT. On June 18, the agency released an additional statement, which stipulated that all Investigational New Drug (IND) holders must implement the following new requirements no later than July 15, 2019:
“1. Donor screening must include questions that specifically address risk factors for colonization with MDROs, and individuals at higher risk of colonization with MDROs must be excluded from donation. Examples of persons at higher risk for colonization with MDROs include:
a. Health care workers
b. Persons who have recently been hospitalized or discharged from long-term care facilities
c. Persons who regularly attend outpatient medical or surgical clinics
d. Persons who have recently engaged in medical tourism
2. FMT donor stool testing must include MDRO testing to exclude use of stool that tests positive for MDRO. The MDRO tests should at minimum include extended spectrum beta-lactamase (ESBL)-producing Enterobacteriaceae, vancomycin-resistant enterococci (VRE), carbapenem-resistant Enterobacteriaceae (CRE), and methicillin-resistant Staphylococcus aureus (MRSA). Culture of nasal or perirectal swabs is an acceptable alternative to stool testing for MRSA only. Bookend testing (no more than 60 days apart) before and after multiple stool donations is acceptable if stool samples are quarantined until the post-donation MDRO tests are confirmed negative.
3. All FMT products currently in storage for which the donor has not undergone screening and stool testing for MDROs as described above must be placed in quarantine until such time as the donor is confirmed to be not at increased risk of MDRO carriage and the FMT products have been tested and found negative. In the case of FMT products manufactured using pooled donations from a single donor, stored samples of the individual donations prior to pooling must be tested before the FMT products can be administered to subjects.
4.The informed consent process for subjects being treated with FMT product under your IND going forward should describe the risks of MDRO transmission and invasive infection as well as the measures implemented for donor screening and stool testing.”
On June 14, the American Gastroenterological Association sent a communication about the FDA alert to its members, which stated that the AGA “is committed to advancing applications of the gut microbiome. Our top priority is ensuring patient safety from microbiome-based therapeutics, such as FMT. Through the AGA FMT National Registry, AGA is working with physicians and patients to track FMT usage, patient outcomes and adverse events. Associated with the registry is a biorepository of donor and patient stool samples, which will allow further investigation of unexpected events such as those described in FDA’s safety alert.”
Dr. Chen, who received the AGA Research Foundation’s 2016 Research Scholar Award for her work on the gut microbiome and inflammatory bowel disease, pointed out that FMT has also been studied as a way to prevent colonization and infection with certain drug resistant organisms, such as VRE.
“Therefore, it’s not that FMT is ‘bad;’ we just have to be more diligent about optimizing the safety of the procedure by screening for of multidrug-resistant organisms,” she said. “We also need to study the use of FMT more, so that we can fully understand the risks associated with the procedure. It’s an important and potentially lifesaving procedure for some, but it’s important that everyone go into the procedure understanding fully what the risks and benefits are.”
Suspected adverse events related to the administration of FMT products can be reported to the FDA at 1-800-332-1088 or via MedWatch.
Officials at the Food and Drug Administration have issued a safety alert regarding the use of fecal microbiota for transplantation (FMT) and the risk of serious adverse reactions because of transmission of multidrug-resistant organisms (MDROs).
According to the alert, which was issued on June 13, 2019, the agency became aware of two immunocompromised adult patients who received investigational FMT and developed infections caused by extended-spectrum beta-lactamase (EBSL)–producing Escherichia coli. One of the patients died.
“This is certainly a theoretical risk that we’ve known about,” Lea Ann Chen, MD, a gastroenterologist at New York University, said in an interview. “This announcement is important, because we probably don’t counsel patients specifically about this risk. We say there is a risk for transmission of infectious agents in general, but I think that probably very few counsel patients about a risk for transmission of MDROs.”
The donor stool and FMT used in the two patients were not tested for ESBL-producing gram-negative organisms prior to use. As a result of these serious adverse reactions, the FDA has determined that certain donor screening and stool testing protections are needed for any investigational use of FMT. On June 18, the agency released an additional statement, which stipulated that all Investigational New Drug (IND) holders must implement the following new requirements no later than July 15, 2019:
“1. Donor screening must include questions that specifically address risk factors for colonization with MDROs, and individuals at higher risk of colonization with MDROs must be excluded from donation. Examples of persons at higher risk for colonization with MDROs include:
a. Health care workers
b. Persons who have recently been hospitalized or discharged from long-term care facilities
c. Persons who regularly attend outpatient medical or surgical clinics
d. Persons who have recently engaged in medical tourism
2. FMT donor stool testing must include MDRO testing to exclude use of stool that tests positive for MDRO. The MDRO tests should at minimum include extended spectrum beta-lactamase (ESBL)-producing Enterobacteriaceae, vancomycin-resistant enterococci (VRE), carbapenem-resistant Enterobacteriaceae (CRE), and methicillin-resistant Staphylococcus aureus (MRSA). Culture of nasal or perirectal swabs is an acceptable alternative to stool testing for MRSA only. Bookend testing (no more than 60 days apart) before and after multiple stool donations is acceptable if stool samples are quarantined until the post-donation MDRO tests are confirmed negative.
3. All FMT products currently in storage for which the donor has not undergone screening and stool testing for MDROs as described above must be placed in quarantine until such time as the donor is confirmed to be not at increased risk of MDRO carriage and the FMT products have been tested and found negative. In the case of FMT products manufactured using pooled donations from a single donor, stored samples of the individual donations prior to pooling must be tested before the FMT products can be administered to subjects.
4.The informed consent process for subjects being treated with FMT product under your IND going forward should describe the risks of MDRO transmission and invasive infection as well as the measures implemented for donor screening and stool testing.”
On June 14, the American Gastroenterological Association sent a communication about the FDA alert to its members, which stated that the AGA “is committed to advancing applications of the gut microbiome. Our top priority is ensuring patient safety from microbiome-based therapeutics, such as FMT. Through the AGA FMT National Registry, AGA is working with physicians and patients to track FMT usage, patient outcomes and adverse events. Associated with the registry is a biorepository of donor and patient stool samples, which will allow further investigation of unexpected events such as those described in FDA’s safety alert.”
Dr. Chen, who received the AGA Research Foundation’s 2016 Research Scholar Award for her work on the gut microbiome and inflammatory bowel disease, pointed out that FMT has also been studied as a way to prevent colonization and infection with certain drug resistant organisms, such as VRE.
“Therefore, it’s not that FMT is ‘bad;’ we just have to be more diligent about optimizing the safety of the procedure by screening for of multidrug-resistant organisms,” she said. “We also need to study the use of FMT more, so that we can fully understand the risks associated with the procedure. It’s an important and potentially lifesaving procedure for some, but it’s important that everyone go into the procedure understanding fully what the risks and benefits are.”
Suspected adverse events related to the administration of FMT products can be reported to the FDA at 1-800-332-1088 or via MedWatch.
Rivaroxaban tied to higher GI bleeding than other NOACs
SAN DIEGO – Patients on rivaroxaban had significantly higher rates of GI bleeding, compared with those taking apixaban or dabigatran, results from a large population-based study showed.

“This may be due to the fact that rivaroxaban is administered as a single daily dose as opposed to the other two non–vitamin K anticoagulants [NOACs], which are given twice daily,” lead study author Arnar B. Ingason said at the annual Digestive Disease Week. “This may lead to a greater variance in plasma drug concentration, making these patients more susceptible to bleeding.”
Mr. Ingason, a medical student at the University of Iceland, Reykjavik, said that although several studies have compared warfarin with NOACs, it remains unclear which NOAC has the most favorable GI profile. In an effort to improve the research in this area, he and his associates performed a nationwide, population-based study during March 2014–Jan. 2018 to compare the GI bleeding risk of patients receiving rivaroxaban to that of a combined pool of patients receiving either apixaban or dabigatran. They drew from the Icelandic Medicine Registry, which contains all outpatient drug prescriptions in the country. Next, the researchers linked the personal identification numbers of patients to the Landspitali University diagnoses registry, which includes more than 90% of all patients hospitalized for GI bleeding. They used 1:1 nearest neighbor propensity score for matching and Kaplan-Meier survival estimates and Cox regression to compare rates of GI bleeding. The study outcome of interest was any clinically relevant GI bleeding.
Mr. Ingason reported that the baseline characteristics were similar between the rivaroxaban group and the apixaban/dabigatran group. They matched for several variables, including age, sex, Charlson score, the proportion being anticoagulant naive, moderate to severe renal disease, moderate to severe liver disease, any prior bleeding, and any prior thrombotic events.
During the study period, 3,473 patients received rivaroxaban, 1,901 received apixaban, and 1,086 received dabigatran. After propensity score matching, the researchers compared 2,635 patients who received rivaroxaban with 2,365 patients who received either apixaban or dabigatran. They found that patients in the rivaroxaban group had significantly higher rates of GI bleeding, compared with in the apixaban/dabigatran group (1.2 and. 0.6 events per 100 patient-years, respectively). This yielded a hazard ratio of 2.02, “which means that patients receiving rivaroxaban are twice as likely to get GI bleeding compared to patients on apixaban or dabigatran,” Mr. Ingason said. When the researchers examined the entire unmatched cohort of patients, the rivaroxaban group also had significantly higher rates of GI bleeding, compared with the apixaban/dabigatran group (1.0 and 0.6 events per 100 patient-years; HR, 1.75).
Mr. Ingason and his colleagues observed that patients in the rivaroxaban group had higher rates of GI bleeding, compared with the apixaban/dabigatran group, during the entire follow-up period. At the end of year 4, the rivaroxaban group had a 4% cumulative event rate of GI bleeding, compared with 1.8% for the apixaban/dabigatran group, a highly significant difference at P = .0057).
When a meeting attendee asked Mr. Ingason why patients taking apixaban or dabigatran were combined into one group, he said that it was done to increase the power of their study. “Our theory was that rivaroxaban was different because it is administered as a single daily dose, while the others are given twice daily,” he said. The researchers reported having no financial disclosures.
SAN DIEGO – Patients on rivaroxaban had significantly higher rates of GI bleeding, compared with those taking apixaban or dabigatran, results from a large population-based study showed.
“This may be due to the fact that rivaroxaban is administered as a single daily dose as opposed to the other two non–vitamin K anticoagulants [NOACs], which are given twice daily,” lead study author Arnar B. Ingason said at the annual Digestive Disease Week. “This may lead to a greater variance in plasma drug concentration, making these patients more susceptible to bleeding.”
Mr. Ingason, a medical student at the University of Iceland, Reykjavik, said that although several studies have compared warfarin with NOACs, it remains unclear which NOAC has the most favorable GI profile. In an effort to improve the research in this area, he and his associates performed a nationwide, population-based study during March 2014–Jan. 2018 to compare the GI bleeding risk of patients receiving rivaroxaban to that of a combined pool of patients receiving either apixaban or dabigatran. They drew from the Icelandic Medicine Registry, which contains all outpatient drug prescriptions in the country. Next, the researchers linked the personal identification numbers of patients to the Landspitali University diagnoses registry, which includes more than 90% of all patients hospitalized for GI bleeding. They used 1:1 nearest neighbor propensity score for matching and Kaplan-Meier survival estimates and Cox regression to compare rates of GI bleeding. The study outcome of interest was any clinically relevant GI bleeding.
Mr. Ingason reported that the baseline characteristics were similar between the rivaroxaban group and the apixaban/dabigatran group. They matched for several variables, including age, sex, Charlson score, the proportion being anticoagulant naive, moderate to severe renal disease, moderate to severe liver disease, any prior bleeding, and any prior thrombotic events.
During the study period, 3,473 patients received rivaroxaban, 1,901 received apixaban, and 1,086 received dabigatran. After propensity score matching, the researchers compared 2,635 patients who received rivaroxaban with 2,365 patients who received either apixaban or dabigatran. They found that patients in the rivaroxaban group had significantly higher rates of GI bleeding, compared with in the apixaban/dabigatran group (1.2 and. 0.6 events per 100 patient-years, respectively). This yielded a hazard ratio of 2.02, “which means that patients receiving rivaroxaban are twice as likely to get GI bleeding compared to patients on apixaban or dabigatran,” Mr. Ingason said. When the researchers examined the entire unmatched cohort of patients, the rivaroxaban group also had significantly higher rates of GI bleeding, compared with the apixaban/dabigatran group (1.0 and 0.6 events per 100 patient-years; HR, 1.75).
Mr. Ingason and his colleagues observed that patients in the rivaroxaban group had higher rates of GI bleeding, compared with the apixaban/dabigatran group, during the entire follow-up period. At the end of year 4, the rivaroxaban group had a 4% cumulative event rate of GI bleeding, compared with 1.8% for the apixaban/dabigatran group, a highly significant difference at P = .0057).
When a meeting attendee asked Mr. Ingason why patients taking apixaban or dabigatran were combined into one group, he said that it was done to increase the power of their study. “Our theory was that rivaroxaban was different because it is administered as a single daily dose, while the others are given twice daily,” he said. The researchers reported having no financial disclosures.
REPORTING FROM DDW 2019
New lemborexant efficacy and safety data unveiled
SAN ANTONIO – results from a pooled analysis showed.
A dual orexin receptor antagonist developed by Eisai, lemborexant is being studied as a treatment for insomnia disorder and irregular sleep-wake rhythm disorder. Early in 2019, the Food and Drug Administration accepted for review the New Drug Application for lemborexant for the treatment of insomnia. A target Prescription Drug User Fee Act date is set for Dec. 27, 2019.
“We evaluated early on whether exposure to lemborexant was going to be different between men and women,” lead study author Margaret Moline, PhD, said during an interview at the annual meeting of the Associated Professional Sleep Societies. “With some drugs, like zolpidem and other so-called Z drugs, because exposure is different, clinical studies could involve different dosing for different sexes. Because we knew the exposure to lemborexant wasn’t different between the sexes, we expected to see similar results in both sexes. That was the case.”
Dr. Moline, executive director of the Neurology Business Group and International Project Team Lead for the lemborexant clinical development program at Eisai, and colleagues presented pooled analyses of subject-reported sleep onset latency (sSOL) and subject-reported wake after sleep onset (sWASO) from lemborexant phase 3 studies, SUNRISE-1 and SUNRISE-2. SUNRISE-1 was a 1-month, double-blind, placebo- and active-controlled, parallel-group study in 1,006 subjects. Participants were females aged 55 years and older and males aged 65 years and older with a primary complaint of sleep maintenance difficulties and an Insomnia Severity Index (ISI) total score of 13 or higher. SUNRISE-2 was a placebo-controlled, 6-month, active treatment, double-blind, parallel-group study in 949 subjects with insomnia disorder. Participants were females and males aged 18 years and older with a primary complaint of sleep onset and/or sleep maintenance difficulties and an ISI total score of 15 or higher. Both analyses included subjects randomized to placebo, lemborexant 5 mg, or lemborexant 10 mg. Each study included a single-blind placebo run-in period prior to randomization.
The pooled analysis of 1,693 subjects included 402 (23.7%) men and 1,291 (76.3%) women. Results on sSOL and sWASO were consistent with the significant results on sleep diary in the individual studies. In both sexes, sSOL for lemborexant 5 mg and lemborexant 10 mg was significantly reduced versus that for placebo during the first 7 days and end of month 1 (P less than .05 for all comparisons). In women, the researchers observed significantly greater reductions in sWASO placebo for both lemborexant doses versus that with placebo (first 7 days and end of month 1; P less than .0001 for all comparisons). In males, sWASO decreased significantly, compared with placebo, for the first 7 days (lemborexant 5 mg and lemborexant 10 mg; P equal to or less than .0001) and at end of month 1 (lemborexant 10 mg only; P = .0032). For placebo, lemborexant 5 mg, and lemborexant 10 mg, the overall incidence of treatment-emergent adverse events was similar across sexes. Incidence of treatment-emergent serious adverse events was low for both sex subgroups; most events occurred in one subject each. Treatment-emergent adverse events leading to study drug withdrawal or interruption were few and similar across sexes for all treatments and was highest in males receiving lemborexant 10 mg. The most frequent treatment-emergent adverse events reported in males were somnolence, fatigue, and headache, while the most common in females were somnolence, headache, and urinary tract infection. About 3% of females (no males) reported a urinary tract infection; the incidence in females was similar across treatment groups.
“Overall, sleep diary outcomes in males and females were consistent with the significant results observed in the total populations of the individual studies,” Dr. Moline concluded. “A dose adjustment based on sex is not anticipated.”
The research was supported by Eisai. Dr. Moline is an employee of the company.
SOURCE: Moline M et al. Sleep 2019, Abstract 0368.
REPORTING FROM SLEEP 2019