User login
Oxygen Therapies and Clinical Outcomes for Patients Hospitalized With COVID-19: First Surge vs Second Surge
From Lahey Hospital and Medical Center, Burlington, MA (Drs. Liesching and Lei), and Tufts University School of Medicine, Boston, MA (Dr. Liesching)
ABSTRACT
Objective: To compare the utilization of oxygen therapies and clinical outcomes of patients admitted for COVID-19 during the second surge of the pandemic to that of patients admitted during the first surge.
Design: Observational study using a registry database.
Setting: Three hospitals (791 inpatient beds and 76 intensive care unit [ICU] beds) within the Beth Israel Lahey Health system in Massachusetts.
Participants: We included 3183 patients with COVID-19 admitted to hospitals.
Measurements: Baseline data included demographics and comorbidities. Treatments included low-flow supplemental oxygen (2-6 L/min), high-flow oxygen via nasal cannula, and invasive mechanical ventilation. Outcomes included ICU admission, length of stay, ventilator days, and mortality.
Results: A total of 3183 patients were included: 1586 during the first surge and 1597 during the second surge. Compared to the first surge, patients admitted during the second surge had a similar rate of receiving low-flow supplemental oxygen (65.8% vs 64.1%, P = .3), a higher rate of receiving high-flow nasal cannula (15.4% vs 10.8%, P = .0001), and a lower ventilation rate (5.6% vs 9.7%, P < .0001). The outcomes during the second surge were better than those during the first surge: lower ICU admission rate (8.1% vs 12.7%, P < .0001), shorter length of hospital stay (5 vs 6 days, P < .0001), fewer ventilator days (10 vs 16, P = .01), and lower mortality (8.3% vs 19.2%, P < .0001). Among ventilated patients, those who received high-flow nasal cannula had lower mortality.
Conclusion: Compared to the first surge of the COVID-19 pandemic, patients admitted during the second surge had similar likelihood of receiving low-flow supplemental oxygen, were more likely to receive high-flow nasal cannula, were less likely to be ventilated, and had better outcomes.
Keywords: supplemental oxygen, high-flow nasal cannula, ventilator.
The respiratory system receives the major impact of SARS-CoV-2 virus, and hypoxemia has been the predominant diagnosis for patients hospitalized with COVID-19.1,2 During the initial stage of the pandemic, oxygen therapies and mechanical ventilation were the only choices for these patients.3-6 Standard-of-care treatment for patients with COVID-19 during the initial surge included oxygen therapies and mechanical ventilation for hypoxemia and medications for comorbidities and COVID-19–associated sequelae, such as multi-organ dysfunction and failure. A report from New York during the first surge (May 2020) showed that among 5700 hospitalized patients with COVID-19, 27.8% received supplemental oxygen and 12.2% received invasive mechanical ventilation.7 High-flow nasal cannula (HFNC) oxygen delivery has been utilized widely throughout the pandemic due to its superiority over other noninvasive respiratory support techniques.8-12 Mechanical ventilation is always necessary for critically ill patients with acute respiratory distress syndrome. However, ventilator scarcity has become a bottleneck in caring for severely ill patients with COVID-19 during the pandemic.13
The clinical outcomes of hospitalized COVID-19 patients include a high intubation rate, long length of hospital and intensive care unit (ICU) stay, and high mortality.14,15 As the pandemic evolved, new medications, including remdesivir, hydroxychloroquine, lopinavir, or interferon β-1a, were used in addition to the standard of care, but these did not result in significantly different mortality from standard of care.16 Steroids are becoming foundational to the treatment of severe COVID-19 pneumonia, but evidence from high-quality randomized controlled clinical trials is lacking.17
During the first surge from March to May 2020, Massachusetts had the third highest number of COVID-19 cases among states in the United States.18 In early 2021, COVID-19 cases were climbing close to the peak of the second surge in Massachusetts. In this study, we compared utilization of low-flow supplemental oxygen, HFNC, and mechanical ventilation and clinical outcomes of patients admitted to 3 hospitals in Massachusetts during the second surge of the pandemic to that of patients admitted during the first surge.
Methods
Setting
Beth Israel Lahey Health is a system of academic and teaching hospitals with primary care and specialty care providers. We included 3 centers within the Beth Israel Lahey Health system in Massachusetts: Lahey Hospital and Medical Center, with 335 inpatient hospital beds and 52 critical care beds; Beverly Hospital, with 227 beds and 14 critical care beds; and Winchester Hospital, with 229 beds and 10 ICU beds.
Participants
We included patients admitted to the 3 hospitals with COVID-19 as a primary or secondary diagnosis during the first surge of the pandemic (March 1, 2020 to June 15, 2020) and the second surge (November 15, 2020 to January 27, 2021). The timeframe of the first surge was defined as the window between the start date and the end date of data collection. During the time window of the first surge, 1586 patients were included. The start time of the second surge was defined as the date when the data collection was restarted; the end date was set when the number of patients (1597) accumulated was close to the number of patients in the first surge (1586), so that the two groups had similar sample size.
Study Design
A data registry of COVID-19 patients was created by our institution, and the data were prospectively collected starting in March 2020. We retrospectively extracted data on the following from the registry database for this observational study: demographics and baseline comorbidities; the use of low-flow supplemental oxygen, HFNC, and invasive mechanical ventilator; and ICU admission, length of hospital stay, length of ICU stay, and hospital discharge disposition. Start and end times for each oxygen therapy were not entered in the registry. Data about other oxygen therapies, such as noninvasive positive-pressure ventilation, were not collected in the registry database, and therefore were not included in the analysis.
Statistical Analysis
Continuous variables (eg, age) were tested for data distribution normality using the Shapiro-Wilk test. Normally distributed data were tested using unpaired t-tests and displayed as mean (SD). The skewed data were tested using the Wilcoxon rank sum test and displayed as median (interquartile range [IQR]). The categorical variables were compared using chi-square test. Comparisons with P ≤ .05 were considered significantly different. Statistical analysis for this study was generated using Statistical Analysis Software (SAS), version 9.4 for Windows (SAS Institute Inc.).
Results
Baseline Characteristics
We included 3183 patients: 1586 admitted during the first surge and 1597 admitted during the second surge. Baseline characteristics of patients with COVID-19 admitted during the first and second surges are shown in Table 1. Patients admitted during the second surge were older (73 years vs 71 years, P = .01) and had higher rates of hypertension (64.8% vs 59.6%, P = .003) and asthma (12.9% vs 10.7%, P = .049) but a lower rate of interstitial lung disease (3.3% vs 7.7%, P < .001). Sequential organ failure assessment scores at admission and the rates of other comorbidities were not significantly different between the 2 surges.

Oxygen Therapies
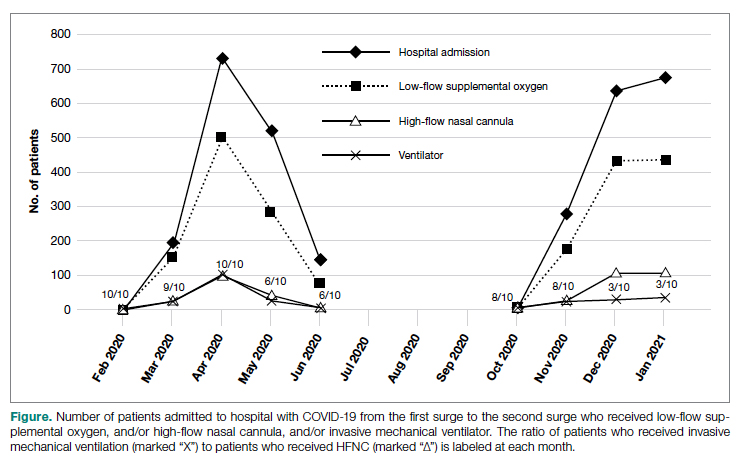
The number of patients who were hospitalized and received low-flow supplemental oxygen, and/or HFNC, and/or ventilator in the first surge and the second surge is shown in the Figure. Of all patients included, 2067 (64.9%) received low-flow supplemental oxygen; of these, 374 (18.1%) subsequently received HFNC, and 85 (22.7%) of these subsequently received mechanical ventilation. Of all 3183 patients, 417 (13.1%) received HFNC; 43 of these patients received HFNC without receiving low-flow supplemental oxygen, and 98 (23.5%) subsequently received mechanical ventilation. Out of all 3183 patients, 244 (7.7%) received mechanical ventilation; 98 (40.2%) of these received HFNC while the remaining 146 (59.8%) did not. At the beginning of the first surge, the ratio of patients who received invasive mechanical ventilation to patients who received HFNC was close to 1:1 (10/10); the ratio decreased to 6:10 in May and June 2020. At the beginning of the second surge, the ratio was 8:10 and then decreased to 3:10 in December 2020 and January 2021.
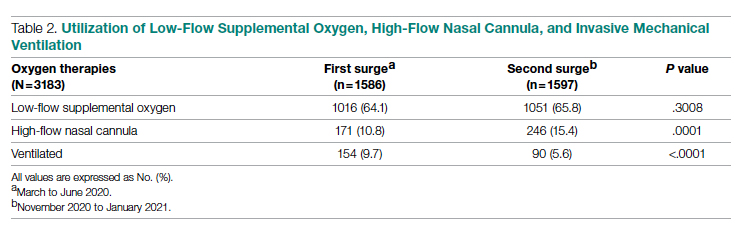
As shown in Table 2, the proportion of patients who received low-flow supplemental oxygen during the second surge was similar to that during the first surge (65.8% vs 64.1%, P = .3). Patients admitted during the second surge were more likely to receive HFNC than patients admitted during the first surge (15.4% vs 10.8%, P = .0001). Patients admitted during the second surge were less likely to be ventilated than the patients admitted during the first surge (5.6% vs 9.7%, P < .0001).
Clinical Outcomes
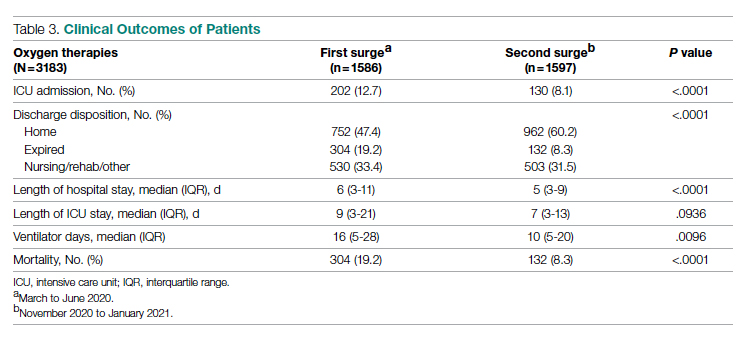
As shown in Table 3, second surge outcomes were much better than first surge outcomes: the ICU admission rate was lower (8.1% vs 12.7%, P < .0001); patients were more likely to be discharged to home (60.2% vs 47.4%, P < .0001), had a shorter length of hospital stay (5 vs 6 days, P < .0001), and had fewer ventilator days (10 vs 16, P = .01); and mortality was lower (8.3% vs 19.2%, P < .0001). There was a trend that length of ICU stay was shorter during the second surge than during the first surge (7 days vs 9 days, P = .09).
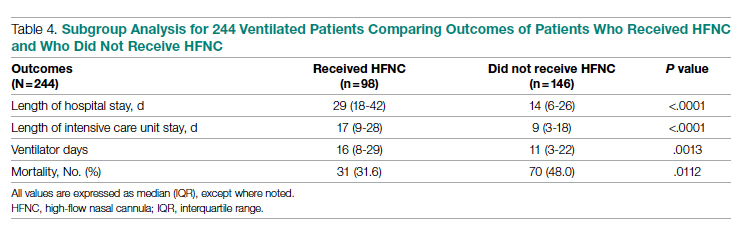
As noted (Figure), the ratio of patients who received invasive mechanical ventilation to patients who received HFNC was decreasing during both the first surge and the second surge. To further analyze the relation between ventilator and HFNC, we performed a subgroup analysis for 244 ventilated patients during both surges to compare outcomes between patients who received HFNC and those who did not receive HFNC (Table 4). Ninety-eight (40%) patients received HFNC. Ventilated patients who received HFNC had lower mortality than those patients who did not receive HFNC (31.6% vs 48%, P = .01), but had a longer length of hospital stay (29 days vs 14 days, P < .0001), longer length of ICU stay (17 days vs 9 days, P < .0001), and a higher number of ventilator days (16 vs 11, P = .001).
Discussion
Our study compared the baseline patient characteristics; utilization of low-flow supplemental oxygen therapy, HFNC, and mechanical ventilation; and clinical outcomes between the first surge (n = 1586) and the second surge (n = 1597) of the COVID-19 pandemic. During both surges, about two-thirds of admitted patients received low-flow supplemental oxygen. A higher proportion of the admitted patients received HFNC during the second surge than during the first surge, while the intubation rate was lower during the second surge than during the first surge.
Reported low-flow supplemental oxygen use ranged from 28% to 63% depending on the cohort characteristics and location during the first surge.6,7,19 A report from New York during the first surge (March 1 to April 4, 2020) showed that among 5700 hospitalized patients with COVID-19, 27.8% received low-flow supplemental oxygen.7 HFNC is recommended in guidelines on management of patients with acute respiratory failure due to COVID-19.20 In our study, HFNC was utilized in a higher proportion of patients admitted for COVID-19 during the second surge (15.5% vs 10.8%, P = .0001). During the early pandemic period in Wuhan, China, 11% to 21% of admitted COVID-19 patients received HFNC.21,22 Utilization of HFNC in New York during the first surge (March to May 2020) varied from 5% to 14.3% of patients admitted with COVID-19.23,24 Our subgroup analysis of the ventilated patients showed that patients who received HFNC had lower mortality than those who did not (31.6% vs 48.0%, P = .011). Comparably, a report from Paris, France, showed that among patients admitted to ICUs for acute hypoxemic respiratory failure, those who received HFNC had lower mortality at day 60 than those who did not (21% vs 31%, P = .052).25 Our recent analysis showed that patients treated with HFNC prior to mechanical ventilation had lower mortality than those treated with only conventional oxygen (30% vs 52%, P = .05).26 In this subgroup analysis, we could not determine if HFNC treatment was administered before or after ventilation because HFNC was entered as dichotomous data (“Yes” or “No”) in the registry database. We merely showed the beneficial effect of HFNC on reducing mortality for ventilated COVID-19 patients, but did not mean to focus on how and when to apply HFNC.
We observed that the patients admitted during the second surge were less likely to be ventilated than the patients admitted during the first surge (5.6% vs 9.7%, P < .0001). During the first surge in New York, among 5700 patients admitted with COVID-19, 12.2% received invasive mechanical ventilation.7 In another report, also from New York during the first surge, 26.1% of 2015 hospitalized COVID-19 patients received mechanical ventilation.27 In our study, the ventilation rate of 9.7% during the first surge was lower.
Outcomes during the second surge were better than during the first surge, including ICU admission rate, hospital and ICU length of stay, ventilator days, and mortality. The mortality was 19.2% during the first surge vs 8.3% during the second surge (P < .0001). The mortality of 19.2% was lower than the 30.6% mortality reported for 2015 hospitalized COVID-19 patients in New York during the first surge.27 A retrospective study showed that early administration of remdesivir was associated with reduced ICU admission, ventilation use, and mortality.28 The RECOVERY clinical trial showed that dexamethasone improved mortality for COVID-19 patients who received respiratory support, but not for patients who did not receive any respiratory support.29 Perhaps some, if not all, of the improvement in ICU admission and mortality during the second surge was attributed to the new medications, such as antivirals and steroids.
The length of hospital stay for patients with moderate to severe COVID-19 varied from 4 to 53 days at different locations of the world, as shown in a meta-analysis by Rees and colleagues.30 Our results showing a length of stay of 6 days during the first surge and 5 days during the second surge fell into the shorter end of this range. In a retrospective analysis of 1643 adults with severe COVID-19 admitted to hospitals in New York City between March 9, 2020 and April 23, 2020, median hospital length of stay was 7 (IQR, 3-14) days.31 For the ventilated patients in our study, the length of stay of 14 days (did not receive HFNC) and 29 days (received HFNC) was much longer. This longer length of stay might be attributed to the patients in our study being older and having more severe comorbidities.
The main purpose of this study was to compare the oxygen therapies and outcomes between 2 surges. It is difficult to associate the clinical outcomes with the oxygen therapies because new therapies and medications were available after the first surge. It was not possible to adjust the outcomes with confounders (other therapies and medications) because the registry data did not include the new therapies and medications.
A strength of this study was that we included a large, balanced number of patients in the first surge and the second surge. We did not plan the sample size in both groups as we could not predict the number of admissions. We set the end date of data collection for analysis as the time when the number of patients admitted during the second surge was similar to the number of patients admitted during the first surge. A limitation was that the registry database was created by the institution and was not designed solely for this study. The data for oxygen therapies were limited to low-flow supplemental oxygen, HFNC, and invasive mechanical ventilation; data for noninvasive ventilation were not included.
Conclusion
At our centers, during the second surge of COVID-19 pandemic, patients hospitalized with COVID-19 infection were more likely to receive HFNC but less likely to be ventilated. Compared to the first surge, the hospitalized patients with COVID-19 infection had a lower ICU admission rate, shorter length of hospital stay, fewer ventilator days, and lower mortality. For ventilated patients, those who received HFNC had lower mortality than those who did not.
Corresponding author: Timothy N. Liesching, MD, 41 Mall Road, Burlington, MA 01805; [email protected]
Disclosures: None reported.
doi:10.12788/jcom.0086
1. Xie J, Covassin N, Fan Z, et al. Association between hypoxemia and mortality in patients with COVID-19. Mayo Clin Proc. 2020;95(6):1138-1147. doi:10.1016/j.mayocp.2020.04.006
2. Asleh R, Asher E, Yagel O, et al. Predictors of hypoxemia and related adverse outcomes in patients hospitalized with COVID-19: a double-center retrospective study. J Clin Med. 2021;10(16):3581. doi:10.3390/jcm10163581
3. Choi KJ, Hong HL, Kim EJ. Association between oxygen saturation/fraction of inhaled oxygen and mortality in patients with COVID-19 associated pneumonia requiring oxygen therapy. Tuberc Respir Dis (Seoul). 2021;84(2):125-133. doi:10.4046/trd.2020.0126
4. Dixit SB. Role of noninvasive oxygen therapy strategies in COVID-19 patients: Where are we going? Indian J Crit Care Med. 2020;24(10):897-898. doi:10.5005/jp-journals-10071-23625
5. Gonzalez-Castro A, Fajardo Campoverde A, Medina A, et al. Non-invasive mechanical ventilation and high-flow oxygen therapy in the COVID-19 pandemic: the value of a draw. Med Intensiva (Engl Ed). 2021;45(5):320-321. doi:10.1016/j.medine.2021.04.001
6. Pan W, Li J, Ou Y, et al. Clinical outcome of standardized oxygen therapy nursing strategy in COVID-19. Ann Palliat Med. 2020;9(4):2171-2177. doi:10.21037/apm-20-1272
7. Richardson S, Hirsch JS, Narasimhan M, et al. Presenting characteristics, comorbidities, and outcomes among 5700 patients hospitalized with COVID-19 in the New York City area. JAMA. 2020;323(20):2052-2059. doi:10.1001/jama.2020.6775
8. He G, Han Y, Fang Q, et al. Clinical experience of high-flow nasal cannula oxygen therapy in severe COVID-19 patients. Article in Chinese. Zhejiang Da Xue Xue Bao Yi Xue Ban. 2020;49(2):232-239. doi:10.3785/j.issn.1008-9292.2020.03.13
9. Lalla U, Allwood BW, Louw EH, et al. The utility of high-flow nasal cannula oxygen therapy in the management of respiratory failure secondary to COVID-19 pneumonia. S Afr Med J. 2020;110(6):12941.
10. Zhang TT, Dai B, Wang W. Should the high-flow nasal oxygen therapy be used or avoided in COVID-19? J Transl Int Med. 2020;8(2):57-58. doi:10.2478/jtim-2020-0018
11. Agarwal A, Basmaji J, Muttalib F, et al. High-flow nasal cannula for acute hypoxemic respiratory failure in patients with COVID-19: systematic reviews of effectiveness and its risks of aerosolization, dispersion, and infection transmission. Can J Anaesth. 2020;67(9):1217-1248. doi:10.1007/s12630-020-01740-2
12. Geng S, Mei Q, Zhu C, et al. High flow nasal cannula is a good treatment option for COVID-19. Heart Lung. 2020;49(5):444-445. doi:10.1016/j.hrtlng.2020.03.018
13. Feinstein MM, Niforatos JD, Hyun I, et al. Considerations for ventilator triage during the COVID-19 pandemic. Lancet Respir Med. 2020;8(6):e53. doi:10.1016/S2213-2600(20)30192-2
14. Wu Z, McGoogan JM. Characteristics of and important lessons from the coronavirus disease 2019 (COVID-19) outbreak in China: summary of a report of 72314 cases from the Chinese Center for Disease Control and Prevention. JAMA. 2020;323(13):1239-1242. doi:10.1001/jama.2020.2648
15. Rojas-Marte G, Hashmi AT, Khalid M, et al. Outcomes in patients with COVID-19 disease and high oxygen requirements. J Clin Med Res. 2021;13(1):26-37. doi:10.14740/jocmr4405
16. Zhang R, Mylonakis E. In inpatients with COVID-19, none of remdesivir, hydroxychloroquine, lopinavir, or interferon β-1a differed from standard care for in-hospital mortality. Ann Intern Med. 2021;174(2):JC17. doi:10.7326/ACPJ202102160-017
17. Rello J, Waterer GW, Bourdiol A, Roquilly A. COVID-19, steroids and other immunomodulators: The jigsaw is not complete. Anaesth Crit Care Pain Med. 2020;39(6):699-701. doi:10.1016/j.accpm.2020.10.011
18. Dargin J, Stempek S, Lei Y, Gray Jr. A, Liesching T. The effect of a tiered provider staffing model on patient outcomes during the coronavirus disease 2019 pandemic: A single-center observational study. Int J Crit Illn Inj Sci. 2021;11(3). doi:10.4103/ijciis.ijciis_37_21
19. Ni YN, Wang T, Liang BM, Liang ZA. The independent factors associated with oxygen therapy in COVID-19 patients under 65 years old. PLoS One. 2021;16(1):e0245690. doi:10.1371/journal.pone.0245690
20. Alhazzani W, Moller MH, Arabi YM, et al. Surviving Sepsis Campaign: guidelines on the management of critically ill adults with coronavirus disease 2019 (COVID-19). Crit Care Med. 2020;48(6):e440-e469. doi:10.1097/CCM.0000000000004363
21. Wang D, Hu B, Hu C, et al. Clinical characteristics of 138 hospitalized patients with 2019 novel coronavirus-infected pneumonia in Wuhan, China. JAMA. 2020;323(11):1061-1069. doi:10.1001/jama.2020.1585
22. Zhou F, Yu T, Du R, et al. Clinical course and risk factors for mortality of adult inpatients with COVID-19 in Wuhan, China: a retrospective cohort study. Lancet. 2020;395(10229):1054-1062. doi:10.1016/S0140-6736(20)30566-3
23. Argenziano MG, Bruce SL, Slater CL, et al. Characterization and clinical course of 1000 patients with coronavirus disease 2019 in New York: retrospective case series. BMJ. 2020;369:m1996. doi:10.1136/bmj.m1996
24. Cummings MJ, Baldwin MR, Abrams D, et al. Epidemiology, clinical course, and outcomes of critically ill adults with COVID-19 in New York City: a prospective cohort study. Lancet. 2020;395(10239):1763-1770. doi:10.1016/S0140-6736(20)31189-2
25. Demoule A, Vieillard Baron A, Darmon M, et al. High-flow nasal cannula in critically ill patients with severe COVID-19. Am J Respir Crit Care Med. 2020;202(7):1039-1042. doi:10.1164/rccm.202005-2007LE
26. Hansen CK, Stempek S, Liesching T, Lei Y, Dargin J. Characteristics and outcomes of patients receiving high flow nasal cannula therapy prior to mechanical ventilation in COVID-19 respiratory failure: a prospective observational study. Int J Crit Illn Inj Sci. 2021;11(2):56-60. doi:10.4103/IJCIIS.IJCIIS_181_20
27. van Gerwen M, Alsen M, Little C, et al. Risk factors and outcomes of COVID-19 in New York City; a retrospective cohort study. J Med Virol. 2021;93(2):907-915. doi:10.1002/jmv.26337
28. Hussain Alsayed HA, Saheb Sharif-Askari F, Saheb Sharif-Askari N, Hussain AAS, Hamid Q, Halwani R. Early administration of remdesivir to COVID-19 patients associates with higher recovery rate and lower need for ICU admission: A retrospective cohort study. PLoS One. 2021;16(10):e0258643. doi:10.1371/journal.pone.0258643
29. RECOVERY Collaborative Group, Horby P, Lim WS, et al. Dexamethasone in hospitalized patients with Covid-19. N Engl J Med. 2021;384(8):693-704. doi:10.1056/NEJMoa2021436
30. Rees EM, Nightingale ES, Jafari Y, et al. COVID-19 length of hospital stay: a systematic review and data synthesis. BMC Med. 2020;18(1):270. doi:10.1186/s12916-020-01726-3
31. Anderson M, Bach P, Baldwin MR. Hospital length of stay for severe COVID-19: implications for Remdesivir’s value. medRxiv. 2020;2020.08.10.20171637. doi:10.1101/2020.08.10.20171637
From Lahey Hospital and Medical Center, Burlington, MA (Drs. Liesching and Lei), and Tufts University School of Medicine, Boston, MA (Dr. Liesching)
ABSTRACT
Objective: To compare the utilization of oxygen therapies and clinical outcomes of patients admitted for COVID-19 during the second surge of the pandemic to that of patients admitted during the first surge.
Design: Observational study using a registry database.
Setting: Three hospitals (791 inpatient beds and 76 intensive care unit [ICU] beds) within the Beth Israel Lahey Health system in Massachusetts.
Participants: We included 3183 patients with COVID-19 admitted to hospitals.
Measurements: Baseline data included demographics and comorbidities. Treatments included low-flow supplemental oxygen (2-6 L/min), high-flow oxygen via nasal cannula, and invasive mechanical ventilation. Outcomes included ICU admission, length of stay, ventilator days, and mortality.
Results: A total of 3183 patients were included: 1586 during the first surge and 1597 during the second surge. Compared to the first surge, patients admitted during the second surge had a similar rate of receiving low-flow supplemental oxygen (65.8% vs 64.1%, P = .3), a higher rate of receiving high-flow nasal cannula (15.4% vs 10.8%, P = .0001), and a lower ventilation rate (5.6% vs 9.7%, P < .0001). The outcomes during the second surge were better than those during the first surge: lower ICU admission rate (8.1% vs 12.7%, P < .0001), shorter length of hospital stay (5 vs 6 days, P < .0001), fewer ventilator days (10 vs 16, P = .01), and lower mortality (8.3% vs 19.2%, P < .0001). Among ventilated patients, those who received high-flow nasal cannula had lower mortality.
Conclusion: Compared to the first surge of the COVID-19 pandemic, patients admitted during the second surge had similar likelihood of receiving low-flow supplemental oxygen, were more likely to receive high-flow nasal cannula, were less likely to be ventilated, and had better outcomes.
Keywords: supplemental oxygen, high-flow nasal cannula, ventilator.
The respiratory system receives the major impact of SARS-CoV-2 virus, and hypoxemia has been the predominant diagnosis for patients hospitalized with COVID-19.1,2 During the initial stage of the pandemic, oxygen therapies and mechanical ventilation were the only choices for these patients.3-6 Standard-of-care treatment for patients with COVID-19 during the initial surge included oxygen therapies and mechanical ventilation for hypoxemia and medications for comorbidities and COVID-19–associated sequelae, such as multi-organ dysfunction and failure. A report from New York during the first surge (May 2020) showed that among 5700 hospitalized patients with COVID-19, 27.8% received supplemental oxygen and 12.2% received invasive mechanical ventilation.7 High-flow nasal cannula (HFNC) oxygen delivery has been utilized widely throughout the pandemic due to its superiority over other noninvasive respiratory support techniques.8-12 Mechanical ventilation is always necessary for critically ill patients with acute respiratory distress syndrome. However, ventilator scarcity has become a bottleneck in caring for severely ill patients with COVID-19 during the pandemic.13
The clinical outcomes of hospitalized COVID-19 patients include a high intubation rate, long length of hospital and intensive care unit (ICU) stay, and high mortality.14,15 As the pandemic evolved, new medications, including remdesivir, hydroxychloroquine, lopinavir, or interferon β-1a, were used in addition to the standard of care, but these did not result in significantly different mortality from standard of care.16 Steroids are becoming foundational to the treatment of severe COVID-19 pneumonia, but evidence from high-quality randomized controlled clinical trials is lacking.17
During the first surge from March to May 2020, Massachusetts had the third highest number of COVID-19 cases among states in the United States.18 In early 2021, COVID-19 cases were climbing close to the peak of the second surge in Massachusetts. In this study, we compared utilization of low-flow supplemental oxygen, HFNC, and mechanical ventilation and clinical outcomes of patients admitted to 3 hospitals in Massachusetts during the second surge of the pandemic to that of patients admitted during the first surge.
Methods
Setting
Beth Israel Lahey Health is a system of academic and teaching hospitals with primary care and specialty care providers. We included 3 centers within the Beth Israel Lahey Health system in Massachusetts: Lahey Hospital and Medical Center, with 335 inpatient hospital beds and 52 critical care beds; Beverly Hospital, with 227 beds and 14 critical care beds; and Winchester Hospital, with 229 beds and 10 ICU beds.
Participants
We included patients admitted to the 3 hospitals with COVID-19 as a primary or secondary diagnosis during the first surge of the pandemic (March 1, 2020 to June 15, 2020) and the second surge (November 15, 2020 to January 27, 2021). The timeframe of the first surge was defined as the window between the start date and the end date of data collection. During the time window of the first surge, 1586 patients were included. The start time of the second surge was defined as the date when the data collection was restarted; the end date was set when the number of patients (1597) accumulated was close to the number of patients in the first surge (1586), so that the two groups had similar sample size.
Study Design
A data registry of COVID-19 patients was created by our institution, and the data were prospectively collected starting in March 2020. We retrospectively extracted data on the following from the registry database for this observational study: demographics and baseline comorbidities; the use of low-flow supplemental oxygen, HFNC, and invasive mechanical ventilator; and ICU admission, length of hospital stay, length of ICU stay, and hospital discharge disposition. Start and end times for each oxygen therapy were not entered in the registry. Data about other oxygen therapies, such as noninvasive positive-pressure ventilation, were not collected in the registry database, and therefore were not included in the analysis.
Statistical Analysis
Continuous variables (eg, age) were tested for data distribution normality using the Shapiro-Wilk test. Normally distributed data were tested using unpaired t-tests and displayed as mean (SD). The skewed data were tested using the Wilcoxon rank sum test and displayed as median (interquartile range [IQR]). The categorical variables were compared using chi-square test. Comparisons with P ≤ .05 were considered significantly different. Statistical analysis for this study was generated using Statistical Analysis Software (SAS), version 9.4 for Windows (SAS Institute Inc.).
Results
Baseline Characteristics
We included 3183 patients: 1586 admitted during the first surge and 1597 admitted during the second surge. Baseline characteristics of patients with COVID-19 admitted during the first and second surges are shown in Table 1. Patients admitted during the second surge were older (73 years vs 71 years, P = .01) and had higher rates of hypertension (64.8% vs 59.6%, P = .003) and asthma (12.9% vs 10.7%, P = .049) but a lower rate of interstitial lung disease (3.3% vs 7.7%, P < .001). Sequential organ failure assessment scores at admission and the rates of other comorbidities were not significantly different between the 2 surges.
Oxygen Therapies
The number of patients who were hospitalized and received low-flow supplemental oxygen, and/or HFNC, and/or ventilator in the first surge and the second surge is shown in the Figure. Of all patients included, 2067 (64.9%) received low-flow supplemental oxygen; of these, 374 (18.1%) subsequently received HFNC, and 85 (22.7%) of these subsequently received mechanical ventilation. Of all 3183 patients, 417 (13.1%) received HFNC; 43 of these patients received HFNC without receiving low-flow supplemental oxygen, and 98 (23.5%) subsequently received mechanical ventilation. Out of all 3183 patients, 244 (7.7%) received mechanical ventilation; 98 (40.2%) of these received HFNC while the remaining 146 (59.8%) did not. At the beginning of the first surge, the ratio of patients who received invasive mechanical ventilation to patients who received HFNC was close to 1:1 (10/10); the ratio decreased to 6:10 in May and June 2020. At the beginning of the second surge, the ratio was 8:10 and then decreased to 3:10 in December 2020 and January 2021.
As shown in Table 2, the proportion of patients who received low-flow supplemental oxygen during the second surge was similar to that during the first surge (65.8% vs 64.1%, P = .3). Patients admitted during the second surge were more likely to receive HFNC than patients admitted during the first surge (15.4% vs 10.8%, P = .0001). Patients admitted during the second surge were less likely to be ventilated than the patients admitted during the first surge (5.6% vs 9.7%, P < .0001).
Clinical Outcomes
As shown in Table 3, second surge outcomes were much better than first surge outcomes: the ICU admission rate was lower (8.1% vs 12.7%, P < .0001); patients were more likely to be discharged to home (60.2% vs 47.4%, P < .0001), had a shorter length of hospital stay (5 vs 6 days, P < .0001), and had fewer ventilator days (10 vs 16, P = .01); and mortality was lower (8.3% vs 19.2%, P < .0001). There was a trend that length of ICU stay was shorter during the second surge than during the first surge (7 days vs 9 days, P = .09).
As noted (Figure), the ratio of patients who received invasive mechanical ventilation to patients who received HFNC was decreasing during both the first surge and the second surge. To further analyze the relation between ventilator and HFNC, we performed a subgroup analysis for 244 ventilated patients during both surges to compare outcomes between patients who received HFNC and those who did not receive HFNC (Table 4). Ninety-eight (40%) patients received HFNC. Ventilated patients who received HFNC had lower mortality than those patients who did not receive HFNC (31.6% vs 48%, P = .01), but had a longer length of hospital stay (29 days vs 14 days, P < .0001), longer length of ICU stay (17 days vs 9 days, P < .0001), and a higher number of ventilator days (16 vs 11, P = .001).
Discussion
Our study compared the baseline patient characteristics; utilization of low-flow supplemental oxygen therapy, HFNC, and mechanical ventilation; and clinical outcomes between the first surge (n = 1586) and the second surge (n = 1597) of the COVID-19 pandemic. During both surges, about two-thirds of admitted patients received low-flow supplemental oxygen. A higher proportion of the admitted patients received HFNC during the second surge than during the first surge, while the intubation rate was lower during the second surge than during the first surge.
Reported low-flow supplemental oxygen use ranged from 28% to 63% depending on the cohort characteristics and location during the first surge.6,7,19 A report from New York during the first surge (March 1 to April 4, 2020) showed that among 5700 hospitalized patients with COVID-19, 27.8% received low-flow supplemental oxygen.7 HFNC is recommended in guidelines on management of patients with acute respiratory failure due to COVID-19.20 In our study, HFNC was utilized in a higher proportion of patients admitted for COVID-19 during the second surge (15.5% vs 10.8%, P = .0001). During the early pandemic period in Wuhan, China, 11% to 21% of admitted COVID-19 patients received HFNC.21,22 Utilization of HFNC in New York during the first surge (March to May 2020) varied from 5% to 14.3% of patients admitted with COVID-19.23,24 Our subgroup analysis of the ventilated patients showed that patients who received HFNC had lower mortality than those who did not (31.6% vs 48.0%, P = .011). Comparably, a report from Paris, France, showed that among patients admitted to ICUs for acute hypoxemic respiratory failure, those who received HFNC had lower mortality at day 60 than those who did not (21% vs 31%, P = .052).25 Our recent analysis showed that patients treated with HFNC prior to mechanical ventilation had lower mortality than those treated with only conventional oxygen (30% vs 52%, P = .05).26 In this subgroup analysis, we could not determine if HFNC treatment was administered before or after ventilation because HFNC was entered as dichotomous data (“Yes” or “No”) in the registry database. We merely showed the beneficial effect of HFNC on reducing mortality for ventilated COVID-19 patients, but did not mean to focus on how and when to apply HFNC.
We observed that the patients admitted during the second surge were less likely to be ventilated than the patients admitted during the first surge (5.6% vs 9.7%, P < .0001). During the first surge in New York, among 5700 patients admitted with COVID-19, 12.2% received invasive mechanical ventilation.7 In another report, also from New York during the first surge, 26.1% of 2015 hospitalized COVID-19 patients received mechanical ventilation.27 In our study, the ventilation rate of 9.7% during the first surge was lower.
Outcomes during the second surge were better than during the first surge, including ICU admission rate, hospital and ICU length of stay, ventilator days, and mortality. The mortality was 19.2% during the first surge vs 8.3% during the second surge (P < .0001). The mortality of 19.2% was lower than the 30.6% mortality reported for 2015 hospitalized COVID-19 patients in New York during the first surge.27 A retrospective study showed that early administration of remdesivir was associated with reduced ICU admission, ventilation use, and mortality.28 The RECOVERY clinical trial showed that dexamethasone improved mortality for COVID-19 patients who received respiratory support, but not for patients who did not receive any respiratory support.29 Perhaps some, if not all, of the improvement in ICU admission and mortality during the second surge was attributed to the new medications, such as antivirals and steroids.
The length of hospital stay for patients with moderate to severe COVID-19 varied from 4 to 53 days at different locations of the world, as shown in a meta-analysis by Rees and colleagues.30 Our results showing a length of stay of 6 days during the first surge and 5 days during the second surge fell into the shorter end of this range. In a retrospective analysis of 1643 adults with severe COVID-19 admitted to hospitals in New York City between March 9, 2020 and April 23, 2020, median hospital length of stay was 7 (IQR, 3-14) days.31 For the ventilated patients in our study, the length of stay of 14 days (did not receive HFNC) and 29 days (received HFNC) was much longer. This longer length of stay might be attributed to the patients in our study being older and having more severe comorbidities.
The main purpose of this study was to compare the oxygen therapies and outcomes between 2 surges. It is difficult to associate the clinical outcomes with the oxygen therapies because new therapies and medications were available after the first surge. It was not possible to adjust the outcomes with confounders (other therapies and medications) because the registry data did not include the new therapies and medications.
A strength of this study was that we included a large, balanced number of patients in the first surge and the second surge. We did not plan the sample size in both groups as we could not predict the number of admissions. We set the end date of data collection for analysis as the time when the number of patients admitted during the second surge was similar to the number of patients admitted during the first surge. A limitation was that the registry database was created by the institution and was not designed solely for this study. The data for oxygen therapies were limited to low-flow supplemental oxygen, HFNC, and invasive mechanical ventilation; data for noninvasive ventilation were not included.
Conclusion
At our centers, during the second surge of COVID-19 pandemic, patients hospitalized with COVID-19 infection were more likely to receive HFNC but less likely to be ventilated. Compared to the first surge, the hospitalized patients with COVID-19 infection had a lower ICU admission rate, shorter length of hospital stay, fewer ventilator days, and lower mortality. For ventilated patients, those who received HFNC had lower mortality than those who did not.
Corresponding author: Timothy N. Liesching, MD, 41 Mall Road, Burlington, MA 01805; [email protected]
Disclosures: None reported.
doi:10.12788/jcom.0086
1. Xie J, Covassin N, Fan Z, et al. Association between hypoxemia and mortality in patients with COVID-19. Mayo Clin Proc. 2020;95(6):1138-1147. doi:10.1016/j.mayocp.2020.04.006
2. Asleh R, Asher E, Yagel O, et al. Predictors of hypoxemia and related adverse outcomes in patients hospitalized with COVID-19: a double-center retrospective study. J Clin Med. 2021;10(16):3581. doi:10.3390/jcm10163581
3. Choi KJ, Hong HL, Kim EJ. Association between oxygen saturation/fraction of inhaled oxygen and mortality in patients with COVID-19 associated pneumonia requiring oxygen therapy. Tuberc Respir Dis (Seoul). 2021;84(2):125-133. doi:10.4046/trd.2020.0126
4. Dixit SB. Role of noninvasive oxygen therapy strategies in COVID-19 patients: Where are we going? Indian J Crit Care Med. 2020;24(10):897-898. doi:10.5005/jp-journals-10071-23625
5. Gonzalez-Castro A, Fajardo Campoverde A, Medina A, et al. Non-invasive mechanical ventilation and high-flow oxygen therapy in the COVID-19 pandemic: the value of a draw. Med Intensiva (Engl Ed). 2021;45(5):320-321. doi:10.1016/j.medine.2021.04.001
6. Pan W, Li J, Ou Y, et al. Clinical outcome of standardized oxygen therapy nursing strategy in COVID-19. Ann Palliat Med. 2020;9(4):2171-2177. doi:10.21037/apm-20-1272
7. Richardson S, Hirsch JS, Narasimhan M, et al. Presenting characteristics, comorbidities, and outcomes among 5700 patients hospitalized with COVID-19 in the New York City area. JAMA. 2020;323(20):2052-2059. doi:10.1001/jama.2020.6775
8. He G, Han Y, Fang Q, et al. Clinical experience of high-flow nasal cannula oxygen therapy in severe COVID-19 patients. Article in Chinese. Zhejiang Da Xue Xue Bao Yi Xue Ban. 2020;49(2):232-239. doi:10.3785/j.issn.1008-9292.2020.03.13
9. Lalla U, Allwood BW, Louw EH, et al. The utility of high-flow nasal cannula oxygen therapy in the management of respiratory failure secondary to COVID-19 pneumonia. S Afr Med J. 2020;110(6):12941.
10. Zhang TT, Dai B, Wang W. Should the high-flow nasal oxygen therapy be used or avoided in COVID-19? J Transl Int Med. 2020;8(2):57-58. doi:10.2478/jtim-2020-0018
11. Agarwal A, Basmaji J, Muttalib F, et al. High-flow nasal cannula for acute hypoxemic respiratory failure in patients with COVID-19: systematic reviews of effectiveness and its risks of aerosolization, dispersion, and infection transmission. Can J Anaesth. 2020;67(9):1217-1248. doi:10.1007/s12630-020-01740-2
12. Geng S, Mei Q, Zhu C, et al. High flow nasal cannula is a good treatment option for COVID-19. Heart Lung. 2020;49(5):444-445. doi:10.1016/j.hrtlng.2020.03.018
13. Feinstein MM, Niforatos JD, Hyun I, et al. Considerations for ventilator triage during the COVID-19 pandemic. Lancet Respir Med. 2020;8(6):e53. doi:10.1016/S2213-2600(20)30192-2
14. Wu Z, McGoogan JM. Characteristics of and important lessons from the coronavirus disease 2019 (COVID-19) outbreak in China: summary of a report of 72314 cases from the Chinese Center for Disease Control and Prevention. JAMA. 2020;323(13):1239-1242. doi:10.1001/jama.2020.2648
15. Rojas-Marte G, Hashmi AT, Khalid M, et al. Outcomes in patients with COVID-19 disease and high oxygen requirements. J Clin Med Res. 2021;13(1):26-37. doi:10.14740/jocmr4405
16. Zhang R, Mylonakis E. In inpatients with COVID-19, none of remdesivir, hydroxychloroquine, lopinavir, or interferon β-1a differed from standard care for in-hospital mortality. Ann Intern Med. 2021;174(2):JC17. doi:10.7326/ACPJ202102160-017
17. Rello J, Waterer GW, Bourdiol A, Roquilly A. COVID-19, steroids and other immunomodulators: The jigsaw is not complete. Anaesth Crit Care Pain Med. 2020;39(6):699-701. doi:10.1016/j.accpm.2020.10.011
18. Dargin J, Stempek S, Lei Y, Gray Jr. A, Liesching T. The effect of a tiered provider staffing model on patient outcomes during the coronavirus disease 2019 pandemic: A single-center observational study. Int J Crit Illn Inj Sci. 2021;11(3). doi:10.4103/ijciis.ijciis_37_21
19. Ni YN, Wang T, Liang BM, Liang ZA. The independent factors associated with oxygen therapy in COVID-19 patients under 65 years old. PLoS One. 2021;16(1):e0245690. doi:10.1371/journal.pone.0245690
20. Alhazzani W, Moller MH, Arabi YM, et al. Surviving Sepsis Campaign: guidelines on the management of critically ill adults with coronavirus disease 2019 (COVID-19). Crit Care Med. 2020;48(6):e440-e469. doi:10.1097/CCM.0000000000004363
21. Wang D, Hu B, Hu C, et al. Clinical characteristics of 138 hospitalized patients with 2019 novel coronavirus-infected pneumonia in Wuhan, China. JAMA. 2020;323(11):1061-1069. doi:10.1001/jama.2020.1585
22. Zhou F, Yu T, Du R, et al. Clinical course and risk factors for mortality of adult inpatients with COVID-19 in Wuhan, China: a retrospective cohort study. Lancet. 2020;395(10229):1054-1062. doi:10.1016/S0140-6736(20)30566-3
23. Argenziano MG, Bruce SL, Slater CL, et al. Characterization and clinical course of 1000 patients with coronavirus disease 2019 in New York: retrospective case series. BMJ. 2020;369:m1996. doi:10.1136/bmj.m1996
24. Cummings MJ, Baldwin MR, Abrams D, et al. Epidemiology, clinical course, and outcomes of critically ill adults with COVID-19 in New York City: a prospective cohort study. Lancet. 2020;395(10239):1763-1770. doi:10.1016/S0140-6736(20)31189-2
25. Demoule A, Vieillard Baron A, Darmon M, et al. High-flow nasal cannula in critically ill patients with severe COVID-19. Am J Respir Crit Care Med. 2020;202(7):1039-1042. doi:10.1164/rccm.202005-2007LE
26. Hansen CK, Stempek S, Liesching T, Lei Y, Dargin J. Characteristics and outcomes of patients receiving high flow nasal cannula therapy prior to mechanical ventilation in COVID-19 respiratory failure: a prospective observational study. Int J Crit Illn Inj Sci. 2021;11(2):56-60. doi:10.4103/IJCIIS.IJCIIS_181_20
27. van Gerwen M, Alsen M, Little C, et al. Risk factors and outcomes of COVID-19 in New York City; a retrospective cohort study. J Med Virol. 2021;93(2):907-915. doi:10.1002/jmv.26337
28. Hussain Alsayed HA, Saheb Sharif-Askari F, Saheb Sharif-Askari N, Hussain AAS, Hamid Q, Halwani R. Early administration of remdesivir to COVID-19 patients associates with higher recovery rate and lower need for ICU admission: A retrospective cohort study. PLoS One. 2021;16(10):e0258643. doi:10.1371/journal.pone.0258643
29. RECOVERY Collaborative Group, Horby P, Lim WS, et al. Dexamethasone in hospitalized patients with Covid-19. N Engl J Med. 2021;384(8):693-704. doi:10.1056/NEJMoa2021436
30. Rees EM, Nightingale ES, Jafari Y, et al. COVID-19 length of hospital stay: a systematic review and data synthesis. BMC Med. 2020;18(1):270. doi:10.1186/s12916-020-01726-3
31. Anderson M, Bach P, Baldwin MR. Hospital length of stay for severe COVID-19: implications for Remdesivir’s value. medRxiv. 2020;2020.08.10.20171637. doi:10.1101/2020.08.10.20171637
Using a Real-Time Prediction Algorithm to Improve Sleep in the Hospital
Study Overview
Objective: This study evaluated whether a clinical-decision-support (CDS) tool that utilizes a real-time algorithm incorporating patient vital sign data can identify hospitalized patients who can forgo overnight vital sign checks and thus reduce delirium incidence.
Design: This was a parallel randomized clinical trial of adult inpatients admitted to the general medical service of a tertiary care academic medical center in the United States. The trial intervention consisted of a CDS notification in the electronic health record (EHR) that informed the physician if a patient had a high likelihood of nighttime vital signs within the reference ranges based on a logistic regression model of real-time patient data input. This notification provided the physician an opportunity to discontinue nighttime vital sign checks, dismiss the notification for 1 hour, or dismiss the notification until the next day.
Setting and participants: This clinical trial was conducted at the University of California, San Francisco Medical Center from March 11 to November 24, 2019. Participants included physicians who served on the primary team (eg, attending, resident) of 1699 patients on the general medical service who were outside of the intensive care unit (ICU). The hospital encounters were randomized (allocation ratio of 1:1) to sleep promotion vitals CDS (SPV CDS) intervention or usual care.
Main outcome and measures: The primary outcome was delirium as determined by bedside nurse assessment using the Nursing Delirium Screening Scale (Nu-DESC) recorded once per nursing shift. The Nu-DESC is a standardized delirium screening tool that defines delirium with a score ≥2. Secondary outcomes included sleep opportunity (ie, EHR-based sleep metrics that reflected the maximum time between iatrogenic interruptions, such as nighttime vital sign checks) and patient satisfaction (ie, patient satisfaction measured by standardized Hospital Consumer Assessment of Healthcare Providers and Systems [HCAHPS] survey). Potential balancing outcomes were assessed to ensure that reduced vital sign checks were not causing harms; these included ICU transfers, rapid response calls, and code blue alarms. All analyses were conducted on the basis of intention-to-treat.
Main results: A total of 3025 inpatient encounters were screened and 1930 encounters were randomized (966 SPV CDS intervention; 964 usual care). The randomized encounters consisted of 1699 patients; demographic factors between the 2 trial arms were similar. Specifically, the intervention arm included 566 men (59%) and mean (SD) age was 53 (15) years. The incidence of delirium was similar between the intervention and usual care arms: 108 (11%) vs 123 (13%) (P = .32). Compared to the usual care arm, the intervention arm had a higher mean (SD) number of sleep opportunity hours per night (4.95 [1.45] vs 4.57 [1.30], P < .001) and fewer nighttime vital sign checks (0.97 [0.95] vs 1.41 [0.86], P < .001). The post-discharge HCAHPS survey measuring patient satisfaction was completed by only 5% of patients (53 intervention, 49 usual care), and survey results were similar between the 2 arms (P = .86). In addition, safety outcomes including ICU transfers (49 [5%] vs 47 [5%], P = .92), rapid response calls (68 [7%] vs 55 [6%], P = .27), and code blue alarms (2 [0.2%] vs 9 [0.9%], P = .07) were similar between the study arms.
Conclusion: In this randomized clinical trial, a CDS tool utilizing a real-time prediction algorithm embedded in EHR did not reduce the incidence of delirium in hospitalized patients. However, this SPV CDS intervention helped physicians identify clinically stable patients who can forgo routine nighttime vital sign checks and facilitated greater opportunity for patients to sleep. These findings suggest that augmenting physician judgment using a real-time prediction algorithm can help to improve sleep opportunity without an accompanying increased risk of clinical decompensation during acute care.
Commentary
High-quality sleep is fundamental to health and well-being. Sleep deprivation and disorders are associated with many adverse health outcomes, including increased risks for obesity, diabetes, hypertension, myocardial infarction, and depression.1 In hospitalized patients who are acutely ill, restorative sleep is critical to facilitating recovery. However, poor sleep is exceedingly common in hospitalized patients and is associated with deleterious outcomes, such as high blood pressure, hyperglycemia, and delirium.2,3 Moreover, some of these adverse sleep-induced cardiometabolic outcomes, as well as sleep disruption itself, may persist after hospital discharge.4 Factors that precipitate interrupted sleep during hospitalization include iatrogenic causes such as frequent vital sign checks, nighttime procedures or early morning blood draws, and environmental factors such as loud ambient noise.3 Thus, a potential intervention to improve sleep quality in the hospital is to reduce nighttime interruptions such as frequent vital sign checks.
In the current study, Najafi and colleagues conducted a randomized trial to evaluate whether a CDS tool embedded in EHR, powered by a real-time prediction algorithm of patient data, can be utilized to identify patients in whom vital sign checks can be safely discontinued at nighttime. The authors found a modest but statistically significant reduction in the number of nighttime vital sign checks in patients who underwent the SPV CDS intervention, and a corresponding higher sleep opportunity per night in those who received the intervention. Importantly, this reduction in nighttime vital sign checks did not cause a higher risk of clinical decompensation as measured by ICU transfers, rapid response calls, or code blue alarms. Thus, the results demonstrated the feasibility of using a real-time, patient data-driven CDS tool to augment physician judgment in managing sleep disruption, an important hospital-associated stressor and a common hazard of hospitalization in older patients.
Delirium is a common clinical problem in hospitalized older patients that is associated with prolonged hospitalization, functional and cognitive decline, institutionalization, death, and increased health care costs.5 Despite a potential benefit of SPV CDS intervention in reducing vital sign checks and increasing sleep opportunity, this intervention did not reduce the incidence of delirium in hospitalized patients. This finding is not surprising given that delirium has a multifactorial etiology (eg, metabolic derangements, infections, medication side effects and drug toxicity, hospital environment). A small modification in nighttime vital sign checks and sleep opportunity may have limited impact on optimizing sleep quality and does not address other risk factors for delirium. As such, a multicomponent nonpharmacologic approach that includes sleep enhancement, early mobilization, feeding assistance, fluid repletion, infection prevention, and other interventions should guide delirium prevention in the hospital setting. The SPV CDS intervention may play a role in the delivery of a multifaceted, nonpharmacologic delirium prevention intervention in high-risk individuals.
Sleep disruption is one of the multiple hazards of hospitalization frequently experience by hospitalized older patients. Other hazards, or hospital-associated stressors, include mobility restriction (eg, physical restraints such as urinary catheters and intravenous lines, bed elevation and rails), malnourishment and dehydration (eg, frequent use of no-food-by-mouth order, lack of easy access to hydration), and pain (eg, poor pain control). Extended exposures to these stressors may lead to a maladaptive state called allostatic overload that transiently increases vulnerability to post-hospitalization adverse events, including emergency department use, hospital readmission, or death (ie, post-hospital syndrome).6 Thus, the optimization of sleep during hospitalization in vulnerable patients may have benefits that extend beyond delirium prevention. It is perceivable that a CDS tool embedded in EHR, powered by a real-time prediction algorithm of patient data, may be applied to reduce some of these hazards of hospitalization in addition to improving sleep opportunity.
Applications for Clinical Practice
Findings from the current study indicate that a CDS tool embedded in EHR that utilizes a real-time prediction algorithm of patient data may help to safely improve sleep opportunity in hospitalized patients. The participants in the current study were relatively young (53 [15] years). Given that age is a risk factor for delirium, the effects of this intervention on delirium prevention in the most susceptible population (ie, those over the age of 65) remain unknown and further investigation is warranted. Additional studies are needed to determine whether this approach yields similar results in geriatric patients and improves clinical outcomes.
—Fred Ko, MD
1. Institute of Medicine (US) Committee on Sleep Medicine and Research. Sleep Disorders and Sleep Deprivation: An Unmet Public Health Problem. Colten HR, Altevogt BM, editors. National Academies Press (US); 2006.
2. Pilkington S. Causes and consequences of sleep deprivation in hospitalised patients. Nurs Stand. 2013;27(49):350-342. doi:10.7748/ns2013.08.27.49.35.e7649
3. Stewart NH, Arora VM. Sleep in hospitalized older adults. Sleep Med Clin. 2018;13(1):127-135. doi:10.1016/j.jsmc.2017.09.012
4. Altman MT, Knauert MP, Pisani MA. Sleep disturbance after hospitalization and critical illness: a systematic review. Ann Am Thorac Soc. 2017;14(9):1457-1468. doi:10.1513/AnnalsATS.201702-148SR
5. Oh ES, Fong TG, Hshieh TT, Inouye SK. Delirium in older persons: advances in diagnosis and treatment. JAMA. 2017;318(12):1161-1174. doi:10.1001/jama.2017.12067
6. Goldwater DS, Dharmarajan K, McEwan BS, Krumholz HM. Is posthospital syndrome a result of hospitalization-induced allostatic overload? J Hosp Med. 2018;13(5). doi:10.12788/jhm.2986
Study Overview
Objective: This study evaluated whether a clinical-decision-support (CDS) tool that utilizes a real-time algorithm incorporating patient vital sign data can identify hospitalized patients who can forgo overnight vital sign checks and thus reduce delirium incidence.
Design: This was a parallel randomized clinical trial of adult inpatients admitted to the general medical service of a tertiary care academic medical center in the United States. The trial intervention consisted of a CDS notification in the electronic health record (EHR) that informed the physician if a patient had a high likelihood of nighttime vital signs within the reference ranges based on a logistic regression model of real-time patient data input. This notification provided the physician an opportunity to discontinue nighttime vital sign checks, dismiss the notification for 1 hour, or dismiss the notification until the next day.
Setting and participants: This clinical trial was conducted at the University of California, San Francisco Medical Center from March 11 to November 24, 2019. Participants included physicians who served on the primary team (eg, attending, resident) of 1699 patients on the general medical service who were outside of the intensive care unit (ICU). The hospital encounters were randomized (allocation ratio of 1:1) to sleep promotion vitals CDS (SPV CDS) intervention or usual care.
Main outcome and measures: The primary outcome was delirium as determined by bedside nurse assessment using the Nursing Delirium Screening Scale (Nu-DESC) recorded once per nursing shift. The Nu-DESC is a standardized delirium screening tool that defines delirium with a score ≥2. Secondary outcomes included sleep opportunity (ie, EHR-based sleep metrics that reflected the maximum time between iatrogenic interruptions, such as nighttime vital sign checks) and patient satisfaction (ie, patient satisfaction measured by standardized Hospital Consumer Assessment of Healthcare Providers and Systems [HCAHPS] survey). Potential balancing outcomes were assessed to ensure that reduced vital sign checks were not causing harms; these included ICU transfers, rapid response calls, and code blue alarms. All analyses were conducted on the basis of intention-to-treat.
Main results: A total of 3025 inpatient encounters were screened and 1930 encounters were randomized (966 SPV CDS intervention; 964 usual care). The randomized encounters consisted of 1699 patients; demographic factors between the 2 trial arms were similar. Specifically, the intervention arm included 566 men (59%) and mean (SD) age was 53 (15) years. The incidence of delirium was similar between the intervention and usual care arms: 108 (11%) vs 123 (13%) (P = .32). Compared to the usual care arm, the intervention arm had a higher mean (SD) number of sleep opportunity hours per night (4.95 [1.45] vs 4.57 [1.30], P < .001) and fewer nighttime vital sign checks (0.97 [0.95] vs 1.41 [0.86], P < .001). The post-discharge HCAHPS survey measuring patient satisfaction was completed by only 5% of patients (53 intervention, 49 usual care), and survey results were similar between the 2 arms (P = .86). In addition, safety outcomes including ICU transfers (49 [5%] vs 47 [5%], P = .92), rapid response calls (68 [7%] vs 55 [6%], P = .27), and code blue alarms (2 [0.2%] vs 9 [0.9%], P = .07) were similar between the study arms.
Conclusion: In this randomized clinical trial, a CDS tool utilizing a real-time prediction algorithm embedded in EHR did not reduce the incidence of delirium in hospitalized patients. However, this SPV CDS intervention helped physicians identify clinically stable patients who can forgo routine nighttime vital sign checks and facilitated greater opportunity for patients to sleep. These findings suggest that augmenting physician judgment using a real-time prediction algorithm can help to improve sleep opportunity without an accompanying increased risk of clinical decompensation during acute care.
Commentary
High-quality sleep is fundamental to health and well-being. Sleep deprivation and disorders are associated with many adverse health outcomes, including increased risks for obesity, diabetes, hypertension, myocardial infarction, and depression.1 In hospitalized patients who are acutely ill, restorative sleep is critical to facilitating recovery. However, poor sleep is exceedingly common in hospitalized patients and is associated with deleterious outcomes, such as high blood pressure, hyperglycemia, and delirium.2,3 Moreover, some of these adverse sleep-induced cardiometabolic outcomes, as well as sleep disruption itself, may persist after hospital discharge.4 Factors that precipitate interrupted sleep during hospitalization include iatrogenic causes such as frequent vital sign checks, nighttime procedures or early morning blood draws, and environmental factors such as loud ambient noise.3 Thus, a potential intervention to improve sleep quality in the hospital is to reduce nighttime interruptions such as frequent vital sign checks.
In the current study, Najafi and colleagues conducted a randomized trial to evaluate whether a CDS tool embedded in EHR, powered by a real-time prediction algorithm of patient data, can be utilized to identify patients in whom vital sign checks can be safely discontinued at nighttime. The authors found a modest but statistically significant reduction in the number of nighttime vital sign checks in patients who underwent the SPV CDS intervention, and a corresponding higher sleep opportunity per night in those who received the intervention. Importantly, this reduction in nighttime vital sign checks did not cause a higher risk of clinical decompensation as measured by ICU transfers, rapid response calls, or code blue alarms. Thus, the results demonstrated the feasibility of using a real-time, patient data-driven CDS tool to augment physician judgment in managing sleep disruption, an important hospital-associated stressor and a common hazard of hospitalization in older patients.
Delirium is a common clinical problem in hospitalized older patients that is associated with prolonged hospitalization, functional and cognitive decline, institutionalization, death, and increased health care costs.5 Despite a potential benefit of SPV CDS intervention in reducing vital sign checks and increasing sleep opportunity, this intervention did not reduce the incidence of delirium in hospitalized patients. This finding is not surprising given that delirium has a multifactorial etiology (eg, metabolic derangements, infections, medication side effects and drug toxicity, hospital environment). A small modification in nighttime vital sign checks and sleep opportunity may have limited impact on optimizing sleep quality and does not address other risk factors for delirium. As such, a multicomponent nonpharmacologic approach that includes sleep enhancement, early mobilization, feeding assistance, fluid repletion, infection prevention, and other interventions should guide delirium prevention in the hospital setting. The SPV CDS intervention may play a role in the delivery of a multifaceted, nonpharmacologic delirium prevention intervention in high-risk individuals.
Sleep disruption is one of the multiple hazards of hospitalization frequently experience by hospitalized older patients. Other hazards, or hospital-associated stressors, include mobility restriction (eg, physical restraints such as urinary catheters and intravenous lines, bed elevation and rails), malnourishment and dehydration (eg, frequent use of no-food-by-mouth order, lack of easy access to hydration), and pain (eg, poor pain control). Extended exposures to these stressors may lead to a maladaptive state called allostatic overload that transiently increases vulnerability to post-hospitalization adverse events, including emergency department use, hospital readmission, or death (ie, post-hospital syndrome).6 Thus, the optimization of sleep during hospitalization in vulnerable patients may have benefits that extend beyond delirium prevention. It is perceivable that a CDS tool embedded in EHR, powered by a real-time prediction algorithm of patient data, may be applied to reduce some of these hazards of hospitalization in addition to improving sleep opportunity.
Applications for Clinical Practice
Findings from the current study indicate that a CDS tool embedded in EHR that utilizes a real-time prediction algorithm of patient data may help to safely improve sleep opportunity in hospitalized patients. The participants in the current study were relatively young (53 [15] years). Given that age is a risk factor for delirium, the effects of this intervention on delirium prevention in the most susceptible population (ie, those over the age of 65) remain unknown and further investigation is warranted. Additional studies are needed to determine whether this approach yields similar results in geriatric patients and improves clinical outcomes.
—Fred Ko, MD
1. Institute of Medicine (US) Committee on Sleep Medicine and Research. Sleep Disorders and Sleep Deprivation: An Unmet Public Health Problem. Colten HR, Altevogt BM, editors. National Academies Press (US); 2006.
2. Pilkington S. Causes and consequences of sleep deprivation in hospitalised patients. Nurs Stand. 2013;27(49):350-342. doi:10.7748/ns2013.08.27.49.35.e7649
3. Stewart NH, Arora VM. Sleep in hospitalized older adults. Sleep Med Clin. 2018;13(1):127-135. doi:10.1016/j.jsmc.2017.09.012
4. Altman MT, Knauert MP, Pisani MA. Sleep disturbance after hospitalization and critical illness: a systematic review. Ann Am Thorac Soc. 2017;14(9):1457-1468. doi:10.1513/AnnalsATS.201702-148SR
5. Oh ES, Fong TG, Hshieh TT, Inouye SK. Delirium in older persons: advances in diagnosis and treatment. JAMA. 2017;318(12):1161-1174. doi:10.1001/jama.2017.12067
6. Goldwater DS, Dharmarajan K, McEwan BS, Krumholz HM. Is posthospital syndrome a result of hospitalization-induced allostatic overload? J Hosp Med. 2018;13(5). doi:10.12788/jhm.2986
Early Hospital Discharge Following PCI for Patients With STEMI
Study Overview
Objective: To assess the safety and efficacy of early hospital discharge (EHD) for selected low-risk patients with ST-segment elevation myocardial infarction (STEMI) after primary percutaneous coronary intervention (PCI).
Design: Single-center retrospective analysis of prospectively collected data.
Setting and participants: An EHD group comprised of 600 patients who were discharged at <48 hours between April 2020 and June 2021 was compared to a control group of 700 patients who met EHD criteria but were discharged at >48 hour between October 2018 and June 2021. Patients were selected into the EHD group based on the following criteria, in accordance with recommendations from the European Society of Cardiology, and all patients had close follow-up with a combination of structured telephone follow-up at 48 hours post discharge and virtual visits at 2, 6, and 8 weeks and at 3 months:
- Left ventricular ejection fraction ≥40%
- Successful primary PCI (that achieved thrombolysis in myocardial infarction flow grade 3)
- Absence of severe nonculprit disease requiring further inpatient revascularization
- Absence of ischemic symptoms post PCI
- Absence of heart failure or hemodynamic instability
- Absence of significant arrhythmia (ventricular fibrillation, ventricular tachycardia, or atrial fibrillation or atrial flutter requiring prolonged stay)
- Mobility with suitable social circumstances for discharge
Main outcome measures: The outcomes measured were length of hospitalization and a composite primary endpoint of cardiovascular mortality and major adverse cardiovascular event (MACE) rates, defined as a composite of all-cause mortality, recurrent MI, and target lesion revascularization.
Main results: The median length of stay of hospitalization in the EHD group was 24.6 hours compared to 56.1 hours in the >48-hour historical control group. On median follow-up of 271 days, the EHD group demonstrated 0% cardiovascular mortality and a MACE rate of 1.2%. This was shown to be noninferior compared to the >48-hour historical control group, which had mortality of 0.7% and a MACE rate of 1.9%.
Conclusion: Selected low-risk STEMI patients can be safely discharged early with appropriate follow-up after primary PCI.
Commentary
Patients with STEMI have a higher risk of postprocedural adverse events such as MI, arrhythmia, or acute heart failure compared to patients with stable ischemic heart disease, and thus are monitored after primary PCI. Although patients were traditionally monitored for 5 to 7 days a few decades ago,1 with improvements in PCI techniques, devices, and pharmacotherapy as well as in door-to-balloon time, the in-hospital complication rates for patients with STEMI have been decreasing, leading to earlier discharge. Currently in the United States, patients are most commonly monitored for 48 to 72 hours post PCI.2 The current guidelines support this practice, recommending early discharge within 48 to 72 hours in selected low-risk patients if adequate follow-up and rehabilitation are arranged.3
Given the COVID-19 pandemic and decreased hospital bed availability, Rathod et al took one step further on the question of whether low-risk STEMI patients with primary PCI can be discharged safely within 48 hours with adequate follow-up. They found that at a median follow-up of 271 days, EHD patients had 2 COVID-related deaths, with 0% cardiovascular mortality and a MACE rate of 1.2%, including deaths, MI, and ischemic revascularization. The median time to discharge was 25 hours. This was noninferior to the >48-hour historical control group, which had mortality of 0.7% (P = 0.349) and a MACE rate of 1.9% (P = .674). The results remained similar after propensity matching for mortality (0.34% vs 0.69%, P = .410) or MACE (1.2% vs 1.9%, P = .342).
This is the first prospective study to systematically assess the safety and feasibility of discharge of low-risk STEMI patients with primary PCI within 48 hours. This study is unique in that it involved the use of telemedicine, including a virtual platform to collect data such as heart rate, blood pressure, and blood glucose, and virtual visits to facilitate follow-up and reduce clinic travel, cost, and potential COVID-19 exposure. The investigators’ protocol included virtual follow-up by cardiology advanced practitioners at 2, 6, and 8 weeks and by an interventional cardiologist at 12 weeks. This protocol led to an increase in patient satisfaction. The study’s main limitation is that it is a single-center trial with a smaller sample size. Further studies are necessary to confirm the safety and feasibility of this approach. In addition, further refinement of the patient selection criteria for EHD should be considered.
Applications for Clinical Practice
In low-risk STEMI patients after primary PCI, discharge within 48 hours may be considered if close follow-up is arranged. However, further studies are necessary to confirm this finding.
—Thai Nguyen, MD, Albert Chan, MD, and Taishi Hirai MD
1. Grines CL, Marsalese DL, Brodie B, et al. Safety and cost-effectiveness of early discharge after primary angioplasty in low risk patients with acute myocardial infarction. PAMI-II Investigators. Primary Angioplasty in Myocardial Infarction. J Am Coll Cardiol. 1998;31:967-72. doi:10.1016/s0735-1097(98)00031-x
2. Seto AH, Shroff A, Abu-Fadel M, et al. Length of stay following percutaneous coronary intervention: An expert consensus document update from the society for cardiovascular angiography and interventions. Catheter Cardiovasc Interv. 2018;92:717-731. doi:10.1002/ccd.27637
3. Ibanez B, James S, Agewall S, et al. 2017 ESC Guidelines for the management of acute myocardial infarction in patients presenting with ST-segment elevation. Eur Heart J. 2018;39:119-177. doi:10.1093/eurheartj/ehx393
Study Overview
Objective: To assess the safety and efficacy of early hospital discharge (EHD) for selected low-risk patients with ST-segment elevation myocardial infarction (STEMI) after primary percutaneous coronary intervention (PCI).
Design: Single-center retrospective analysis of prospectively collected data.
Setting and participants: An EHD group comprised of 600 patients who were discharged at <48 hours between April 2020 and June 2021 was compared to a control group of 700 patients who met EHD criteria but were discharged at >48 hour between October 2018 and June 2021. Patients were selected into the EHD group based on the following criteria, in accordance with recommendations from the European Society of Cardiology, and all patients had close follow-up with a combination of structured telephone follow-up at 48 hours post discharge and virtual visits at 2, 6, and 8 weeks and at 3 months:
- Left ventricular ejection fraction ≥40%
- Successful primary PCI (that achieved thrombolysis in myocardial infarction flow grade 3)
- Absence of severe nonculprit disease requiring further inpatient revascularization
- Absence of ischemic symptoms post PCI
- Absence of heart failure or hemodynamic instability
- Absence of significant arrhythmia (ventricular fibrillation, ventricular tachycardia, or atrial fibrillation or atrial flutter requiring prolonged stay)
- Mobility with suitable social circumstances for discharge
Main outcome measures: The outcomes measured were length of hospitalization and a composite primary endpoint of cardiovascular mortality and major adverse cardiovascular event (MACE) rates, defined as a composite of all-cause mortality, recurrent MI, and target lesion revascularization.
Main results: The median length of stay of hospitalization in the EHD group was 24.6 hours compared to 56.1 hours in the >48-hour historical control group. On median follow-up of 271 days, the EHD group demonstrated 0% cardiovascular mortality and a MACE rate of 1.2%. This was shown to be noninferior compared to the >48-hour historical control group, which had mortality of 0.7% and a MACE rate of 1.9%.
Conclusion: Selected low-risk STEMI patients can be safely discharged early with appropriate follow-up after primary PCI.
Commentary
Patients with STEMI have a higher risk of postprocedural adverse events such as MI, arrhythmia, or acute heart failure compared to patients with stable ischemic heart disease, and thus are monitored after primary PCI. Although patients were traditionally monitored for 5 to 7 days a few decades ago,1 with improvements in PCI techniques, devices, and pharmacotherapy as well as in door-to-balloon time, the in-hospital complication rates for patients with STEMI have been decreasing, leading to earlier discharge. Currently in the United States, patients are most commonly monitored for 48 to 72 hours post PCI.2 The current guidelines support this practice, recommending early discharge within 48 to 72 hours in selected low-risk patients if adequate follow-up and rehabilitation are arranged.3
Given the COVID-19 pandemic and decreased hospital bed availability, Rathod et al took one step further on the question of whether low-risk STEMI patients with primary PCI can be discharged safely within 48 hours with adequate follow-up. They found that at a median follow-up of 271 days, EHD patients had 2 COVID-related deaths, with 0% cardiovascular mortality and a MACE rate of 1.2%, including deaths, MI, and ischemic revascularization. The median time to discharge was 25 hours. This was noninferior to the >48-hour historical control group, which had mortality of 0.7% (P = 0.349) and a MACE rate of 1.9% (P = .674). The results remained similar after propensity matching for mortality (0.34% vs 0.69%, P = .410) or MACE (1.2% vs 1.9%, P = .342).
This is the first prospective study to systematically assess the safety and feasibility of discharge of low-risk STEMI patients with primary PCI within 48 hours. This study is unique in that it involved the use of telemedicine, including a virtual platform to collect data such as heart rate, blood pressure, and blood glucose, and virtual visits to facilitate follow-up and reduce clinic travel, cost, and potential COVID-19 exposure. The investigators’ protocol included virtual follow-up by cardiology advanced practitioners at 2, 6, and 8 weeks and by an interventional cardiologist at 12 weeks. This protocol led to an increase in patient satisfaction. The study’s main limitation is that it is a single-center trial with a smaller sample size. Further studies are necessary to confirm the safety and feasibility of this approach. In addition, further refinement of the patient selection criteria for EHD should be considered.
Applications for Clinical Practice
In low-risk STEMI patients after primary PCI, discharge within 48 hours may be considered if close follow-up is arranged. However, further studies are necessary to confirm this finding.
—Thai Nguyen, MD, Albert Chan, MD, and Taishi Hirai MD
1. Grines CL, Marsalese DL, Brodie B, et al. Safety and cost-effectiveness of early discharge after primary angioplasty in low risk patients with acute myocardial infarction. PAMI-II Investigators. Primary Angioplasty in Myocardial Infarction. J Am Coll Cardiol. 1998;31:967-72. doi:10.1016/s0735-1097(98)00031-x
2. Seto AH, Shroff A, Abu-Fadel M, et al. Length of stay following percutaneous coronary intervention: An expert consensus document update from the society for cardiovascular angiography and interventions. Catheter Cardiovasc Interv. 2018;92:717-731. doi:10.1002/ccd.27637
3. Ibanez B, James S, Agewall S, et al. 2017 ESC Guidelines for the management of acute myocardial infarction in patients presenting with ST-segment elevation. Eur Heart J. 2018;39:119-177. doi:10.1093/eurheartj/ehx393
Physical exercise might contribute to increased BDNF levels in MS
Key clinical point: Physical activity increased peripheral levels of brain-derived neurotrophic factor (BDNF) in patients with multiple sclerosis (MS).
Major finding: Serum BDNF concentrations were significantly higher after exercise intervention compared with the preintervention levels (standardized mean difference 0.3309; P = .0275).
Study details: This was a meta-analysis of 13 exercise intervention clinical trials involving 271 patients with MS.
Disclosures: The authors did not receive any funding for this work. The authors declared no conflicts of interest.
Source: Shobeiri P et al. Exercise-induced increase in blood-based brain-derived neurotrophic factor (BDNF) in people with multiple sclerosis: A systematic review and meta-analysis of exercise intervention trials. PLoS One. 2022;17(3):e0264557 (Mar 3). Doi: 10.1371/journal.pone.0264557
Smoking cessation could prevent a large proportion of MS cases
Key clinical point: At least 13% of cases of multiple sclerosis (MS) can be prevented if tobacco smoking is avoided, indicating the need for integrated programs aimed not only at smoking cessation but also at smoking prevention.
Major finding: The overall attributable fraction (AF) of MS because of smoking was 13.1% (95% CI 10.7%-15.4%), with AF being 0.6% (95% CI 0%-2%) in ex-smokers, indicating the beneficial effects of smoking cessation. Ever-smokers were at a 41% (95% CI 1.33%-1.50%) increased risk for MS than never smokers.
Study details: This was a population-based matched case-control study including 9,419 patients with MS and 9,419 matched control individuals.
Disclosures: No external funding was received for this study. The authors declared no conflicts of interest.
Source: Manouchehrinia A et al. Smoking attributable risk in multiple sclerosis. Front Immunol. 2022;13:840158 (Mar 3). Doi: 10.3389/fimmu.2022.840158
RMS: Extended ofatumumab treatment presents favorable benefit-risk profile in ALITHIOS study
Key clinical point: Extended treatment with ofatumumab for up to 3.5 years was well tolerated without any new risks in patients with relapsing multiple sclerosis (RMS).
Major finding: Overall, 83.8% and 9.7% of patients experienced at least 1 adverse event (AE) and serious AE, respectively. Systemic injection-related reactions, infections, and malignancies were reported in 24.8%, 54.3%, and 0.3% of patients, respectively. In most patients, the mean serum immunoglobulin (Ig) G and IgM levels were stable and above the lower limit of normal and the risk for serious infections was low.
Study details: Findings are from the ongoing phase 3b ALITHIOS umbrella extension trial involving 1,969 patients with RMS who completed ASCLEPIOS I/II, APLIOS, or APOLITOS trial and continued or switched to ofatumumab in ALITHIOS.
Disclosures: This study was funded by Novartis Pharma AG (Basel, Switzerland). The authors declared receiving consultancy fees, personal compensation, travel reimbursement, research support, or serving on advisory boards for various sources including Novartis Pharma AG. Some authors declared being employees of Novartis Pharma AG.
Source: Hauser SL et al. Safety experience with continued exposure to ofatumumab in patients with relapsing forms of multiple sclerosis for up to 3.5 years. Mult Scler. 2022 (Mar 1). Doi: 10.1177/13524585221079731
Multiple sclerosis: Discontinuing fingolimod improves humoral response after SARS-CoV-2 vaccination
Key clinical point: Short-term fingolimod discontinuation until the absolute lymphocyte count increases to >1,000 cells/mm3 may improve the SARS-CoV-2 mRNA vaccine-specific humoral response in patients with multiple sclerosis (MS) but not the adaptive cellular response.
Major finding: Overall, 80% vs. 20% of patients in the fingolimod-discontinuation vs. fingolimod-continuation group developed a positive humoral response against SARS-CoV-2 1 month after the third vaccine dose, with a significantly higher median immunoglobulin (Ig) G titer in the fingolimod-discontinuation vs. fingolimod-continuation group (202.3 vs. 26.4 binding antibody units/mL; P = .022).
Study details: This was a prospective monocentric 3-month randomized clinical trial involving 20 patients with relapsing-remitting MS on fingolimod therapy who received the third dose of BNT162b2 vaccine after failing to develop a humoral IgG immune response to the previous 2 doses and were randomly assigned to the fingolimod-continuation or fingolimod-discontinuation group.
Disclosures: This study was supported by Sheba Multiple Sclerosis Research Grant. The authors declared no conflicts of interest.
Source: Achiron A et al. Immune response to the third COVID-19 vaccine dose is related to lymphocyte count in multiple sclerosis patients treated with fingolimod. J Neurol. 2022 (Mar 2). Doi: 10.1007/s00415-022-11030-0
Flu vaccination does not increase risk for infections or relapse in MS
Key clinical point: Vaccination against influenza was well tolerated in patients with multiple sclerosis (MS) who mainly experienced short-term nonserious adverse events following immunization (AEFI), with the risk for MS relapse not being significantly different than those who were not vaccinated.
Major finding: Overall, 60.2% of patients did not experience any vaccine-related AEFIs, with pain at the injection site (68.1%), headache (10.6%), flu-like symptoms (17%), and fatigue (4.3%) being the major nonserious short-term AEFIs. The long-term AEFIs included flu-like symptoms, COVID-19, and MS relapse, with incidences of infection or MS relapse (P = .65) and cumulative survival rate (P = .21) not being significantly different between the vaccinated and unvaccinated groups.
Study details: This was a single-center, prospective, vaccination-vigilance trial including 194 patients with MS, of whom 113 patients received any of the recommended flu vaccines and 81 did not.
Disclosures: The study received no external funding. GT Maniscalco declared serving on speaking and advisory boards and receiving speaker fees from various sources. Other authors declared no conflicts of interest.
Source: Maniscalco GT et al. Flu vaccination in multiple sclerosis patients: A monocentric prospective vaccine-vigilance study. Expert Opin Drug Saf. 2022 (Feb 22). Doi: 10.1080/14740338.2022.2044787
Hormone therapy use and disability accrual in women with MS
Key clinical point: Over 22 years of follow-up found no association between the use of hormone therapy (HT) and the risk for disability accrual in women with multiple sclerosis (MS) treated with a disease-modifying therapy (DMT) when used for <5 years.
Major finding: Overall, current HT use vs. no use was not associated with a significantly higher risk for disability accrual; however, the risk of reaching 6-month confirmed and sustained Expanded Disability Status Scale 4 increased from 0.6 (95% CI 0.3-1.2) after <1 year of use to 1.4 (95% CI 0.9-2.2) after >5 years of HT use vs. no use.
Study details: The data come from a nationwide, population-based cohort study of 3,325 women with relapsing-remitting MS treated with DMT.
Disclosures: This study received no external funding. TI Kopp revealed his role as an adviser for Novartis and received Biogen's sponsorship for congress participation. M Magyari declared serving as an advisor and receiving honoraria for lecturing and research support for congress participation from various sources. Ø Lidegaard had no conflicts of interest.
Source: Kopp TI et al. Hormone therapy and disease activity in Danish women with multiple sclerosis: A population-based cohort study. Eur J Neurol. 2022 (Feb 23). Doi: 10.1111/ene.15299
Purulent Nodule on the Mandible
The Diagnosis: Odontogenic Cutaneous Sinus Tract
In our patient, panoramic radiography showed a radiolucency in the periapex of the mandibular first molar (Figure 1). Ultrasonography depicted a hypoechoic band that originated from the cutaneous lesion and extended through the subcutaneous tissue to the defective alveolar bone, suggesting odontogenic inflammation (Figure 2).1 The infected pulp was removed, and the purulent nodules then disappeared.

The dental etiology of odontogenic cutaneous sinus tracts can be confirmed by panoramic radiography and ultrasonography. The odontogenic sinus path can be clearly observed via radiography by injecting or inserting a radiopaque substance into the sinus tract.2 Effective treatment of the diseased tooth is removal of the infected pulp, performance of a root canal to eliminate infection, closure and filling of the root canal, and repair of the crown. Once the source of infection is eliminated, the sinus typically subsides within 2 weeks. When residual skin retreats or scars are present, cosmetic surgery can be performed to improve the appearance.3,4

Odontogenic cutaneous sinus tracts usually are caused by a route of drainage from a chronic apical abscess. They follow a path of least resistance through the alveolar bone and periosteum, spreading into the surrounding soft tissues. With the formation of abscesses, sinus tracts will erupt intraorally or cutaneously, depending on the relationship of the posterior tooth apices to the mandibular attachments of the mylohyoid and buccinator muscles and the maxillary attachment of the buccinator.2,5 Clinically, cutaneous lesions present as nodules, cysts, or dimples that have attached to deep tissues through the sinus tract. Half of patients may have no dental symptoms and often are misdiagnosed with nonodontogenic lesions. Subsequent improper treatments, such as repeated use of antibiotics, multiple biopsies, surgical excision, and chemotherapy, often are repeated and ineffective.6 The most common cause of chronic cutaneous sinus tracts in the face and neck is a chronically draining dental infection.2,5 A thorough history is necessary when odontogenic cutaneous sinuses are suspected. Toothache before the development of the sinus tract is an important diagnostic clue.
Pyogenic granuloma, syringocystadenoma papilliferum, osteomyelitis, infected epidermoid cyst, actinomycoses, and salivary gland fistula also should be considered in the differential diagnosis.7-10 Pyogenic granuloma (also known as lobular capillary hemangioma) is a benign overgrowth of capillaries showing a vascular phenotype that usually occurs as a response to different stimulating factors such as local stimuli, trauma, or hormonal factors. Clinically, pyogenic granuloma presents as a red, solitary, painless nodule on the face or distal extremities.11,12 Syringocystadenoma papilliferum is a benign adnexal proliferation with apocrine differentiation that usually presents as a hairless papillomatous plaque or nodule measuring 1 to 4 cm in diameter and often is first noted at birth or during early childhood.7 Osteomyelitis is progressive inflammation of the periosteum and bone marrow that rapidly breaks through the periosteum and spreads to surrounding areas. The mandible is the most susceptible bone for facial osteomyelitis.8 Epidermoid cysts are formed by the proliferation of epidermal cells within a circumscribed dermal space. Infection of the cysts is characterized by redness, swelling, heat, and pain. As the infection progresses, suppurative inflammation develops, leading to local liquefaction and abscesses.9
This case was initially misdiagnosed as infectious skin lesions by outside clinicians. Multiple surgical treatments and long-term antibiotic therapy were attempted before the correct diagnosis was made. The clinical diagnosis of odontogenic cutaneous sinus tracts is challenging due to the variety of affected sites and clinical signs. Ultrasonography should be performed as early as possible to identify the disease and avoid unnecessary surgery. For appropriate dental therapy, close liaison with the stomatology department is warranted.
- Shobatake C, Miyagawa F, Fukumoto T, et al. Usefulness of ultrasonography for rapidly diagnosing cutaneous sinus tracts of dental origin. Eur J Dermatol. 2014;24:683-687.
- Cioffi GA, Terezhalmy GT, Parlette HL. Cutaneous draining sinus tract: an odontogenic etiology. J Am Acad Dermatol. 1986;14:94-100.
- McWalter GM, Alexander JB, del Rio CE, et al. Cutaneous sinus tracts of dental etiology. Oral Surg Oral Med Oral Pathol. 1988;66:608-614.
- Spear KL, Sheridan PJ, Perry HO. Sinus tracts to the chin and jaw of dental origin. J Am Acad Dermatol. 1983;8:486-492.
- Lewin-Epstein J, Taicher S, Azaz B. Cutaneous sinus tracts of dental origin. Arch Dermatol. 1978;114:1158-1161.
- Mittal N, Gupta P. Management of extraoral sinus cases: a clinical dilemma. J Endod. 2004;30:541-547.
- Alegria-Landa V, Jo-Velasco M, Santonja C, et al. Syringocystadenoma papilliferum associated with verrucous carcinoma of the skin in the same lesion: report of four cases. J Cutan Pathol. 2020;47:12-16.
- Prasad KC, Prasad SC, Mouli N, et al. Osteomyelitis in the head and neck. Acta Otolaryngol. 2007;127:194-205.
- Hong SH, Chung HW, Choi JY, et al. MRI findings of subcutaneous epidermal cysts: emphasis on the presence of rupture. AJR Am J Roentgenol. 2006;186:961-966.
- Gefrerer L, Popowski W, Perek JN, et al. Recurrent pyogenic granuloma around dental implants: a rare case report. Int J Periodontics Restorative Dent. 2016;36:573-581.
- Chae JB, Park JT, Kim BR, et al. Agminated eruptive pyogenic granuloma on chin following redundant needle injections. J Dermatol. 2016;43:577-578.
- Thompson LD. Lobular capillary hemangioma (pyogenic granuloma) of the oral cavity. Ear Nose Throat J. 2017;96:240.
The Diagnosis: Odontogenic Cutaneous Sinus Tract
In our patient, panoramic radiography showed a radiolucency in the periapex of the mandibular first molar (Figure 1). Ultrasonography depicted a hypoechoic band that originated from the cutaneous lesion and extended through the subcutaneous tissue to the defective alveolar bone, suggesting odontogenic inflammation (Figure 2).1 The infected pulp was removed, and the purulent nodules then disappeared.
The dental etiology of odontogenic cutaneous sinus tracts can be confirmed by panoramic radiography and ultrasonography. The odontogenic sinus path can be clearly observed via radiography by injecting or inserting a radiopaque substance into the sinus tract.2 Effective treatment of the diseased tooth is removal of the infected pulp, performance of a root canal to eliminate infection, closure and filling of the root canal, and repair of the crown. Once the source of infection is eliminated, the sinus typically subsides within 2 weeks. When residual skin retreats or scars are present, cosmetic surgery can be performed to improve the appearance.3,4
Odontogenic cutaneous sinus tracts usually are caused by a route of drainage from a chronic apical abscess. They follow a path of least resistance through the alveolar bone and periosteum, spreading into the surrounding soft tissues. With the formation of abscesses, sinus tracts will erupt intraorally or cutaneously, depending on the relationship of the posterior tooth apices to the mandibular attachments of the mylohyoid and buccinator muscles and the maxillary attachment of the buccinator.2,5 Clinically, cutaneous lesions present as nodules, cysts, or dimples that have attached to deep tissues through the sinus tract. Half of patients may have no dental symptoms and often are misdiagnosed with nonodontogenic lesions. Subsequent improper treatments, such as repeated use of antibiotics, multiple biopsies, surgical excision, and chemotherapy, often are repeated and ineffective.6 The most common cause of chronic cutaneous sinus tracts in the face and neck is a chronically draining dental infection.2,5 A thorough history is necessary when odontogenic cutaneous sinuses are suspected. Toothache before the development of the sinus tract is an important diagnostic clue.
Pyogenic granuloma, syringocystadenoma papilliferum, osteomyelitis, infected epidermoid cyst, actinomycoses, and salivary gland fistula also should be considered in the differential diagnosis.7-10 Pyogenic granuloma (also known as lobular capillary hemangioma) is a benign overgrowth of capillaries showing a vascular phenotype that usually occurs as a response to different stimulating factors such as local stimuli, trauma, or hormonal factors. Clinically, pyogenic granuloma presents as a red, solitary, painless nodule on the face or distal extremities.11,12 Syringocystadenoma papilliferum is a benign adnexal proliferation with apocrine differentiation that usually presents as a hairless papillomatous plaque or nodule measuring 1 to 4 cm in diameter and often is first noted at birth or during early childhood.7 Osteomyelitis is progressive inflammation of the periosteum and bone marrow that rapidly breaks through the periosteum and spreads to surrounding areas. The mandible is the most susceptible bone for facial osteomyelitis.8 Epidermoid cysts are formed by the proliferation of epidermal cells within a circumscribed dermal space. Infection of the cysts is characterized by redness, swelling, heat, and pain. As the infection progresses, suppurative inflammation develops, leading to local liquefaction and abscesses.9
This case was initially misdiagnosed as infectious skin lesions by outside clinicians. Multiple surgical treatments and long-term antibiotic therapy were attempted before the correct diagnosis was made. The clinical diagnosis of odontogenic cutaneous sinus tracts is challenging due to the variety of affected sites and clinical signs. Ultrasonography should be performed as early as possible to identify the disease and avoid unnecessary surgery. For appropriate dental therapy, close liaison with the stomatology department is warranted.
- Shobatake C, Miyagawa F, Fukumoto T, et al. Usefulness of ultrasonography for rapidly diagnosing cutaneous sinus tracts of dental origin. Eur J Dermatol. 2014;24:683-687.
- Cioffi GA, Terezhalmy GT, Parlette HL. Cutaneous draining sinus tract: an odontogenic etiology. J Am Acad Dermatol. 1986;14:94-100.
- McWalter GM, Alexander JB, del Rio CE, et al. Cutaneous sinus tracts of dental etiology. Oral Surg Oral Med Oral Pathol. 1988;66:608-614.
- Spear KL, Sheridan PJ, Perry HO. Sinus tracts to the chin and jaw of dental origin. J Am Acad Dermatol. 1983;8:486-492.
- Lewin-Epstein J, Taicher S, Azaz B. Cutaneous sinus tracts of dental origin. Arch Dermatol. 1978;114:1158-1161.
- Mittal N, Gupta P. Management of extraoral sinus cases: a clinical dilemma. J Endod. 2004;30:541-547.
- Alegria-Landa V, Jo-Velasco M, Santonja C, et al. Syringocystadenoma papilliferum associated with verrucous carcinoma of the skin in the same lesion: report of four cases. J Cutan Pathol. 2020;47:12-16.
- Prasad KC, Prasad SC, Mouli N, et al. Osteomyelitis in the head and neck. Acta Otolaryngol. 2007;127:194-205.
- Hong SH, Chung HW, Choi JY, et al. MRI findings of subcutaneous epidermal cysts: emphasis on the presence of rupture. AJR Am J Roentgenol. 2006;186:961-966.
- Gefrerer L, Popowski W, Perek JN, et al. Recurrent pyogenic granuloma around dental implants: a rare case report. Int J Periodontics Restorative Dent. 2016;36:573-581.
- Chae JB, Park JT, Kim BR, et al. Agminated eruptive pyogenic granuloma on chin following redundant needle injections. J Dermatol. 2016;43:577-578.
- Thompson LD. Lobular capillary hemangioma (pyogenic granuloma) of the oral cavity. Ear Nose Throat J. 2017;96:240.
A 27-year-old man presented with a recurrent nodule with purulent discharge on the mandible of 3 months’ duration. He underwent several surgical excisions before he was referred to our outpatient clinic, but each time the lesion recurred. The patient was otherwise healthy with no associated discomfort. He denied exposure to animals or ticks, and he did not have a family history of similar lesions. He had a root canal treatment several years prior to the current presentation. Physical examination revealed 2 contiguous nodules with purulent secretions on the left mandible.

