User login
Addressing insulin price spikes will require supply chain reform
WASHINGTON – panelists said at a House Committee on Energy & Commerce hearing on insulin affordability.

“Each member of the supply chain has a responsibility to help solve this problem,” said Alvin C. Powers, MD, director of the Vanderbilt Diabetes Center at Vanderbilt University, who was speaking on behalf of the Endocrine Society during the April 2 hearing of the committee’s oversight & investigations subcommittee.
Dr. Powers identified all members – manufacturers, payers, pharmacy benefit managers, patients, providers, and Congress – as having a role in developing a solution that will encourage more access to the treatment.
The hearing was the first of two in a series specifically examining the price of insulin. This one focused on the role pricing issues play in terms of access to insulin and patient outcomes.
To highlight the pricing issues, it was noted that a vial of Humalog (insulin lispro) cost $21 when it was launched by Eli Lilly in 1996. It now costs $275 even though it has gone through no changes in formulation or innovation during that time.
Kasia Lipska, MD, of Yale University School of Medicine noted that a summer 2017 survey conducted by the Yale Diabetes Center found that one in four patients took less than the prescribed dose of insulin specifically because of the cost of insulin.
William Cefalu, MD, chief scientific, medical, and mission officer at the American Diabetes Association, echoed comments from Dr. Powers about pricing and suggested that simply going after list price is not a complete solution.
“There is also no guarantee that if the list price drops there [will] be substantive changes throughout the supply chain,” Dr. Cefalu said, adding that there needs to be a move away from a system based on high list prices and rebates and toward a system that ensures that any negotiated rebate or discount will find its way to the patient at the pharmacy counter.
“That’s what is not happening now,” Dr. Cefalu added. “Unless you can control what happens downstream in the intermediaries and what happens to the patient, there is no guarantee that just dropping list prices ... is going to get the job done.”
Aaron Kowalski, PhD, chief mission officer of JDRF, an organization that funds research into type 1 diabetes, also called out insurers as a part of the problem.
“What we are seeing in the community is people being switched [from their prescribed insulin for nonmedical reasons] by their insurance companies, not by the choice of their physician or the patient, which is just not the right way to practice medicine.”
He relayed an anecdote about a woman who went from having her blood sugar well controlled to dealing with severe cases of hyperglycemia because of changes in the medical coverage of her insulin. It took 8 hours on the phone with the insurance company, not to mention countless hours spent by the physician, to get the situation corrected and to get the proper insulin covered.
“This is a broken part of the system,” Dr. Kowalski said.
Dr. Cefalu noted that data are needed on the medical impact of switching for nonmedical reasons, such as changes to insurance coverage.
Christel Marchand Aprigliano, chief executive officer of the Diabetes Patient Advocacy Coalition, also relayed an anecdote of a friend who had suffered medical consequences of nonmedical switching of his insulin and then having to deal with his insurer’s fail-first policy before they would cover his original, medically effective insulin.
“Insurance has been denied twice because they believe that insulins are interchangeable, which they aren’t,” she said.
Michael Burgess, MD, (R-Texas) asked rhetorically during the hearing whether it would make sense for payers to simply provide insulin at no cost to patients, given the cost of medical complications resulting from lack of proper use as a result of pricing likely is much higher than covering insulin completely.
While specific legislative proposals were not discussed during the hearing, one thing that the panelists agreed would help to clarify all the factors that are contributing to the pricing increases is clear, transparent information about the finances surrounding the insulin as the product moves through the supply chain.
The Food and Drug Administration is also doing its part. Although the agency was not a participant in the hearing, the agency’s commissioner, Scott Gottlieb, MD, released a statement on the same day as the hearing in which he touted efforts in the biosimilar space that could spur competition.
“Once an interchangeable insulin product is approved and available on the market, it can be substituted for the reference product at the pharmacy, potentially leading to increased access [to insulin] and lower costs for patients,” he said in the statement. “The FDA anticipates that biosimilar and interchangeable insulin products will bring the competition that’s needed to help [deliver] affordable treatment options to patients.”
Dr Gottlieb did not say when a biosimilar insulin might be available on the market.
The second hearing in this series has not been scheduled, but is expected to take place the week of April 8 and will feature representatives from three insulin manufacturers and other participants in the supply chain.
WASHINGTON – panelists said at a House Committee on Energy & Commerce hearing on insulin affordability.
“Each member of the supply chain has a responsibility to help solve this problem,” said Alvin C. Powers, MD, director of the Vanderbilt Diabetes Center at Vanderbilt University, who was speaking on behalf of the Endocrine Society during the April 2 hearing of the committee’s oversight & investigations subcommittee.
Dr. Powers identified all members – manufacturers, payers, pharmacy benefit managers, patients, providers, and Congress – as having a role in developing a solution that will encourage more access to the treatment.
The hearing was the first of two in a series specifically examining the price of insulin. This one focused on the role pricing issues play in terms of access to insulin and patient outcomes.
To highlight the pricing issues, it was noted that a vial of Humalog (insulin lispro) cost $21 when it was launched by Eli Lilly in 1996. It now costs $275 even though it has gone through no changes in formulation or innovation during that time.
Kasia Lipska, MD, of Yale University School of Medicine noted that a summer 2017 survey conducted by the Yale Diabetes Center found that one in four patients took less than the prescribed dose of insulin specifically because of the cost of insulin.
William Cefalu, MD, chief scientific, medical, and mission officer at the American Diabetes Association, echoed comments from Dr. Powers about pricing and suggested that simply going after list price is not a complete solution.
“There is also no guarantee that if the list price drops there [will] be substantive changes throughout the supply chain,” Dr. Cefalu said, adding that there needs to be a move away from a system based on high list prices and rebates and toward a system that ensures that any negotiated rebate or discount will find its way to the patient at the pharmacy counter.
“That’s what is not happening now,” Dr. Cefalu added. “Unless you can control what happens downstream in the intermediaries and what happens to the patient, there is no guarantee that just dropping list prices ... is going to get the job done.”
Aaron Kowalski, PhD, chief mission officer of JDRF, an organization that funds research into type 1 diabetes, also called out insurers as a part of the problem.
“What we are seeing in the community is people being switched [from their prescribed insulin for nonmedical reasons] by their insurance companies, not by the choice of their physician or the patient, which is just not the right way to practice medicine.”
He relayed an anecdote about a woman who went from having her blood sugar well controlled to dealing with severe cases of hyperglycemia because of changes in the medical coverage of her insulin. It took 8 hours on the phone with the insurance company, not to mention countless hours spent by the physician, to get the situation corrected and to get the proper insulin covered.
“This is a broken part of the system,” Dr. Kowalski said.
Dr. Cefalu noted that data are needed on the medical impact of switching for nonmedical reasons, such as changes to insurance coverage.
Christel Marchand Aprigliano, chief executive officer of the Diabetes Patient Advocacy Coalition, also relayed an anecdote of a friend who had suffered medical consequences of nonmedical switching of his insulin and then having to deal with his insurer’s fail-first policy before they would cover his original, medically effective insulin.
“Insurance has been denied twice because they believe that insulins are interchangeable, which they aren’t,” she said.
Michael Burgess, MD, (R-Texas) asked rhetorically during the hearing whether it would make sense for payers to simply provide insulin at no cost to patients, given the cost of medical complications resulting from lack of proper use as a result of pricing likely is much higher than covering insulin completely.
While specific legislative proposals were not discussed during the hearing, one thing that the panelists agreed would help to clarify all the factors that are contributing to the pricing increases is clear, transparent information about the finances surrounding the insulin as the product moves through the supply chain.
The Food and Drug Administration is also doing its part. Although the agency was not a participant in the hearing, the agency’s commissioner, Scott Gottlieb, MD, released a statement on the same day as the hearing in which he touted efforts in the biosimilar space that could spur competition.
“Once an interchangeable insulin product is approved and available on the market, it can be substituted for the reference product at the pharmacy, potentially leading to increased access [to insulin] and lower costs for patients,” he said in the statement. “The FDA anticipates that biosimilar and interchangeable insulin products will bring the competition that’s needed to help [deliver] affordable treatment options to patients.”
Dr Gottlieb did not say when a biosimilar insulin might be available on the market.
The second hearing in this series has not been scheduled, but is expected to take place the week of April 8 and will feature representatives from three insulin manufacturers and other participants in the supply chain.
REPORTING FROM A HOUSE ENERGY & COMMERCE SUBCOMMITTEE HEARING
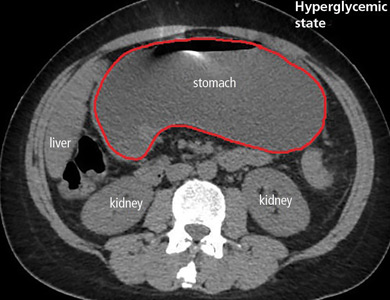
Gastroparesis in a patient with diabetic ketoacidosis
A 40-year-old man with type 1 diabetes mellitus and recurrent renal calculi presented to the emergency department with nausea, vomiting, and abdominal pain for the past day. He had been checking his blood glucose level regularly, and it had usually been within the normal range until 2 or 3 days previously, when he stopped taking his insulin because he ran out and could not afford to buy more.
He said he initially vomited clear mucus but then had 2 episodes of black vomit. His abdominal pain was diffuse but more intense in his flanks. He said he had never had nausea or vomiting before this episode.
In the emergency department, his heart rate was 136 beats per minute and respiratory rate 24 breaths per minute. He appeared to be in mild distress, and physical examination revealed a distended abdomen, decreased bowel sounds on auscultation, tympanic sound elicited by percussion, and diffuse abdominal tenderness to palpation without rebound tenderness or rigidity. His blood glucose level was 993 mg/dL, and his anion gap was 36 mmol/L.
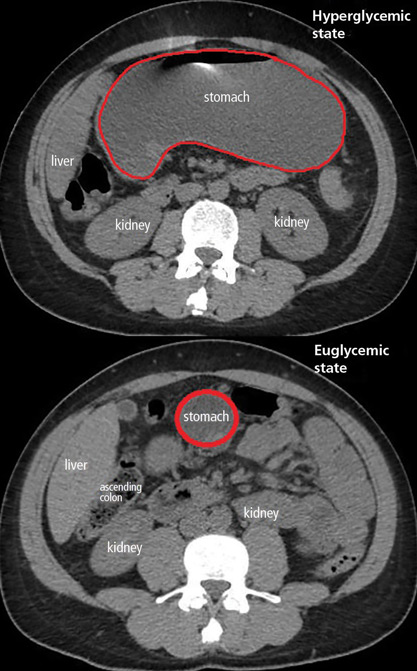
The patient was treated with hydration, insulin, and a nasogastric tube to relieve the pressure. The following day, his symptoms had significantly improved, his abdomen was less distended, his bowel sounds had returned, and his plasma glucose levels were in the normal range. The nasogastric tube was removed after he started to have bowel movements; he was given liquids by mouth and eventually solid food. Since his condition had significantly improved and he had started to have bowel movements, no follow-up imaging was done. The next day, he was symptom-free, his laboratory values were normal, and he was discharged home.
GASTROPARESIS
Gastroparesis is defined by delayed gastric emptying in the absence of a mechanical obstruction, with symptoms of nausea, vomiting, bloating, and abdominal pain. Most commonly it is idiopathic or caused by long-standing uncontrolled diabetes.
Diabetic gastroparesis is thought to result from impaired neural control of gastric function. Damage to the pacemaker interstitial cells of Cajal and underlying smooth muscle may be contributing factors.1 It is usually chronic, with a mean duration of symptoms of 26.5 months.2 However, acute gastroparesis can occur after an acute elevation in the plasma glucose concentration, which can affect gastric sensory and motor function3 via relaxation of the proximal stomach, decrease in antral pressure waves, and increase in pyloric pressure waves.4
Patients with diabetic ketoacidosis often present with symptoms similar to those of gastroparesis, including nausea, vomiting, and abdominal pain.5 But acute gastroparesis can coexist with diabetic ketoacidosis, as in our patient, and the gastroparesis can go undiagnosed, since imaging studies are not routinely done for diabetic ketoacidosis unless there is another reason—as in our patient.
More study is needed to answer questions on long-term outcomes for patients presenting with acute gastroparesis: Do they develop chronic gastroparesis? And is there is a correlation with progression of neuropathy?
The diagnosis usually requires a high level of suspicion in patients with nausea, vomiting, fullness, abdominal pain, and bloating; exclusion of gastric outlet obstruction by a mass or antral stenosis; and evidence of delayed gastric emptying. Gastric outlet obstruction can be ruled out by endoscopy, abdominal CT, or magnetic resonance enterography. Delayed gastric emptying can be quantified with scintigraphy and endoscopy. In our patient, gastroparesis was diagnosed on the basis of the clinical symptoms and CT findings.
Treatment is usually directed at symptoms, with better glycemic control and dietary modification for moderate cases, and prokinetics and a gastrostomy tube for severe cases.
TAKE-HOME POINTS
- Gastroparesis is usually chronic but can present acutely with acute severe hyperglycemia.
- Gastrointestinal tract motor function is affected by plasma glucose levels and can change over brief intervals.
- Diabetic ketoacidosis symptoms can mask acute gastroparesis, as imaging studies are not routinely done.
- Acute gastroparesis can be diagnosed clinically along with abdominal CT or endoscopy to rule out gastric outlet obstruction.
- Acute gastroparesis caused by diabetic ketoacidosis can resolve promptly with tight control of plasma glucose levels, anion gap closing, and nasogastric tube placement.
- Parkman HP, Hasler WL, Fisher RS; American Gastroenterological Association. American Gastroenterological Association technical review on the diagnosis and treatment of gastroparesis. Gastroenterology 2004; 127(5):1592–1622. pmid:15521026
- Dudekula A, O’Connell M, Bielefeldt K. Hospitalizations and testing in gastroparesis. J Gastroenterol Hepatol 2011; 26(8):1275–1282. doi:10.1111/j.1440-1746.2011.06735.x
- Fraser RJ, Horowitz M, Maddox AF, Harding PE, Chatterton BE, Dent J. Hyperglycaemia slows gastric emptying in type 1 (insulin-dependent) diabetes mellitus. Diabetologia 1990; 33(11):675–680. pmid:2076799
- Mearin F, Malagelada JR. Gastroparesis and dyspepsia in patients with diabetes mellitus. Eur J Gastroenterol Hepatol 1995; 7(8):717–723. pmid:7496857
- Malone ML, Gennis V, Goodwin JS. Characteristics of diabetic ketoacidosis in older versus younger adults. J Am Geriatr Soc 1992; 40(11):1100–1104. pmid:1401693
A 40-year-old man with type 1 diabetes mellitus and recurrent renal calculi presented to the emergency department with nausea, vomiting, and abdominal pain for the past day. He had been checking his blood glucose level regularly, and it had usually been within the normal range until 2 or 3 days previously, when he stopped taking his insulin because he ran out and could not afford to buy more.
He said he initially vomited clear mucus but then had 2 episodes of black vomit. His abdominal pain was diffuse but more intense in his flanks. He said he had never had nausea or vomiting before this episode.
In the emergency department, his heart rate was 136 beats per minute and respiratory rate 24 breaths per minute. He appeared to be in mild distress, and physical examination revealed a distended abdomen, decreased bowel sounds on auscultation, tympanic sound elicited by percussion, and diffuse abdominal tenderness to palpation without rebound tenderness or rigidity. His blood glucose level was 993 mg/dL, and his anion gap was 36 mmol/L.
The patient was treated with hydration, insulin, and a nasogastric tube to relieve the pressure. The following day, his symptoms had significantly improved, his abdomen was less distended, his bowel sounds had returned, and his plasma glucose levels were in the normal range. The nasogastric tube was removed after he started to have bowel movements; he was given liquids by mouth and eventually solid food. Since his condition had significantly improved and he had started to have bowel movements, no follow-up imaging was done. The next day, he was symptom-free, his laboratory values were normal, and he was discharged home.
GASTROPARESIS
Gastroparesis is defined by delayed gastric emptying in the absence of a mechanical obstruction, with symptoms of nausea, vomiting, bloating, and abdominal pain. Most commonly it is idiopathic or caused by long-standing uncontrolled diabetes.
Diabetic gastroparesis is thought to result from impaired neural control of gastric function. Damage to the pacemaker interstitial cells of Cajal and underlying smooth muscle may be contributing factors.1 It is usually chronic, with a mean duration of symptoms of 26.5 months.2 However, acute gastroparesis can occur after an acute elevation in the plasma glucose concentration, which can affect gastric sensory and motor function3 via relaxation of the proximal stomach, decrease in antral pressure waves, and increase in pyloric pressure waves.4
Patients with diabetic ketoacidosis often present with symptoms similar to those of gastroparesis, including nausea, vomiting, and abdominal pain.5 But acute gastroparesis can coexist with diabetic ketoacidosis, as in our patient, and the gastroparesis can go undiagnosed, since imaging studies are not routinely done for diabetic ketoacidosis unless there is another reason—as in our patient.
More study is needed to answer questions on long-term outcomes for patients presenting with acute gastroparesis: Do they develop chronic gastroparesis? And is there is a correlation with progression of neuropathy?
The diagnosis usually requires a high level of suspicion in patients with nausea, vomiting, fullness, abdominal pain, and bloating; exclusion of gastric outlet obstruction by a mass or antral stenosis; and evidence of delayed gastric emptying. Gastric outlet obstruction can be ruled out by endoscopy, abdominal CT, or magnetic resonance enterography. Delayed gastric emptying can be quantified with scintigraphy and endoscopy. In our patient, gastroparesis was diagnosed on the basis of the clinical symptoms and CT findings.
Treatment is usually directed at symptoms, with better glycemic control and dietary modification for moderate cases, and prokinetics and a gastrostomy tube for severe cases.
TAKE-HOME POINTS
- Gastroparesis is usually chronic but can present acutely with acute severe hyperglycemia.
- Gastrointestinal tract motor function is affected by plasma glucose levels and can change over brief intervals.
- Diabetic ketoacidosis symptoms can mask acute gastroparesis, as imaging studies are not routinely done.
- Acute gastroparesis can be diagnosed clinically along with abdominal CT or endoscopy to rule out gastric outlet obstruction.
- Acute gastroparesis caused by diabetic ketoacidosis can resolve promptly with tight control of plasma glucose levels, anion gap closing, and nasogastric tube placement.
- Parkman HP, Hasler WL, Fisher RS; American Gastroenterological Association. American Gastroenterological Association technical review on the diagnosis and treatment of gastroparesis. Gastroenterology 2004; 127(5):1592–1622. pmid:15521026
- Dudekula A, O’Connell M, Bielefeldt K. Hospitalizations and testing in gastroparesis. J Gastroenterol Hepatol 2011; 26(8):1275–1282. doi:10.1111/j.1440-1746.2011.06735.x
- Fraser RJ, Horowitz M, Maddox AF, Harding PE, Chatterton BE, Dent J. Hyperglycaemia slows gastric emptying in type 1 (insulin-dependent) diabetes mellitus. Diabetologia 1990; 33(11):675–680. pmid:2076799
- Mearin F, Malagelada JR. Gastroparesis and dyspepsia in patients with diabetes mellitus. Eur J Gastroenterol Hepatol 1995; 7(8):717–723. pmid:7496857
- Malone ML, Gennis V, Goodwin JS. Characteristics of diabetic ketoacidosis in older versus younger adults. J Am Geriatr Soc 1992; 40(11):1100–1104. pmid:1401693
Metformin for type 2 diabetes
To the Editor: I enjoyed reading “Should metformin be used in every patient with type 2 diabetes” by Makin and Lansang in the January 2019 issue.1
I just wanted to point out that metformin is a frequent cause of low serum vitamin B12 levels, and serum vitamin B12 levels should be monitored intermittently in patients using metformin.
- Makin V, Lansang MC. Should metformin be used in every patient with type 2 diabetes? Cleve Clin J Med 2019; 86(1):17–20. doi:10.3949/ccjm.86a.18039
To the Editor: I enjoyed reading “Should metformin be used in every patient with type 2 diabetes” by Makin and Lansang in the January 2019 issue.1
I just wanted to point out that metformin is a frequent cause of low serum vitamin B12 levels, and serum vitamin B12 levels should be monitored intermittently in patients using metformin.
- Makin V, Lansang MC. Should metformin be used in every patient with type 2 diabetes? Cleve Clin J Med 2019; 86(1):17–20. doi:10.3949/ccjm.86a.18039
- Makin V, Lansang MC. Should metformin be used in every patient with type 2 diabetes? Cleve Clin J Med 2019; 86(1):17–20. doi:10.3949/ccjm.86a.18039

In reply: Metformin for type 2 diabetes
In Reply: We thank Dr. Moskowitz for his kind comments. We agree about the need for assessing vitamin B12 levels during chronic metformin use.
Secondary analysis of patients in the Diabetes Prevention Program Outcomes Study showed a higher incidence of combined low and low-normal vitamin B12 deficiency in users assigned to the metformin group compared with those assigned to the placebo group at the 5-year and 13-year marks after randomization.1 Post hoc analysis of patients in the Hyperinsulinemia: the Outcome of Its Metabolic Effects trial also showed lower levels of vitamin B12 and higher levels of methylmalonic acid associated with significant worsening of a validated neuropathy score in metformin users.2
The mechanism behind the development of vitamin B12 deficiency is not completely understood but could possibly be alterations in intestinal mobility, bacterial overgrowth, or calcium-dependent uptake by ileal cells of the vitamin B12-intrinsic factor complex.3
Our electronic medical record has a built-in tool that suggests checking vitamin B12 whenever a patient requests metformin refills. There are no current guidelines on the need for baseline testing of the vitamin B12 level. The American Diabetes Association recommends periodic measurement of vitamin B12 levels, possibly yearly, in metformin users and more often if there are symptoms indicative of deficiency.4
- Aroda VR, Edelstein SL, Goldberg RB, et al; Diabetes Prevention Program Research Group. Long-term metformin use and vitamin B12 deficiency in the Diabetes Prevention Program Outcomes Study. J Clin Endocrinol Metab 2019; 101(4):1754–1761. doi:10.1210/jc.2015-3754
- Out M, Kooy A, Lehert P, Schalkwijk CA, Stehouwer CDA. Long-term treatment with metformin in type 2 diabetes and methylmalonic acid: post hoc analysis of a randomized controlled 4.3 year trial. J Diabetes Complications 2018; 32(2):171–178. doi:10.1016/j.jdiacomp.2017.11.001
- Liu KW, Dai LK, Jean W. Metformin-related vitamin B12 deficiency. Age Ageing 2006; 35(2):200–201. doi:10.1093/ageing/afj042
- American Diabetes Association. 9. Pharmacologic approaches to glycemic treatment: Standards of Medical Care in Diabetes—2019. Diabetes Care 2019; 42(suppl 1):S90–S102. doi:10.2337/dc19-S009
In Reply: We thank Dr. Moskowitz for his kind comments. We agree about the need for assessing vitamin B12 levels during chronic metformin use.
Secondary analysis of patients in the Diabetes Prevention Program Outcomes Study showed a higher incidence of combined low and low-normal vitamin B12 deficiency in users assigned to the metformin group compared with those assigned to the placebo group at the 5-year and 13-year marks after randomization.1 Post hoc analysis of patients in the Hyperinsulinemia: the Outcome of Its Metabolic Effects trial also showed lower levels of vitamin B12 and higher levels of methylmalonic acid associated with significant worsening of a validated neuropathy score in metformin users.2
The mechanism behind the development of vitamin B12 deficiency is not completely understood but could possibly be alterations in intestinal mobility, bacterial overgrowth, or calcium-dependent uptake by ileal cells of the vitamin B12-intrinsic factor complex.3
Our electronic medical record has a built-in tool that suggests checking vitamin B12 whenever a patient requests metformin refills. There are no current guidelines on the need for baseline testing of the vitamin B12 level. The American Diabetes Association recommends periodic measurement of vitamin B12 levels, possibly yearly, in metformin users and more often if there are symptoms indicative of deficiency.4
- Aroda VR, Edelstein SL, Goldberg RB, et al; Diabetes Prevention Program Research Group. Long-term metformin use and vitamin B12 deficiency in the Diabetes Prevention Program Outcomes Study. J Clin Endocrinol Metab 2019; 101(4):1754–1761. doi:10.1210/jc.2015-3754
- Out M, Kooy A, Lehert P, Schalkwijk CA, Stehouwer CDA. Long-term treatment with metformin in type 2 diabetes and methylmalonic acid: post hoc analysis of a randomized controlled 4.3 year trial. J Diabetes Complications 2018; 32(2):171–178. doi:10.1016/j.jdiacomp.2017.11.001
- Liu KW, Dai LK, Jean W. Metformin-related vitamin B12 deficiency. Age Ageing 2006; 35(2):200–201. doi:10.1093/ageing/afj042
- American Diabetes Association. 9. Pharmacologic approaches to glycemic treatment: Standards of Medical Care in Diabetes—2019. Diabetes Care 2019; 42(suppl 1):S90–S102. doi:10.2337/dc19-S009

Significant HbA1c Lowering in Patients Achieving a Hepatitis C Virus Cure (FULL)
The immediate clinically significant reduction in hemoglobin A1c following HCV treatment observed in this study contrasts with the expected rise seen with normal disease progression.
According to estimates, between 2.7 and 3.9 million people are infected with hepatitis C virus (HCV) in the US, with worldwide infection estimated to be about 185 million people.1-3 The majority of patients infected with HCV develop a chronic infection, which is the leading cause of liver-related complications in the Western world, including cirrhosis, hepatocellular carcinoma, and the need for liver transplantation.4 In addition to the direct effects HCV has on the liver, extrahepatic complications can occur, often related to the immune-mediated mechanism of cryoglobulinemia, such as vasculitis, renal disease, and palpable purpura. Additionally, > 70 studies globally have associated HCV with insulin resistance and worsening glycemic control.5,6
The prevalence of patients infected with HCV that have comorbid type 2 diabetes mellitus (T2DM) is estimated to be about 30%.7,8 The landmark cross-sectional National Health and Nutrition Examination Survey III study found the prevalence of T2DM among HCV patients in the US aged > 40 years to be about 3-fold higher than those without HCV.9 These findings were further supported by a Taiwanese prospective community-based cohort study that found a higher incidence of T2DM in HCV-positive patients compared with HCV negative patients (hazard ratio [HR], 1.7; 95% CI, 1.3-2.1).10 This relationship appears to be separate from the diabetogenic effect of cirrhosis itself as a significantly higher prevalence of DM has been observed in people with HCV when compared with people with cirrhosis due to other etiologies.11 Although the mechanism for this relationship is not fully understood and is likely multifactorial, it is believed to primarily be an effect of the HCV core protein increasing phosphorylation of insulin receptor substrate-1.6,12,13 The increased presence of the inflammatory cytokine, tumor necrosis factor-α, is also believed to play a role in the effects on insulinreceptor substrate-1 as well as mediating hepatic insulin resistance, stimulating lipolysis, down-regulating peroxisome proliferator-activated receptor-γ, and interfering with β-cell function.14-17
The relationship between HCV and T2DM has been further established by measured improvements in insulin resistance among patients undergoing HCV treatment with the pre-2011 standard of care—peginterferon and ribavirin.Kawaguchi and colleagues found sustained treatment responders to have a significant decrease in both the homeostatic model assessment-insulin resistance (HOMA-IR) score, representing insulin resistance, and the HOMA-β score, representing β-cell function.18 Improvements in the HOMA-IR score were further validated by Kim and colleagues and a nested cohort within the Hepatitis C Long-term Treatment against Cirrhosis (HALT-C) trial.19,20 Furthermore, Romero-Gómez and colleagues found that patients achieving a cure from HCV treatment defined as a sustained virologic response (SVR) had a nearly 50% reduced risk of impaired fasting glucose or T2DM over a mean posttreatment follow-up of 27 months.21
The recent development of direct-acting antivirals (DAAs) has marked significant HCV treatment advances in terms of efficacy and tolerability, leading current guidelines to emphasize that nearly all patients with HCV would benefit from treatment.22 Despite these guidelines, issues have been documented throughout the US with payors often limiting this costly treatment to only those with advanced fibrotic disease.23 Although the benefits of HCV treatment on reducing liver-related morbidity and mortality may be most appreciated in individuals with advanced fibrotic liver disease, improvements in insulin resistance would suggest potential morbidity and mortality benefits beyond the liver in many more at-risk individuals.24
Increasingly, cases are being reported of new DAA regimens having a significant impact on reducing insulin resistance as demonstrated by marked decreases in antihyperglycemic requirements, fasting blood glucose, and hemoglobin A1c (HbA1c).25-30 One striking case describes a patient being able to de-escalate his regimen from 42 daily units of insulin to a single oral dipeptidyl peptidase-4 inhibitor while maintaining goal HbA1c level over a 2-year time period.31 A database-driven study of veterans found a mean HbA1c drop of 0.37% in its overall included cohort of patients with T2DM who achieved SVR from HCV DAA treatment.32
Despite these data, the individual predictability and variable magnitude of improved insulin resistance based on baseline HbA1c remains unknown. The objective of this study was to assess the impact of HCV treatment with short course DAAs on glucose control in veteran patients with T2DM at a single center.
Methods
This retrospective cohort study was performed at the Department of Veterans Affairs (VA) Northeast Ohio Healthcare System (VANEOHS) in Cleveland. This study received approval from the VANEOHS Institutional Review Board. Retrospective patient data were collected from the Veterans Health Administration (VHA) Computerized Patient Record System (CPRS) electronic health record. Collectively, the VHA has treated > 100,000 patients with DAAs, making it the largest provider of HCV treatment in the US. VANEOHS has treated nearly 2,000 patients with DAAs, rendering it one of the largest single-institution cohorts to be able to examine the effects of HCV treatment on subpopulations, such as patients with T2DM.
Patient Population
Patients were identified using ICD-9/10 codes for T2DM and medication dispense history of hepatitis C DAAs. Patients were included if they had a diagnosis of T2DM, were initiated on a hepatitis C DAA between February 1, 2014 to September 26, 2016. To be eligible, patients were required to have both a baseline HbA1c within 6 months prior to starting HCV treatment as well as a HbA1c within 4 months posttreatment. The HCV treatment included were new short-course DAAs, including sofosbuvir, simeprevir, ombitasvir/paritaprevir/ritonavir ± dasabuvir, ledipasvir/sofosbuvir, elbasvir/grazoprevir, and sofosbuvir/velpatasvir. Patients were excluded if they were not on any antihyperglycemic medications at the start of HCV treatment or did not complete a full HCV treatment course.
Baseline Characteristics
Pertinent demographic data collected at baseline included patient age, gender, HCV genotype, and presence of advanced fibrotic liver disease (defined as a Metavir fibrosis stage 4 on liver biopsy, transient elastography > 12.5 kPa, or radiologic evidence of cirrhosis). HCV treatment initiation and completion dates were collected along with treatment response at 12 weeks posttreatment. Patients were considered to have achieved SVR12 if their hepatitis C viral load remained undetectable at posttreatment day 77 or thereafter. Treatment relapse was defined as a patient who achieved an undetectable HCV RNA by the end of treatment but subsequently had detectable HCV RNA following treatment cessation.
Outcome Measures
Baseline HbA1c was defined as the HbA1c drawn closest to the date of HCV treatment initiation, at least 6 months prior to treatment. Immediate posttreatment HbA1c was defined as HbA1c drawn up to 4 months posttreatment, and sustained HbA1c was captured up to 18 months posttreatment. Antihyperglycemic medication regimens and doses were collected at baseline, the end of treatment, and 3 months posttreatment via medication dispense history as well as provider notes documented in CPRS.
The primary endpoint was the change in HbA1c up to 4 months posttreatment in patients achieving SVR12. Secondary endpoints included the sustained change in HbA1c up to 12- and 18-months posttreatment, as well as change in antihyperglycemic medications from baseline to the end of HCV treatment and from baseline to 3 months posttreatment in patients achieving SVR12.
Statistical Analysis
The anticipated sample size after inclusion and exclusion for this study was 160 patients. As HbA1c is a continuous variable and tested prior to treatment and up to 18-months posttreatment, a paired dependent 2-sided t test was used for this study. For a paired dependent t test with an α of 0.05 and a power of 80%, a sample size of 160 would be able to detect a moderately small, but clinically relevant effect size of 0.22. Descriptive statistics were used for secondary outcomes. For categorical data, frequencies and percentages are provided.
Results
A total of 437 patients were identified as having a diagnosis of T2DM and being prescribed a HCV DAA, of which 157 patients met inclusion criteria. The 280 excluded patients included 127 who were not on antihyperglycemics at the start of HCV treatment, 147 who did not have HbA1c data within the specified time frame, 4 were excluded due to delayed treatment initiation outside of the study time period, and 2 self-discontinued HCV treatment due to adverse drug reactions.
Baseline Demographics
The majority of patients were male (96%), primarily African American (56%), with a mean age of 62 years (Table 1). 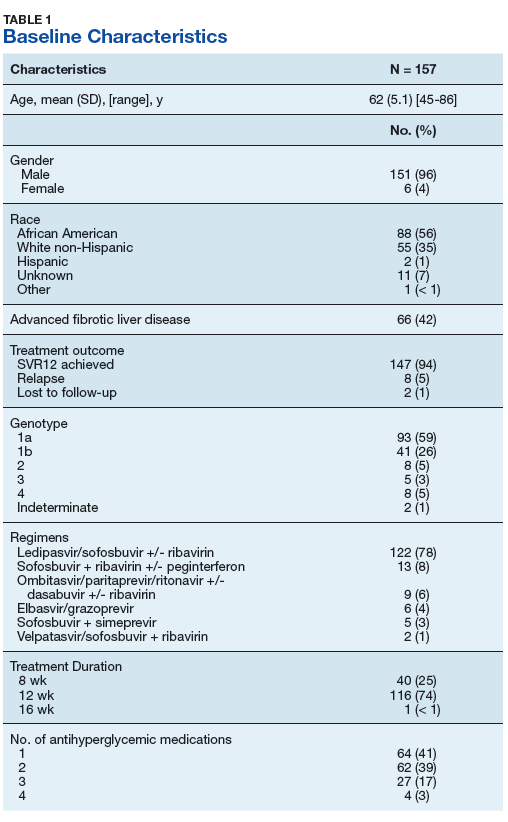
Metformin was the most commonly prescribed antihyperglycemic medication (62%), followed by insulin (54%), and sulfonylureas (40%) (Table 2). 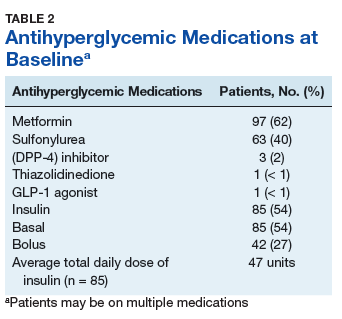
Primary and Secondary Endpoints
There was a significant immediate HbA1c lowering of 0.67% (from 7.67% to 7.00%; P < .001) in patients who achieved SVR12 over a mean of 2-months posttreatment (Figure 1). 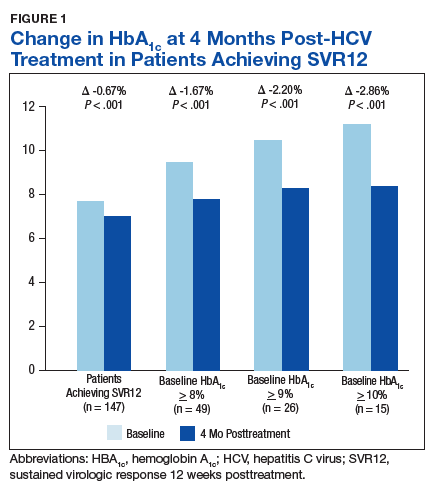
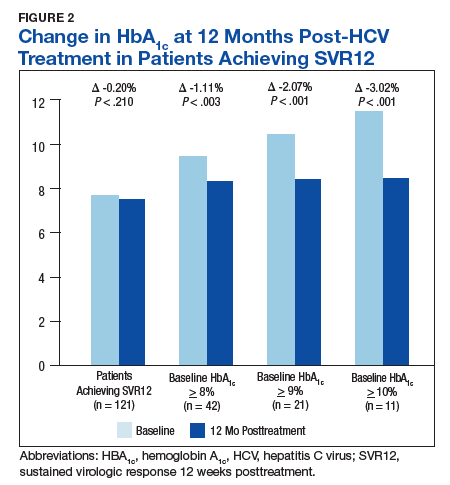
In the overall cohort of patients achieving SVR12, the HbA1c lowering was not sustained at 18 months posttreatment. However, a subanalysis demonstrated that patients with baseline HbA1c ≥ 8%, ≥ 9%, and ≥ 10% had an increasingly larger HbA1c Δ upon HCV treatment completion; the change in HbA1c for these subcohorts did remain significant at sustained time points. Patients with a baseline HbA1c ≥ 8%, ≥ 9%, and ≥ 10%, showed 18-month posttreatment HbA1c decreases of 1.65% (P < .001), 2.28% (P = .004), and 3.63% (P = .003), respectively (Figure 3). 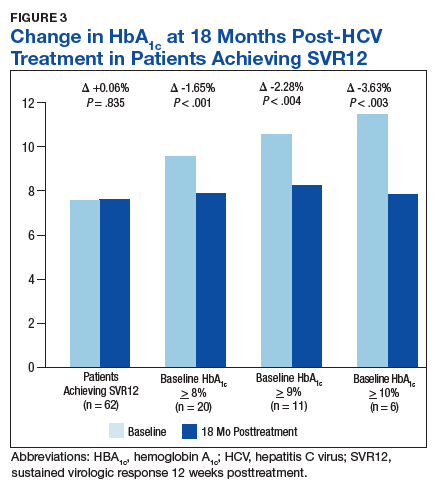
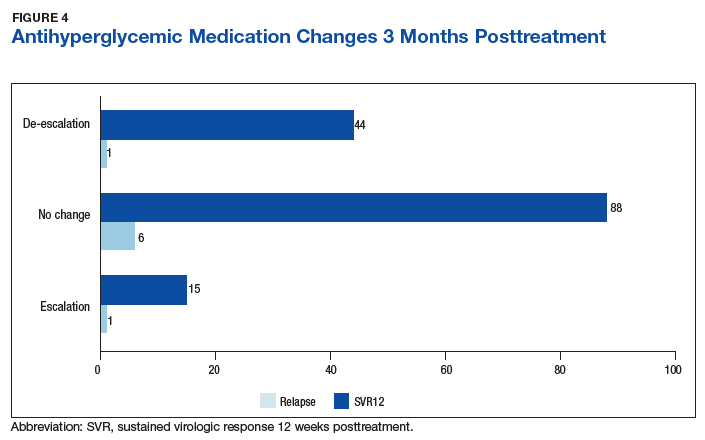
Of the 8 patients who relapsed, there was a significant decrease in HbA1c of 0.90% from 7.54% to 6.64% (P = .024) at 4 months posttreatment. Of the relapsers who had HbA1c values up to 12 months and 18-months posttreatment, the observed change in HbA1c was 0.61% and 0.2%, respectively. However, the data are limited by its small numbers. One (13%) of the HCV treatment relapsers had an escalation of their antihyperglycemic regimen, while 1 (13%) had a de-escalation, and the remaining 6 (75%) had no change.
Discussion
The immediate reduction in HbA1c following HCV treatment observed in this study of -0.67% is clinically significant and contrasts with the expected rise in HbA1c seen with normal disease progression. The results from this study are comparable to HbA1c reductions seen with certain oral, antihyperglycemic medications, such as DPP-4 inhibitors, meglitinides, and SGLT-2 inhibitors that have an average HbA1c lowering of 0.5% to 1%. This effect was increasingly magnified in patients with a higher baseline HbA1c.
The sustained effect on HbA1c may have not been seen in the overall cohort achieving SVR12 due to the fairly well-controlled mean baseline HbA1c for this older patient cohort. In addition to improvements in HbA1c, one-third of patients achieving SVR12 required de-escalation of concomitant antihyperglycemic medications. The de-escalation of antihyperglycemics may have made the sustained HbA1c impact underappreciated in the overall cohort. There were also limited sustained HbA1c data to evaluate at the time the review was completed.
Despite the clinically significant magnitude of HbA1c change, this study suggests that this effect is not predictable for all patients with DM achieving SVR12 from HCV treatment. Nineteen percent (28/147) of these patients neither had a decrease in their HbA1c nor a de-escalation of their antihyperglycemic treatment. Patients whose T2DM onset preceded or was independent of the diabetogenic effects of HCV may be more likely to have insulin resistance unaffected by hepatitis C viral clearance. Notably, the small number of treatment relapses in this study limits this group’s ability to serve as a comparator. However, one may expect a treatment relapse to have an initial decrease in insulin resistance while the hepatitis C viral load decreases below the level of detectability, yet the effects not be sustained once the HCV relapses.
Of the 35 patients who had their HbA1c decrease to < 6% following HCV treatment, concerningly 29 (83%) had either no change or even had an escalation in their antihyperglycemic regimen. This lack of de-escalation occurred despite 45% (13/29) of these patients continuing insulin posttreatment. These patients may be at a particularly high risk for hypoglycemia. Given the mean age of patients was 62 years, extremely tight glycemic control typically is not the goal for this older patient population with numerous comorbidities and high potential for hypoglycemia unawareness.
This raises concerns that patients with T2DM undergoing HCV treatment experience a new heightened risk of hypoglycemia, particularly if neither patients or providers managing DM are aware of the high potential for decreased antihyperglycemic needs upon achieving hepatitis C virologic response. It is important that these providers are aware of the mean decreased insulin resistance achieved from hepatitis C viral clearance. Providers managing DM should advise frequent serum blood glucose monitoring with close follow-up to allow for medication adjustments to prevent hypoglycemic episodes occurring during and after HCV treatment.
Limitations
The limitations of this study included small sample sizes in subgroups, and the retrospective design prohibited the ability to quantify and describe hypoglycemic events that may have occurred as a result of HCV treatment. In addition, the documentation of medication changes in CPRS may not have fully accounted for adjustments or self-discontinuations of DM medications. An alternative definition for change in antihyperglycemic medications may have accounted for the variable HbA1c-lowering between oral antihyperglycemic medications.
Finally, hemoglobin was not collected to account for any impact ribavirin-associated anemia may have had on the immediate posttreatment HbA1c values. Phase 3 DAA trials have demonstrated that between 7% and 9% of patients on ribavirin-containing DAA regimens are expected to have a hemoglobin < 10 g/dL during the HCV treatment course.33-36 Ribavirin-containing regimens may minimally impact the immediate posttreatment HbA1c result, but not necessarily the 12- or 18-month posttreatment HbA1c levels due to the reversible nature of this adverse effect (AE) following discontinuation of ribavirin.
Future studies may be strengthened by controlling for possible confounders such as concomitant ribavirin, adherence to antihyperglycemic medications, comorbidities, years since initial DM diagnosis, and lifestyle modifications, including a decrease of alcohol consumption. A prospective study also may include data on hypoglycemic events and further determine the sustained response by including an 18- or 24-month posttreatment HbA1c in the protocol.
Conclusion
The findings of this study validate the significant HbA1c changes post-HCV treatment described in the recent veteran database study.32 However, the current study’s validated patient chart data provide a better understanding of the changes made to antihyperglycemic regimens. This also is the first study describing this phenomenon of improved insulin resistance to only be observed in approximately 80% of patients infected with HCV and comorbid T2DM. Furthermore, the variable magnitude of HbA1c impact reliant on baseline HbA1c is informative for individual patient management. In addition to the direct benefits for the liver on hepatitis C viral eradication, improvements in HbA1c and the de-escalation of antihyperglycemic regimens may be a benefit of receiving HCV treatment.
The improved DM control achieved with hepatitis C viral eradication may represent an opportunity to prevent progressive DM and cardiovascular AEs. Additionally, HCV treatment may be able to prevent the onset of T2DM in patients at risk. Arguably HCV treatment has significant benefits in terms of health outcomes, quality of life, and long-term cost avoidance to patients beyond the well-described value of decreasing liver-related morbidity and mortality. This may be an incentive for payers to improve access to HCV DAAs by expanding eligibility criteria beyond those with advanced fibrotic liver disease.
Acknowledgments
This material is the result of work supported with the resources and the use of facilities at the VA Northeast Ohio Healthcare System.
1. Backus LI, Belperio PS, Loomis TP, Yip GH, Mole LA. Hepatitis C virus screening and prevalence among US veterans in Department of Veterans Affairs care. JAMA Intern Med. 2013;173(16):1549-1552.
2. Edlin BR, Eckhardt BJ, Shu MA, Holmberg SD, Swan T. Toward a more accurate estimate of the prevalence of hepatitis C in the United States. Hepatology. 2015;62(5):1353-1363.
3. World Health Organization. Guidelines for the screening, care and treatment of persons with hepatitis C infection. http://www.who.int/hiv/pub/hepatitis/hepatitis-c-guidelines/en/. Published April 2014. Accessed January 24, 2019.
4. Antonelli A, Ferri C, Galeazzi C, et al. HCV infection: pathogenesis, clinical manifestations and therapy. Clin Exp Rheumatol. 2008;26(1)(suppl 48):S39-S47.
5. Jacobson IM, Cacoub P, Dal Maso L, Harrison SA, Younossi ZM. Manifestations of chronic hepatitis C virus infection beyond the liver. Clin Gastroenterol Hepatol. 2010;8(12):1017-1029.
6. Antonelli A, Ferrari SM, Giuggioli D, et al. Hepatitis C virus infection and type 1 and type 2 diabetes mellitus. World J Diabetes. 2014;5(5):586-600.
7. Knobler H, Schihmanter R, Zifroni A, Fenakel G, Schattner A. Increased risk of type 2 diabetes mellitus in non-cirrhotic patients with hepatitis C. Mayo Clin Proc. 2000;75(4):355-359.
8. Hammerstad SS, Grock SF, Lee HJ, Hasham A, Sundaram N, Tomer Y. Diabetes and hepatitis C: a two-way association. Front Endocrinol (Lausanne). 2015;6:134.
9. Mehta SH, Brancati FI, Sulkowski MS, Strathdee SA, Szklo M, Thomas DL. Prevalence of type 2 diabetes mellitus among persons with hepatitis C virus infection in the United States. Ann Interns Med. 2000;133(8):592-599.
10. Wang CS, Wang ST, Yao WJ, Chang TT, Chou P. Hepatitis C virus infection and the development of type 2 diabetes in a community-based longitudinal study. Am J Epidemiol. 2007;166(2):196-203.
11. Allison ME, Wreghitt T, Palmer CR, Alexander GJ. Evidence for a link between hepatitis C virus infection and diabetes mellitus in a cirrhotic population. J Hepatol. 1994;21(6):1135-1139.
12. Kawaguchi T, Yoshida T, Harada M, et al. Hepatitis C virus down-regulates insulin receptor substrates 1 and 2 through up-regulation of suppressor of cytokine signaling 3. Am J Pathol. 2004;165(5):1499-1508.
13. Negro F, Alaei M. Hepatitis C virus and type 2 diabetes. World J Gastroenterol. 2009;15(13):1537-1547.
14. Knobler H, Schattner A. TNF-α, chronic hepatitis C and diabetes: a novel triad. QJM. 2005;98(1):1-6.
15. Greenberg AS, McDaniel ML. Identifying the links between obesity, insulin resistance and beta-cell function: potential role of adipocyte-derived cytokines in the pathogenesis of type 2 diabetes. Eur J Clin Invest. 2002;32(suppl 3):24-34.
16. Ruan H, Lodish HF. Insulin resistance in adipose tissue: direct and indirect effects of tumor necrosis factor-alpha. Cytokine Growth Factor Rev. 2003;14(5):447-455.
17. Kralj D, Virovic´ Jukic´ L, Stojsavljevic´ S, Duvnjak M, Smolic´ M, C˘urc˘ic´ IB. Hepatitis C virus, insulin resistance, and steatosis. J Clin Transl Hepatol. 2016;4(1):66-75.
18. Kawaguchi T, Ide T, Taniguchi E, et al. Clearance of HCV improves insulin resistance, beta-cell function, and hepatic expression of insulin receptor substrate 1 and 2. Am J Gastroenterol. 2007;102(3):570-576.
19. Kim HJ, Park JH, Park DI, et al. Clearance of HCV by combination therapy of pegylated interferon alpha-2a and ribavirin improves insulin resistance. Gut Liver. 2009;3(2):108-115.
20. Delgado-Borrego A, Jordan SH, Negre B, et al; Halt-C Trial Group. Reduction of insulin resistance with effective clearance of hepatitis C infection: results from the HALT-C trial. Clin Gastroenterol Hepatol. 2010;8(5):458-462.
21. Romero-Gómez M, Fernández-Rodríguez CM, Andrade RJ, et al. Effect of sustained virologic response to treatment on the incidence of abnormal glucose values in chronic hepatitis C. J Hepatol. 2008;48(5):721-727.
22. American Association for the Study of Liver Disease, Infectious Disease Society of America. HCV guidance: recommendations for testing, managing, and treating hepatitis C. http://www.hcvguidelines.org. Updated May 24, 20187. Accessed January 24, 2019.
23. Barua S, Greenwald R, Grebely J, Dore GJ, Swan T, Taylor LE. Restrictions for Medicaid reimbursement of sofosbuvir for the treatment of hepatitis C virus infection in the United States. Ann Intern Med. 2015;163(3):215-223.
24. Smith-Palmer J, Cerri K, Valentine W. Achieving sustained virologic response in hepatitis C: a systematic review of clinical, economic, and quality of life benefits. BMC Infect Dis. 2015;15:19.
25. Moucari R, Forestier N, Larrey D, et al. Danoprevir, an HCV NS3/4A protease inhibitor, improves insulin sensitivity in patients with genotype 1 chronic hepatitis C. Gut. 2010;59(12):1694-1698.
26. Pedersen MR, Backstedt D, Kakati BR, et al. Sustained virologic response to direct acting antiviral therapy improves components is associated with improvements in the metabolic syndrome. Abstract 1043. Presented at: The 66th Annual Meeting of the American Association for the Study of Liver Diseases: The Liver Meeting, October 2015; San Francisco, CA.
27. Doyle MA, Curtis C. Successful hepatitis C antiviral therapy induces remission of type 2 diabetes: a case report. Am J Case Rep. 2015;16:745-750.
28. Pavone P, Tieghi T, d’Ettore G, et al. Rapid decline of fasting glucose in HCV diabetic patients treated with direct-acting antiviral agents. Clin Microbiol Infect. 2016;22(5):462.e1-e3.
29. Pashun RA, Shen NT, Jesudian A. Markedly improved glycemic control in poorly controlled type 2 diabetes following direct acting antiviral treatment of genotype 1 hepatitis C. Case Reports Hepatol. 2016:7807921.
30. Stine JG, Wynter JA, Niccum B, Kelly V, Caldwell SH, Shah NL. Effect of treatment with direct acting antiviral on glycemic control in patients with diabetes mellitus and chronic hepatitis C. Ann Hepatol. 2017;16(2):215-220.
31. Davis TME, Davis WA, Jeffrey G. Successful withdrawal of insulin therapy after post-treatment clearance of hepatitis C virus in a man with type 2 diabetes. Am J Case Rep. 2017;18:414-417.
32. Hum J, Jou JH, Green PK, et al. Improvement in glycemic control of type 2 diabetes after successful treatment of hepatitis C virus. Diabetes Care. 2017;40(9):1173-1180.
33. Afdhal N, Zeuzem S, Kwo P, et al; ION-1 Investigators. Ledipasvir and sofosbuvir for untreated HCV genotype 1 infection. N Engl J Med. 2014;370(20):1889-1898.
34. Afdhal N, Reddy R, Nelson DR, et al; ION-2 Investigators. Ledipasvir and sofosbuvir for previously treated HCV genotype 1 infection. N Engl J Med. 2014:370 (16):1483-1493.
35. Ferenci P, Bernstein D, Lalezari J, et al; PEARL-III Study; PEARL-IV Study. ABT-450/r-ombitasvir and dasabuvir with or without ribavirin for HCV. N Engl J Med. 2014;370(21):1983-1992.
36. Poordad F, Hezode C, Trinh R, et al. ABT-450/r-ombitasvir and dasabuvir with ribavirin for hepatitis C with cirrhosis. N Engl J Med. 2014;370(21):1973-1982.
The immediate clinically significant reduction in hemoglobin A1c following HCV treatment observed in this study contrasts with the expected rise seen with normal disease progression.
The immediate clinically significant reduction in hemoglobin A1c following HCV treatment observed in this study contrasts with the expected rise seen with normal disease progression.
According to estimates, between 2.7 and 3.9 million people are infected with hepatitis C virus (HCV) in the US, with worldwide infection estimated to be about 185 million people.1-3 The majority of patients infected with HCV develop a chronic infection, which is the leading cause of liver-related complications in the Western world, including cirrhosis, hepatocellular carcinoma, and the need for liver transplantation.4 In addition to the direct effects HCV has on the liver, extrahepatic complications can occur, often related to the immune-mediated mechanism of cryoglobulinemia, such as vasculitis, renal disease, and palpable purpura. Additionally, > 70 studies globally have associated HCV with insulin resistance and worsening glycemic control.5,6
The prevalence of patients infected with HCV that have comorbid type 2 diabetes mellitus (T2DM) is estimated to be about 30%.7,8 The landmark cross-sectional National Health and Nutrition Examination Survey III study found the prevalence of T2DM among HCV patients in the US aged > 40 years to be about 3-fold higher than those without HCV.9 These findings were further supported by a Taiwanese prospective community-based cohort study that found a higher incidence of T2DM in HCV-positive patients compared with HCV negative patients (hazard ratio [HR], 1.7; 95% CI, 1.3-2.1).10 This relationship appears to be separate from the diabetogenic effect of cirrhosis itself as a significantly higher prevalence of DM has been observed in people with HCV when compared with people with cirrhosis due to other etiologies.11 Although the mechanism for this relationship is not fully understood and is likely multifactorial, it is believed to primarily be an effect of the HCV core protein increasing phosphorylation of insulin receptor substrate-1.6,12,13 The increased presence of the inflammatory cytokine, tumor necrosis factor-α, is also believed to play a role in the effects on insulinreceptor substrate-1 as well as mediating hepatic insulin resistance, stimulating lipolysis, down-regulating peroxisome proliferator-activated receptor-γ, and interfering with β-cell function.14-17
The relationship between HCV and T2DM has been further established by measured improvements in insulin resistance among patients undergoing HCV treatment with the pre-2011 standard of care—peginterferon and ribavirin.Kawaguchi and colleagues found sustained treatment responders to have a significant decrease in both the homeostatic model assessment-insulin resistance (HOMA-IR) score, representing insulin resistance, and the HOMA-β score, representing β-cell function.18 Improvements in the HOMA-IR score were further validated by Kim and colleagues and a nested cohort within the Hepatitis C Long-term Treatment against Cirrhosis (HALT-C) trial.19,20 Furthermore, Romero-Gómez and colleagues found that patients achieving a cure from HCV treatment defined as a sustained virologic response (SVR) had a nearly 50% reduced risk of impaired fasting glucose or T2DM over a mean posttreatment follow-up of 27 months.21
The recent development of direct-acting antivirals (DAAs) has marked significant HCV treatment advances in terms of efficacy and tolerability, leading current guidelines to emphasize that nearly all patients with HCV would benefit from treatment.22 Despite these guidelines, issues have been documented throughout the US with payors often limiting this costly treatment to only those with advanced fibrotic disease.23 Although the benefits of HCV treatment on reducing liver-related morbidity and mortality may be most appreciated in individuals with advanced fibrotic liver disease, improvements in insulin resistance would suggest potential morbidity and mortality benefits beyond the liver in many more at-risk individuals.24
Increasingly, cases are being reported of new DAA regimens having a significant impact on reducing insulin resistance as demonstrated by marked decreases in antihyperglycemic requirements, fasting blood glucose, and hemoglobin A1c (HbA1c).25-30 One striking case describes a patient being able to de-escalate his regimen from 42 daily units of insulin to a single oral dipeptidyl peptidase-4 inhibitor while maintaining goal HbA1c level over a 2-year time period.31 A database-driven study of veterans found a mean HbA1c drop of 0.37% in its overall included cohort of patients with T2DM who achieved SVR from HCV DAA treatment.32
Despite these data, the individual predictability and variable magnitude of improved insulin resistance based on baseline HbA1c remains unknown. The objective of this study was to assess the impact of HCV treatment with short course DAAs on glucose control in veteran patients with T2DM at a single center.
Methods
This retrospective cohort study was performed at the Department of Veterans Affairs (VA) Northeast Ohio Healthcare System (VANEOHS) in Cleveland. This study received approval from the VANEOHS Institutional Review Board. Retrospective patient data were collected from the Veterans Health Administration (VHA) Computerized Patient Record System (CPRS) electronic health record. Collectively, the VHA has treated > 100,000 patients with DAAs, making it the largest provider of HCV treatment in the US. VANEOHS has treated nearly 2,000 patients with DAAs, rendering it one of the largest single-institution cohorts to be able to examine the effects of HCV treatment on subpopulations, such as patients with T2DM.
Patient Population
Patients were identified using ICD-9/10 codes for T2DM and medication dispense history of hepatitis C DAAs. Patients were included if they had a diagnosis of T2DM, were initiated on a hepatitis C DAA between February 1, 2014 to September 26, 2016. To be eligible, patients were required to have both a baseline HbA1c within 6 months prior to starting HCV treatment as well as a HbA1c within 4 months posttreatment. The HCV treatment included were new short-course DAAs, including sofosbuvir, simeprevir, ombitasvir/paritaprevir/ritonavir ± dasabuvir, ledipasvir/sofosbuvir, elbasvir/grazoprevir, and sofosbuvir/velpatasvir. Patients were excluded if they were not on any antihyperglycemic medications at the start of HCV treatment or did not complete a full HCV treatment course.
Baseline Characteristics
Pertinent demographic data collected at baseline included patient age, gender, HCV genotype, and presence of advanced fibrotic liver disease (defined as a Metavir fibrosis stage 4 on liver biopsy, transient elastography > 12.5 kPa, or radiologic evidence of cirrhosis). HCV treatment initiation and completion dates were collected along with treatment response at 12 weeks posttreatment. Patients were considered to have achieved SVR12 if their hepatitis C viral load remained undetectable at posttreatment day 77 or thereafter. Treatment relapse was defined as a patient who achieved an undetectable HCV RNA by the end of treatment but subsequently had detectable HCV RNA following treatment cessation.
Outcome Measures
Baseline HbA1c was defined as the HbA1c drawn closest to the date of HCV treatment initiation, at least 6 months prior to treatment. Immediate posttreatment HbA1c was defined as HbA1c drawn up to 4 months posttreatment, and sustained HbA1c was captured up to 18 months posttreatment. Antihyperglycemic medication regimens and doses were collected at baseline, the end of treatment, and 3 months posttreatment via medication dispense history as well as provider notes documented in CPRS.
The primary endpoint was the change in HbA1c up to 4 months posttreatment in patients achieving SVR12. Secondary endpoints included the sustained change in HbA1c up to 12- and 18-months posttreatment, as well as change in antihyperglycemic medications from baseline to the end of HCV treatment and from baseline to 3 months posttreatment in patients achieving SVR12.
Statistical Analysis
The anticipated sample size after inclusion and exclusion for this study was 160 patients. As HbA1c is a continuous variable and tested prior to treatment and up to 18-months posttreatment, a paired dependent 2-sided t test was used for this study. For a paired dependent t test with an α of 0.05 and a power of 80%, a sample size of 160 would be able to detect a moderately small, but clinically relevant effect size of 0.22. Descriptive statistics were used for secondary outcomes. For categorical data, frequencies and percentages are provided.
Results
A total of 437 patients were identified as having a diagnosis of T2DM and being prescribed a HCV DAA, of which 157 patients met inclusion criteria. The 280 excluded patients included 127 who were not on antihyperglycemics at the start of HCV treatment, 147 who did not have HbA1c data within the specified time frame, 4 were excluded due to delayed treatment initiation outside of the study time period, and 2 self-discontinued HCV treatment due to adverse drug reactions.
Baseline Demographics
The majority of patients were male (96%), primarily African American (56%), with a mean age of 62 years (Table 1).
Metformin was the most commonly prescribed antihyperglycemic medication (62%), followed by insulin (54%), and sulfonylureas (40%) (Table 2).
Primary and Secondary Endpoints
There was a significant immediate HbA1c lowering of 0.67% (from 7.67% to 7.00%; P < .001) in patients who achieved SVR12 over a mean of 2-months posttreatment (Figure 1).
In the overall cohort of patients achieving SVR12, the HbA1c lowering was not sustained at 18 months posttreatment. However, a subanalysis demonstrated that patients with baseline HbA1c ≥ 8%, ≥ 9%, and ≥ 10% had an increasingly larger HbA1c Δ upon HCV treatment completion; the change in HbA1c for these subcohorts did remain significant at sustained time points. Patients with a baseline HbA1c ≥ 8%, ≥ 9%, and ≥ 10%, showed 18-month posttreatment HbA1c decreases of 1.65% (P < .001), 2.28% (P = .004), and 3.63% (P = .003), respectively (Figure 3).
Of the 8 patients who relapsed, there was a significant decrease in HbA1c of 0.90% from 7.54% to 6.64% (P = .024) at 4 months posttreatment. Of the relapsers who had HbA1c values up to 12 months and 18-months posttreatment, the observed change in HbA1c was 0.61% and 0.2%, respectively. However, the data are limited by its small numbers. One (13%) of the HCV treatment relapsers had an escalation of their antihyperglycemic regimen, while 1 (13%) had a de-escalation, and the remaining 6 (75%) had no change.
Discussion
The immediate reduction in HbA1c following HCV treatment observed in this study of -0.67% is clinically significant and contrasts with the expected rise in HbA1c seen with normal disease progression. The results from this study are comparable to HbA1c reductions seen with certain oral, antihyperglycemic medications, such as DPP-4 inhibitors, meglitinides, and SGLT-2 inhibitors that have an average HbA1c lowering of 0.5% to 1%. This effect was increasingly magnified in patients with a higher baseline HbA1c.
The sustained effect on HbA1c may have not been seen in the overall cohort achieving SVR12 due to the fairly well-controlled mean baseline HbA1c for this older patient cohort. In addition to improvements in HbA1c, one-third of patients achieving SVR12 required de-escalation of concomitant antihyperglycemic medications. The de-escalation of antihyperglycemics may have made the sustained HbA1c impact underappreciated in the overall cohort. There were also limited sustained HbA1c data to evaluate at the time the review was completed.
Despite the clinically significant magnitude of HbA1c change, this study suggests that this effect is not predictable for all patients with DM achieving SVR12 from HCV treatment. Nineteen percent (28/147) of these patients neither had a decrease in their HbA1c nor a de-escalation of their antihyperglycemic treatment. Patients whose T2DM onset preceded or was independent of the diabetogenic effects of HCV may be more likely to have insulin resistance unaffected by hepatitis C viral clearance. Notably, the small number of treatment relapses in this study limits this group’s ability to serve as a comparator. However, one may expect a treatment relapse to have an initial decrease in insulin resistance while the hepatitis C viral load decreases below the level of detectability, yet the effects not be sustained once the HCV relapses.
Of the 35 patients who had their HbA1c decrease to < 6% following HCV treatment, concerningly 29 (83%) had either no change or even had an escalation in their antihyperglycemic regimen. This lack of de-escalation occurred despite 45% (13/29) of these patients continuing insulin posttreatment. These patients may be at a particularly high risk for hypoglycemia. Given the mean age of patients was 62 years, extremely tight glycemic control typically is not the goal for this older patient population with numerous comorbidities and high potential for hypoglycemia unawareness.
This raises concerns that patients with T2DM undergoing HCV treatment experience a new heightened risk of hypoglycemia, particularly if neither patients or providers managing DM are aware of the high potential for decreased antihyperglycemic needs upon achieving hepatitis C virologic response. It is important that these providers are aware of the mean decreased insulin resistance achieved from hepatitis C viral clearance. Providers managing DM should advise frequent serum blood glucose monitoring with close follow-up to allow for medication adjustments to prevent hypoglycemic episodes occurring during and after HCV treatment.
Limitations
The limitations of this study included small sample sizes in subgroups, and the retrospective design prohibited the ability to quantify and describe hypoglycemic events that may have occurred as a result of HCV treatment. In addition, the documentation of medication changes in CPRS may not have fully accounted for adjustments or self-discontinuations of DM medications. An alternative definition for change in antihyperglycemic medications may have accounted for the variable HbA1c-lowering between oral antihyperglycemic medications.
Finally, hemoglobin was not collected to account for any impact ribavirin-associated anemia may have had on the immediate posttreatment HbA1c values. Phase 3 DAA trials have demonstrated that between 7% and 9% of patients on ribavirin-containing DAA regimens are expected to have a hemoglobin < 10 g/dL during the HCV treatment course.33-36 Ribavirin-containing regimens may minimally impact the immediate posttreatment HbA1c result, but not necessarily the 12- or 18-month posttreatment HbA1c levels due to the reversible nature of this adverse effect (AE) following discontinuation of ribavirin.
Future studies may be strengthened by controlling for possible confounders such as concomitant ribavirin, adherence to antihyperglycemic medications, comorbidities, years since initial DM diagnosis, and lifestyle modifications, including a decrease of alcohol consumption. A prospective study also may include data on hypoglycemic events and further determine the sustained response by including an 18- or 24-month posttreatment HbA1c in the protocol.
Conclusion
The findings of this study validate the significant HbA1c changes post-HCV treatment described in the recent veteran database study.32 However, the current study’s validated patient chart data provide a better understanding of the changes made to antihyperglycemic regimens. This also is the first study describing this phenomenon of improved insulin resistance to only be observed in approximately 80% of patients infected with HCV and comorbid T2DM. Furthermore, the variable magnitude of HbA1c impact reliant on baseline HbA1c is informative for individual patient management. In addition to the direct benefits for the liver on hepatitis C viral eradication, improvements in HbA1c and the de-escalation of antihyperglycemic regimens may be a benefit of receiving HCV treatment.
The improved DM control achieved with hepatitis C viral eradication may represent an opportunity to prevent progressive DM and cardiovascular AEs. Additionally, HCV treatment may be able to prevent the onset of T2DM in patients at risk. Arguably HCV treatment has significant benefits in terms of health outcomes, quality of life, and long-term cost avoidance to patients beyond the well-described value of decreasing liver-related morbidity and mortality. This may be an incentive for payers to improve access to HCV DAAs by expanding eligibility criteria beyond those with advanced fibrotic liver disease.
Acknowledgments
This material is the result of work supported with the resources and the use of facilities at the VA Northeast Ohio Healthcare System.
1. Backus LI, Belperio PS, Loomis TP, Yip GH, Mole LA. Hepatitis C virus screening and prevalence among US veterans in Department of Veterans Affairs care. JAMA Intern Med. 2013;173(16):1549-1552.
2. Edlin BR, Eckhardt BJ, Shu MA, Holmberg SD, Swan T. Toward a more accurate estimate of the prevalence of hepatitis C in the United States. Hepatology. 2015;62(5):1353-1363.
3. World Health Organization. Guidelines for the screening, care and treatment of persons with hepatitis C infection. http://www.who.int/hiv/pub/hepatitis/hepatitis-c-guidelines/en/. Published April 2014. Accessed January 24, 2019.
4. Antonelli A, Ferri C, Galeazzi C, et al. HCV infection: pathogenesis, clinical manifestations and therapy. Clin Exp Rheumatol. 2008;26(1)(suppl 48):S39-S47.
5. Jacobson IM, Cacoub P, Dal Maso L, Harrison SA, Younossi ZM. Manifestations of chronic hepatitis C virus infection beyond the liver. Clin Gastroenterol Hepatol. 2010;8(12):1017-1029.
6. Antonelli A, Ferrari SM, Giuggioli D, et al. Hepatitis C virus infection and type 1 and type 2 diabetes mellitus. World J Diabetes. 2014;5(5):586-600.
7. Knobler H, Schihmanter R, Zifroni A, Fenakel G, Schattner A. Increased risk of type 2 diabetes mellitus in non-cirrhotic patients with hepatitis C. Mayo Clin Proc. 2000;75(4):355-359.
8. Hammerstad SS, Grock SF, Lee HJ, Hasham A, Sundaram N, Tomer Y. Diabetes and hepatitis C: a two-way association. Front Endocrinol (Lausanne). 2015;6:134.
9. Mehta SH, Brancati FI, Sulkowski MS, Strathdee SA, Szklo M, Thomas DL. Prevalence of type 2 diabetes mellitus among persons with hepatitis C virus infection in the United States. Ann Interns Med. 2000;133(8):592-599.
10. Wang CS, Wang ST, Yao WJ, Chang TT, Chou P. Hepatitis C virus infection and the development of type 2 diabetes in a community-based longitudinal study. Am J Epidemiol. 2007;166(2):196-203.
11. Allison ME, Wreghitt T, Palmer CR, Alexander GJ. Evidence for a link between hepatitis C virus infection and diabetes mellitus in a cirrhotic population. J Hepatol. 1994;21(6):1135-1139.
12. Kawaguchi T, Yoshida T, Harada M, et al. Hepatitis C virus down-regulates insulin receptor substrates 1 and 2 through up-regulation of suppressor of cytokine signaling 3. Am J Pathol. 2004;165(5):1499-1508.
13. Negro F, Alaei M. Hepatitis C virus and type 2 diabetes. World J Gastroenterol. 2009;15(13):1537-1547.
14. Knobler H, Schattner A. TNF-α, chronic hepatitis C and diabetes: a novel triad. QJM. 2005;98(1):1-6.
15. Greenberg AS, McDaniel ML. Identifying the links between obesity, insulin resistance and beta-cell function: potential role of adipocyte-derived cytokines in the pathogenesis of type 2 diabetes. Eur J Clin Invest. 2002;32(suppl 3):24-34.
16. Ruan H, Lodish HF. Insulin resistance in adipose tissue: direct and indirect effects of tumor necrosis factor-alpha. Cytokine Growth Factor Rev. 2003;14(5):447-455.
17. Kralj D, Virovic´ Jukic´ L, Stojsavljevic´ S, Duvnjak M, Smolic´ M, C˘urc˘ic´ IB. Hepatitis C virus, insulin resistance, and steatosis. J Clin Transl Hepatol. 2016;4(1):66-75.
18. Kawaguchi T, Ide T, Taniguchi E, et al. Clearance of HCV improves insulin resistance, beta-cell function, and hepatic expression of insulin receptor substrate 1 and 2. Am J Gastroenterol. 2007;102(3):570-576.
19. Kim HJ, Park JH, Park DI, et al. Clearance of HCV by combination therapy of pegylated interferon alpha-2a and ribavirin improves insulin resistance. Gut Liver. 2009;3(2):108-115.
20. Delgado-Borrego A, Jordan SH, Negre B, et al; Halt-C Trial Group. Reduction of insulin resistance with effective clearance of hepatitis C infection: results from the HALT-C trial. Clin Gastroenterol Hepatol. 2010;8(5):458-462.
21. Romero-Gómez M, Fernández-Rodríguez CM, Andrade RJ, et al. Effect of sustained virologic response to treatment on the incidence of abnormal glucose values in chronic hepatitis C. J Hepatol. 2008;48(5):721-727.
22. American Association for the Study of Liver Disease, Infectious Disease Society of America. HCV guidance: recommendations for testing, managing, and treating hepatitis C. http://www.hcvguidelines.org. Updated May 24, 20187. Accessed January 24, 2019.
23. Barua S, Greenwald R, Grebely J, Dore GJ, Swan T, Taylor LE. Restrictions for Medicaid reimbursement of sofosbuvir for the treatment of hepatitis C virus infection in the United States. Ann Intern Med. 2015;163(3):215-223.
24. Smith-Palmer J, Cerri K, Valentine W. Achieving sustained virologic response in hepatitis C: a systematic review of clinical, economic, and quality of life benefits. BMC Infect Dis. 2015;15:19.
25. Moucari R, Forestier N, Larrey D, et al. Danoprevir, an HCV NS3/4A protease inhibitor, improves insulin sensitivity in patients with genotype 1 chronic hepatitis C. Gut. 2010;59(12):1694-1698.
26. Pedersen MR, Backstedt D, Kakati BR, et al. Sustained virologic response to direct acting antiviral therapy improves components is associated with improvements in the metabolic syndrome. Abstract 1043. Presented at: The 66th Annual Meeting of the American Association for the Study of Liver Diseases: The Liver Meeting, October 2015; San Francisco, CA.
27. Doyle MA, Curtis C. Successful hepatitis C antiviral therapy induces remission of type 2 diabetes: a case report. Am J Case Rep. 2015;16:745-750.
28. Pavone P, Tieghi T, d’Ettore G, et al. Rapid decline of fasting glucose in HCV diabetic patients treated with direct-acting antiviral agents. Clin Microbiol Infect. 2016;22(5):462.e1-e3.
29. Pashun RA, Shen NT, Jesudian A. Markedly improved glycemic control in poorly controlled type 2 diabetes following direct acting antiviral treatment of genotype 1 hepatitis C. Case Reports Hepatol. 2016:7807921.
30. Stine JG, Wynter JA, Niccum B, Kelly V, Caldwell SH, Shah NL. Effect of treatment with direct acting antiviral on glycemic control in patients with diabetes mellitus and chronic hepatitis C. Ann Hepatol. 2017;16(2):215-220.
31. Davis TME, Davis WA, Jeffrey G. Successful withdrawal of insulin therapy after post-treatment clearance of hepatitis C virus in a man with type 2 diabetes. Am J Case Rep. 2017;18:414-417.
32. Hum J, Jou JH, Green PK, et al. Improvement in glycemic control of type 2 diabetes after successful treatment of hepatitis C virus. Diabetes Care. 2017;40(9):1173-1180.
33. Afdhal N, Zeuzem S, Kwo P, et al; ION-1 Investigators. Ledipasvir and sofosbuvir for untreated HCV genotype 1 infection. N Engl J Med. 2014;370(20):1889-1898.
34. Afdhal N, Reddy R, Nelson DR, et al; ION-2 Investigators. Ledipasvir and sofosbuvir for previously treated HCV genotype 1 infection. N Engl J Med. 2014:370 (16):1483-1493.
35. Ferenci P, Bernstein D, Lalezari J, et al; PEARL-III Study; PEARL-IV Study. ABT-450/r-ombitasvir and dasabuvir with or without ribavirin for HCV. N Engl J Med. 2014;370(21):1983-1992.
36. Poordad F, Hezode C, Trinh R, et al. ABT-450/r-ombitasvir and dasabuvir with ribavirin for hepatitis C with cirrhosis. N Engl J Med. 2014;370(21):1973-1982.
New renal, CV disease indication sought for canagliflozin
Janssen has announced that it has submitted a supplemental new drug application to the Food and Drug Administration to add an indication for canagliflozin (Invokana). The sodium-glucose cotransporter 2 is currently indicated, in addition to diet and exercise, for glycemic control in type 2 diabetes. However, in hopes of reducing the risks of end-stage kidney disease and of renal or cardiovascular death, according to a press release from the manufacturer.

If approved, canagliflozin will be the first diabetes medicine for the treatment of people living with type 2 diabetes and chronic kidney disease, according to the press release.
The application was based on the results of the phase 3 CREDENCE trial, a randomized, double-blind, placebo-controlled, multicenter study of 4,401 patients with type 2 diabetes, stage 2 or 3 chronic kidney disease, and macroalbuminuria. The patients received standard of care as well. The trial was stopped early, in July 2018, because it had met the prespecified criteria for efficacy. Data from the trial will be presented in mid-April at the annual meeting of the International Society of Nephrology World Congress of Nephrology in Melbourne.
Canagliflozin is contraindicated in patients with severe renal impairment (an estimated glomerular filtration rate of less than 30 mL/min per 1.73 m2), patients with end-stage renal disease, or patients on dialysis. Serious side effects associated with canagliflozin include ketoacidosis, kidney problems, hyperkalemia, serious urinary tract infections, and hypoglycemia. The most common side effects are yeast infections of the vagina or penis, and changes in urination.
The full prescribing information for canagliflozin is available on the FDA website.
Janssen has announced that it has submitted a supplemental new drug application to the Food and Drug Administration to add an indication for canagliflozin (Invokana). The sodium-glucose cotransporter 2 is currently indicated, in addition to diet and exercise, for glycemic control in type 2 diabetes. However, in hopes of reducing the risks of end-stage kidney disease and of renal or cardiovascular death, according to a press release from the manufacturer.
If approved, canagliflozin will be the first diabetes medicine for the treatment of people living with type 2 diabetes and chronic kidney disease, according to the press release.
The application was based on the results of the phase 3 CREDENCE trial, a randomized, double-blind, placebo-controlled, multicenter study of 4,401 patients with type 2 diabetes, stage 2 or 3 chronic kidney disease, and macroalbuminuria. The patients received standard of care as well. The trial was stopped early, in July 2018, because it had met the prespecified criteria for efficacy. Data from the trial will be presented in mid-April at the annual meeting of the International Society of Nephrology World Congress of Nephrology in Melbourne.
Canagliflozin is contraindicated in patients with severe renal impairment (an estimated glomerular filtration rate of less than 30 mL/min per 1.73 m2), patients with end-stage renal disease, or patients on dialysis. Serious side effects associated with canagliflozin include ketoacidosis, kidney problems, hyperkalemia, serious urinary tract infections, and hypoglycemia. The most common side effects are yeast infections of the vagina or penis, and changes in urination.
The full prescribing information for canagliflozin is available on the FDA website.
Hyperglycemia drives leaky gut syndrome, inflammation
MIAMI – Hyperglycemia increases intestinal permeability, which facilitates enteric infections and systemic inflammation, reported Christoph Thaiss, PhD.
The findings upend the old idea that intestinal barrier dysfunction leads to diabetes, Dr. Thaiss said during a plenary session at the annual Gut Microbiota for Health World Summit. Multiple mouse models link hyperglycemia to intestinal barrier dysfunction, and hemoglobin A1C (HbA1c) levels in humans “highly correlate with the influx of microbial molecules into the intestinal epithelium.”
Researchers often struggle to decide if apparent causes are really confounders or even downstream results (reverse causation). In the metabolic syndrome, patients are known to have increased intestinal permeability – so-called leaky gut – and microbes crossing the gastrointestinal epithelium have been found to cause both gut mucosal infections and chronic systemic inflammation. But because these mechanisms were poorly understood, some experts posited that intestinal barrier dysfunction induced pancreatic beta cell inflammation, insulin resistance, and diabetes.
To take a deeper dive, Dr. Thaiss and his associates at the University of Pennsylvania, Philadelphia started with a mouse model of morbid obesity. The mice had multiple systemic sites with microbial pattern recognition ligands, signifying microbial influx from the gut. They also had genetic signatures indicating a marked disruption of junctions between epithelial cells, compared with healthy controls.
The obese mice also were much more susceptible to enteric infections with Citrobacter rodentium (a Salmonella analog), but obesity itself did not drive this risk, Dr. Thaiss explained. In fact, two different murine models of nonobese type 1 diabetes mellitus showed “leaky” intestinal epithelial adherence junctions, heightened susceptibility to C. rodentium infection, and showed systemic pathogen spread. Ribosomal DNA sequencing showed that these hyperglycemic (diabetic) mice had shifts in their gut microbiomes; however, translocating the altered microbiota to normal mice did not make them more susceptible to enteric infections or systemic inflammation.
Based on these findings, the researchers hypothesized that hyperglycemia itself drove susceptibility to enteric infections. They confirmed this by administering insulin to the mice with type 1 diabetes, which restored intestinal epithelial adherence junctions and stopped the systemic spread of pathogens. In vitro, exposing intestinal epithelial cells to glucose-induced barrier dysfunctions that increased over time and with higher glucose concentrations. RNA sequencing demonstrated that hyperglycemia markedly changed expression of genes that encode proteins that regulate intestinal barrier function. Moreover, hyperglycemic mice lacking the bidirectional glucose transporter GLUT2 showed no intestinal barrier dysfunction and were not susceptible to C. rodentium infection and systemic spread.
Finally, the investigators studied more than 30 clinical measures and microbial products in the systemic circulation of 27 healthy human volunteers. “Of all the variables we measured, HbA1c showed the strongest correlation with the influx of microbial molecules,” said Dr. Thaiss. Serum HbA1c correlated highly (P = .008) with levels of toll-like receptor 4, an indicator of systemic pathogens, but not with body mass index (P = .76).
The findings in humans confirm those in mice and indicate that hyperglycemia is a direct cause of intestinal barrier dysfunction and susceptibility to enteric infection, Dr. Thaiss said, adding that the systemic influx of microbial products might explain the wide range of otherwise unrelated inflammatory conditions seen in patients with metabolic syndrome. Future studies of therapies for enteric infection and systemic inflammation might focus on glucose as a modifier of intestinal barrier function.
These findings, reported at the meeting sponsored by the American Gastroenterological Association and the European Society for Neurogastroenterology and Motility, were also published in Science.
The work was supported by a Boehringer Ingelheim Funds PhD fellowship, the Leona M. and Harry B. Helmsley Charitable Trust, the Adelis Foundation, the Gurwin Family Fund for Scientific Research, the Crown Endowment Fund for Immunological Research, and others. Dr. Thaiss and his coinvestigators reported having no conflicts of interest.
SOURCE: Thaiss CA et al. Science. 2018;359(6382):1376-83.
REPORTING FROM GMFH 2019
NIH director updates study enrolling one million participants
NEW ORLEANS – It is not too late to enroll your patients or yourself into the largest longitudinal cohort study ever initiated, according to Francis S. Collins, MD, PhD, who is director of the National Institutes of Health (NIH).
Since May 2018, when it was initiated, the NIH-funded All of Us Research Program has already enrolled 200,000 of the planned goal of one million participants in the United States. Of these, approximately half have already provided baseline demographics and health information as well as their consent to use the slew of health data that is being collected.
“The only way to do this kind of thing is to have data – a lot of it,” said Dr. Collins, explaining the premise of the All of Us Research Program in an interview conducted at the annual meeting of the Endocrine Society.
The data are not limited to medical records: Blood samples, whole genome sequencing, wearable activity monitors, and subject-completed questionnaires are among a long list of sources of information to be collected from participants, who are expected to be followed indefinitely.
According to Dr. Collins, who delivered a plenary address at the meeting, these data will become more valuable over time, one of the most important goals of this study is to prepare the way for precision medicine. As opposed to the traditional one-size-fits-all approach to treating disease, he believes that this large dataset will allow researchers to understand differences in common diseases at the individual level.
In relation to endocrinology, Dr. Collins said that a cohort of one million participants would be expected to have close to 100,000 individuals with diabetes mellitus.
“This is going to be transformative,” said Dr. Collins, who emphasized that the enrollment is specifically designed to capture participants from diverse ethnic and racial groups.
All of the data collected will be made broadly available to research initiatives of all kinds, many of which have not yet even been envisioned.
Information on enrollment is available on line: joinallofus.org.
REPORTING FROM ENDO 2019

Long-term metformin offsets diabetes in patients with higher glucose/HbA1c, history of gestational diabetes
Metformin is especially effective in diabetes prevention among persons with higher baseline fasting glucose, higher hemoglobin A1c (HbA1c), or a history of gestational diabetes, based on 15-year follow-up results from the Diabetes Prevention Program and the Diabetes Prevention Program Outcomes Study.
Beyond those subgroups, metformin remained effective regardless of how diabetes was diagnosed, with a risk reduction of up to 36%, according to a report published in Diabetes Care.
“These results should help to prioritize those groups at high risk of developing diabetes who will benefit most from being treated with metformin,” said the report’s writing committee, chaired by David M. Nathan, MD, professor of medicine at Harvard Medical School, Boston.
However, the link between higher HbA1c and better efficacy of metformin should be “considered carefully,” according to Dr. Nathan and his cocommittee members, who noted that the original criteria for the Diabetes Prevention Program study were based on glucose level, rather than HbA1c level.
Initial results of the Diabetes Prevention Program study indicated a particular benefit of metformin after an average of 2.8 years of follow-up in individuals with higher baseline fasting glucose levels and in women with a self-reported history of gestational diabetes (N Engl J Med. 2002 Feb 7;346[6]:393-403).
Those results prompted the American Diabetes Association and others to recommend consideration of metformin for diabetes prevention in individuals considered to be at high risk, Dr. Nathan and his colleagues noted. “This recommendation is further supported by the demonstrated cost savings of metformin in diabetes prevention.”
The Diabetes Prevention Program study originally included 3,234 high-risk participants enrolled between 1996 and 1999 and randomized to masked metformin, placebo, or intensive lifestyle intervention. The 15-year follow-up analysis considered the 2,155 individuals randomized to the metformin or placebo groups, of whom 1,861 (86%) chose to continue in the Diabetes Prevention Program Outcomes Study, in which they continued to receive metformin unmasked.
Over the 15 years, the incidence of diabetes development based on fasting or 2-hour glucose results was 17% lower in the metformin group, compared with the placebo group (hazard ratio, 0.83; or –1.25 cases per 100 person-years), according to Dr. Nathan and his colleagues.
For diabetes development based on HbA1c level, metformin was linked to a 36% reduction in risk, compared with placebo, or –1.67 cases per 100 person-years.
Higher baseline fasting plasma glucose (110-125 mg/dL vs. 95-109 mg/dL) was associated with a greater effect of metformin in reducing diabetes development over 15 years (P = .0004).
Metformin’s effect in reducing diabetes development was “nearly identical” in participants with an HbA1c of 6.0%-6.4%, compared with less than 6.0%, with HRs of 0.63 and 0.61, respectively; however, looking at rate differences, there was “substantial heterogeneity” between the groups, at –3.88 and –1.03 cases per 100 person-years, respectively, the investigators wrote.
For women with a history of gestational diabetes, metformin was linked to a 41% reduction in diabetes development, compared with placebo (P = .03); in women without gestational diabetes, the difference was a nonsignificant 6% reduction, compared with placebo. In terms of risk differences, this translated into a reduction of 4.57 cases per 100 person-years in women with gestational diabetes, compared with a reduction of just 0.38 cases in women without such a history. The authors noted that it is “complicated” to determine whether greater credence be given to the results based on glucose or those based on HbA1c.
On the one hand, the generalizability of the HbA1c analyses is adversely affected because the analyses were performed post hoc on a set of participants who had initially been selected for the study based on prediabetes defined by glucose. On the other, the HbA1c results may be more clinically relevant because “in many countries, oral glucose tolerance tests are not used routinely for the identification of persons at high risk for diabetes or with diabetes,” the authors wrote.
Continued follow-up of these patients will provide additional data on the potential long-term benefits of metformin use, such as the incidence of cardiovascular disease, cancer, and microvascular disease, the investigators concluded.
The National Institute of Diabetes and Digestive and Kidney Diseases and Department of Veterans Affairs, among others, funded the Diabetes Prevention Program and subsequent outcomes study. Lipha provided medication and LifeScan donated materials during the studies. Additional funding to the Diabetes Prevention Program was provided by Bristol-Myers Squibb and Parke-Davis.
SOURCE: Nathan DM et al. Diabetes Care. 2019 Mar 15. doi: 10.2337/dc18-1970.
FROM DIABETES CARE
ACC, AHA release first cardiovascular disease primary prevention guideline
that takes into account each person’s social determinants of health. The guideline substantially dialed down prior recommendations on aspirin for primary prevention by calling for no use in people older than 70 years and infrequent use in those 40-70 years old.
The American College of Cardiology and the American Heart Association released their 2019 guideline on the primary prevention of cardiovascular disease on March 17, during the annual meeting of the American College of Cardiology (J Amer Coll Cardiol. 2019 March 17;doi: 10.1016/j.jacc.2019.03.010.). The guideline is a “one-stop shop” that pulls together existing recommendations from the two organizations and combines it with some new recommendations that address issues such as aspirin prophylaxis, and the social setting of each person, said Donna K. Arnett, Ph.D., professor of epidemiology at the University of Kentucky, dean of the university’s College of Public Health, and co-chair of the guideline writing panel.
“We made the social determinants of health front and center. With many people, clinicians don’t ask whether they have access to healthy foods or a way to get to the pharmacy. Asking about these issues is step one,” toward helping people address their social situation, Dr. Arnett said while introducing the new guideline in a press briefing. The guideline recommends that clinicians assess the social determinants for each person treated for cardiovascular disease prevention using a screening tool developed by the U.S. Centers for Medicare & Medicaid Services and made available by the National Academy of Medicine (NAM Perspectives. 2017; doi:10.31478/201705b).
“No other guideline has highlighted the social determinants of health,” noted Erin D. Michos, MD, associate director of preventive cardiology at Johns Hopkins Medicine in Baltimore, and a member of the guideline-writing panel. Other overarching themes of the guideline are its emphasis on the need for a team of clinicians to deliver all the disparate and time-consuming facets of care needed for comprehensive primary prevention of cardiovascular disease, and its call for a healthy lifestyle throughout life as foundations for prevention, Dr. Michos said in an interview.
With 48 recommendations, the guideline also deals with prevention issues such as a healthy diet and body mass, appropriate control of diabetes, smoking cessation, and control of blood pressure and cholesterol (see chart). The writing committee took the cholesterol and blood pressure recommendations directly from recent guidelines from the ACC and AHA in 2017 (blood pressure:J Amer Coll Cardiol. 2018 May;71[19]:e177-e248) and 2018 (cholesterol:Circulation. 2018 Nov 10;doi: 10.1161/CIR.0000000000000625).
The other major, new recommendations in the guideline deal with aspirin use for primary prevention, which recently underwent a shake up with publication of results from several studies that showed less cardiovascular benefit and more potential bleeding harm from routine aspirin prophylaxis than previously appreciated. Among the most notable of these reports, which led to a class III recommendation – do not use – for aspirin in people more than 70 years old came from the ASPREE (Aspirin in Reducing Events in the Elderly) study (New Engl J Med. 2018 Oct 18;379[16]:1519-28). For those 40-70 years old, the recommendation is class IIb, worded as “might be considered for select adults.”
“Generally no, occasionally yes,” is aspirin appropriate for people in this age group, notably those at high risk for cardiovascular disease and also at low risk for bleeding, explained Amit Khera, MD, a guideline-panel member, and professor of medicine and director of preventive cardiology at the University of Texas Southwestern Medical Center in Dallas.
As a guideline for primary prevention, a prime target audience is primary care physicians, who would need to be instrumental in applying the guideline. But the guideline recommendations released by the ACC and AHA for blood pressure management in 2017 were not accepted by U.S. groups that represent primary care physicians, the American College of Physicians, and the American Academy of Family Physicians.
John J. Warner, MD, an interventional cardiologist, executive vice president for health system affairs at UT Southwestern, and president of the AHA when the blood pressure guideline came out said that the ACC and AHA “learned some lessons” from the blood pressure experience. The societies responded this time around by “trying to view the document through as many lenses as possible” during the peer review process, Dr. Warner said during the press conference.

“I don’t think the new guideline will be seen as anything except positive,” commented Martha Gulati, MD, professor of medicine and chief of cardiology at the University of Arizona in Phoenix. Collecting all the cardiovascular disease recommendations for primary prevention in one document “helps clinicians access the information easily and helps patients see the big picture,” said Dr. Gulati, who was not involved in the guideline’s writing or review.

She especially applauded the recommendations to assess each person’s social determinants of health, the team-care approach, and the recommendations dealing with diet and other aspects of a healthy lifestyle. “This was a perfect time” to bring together the existing blood pressure and cholesterol guidelines, the new guidance on aspirin use, and the other recommendation in a single document, she said in an interview.
Dr. Arnett, Dr. Michos, Dr. Khera, Dr. Warner, and Dr. Gulati had no disclosures.
[email protected]
On Twitter @mitchelzoler
SOURCE: Arnett DK et al. J Amer Coll Cardiol. 2019 March 17;doi: 10.1016/j.jacc.2019.03.010.
that takes into account each person’s social determinants of health. The guideline substantially dialed down prior recommendations on aspirin for primary prevention by calling for no use in people older than 70 years and infrequent use in those 40-70 years old.
The American College of Cardiology and the American Heart Association released their 2019 guideline on the primary prevention of cardiovascular disease on March 17, during the annual meeting of the American College of Cardiology (J Amer Coll Cardiol. 2019 March 17;doi: 10.1016/j.jacc.2019.03.010.). The guideline is a “one-stop shop” that pulls together existing recommendations from the two organizations and combines it with some new recommendations that address issues such as aspirin prophylaxis, and the social setting of each person, said Donna K. Arnett, Ph.D., professor of epidemiology at the University of Kentucky, dean of the university’s College of Public Health, and co-chair of the guideline writing panel.
“We made the social determinants of health front and center. With many people, clinicians don’t ask whether they have access to healthy foods or a way to get to the pharmacy. Asking about these issues is step one,” toward helping people address their social situation, Dr. Arnett said while introducing the new guideline in a press briefing. The guideline recommends that clinicians assess the social determinants for each person treated for cardiovascular disease prevention using a screening tool developed by the U.S. Centers for Medicare & Medicaid Services and made available by the National Academy of Medicine (NAM Perspectives. 2017; doi:10.31478/201705b).
“No other guideline has highlighted the social determinants of health,” noted Erin D. Michos, MD, associate director of preventive cardiology at Johns Hopkins Medicine in Baltimore, and a member of the guideline-writing panel. Other overarching themes of the guideline are its emphasis on the need for a team of clinicians to deliver all the disparate and time-consuming facets of care needed for comprehensive primary prevention of cardiovascular disease, and its call for a healthy lifestyle throughout life as foundations for prevention, Dr. Michos said in an interview.
With 48 recommendations, the guideline also deals with prevention issues such as a healthy diet and body mass, appropriate control of diabetes, smoking cessation, and control of blood pressure and cholesterol (see chart). The writing committee took the cholesterol and blood pressure recommendations directly from recent guidelines from the ACC and AHA in 2017 (blood pressure:J Amer Coll Cardiol. 2018 May;71[19]:e177-e248) and 2018 (cholesterol:Circulation. 2018 Nov 10;doi: 10.1161/CIR.0000000000000625).
The other major, new recommendations in the guideline deal with aspirin use for primary prevention, which recently underwent a shake up with publication of results from several studies that showed less cardiovascular benefit and more potential bleeding harm from routine aspirin prophylaxis than previously appreciated. Among the most notable of these reports, which led to a class III recommendation – do not use – for aspirin in people more than 70 years old came from the ASPREE (Aspirin in Reducing Events in the Elderly) study (New Engl J Med. 2018 Oct 18;379[16]:1519-28). For those 40-70 years old, the recommendation is class IIb, worded as “might be considered for select adults.”
“Generally no, occasionally yes,” is aspirin appropriate for people in this age group, notably those at high risk for cardiovascular disease and also at low risk for bleeding, explained Amit Khera, MD, a guideline-panel member, and professor of medicine and director of preventive cardiology at the University of Texas Southwestern Medical Center in Dallas.
As a guideline for primary prevention, a prime target audience is primary care physicians, who would need to be instrumental in applying the guideline. But the guideline recommendations released by the ACC and AHA for blood pressure management in 2017 were not accepted by U.S. groups that represent primary care physicians, the American College of Physicians, and the American Academy of Family Physicians.
John J. Warner, MD, an interventional cardiologist, executive vice president for health system affairs at UT Southwestern, and president of the AHA when the blood pressure guideline came out said that the ACC and AHA “learned some lessons” from the blood pressure experience. The societies responded this time around by “trying to view the document through as many lenses as possible” during the peer review process, Dr. Warner said during the press conference.
“I don’t think the new guideline will be seen as anything except positive,” commented Martha Gulati, MD, professor of medicine and chief of cardiology at the University of Arizona in Phoenix. Collecting all the cardiovascular disease recommendations for primary prevention in one document “helps clinicians access the information easily and helps patients see the big picture,” said Dr. Gulati, who was not involved in the guideline’s writing or review.
She especially applauded the recommendations to assess each person’s social determinants of health, the team-care approach, and the recommendations dealing with diet and other aspects of a healthy lifestyle. “This was a perfect time” to bring together the existing blood pressure and cholesterol guidelines, the new guidance on aspirin use, and the other recommendation in a single document, she said in an interview.
Dr. Arnett, Dr. Michos, Dr. Khera, Dr. Warner, and Dr. Gulati had no disclosures.
[email protected]
On Twitter @mitchelzoler
SOURCE: Arnett DK et al. J Amer Coll Cardiol. 2019 March 17;doi: 10.1016/j.jacc.2019.03.010.
REPORTING FROM ACC 2019