User login
U.S. cancer centers embroiled in Chinese research thefts
Academic cancer centers around the United States continue to get caught up in an ever-evolving investigation into researchers – American and Chinese – who did not disclose payments from or the work they did for Chinese institutions while simultaneously accepting taxpayer money through U.S. government grants.
The U.S. Federal Bureau of Investigation has been ferreting out researchers it says have acted illegally.
On Jan. 28, the agency arrested Charles Lieber, a chemist from Harvard University, Cambridge, Mass., and also unveiled charges against Zheng Zaosong, a cancer researcher who is in the United States on a Harvard-sponsored visa.
The FBI said Mr. Zheng, who worked at the Harvard-affiliated Beth Israel Deaconess Medical Center, Boston, tried to smuggle 21 vials of biological material and research to China. Mr. Zheng was arrested in December at Boston’s Logan Airport. He admitted he planned to conduct and publish research in China using the stolen samples, said the FBI.
“All of the individuals charged today were either directly or indirectly working for the Chinese government, at our country’s expense,” said the agent in charge of the FBI’s Boston office, Joseph R. Bonavolonta.
Sen. Charles Grassley (R-IA), who has been pushing for more government action against foreign theft of U.S. research, said in a statement, “I’m glad the FBI appears to be taking foreign threats to taxpayer-funded research seriously, but I fear that this case is only the tip of the iceberg.”
The FBI said it is investigating China-related cases in all 50 states.
Ross McKinney, MD, the chief scientific officer at the Association of American Medical Colleges (AAMC), said he is aware of some 200 investigations, not all of which are cancer related, at 70-75 institutions.
“It’s a very ubiquitous problem,” Dr. McKinney said in an interview.
He also pointed out that some 6,000 National Institutes of Health–funded principal investigators are of Asian background. “So that 200 is a pretty small proportion,” said Dr. McKinney.
The NIH warned some 10,000 institutions in August 2018 that it had uncovered Chinese manipulation of peer review and a lack of disclosure of work for Chinese institutions. It urged the institutions to report irregularities.
For universities, “the trouble is sorting out who is the violator from who is not,” said Dr. McKinney. He noted that they are not set up to investigate whether someone has a laboratory in China.
“The fact that the Chinese government exploited the fact that universities are typically fairly trusting is extremely disappointing,” he said.
Moffitt story still unfolding
The most serious allegations have been leveled against six former employees of the Moffitt Cancer Center and Research Institute in Tampa, Florida.
In December 2019, Moffitt announced that the six – including President and CEO Alan List, MD, and the center director, Thomas Sellers, PhD – had left Moffitt as a result of “violations of conflict of interest rules through their work in China.”
New details have emerged, thanks to a new investigative report from a committee of the Florida House of Representatives.
The report said that Sheng Wei, a naturalized U.S. citizen who had worked at Moffitt since 2008 – when Moffitt began its affiliation with the Tianjin Medical University Cancer Institute and Hospital – was instrumental in recruiting top executives into the Thousand Talents program, which Wei had joined in 2010, according to the report. These executives included Dr. List, Dr. Sellers, and also Daniel Sullivan, head of Moffitt’s clinical science program, and cancer biologist Pearlie Epling-Burnette, it noted.
Begun in 2008, China’s Thousand Talents Plan gave salaries, funding, laboratory space, and other incentives to researchers who promised to bring U.S.-gained knowledge and research to China.
All information about this program has been removed from the Internet, but the program may still be active, Dr. McKinney commented.
According to the report, Dr. List pledged to work for the Tianjin cancer center 9 months a year for $71,000 annually. He was appointed head of the hematology department ($85,300 a year) in 2016. He opened a bank account in China to receive that salary and other Thousand Talents payments, the report found. The report notes that the exact amount Dr. List was paid is still not known.
Initially, Dr. Sellers, who was the principal investigator for Moffitt’s National Cancer Institute core grant, said he had not been involved in the Thousand Talents program. He later admitted that he had pledged to work in China 2 months a year for the program and that he’d opened a Chinese bank account and had deposited at least $35,000 into the account, the report notes.
The others pledged to work for the Thousand Talents program and also opened bank accounts in China and received money in those accounts.
Another Moffitt employee, Howard McLeod, MD, had worked for Thousand Talents before he joined Moffitt but did not disclose his China work. Dr. McLeod also supervised and had a close relationship with another researcher, Yijing (Bob) He, MD, who was employed by Moffitt but who lived in China, unbeknownst to Moffitt. “Dr. He appears to have functioned as an agent of Dr. McLeod in China,” said the report.
The report concluded that “none of the Moffitt faculty who were Talents program participants properly or timely disclosed their Talents program involvement to Moffitt, and none disclosed the full extent of their Talents program activities prior to Moffitt’s internal investigation.”
No charges have been filed against any of the former Moffitt employees.
However, the Cancer Letter has reported that Dr. Sellers is claiming he was not involved in the program and that he is preparing to sue Moffitt.
AAMC’s Dr. McKinney notes that it is illegal for researchers to take U.S. government grant money and pledge a certain amount of time but not deliver on that commitment because they are working for someone else – in this case, China. They also lied about not having any other research support, which is also illegal, he said.
The researchers received Chinese money and deposited it in Chinese accounts, which was never reported to the U.S. Internal Revenue Service.
“One of the hallmarks of the Chinese recruitment program was that people were instructed to not tell their normal U.S. host institution and not tell any U.S. government agency about their relationship with China,” Dr. McKinney said. “It was creating a culture where dishonesty in this situation was norm,” he added.
The lack of honesty brings up bigger questions for the field, he said. “Once you start lying about one thing, do you lie about your science, too?”
Lack of oversight?
Dr. McKinney said the NIH, as well as universities and hospitals, had a long and trusting relationship with China and should not be blamed for falling prey to the Chinese government’s concerted effort to steal intellectual property.
But some government watchdog groups have chided the NIH for lax oversight. In February 2019, the federal Health & Human Services’ Office of Inspector General found that “NIH has not assessed the risks to national security when permitting data access to foreign [principal investigators].”
Federal investigators have said that Thousand Talents has been one of the biggest threats.
The U.S. Senate Permanent Subcommittee on Investigations reported in November 2019 that “the federal government’s grant-making agencies did little to prevent this from happening, nor did the FBI and other federal agencies develop a coordinated response to mitigate the threat.”
The NIH invests $31 billion a year in medical research through 50,000 competitive grants to more than 300,000 researchers, according to that report. Even after uncovering grant fraud and peer-review manipulation that benefited China, “significant gaps in NIH’s grant integrity process remain,” the report states. Site visits by the NIH’s Division of Grants Compliance and Oversight dropped from 28 in 2012 to just 3 in 2018, the report noted.
Widening dragnet
In April 2019, Science reported that the NIH identified five researchers at MD Anderson Cancer Center in Houston who had failed to disclose their ties to Chinese enterprises and who had failed to keep peer review confidential.
Two resigned before they could be fired, one was fired, another eventually left the institution, and the fifth was found to have not willfully engaged in subterfuge.
Just a month later, Emory University in Atlanta announced that it had fired a husband and wife research team. The neuroscientists were known for their studies of Huntington disease. Both were U.S. citizens and had worked at Emory for more than 2 decades, according to the Science report.
The Moffitt situation led to the Florida legislature’s investigation, and also prompted some soul searching. The Tampa Bay Times reported that U.S. Senator Rick Scott (R-FL) asked state universities to provide information on what they are doing to stop foreign influence. The University of Florida then acknowledged that four faculty members resigned or were terminated because of ties to a foreign recruitment program.
This article first appeared on Medscape.com.
Physician groups push back on Medicaid block grant plan
It took less than a day for physician groups to start pushing back at the Centers for Medicare & Medicaid Services over its new Medicaid block grant plan, which was introduced on Jan. 30.
Dubbed “Healthy Adult Opportunity,” the agency is offering all states the chance to participate in a block grant program through the 1115 waiver process.
According to a fact sheet issued by the agency, the program will focus on “adults under age 65 who are not eligible for Medicaid on the basis of disability or their need for long term care services and supports, and who are not eligible under a state plan. Other very low-income parents, children, pregnant women, elderly adults, and people eligible on the basis of a disability will not be directly affected – except from the improvement that results from states reinvesting savings into strengthening their overall programs.”
States will be operating within a defined budget when participating in the program and expenditures exceeding that defined budget will not be eligible for additional federal funding. Budgets will be based on a state’s historic costs, as well as national and regional trends, and will be tied to inflation with the potential to have adjustments made for extraordinary events. States can set their baseline using the prior year’s total spending or a per-enrollee spending model.
A Jan. 30 letter to state Medicaid directors notes that states participating in the program “will be granted extensive flexibility to test alternative approaches to implementing their Medicaid programs, including the ability to make many ongoing program adjustments without the need for demonstration or state plan amendments that require prior approval.”
Among the activities states can engage in under this plan are adjusting cost-sharing requirements, adopting a closed formulary, and applying additional conditions of eligibility. Requests, if approved, will be approved for a 5-year initial period, with a renewal option of up to 10 years.
But physician groups are not seeing a benefit with this new block grant program.
“Moving to a block grant system will likely limit the ability of Medicaid patients to receive preventive and needed medical care from their family physicians, and it will only increase the health disparities that exist in these communities, worsen overall health outcomes, and ultimately increase costs,” Gary LeRoy, MD, president of the American Academy of Family Physicians, said in a statement.
The American Medical Association concurred.
“The AMA opposes caps on federal Medicaid funding, such as block grants, because they would increase the number of uninsured and undermine Medicaid’s role as an indispensable safety net,” Patrice Harris, MD, the AMA’s president, said in a statement. “The AMA supports flexibility in Medicaid and encourages CMS to work with states to develop and test new Medicaid models that best meet the needs and priorities of low-income patients. While encouraging flexibility, the AMA is mindful that expanding Medicaid has been a literal lifesaver for low-income patients. We need to find ways to build on this success. We look forward to reviewing the proposal in detail.”
Officials at the American College of Obstetricians and Gynecologists said the changes have the potential to harm women and children’s health, as well as negatively impact physician reimbursement and ultimately access to care.
“Limits on the federal contribution to the Medicaid program would negatively impact patients by forcing states to reduce the number of people who are eligible for Medicaid coverage, eliminate covered services, and increase beneficiary cost-sharing,” ACOG President Ted Anderson, MD, said in a statement. “ACOG is also concerned that this block grant opportunity could lower physician reimbursement for certain services, forcing providers out of the program and jeopardizing patients’ ability to access health care services. Given our nation’s stark rates of maternal mortality and severe maternal morbidity, we are alarmed by the Administration’s willingness to weaken physician payment in Medicaid.”
A Comparison of 4 Single-Question Measures of Patient Satisfaction
From Dell Medical School, The University of Texas at Austin, Austin, TX.
Abstract
- Objective: Satisfaction measures often show substantial ceiling effects. This randomized controlled trial tested the null hypothesis that there is no difference in mean overall satisfaction, ceiling and floor effect, and data distribution between 4 different kinds of single-question scales assessing the helpfulness of a visit. We also hypothesized that there is no correlation between scaled satisfaction and psychological status. Finally, we assessed how the satisfaction scores compared with the Net Promoter Scores (NPS).
- Design: Randomized controlled trial.
- Methods: We enrolled 258 adult, English-speaking new and returning patients. Patients were randomly assigned to 1 of 4 different scale types: (1) an 11-point ordinal scale with 5 anchor points; (2) a 5-point Likert scale; (3) a 0-100 visual analogue scale (VAS) electronic slider with 3 anchor points and visible numbers; and (4) a 0-100 VAS with 3 anchor points and no visible numbers. Additionally, patients completed the 2-item Pain Self-Efficacy Questionnaire (PSEQ-2), 5-item Short Health Anxiety Inventory scale (SHAI-5), and Patient-Reported Outcomes Measurement Information System (PROMIS) Depression. We assessed mean and median score, floor and ceiling effect, and skewness and kurtosis for each scale. Spearman correlation tests were used to test correlations between satisfaction and psychological status.
- Results: The nonnumerical 0-100 VAS with 3 anchor points and the 5-point Likert scale had the least ceiling effect (12% and 20%, respectively). The 11-point ordinal scale had skewness and kurtosis closest to a normal distribution (skew = –0.58 and kurtosis = 4.0). Scaled satisfaction scores had a small but significant correlation with PSEQ-2 (r = 0.17; P = 0.006), but not with SHAI-5 (r = –0.12; P = 0.052) or PROMIS Depression (r = –0.12; P = 0.064). NPS were 35, 16, 67, and 20 for the scales, respectively.
- Conclusion: Single-question measures of satisfaction can be adjusted to limit the ceiling effect. Additional research in this area is warranted.
Keywords: patient satisfaction; floor and ceiling effect; skewness and kurtosis; quality improvement.
Patient satisfaction is an important quality metric that is increasingly being measured, reported, and incentivized. A qualitative study identified 7 themes influencing satisfaction among people visiting an orthopedic surgeon’s office: trust, relatedness, expectations, wait time, visit duration, communication, and empathy.1 However, another study found that satisfaction and perceived empathy are not associated with wait time or visit duration, but rather with the quality of the visit.2 Satisfaction measures that incorporate many of these features in relatively long questionnaires are associated with lower response rates3 and overlap with the factors whose influence on satisfaction one would like to study (eg, perceived empathy or communication effectiveness).4 Single- and multiple-question satisfaction scores are prone to a strong right skew, with a substantial ceiling effect.5 Ceiling effect occurs when a considerable proportion (about half) of participants select 1 of the top 2 scores (or the maximum score). An ideal scale would measure satisfaction independent from other factors, would use 1 or just a few questions, and would have little or no ceiling effect.
In this randomized controlled trial, we examined whether there were significant differences in mean and median satisfaction, floor and ceiling effect, and data distribution (by looking at skewness and kurtosis) between 4 different kinds of satisfaction scales asking about the helpfulness of a visit. Additionally, we hypothesized that there is no correlation between scaled satisfaction and psychological status. Finally, we assessed how the satisfaction scores compared to the Net Promoter Scores (NPS). NPS are commonly used in the service industry to measure customer satisfaction; we are using these scores as a measure of patient satisfaction.
Methods
Study Design
All English-speaking new and return patients ages 18 to 89 years visiting an orthopedic surgeon in 1 of 7 clinics located in a large urban area were considered eligible for this study. Enrollment took place intermittently over a 5-month period. We were granted a waiver of written informed consent. Patients indicated their consent by completing the surveys. Patients were randomly assigned to 1 of the 4 questionnaires containing different scale types using an Excel random-number generator. After the visit, patients were asked to complete the survey. All questionnaires were administered on an encrypted tablet via a HIPAA-compliant, secure web-based application for building and managing online surveys and databases (REDCap; Research Electronic Data Capture).6 This study was approved by our Institutional Review Board and is registered on ClinicalTrials.gov (NCT03686735).7
Outcome Measures
Study participants were asked to complete questionnaires regarding demographics (sex, age, race/ethnicity, marital status, level of education, work status, insurance status, comorbidities) and to rate satisfaction with their visit on the scale that was randomly assigned to them: (1) an 11-point Likert scale with 5 anchor points and visible numbers; (2) a 5-point Likert scale with 5 anchor points and no visible numbers; (3) a 0-100 VAS with 3 anchor points and visible numbers; (4) a 0-100 VAS with 3 anchor points and no visible numbers (Figure 1). The 4 scales should not differ in time needed to complete them; however, we did not explicitly measure time to completion. Participants also completed measures of psychological aspects of illness. The 2-item Pain Self-Efficacy Questionnaire (PSEQ-2) was used to measure pain self-efficacy, an effective coping strategy for pain.8 Higher PSEQ-2 scores indicate a higher level of pain self-efficacy. The 5-item Short Health Anxiety Inventory scale (SHAI-5) was also administered; higher scores on this scale indicate a greater degree of health anxiety.9 The Patient-Reported Outcomes Measurement Information System (PROMIS) Depression was used to measure symptoms of depression.10 Finally, the diagnosis was recorded by the surgeon (not in table).

Statistical Analysis
We reported continuous variables using mean, standard deviation (SD), median, and interquartile range (IQR). Categorical data are presented as frequencies and percentages. We calculated floor and ceiling effect and the skewness and kurtosis of every scale. We scaled every scale to 10 and also standardized every scale. We used the Kruskal–Wallis test to compare differences in satisfaction between the scales; Fisher’s exact test to compare differences in floor and ceiling effect; and Spearman correlation tests to test the correlation between scaled satisfaction scores and psychological status.
Ceiling effects are present when patients select the highest value on a scale rather than a value that reflects their actual feelings about a certain topic. Floor effects are present when patients select the lowest value in a similar fashion. These 2 effects indicate that an independent variable no longer influences the dependent variable being tested. Skewness and kurtosis are rough indicators of a normal distribution of values. Skewness (γ1) is an index of the symmetry of a distribution, with symmetric distributions having a skewness of 0. If skewness has a positive value, it suggests relatively many low values, having a long right tail. Negative skewness suggests relatively many high values, having a long left tail. Kurtosis (γ2) is a measure to describe tailedness of a distribution. Kurtosis of a normal distribution is 3. Negative kurtosis represents little peaked distribution, and positive kurtosis represents more peaked distribution.11,12 If skewness is 0 and kurtosis is 3, there is a normal, or Gaussian, distribution.
Finally, we manually calculated the NPS for all scales by subtracting the percentage of detractors (people who scored between 0 and 6) from the percentage of promoters (people who scored 9 or 10).13 NPS are widely used in the service industry to assess customer satisfaction, and scores range between –100 and 100.
An a priori power analysis indicated that in order to find a difference in satisfaction of 0.5 on a 0-10 scale, with an effect size of 80% and alpha set at 0.05, we needed 128 patients (64 per group). Since we wanted to compare 4 satisfaction scales, we doubled this.
Results
Patient Characteristics
All patients invited to participate in this study agreed, and 258 patients with various diagnoses were enrolled. The median age of the cohort was 54 years (IQR, 40-65 years); 114 (44%) were men, and 119 (42%) were new patients (Table 1). The number of patients assigned to scales 1, 2, 3, and 4 were 62 (24%), 70 (27%), 67 (26%), and 59 (23%), respectively.

Difference in Distribution
Looking at the data distribution (Figure 2) and skewness and kurtosis (Table 2) of the scales, we found that none of the scales was normally distributed. 

Difference in Satisfaction Scores
Mean (SD) scaled satisfaction scores (range, 0-10) were 8.3 (1.2) for the 11-point ordinal scale, 8.3 (1.2) for the 5-point Likert scale, 8.9 (1.7) for the 0-100 numerical VAS, and 8.3 (1.3) for the 0-100 nonnumerical VAS (Table 3 and Table 4). 

Difference in Floor and Ceiling Effect
A difference was found in ceiling effect between the different scales (P = 0.025), with the 0-100 numerical VAS showing the highest ceiling effect (34%) and the 0-100 nonnumerical VAS showing the lowest ceiling effect (12%; Table 2). There was no floor effect. A single patient used the lowest score (on the Likert scale).
Correlation Between Satisfaction and Psychological Status
Scaled satisfaction scores had a small but significant correlation with PSEQ-2 (r = 0.17; P = 0.006), but not with SHAI-5 (r = –0.12; P = 0.052) or PROMIS Depression (r = –0.12; P = 0.064; not in table), indicating that patients with more self-efficacy had higher satisfaction ratings.
Net Promoter Scores
NPS were 35 for the 11-point ordinal scale; 16 for the 5-point Likert scale; 67 for the 0-100 numerical VAS; and 20 for the 0-100 nonnumerical VAS.
Discussion
Single-question measures of satisfaction can decrease patient burden and limit overlap with measures of communication effectiveness and perceived empathy. Both long and short questionnaires addressing satisfaction and perceived empathy show substantial ceiling effect. We compared 4 different measures for overall scores, floor and ceiling effect, and skewness and kurtosis, and assessed the correlation between scaled satisfaction and psychological status. We found that scale type influenced the median helpfulness score. As one would expect, scales with less ceiling effect have lower median scores. In other words, if the goal is to collect meaningful information and identify areas for improvement, there must be a willingness to accept lower scores.
Only the nonnumerical VAS was below the threshold of 15% ceiling effect proposed by Terwee et al.14 This scale with 3 anchor points and no visible numbers showed the least ceiling effect (12%) and minimal skew (–1.0), and was closer to kurtosis consistent with a normal distribution (5.0). However, the 11-point ordinal Likert scale with 5 anchor points and visible numbers had the lowest skewness and kurtosis (–0.58 and 4.0). The low ceiling effect observed with the nonnumerical VAS (12%) might be explained by the fact that the scale does not lead patients to a specific description of the helpfulness of their visit, but rather asks patients to use their own judgement in making the rating. The ordinal scale approached the most normal data distribution, and this might be explained by the presence of numbers on the scale. Ratings based on a 0-10 scale are commonly used, and familiarity with the system might have allowed people to pick a number that represents their actual view of the visit helpfulness, rather than picking the highest possible choice (which would have led to a ceiling effect). Study results comparing Likert scales and VAS are conflicting,15 with some preferring Likert scales for their responsiveness16 and ease of use in practice,17 and others preferring VAS for their sensitivity to describe continuous, subjective phenomenon and their high validity and reliability.18 Looking at our nonnumerical VAS, adding numbers to a scale might not help avoid, and may actually increase, the presence of ceiling effect. However, with the ordinal scale with visible numbers, we saw a 21% ceiling effect coupled with low skew and kurtosis (–0.58 and 4.0), which indicate that the distribution of scores is relatively normal. This finding is in line with other study results.19
Our findings demonstrated that feedback concerning self-efficacy, health anxiety, or depression had no or only a small effect on patient satisfaction. Consistent with prior evidence, psychological factors had limited or no correlation with satisfaction.20-24 Given the effect that priming has on patient-reported outcome measures, the effect of psychological factors on satisfaction could be an area of future study.
The NPS varied substantially based on scale structure. Increasing the spread of the scores to limit the ceiling effect will likely reduce promoters and detractors and increase neutrals. NPS systems have been used in the past to measure patient satisfaction with common hand surgery techniques and with community mental health services.25,26 These studies suggest that NPS could be a helpful addition to commonly used clinical measures of satisfaction, after more research has been done to validate it. The evidence showing that NPS are strongly influenced by scale structure suggests that NPS should be used and interpreted with caution.
Several caveats regarding this study should be kept in mind. This study specifically addressed ratings of visit helpfulness. Differently phrased questions might lead to different results. More work is needed to determine the essence of satisfaction with a medical visit.1 In addition, the majority of our patient population was white, employed, and privately insured, limiting generalizability to other populations with different demographics. Finally, all patients were seen by an orthopedic surgeon, and our results might not apply to other populations or clinical settings. However, given the scope of this study, we suspect that the findings can be generalized to specialty care in general and likely all medical contexts.
Conclusion
It is clear from this work that scale design can affect ceiling effect. We plan to test alternative phrasings and structures of single-question measures of satisfaction with a medical visit so that we can better study what factors contribute to satisfaction. It is notable that this approach runs counter to efforts to improve satisfaction scores, because reducing the ceiling effect reduces the mean score and may contribute to worse NPS. Further study is needed to find the optimal measure to assess satisfaction ratings.
Corresponding author: David Ring, MD, PhD, 1701 Trinity Street, Austin, TX, 78712; [email protected].
Financial disclosures: Dr. Ring has or may receive payment or benefits from Skeletal Dynamics; Wright Medical Group; the journal Clinical Orthopaedics and Related Research; and universities, hospitals, and lawyers not related to the submitted work.
1. Waters S, Edmondston SJ, Yates PJ, Gucciardi DF. Identification of factors influencing patient satisfaction with orthopaedic outpatient clinic consultation: A qualitative study. Man Ther. 2016;25:48-55.
2. Kortlever JTP, Ottenhoff JSE, Vagner GA, et al. Visit duration does not correlate with perceived physician empathy. J Bone Joint Surg Am. 2019;101:296-301.
3. Edwards P, Roberts I, Clarke M, et al. Methods to influence response to postal questionnaires. Cochrane Database Syst Rev. 2001(3):CD003227.
4. Salisbury C, Burgess A, Lattimer V, et al. Developing a standard short questionnaire for the assessment of patient satisfaction with out-of-hours primary care. Fam Pract. 2005;22:560-569.
5. Ross CK, Steward CA, Sinacore JM. A comparative study of seven measures of patient satisfaction. Med Care. 1995;33:392-406.
6. Harris PA, Taylor R, Thielke R, et al. Research electronic data capture (REDCap)--a metadata-driven methodology and workflow process for providing translational research informatics support. J Biomed Inform. 2009;42:377-381.
7. Medicine USNLo. ClinicalTrials.gov. Accessed March 18, 2019.
8. Nicholas MK, McGuire BE, Asghari A. A 2-item short form of the Pain Self-efficacy Questionnaire: development and psychometric evaluation of PSEQ-2. J Pain. 2015;16:153-163.
9. Salkovskis PM, Rimes KA, Warwick H, Clark D. The Health Anxiety Inventory: development and validation of scales for the measurement of health anxiety and hypochondriasis. Psychol Med. 2002;32:843-853.
10. Schalet BD, Pilkonis PA, Yu L, et al. Clinical validity of PROMIS depression, anxiety, and anger across diverse clinical samples. J Clin Epidemiol. 2016;73:119-127.
11. Ho AD, Yu CC. Descriptive statistics for modern test score distributions: skewness, kurtosis, discreteness, and ceiling effects. Educ Psychol Meas. 2015;75:365-388.
12. Kim HY. Statistical notes for clinical researchers: assessing normal distribution (2) using skewness and kurtosis. Restor Dent Endod. 2013;38:52-54.
13. NICE Satmetrix. What is net promoter? https://www.netpromoter.com/know/. Accessed March 18, 2019.
14. Terwee CB, Bot SD, de Boer MR, et al. Quality criteria were proposed for measurement properties of health status questionnaires. J Clin Epidemiol. 2007;60:34-42.
15. Hasson D, Arnetz BB. Validation and findings comparing VAS vs. Likert scales for psychosocial measurements. Int Electronic J Health Educ. 2005;8:178-192.
16. Vickers AJ. Comparison of an ordinal and a continuous outcome measure of muscle soreness. Int J Technol Assess Health Care. 1999;15:709-716.
17. Jaeschke R, Singer J, Guyatt GH. A comparison of seven-point and visual analogue scales: data from a randomized trial. Control Clin Trials. 1990;11:43-51.
18. Voutilainen A, Pitkaaho T, Kvist T, Vehvilainen-Julkunen K. How to ask about patient satisfaction? The visual analogue scale is less vulnerable to confounding factors and ceiling effect than a symmetric Likert scale. J Adv Nurs. 2016;72:946-957.
19. Brunelli C, Zecca E, Martini C, et al. Comparison of numerical and verbal rating scales to measure pain exacerbations in patients with chronic cancer pain. Health Qual Life Outcomes. 2010;8:42.
20. Hageman MG, Briet JP, Bossen JK, et al. Do previsit expectations correlate with satisfaction of new patients presenting for evaluation with an orthopaedic surgical practice? Clin Orthop Relat Res. 2015;473:716-721.
21. Keulen MHF, Teunis T, Vagner GA, et al. The effect of the content of patient-reported outcome measures on patient perceived empathy and satisfaction: a randomized controlled trial. J Hand Surg Am. 2018;43:1141.e1-e9.
22. Mellema JJ, O’Connor CM, Overbeek CL, et al. The effect of feedback regarding coping strategies and illness behavior on hand surgery patient satisfaction and communication: a randomized controlled trial. Hand. 2015;10:503-511.
23. Tyser AR, Gaffney CJ, Zhang C, Presson AP. The association of patient satisfaction with pain, anxiety, and self-reported physical function. J Bone Joint Surg Am. 2018;100:1811-1818.
24. Vranceanu AM, Ring D. Factors associated with patient satisfaction. J Hand Surg Am. 2011;36:1504-1508.
25. Stirling P, Jenkins PJ, Clement ND, et al. The Net Promoter Scores with Friends and Family Test after four hand surgery procedures. J Hand Surg Eur. 2019;44:290-295.
26. Wilberforce M, Poll S, Langham H, et al. Measuring the patient experience in community mental health services for older people: A study of the Net Promoter Score using the Friends and Family Test in England. Int J Geriatr Psychiatry. 2019;34:31-37.
From Dell Medical School, The University of Texas at Austin, Austin, TX.
Abstract
- Objective: Satisfaction measures often show substantial ceiling effects. This randomized controlled trial tested the null hypothesis that there is no difference in mean overall satisfaction, ceiling and floor effect, and data distribution between 4 different kinds of single-question scales assessing the helpfulness of a visit. We also hypothesized that there is no correlation between scaled satisfaction and psychological status. Finally, we assessed how the satisfaction scores compared with the Net Promoter Scores (NPS).
- Design: Randomized controlled trial.
- Methods: We enrolled 258 adult, English-speaking new and returning patients. Patients were randomly assigned to 1 of 4 different scale types: (1) an 11-point ordinal scale with 5 anchor points; (2) a 5-point Likert scale; (3) a 0-100 visual analogue scale (VAS) electronic slider with 3 anchor points and visible numbers; and (4) a 0-100 VAS with 3 anchor points and no visible numbers. Additionally, patients completed the 2-item Pain Self-Efficacy Questionnaire (PSEQ-2), 5-item Short Health Anxiety Inventory scale (SHAI-5), and Patient-Reported Outcomes Measurement Information System (PROMIS) Depression. We assessed mean and median score, floor and ceiling effect, and skewness and kurtosis for each scale. Spearman correlation tests were used to test correlations between satisfaction and psychological status.
- Results: The nonnumerical 0-100 VAS with 3 anchor points and the 5-point Likert scale had the least ceiling effect (12% and 20%, respectively). The 11-point ordinal scale had skewness and kurtosis closest to a normal distribution (skew = –0.58 and kurtosis = 4.0). Scaled satisfaction scores had a small but significant correlation with PSEQ-2 (r = 0.17; P = 0.006), but not with SHAI-5 (r = –0.12; P = 0.052) or PROMIS Depression (r = –0.12; P = 0.064). NPS were 35, 16, 67, and 20 for the scales, respectively.
- Conclusion: Single-question measures of satisfaction can be adjusted to limit the ceiling effect. Additional research in this area is warranted.
Keywords: patient satisfaction; floor and ceiling effect; skewness and kurtosis; quality improvement.
Patient satisfaction is an important quality metric that is increasingly being measured, reported, and incentivized. A qualitative study identified 7 themes influencing satisfaction among people visiting an orthopedic surgeon’s office: trust, relatedness, expectations, wait time, visit duration, communication, and empathy.1 However, another study found that satisfaction and perceived empathy are not associated with wait time or visit duration, but rather with the quality of the visit.2 Satisfaction measures that incorporate many of these features in relatively long questionnaires are associated with lower response rates3 and overlap with the factors whose influence on satisfaction one would like to study (eg, perceived empathy or communication effectiveness).4 Single- and multiple-question satisfaction scores are prone to a strong right skew, with a substantial ceiling effect.5 Ceiling effect occurs when a considerable proportion (about half) of participants select 1 of the top 2 scores (or the maximum score). An ideal scale would measure satisfaction independent from other factors, would use 1 or just a few questions, and would have little or no ceiling effect.
In this randomized controlled trial, we examined whether there were significant differences in mean and median satisfaction, floor and ceiling effect, and data distribution (by looking at skewness and kurtosis) between 4 different kinds of satisfaction scales asking about the helpfulness of a visit. Additionally, we hypothesized that there is no correlation between scaled satisfaction and psychological status. Finally, we assessed how the satisfaction scores compared to the Net Promoter Scores (NPS). NPS are commonly used in the service industry to measure customer satisfaction; we are using these scores as a measure of patient satisfaction.
Methods
Study Design
All English-speaking new and return patients ages 18 to 89 years visiting an orthopedic surgeon in 1 of 7 clinics located in a large urban area were considered eligible for this study. Enrollment took place intermittently over a 5-month period. We were granted a waiver of written informed consent. Patients indicated their consent by completing the surveys. Patients were randomly assigned to 1 of the 4 questionnaires containing different scale types using an Excel random-number generator. After the visit, patients were asked to complete the survey. All questionnaires were administered on an encrypted tablet via a HIPAA-compliant, secure web-based application for building and managing online surveys and databases (REDCap; Research Electronic Data Capture).6 This study was approved by our Institutional Review Board and is registered on ClinicalTrials.gov (NCT03686735).7
Outcome Measures
Study participants were asked to complete questionnaires regarding demographics (sex, age, race/ethnicity, marital status, level of education, work status, insurance status, comorbidities) and to rate satisfaction with their visit on the scale that was randomly assigned to them: (1) an 11-point Likert scale with 5 anchor points and visible numbers; (2) a 5-point Likert scale with 5 anchor points and no visible numbers; (3) a 0-100 VAS with 3 anchor points and visible numbers; (4) a 0-100 VAS with 3 anchor points and no visible numbers (Figure 1). The 4 scales should not differ in time needed to complete them; however, we did not explicitly measure time to completion. Participants also completed measures of psychological aspects of illness. The 2-item Pain Self-Efficacy Questionnaire (PSEQ-2) was used to measure pain self-efficacy, an effective coping strategy for pain.8 Higher PSEQ-2 scores indicate a higher level of pain self-efficacy. The 5-item Short Health Anxiety Inventory scale (SHAI-5) was also administered; higher scores on this scale indicate a greater degree of health anxiety.9 The Patient-Reported Outcomes Measurement Information System (PROMIS) Depression was used to measure symptoms of depression.10 Finally, the diagnosis was recorded by the surgeon (not in table).
Statistical Analysis
We reported continuous variables using mean, standard deviation (SD), median, and interquartile range (IQR). Categorical data are presented as frequencies and percentages. We calculated floor and ceiling effect and the skewness and kurtosis of every scale. We scaled every scale to 10 and also standardized every scale. We used the Kruskal–Wallis test to compare differences in satisfaction between the scales; Fisher’s exact test to compare differences in floor and ceiling effect; and Spearman correlation tests to test the correlation between scaled satisfaction scores and psychological status.
Ceiling effects are present when patients select the highest value on a scale rather than a value that reflects their actual feelings about a certain topic. Floor effects are present when patients select the lowest value in a similar fashion. These 2 effects indicate that an independent variable no longer influences the dependent variable being tested. Skewness and kurtosis are rough indicators of a normal distribution of values. Skewness (γ1) is an index of the symmetry of a distribution, with symmetric distributions having a skewness of 0. If skewness has a positive value, it suggests relatively many low values, having a long right tail. Negative skewness suggests relatively many high values, having a long left tail. Kurtosis (γ2) is a measure to describe tailedness of a distribution. Kurtosis of a normal distribution is 3. Negative kurtosis represents little peaked distribution, and positive kurtosis represents more peaked distribution.11,12 If skewness is 0 and kurtosis is 3, there is a normal, or Gaussian, distribution.
Finally, we manually calculated the NPS for all scales by subtracting the percentage of detractors (people who scored between 0 and 6) from the percentage of promoters (people who scored 9 or 10).13 NPS are widely used in the service industry to assess customer satisfaction, and scores range between –100 and 100.
An a priori power analysis indicated that in order to find a difference in satisfaction of 0.5 on a 0-10 scale, with an effect size of 80% and alpha set at 0.05, we needed 128 patients (64 per group). Since we wanted to compare 4 satisfaction scales, we doubled this.
Results
Patient Characteristics
All patients invited to participate in this study agreed, and 258 patients with various diagnoses were enrolled. The median age of the cohort was 54 years (IQR, 40-65 years); 114 (44%) were men, and 119 (42%) were new patients (Table 1). The number of patients assigned to scales 1, 2, 3, and 4 were 62 (24%), 70 (27%), 67 (26%), and 59 (23%), respectively.
Difference in Distribution
Looking at the data distribution (Figure 2) and skewness and kurtosis (Table 2) of the scales, we found that none of the scales was normally distributed.
Difference in Satisfaction Scores
Mean (SD) scaled satisfaction scores (range, 0-10) were 8.3 (1.2) for the 11-point ordinal scale, 8.3 (1.2) for the 5-point Likert scale, 8.9 (1.7) for the 0-100 numerical VAS, and 8.3 (1.3) for the 0-100 nonnumerical VAS (Table 3 and Table 4).
Difference in Floor and Ceiling Effect
A difference was found in ceiling effect between the different scales (P = 0.025), with the 0-100 numerical VAS showing the highest ceiling effect (34%) and the 0-100 nonnumerical VAS showing the lowest ceiling effect (12%; Table 2). There was no floor effect. A single patient used the lowest score (on the Likert scale).
Correlation Between Satisfaction and Psychological Status
Scaled satisfaction scores had a small but significant correlation with PSEQ-2 (r = 0.17; P = 0.006), but not with SHAI-5 (r = –0.12; P = 0.052) or PROMIS Depression (r = –0.12; P = 0.064; not in table), indicating that patients with more self-efficacy had higher satisfaction ratings.
Net Promoter Scores
NPS were 35 for the 11-point ordinal scale; 16 for the 5-point Likert scale; 67 for the 0-100 numerical VAS; and 20 for the 0-100 nonnumerical VAS.
Discussion
Single-question measures of satisfaction can decrease patient burden and limit overlap with measures of communication effectiveness and perceived empathy. Both long and short questionnaires addressing satisfaction and perceived empathy show substantial ceiling effect. We compared 4 different measures for overall scores, floor and ceiling effect, and skewness and kurtosis, and assessed the correlation between scaled satisfaction and psychological status. We found that scale type influenced the median helpfulness score. As one would expect, scales with less ceiling effect have lower median scores. In other words, if the goal is to collect meaningful information and identify areas for improvement, there must be a willingness to accept lower scores.
Only the nonnumerical VAS was below the threshold of 15% ceiling effect proposed by Terwee et al.14 This scale with 3 anchor points and no visible numbers showed the least ceiling effect (12%) and minimal skew (–1.0), and was closer to kurtosis consistent with a normal distribution (5.0). However, the 11-point ordinal Likert scale with 5 anchor points and visible numbers had the lowest skewness and kurtosis (–0.58 and 4.0). The low ceiling effect observed with the nonnumerical VAS (12%) might be explained by the fact that the scale does not lead patients to a specific description of the helpfulness of their visit, but rather asks patients to use their own judgement in making the rating. The ordinal scale approached the most normal data distribution, and this might be explained by the presence of numbers on the scale. Ratings based on a 0-10 scale are commonly used, and familiarity with the system might have allowed people to pick a number that represents their actual view of the visit helpfulness, rather than picking the highest possible choice (which would have led to a ceiling effect). Study results comparing Likert scales and VAS are conflicting,15 with some preferring Likert scales for their responsiveness16 and ease of use in practice,17 and others preferring VAS for their sensitivity to describe continuous, subjective phenomenon and their high validity and reliability.18 Looking at our nonnumerical VAS, adding numbers to a scale might not help avoid, and may actually increase, the presence of ceiling effect. However, with the ordinal scale with visible numbers, we saw a 21% ceiling effect coupled with low skew and kurtosis (–0.58 and 4.0), which indicate that the distribution of scores is relatively normal. This finding is in line with other study results.19
Our findings demonstrated that feedback concerning self-efficacy, health anxiety, or depression had no or only a small effect on patient satisfaction. Consistent with prior evidence, psychological factors had limited or no correlation with satisfaction.20-24 Given the effect that priming has on patient-reported outcome measures, the effect of psychological factors on satisfaction could be an area of future study.
The NPS varied substantially based on scale structure. Increasing the spread of the scores to limit the ceiling effect will likely reduce promoters and detractors and increase neutrals. NPS systems have been used in the past to measure patient satisfaction with common hand surgery techniques and with community mental health services.25,26 These studies suggest that NPS could be a helpful addition to commonly used clinical measures of satisfaction, after more research has been done to validate it. The evidence showing that NPS are strongly influenced by scale structure suggests that NPS should be used and interpreted with caution.
Several caveats regarding this study should be kept in mind. This study specifically addressed ratings of visit helpfulness. Differently phrased questions might lead to different results. More work is needed to determine the essence of satisfaction with a medical visit.1 In addition, the majority of our patient population was white, employed, and privately insured, limiting generalizability to other populations with different demographics. Finally, all patients were seen by an orthopedic surgeon, and our results might not apply to other populations or clinical settings. However, given the scope of this study, we suspect that the findings can be generalized to specialty care in general and likely all medical contexts.
Conclusion
It is clear from this work that scale design can affect ceiling effect. We plan to test alternative phrasings and structures of single-question measures of satisfaction with a medical visit so that we can better study what factors contribute to satisfaction. It is notable that this approach runs counter to efforts to improve satisfaction scores, because reducing the ceiling effect reduces the mean score and may contribute to worse NPS. Further study is needed to find the optimal measure to assess satisfaction ratings.
Corresponding author: David Ring, MD, PhD, 1701 Trinity Street, Austin, TX, 78712; [email protected].
Financial disclosures: Dr. Ring has or may receive payment or benefits from Skeletal Dynamics; Wright Medical Group; the journal Clinical Orthopaedics and Related Research; and universities, hospitals, and lawyers not related to the submitted work.
1. Waters S, Edmondston SJ, Yates PJ, Gucciardi DF. Identification of factors influencing patient satisfaction with orthopaedic outpatient clinic consultation: A qualitative study. Man Ther. 2016;25:48-55.
2. Kortlever JTP, Ottenhoff JSE, Vagner GA, et al. Visit duration does not correlate with perceived physician empathy. J Bone Joint Surg Am. 2019;101:296-301.
3. Edwards P, Roberts I, Clarke M, et al. Methods to influence response to postal questionnaires. Cochrane Database Syst Rev. 2001(3):CD003227.
4. Salisbury C, Burgess A, Lattimer V, et al. Developing a standard short questionnaire for the assessment of patient satisfaction with out-of-hours primary care. Fam Pract. 2005;22:560-569.
5. Ross CK, Steward CA, Sinacore JM. A comparative study of seven measures of patient satisfaction. Med Care. 1995;33:392-406.
6. Harris PA, Taylor R, Thielke R, et al. Research electronic data capture (REDCap)--a metadata-driven methodology and workflow process for providing translational research informatics support. J Biomed Inform. 2009;42:377-381.
7. Medicine USNLo. ClinicalTrials.gov. Accessed March 18, 2019.
8. Nicholas MK, McGuire BE, Asghari A. A 2-item short form of the Pain Self-efficacy Questionnaire: development and psychometric evaluation of PSEQ-2. J Pain. 2015;16:153-163.
9. Salkovskis PM, Rimes KA, Warwick H, Clark D. The Health Anxiety Inventory: development and validation of scales for the measurement of health anxiety and hypochondriasis. Psychol Med. 2002;32:843-853.
10. Schalet BD, Pilkonis PA, Yu L, et al. Clinical validity of PROMIS depression, anxiety, and anger across diverse clinical samples. J Clin Epidemiol. 2016;73:119-127.
11. Ho AD, Yu CC. Descriptive statistics for modern test score distributions: skewness, kurtosis, discreteness, and ceiling effects. Educ Psychol Meas. 2015;75:365-388.
12. Kim HY. Statistical notes for clinical researchers: assessing normal distribution (2) using skewness and kurtosis. Restor Dent Endod. 2013;38:52-54.
13. NICE Satmetrix. What is net promoter? https://www.netpromoter.com/know/. Accessed March 18, 2019.
14. Terwee CB, Bot SD, de Boer MR, et al. Quality criteria were proposed for measurement properties of health status questionnaires. J Clin Epidemiol. 2007;60:34-42.
15. Hasson D, Arnetz BB. Validation and findings comparing VAS vs. Likert scales for psychosocial measurements. Int Electronic J Health Educ. 2005;8:178-192.
16. Vickers AJ. Comparison of an ordinal and a continuous outcome measure of muscle soreness. Int J Technol Assess Health Care. 1999;15:709-716.
17. Jaeschke R, Singer J, Guyatt GH. A comparison of seven-point and visual analogue scales: data from a randomized trial. Control Clin Trials. 1990;11:43-51.
18. Voutilainen A, Pitkaaho T, Kvist T, Vehvilainen-Julkunen K. How to ask about patient satisfaction? The visual analogue scale is less vulnerable to confounding factors and ceiling effect than a symmetric Likert scale. J Adv Nurs. 2016;72:946-957.
19. Brunelli C, Zecca E, Martini C, et al. Comparison of numerical and verbal rating scales to measure pain exacerbations in patients with chronic cancer pain. Health Qual Life Outcomes. 2010;8:42.
20. Hageman MG, Briet JP, Bossen JK, et al. Do previsit expectations correlate with satisfaction of new patients presenting for evaluation with an orthopaedic surgical practice? Clin Orthop Relat Res. 2015;473:716-721.
21. Keulen MHF, Teunis T, Vagner GA, et al. The effect of the content of patient-reported outcome measures on patient perceived empathy and satisfaction: a randomized controlled trial. J Hand Surg Am. 2018;43:1141.e1-e9.
22. Mellema JJ, O’Connor CM, Overbeek CL, et al. The effect of feedback regarding coping strategies and illness behavior on hand surgery patient satisfaction and communication: a randomized controlled trial. Hand. 2015;10:503-511.
23. Tyser AR, Gaffney CJ, Zhang C, Presson AP. The association of patient satisfaction with pain, anxiety, and self-reported physical function. J Bone Joint Surg Am. 2018;100:1811-1818.
24. Vranceanu AM, Ring D. Factors associated with patient satisfaction. J Hand Surg Am. 2011;36:1504-1508.
25. Stirling P, Jenkins PJ, Clement ND, et al. The Net Promoter Scores with Friends and Family Test after four hand surgery procedures. J Hand Surg Eur. 2019;44:290-295.
26. Wilberforce M, Poll S, Langham H, et al. Measuring the patient experience in community mental health services for older people: A study of the Net Promoter Score using the Friends and Family Test in England. Int J Geriatr Psychiatry. 2019;34:31-37.
Families as Care Partners: Implementing the Better Together Initiative Across a Large Health System
From the Institute for Patient- and Family-Centered Care, Bethesda, MD (Ms. Dokken and Ms. Johnson), and Northwell Health, New Hyde Park, NY (Dr. Barden, Ms. Tuomey, and Ms. Giammarinaro).
Abstract
Objective: To describe the growth of Better Together: Partnering with Families, a campaign launched in 2014 to eliminate restrictive hospital visiting policies and to put in place policies that recognize families as partners in care, and to discuss the processes involved in implementing the initiative in a large, integrated health system.
Methods: Descriptive report.
Results: In June 2014, the Institute for Patient- and Family-Centered Care (IPFCC) launched the Better Together campaign to emphasize the importance of family presence and participation to the quality, experience, safety, and outcomes of care. Since then, this initiative has expanded in both the United States and Canada. With support from 2 funders in the United States, special attention was focused on acute care hospitals across New York State. Nearly 50 hospitals participated in 2 separate but related projects. Fifteen of the hospitals are part of Northwell Health, New York State’s largest health system. Over a 10-month period, these hospitals made significant progress in changing policy, practice, and communication to support family presence.
Conclusion: The Better Together initiative was implemented across a health system with strong support from leadership and the involvement of patient and family advisors. An intervention offering structured training, coaching, and resources, like IPFCC’s Better Together initiative, can facilitate the change process.
Keywords: family presence; visiting policies; patient-centered care; family-centered care; patient experience.
The presence of families at the bedside of patients is often restricted by hospital visiting hours. Hospitals that maintain these restrictive policies cite concerns about negative impacts on security, infection control, privacy, and staff workload. But there are no data to support these concerns, and the experience of hospitals that have successfully changed policy and practice to welcome families demonstrates the potential positive impacts of less restrictive policies on patient care and outcomes.1 For example, hospitalization can lead to reduced cognitive function in elderly patients. Family members would recognize the changes and could provide valuable information to hospital staff, potentially improving outcomes.2
In June 2014, the Institute for Patient- and Family-Centered Care (IPFCC) launched the campaign Better Together: Partnering with Families.3 The campaign is is grounded in patient- and family- centered care, an approach to care that supports partnerships among health care providers, patients, and families, and, among other core principles, advocates that patients define their “families” and how they will participate in care and decision-making.
Emphasizing the importance of family presence and participation to quality and safety, the Better Together campaign seeks to eliminate restrictive visiting policies and calls upon hospitals to include families as members of the care team and to welcome them 24 hours a day, 7 days a week, according to patient preference. As part of the campaign, IPFCC developed an extensive toolkit of resources that is available to hospitals and other organizations at no cost. The resources include sample policies; profiles of hospitals that have implemented family presence policies; educational materials for staff, patients, and families; and a template for hospital websites. This article, a follow-up to an article published in the January 2015 issue of JCOM,1 discusses the growth of the Better Together initiative as well as the processes involved in implementing the initiative across a large health system.
Growth of the Initiative
Since its launch in 2014, the Better Together initiative has continued to expand in the United States and Canada. In Canada, under the leadership of the Canadian Foundation for Healthcare Improvement (CFHI), more than 50 organizations have made a commitment to the Better Together program and family presence.4 Utilizing and adapting IPFCC’s Toolkit, CFHI developed a change package of free resources for Canadian organizations.5 Some of the materials, including the Pocket Guide for Families (Manuel des Familles), were translated into French.6
With support from 2 funders in the United States, the United Hospital Fund and the New York State Health (NYSHealth) Foundation, through a subcontract with the New York Public Interest Research Group (NYPIRG), IPFCC has been able to focus on hospitals in New York City, including public hospitals, and, more broadly, acute care hospitals across New York State. Nearly 50 hospitals participated in these 2 separate but related projects.
Education and Support for New York City Hospitals
Supported by the United Hospital Fund, an 18-month project that focused specifically on New York City hospitals was completed in June 2017. The project began with a 1-day intensive training event with representatives of 21 hospitals. Eighteen of those hospitals were eligible to participate in follow-up consultation provided by IPFCC, and 14 participated in some kind of follow-up. NYC Health + Hospitals (H+H), the system of public hospitals in NYC, participated most fully in these activities.
The outcomes of the Better Together initiative in New York City are summarized in the report Sick, Scared, & Separated From Loved Ones,2 which is based on a pre/post review of hospital visitation/family presence policies and website communications. According to the report, hospitals that participated in the IPFCC training and consultation program performed better, as a group, with respect to improved policy and website scores on post review than those that did not. Of the 10 hospitals whose scores improved during the review period, 8 had participated in the IPFCC training and 1 hospital was part of a hospital network that did so. (Six of these hospitals are part of the H+H public hospital system.) Those 9 hospitals saw an average increase in scores of 4.9 points (out of a possible 11).
A Learning Community for Hospitals in New York State
With support from the NYSHealth Foundation, IPFCC again collaborated with NYPIRG and New Yorkers for Patient & Family Empowerment on a 2-year initiative, completed in November 2019, that involved 26 hospitals: 15 from Northwell Health, New York State’s largest health system, and 11 hospitals from health systems throughout the state (Greater Hudson Valley Health System, now Garnet Health; Mohawk Valley Health System; Rochester Regional Health; and University of Vermont Health Network). An update of the report Sick, Scared, & Separated From Loved Onescompared pre/post reviews of policies and website communications regarding hospital visitation/family presence.7 Its findings confirm that hospitals that participated in the Better Together Learning Community improved both their policy and website scores to a greater degree than hospitals that did not participate and that a planned intervention can help facilitate change.
During the survey period, 28 out of 40 hospitals’ website navigability scores improved. Of those, hospitals that did not participate in the Better Together Learning Community saw an average increase in scores of 1.2 points, out of a possible 11, while the participating hospitals saw an average increase of 2.7 points, with the top 5 largest increases in scores belonging to hospitals that participated in the Better Together Learning Community.7
The Northwell Health Experience
Northwell Health is a large integrated health care organization comprising more than 69,000 employees, 23 hospitals, and more than 750 medical practices, located geographically across New York State. Embracing patient- and family-centered care, Northwell is dedicated to improving the quality, experience, and safety of care for patients and their families. Welcoming and including patients, families, and care partners as members of the health care team has always been a core element of Northwell’s organizational goal of providing world-class patient care and experience.
Four years ago, the organization reorganized and formalized a system-wide Patient & Family Partnership Council (PFPC).8 Representatives on the PFPC include a Northwell patient experience leader and patient/family co-chair from local councils that have been established in nearly all 23 hospitals as well as service lines. Modeling partnership, the PFPC is grounded in listening to the “voice” of patients and families and promoting collaboration, with the goal of driving change across varied aspects and experiences of health care delivery.
Through the Office of Patient and Customer Experience (OPCE), a partnership with IPFCC and the Better Together Learning Community for Hospitals in New York State was initiated as a fundamental next step in Northwell’s journey to enhance system-wide family presence and participation. Results from Better Together’s Organizational Self-Assessment Tool and process identified opportunities to influence 3 distinct areas: policy/staff education, position descriptions/performance management, and website/signage. Over a 10-month period (September 2018 through June 2019), 15 Northwell hospitals implemened significant patient- and family-centered improvements through multifaceted shared work teams (SWT) that partnered around the common goal of supporting the patient and family experience (Figure). Northwell’s SWT structure allowed teams to meet individually on specific tasks, led by a dedicated staff member of the OPCE to ensure progress, support, and accountability. Six monthly coaching calls or report-out meetings were attended by participating teams, where feedback and recommendations shared by IPFCC were discussed in order to maintain momentum and results.

Policy/Staff Education
The policy/staff education SWT focused on appraising and updating existing policies to ensure alignment with key patient- and family-centered concepts and Better Together principles (Table 1). By establishing representation on the System Policy and Procedure Committee, OPCE enabled patients and families to have a voice at the decision-making table. OPCE leaders presented the ideology and scope of the transformation to this committee. After reviewing all system-wide policies, 4 were identified as key opportunities for revision. One overarching policy titled “Visitation Guidelines” was reviewed and updated to reflect Northwell’s mission of patient- and family-centered care, retiring the reference to “families” as “visitors” in definitions, incorporating language of inclusion and partnership, and citing other related policies. The policy was vetted through a multilayer process of review and stakeholder feedback and was ultimately approved at a system

Three additional related policies were also updated to reflect core principles of inclusion and partnership. These included system policies focused on discharge planning; identification of health care proxy, agent, support person and caregiver; and standards of behavior not conducive in a health care setting. As a result of this work, OPCE was invited to remain an active member of the System Policy and Procedure Committee, adding meaningful new perspectives to the clinical and administrative policy management process. Once policies were updated and approved, the SWT focused on educating leaders and teams. Using a diversified strategy, education was provided through various modes, including weekly system-wide internal communication channels, patient experience huddle messages, yearly mandatory topics training, and the incorporation of essential concepts in existing educational courses (classroom and e-learning modalities).
Position Descriptions/Performance Management
The position descriptions/performance management SWT focused its efforts on incorporating patient- and family-centered concepts and language into position descriptions and the performance appraisal process (Table 2). Due to the complex nature of this work, the process required collaboration from key subject matter experts in human resources, talent management, corporate compensation, and labor management. In 2019, Northwell began an initiative focused on streamlining and standardizing job titles, roles, and developmental pathways across the system. The overarching goal was to create system-wide consistency and standardization. The SWT was successful in advising the leaders overseeing this job architecture initiative on the importance of including language of patient- and family-centered care, like partnership and collaboration, and of highlighting the critical role of family members as part of the care team in subsequent documents.

Northwell has 6 behavioral expectations, standards to which all team members are held accountable: Patient/Customer Focus, Teamwork, Execution, Organizational Awareness, Enable Change, and Develop Self. As a result of the SWT’s work, Patient/Customer Focus was revised to include “families” as essential care partners, demonstrating Northwell’s ongoing commitment to honoring the role of families as members of the care team. It also ensures that all employees are aligned around this priority, as these expectations are utilized to support areas such as recognition and performance. Collaborating with talent management and organizational development, the SWT reviewed yearly performance management and new-hire evaluations. In doing so, they identified an opportunity to refresh the anchored qualitative rating scales to include behavioral demonstrations of patient- and family-centered care, collaboration, respect, and partnership with family members.
Website/Signage
Websites make an important first impression on patients and families looking for information to best prepare for a hospital experience. Therefore, the website/signage SWT worked to redesign hospital websites, enhance digital signage, and perform a baseline assessment of physical signage across facilities. Initial feedback on Northwell’s websites identified opportunities to include more patient- and family-centered, care-partner-infused language; improve navigation; and streamline click levels for easier access. Content for the websites was carefully crafted in collaboration with Northwell’s internal web team, utilizing IPFCC’s best practice standards as a framework and guide.
Next, a multidisciplinary website shared-governance team was established by the OPCE to ensure that key stakeholders were represented and had the opportunity to review and make recommendations for appropriate language and messaging about family presence and participation. This 13-person team was comprised of patient/family partners, patient-experience culture leaders, quality, compliance, human resources, policy, a chief nursing officer, a medical director, and representation from the Institute for Nursing. After careful review and consideration from Northwell’s family partners and teams, all participating hospital websites were enhanced as of June 2019 to include prominent 1-click access from homepages to information for “patients, families and visitors,” as well as “your care partners” information on the important role of families and care partners.
Along with refreshing websites, another step in Northwell’s work to strengthen messaging about family presence and participation was to partner and collaborate with the system’s digital web team as well as local facility councils to understand the capacity to adjust digital signage across facilities. Opportunities were found to make simple yet effective enhancements to the language and imagery of digital signage upon entry, creating a warmer and more welcoming first impression for patients and families. With patient and family partner feedback, the team designed digital signage with inclusive messaging and images that would circulate appropriately based on the facility. Signage specifically welcomes families and refers to them as members of patients’ care teams.
Northwell’s website/signage SWT also directed a 2-phase physical signage assessment to determine ongoing opportunities to alter signs in areas that particularly impact patients and families, such as emergency departments, main lobbies, cafeterias, surgical waiting areas, and intensive care units. Each hospital’s local PFPC did a “walk-about”9 to make enhancements to physical signage, such as removing paper and overcrowded signs, adjusting negative language, ensuring alignment with brand guidelines, and including language that welcomed families. As a result of the team’s efforts around signage, collaboration began with the health system’s signage committee to help standardize signage terminology to reflect family inclusiveness, and to implement the recommendation for a standardized signage shared-governance team to ensure accountability and a patient- and family-centered structure.
Sustainment
Since implementing Better Together, Northwell has been able to infuse a more patient- and family-centered emphasis into its overall patient experience message of “Every role, every person, every moment matters.” As a strategic tool aimed at encouraging leaders, clinicians, and staff to pause and reflect about the “heart” of their work, patient and family stories are now included at the beginning of meetings, forums, and team huddles. Elements of the initiative have been integrated in current Patient and Family Partnership sustainment plans at participating hospitals. Some highlights include continued integration of patient/family partners on committees and councils that impact areas such as way finding, signage, recruitment, new-hire orientation, and community outreach; focus on enhancing partner retention and development programs; and inclusion of patient- and family-centered care and Better Together principles in ongoing leadership meetings.
Factors Contributing to Success
Health care is a complex, regulated, and often bureaucratic world that can be very difficult for patients and families to navigate. The system’s partnership with the Better Together Learning Community for Hospitals in New York State enhanced its efforts to improve family presence and participation and created powerful synergy. The success of this partnership was based on a number of important factors:
A solid foundation of support, structure, and accountability. The OPCE initiated the IPFCC Better Together partnership and established a synergistic collaboration inclusive of leadership, frontline teams, multiple departments, and patient and family partners. As a major strategic component of Northwell’s mission to deliver high-quality, patient- and family-centered care, OPCE was instrumental in connecting key areas and stakeholders and mobilizing the recommendations coming from patients and families.
A visible commitment of leadership at all levels. Partnering with leadership across Northwell’s system required a delineated vision, clear purpose and ownership, and comprehensive implementation and sustainment strategies. The existing format of Northwell’s PFPC provided the structure and framework needed for engaged patient and family input; the OPCE motivated and organized key areas of involvement and led communication efforts across the organization. The IPFCC coaching calls provided the underlying guidance and accountability needed to sustain momentum. As leadership and frontline teams became aware of the vision, they understood the larger connection to the system’s purpose, which ultimately created a clear path for positive change.
Meaningful involvement and input of patient and family partners. Throughout this project, Northwell’s patient/family partners were involved through the PFPC and local councils. For example, patient/family partners attended every IPFCC coaching call; members had a central voice in every decision made within each SWT; and local PFPCs actively participated in physical signage “walk-abouts” across facilities, making key recommendations for improvement. This multifaceted, supportive collaboration created a rejuvenated and purposeful focus for all council members involved. Some of their reactions include, “…I am so happy to be able to help other families in crisis, so that they don’t have to be alone, like I was,” and “I feel how important the patient and family’s voice is … it’s truly a partnership between patients, families, and staff.”
Regular access to IPFCC as a best practice coach and expert resource. Throughout the 10-month process, IPFCC’s Better Together Learning Community for Hospitals in New York State provided ongoing learning interventions for members of the SWT; multiple and varied resources from the Better Together toolkit for adaptation; and opportunities to share and reinforce new, learned expertise with colleagues within the Northwell Health system and beyond through IPFCC’s free online learning community, PFCC.Connect.
Conclusion
Family presence and participation are important to the quality, experience, safety, and outcomes of care. IPFCC’s campaign, Better Together: Partnering with Families, encourages hospitals to change restrictive visiting policies and, instead, to welcome families and caregivers 24 hours a day.
Two projects within Better Together involving almost 50 acute care hospitals in New York State confirm that change in policy, practice, and communication is particularly effective when implemented with strong support from leadership. An intervention like the Better Together Learning Community, offering structured training, coaching, and resources, can facilitate the change process.
Corresponding author: IPFCC, Deborah L. Dokken, 6917 Arlington Rd., Ste. 309, Bethesda, MD 20814; [email protected].
Funding disclosures: None.
1. Dokken DL, Kaufman J, Johnson BJ et al. Changing hospital visiting policies: from families as “visitors” to families as partners. J Clin Outcomes Manag. 2015; 22:29-36.
2. New York Public Interest Research Group and New Yorkers for Patient & Family Empowerment. Sick, scared and separated from loved ones. third edition: A pathway to improvement in New York City. New York: NYPIRG: 2018. www.nypirg.org/pubs/201801/NYPIRG_SICK_SCARED_FINAL.pdf. Accessed December 12, 2019.
3. Institute for Patient- and Family-Centered Care. Better Together: Partnering with Families. www.ipfcc.org/bestpractices/better-together.html. Accessed December 12, 2019.
4. Canadian Foundation for Healthcare Improvement. Better Together. www.cfhi-fcass.ca/WhatWeDo/better-together. Accessed December 12, 2019.
5. Canadian Foundation for Healthcare Improvement. Better Together: A change package to support the adoption of family presence and participation in acute care hospitals and accelerate healthcare improvement. www.cfhi-fcass.ca/sf-docs/default-source/patient-engagement/better-together-change-package.pdf?sfvrsn=9656d044_4. Accessed December 12, 2019.
6. Canadian Foundation for Healthcare Improvement. L’Objectif santé: main dans la main avec les familles. www.cfhi-fcass.ca/sf-docs/default-source/patient-engagement/families-pocket-screen_fr.pdf. Accessed December 12, 2019.
7. New York Public Interest Research Group and New Yorkers for Patient & Family Empowerment. Sick, scared and separated from loved ones. fourth edition: A pathway to improvement in New York. New York: NYPIRG: 2019. www.nypirg.org/pubs/201911/Sick_Scared_Separated_2019_web_FINAL.pdf. Accessed December 12, 2019.
8. Northwell Health. Patient and Family Partnership Councils. www.northwell.edu/about/commitment-to-excellence/patient-and-customer-experience/care-delivery-hospitality. Accessed December 12, 2019.
9 . Institute for Patient- and Family-Centered Care. How to conduct a “walk-about” from the patient and family perspective. www.ipfcc.org/resources/How_To_Conduct_A_Walk-About.pdf. Accessed December 12, 2019.
From the Institute for Patient- and Family-Centered Care, Bethesda, MD (Ms. Dokken and Ms. Johnson), and Northwell Health, New Hyde Park, NY (Dr. Barden, Ms. Tuomey, and Ms. Giammarinaro).
Abstract
Objective: To describe the growth of Better Together: Partnering with Families, a campaign launched in 2014 to eliminate restrictive hospital visiting policies and to put in place policies that recognize families as partners in care, and to discuss the processes involved in implementing the initiative in a large, integrated health system.
Methods: Descriptive report.
Results: In June 2014, the Institute for Patient- and Family-Centered Care (IPFCC) launched the Better Together campaign to emphasize the importance of family presence and participation to the quality, experience, safety, and outcomes of care. Since then, this initiative has expanded in both the United States and Canada. With support from 2 funders in the United States, special attention was focused on acute care hospitals across New York State. Nearly 50 hospitals participated in 2 separate but related projects. Fifteen of the hospitals are part of Northwell Health, New York State’s largest health system. Over a 10-month period, these hospitals made significant progress in changing policy, practice, and communication to support family presence.
Conclusion: The Better Together initiative was implemented across a health system with strong support from leadership and the involvement of patient and family advisors. An intervention offering structured training, coaching, and resources, like IPFCC’s Better Together initiative, can facilitate the change process.
Keywords: family presence; visiting policies; patient-centered care; family-centered care; patient experience.
The presence of families at the bedside of patients is often restricted by hospital visiting hours. Hospitals that maintain these restrictive policies cite concerns about negative impacts on security, infection control, privacy, and staff workload. But there are no data to support these concerns, and the experience of hospitals that have successfully changed policy and practice to welcome families demonstrates the potential positive impacts of less restrictive policies on patient care and outcomes.1 For example, hospitalization can lead to reduced cognitive function in elderly patients. Family members would recognize the changes and could provide valuable information to hospital staff, potentially improving outcomes.2
In June 2014, the Institute for Patient- and Family-Centered Care (IPFCC) launched the campaign Better Together: Partnering with Families.3 The campaign is is grounded in patient- and family- centered care, an approach to care that supports partnerships among health care providers, patients, and families, and, among other core principles, advocates that patients define their “families” and how they will participate in care and decision-making.
Emphasizing the importance of family presence and participation to quality and safety, the Better Together campaign seeks to eliminate restrictive visiting policies and calls upon hospitals to include families as members of the care team and to welcome them 24 hours a day, 7 days a week, according to patient preference. As part of the campaign, IPFCC developed an extensive toolkit of resources that is available to hospitals and other organizations at no cost. The resources include sample policies; profiles of hospitals that have implemented family presence policies; educational materials for staff, patients, and families; and a template for hospital websites. This article, a follow-up to an article published in the January 2015 issue of JCOM,1 discusses the growth of the Better Together initiative as well as the processes involved in implementing the initiative across a large health system.
Growth of the Initiative
Since its launch in 2014, the Better Together initiative has continued to expand in the United States and Canada. In Canada, under the leadership of the Canadian Foundation for Healthcare Improvement (CFHI), more than 50 organizations have made a commitment to the Better Together program and family presence.4 Utilizing and adapting IPFCC’s Toolkit, CFHI developed a change package of free resources for Canadian organizations.5 Some of the materials, including the Pocket Guide for Families (Manuel des Familles), were translated into French.6
With support from 2 funders in the United States, the United Hospital Fund and the New York State Health (NYSHealth) Foundation, through a subcontract with the New York Public Interest Research Group (NYPIRG), IPFCC has been able to focus on hospitals in New York City, including public hospitals, and, more broadly, acute care hospitals across New York State. Nearly 50 hospitals participated in these 2 separate but related projects.
Education and Support for New York City Hospitals
Supported by the United Hospital Fund, an 18-month project that focused specifically on New York City hospitals was completed in June 2017. The project began with a 1-day intensive training event with representatives of 21 hospitals. Eighteen of those hospitals were eligible to participate in follow-up consultation provided by IPFCC, and 14 participated in some kind of follow-up. NYC Health + Hospitals (H+H), the system of public hospitals in NYC, participated most fully in these activities.
The outcomes of the Better Together initiative in New York City are summarized in the report Sick, Scared, & Separated From Loved Ones,2 which is based on a pre/post review of hospital visitation/family presence policies and website communications. According to the report, hospitals that participated in the IPFCC training and consultation program performed better, as a group, with respect to improved policy and website scores on post review than those that did not. Of the 10 hospitals whose scores improved during the review period, 8 had participated in the IPFCC training and 1 hospital was part of a hospital network that did so. (Six of these hospitals are part of the H+H public hospital system.) Those 9 hospitals saw an average increase in scores of 4.9 points (out of a possible 11).
A Learning Community for Hospitals in New York State
With support from the NYSHealth Foundation, IPFCC again collaborated with NYPIRG and New Yorkers for Patient & Family Empowerment on a 2-year initiative, completed in November 2019, that involved 26 hospitals: 15 from Northwell Health, New York State’s largest health system, and 11 hospitals from health systems throughout the state (Greater Hudson Valley Health System, now Garnet Health; Mohawk Valley Health System; Rochester Regional Health; and University of Vermont Health Network). An update of the report Sick, Scared, & Separated From Loved Onescompared pre/post reviews of policies and website communications regarding hospital visitation/family presence.7 Its findings confirm that hospitals that participated in the Better Together Learning Community improved both their policy and website scores to a greater degree than hospitals that did not participate and that a planned intervention can help facilitate change.
During the survey period, 28 out of 40 hospitals’ website navigability scores improved. Of those, hospitals that did not participate in the Better Together Learning Community saw an average increase in scores of 1.2 points, out of a possible 11, while the participating hospitals saw an average increase of 2.7 points, with the top 5 largest increases in scores belonging to hospitals that participated in the Better Together Learning Community.7
The Northwell Health Experience
Northwell Health is a large integrated health care organization comprising more than 69,000 employees, 23 hospitals, and more than 750 medical practices, located geographically across New York State. Embracing patient- and family-centered care, Northwell is dedicated to improving the quality, experience, and safety of care for patients and their families. Welcoming and including patients, families, and care partners as members of the health care team has always been a core element of Northwell’s organizational goal of providing world-class patient care and experience.
Four years ago, the organization reorganized and formalized a system-wide Patient & Family Partnership Council (PFPC).8 Representatives on the PFPC include a Northwell patient experience leader and patient/family co-chair from local councils that have been established in nearly all 23 hospitals as well as service lines. Modeling partnership, the PFPC is grounded in listening to the “voice” of patients and families and promoting collaboration, with the goal of driving change across varied aspects and experiences of health care delivery.
Through the Office of Patient and Customer Experience (OPCE), a partnership with IPFCC and the Better Together Learning Community for Hospitals in New York State was initiated as a fundamental next step in Northwell’s journey to enhance system-wide family presence and participation. Results from Better Together’s Organizational Self-Assessment Tool and process identified opportunities to influence 3 distinct areas: policy/staff education, position descriptions/performance management, and website/signage. Over a 10-month period (September 2018 through June 2019), 15 Northwell hospitals implemened significant patient- and family-centered improvements through multifaceted shared work teams (SWT) that partnered around the common goal of supporting the patient and family experience (Figure). Northwell’s SWT structure allowed teams to meet individually on specific tasks, led by a dedicated staff member of the OPCE to ensure progress, support, and accountability. Six monthly coaching calls or report-out meetings were attended by participating teams, where feedback and recommendations shared by IPFCC were discussed in order to maintain momentum and results.
Policy/Staff Education
The policy/staff education SWT focused on appraising and updating existing policies to ensure alignment with key patient- and family-centered concepts and Better Together principles (Table 1). By establishing representation on the System Policy and Procedure Committee, OPCE enabled patients and families to have a voice at the decision-making table. OPCE leaders presented the ideology and scope of the transformation to this committee. After reviewing all system-wide policies, 4 were identified as key opportunities for revision. One overarching policy titled “Visitation Guidelines” was reviewed and updated to reflect Northwell’s mission of patient- and family-centered care, retiring the reference to “families” as “visitors” in definitions, incorporating language of inclusion and partnership, and citing other related policies. The policy was vetted through a multilayer process of review and stakeholder feedback and was ultimately approved at a system
Three additional related policies were also updated to reflect core principles of inclusion and partnership. These included system policies focused on discharge planning; identification of health care proxy, agent, support person and caregiver; and standards of behavior not conducive in a health care setting. As a result of this work, OPCE was invited to remain an active member of the System Policy and Procedure Committee, adding meaningful new perspectives to the clinical and administrative policy management process. Once policies were updated and approved, the SWT focused on educating leaders and teams. Using a diversified strategy, education was provided through various modes, including weekly system-wide internal communication channels, patient experience huddle messages, yearly mandatory topics training, and the incorporation of essential concepts in existing educational courses (classroom and e-learning modalities).
Position Descriptions/Performance Management
The position descriptions/performance management SWT focused its efforts on incorporating patient- and family-centered concepts and language into position descriptions and the performance appraisal process (Table 2). Due to the complex nature of this work, the process required collaboration from key subject matter experts in human resources, talent management, corporate compensation, and labor management. In 2019, Northwell began an initiative focused on streamlining and standardizing job titles, roles, and developmental pathways across the system. The overarching goal was to create system-wide consistency and standardization. The SWT was successful in advising the leaders overseeing this job architecture initiative on the importance of including language of patient- and family-centered care, like partnership and collaboration, and of highlighting the critical role of family members as part of the care team in subsequent documents.
Northwell has 6 behavioral expectations, standards to which all team members are held accountable: Patient/Customer Focus, Teamwork, Execution, Organizational Awareness, Enable Change, and Develop Self. As a result of the SWT’s work, Patient/Customer Focus was revised to include “families” as essential care partners, demonstrating Northwell’s ongoing commitment to honoring the role of families as members of the care team. It also ensures that all employees are aligned around this priority, as these expectations are utilized to support areas such as recognition and performance. Collaborating with talent management and organizational development, the SWT reviewed yearly performance management and new-hire evaluations. In doing so, they identified an opportunity to refresh the anchored qualitative rating scales to include behavioral demonstrations of patient- and family-centered care, collaboration, respect, and partnership with family members.
Website/Signage
Websites make an important first impression on patients and families looking for information to best prepare for a hospital experience. Therefore, the website/signage SWT worked to redesign hospital websites, enhance digital signage, and perform a baseline assessment of physical signage across facilities. Initial feedback on Northwell’s websites identified opportunities to include more patient- and family-centered, care-partner-infused language; improve navigation; and streamline click levels for easier access. Content for the websites was carefully crafted in collaboration with Northwell’s internal web team, utilizing IPFCC’s best practice standards as a framework and guide.
Next, a multidisciplinary website shared-governance team was established by the OPCE to ensure that key stakeholders were represented and had the opportunity to review and make recommendations for appropriate language and messaging about family presence and participation. This 13-person team was comprised of patient/family partners, patient-experience culture leaders, quality, compliance, human resources, policy, a chief nursing officer, a medical director, and representation from the Institute for Nursing. After careful review and consideration from Northwell’s family partners and teams, all participating hospital websites were enhanced as of June 2019 to include prominent 1-click access from homepages to information for “patients, families and visitors,” as well as “your care partners” information on the important role of families and care partners.
Along with refreshing websites, another step in Northwell’s work to strengthen messaging about family presence and participation was to partner and collaborate with the system’s digital web team as well as local facility councils to understand the capacity to adjust digital signage across facilities. Opportunities were found to make simple yet effective enhancements to the language and imagery of digital signage upon entry, creating a warmer and more welcoming first impression for patients and families. With patient and family partner feedback, the team designed digital signage with inclusive messaging and images that would circulate appropriately based on the facility. Signage specifically welcomes families and refers to them as members of patients’ care teams.
Northwell’s website/signage SWT also directed a 2-phase physical signage assessment to determine ongoing opportunities to alter signs in areas that particularly impact patients and families, such as emergency departments, main lobbies, cafeterias, surgical waiting areas, and intensive care units. Each hospital’s local PFPC did a “walk-about”9 to make enhancements to physical signage, such as removing paper and overcrowded signs, adjusting negative language, ensuring alignment with brand guidelines, and including language that welcomed families. As a result of the team’s efforts around signage, collaboration began with the health system’s signage committee to help standardize signage terminology to reflect family inclusiveness, and to implement the recommendation for a standardized signage shared-governance team to ensure accountability and a patient- and family-centered structure.
Sustainment
Since implementing Better Together, Northwell has been able to infuse a more patient- and family-centered emphasis into its overall patient experience message of “Every role, every person, every moment matters.” As a strategic tool aimed at encouraging leaders, clinicians, and staff to pause and reflect about the “heart” of their work, patient and family stories are now included at the beginning of meetings, forums, and team huddles. Elements of the initiative have been integrated in current Patient and Family Partnership sustainment plans at participating hospitals. Some highlights include continued integration of patient/family partners on committees and councils that impact areas such as way finding, signage, recruitment, new-hire orientation, and community outreach; focus on enhancing partner retention and development programs; and inclusion of patient- and family-centered care and Better Together principles in ongoing leadership meetings.
Factors Contributing to Success
Health care is a complex, regulated, and often bureaucratic world that can be very difficult for patients and families to navigate. The system’s partnership with the Better Together Learning Community for Hospitals in New York State enhanced its efforts to improve family presence and participation and created powerful synergy. The success of this partnership was based on a number of important factors:
A solid foundation of support, structure, and accountability. The OPCE initiated the IPFCC Better Together partnership and established a synergistic collaboration inclusive of leadership, frontline teams, multiple departments, and patient and family partners. As a major strategic component of Northwell’s mission to deliver high-quality, patient- and family-centered care, OPCE was instrumental in connecting key areas and stakeholders and mobilizing the recommendations coming from patients and families.
A visible commitment of leadership at all levels. Partnering with leadership across Northwell’s system required a delineated vision, clear purpose and ownership, and comprehensive implementation and sustainment strategies. The existing format of Northwell’s PFPC provided the structure and framework needed for engaged patient and family input; the OPCE motivated and organized key areas of involvement and led communication efforts across the organization. The IPFCC coaching calls provided the underlying guidance and accountability needed to sustain momentum. As leadership and frontline teams became aware of the vision, they understood the larger connection to the system’s purpose, which ultimately created a clear path for positive change.
Meaningful involvement and input of patient and family partners. Throughout this project, Northwell’s patient/family partners were involved through the PFPC and local councils. For example, patient/family partners attended every IPFCC coaching call; members had a central voice in every decision made within each SWT; and local PFPCs actively participated in physical signage “walk-abouts” across facilities, making key recommendations for improvement. This multifaceted, supportive collaboration created a rejuvenated and purposeful focus for all council members involved. Some of their reactions include, “…I am so happy to be able to help other families in crisis, so that they don’t have to be alone, like I was,” and “I feel how important the patient and family’s voice is … it’s truly a partnership between patients, families, and staff.”
Regular access to IPFCC as a best practice coach and expert resource. Throughout the 10-month process, IPFCC’s Better Together Learning Community for Hospitals in New York State provided ongoing learning interventions for members of the SWT; multiple and varied resources from the Better Together toolkit for adaptation; and opportunities to share and reinforce new, learned expertise with colleagues within the Northwell Health system and beyond through IPFCC’s free online learning community, PFCC.Connect.
Conclusion
Family presence and participation are important to the quality, experience, safety, and outcomes of care. IPFCC’s campaign, Better Together: Partnering with Families, encourages hospitals to change restrictive visiting policies and, instead, to welcome families and caregivers 24 hours a day.
Two projects within Better Together involving almost 50 acute care hospitals in New York State confirm that change in policy, practice, and communication is particularly effective when implemented with strong support from leadership. An intervention like the Better Together Learning Community, offering structured training, coaching, and resources, can facilitate the change process.
Corresponding author: IPFCC, Deborah L. Dokken, 6917 Arlington Rd., Ste. 309, Bethesda, MD 20814; [email protected].
Funding disclosures: None.
1. Dokken DL, Kaufman J, Johnson BJ et al. Changing hospital visiting policies: from families as “visitors” to families as partners. J Clin Outcomes Manag. 2015; 22:29-36.
2. New York Public Interest Research Group and New Yorkers for Patient & Family Empowerment. Sick, scared and separated from loved ones. third edition: A pathway to improvement in New York City. New York: NYPIRG: 2018. www.nypirg.org/pubs/201801/NYPIRG_SICK_SCARED_FINAL.pdf. Accessed December 12, 2019.
3. Institute for Patient- and Family-Centered Care. Better Together: Partnering with Families. www.ipfcc.org/bestpractices/better-together.html. Accessed December 12, 2019.
4. Canadian Foundation for Healthcare Improvement. Better Together. www.cfhi-fcass.ca/WhatWeDo/better-together. Accessed December 12, 2019.
5. Canadian Foundation for Healthcare Improvement. Better Together: A change package to support the adoption of family presence and participation in acute care hospitals and accelerate healthcare improvement. www.cfhi-fcass.ca/sf-docs/default-source/patient-engagement/better-together-change-package.pdf?sfvrsn=9656d044_4. Accessed December 12, 2019.
6. Canadian Foundation for Healthcare Improvement. L’Objectif santé: main dans la main avec les familles. www.cfhi-fcass.ca/sf-docs/default-source/patient-engagement/families-pocket-screen_fr.pdf. Accessed December 12, 2019.
7. New York Public Interest Research Group and New Yorkers for Patient & Family Empowerment. Sick, scared and separated from loved ones. fourth edition: A pathway to improvement in New York. New York: NYPIRG: 2019. www.nypirg.org/pubs/201911/Sick_Scared_Separated_2019_web_FINAL.pdf. Accessed December 12, 2019.
8. Northwell Health. Patient and Family Partnership Councils. www.northwell.edu/about/commitment-to-excellence/patient-and-customer-experience/care-delivery-hospitality. Accessed December 12, 2019.
9 . Institute for Patient- and Family-Centered Care. How to conduct a “walk-about” from the patient and family perspective. www.ipfcc.org/resources/How_To_Conduct_A_Walk-About.pdf. Accessed December 12, 2019.
Improving Nephropathy Screening in Appalachian Patients With Diabetes Using Practice-Wide Outreach
From West Virginia University, Morgantown, WV.
Abstract
Objective: To describe the strategies a family medicine clinic in Appalachia utilized to increase nephropathy screening rates as well as to explore the factors predictive of nephropathy screening in patients with diabetes.
Design: This quality improvement project targeted the points in the care process when patients are lost to follow-up for nephropathy screening.
Setting and participants: Patients with diabetes cared for by a primary care provider (PCP) at an academic family medicine practice in Appalachia from January 2018 to November 2018.
Interventions: Bulk orders for albumin-to-creatinine (ACR) testing and urine collection during clinic visit, enhanced patient communication through bulk communication reminders and individual patient outreach, and education of clinic providers.
Measurements: Demographic data and monthly nephropathy screening rates.
Results: The nephropathy screening rate increased by 6.2% during the project. Older patients living closer to the clinic who visited their PCP 3 or more times per year were the most likely to be screened.
Conclusion: Combining team-based interventions with quality control monitoring can significantly improve compliance with recommended nephropathy treatment and screening in rural patients with diabetes at a family medicine clinic.
Keywords: rural; kidney disease; albumin-to-creatinine ratio; electronic health record.
According to the Centers for Disease Control and Prevention (CDC), an estimated 30.3 million people in the United States—about 9.4% of the population—have been diagnosed with diabetes.1 Diabetes is the seventh leading cause of death in the United States, and it contributes to other leading causes of death: heart disease and stroke.1 Diabetes also is related to high morbidity risk and is a leading cause of chronic kidney disease.1 The total cost of diagnosed diabetes was estimated at $327 billion in direct medical costs and reduced productivity.2
Residents of Appalachia bear a disproportionate burden of diabetes and other related negative health outcomes; these outcomes are influenced by a number of factors, including socioeconomic status, poverty, rurality, and health care access. Rates of chronic disease, such as diabetes, are most pronounced in Appalachia’s most economically distressed counties.3-5 In 2011, the CDC labeled a 644-county area the “diabetes belt,” which included most of Appalachia.6 As a result of this elevated prevalence of diabetes in Appalachia as compared to the rest of the country, complications directly associated with diabetes are more commonly observed in Appalachian residents. One of the most damaging complications is diabetic nephropathy.
Diabetic nephropathy results from damage to the microvasculature of the kidney due to inadequately controlled blood glucose. This, in turn, leads to decreased renal function, eventually leading to clinically significant renal disease. The long-term complications associated with nephropathy can include many comorbid conditions, the most serious of which are progression to end-stage renal disease, dialysis requirement, and early mortality. Diabetic nephropathy affects approximately 40% of patients with type 1 and type 2 diabetes.7,8
One way to prevent complications of diabetic nephropathy, in addition to good glycemic control in patients with diabetes, is early and regular screening. Currently, the American Diabetes Association (ADA) recommends yearly screening for diabetic nephropathy in the form of a urine albumin-to-creatinine ratio (ACR) for patients 18 to 75 years of age.2 This screening to detect diabetic nephropathy is recognized as a marker of quality care by many public and private insurance agencies and medical specialty associations, such as the Centers for Medicare and Medicaid Services.
Many patients with diabetes are cared for by primary care providers (PCP), and these PCP appointments provide an opportune time to screen and appropriately treat nephropathy. Screening opportunities are often missed, however, due to time constraints and competing health priorities. There are also a number of other factors specific to the Appalachian region that reduce the likelihood of screening for diabetic nephropathy, such as a lack of health insurance, the need to travel long distances to see a PCP, work and household responsibilities, low levels of education and health literacy, and a mistrust of outsiders regarding personal matters, including health.9-11 While nephropathy can have a detrimental impact on patients across populations, it is of particular concern for a state located in the heart of Appalachia, such as West Virginia.
Given the disproportionate burden of diabetes in this region and the potentially severe consequences of undetected nephropathy, clinicians from an academic family medicine clinic in West Virginia undertook a quality improvement project to increase the rate of nephropathy screening and treatment among patients with diabetes. This article describes the intervention strategies the team utilized to increase nephropathy screening and treatment in patients 18 to 75 years of age who met quality measures for nephropathy screening or treatment in the previous 12 months and explores the factors most predictive of nephropathy screening in Appalachian patients in this age group. It also reports the challenges and opportunities encountered and offers suggestions for other providers and clinics attempting to increase their nephropathy screening rates.
Methods
Setting and Study Population
The study population included patients ages 18 to 75 years under the care of providers in an academic family medicine practice in West Virginia who had been diagnosed with diabetes mellitus. The study focused on those patients overdue for diabetic nephropathy screening (ie, had not been screened in previous 12 months). The project began in January 2018 with a screening rate of 83.8%. The goal of this project was to increase this compliance metric by at least 5%. The project protocol was submitted to the West Virginia University Institutional Review Board, and, because it is a quality improvement project, permission was given to proceed without a board review.
Interventions
The team identified and implemented several interventions intended to reduce screening barriers and increase the screening rate.
Bulk orders for ACR and urine collection during clinic visits. Prior to initiation of this project, it was left to individual clinic providers to order nephropathy screening for patients with diabetes during a clinic visit; after receiving the order for “random urine microalbumin/creatinine ratio,” patients then had to travel to a lab to provide a urine sample. For this project and moving forward, the team changed to the procedure of initiating bulk ACR orders and collecting urine samples during clinic visits from all patients ages 18 to 75 years who have diabetes.
Bulk communication reminders. Since many patients with diabetes may not have realized they were overdue for nephropathy screening, the team began sending out bulk communication reminders through either the institution’s electronic health record (EHR; MyChart) or postal service–delivered physical letters (according to patient communication preferences) to remind patients that they were due for screening and to encourage them to schedule an appointment or keep a previously scheduled appointment with their PCP.
Individual patient outreach. A team of pharmacy students led by a licensed pharmacist in the family medicine clinic contacted patients overdue for screening even after bulk communication reminders went out. The students telephoned patients 2 to 3 months following the bulk communication. The students obtained an updated list of patients with diabetes ages 18 to 75 years from an EHR quality report. They began by prescreening the patients on the overdue list for potential candidacy for an angiotensin-converting enzyme (ACE) inhibitor or an angiotensin II receptor blocker (ARB). Screening for candidacy included evaluation of recent blood pressure readings, electrolytes (ie, basic metabolic panel), and ACR. If the students determined a patient was a candidate, they presented the patient to the preceptor for verification and then reached out to the provider with a recommendation. If the provider agreed, the student contacted the patient by telephone for medication counseling and education. The remaining patients determined not to be candidates for ACE inhibitors or ARBs were contacted by the pharmacy students by telephone to remind them that laboratory work was pending. Up to 3 phone call attempts were made before patients were determined to be unreachable. Students left voice mails with generic reminders if a patient could not be reached. If a patient answered, the student provided a reminder but also reviewed indications for lab work, the reason why the provider wished for follow-up, and updated lab hours. Students also followed up with the results of the work-up, as appropriate. During this outreach process, the student team encountered a number of patients who had moved or changed to a PCP outside of the family medicine clinic. In these cases, the EHR was updated and those patients were removed from the list of patients altogether.
Education of clinic providers. Clinic providers were educated during faculty and resident meetings and didactic learning sessions on identifying patients within the EHR who are due for nephropathy screening. They also received instruction on how to update the EHR to reflect completed screenings.
Data Analysis
All analyses in this study were conducted using SAS (version 9.4, 2013, SAS Institute Inc., Cary, NC). Descriptive analyses were conducted to summarize basic patient demographic information. To compare patients screened within the previous 12 months to those patients overdue for screening, 2-sample t-tests were used to examine differences in patients’ age, HbA1c, ACR, and creatinine level and the distance (in miles) between the patient’s home and the clinic. Chi-square analyses were used to examine the relationship between whether a patient was recently screened for nephropathy and the patient’s insurance, number of patient visits in the previous 12 months, and provider level. Logistic regression analyses were conducted to control for covariates and to explore which factors were most predictive of nephropathy screening. All tests were 2-tailed, and P values less than 0.05 were considered statistically significant.
Results
Patient Characteristics
There were 1676 family medicine clinic patients with diabetes between 18 and 75 years of age (Table 1 and Table 2). Of the total sample, 1489 (88.8%) had completed screening for nephropathy in the 12 months prior to evaluation, and 67.5%, 23.7%, and 8.8% of patients had private insurance, Medicare, and Medicaid, respectively. ")
The mean (SD) age of the patients was 56.3 (11.9) years. The mean distance between the patient’s home and the clinic was 26.6 (76.8) miles. The mean number of visits was 3.6 (2.9) per year, and 43.0% of the patientvisited the clinic more than 3 times in a year. The mean values for HbA1c (%), creatinine (g/mol), and ACR (mg/g) were 7.7 (1.9), 1.0 (0.7), and 9.4 (31.4), respectively.")
Screening of Patients for Nephropathy
Patients with Medicare and private insurance were more likely to have completed the nephropathy screening than those with Medicaid (92.5% versus 88.8% versus 82.8%, P = 0.004; Table 3 and Table 4). 

Changes in Screening Rate
The practice-wide screening rate was 83.8% at the start of this project in January 2018. The screening rate steadily increased throughout 2018, reaching 90.3% in August 2018, and then leveled off around 90% when the project was concluded at the end of November 2018 (Figure). As an added benefit of the increased screening rates, a number of patients were initiated on an ACE inhibitor or ARB based on the team’s screening efforts.

Predictors of Nephropathy Screening
A logistic regression analysis was conducted with nephropathy screening (screened or not screened) as the outcome and 7 patient characteristics as predictors: type of insurance (private, Medicare, or Medicaid), PCP visits in the past 12 months (≤ 3 or > 3), distance in miles of the patient’s residence from the clinic, age, last HbA1c value, last ACR value, and last creatinine value. A test of the full model with all 7 predictors was statistically significant (χ2 (8) = 57.77, P < 0.001). Table 5 shows regression coefficients, Wald statistics, and 95% confidence intervals for odds ratios for each of the 7 predictors. According to the Wald criterion, 3 patient characteristics were significant predictors of nephropathy screening: age, distance between the patient’s home and clinic, and number of PCP visits in the past 12 months. After adjusting for the covariates, there were still significant associations between the nephropathy screening status and age ( χ2(1) = 9.64, P < 0.01); distance between the patient’s home and the clinic (χ2(1) = 3.98, P < 0.05); and the number of PCP visits in the previous year (χ2(1) = 21.74, P < 0.001). With each 1-year increment in age, the odds of completing the nephropathy screening increased by 3.2%. With each 1-mile increase in the distance between the patient’s home and clinic, the odds of completing the nephropathy screening decreased by 0.2%. Patients who visited the clinic more than 3 times in a year were 3.9 times (95% confidence interval, 2.2-7.0) more likely to complete the nephropathy screening than their counterparts who visited fewer than 3 times per year.
In summary, older patients living within about 164 miles of the clinic (ie, within 1 standard deviation from the average miles between patient’s homes and the clinic) who visited their PCP 3 or more times per year were the most likely to be screened.

Discussion
Diabetic nephropathy is a critical issue facing family medicine providers and patients. The morbidity and mortality costs are significant, as diabetic nephropathy is the leading cause of end-stage renal disease. While the ADA recommends annual ACR screening in patients with diabetes and prescription of ACE inhibitors or ARBs in patients who qualify, many patients do not receive these interventions, despite following up with a provider.12-15 There is no current literature that indicates the compliance rates in the rural setting. Due to health disparities in the rural setting noted in the literature, it could be hypothesized that these individuals are at high risk of not meeting these screening and treatment recommendations.16,17 Limited access to care and resources, gaps in insurance coverage, and lower health literacy are a few barriers identified in the rural population that may influence whether these measures are met.17
Considering the disease burden of diabetes and its related complications, including nephropathy, consistent screening is necessary to reduce diabetes-related burdens and cost, while also increasing the quality of life for patients with diabetes. All parties must be involved to ensure appropriate compliance and treatment. Our institution’s implementation of quality improvement strategies has key implications for nephropathy screening and treatment efforts in rural settings.
An additional step of having a health care provider (other than the PCP) screen all patients who are not meeting the standard allows for identification of gaps in care. In our quality improvement workflow, the clinical pharmacist screened all patients for candidacy for ACE inhibitor/ARB therapy. While only a small percentage of patients qualified, many of these patients had previously been on therapy and were discontinued for an unknown reason or were stopped due to an acute condition (eg, acute kidney injury) and never restarted after recovery. Other patients required additional education that therapy would be utilized for nephroprotection versus blood pressure management (secondary to an elevated ACR). This highlights the importance of transitions of care and ongoing, intensive education, not only during initial diagnosis but also throughout the disease-state progression.
Utilization of EHRs and telephone outreach are additional aspects of care that can be provided. Our improved rates of compliance with these care interventions parallel findings from previous studies.15,18 Optimization of an institution’s EHR can aid in standardization of care, workflow management, and communication with patients, as well as alert nursing or support staff of screening needs. Techniques such as best practice reminders, patient chart messages, and nursing-entered physician alerts on daily schedules have been shown to increase rates of compliance with nephropathy standards. These findings underscore an additional opportunity for nursing and support staff to be better integrated into care.
Despite the success of this quality improvement initiative, there remain some limitations. The processes we used in this project may not be applicable to every institution and may have limited external validity. Primarily, while these processes may be implemented at some sites, without additional support staff (ie, extra nursing staff, pharmacists) and students to aid in patient outreach, success may be limited due to provider time constraints. Additionally, our workflow process demonstrates significant incorporation of an EHR system for patient outreach. Institutions and/or clinics that heavily rely on paper charts and paper outreach may face barriers with bulk orders (eg, ACR) and messages, interventions that streamlined our population health management. Finally, this project focuses on only 1 aspect of population health management for patients with diabetes. While nephropathy is a critical aspect of caring for individuals with diabetes, this patient outreach does not address retinopathy screening, HbA1c control, or vaccination rates, which are other components of care.
Conclusion
Although this evaluation does not provide insight into why patients were not treated or screened, it demonstrates processes to improve compliance in patients with diabetic nephropathy. Rural health care facilities require an ongoing program of change and evaluation, with the aim to improve the provision of services, increase screening, and encourage team member involvement in health promotion. This study demonstrates that combining team-based interventions with quality control monitoring can significantly improve compliance with recommended nephropathy screening and treatment in rural patients with diabetes at a family medicine clinic.
Corresponding author: Amie M. Ashcraft, West Virginia University, Department of Family Medicine, 1 Medical Center Drive, Box 9152, Morgantown, WV 26506; [email protected].
Financial disclosures: None.
Acknowledgment: The authors thank the faculty, residents, nurses, and clinic staff for their hard work and dedication to this effort: Umama Sadia, Michelle Prestoza, Richard Dattola, Greg Doyle, Dana King, Mike Maroon, Kendra Under, Judy Siebert, Christine Snyder, Rachel Burge, Meagan Gribble, Lisa Metts, Kelsey Samek, Sarah Deavers, Amber Kitzmiller, Angela Lamp, Tina Waldeck, and Andrea Sukeruksa.
1. Centers for Disease Control and Prevention (CDC). National diabetes statistics report. Estimates of diabetes and its burden in the United States. Atlanta, GA: CDC; 2017www.cdc.gov/diabetes/pdfs/data/statistics/national-diabetes-statistics-report.pdf. Accessed December 20, 2020.
2. American Diabetes Association (ADA). Economic costs of diabetes in the U.S. in 2017. Diabetes Care. 2018;41:917-928.
3. Wood L. Trends in national and regional economic distress, 1960-2000. Washington, DC: Appalachian Regional Commission; 2005.
4. Barker L, Crespo R, Gerzoff RB, et al. Residence in a distressed county in Appalachia as a risk factor for diabetes, Behavioral Risk Factor Surveillance System, 2006-2007. Prev Chronic Dis. 2010;7:A104.
5. Barker L, Kirtland KA, Gregg E, et al. Geographic distribution of diagnosed diabetes in the United States: A diabetes belt. Am J Prev Med. 2011;40:434-439.
6. Gross JL, de Azevedo MJ, Silveiro SP, et al. Diabetic nephropathy: Diagnosis, prevention, and treatment. Diabetes Care. 2005;28:164-176.
7. United States Renal Data System (USRDS). Annual data report. Ann Arbor, MI: USRDS; 2018. www.usrds.org/2018/view/Default.aspx. Accessed December 20, 2020.
8. Halverson JA, Bichak G. Underlying socioeconomic factors influencing health disparities in the Appalachian region. Washington, DC: Appalachian Regional Commission; 2008.
9. Shell R, Tudiver F. Barriers to cancer screening by rural Appalachian primary care providers. J Rural Health. 2004;20:368-373.
10. Hatcher J, Dignan MB, Schoenberg N. How do rural health care providers and patients view barriers to colorectal cancer screening? Insights from Appalachian Kentucky. Nurs Clin North Am. 2011;46:181-192.
11. Scott S, McSpirit S. The suspicious, untrusting hillbilly in political-economic contexts: Stereotypes and social trust in the Appalachian coalfields. Pract Anthropol. 2014;36:42-46.
12. Kirkman MS, Williams SR, Caffrey HH, Marrero DG. Impact of a program to improve adherence to diabetes guidelines by primary care physicians. Diabetes Care. 2002;25:1946-1951.
13. Byun SH, Ma SH, Jun JK, et al. Screening for diabetic retinopathy and nephropathy in patients with diabetes: A nationwide survey in Korea. PLoS One. 2013;8:e62991.
14. Flood D, Garcia P, Douglas K, et al. Screening for chronic kidney disease in a community-based diabetes cohort in rural Guatemala: A cross-sectional study. BMJ Open. 2018;8:e019778.
15. Anabtawi A, Mathew LM. Improving compliance with screening of diabetic patients for microalbuminuria in primary care practice. ISRN Endocrinology. 2013:893913.
16. Tonks SA, Makwana S, Salanitro AH, et al. Quality of diabetes mellitus care by rural primary care physicians. J Rural Health. 2012;28:364-371.
17. Douthit N, Kiv S, Dwolatzky T, Biswas S. Exposing some important barriers to health care access in the rural USA. Public Health. 2015;129:611-620.
18. Weber V, Bloom F, Pierdon S, Wood C. Employing the electronic health record to improve diabetes care: a multifaceted intervention in an integrated delivery system. J Gen Intern Med. 2008;23:379-382.
From West Virginia University, Morgantown, WV.
Abstract
Objective: To describe the strategies a family medicine clinic in Appalachia utilized to increase nephropathy screening rates as well as to explore the factors predictive of nephropathy screening in patients with diabetes.
Design: This quality improvement project targeted the points in the care process when patients are lost to follow-up for nephropathy screening.
Setting and participants: Patients with diabetes cared for by a primary care provider (PCP) at an academic family medicine practice in Appalachia from January 2018 to November 2018.
Interventions: Bulk orders for albumin-to-creatinine (ACR) testing and urine collection during clinic visit, enhanced patient communication through bulk communication reminders and individual patient outreach, and education of clinic providers.
Measurements: Demographic data and monthly nephropathy screening rates.
Results: The nephropathy screening rate increased by 6.2% during the project. Older patients living closer to the clinic who visited their PCP 3 or more times per year were the most likely to be screened.
Conclusion: Combining team-based interventions with quality control monitoring can significantly improve compliance with recommended nephropathy treatment and screening in rural patients with diabetes at a family medicine clinic.
Keywords: rural; kidney disease; albumin-to-creatinine ratio; electronic health record.
According to the Centers for Disease Control and Prevention (CDC), an estimated 30.3 million people in the United States—about 9.4% of the population—have been diagnosed with diabetes.1 Diabetes is the seventh leading cause of death in the United States, and it contributes to other leading causes of death: heart disease and stroke.1 Diabetes also is related to high morbidity risk and is a leading cause of chronic kidney disease.1 The total cost of diagnosed diabetes was estimated at $327 billion in direct medical costs and reduced productivity.2
Residents of Appalachia bear a disproportionate burden of diabetes and other related negative health outcomes; these outcomes are influenced by a number of factors, including socioeconomic status, poverty, rurality, and health care access. Rates of chronic disease, such as diabetes, are most pronounced in Appalachia’s most economically distressed counties.3-5 In 2011, the CDC labeled a 644-county area the “diabetes belt,” which included most of Appalachia.6 As a result of this elevated prevalence of diabetes in Appalachia as compared to the rest of the country, complications directly associated with diabetes are more commonly observed in Appalachian residents. One of the most damaging complications is diabetic nephropathy.
Diabetic nephropathy results from damage to the microvasculature of the kidney due to inadequately controlled blood glucose. This, in turn, leads to decreased renal function, eventually leading to clinically significant renal disease. The long-term complications associated with nephropathy can include many comorbid conditions, the most serious of which are progression to end-stage renal disease, dialysis requirement, and early mortality. Diabetic nephropathy affects approximately 40% of patients with type 1 and type 2 diabetes.7,8
One way to prevent complications of diabetic nephropathy, in addition to good glycemic control in patients with diabetes, is early and regular screening. Currently, the American Diabetes Association (ADA) recommends yearly screening for diabetic nephropathy in the form of a urine albumin-to-creatinine ratio (ACR) for patients 18 to 75 years of age.2 This screening to detect diabetic nephropathy is recognized as a marker of quality care by many public and private insurance agencies and medical specialty associations, such as the Centers for Medicare and Medicaid Services.
Many patients with diabetes are cared for by primary care providers (PCP), and these PCP appointments provide an opportune time to screen and appropriately treat nephropathy. Screening opportunities are often missed, however, due to time constraints and competing health priorities. There are also a number of other factors specific to the Appalachian region that reduce the likelihood of screening for diabetic nephropathy, such as a lack of health insurance, the need to travel long distances to see a PCP, work and household responsibilities, low levels of education and health literacy, and a mistrust of outsiders regarding personal matters, including health.9-11 While nephropathy can have a detrimental impact on patients across populations, it is of particular concern for a state located in the heart of Appalachia, such as West Virginia.
Given the disproportionate burden of diabetes in this region and the potentially severe consequences of undetected nephropathy, clinicians from an academic family medicine clinic in West Virginia undertook a quality improvement project to increase the rate of nephropathy screening and treatment among patients with diabetes. This article describes the intervention strategies the team utilized to increase nephropathy screening and treatment in patients 18 to 75 years of age who met quality measures for nephropathy screening or treatment in the previous 12 months and explores the factors most predictive of nephropathy screening in Appalachian patients in this age group. It also reports the challenges and opportunities encountered and offers suggestions for other providers and clinics attempting to increase their nephropathy screening rates.
Methods
Setting and Study Population
The study population included patients ages 18 to 75 years under the care of providers in an academic family medicine practice in West Virginia who had been diagnosed with diabetes mellitus. The study focused on those patients overdue for diabetic nephropathy screening (ie, had not been screened in previous 12 months). The project began in January 2018 with a screening rate of 83.8%. The goal of this project was to increase this compliance metric by at least 5%. The project protocol was submitted to the West Virginia University Institutional Review Board, and, because it is a quality improvement project, permission was given to proceed without a board review.
Interventions
The team identified and implemented several interventions intended to reduce screening barriers and increase the screening rate.
Bulk orders for ACR and urine collection during clinic visits. Prior to initiation of this project, it was left to individual clinic providers to order nephropathy screening for patients with diabetes during a clinic visit; after receiving the order for “random urine microalbumin/creatinine ratio,” patients then had to travel to a lab to provide a urine sample. For this project and moving forward, the team changed to the procedure of initiating bulk ACR orders and collecting urine samples during clinic visits from all patients ages 18 to 75 years who have diabetes.
Bulk communication reminders. Since many patients with diabetes may not have realized they were overdue for nephropathy screening, the team began sending out bulk communication reminders through either the institution’s electronic health record (EHR; MyChart) or postal service–delivered physical letters (according to patient communication preferences) to remind patients that they were due for screening and to encourage them to schedule an appointment or keep a previously scheduled appointment with their PCP.
Individual patient outreach. A team of pharmacy students led by a licensed pharmacist in the family medicine clinic contacted patients overdue for screening even after bulk communication reminders went out. The students telephoned patients 2 to 3 months following the bulk communication. The students obtained an updated list of patients with diabetes ages 18 to 75 years from an EHR quality report. They began by prescreening the patients on the overdue list for potential candidacy for an angiotensin-converting enzyme (ACE) inhibitor or an angiotensin II receptor blocker (ARB). Screening for candidacy included evaluation of recent blood pressure readings, electrolytes (ie, basic metabolic panel), and ACR. If the students determined a patient was a candidate, they presented the patient to the preceptor for verification and then reached out to the provider with a recommendation. If the provider agreed, the student contacted the patient by telephone for medication counseling and education. The remaining patients determined not to be candidates for ACE inhibitors or ARBs were contacted by the pharmacy students by telephone to remind them that laboratory work was pending. Up to 3 phone call attempts were made before patients were determined to be unreachable. Students left voice mails with generic reminders if a patient could not be reached. If a patient answered, the student provided a reminder but also reviewed indications for lab work, the reason why the provider wished for follow-up, and updated lab hours. Students also followed up with the results of the work-up, as appropriate. During this outreach process, the student team encountered a number of patients who had moved or changed to a PCP outside of the family medicine clinic. In these cases, the EHR was updated and those patients were removed from the list of patients altogether.
Education of clinic providers. Clinic providers were educated during faculty and resident meetings and didactic learning sessions on identifying patients within the EHR who are due for nephropathy screening. They also received instruction on how to update the EHR to reflect completed screenings.
Data Analysis
All analyses in this study were conducted using SAS (version 9.4, 2013, SAS Institute Inc., Cary, NC). Descriptive analyses were conducted to summarize basic patient demographic information. To compare patients screened within the previous 12 months to those patients overdue for screening, 2-sample t-tests were used to examine differences in patients’ age, HbA1c, ACR, and creatinine level and the distance (in miles) between the patient’s home and the clinic. Chi-square analyses were used to examine the relationship between whether a patient was recently screened for nephropathy and the patient’s insurance, number of patient visits in the previous 12 months, and provider level. Logistic regression analyses were conducted to control for covariates and to explore which factors were most predictive of nephropathy screening. All tests were 2-tailed, and P values less than 0.05 were considered statistically significant.
Results
Patient Characteristics
There were 1676 family medicine clinic patients with diabetes between 18 and 75 years of age (Table 1 and Table 2). Of the total sample, 1489 (88.8%) had completed screening for nephropathy in the 12 months prior to evaluation, and 67.5%, 23.7%, and 8.8% of patients had private insurance, Medicare, and Medicaid, respectively.
The mean (SD) age of the patients was 56.3 (11.9) years. The mean distance between the patient’s home and the clinic was 26.6 (76.8) miles. The mean number of visits was 3.6 (2.9) per year, and 43.0% of the patientvisited the clinic more than 3 times in a year. The mean values for HbA1c (%), creatinine (g/mol), and ACR (mg/g) were 7.7 (1.9), 1.0 (0.7), and 9.4 (31.4), respectively.
Screening of Patients for Nephropathy
Patients with Medicare and private insurance were more likely to have completed the nephropathy screening than those with Medicaid (92.5% versus 88.8% versus 82.8%, P = 0.004; Table 3 and Table 4).
Changes in Screening Rate
The practice-wide screening rate was 83.8% at the start of this project in January 2018. The screening rate steadily increased throughout 2018, reaching 90.3% in August 2018, and then leveled off around 90% when the project was concluded at the end of November 2018 (Figure). As an added benefit of the increased screening rates, a number of patients were initiated on an ACE inhibitor or ARB based on the team’s screening efforts.
Predictors of Nephropathy Screening
A logistic regression analysis was conducted with nephropathy screening (screened or not screened) as the outcome and 7 patient characteristics as predictors: type of insurance (private, Medicare, or Medicaid), PCP visits in the past 12 months (≤ 3 or > 3), distance in miles of the patient’s residence from the clinic, age, last HbA1c value, last ACR value, and last creatinine value. A test of the full model with all 7 predictors was statistically significant (χ2 (8) = 57.77, P < 0.001). Table 5 shows regression coefficients, Wald statistics, and 95% confidence intervals for odds ratios for each of the 7 predictors. According to the Wald criterion, 3 patient characteristics were significant predictors of nephropathy screening: age, distance between the patient’s home and clinic, and number of PCP visits in the past 12 months. After adjusting for the covariates, there were still significant associations between the nephropathy screening status and age ( χ2(1) = 9.64, P < 0.01); distance between the patient’s home and the clinic (χ2(1) = 3.98, P < 0.05); and the number of PCP visits in the previous year (χ2(1) = 21.74, P < 0.001). With each 1-year increment in age, the odds of completing the nephropathy screening increased by 3.2%. With each 1-mile increase in the distance between the patient’s home and clinic, the odds of completing the nephropathy screening decreased by 0.2%. Patients who visited the clinic more than 3 times in a year were 3.9 times (95% confidence interval, 2.2-7.0) more likely to complete the nephropathy screening than their counterparts who visited fewer than 3 times per year.
In summary, older patients living within about 164 miles of the clinic (ie, within 1 standard deviation from the average miles between patient’s homes and the clinic) who visited their PCP 3 or more times per year were the most likely to be screened.
Discussion
Diabetic nephropathy is a critical issue facing family medicine providers and patients. The morbidity and mortality costs are significant, as diabetic nephropathy is the leading cause of end-stage renal disease. While the ADA recommends annual ACR screening in patients with diabetes and prescription of ACE inhibitors or ARBs in patients who qualify, many patients do not receive these interventions, despite following up with a provider.12-15 There is no current literature that indicates the compliance rates in the rural setting. Due to health disparities in the rural setting noted in the literature, it could be hypothesized that these individuals are at high risk of not meeting these screening and treatment recommendations.16,17 Limited access to care and resources, gaps in insurance coverage, and lower health literacy are a few barriers identified in the rural population that may influence whether these measures are met.17
Considering the disease burden of diabetes and its related complications, including nephropathy, consistent screening is necessary to reduce diabetes-related burdens and cost, while also increasing the quality of life for patients with diabetes. All parties must be involved to ensure appropriate compliance and treatment. Our institution’s implementation of quality improvement strategies has key implications for nephropathy screening and treatment efforts in rural settings.
An additional step of having a health care provider (other than the PCP) screen all patients who are not meeting the standard allows for identification of gaps in care. In our quality improvement workflow, the clinical pharmacist screened all patients for candidacy for ACE inhibitor/ARB therapy. While only a small percentage of patients qualified, many of these patients had previously been on therapy and were discontinued for an unknown reason or were stopped due to an acute condition (eg, acute kidney injury) and never restarted after recovery. Other patients required additional education that therapy would be utilized for nephroprotection versus blood pressure management (secondary to an elevated ACR). This highlights the importance of transitions of care and ongoing, intensive education, not only during initial diagnosis but also throughout the disease-state progression.
Utilization of EHRs and telephone outreach are additional aspects of care that can be provided. Our improved rates of compliance with these care interventions parallel findings from previous studies.15,18 Optimization of an institution’s EHR can aid in standardization of care, workflow management, and communication with patients, as well as alert nursing or support staff of screening needs. Techniques such as best practice reminders, patient chart messages, and nursing-entered physician alerts on daily schedules have been shown to increase rates of compliance with nephropathy standards. These findings underscore an additional opportunity for nursing and support staff to be better integrated into care.
Despite the success of this quality improvement initiative, there remain some limitations. The processes we used in this project may not be applicable to every institution and may have limited external validity. Primarily, while these processes may be implemented at some sites, without additional support staff (ie, extra nursing staff, pharmacists) and students to aid in patient outreach, success may be limited due to provider time constraints. Additionally, our workflow process demonstrates significant incorporation of an EHR system for patient outreach. Institutions and/or clinics that heavily rely on paper charts and paper outreach may face barriers with bulk orders (eg, ACR) and messages, interventions that streamlined our population health management. Finally, this project focuses on only 1 aspect of population health management for patients with diabetes. While nephropathy is a critical aspect of caring for individuals with diabetes, this patient outreach does not address retinopathy screening, HbA1c control, or vaccination rates, which are other components of care.
Conclusion
Although this evaluation does not provide insight into why patients were not treated or screened, it demonstrates processes to improve compliance in patients with diabetic nephropathy. Rural health care facilities require an ongoing program of change and evaluation, with the aim to improve the provision of services, increase screening, and encourage team member involvement in health promotion. This study demonstrates that combining team-based interventions with quality control monitoring can significantly improve compliance with recommended nephropathy screening and treatment in rural patients with diabetes at a family medicine clinic.
Corresponding author: Amie M. Ashcraft, West Virginia University, Department of Family Medicine, 1 Medical Center Drive, Box 9152, Morgantown, WV 26506; [email protected].
Financial disclosures: None.
Acknowledgment: The authors thank the faculty, residents, nurses, and clinic staff for their hard work and dedication to this effort: Umama Sadia, Michelle Prestoza, Richard Dattola, Greg Doyle, Dana King, Mike Maroon, Kendra Under, Judy Siebert, Christine Snyder, Rachel Burge, Meagan Gribble, Lisa Metts, Kelsey Samek, Sarah Deavers, Amber Kitzmiller, Angela Lamp, Tina Waldeck, and Andrea Sukeruksa.
1. Centers for Disease Control and Prevention (CDC). National diabetes statistics report. Estimates of diabetes and its burden in the United States. Atlanta, GA: CDC; 2017www.cdc.gov/diabetes/pdfs/data/statistics/national-diabetes-statistics-report.pdf. Accessed December 20, 2020.
2. American Diabetes Association (ADA). Economic costs of diabetes in the U.S. in 2017. Diabetes Care. 2018;41:917-928.
3. Wood L. Trends in national and regional economic distress, 1960-2000. Washington, DC: Appalachian Regional Commission; 2005.
4. Barker L, Crespo R, Gerzoff RB, et al. Residence in a distressed county in Appalachia as a risk factor for diabetes, Behavioral Risk Factor Surveillance System, 2006-2007. Prev Chronic Dis. 2010;7:A104.
5. Barker L, Kirtland KA, Gregg E, et al. Geographic distribution of diagnosed diabetes in the United States: A diabetes belt. Am J Prev Med. 2011;40:434-439.
6. Gross JL, de Azevedo MJ, Silveiro SP, et al. Diabetic nephropathy: Diagnosis, prevention, and treatment. Diabetes Care. 2005;28:164-176.
7. United States Renal Data System (USRDS). Annual data report. Ann Arbor, MI: USRDS; 2018. www.usrds.org/2018/view/Default.aspx. Accessed December 20, 2020.
8. Halverson JA, Bichak G. Underlying socioeconomic factors influencing health disparities in the Appalachian region. Washington, DC: Appalachian Regional Commission; 2008.
9. Shell R, Tudiver F. Barriers to cancer screening by rural Appalachian primary care providers. J Rural Health. 2004;20:368-373.
10. Hatcher J, Dignan MB, Schoenberg N. How do rural health care providers and patients view barriers to colorectal cancer screening? Insights from Appalachian Kentucky. Nurs Clin North Am. 2011;46:181-192.
11. Scott S, McSpirit S. The suspicious, untrusting hillbilly in political-economic contexts: Stereotypes and social trust in the Appalachian coalfields. Pract Anthropol. 2014;36:42-46.
12. Kirkman MS, Williams SR, Caffrey HH, Marrero DG. Impact of a program to improve adherence to diabetes guidelines by primary care physicians. Diabetes Care. 2002;25:1946-1951.
13. Byun SH, Ma SH, Jun JK, et al. Screening for diabetic retinopathy and nephropathy in patients with diabetes: A nationwide survey in Korea. PLoS One. 2013;8:e62991.
14. Flood D, Garcia P, Douglas K, et al. Screening for chronic kidney disease in a community-based diabetes cohort in rural Guatemala: A cross-sectional study. BMJ Open. 2018;8:e019778.
15. Anabtawi A, Mathew LM. Improving compliance with screening of diabetic patients for microalbuminuria in primary care practice. ISRN Endocrinology. 2013:893913.
16. Tonks SA, Makwana S, Salanitro AH, et al. Quality of diabetes mellitus care by rural primary care physicians. J Rural Health. 2012;28:364-371.
17. Douthit N, Kiv S, Dwolatzky T, Biswas S. Exposing some important barriers to health care access in the rural USA. Public Health. 2015;129:611-620.
18. Weber V, Bloom F, Pierdon S, Wood C. Employing the electronic health record to improve diabetes care: a multifaceted intervention in an integrated delivery system. J Gen Intern Med. 2008;23:379-382.
Collaborative Dementia Care via Telephone and Internet Improves Quality of Life and Reduces Caregiver Burden
Study Overview
Objective. To examine the effectiveness of a hub site–based care delivery system in delivering a dementia care management program to persons with dementia and their caregivers.
Design. Randomized pragmatic clinical trial enrolling dyads of persons with dementia and their caregiver. Study participants were randomly assigned to the dementia care management program and usual care in a 2:1 ratio.
Setting and participants. The study was conducted from 2 hub sites: the University of California, San Francisco, and the University of Nebraska Medical Center in Omaha. Each hub-site team served persons with dementia and their caregivers in California, Nebraska, and Iowa in both urban and rural areas. Participants were recruited through referral by treating providers or self-referral in response to advertising presented through a community outreach event, in the news, or on the internet. Eligibility requirements included: having a dementia diagnosis made by a treating provider; age older than 45 years; Medicare or Medicaid enrollment or eligibility; presence of a caregiver willing to enroll in the study; fluency in English, Spanish, or Cantonese; and residence in California, Nebraska, or Iowa. Exclusion criteria included residence in a nursing home. Out of 2585 referred dyads of persons with dementia and caregivers, 780 met inclusion criteria and were enrolled. A 2:1 randomization yielded 512 dyads in the intervention group and 268 dyads in the control group.
Intervention. The dementia care management program was implemented through the Care Ecosystem, a telephone- and internet-based supportive care intervention delivered by care team navigators. The navigators were unlicensed but trained dementia care guides working under the supervision of an advanced practice nurse, social worker, and pharmacist. The intervention consisted of telephone calls, monthly or at a frequency determined by needs and preferences, placed by navigators over a 12-month period; the content of the calls included response to immediate needs of persons with dementia and their caregiver, screening for common problems, and provision of support and education using care plan protocols. Caregivers and persons with dementia were encouraged to initiate contact through email, mail, or telephone for dementia-related questions. Additional support was provided by an advanced practice nurse, social worker, or pharmacist, as needed, and these health care professionals conducted further communication with the persons with dementia, caregiver, or outside professionals, such as physicians, for the persons with dementia, as needed. The average number of telephone calls over the 12-month period was 15.3 (standard deviation, 11.3). Participants assigned to usual care were offered contact information on dementia and aging-related organizations, including the Alzheimer’s Association and the Area Agencies on Aging, and also were sent a quarterly newsletter with general information about dementia.
Main outcome measures. The primary outcome measure was the Quality of Life in Alzheimer’s Disease score obtained by caregiver interview. This quality of life measure includes the following aspects, each rated on an ordinal scale of 1 to 4: physical health, energy level, mood, living situation, memory, family, closest relationship, friends, self, ability to do things for fun, finances, and life as a whole. The scores range from 13 to 52, with a higher score indicating better quality of life for persons with dementia. Other outcomes included frequency of emergency room visits, hospital use, and ambulance use; caregiver depression score from the Patient Health Questionnaire scale; caregiver burden score using the 12-item Zarit Burden Interview; caregiver self-efficacy; and caregiver satisfaction.
Main results. The study found that the quality of life for persons with dementia declined more in the usual care group than in the intervention group during the 12-month study period (difference of 0.53; 95% confidence interval, 0.25-1.3; P = 0.04). Persons with dementia also had fewer emergency room visits, with a number needed to treat to prevent 1 emergency room visit of 5. The intervention did not reduce ambulance use or hospital use. Caregivers in the intervention group had a greater decline in depression when compared to usual care; the frequency of moderate to severe depression decreased from 13.4% at baseline to 7.9% at 12 months (P = 0.004). Caregiver burden declined more in the intervention group than in the control group at 12 months (P = 0.046). In terms of caregiver satisfaction, 97% of caregivers surveyed in the intervention group said they would recommend the intervention to another caregiver; 45% indicated they were very satisfied, and 33% that they were satisfied.
Conclusion. Delivering dementia care via telephone and internet through a collaborative program with care navigators can improve caregiver burden and well-being and improve quality of life, emergency room utilization, and depression for persons with dementia. In addition, the program was well received.
Commentary
Dementia, including Alzheimer’s disease, primarily affects older adults and is characterized by declines in memory and cognitive function. It is often accompanied by neuropsychological symptoms such as agitation, wandering, and physical and verbal outbursts, which are debilitating for persons living with dementia and difficult to cope with for caregivers.1 These symptoms are often the source of caregiver stress, potentially leading to caregiver depression and eventual need for long-term institution-based care, such as nursing home placement.2
Prior literature has established the potential effect of support in improving caregiver outcomes, including caregiver stress and burden, through interventions such as enhancing resources for caregivers, teaching coping strategies to caregivers, and teaching caregivers how to manage support for their loved ones.3,4 However, wider adoption of these interventions may be limited if the interventions involve in-person meetings or activities that take caregivers away from caregiving; the scalability of these programs is also limited by their ability to reach persons with dementia and their caregivers. These barriers are particularly important for older adults living in rural areas, where the availability of resources and distance from access to quality care may be particularly limiting.5 Leveraging advances in technology and telecommunication, this study examined the effects of providing dementia care support via telephone and internet using a trained, unlicensed care navigator as the main point of contact. The results showed improved quality of life for persons with dementia, reduced need for emergency room visits, and reduced caregiver burden and depression. The intervention is promising as a scalable intervention that may impact dementia care nationwide.
Despite the promising results, there are several issues regarding the intervention’s applicability and impact that future studies may help to further clarify. Although the improvement in quality of life in persons with dementia is important to document, it is unclear whether this difference is clinically significant. Also, it may be important to examine whether the 12-month program has sustained impact beyond the study period, although the intervention could be conceived as a long-term care solution. If the intervention is sustained beyond 12 months, future studies may look at other clinical outcomes, such as incidence of institutionalization and perhaps time to institutionalization. The study population consisted of persons with dementia of various stages, half of whom had mild disease. Future studies may further clarify at which stage of dementia the intervention is most useful. Other changes that occurred during the study period, such as change in the use of paid home-based support services and referrals to other relevant evaluations and treatment, may provide further clues about how the dementia care intervention achieved its beneficial effects.
Applications for Clinical Practice
From the health systems perspective, dementia care accounts for significant resources, and these costs are expected to grow as the population ages and dementia prevalence increases. Identifying potentially scalable interventions that yield clinical benefits and are sustainable from a cost perspective is an important step forward in improving care for persons with dementia and their caregivers across the nation. The use of centralized hubs to deliver this intervention and the novel use of telecommunications advances make this intervention applicable across large areas. Policy makers should explore how an intervention such as this could be established and sustained in our health care system.
–William W. Hung, MD, MPH
1. Mega MS, Cummings JL, Fiorello T, Gornbein J. The spectrum of behavioral changes in Alzheimer’s disease. Neurology. 1996;46:130-135.
2. Gallagher-Thompson D, Brooks JO 3rd, Bliwise D, et al. The relations among caregiver stress, “sundowning” symptoms, and cognitive decline in Alzheimer’s disease. J Am Geriatr Soc. 1992;40:807-810.
3. Livingston G, Barber J, Rapaport P, et al. Clinical effectiveness of a manual based coping strategy programme (START, STrAtegies for RelaTives) in promoting the mental health of carers of family members with dementia: pragmatic randomised controlled trial. BMJ. 2013;347:f6276.
4. Belle SH, Burgio L, Burns R, et al; Resources for Enhancing Alzheimer’s Caregiver Health (REACH) II Investigators. Enhancing the quality of life of dementia caregivers from different ethnic or racial groups: a randomized, controlled trial. Ann Intern Med. 2006;145:727-738.
5. Goins RT, Williams KA, Carter MW, et al. Perceived barriers to health care access among rural older adults: a qualitative study. J Rural Health. 2005;21:206-213.
Study Overview
Objective. To examine the effectiveness of a hub site–based care delivery system in delivering a dementia care management program to persons with dementia and their caregivers.
Design. Randomized pragmatic clinical trial enrolling dyads of persons with dementia and their caregiver. Study participants were randomly assigned to the dementia care management program and usual care in a 2:1 ratio.
Setting and participants. The study was conducted from 2 hub sites: the University of California, San Francisco, and the University of Nebraska Medical Center in Omaha. Each hub-site team served persons with dementia and their caregivers in California, Nebraska, and Iowa in both urban and rural areas. Participants were recruited through referral by treating providers or self-referral in response to advertising presented through a community outreach event, in the news, or on the internet. Eligibility requirements included: having a dementia diagnosis made by a treating provider; age older than 45 years; Medicare or Medicaid enrollment or eligibility; presence of a caregiver willing to enroll in the study; fluency in English, Spanish, or Cantonese; and residence in California, Nebraska, or Iowa. Exclusion criteria included residence in a nursing home. Out of 2585 referred dyads of persons with dementia and caregivers, 780 met inclusion criteria and were enrolled. A 2:1 randomization yielded 512 dyads in the intervention group and 268 dyads in the control group.
Intervention. The dementia care management program was implemented through the Care Ecosystem, a telephone- and internet-based supportive care intervention delivered by care team navigators. The navigators were unlicensed but trained dementia care guides working under the supervision of an advanced practice nurse, social worker, and pharmacist. The intervention consisted of telephone calls, monthly or at a frequency determined by needs and preferences, placed by navigators over a 12-month period; the content of the calls included response to immediate needs of persons with dementia and their caregiver, screening for common problems, and provision of support and education using care plan protocols. Caregivers and persons with dementia were encouraged to initiate contact through email, mail, or telephone for dementia-related questions. Additional support was provided by an advanced practice nurse, social worker, or pharmacist, as needed, and these health care professionals conducted further communication with the persons with dementia, caregiver, or outside professionals, such as physicians, for the persons with dementia, as needed. The average number of telephone calls over the 12-month period was 15.3 (standard deviation, 11.3). Participants assigned to usual care were offered contact information on dementia and aging-related organizations, including the Alzheimer’s Association and the Area Agencies on Aging, and also were sent a quarterly newsletter with general information about dementia.
Main outcome measures. The primary outcome measure was the Quality of Life in Alzheimer’s Disease score obtained by caregiver interview. This quality of life measure includes the following aspects, each rated on an ordinal scale of 1 to 4: physical health, energy level, mood, living situation, memory, family, closest relationship, friends, self, ability to do things for fun, finances, and life as a whole. The scores range from 13 to 52, with a higher score indicating better quality of life for persons with dementia. Other outcomes included frequency of emergency room visits, hospital use, and ambulance use; caregiver depression score from the Patient Health Questionnaire scale; caregiver burden score using the 12-item Zarit Burden Interview; caregiver self-efficacy; and caregiver satisfaction.
Main results. The study found that the quality of life for persons with dementia declined more in the usual care group than in the intervention group during the 12-month study period (difference of 0.53; 95% confidence interval, 0.25-1.3; P = 0.04). Persons with dementia also had fewer emergency room visits, with a number needed to treat to prevent 1 emergency room visit of 5. The intervention did not reduce ambulance use or hospital use. Caregivers in the intervention group had a greater decline in depression when compared to usual care; the frequency of moderate to severe depression decreased from 13.4% at baseline to 7.9% at 12 months (P = 0.004). Caregiver burden declined more in the intervention group than in the control group at 12 months (P = 0.046). In terms of caregiver satisfaction, 97% of caregivers surveyed in the intervention group said they would recommend the intervention to another caregiver; 45% indicated they were very satisfied, and 33% that they were satisfied.
Conclusion. Delivering dementia care via telephone and internet through a collaborative program with care navigators can improve caregiver burden and well-being and improve quality of life, emergency room utilization, and depression for persons with dementia. In addition, the program was well received.
Commentary
Dementia, including Alzheimer’s disease, primarily affects older adults and is characterized by declines in memory and cognitive function. It is often accompanied by neuropsychological symptoms such as agitation, wandering, and physical and verbal outbursts, which are debilitating for persons living with dementia and difficult to cope with for caregivers.1 These symptoms are often the source of caregiver stress, potentially leading to caregiver depression and eventual need for long-term institution-based care, such as nursing home placement.2
Prior literature has established the potential effect of support in improving caregiver outcomes, including caregiver stress and burden, through interventions such as enhancing resources for caregivers, teaching coping strategies to caregivers, and teaching caregivers how to manage support for their loved ones.3,4 However, wider adoption of these interventions may be limited if the interventions involve in-person meetings or activities that take caregivers away from caregiving; the scalability of these programs is also limited by their ability to reach persons with dementia and their caregivers. These barriers are particularly important for older adults living in rural areas, where the availability of resources and distance from access to quality care may be particularly limiting.5 Leveraging advances in technology and telecommunication, this study examined the effects of providing dementia care support via telephone and internet using a trained, unlicensed care navigator as the main point of contact. The results showed improved quality of life for persons with dementia, reduced need for emergency room visits, and reduced caregiver burden and depression. The intervention is promising as a scalable intervention that may impact dementia care nationwide.
Despite the promising results, there are several issues regarding the intervention’s applicability and impact that future studies may help to further clarify. Although the improvement in quality of life in persons with dementia is important to document, it is unclear whether this difference is clinically significant. Also, it may be important to examine whether the 12-month program has sustained impact beyond the study period, although the intervention could be conceived as a long-term care solution. If the intervention is sustained beyond 12 months, future studies may look at other clinical outcomes, such as incidence of institutionalization and perhaps time to institutionalization. The study population consisted of persons with dementia of various stages, half of whom had mild disease. Future studies may further clarify at which stage of dementia the intervention is most useful. Other changes that occurred during the study period, such as change in the use of paid home-based support services and referrals to other relevant evaluations and treatment, may provide further clues about how the dementia care intervention achieved its beneficial effects.
Applications for Clinical Practice
From the health systems perspective, dementia care accounts for significant resources, and these costs are expected to grow as the population ages and dementia prevalence increases. Identifying potentially scalable interventions that yield clinical benefits and are sustainable from a cost perspective is an important step forward in improving care for persons with dementia and their caregivers across the nation. The use of centralized hubs to deliver this intervention and the novel use of telecommunications advances make this intervention applicable across large areas. Policy makers should explore how an intervention such as this could be established and sustained in our health care system.
–William W. Hung, MD, MPH
1. Mega MS, Cummings JL, Fiorello T, Gornbein J. The spectrum of behavioral changes in Alzheimer’s disease. Neurology. 1996;46:130-135.
2. Gallagher-Thompson D, Brooks JO 3rd, Bliwise D, et al. The relations among caregiver stress, “sundowning” symptoms, and cognitive decline in Alzheimer’s disease. J Am Geriatr Soc. 1992;40:807-810.
3. Livingston G, Barber J, Rapaport P, et al. Clinical effectiveness of a manual based coping strategy programme (START, STrAtegies for RelaTives) in promoting the mental health of carers of family members with dementia: pragmatic randomised controlled trial. BMJ. 2013;347:f6276.
4. Belle SH, Burgio L, Burns R, et al; Resources for Enhancing Alzheimer’s Caregiver Health (REACH) II Investigators. Enhancing the quality of life of dementia caregivers from different ethnic or racial groups: a randomized, controlled trial. Ann Intern Med. 2006;145:727-738.
5. Goins RT, Williams KA, Carter MW, et al. Perceived barriers to health care access among rural older adults: a qualitative study. J Rural Health. 2005;21:206-213.
Medical scribe use linked to lower physician burnout
The incorporation of medical scribes into an outpatient oncology setting may lower physician burnout and improve patient care, according to a retrospective study.
“The objective of this study was to determine the effect of scribe integration on clinic workflow efficiency and physician satisfaction and quality of life in outpatient oncology clinics,” wrote Rebecca W. Gao, MD, of Stanford (Calif.) Medicine, and colleagues in the Journal of Oncology Practice.
The researchers retrospectively analyzed patient and survey data from 129 physicians connected with a tertiary care academic medical center during 2017-2019. In the study, 33 physicians were paired with a scribe, while 96 others were not.
During each patient encounter, visit duration times were recorded into an electronic medical record by a medical scribe. The scribes also performed a variety of other tasks, including collating lab results, documenting medical history, and completing postvisit summaries.
In the analysis, the team compared average visit duration times between physicians with and without a scribe. The effects of scribe integration on individual physician’s visit times were also assessed.
After analysis, the researchers found that physicians with a scribe experienced a 12.1% reduction in overall average patient visit duration, compared with visit times before scribe integration (P less than .0001). They also reported that less time was spent charting at the end of the day (P = .04).
“Compared with their peers, oncologists with scribes showed a 10%-20% decrease in the duration of all patient visits,” they explained.
With respect to patient care, survey results revealed that 90% of physicians strongly agreed they spent additional time with patients, and less time at the computer. “100% of physicians surveyed ‘strongly agreed’ that scribes improved their quality of life,” they added.
The researchers acknowledged that a key limitation of the study was the single-center design. As a result, these findings may not be applicable to physicians practicing in community-based settings.
Further studies could include financial analyses to evaluate the cost-effectiveness of medical scribe use in oncology practices, they noted.
“Our study suggests that scribes can be successfully integrated into oncology clinics and may benefit physician quality of life, clinic workflow efficiency, and the quality of physician-patient interactions,” they concluded.
The study was funded by the Stanford Cancer Center. One study author reported financial affiliations with SurgVision, Vergent Biotechnology, Novadaq Technologies, and LI-COR Biosciences.
SOURCE: Gao RW et al. J Oncol Pract. 2019 Dec 5. doi: 10.1200/JOP.19.00307.
FROM JOURNAL OF ONCOLOGY PRACTICE
Docs weigh pulling out of MIPS over paltry payments
If you’ve knocked yourself out to earn a Merit-Based Incentive Payment System (MIPS) bonus payment, it’s pretty safe to say that getting a 1.68% payment boost probably didn’t feel like a “win” that was worth the effort.
And although it saved you from having a negative 5% payment adjustment, many physicians don’t feel that it was worth the effort.
On Jan. 6, the Centers for Medicare & Medicaid Services announced the 2020 payouts for MIPS.
Based on 2018 participation, the bonus for those who scored a perfect 100 is only a 1.68% boost in Medicare reimbursement, slightly lower than last year’s 1.88%. This decline comes as no surprise as the agency leader admits: “As the program matures, we expect that the increases in the performance thresholds in future program years will create a smaller distribution of positive payment adjustments.” Overall, more than 97% of participants avoided having a negative 5% payment adjustment.
Indeed, these bonus monies are based on a short-term appropriation of extra funds from Congress. After these temporary funds are no longer available, there will be little, if any, monies to distribute as the program is based on a “losers-feed-the-winners” construct.
It may be very tempting for many physicians to decide to ignore MIPS, with the rationale that 1.68% is not worth the effort. But don’t let your foot off the gas pedal yet, since the penalty for not participating in 2020 is a substantial 9%.
However, it is certainly time to reconsider efforts to participate at the highest level.
Should you or shouldn’t you bother with MIPS?
Let’s say you have $75,000 in revenue from Medicare Part B per year. Depending on the services you offer in your practice, that equates to 500-750 encounters with Medicare beneficiaries per year. (A reminder that MIPS affects only Part B; Medicare Advantage plans do not partake in the program.)
The recent announcement reveals that perfection would equate to an additional $1,260 per year. That’s only if you received the full 100 points; if you were simply an “exceptional performer,” the government will allot an additional $157. That’s less than you get paid for a single office visit.
The difference between perfection and compliance is approximately $1,000. Failure to participate, however, knocks $6,750 off your bottom line. Clearly, that’s a substantial financial loss that would affect most practices. Obviously, the numbers change if you have higher – or lower – Medicare revenue, but it’s important to do the math.
Why? Physicians are spending a significant amount of money to comply with the program requirements. This includes substantial payments to registries – typically $200 to >$1,000 per year – to report the quality measures for the program; electronic health record (EHR) systems, many of which require additional funding for the “upgrade” to a MIPS-compatible system, are also a sizable investment.
These hard costs pale in comparison with the time spent on understanding the ever-changing requirements of the program and the process by which your practice will implement them. Take, for example, something as innocuous as the required “Support Electronic Referral Loops by Receiving and Incorporating Health Information.”
You first must understand the elements of the measure: What is a “referral loop?” When do we need to generate one? To whom shall it be sent? What needs to be included in “health information?” What is the electronic address to which we should route the information? How do we obtain that address? Then you must determine how your EHR system captures and reports it.
Only then comes the hard part: How are we going to implement this? That’s only one of more than a dozen required elements: six quality measures, two (to four) improvement activities, and four promoting interoperability requirements. Each one of these elements has a host of requirements, all listed on multipage specification sheets.
The government does not seem to be listening. John Cullen, MD, president of the American Academy of Family Physicians, testified at the Senate Finance Committee in May 2019 that MIPS “has created a burdensome and extremely complex program that has increased practice costs ... ” Yet, later that year, CMS issued another hefty ruling that outlines significant changes to the program, despite the fact that it’s in its fourth performance year.
Turning frustration into action
Frustration or even anger may be one reaction, but now is an opportune time to determine your investment in the program. At a minimum, it’s vital to understand and meet the threshold to avoid the penalty. It’s been shifting to date, but it’s now set at 9% for perpetuity.
First, it’s crucial to check on your participation status. CMS revealed that the participation database was recently corrected for so-called inconsistencies, so it pays to double-check. It only takes seconds: Insert your NPI in the QPP Participation Status Tool to determine your eligibility for 2020.
In 2020, the threshold to avoid the penalty is 45 points. To get the 45 points, practices must participate in two improvement activities, which is not difficult as there are 118 options. That will garner 15 points. Then there are 45 points available from the quality category; you need at least 30 to reach the 45-point threshold for penalty avoidance.
Smart MIPS hacks that can help you
To obtain the additional 30 points, turn your attention to the quality category. There are 268 quality measures; choose at least six to measure. If you report directly from your EHR system, you’ll get a bonus point for each reported measure, plus one just for trying. (There are a few other opportunities for bonus points, such as improving your scores over last year.) Those bonus points give you a base with which to work, but getting to 45 will require effort to report successfully on at least a couple of the measures.
The quality category has a total of 100 points available, which are converted to 45 toward your composite score. Since you need 30 to reach that magical 45 (if 15 were attained from improvement activities), that means you must come up with 75 points in the quality category. Between the bonus points and measuring a handful of measures successfully through the year, you’ll achieve this threshold.
There are two other categories in the program: promoting interoperability (PI) and cost. The PI category mirrors the old “meaningful use” program; however, it has become increasingly difficult over the years. If you think that you can meet the required elements, you can pick up 25 more points toward your composite score.
Cost is a bit of an unknown, as the scoring is based on a retrospective review of your claims. You’ll likely pick up a few more points on this 15-point category, but there’s no method to determine performance until after the reporting period. Therefore, be cautious about relying on this category.
The best MIPS hack, however, is if you are a small practice. CMS – remarkably – defines a “small practice” as 15 or fewer eligible professionals. If you qualify under this paradigm, you have multiple options to ease compliance:
Apply for a “hardship exemption” simply on the basis of being small; the exemption relates to the promoting operability category, shifting those points to the quality category.
Gain three points per quality measure, regardless of data completeness; this compares to just one point for other physicians.
Capture all of the points available from the Improvement Activities category by confirming participation with just a single activity. (This also applies to all physicians in rural or Health Professional Shortage Areas.)
In the event that you don’t qualify as a “small practice” or you’re still falling short of the requirements, CMS allows for the ultimate “out”: You can apply for exemption on the basis of an “extreme and uncontrollable circumstance.” The applications for these exceptions open this summer.
Unless you qualify for the program exemption, it’s important to keep pace with the program to ensure that you reach the 45-point threshold. It may not, however, be worthwhile to gear up for all 100 points unless your estimate of the potential return – and what it costs you to get there – reveals otherwise. MIPS is not going anywhere; the program is written into the law.
But that doesn’t mean that CMS can’t make tweaks and updates. Hopefully, the revisions won’t create even more administrative burden as the program is quickly turning into a big stick with only a small carrot at the end.
Elizabeth Woodcock is president of Woodcock & Associates in Atlanta. She has disclosed no relevant financial relationships.
This article first appeared on Medscape.com.
Costs are keeping Americans out of the doctor’s office
The cost of health care is keeping more Americans from seeing a doctor, even as the number of individuals with insurance coverage increases, according to a new study.
“Despite short-term gains owing to the [Affordable Care Act], over the past 20 years the portion of adults aged 18-64 years unable to see a physician owing to the cost increased, mostly because of an increase among persons with insurance,” Laura Hawks, MD, of Cambridge (Mass.) Health Alliance and Harvard Medical School in Boston and colleagues wrote in a new research report published in JAMA Internal Medicine.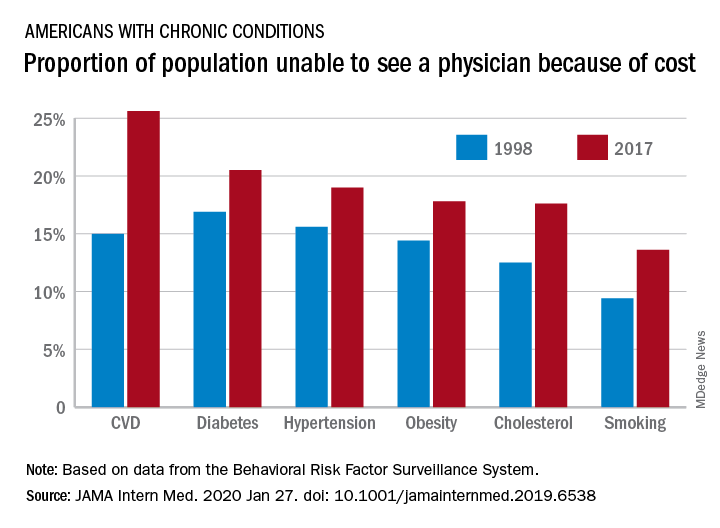
“In 2017, nearly one-fifth of individuals with any chronic condition (diabetes, obesity, or cardiovascular disease) said they were unable to see a physician owing to cost,” they continued.
Researchers examined 20 years of data (January 1998 through December 2017) from the Centers for Disease Control and Prevention’s Behavioral Risk Factor Surveillance System to identify trends in unmet need for physician and preventive services.
Among adults aged 18-64 years who responded to the survey in 1998 and 2017, uninsurance decreased by 2.1 percentage points, falling from 16.9% to 14.8%. But at the same time, the portion of adults who were unable to see a physician because of cost rose by 2.7 percentage points, from 11.4% to 15.7%. Looking specifically at adults who had insurance coverage, the researchers found that cost was a barrier for 11.5% of them in 2017, up from 7.1% in 1998.
These results come against a backdrop of growing medical costs, increasing deductibles and copayments, an increasing use of cost containment measures like prior authorization, and narrow provider networks in the wake of the transition to value-based payment structures, the authors noted.
“Our finding that financial access to physician care worsened is concerning,” Dr. Hawks and her colleagues wrote. “Persons with conditions such as diabetes, hypertension, cardiovascular disease, and poor health status risk substantial harms if they forgo physician care. Financial barriers to care have been associated with increased hospitalizations and worse health outcomes in patients with cardiovascular disease and hypertension and increased morbidity among patients with diabetes.”
One of the trends highlighted by the study authors is the growing number of employers offering plans with a high deductible.
“Enrollment in a high-deductible health plan, which has become increasingly common in the last decade, a trend uninterrupted by the ACA, is associated with forgoing needed care, especially among those of lower socioeconomic status,” the authors wrote. “Other changes in insurance benefit design, such as imposing tiered copayments and coinsurance obligations, eliminating coverage for some services (e.g., eyeglasses) and narrowing provider networks (which can force some patients to go out-of-network for care) may also have undermined the affordability of care.”
There was some positive news among the findings, however.
“The main encouraging finding from our analysis is the increase in the proportion of persons – both insured and uninsured – receiving cholesterol checks and flu shots,” Dr. Hawk and her colleagues wrote, adding that this increase “may be attributable to the increasing implementation of quality metrics, financial incentives, and improved systems for the delivery of these services.”
However, not all preventive services that had cost barriers eliminated under the ACA saw improvement, such as cancer screening. They note that the proportion of women who did not receive mammography increased during the study period and then plateaued, but did not improve following the implementation of the ACA. The authors described the reasons for this as “unclear.”
Dr. Hawks received funding support from an Institutional National Research Service award and from Cambridge Health Alliance, her employer. Other authors reported membership in Physicians for a National Health Program.
SOURCE: Hawks L et al. JAMA Intern Med. 2020 Jan 27. doi: 10.1001/jamainternmed.2019.6538.
FROM JAMA INTERNAL MEDICINE
Journal editors seek more complete disclosure from authors
A group of leading medical journal editors is seeking to improve the completeness and transparency of financial disclosure reporting with a proposed new disclosure form that puts more onus on readers to decide whether relationships and activities should influence how they view published papers.
The proposed changes are described in an editorial published simultaneously today in the Annals of Internal Medicine, British Medical Journal, Journal of the American Medical Association, The Lancet, New England Journal of Medicine, and several other journals whose editors are members of the International Committee of Medical Journal Editors (ICMJE).
“While no approach to disclosure will be perfect or foolproof, we hope the changes we propose will help promote transparency and trust,” the editorial stated (Ann Intern Med. 2020 Jan 27. doi: 10.7326/M19-3933).
The ICMJE adopted its currently used electronic form – the “ICMJE Form for the Disclosure of Potential Conflicts of Interest” – 10 years ago in an effort to create some uniformity amidst a patchwork of differing disclosure requirements for authors.
It’s not known how many journals outside of the ICMJE’s member journals routinely use the disclosure form, but the organization’s website houses an extensive list of journals whose editors or publishers have requested to be listed as following the ICMJE’s recommendations for editing, reporting, and publishing, including those concerning disclosures. The ICMJE does not “certify” journals. The full set of recommendations was updated in December 2019.
Most authors are committed to transparent reporting, but “opinions differ over which relationships or activities to report,” the editorial stated.
An author might choose to omit an item that others deem important because of a difference in opinion regarding “relevance,” confusion over definitions, or a simple oversight. Some authors may be “concerned that readers will interpret the listing of any item as a ‘potential conflict of interest’ as indicative of problematic influence and wrongdoing,” the editorial stated.
The revised form, like the current one, asks authors to disclose relationships and activities that are directly related to the reported work, as well as those that are topically related (within the broadly defined field addressed in the work). But unlike the current form, the new version provides a checklist of relationships and activities and asks authors to check ‘yes’ or ‘no’ for each one (and to name them when the answer is ‘yes’).
Items in the checklist include grants, payments/honoraria for lectures, patents issued or planned, stock/stock options, and leadership or fiduciary roles in committees, boards, or societies.
The proposed new form makes no mention of “potential conflicts of interest” or “relevancy,” per say. Authors aren’t asked to determine what might be interpreted as a potential conflict of interest, but instead are asked for a “complete listing” of what readers may find “pertinent” to their work.
“We’re trying to move away from calling everything a [potential] ‘conflict,’ ” Darren B. Taichman, MD, PhD, secretary of ICMJE and executive editor of the Annals of Internal Medicine, said in an interview. “We want to remove for authors the concern or stigma, if you will, that anything listed on a form implies that there is something wrong, because that’s just not true. … We want readers to decide what relationships are important as they interpret the work.”
Dr. Taichman said in the interview that the ICMJE’s updating of the form was more a function of “good housekeeping” and continuous appreciation of disclosure as an important issue, rather than any one specific issue, such as concern over a “relevancy” approach to disclosures.
The ICMJE is seeking feedback about its proposed form, which is available with a link for providing comments, at www.icmje.org.
Broader national efforts
Editors and others have been increasingly moving, however, toward asking for more complete disclosures where authors aren’t asked to judge “relevancy” and where readers can make decisions on their own. The American Society of Clinical Oncology, which produces the Journal of Clinical Oncology (JCO) as well as practice guidelines and continuing medical education programs, moved about 5 years ago to a system of general disclosure that asks physicians and others to disclose all financial interests and industry relationships, with no qualifiers.
Earlier in January 2020, the Accreditation Council for Continuing Medical Education issued proposed revisions to its Standards for Integrity and Independence in Accredited Continuing Education. These revisions, which are open for comment, require CME providers to collect disclosure information about all financial relationships of speakers and presenters. It’s up to the CME provider to then determine which relationships are relevant, according to the proposed document.
More change is on the way, as disclosure issues are being deliberated nationally in the wake of a highly publicized disclosure failure at Memorial Sloan Kettering Cancer Center in 2018. Chief medical officer José Baselga, MD, PhD, failed to report millions of dollars of industry payments and ownership interests in journal articles he wrote or cowrote over several years.
In February 2019, leaders from journals, academia, medical societies, and other institutions gathered in Washington for a closed-door meeting to hash out various disclosure related issues.
Hosted by the Association of American Medical Colleges and cosponsored by Memorial Sloan Kettering Cancer Center, ASCO, JAMA, and the Council of Medical Specialty Societies, the meeting led to a series of working groups that are creating additional recommendations “due out soon in 2020,” Heather Pierce, senior director of science policy and regulatory counsel for the AAMC, said in an interview.
Among the questions being discussed: What disclosures should be verified and who should do so? How can disclosures be made more complete and easier for researchers? And, “most importantly,” said Ms. Pierce, how can policy requirements across each of these sectors be aligned so that there’s more coordination and oversight – and with it, public trust?
Some critics of current disclosure policies have called for more reporting of compensation amounts, and Ms. Pierce said that this has been part of cross-sector discussions.
The ICMJE’s proposed form invites, but does not require, authors to indicate what payments were made to them or their institutions. “Part of this is due to the fact that it’s hard to define, let alone agree on, what’s an important amount,” Dr. Taichman said.
A push for registries
The ICMJE is also aiming to make the disclosure process more efficient for authors – and to eliminate inconsistent and incomplete disclosures – by accepting disclosures from web-based repositories, according to the editorial. Repositories allow authors to maintain an inventory of their relationships and activities and then create electronic disclosures that are tailored to the requirements of the ICMJE, medical societies, and other entities.
The AAMC-run repository, called Convey, is consistent with ICMJE reporting requirements and other criteria (e.g., there are no fees for individuals to enter, store, or export their data), but the development of other repositories may be helpful “for meeting regional, linguistic, and regulatory needs” of authors across the world, the editorial stated.
The Annals of Internal Medicine and the New England Journal of Medicine are both currently collecting disclosures through Convey. The platform was born from discussions that followed a 2009 Institute of Medicine report on conflicts of interest.
Signers of the ICMJE editorial include representatives of the National Library of Medicine and the World Association of Medical Editors, in addition to editors in chief and other leaders of the ICMJE member journals.
FROM ANNALS OF INTERNAL MEDICINE