User login
Behavioral treatment tied to lower medical, pharmacy costs
Results of a large retrospective study showed that patients newly diagnosed with a BHC who receive OPBHT following diagnosis incur lower medical and pharmacy costs over roughly the next 1 to 2 years, compared with peers who don’t receive OPBHT.
“Our findings suggest that promoting OPBHT as part of a population health strategy is associated with improved overall medical spending, particularly among adults,” the investigators write.
The study was published online in JAMA Network Open.
Common, undertreated
Nearly a quarter of adults in the United States have a BHC, and they incur greater medical costs than those without a BHC. However, diagnosis of a BHC is often delayed, and most affected individuals receive little to no treatment.
In their cost analysis, Johanna Bellon, PhD, and colleagues with Evernorth Health, St. Louis, analyzed commercial insurance claims data for 203,401 U.S. individuals newly diagnosed with one or more BHCs between 2017 and 2018.
About half of participants had depression and/or anxiety, 11% had substance use or alcohol use disorder, and 6% had a higher-acuity diagnosis, such as bipolar disorder, severe depression, eating disorder, psychotic disorder, or autism spectrum disorder.
About 1 in 5 (22%) had at least one chronic medical condition along with their BHC.
The researchers found that having at least one OPBHT visit was associated with lower medical and pharmacy costs during 15- and 27-month follow-up periods.
Over 15 months, the adjusted mean per member per month (PMPM) medical/pharmacy cost was $686 with no OPBHT visit, compared with $571 with one or more OPBHT visits.
Over 27 months, the adjusted mean PMPM was $464 with no OPBHT, versus $391 with one or more OPBHT visits.
Dose-response effect
In addition, there was a “dose-response” relationship between OPBHT and medical/pharmacy costs, such that estimated cost savings were significantly lower in the treated versus the untreated groups at almost every level of treatment.
“Our findings were also largely age independent, especially over 15 months, suggesting that OPBHT has favorable effects among children, young adults, and adults,” the researchers report.
“This is promising given that disease etiology and progression, treatment paradigms, presence of comorbid medical conditions, and overall medical and pharmacy costs differ among the three groups,” they say.
Notably, the dataset largely encompassed in-person OPBHT, because the study period preceded the transition into virtual care that occurred in 2020.
However, overall use of OPBHT was low – older adults, adults with lower income, individuals with comorbid medical conditions, and persons of racial and ethnic minorities were less likely to receive OPBHT, they found.
“These findings support the cost-effectiveness of practitioner- and insurance-based interventions to increase OPBHT utilization, which is a critical resource as new BHC diagnoses continue to increase,” the researchers say.
“Future research should validate these findings in other populations, including government-insured individuals, and explore data by chronic disease category, over longer time horizons, by type and quality of OPBHT, by type of medical spending, within subpopulations with BHCs, and including virtual and digital behavioral health services,” they suggest.
The study had no specific funding. The authors have disclosed no relevant financial relationships.
A version of this article first appeared on Medscape.com.
FROM JAMA NETWORK OPEN
Aerobic exercise augments PTSD therapy
Investigators randomly assigned individuals with PTSD to receive either exposure therapy with aerobic exercise or exposure therapy with passive stretching for 9 weeks. At 6 months post intervention, participants in the aerobic exercise group showed greater reductions in PTSD severity, compared with those in the stretching group.
“There is a critical need to improve outcomes for treating people with PTSD, and this finding points to one potentially cheap and ready-to-use strategy that all clinicians could employ with most patients,” lead author Richard Bryant, MPsych, PhD, DSc, director of the Traumatic Stress Clinic and Scientia Professor of Psychology at the University of New South Wales, Sydney, told this news organization.
The study was published online in The Lancet Psychiatry.
Promoting BDNF
“Trauma-focused psychotherapy is the recommended treatment for PTSD, but up to half of patients do not respond to this treatment,” Dr. Bryant said.
“We know that brain-derived neurotrophic factors [BDNF] are critical for synaptic plasticity, which underpins the learning that occurs in therapy so that reminders of trauma are no longer fear-provoking,” he continued. “Preclinical animal and human research inform us that brief aerobic exercise can promote BDNF and new learning that inhibits fear responses.”
The researchers “hypothesized that brief exercise after exposure therapy to trauma memories – which is the key ingredient of trauma-focused psychotherapy – would lead to greater reductions in PTSD, relative to standard trauma-focused therapy,” he said.
To investigate the question, the researchers randomly assigned 130 adults with PTSD (mean age, 39 years; 61% female; 76% White) to receive nine 90-minute sessions of exposure therapy with either aerobic exercise or passive stretching (n = 65 in each group).
There were no differences at baseline in sociodemographic characteristics or psychopathology measures, although the mean age of the stretching group was slightly older than that of the aerobic group (40 years vs. 37 years, respectively), and there was a slightly higher proportion of women in the stretching group (68% vs. 54%).
Participants did not differ on weekly exercise either at baseline, immediately post treatment, or at 6-week follow-up.
PTSD severity (the primary outcome) was measured using the clinician-administered PTSD scale CAPS-2, with assessments conducted at baseline, 1 week post treatment, and 6 months post treatment.
The aerobic exercise regimen was tailored to each participant, based on an assessment of his/her aerobic target zone.
The exposure therapy sessions were identical for both groups. Following the exposure sessions, participants engaged in their respective exercises: Those in the passive stretching group engaged in 20 minutes of exercise, while those in the aerobic group participated in a total of 20 minutes of exercise, with 10 conducted at their personal aerobic target heart rate.
“This level of exercise was chosen because BDNF concentration in the serum is increased by two 3-minute bouts of aerobic exercise, and 10 minutes of aerobic exercise can facilitate extinction learning,” the authors explained.
The aerobic activity consisted of running on a stepper exercise platform while having cardiac activity recorded. A small portion (10%) of the therapy sessions were recorded and rated for treatment fidelity.
Change in PTSD was the primary outcome, with secondary outcomes consisting of changes in depression, anxiety, alcohol use disorder, and posttraumatic cognitions.
Few barriers
The researchers found no significant differences in PTSD severity, as measured by CAPS-2 score, between treatment groups at 10 weeks – that is, immediately post treatment (mean difference, 7.0; 95% confidence interval, –2.3 to 16.4; P = .14).
However, significantly greater reductions in PTSD severity were found in the aerobic versus the stretching group at 6-month follow-up (mean difference, 12.1;95% CI, 2.4-21.8; P = .023), pointing to a “moderate effect size” (d = 0.6; 95% CI, 0.1-1.1]).
Although there were no differences found at 6-month assessment between rates of PTSD diagnosis (25% of the aerobic vs 27% of the stretching group), more participants in the aerobic group reached a “minimal clinically important difference,” compared to those in the stretching group (96% vs. 84%, respectively, x2 = 4.4; P = .036).
There were also superior benefits found in the aerobic versus the stretching group on depression severity at 6 months (a secondary outcome), with a mean difference in Beck Depression Inventory-2 score of 5.7 (95% CI, 0.5-10.9; P = .022), yielding a “moderate effect size” (d = 0.5; 95% CI, 0.1-1.0]).
There were no adverse events associated with the intervention, and almost all the sessions (88%) complied with the treatment protocol.
The researchers noted several limitations. For example, they did not obtain plasma to measure BDNF concentrations, so they could not “infer whether the mechanism of change involved BDNF.”
In addition, they did not perform sex-specific analyses. “Future studies could increase the sample size to investigate sex differences because females display less BDNF change following exercise than do males,” they wrote.
Nevertheless, the study “provides initial evidence of a simple and accessible strategy that clinicians could readily apply in combination with exposure therapy,” they stated. “Whereas many pharmacologic interventions pose barriers, including cost, requirement for prescriptions, and patient resistance to drugs, exercise offers clinicians a strategy that can be implemented with few barriers.”
Dr. Bryant emphasized that one study “does not represent a body of evidence, and so it is essential that this finding be replicated in other trials before it can be recommended for clinical use.” He noted that other trials are “currently underway.”
Easy augmentation
In a comment, Barbara Rothbaum, PhD, professor in psychiatry and director of the Trauma and Anxiety Recovery Program at Emory University, Atlanta, called it a “well-controlled trial augmenting exposure therapy for PTSD with brief aerobic exercise and finding some benefits of the augmented condition at 6 months posttreatment but not immediately posttreatment.”
The study’s methodology – that is, using independent standard assessment of PTSD and rating audio recordings of therapy sessions for treatment fidelity and quality – can lead us to “be confident in their [the researchers’] conclusions,” she said.
Dr. Rothbaum, who was not associated with this study, described research into methods to augment exposure therapy for PTSD as “timely and clinically relevant.”
Exercise “would be an easy augmentation for many clinicians if it is helpful,” she noted.
The study was funded by the Australian National Health and Medical Research Council. The authors and Dr. Rothbaum reported no relevant financial relationships.
A version of this article first appeared on Medscape.com.
FROM THE LANCET PSYCHIATRY
Antipsychotic shows benefit for Alzheimer’s agitation
SAN FRANCISCO – In a widely anticipated report,
Members of a panel of dementia specialists here at the 15th Clinical Trials on Alzheimer’s Disease (CTAD) conference said that the results were encouraging. But they also noted that the available data make it difficult to understand the impact of the drug on the day-to-day life on patients.
“I’d like to be able to translate that into something else to understand the risk benefit calculus,” said neurologist and neuroscientist Alireza Atri, MD, PhD, of Banner Sun Health Research Institute in Phoenix. “How does it affect the patients themselves, their quality of life, and the family members and their burden?”
Currently, there’s no Food and Drug Administration–approved treatment for agitation in AD.
In 2015, the FDA approved brexpiprazole, an oral medication, as a treatment for schizophrenia and an adjunctive treatment for major depressive disorder (MDD). It is an expensive drug with an average retail price per GoodRx of $1,582 per month, and no generic is available.
Researchers released the results of a trio of phase 3 clinical trials at CTAD that examined various doses of brexpiprazole. The results of the first two trials had been released earlier in 2018.
Three trials
All trials were multicenter, 12-week, randomized, double-blind and placebo-controlled.
Study participants were aged 55-90 years, had probable AD diagnoses, and had agitation per various scales. The average age in the groups was 74 years, 56.0%-61.7% were women, and 94.3%-98.1% were White.
The first trial examined two fixed doses (1 mg/d, n = 137; and 2 mg/d, n = 140) or placebo (n = 136). “The study initially included a 0.5 mg/day arm,” the researchers reported, “which was removed in a protocol amendment, and patients randomized to that arm were not included in efficacy analyses.”
The second trial looked at a flexible dose (0.5-2 mg/d, n = 133) or placebo (n = 137).
In a CTAD presentation, Nanco Hefting of Lundbeck, a codeveloper of the drug, said that the researchers learned from the first two trials that 2 mg/d might be an appropriate dose, and the FDA recommended they also examine 3 mg/day. As a result, the third trial examined two fixed doses (2 mg/d, n = 75; 3 mg/d, n = 153; or placebo, n = 117).
In the third trial, both the placebo and drug groups improved per a measurement of agitation; those in the drug group improved somewhat more.
The mean change in baseline on the Cohen-Mansfield Agitation Inventory scale – the primary endpoint – was –5.32 for the 2-mg/d and 3-mg/d groups vs. placebo (P = .0026); the score in the placebo group fell by about 18 and by about 22 in the drug group.
The key secondary endpoint was an improvement from baseline to week 12 in the Clinical Global Impression–Severity (CGI-S) score related to agitation. Compared with the placebo group, this score was –0.27 in the drug group (P = .0078). Both scores hovered around –1.0.
Safety data show the percentage of treatment-emergent events ranged from 45.9% in the placebo group to 49.0%-56.8% for brexpiprazole in the three trials. The percentage of these events leading to discontinuation was 6.3% among those receiving the drug and 3.4% in the placebo group.
University of Exeter dementia researcher Clive Ballard, MD, MB ChB, one of the panelists who discussed the research after the CTAD presentation, praised the trials as “well-conducted” and said that he was pleased that subjects in institutions were included. “It’s not an easy environment to do trials in. They should be really commended for doing for doing that.”
But he echoed fellow panelist Dr. Atri by noting that more data are needed to understand how well the drug works. “I would like to see the effect sizes and a little bit more detail to understand the clinical meaningfulness of that level of benefit.”
What’s next? A spokeswoman for Otsuka, a codeveloper of brexpiprazole, said that it hopes to hear in 2023 about a supplemental new drug application that was filed in November 2022.
Otsuka and Lundbeck funded the research. Mr. Hefting is an employee of Lundbeck, and several other authors work for Lundbeck or Otsuka. The single non-employee author reports various disclosures. Disclosures for Dr. Atri and Dr. Ballard were not provided.
A version of this article first appeared on Medscape.com.
AT CTAD 2022
Mindfulness, exercise strike out in memory trial
Welcome to Impact Factor, your weekly dose of commentary on a new medical study. I’m Dr. F. Perry Wilson of the Yale School of Medicine.
We are coming to the end of the year, which always makes me think about getting older. Much like the search for the fountain of youth, many promising leads have ultimately led to dead ends. And yet, I had high hopes for a trial that focused on two cornerstones of wellness – exercise and mindfulness – to address the subjective loss of memory that comes with aging. Alas, meditation and exercise do not appear to be the fountain of youth.
I’m talking about this study, appearing in JAMA, known as the MEDEX trial.
It’s a clever design: a 2 x 2 factorial randomized trial where participants could be randomized to a mindfulness intervention, an exercise intervention, both, or neither.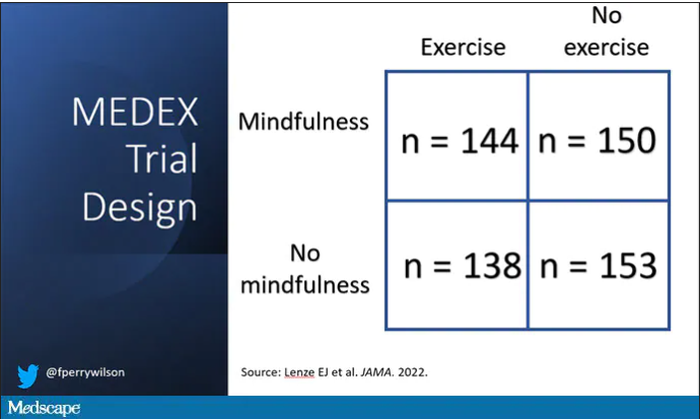
In this manner, you can test multiple hypotheses exploiting a shared control group. Or as a mentor of mine used to say, you get two trials for the price of one and a half.
The participants were older adults, aged 65-84, living in the community. They had to be relatively sedentary at baseline and not engaging in mindfulness practices. They had to subjectively report some memory or concentration issues but had to be cognitively intact, based on a standard dementia screening test. In other words, these are your average older people who are worried that they aren’t as sharp as they used to be.
The interventions themselves were fairly intense. The exercise group had instructor-led sessions for 90 minutes twice a week for the first 6 months of the study, once a week thereafter. And participants were encouraged to exercise at home such that they had a total of 300 minutes of weekly exercise.
The mindfulness program was characterized by eight weekly classes of 2.5 hours each as well as a half-day retreat to teach the tenets of mindfulness and meditation, with monthly refreshers thereafter. Participants were instructed to meditate for 60 minutes a day in addition to the classes.
For the 144 people who were randomized to both meditation and exercise, this trial amounted to something of a part-time job. So you might think that adherence to the interventions was low, but apparently that’s not the case. Attendance to the mindfulness classes was over 90%, and over 80% for the exercise classes. And diary-based reporting of home efforts was also pretty good.
The control group wasn’t left to their own devices. Recognizing that the community aspect of exercise or mindfulness classes might convey a benefit independent of the actual exercise or mindfulness, the control group met on a similar schedule to discuss health education, but no mention of exercise or mindfulness occurred in that setting.
The primary outcome was change in memory and executive function scores across a battery of neuropsychologic testing, but the story is told in just a few pictures.
Memory scores improved in all three groups – mindfulness, exercise, and health education – over time. Cognitive composite score improved in all three groups similarly. There was no synergistic effect of mindfulness and exercise either. Basically, everyone got a bit better.
But the study did way more than look at scores on tests. Researchers used MRI to measure brain anatomic outcomes as well. And the surprising thing is that virtually none of these outcomes were different between the groups either.
Hippocampal volume decreased a bit in all the groups. Dorsolateral prefrontal cortex volume was flat. There was no change in scores measuring tasks of daily living.
When you see negative results like this, right away you worry that the intervention wasn’t properly delivered. Were these people really exercising and meditating? Well, the authors showed that individuals randomized to exercise, at least, had less sleep latency, greater aerobic fitness, and greater strength. So we know something was happening.
They then asked, would the people in the exercise group with the greatest changes in those physiologic parameters show some improvement in cognitive parameters? In other words, we know you were exercising because you got stronger and are sleeping better; is your memory better? The answer? Surprisingly, still no. Even in that honestly somewhat cherry-picked group, the interventions had no effect.
Could it be that the control was inappropriate, that the “health education” intervention was actually so helpful that it obscured the benefits of exercise and meditation? After all, cognitive scores did improve in all groups. The authors doubt it. They say they think the improvement in cognitive scores reflects the fact that patients had learned a bit about how to take the tests. This is pretty common in the neuropsychiatric literature.
So here we are and I just want to say, well, shoot. This is not the result I wanted. And I think the reason I’m so disappointed is because aging and the loss of cognitive faculties that comes with aging are just sort of scary. We are all looking for some control over that fear, and how nice it would be to be able to tell ourselves not to worry – that we won’t have those problems as we get older because we exercise, or meditate, or drink red wine, or don’t drink wine, or whatever. And while I have no doubt that staying healthier physically will keep you healthier mentally, it may take more than one simple thing to move the needle.
Dr. Wilson is associate professor, department of medicine, and director of the Clinical and Translational Research Accelerator at Yale University, New Haven, Conn. He reported no conflicts of interest.
A version of this article first appeared on Medscape.com.
Can a Mediterranean diet ease depression in young men?
This transcript has been edited for clarity.
Drew Ramsey, MD: Welcome back, everyone. I’m Dr. Drew Ramsey. I’m on the editorial board with Medscape Psychiatry and I’m an assistant clinical professor of psychiatry at Columbia University. We have a special guest today.
I’m here with nutritionist Jessica Bayes, who’s at the University of Technology Sydney, and she’s the lead author of the AMMEND trial. [Editor’s note: Since completing her PhD, Bayes is now at Southern Cross University.]
Jessica, welcome to Medscape.
Jessica Bayes, PhD: Thank you for having me.
The AMMEND Trial
Dr. Ramsey: Thank you for coming on board and helping all of us as clinicians understand some of your research and some of what is suggested by your research – that young men can change their diet and it helped their depression. Tell us a little bit about the AMMEND trial.
Dr. Bayes: The AMMEND trial was a 12-week randomized controlled trial in young men, 18-25 years old, who had diagnosed moderate to severe clinical depression. They had a poor baseline diet and we got them to eat a healthy Mediterranean diet, which improved their symptoms of depression.
Dr. Ramsey: It was a remarkable trial. Jessica, if I recall, you helped individuals improve the Mediterranean dietary pattern score by 8 points on a 14-point scale. That led to a 20-point reduction in their Beck Depression Inventory. Tell us what that looked like on the ground.
Dr. Bayes: It’s a huge improvement. Obviously, they were feeling much better in the end in terms of their depressive symptoms, but we also measured their energy, sleep, and quality of life. Many of them at the end were at a score cutoff that suggests no depression or in remission.
Dr. Ramsey: There were 72 people in your total trial, so 36% in your intervention arm went into full remission.
Dr. Bayes: Which is just amazing.
Dr. Ramsey: It also follows up the SMILES trial, which was a little bit of a different trial. You had two nutritional counseling sessions and the SMILES trial had seven, but in the SMILES trial, 32.3% of the patients went into full remission when they adopted a Mediterranean-style diet.
Jessica, what is the secret that you and your team know? I think many clinicians, especially clinicians who are parents and have teens, are kind of shaking their heads in disbelief. They’ve been telling their kids to eat healthy. What do you guys know about how to help young men change their diet?
How to Aid Adherence to Mediterranean Diet
Dr. Bayes: Prior to starting this, when I would say this idea to people, everyone would say, “Great idea. There’s no way you’re going to get depressed young men to change their diet. Not going to happen.” We went to them and we asked them. We said, “We’re going to do this study. What do you want from us? What resources would you need? How many appointments would you like? What’s too little or too many?”
We really got their feedback on board when we designed the study, and that obviously paid off. We had a personalized approach and we met them where they were at. We gave them the skills, resources, recipes, meal ideas – all those things – so we could really set them up to succeed.
Dr. Ramsey: You were telling me earlier about a few of the dietary changes that you felt made a big difference for these young men. What were those?
Dr. Bayes: Increasing the vegetables, olive oil, and legumes are probably the big ones that most of them were really not doing beforehand. They were really able to take that on board and make significant improvements in those areas.
Dr. Ramsey: These are really some of the top food categories in nutritional psychiatry as we think about how we help our efforts to improve mental health by thinking about nutrition, nutritional quality, and nutritional density. Certainly, those food categories – nuts and legumes, plants, and olive oil – are really what help get us there.
You also gave the students a food hamper. If you were going to be in charge of mental health in Australia and America and you got to give every college freshman a little box with a note, what would be in that box?
Dr. Bayes: I’d want to put everything in that box! It would be full of brightly colored fruits and vegetables, different nuts and seeds, and legumes. It would be full of recipes and ideas of how to cook things and how to prepare really delicious things. It would be full of different herbs and spices and all of those things to get people really excited about food.
Dr. Ramsey: Did the young men pick up on your enthusiasm and excitement around food? Did they begin to adopt some of that, shifting their view of how they saw the food and how they saw that it is related to their depression?
Dr. Bayes: Hopefully. I do think energy is infectious. I’m sure that played a role somewhat, but trying to get them excited about food can be really quite daunting, thinking, I’ve got to change my entire diet and I’ve got to learn to cook and go out and buy groceries. I don’t even know what to do with a piece of salmon. Trying to get them curious, interested, and just reminding them that it’s not all-or-nothing. Make small changes, give it a go, and have fun.
Dr. Ramsey: You also have a unique aspect of your research that you’re interested in male mental health, and that’s not something that’s been widely researched. Can you tell us a little bit about what these men were like in terms of coming into your trial as depressed young men?
Dr. Bayes: In the context of the COVID-19 pandemic, mental health was at the forefront of many people’s minds. They joined the study saying, “I’ve never seen anything like this before. I’ve never seen myself represented in research. I wanted to contribute. I want to add to that conversation because I feel like we are overlooked.”
Dr. Ramsey: I love hearing this notion that maybe young men aren’t quite who we think they are. They are wanting to be seen around their mental health. They can learn to use olive oil and to cook, and they can engage in mental health interventions that work. We just need to ask, give them some food, encourage them, and it makes a big difference.
Jessica Bayes, thank you so much for joining us and sharing some of your research. Everyone, it’s the AMMEND trial. We will drop a link to the trial below so you can take a peek and tell us what you think.
Please, in the comments, let us know what you think about this notion of helping young men with depression through nutritional interventions. Take a peek at the great work that Jessica and Professor Sibbritt from the University of Technology Sydney have published and put out into the scientific literature for us all.
Thanks so much, Jessica. I look forward to seeing you soon.
Dr. Bayes: Thank you.
Dr. Ramsey is assistant clinical professor, department of psychiatry, Columbia University, New York. He has disclosed the following relevant financial relationships:
Serve(d) as a director, officer, partner, employee, advisor, consultant, or trustee for InterContinental Hotels Group; National Kale Day 501(c)3. Received income in an amount equal to or greater than $250 from: Sharecare. Dr. Bayes is a postdoctoral research fellow; clinical nutritionist, Southern Cross University, National Center for Naturopathic Medicine, Lismore, New South Wales, Australia. She has disclosed the following relevant financial relationships: Received research grant from Endeavour College. A version of this article first appeared on Medscape.com.
Terminally ill cancer patients struggle to access psilocybin
In March 2020, when the world was struck by the news of the COVID-19 pandemic, Erinn Baldeschwiler received her own gut punch. She was diagnosed with stage IV metastatic breast cancer and was given about 2 years to live.
Then 48, the mother of two teenagers had just started a new chapter in her life. She’d gotten divorced, moved to a new home, and left a small business she had spent 18 years cultivating. The prospect that her life story might soon be ending, that she wouldn’t see her children grow up, was a twist of fate almost too devastating to bear.
“Are you kidding me that this is happening?” she thought.
But she also wanted to keep learning and growing in her remaining years, to devote them to creating meaningful memories, contemplating her mortality, and trying to find inner peace.
“The last 2 years have kind of been this dance with Lady Death,” she said.
They have also been a dance with Lady Justice.
In March 2021, Ms. Baldeschwiler, along with Michal Bloom, who also has terminal cancer, and their palliative care physician, Sunil Aggarwal, MD, PhD, decided to sue the Drug Enforcement Administration (DEA) for the right to access psilocybin, the psychoactive ingredient in “magic” mushrooms.
Psilocybin-assisted therapy has been shown to help terminally ill people overcome their fear, anxiety, and despair about death and to experience the kind of peace Ms. Baldeschwiler is seeking.
Psilocybin is illegal in the United States, but the plaintiffs argue they should be able to take the substance through the Right to Try Act. The 2018 federal law says that people with life-threatening conditions who have exhausted all approved treatment options can access drugs that have not yet been approved by the Food and Drug Administration but have passed phase 1 clinical trials.
This case marks the first time patients have fought to use a Schedule I drug under the Right to Try Act.
The push to expand access to psilocybin is picking up steam in the United States. In 2023, facilitated use of psilocybin will become legal in Oregon and Colorado. Recent proposals from the Biden administration and members of Congress could make psilocybin more widely accessible in the next few years.
It is also gaining momentum outside the United States. In Canada, patients are suing the government to help patients obtain psilocybin-assisted therapy for medical purposes.
“I think what we have here is a confluence of events that are driving toward the mandatory opening of a path to access psilocybin for therapeutic use sooner rather than later,” said Kathryn Tucker, lead counsel in the case against the DEA.
Reverberations of Right to Try
The story of Right to Try began with Abigail Burroughs, who was diagnosed with head and neck cancer at age 19.
After conventional therapies failed, Ms. Burroughs’ oncologist recommended cetuximab, a drug targeting EGFR that was experimental at the time. Because the drug was available only through colon cancer trials, she was denied access.
She died in 2001 at age 21.
Ms. Burroughs’ father, Frank Burroughs, formed an organization that in 2003 sued the FDA to provide terminally ill patients access to unapproved drugs. In 2005, they lost, and subsequent attempts to appeal the decision failed.
Still, the case sparked a Right to Try movement.
“Right to Try laws swept the U.S. in a firestorm,” Ms. Tucker said.
Along with the federal law, which passed in 2018, 41 states have enacted Right to Try laws.
The movement intrigued Dr. Aggarwal, codirector of the Advanced Integrative Medical Science (AIMS) Institute in Seattle. Dr. Aggarwal had been treating patients with cannabis, and after taking psilocybin himself and finding it therapeutic, he thought Ms. Baldeschwiler could benefit.
“I always knew that the powerful medicines within Schedule I had a significant role to play in healing,” he said. “That was baked into my decision to become a doctor, to research, and to innovate.”
He applied for the right to cultivate psilocybin mushrooms, but the fungus doesn’t meet Right to Try requirements. He then found a manufacturer willing to supply synthesized psilocybin, but because it’s a Schedule I drug, the manufacturer needed an okay from the DEA.
Dr. Aggarwal joined forces with Ms. Tucker, who has spent 35 years protecting the rights of terminally ill patients. In January 2021, Ms. Tucker contacted the DEA about allowing dying patients, including Ms. Baldeschwiler and Mr. Bloom, to access psilocybin-assisted therapy.
The response, she said, was predictable.
“The DEA’s knee always jerks in the direction of no access,” Ms. Tucker said. “So it said ‘no access.’ “
The reason: In a letter dated February 2021, the DEA said it “has no authority to waive” any requirements of the Controlled Substances Act under Right to Try laws.
Suing the DEA
Dr. Aggarwal and Ms. Tucker did not accept the DEA’s “no access” answer.
They decided to sue.
Dr. Aggarwal and Ms. Tucker took the matter to the Ninth Circuit Court in March 2021. In January 2022, the court dismissed the case after the DEA claimed its initial denial was not final.
The following month, the plaintiffs petitioned the DEA to deliver a concrete answer.
In May, while waiting for a response, demonstrators gathered at the DEA’s headquarters to call for legal access to psilocybin. One of the protesters was Ms. Baldeschwiler, who choked back tears as she told the crowd she was likely missing her last Mother’s Day with her children to attend the event. She was arrested, along with 16 other people.
In late June, the DEA provided its final answer: No access.
In a letter addressed to Ms. Tucker, Thomas W. Prevoznik, the DEA’s deputy assistant administrator, said it “finds no basis” to reconsider its initial denial in February 2021 “because the legal and factual considerations remain unchanged.”
In an appeal, Ms. Tucker wrote: “In denying Petitioners’ requested accommodation in the Final Agency Action, DEA hides behind a smokescreen, neglecting its duty to implement the federal [Right to Try Act] and violating the state [Right to Try law].”
The government’s response is due in January 2023.
Ms. Tucker and her legal team also petitioned the DEA on behalf of Dr. Aggarwal to reschedule psilocybin from Schedule I to Schedule II.
The DEA defines Schedule I substances as “drugs with no currently accepted medical use and a high potential for abuse.” But the FDA has designated psilocybin as a breakthrough therapy for depression, which, Ms. Tucker noted, “reflects that there is a currently accepted medical use.”
Nevertheless, in September, the DEA denied Ms. Tucker’s petition to reschedule psilocybin, and her team is now petitioning the Ninth Circuit Court for a review of that decision.
Despite the setbacks, actions from the Biden administration and members of Congress could help improve access.
In July, Senators Cory Booker and Rand Paul introduced the Right to Try Clarification Act to clarify that the federal law includes Schedule I substances. If passed, Ms. Tucker said, it would negate the DEA’s “no access” argument.
And earlier this year, the Biden administration announced plans to establish a federal task force to address the “myriad of complex issues” associated with the anticipated FDA approval of psilocybin to treat depression. The task force will explore “the potential of psychedelic-assisted therapies” to tackle the mental health crisis as well as any “risks to public health” that “may require harm reduction, risk mitigation, and safety monitoring.”
The fight north of the border
In 2016, Canadian resident Thomas Hartle, then 48, awoke from surgery for a bowel obstruction to learn he had stage IV colon cancer.
After another surgery, his doctors believed the tumors were gone. But in 2019, the cancer came back, along with extreme anxiety and distress over his impending death and how his two special-needs children would cope.
Mr. Hartle wanted to try magic mushroom–assisted psychotherapy. The Saskatoon resident sought help from TheraPsil, a Canadian nonprofit organization that advocates for therapeutic psilocybin. They applied for access under Section 56, which allows health officials to exempt patients from certain provisions of drug law.
In 2020, Hartle became the first Canadian to legally obtain psilocybin-assisted therapy.
“It has been nothing short of life changing for me,” Mr. Hartle said at a palliative care conference in Saskatoon this past June. “I am now no longer actively dying. I feel like I am genuinely actively living.”
TheraPsil has obtained Section 56 exemptions for around 60 patients to access psilocybin-assisted therapy as well as 19 health care professionals who are training to become psilocybin-assisted therapists.
But then an election ushered in new health ministers, and in early 2022, the exemptions evaporated. Thousands of patients and health care practitioners on TheraPsil’s waiting list were left in limbo.
Health Canada told CBC News that the rule change came about because “while psilocybin has shown promise in clinical trials for the treatment of some indications, further research is still needed to determine its safety and efficacy.”
As an alternative, TheraPsil began applying for access under Canada’s Special Access Program, which is similar to Right to Try laws in the United States. But Canada’s program doesn’t apply to therapists in training, and the petition process is so slow that many patients die before requests can be approved.
“People like to pretend that the Special Access Program is not political, but it is very political,” said TheraPsil’s CEO, Spencer Hawkswell. “It means a patient and a doctor are asking a politician for access to their medicine, which is absolutely unacceptable.”
Now, TheraPsil is helping patients take the Canadian government to court. In July, Mr. Hartle and seven others with conditions ranging from cancer to chronic pain filed a lawsuit against Canada’s health ministry that challenges the limited legal pathways to the use of psilocybin. The lawsuit argues that patients have a “constitutional right to access psilocybin for medicinal purposes,” and it advocates for access to regulated psilocybin products from licensed dealers, much like Canada’s medical marijuana program already does.
In the filing, TheraPsil said that as of February 2022, it has a wait-list of more than 800 patients who are requesting help in obtaining psilocybin-assisted psychotherapy.
An uncertain future
Despite the groundswell of support, many unknowns remain about the safety of expanding access to psilocybin-assisted therapy.
When Oregon and Colorado launch their psilocybin programs in 2023, the licensed centers will provide testing grounds for the safety and efficacy of broader access to psilocybin for people with depression or terminal cancer as well as those looking to grow spiritually.
Although in clinical trials psilocybin has been found to ease symptoms of depression and end-of-life demoralization for people with life-threatening conditions, it has not been adequately tested in people with a range of mental health problems, traumas, and racial backgrounds.
That uncertainty has given some people pause. In recent months, some researchers and journalists have pushed back against the frenzy over the promise of psychedelics.
In September, David Yaden, PhD, a psychedelics researcher at Johns Hopkins, spoke at the Interdisciplinary Conference on Psychedelic Research in the Netherlands. He encouraged people to pay more attention to potential adverse effects of psychedelics, which could include anything from headaches to lingering dysphoria.
“Oftentimes, we hear only the positive anecdotes,” Dr. Yaden said. “We don’t hear ... neutral or negative ones. So, I think all of those anecdotes need to be part of the picture.”
A recent piece in Wired noted that mentioning the potential harms of psychedelics amid its renaissance has been “taboo,” but the authors cautioned that as clinical trials involving psychedelics grow larger and the drugs become commercialized, “more negative outcomes are likely to transpire.”
But Ms. Baldeschwiler remains steadfast in her pursuit. While it’s important to approach broader access to psychedelics with caution, “end-of-life patients don’t have time to wait,” she said.
A version of this article first appeared on Medscape.com.
Immune dysregulation may drive long-term postpartum depression
Postpartum depression, anxiety, and posttraumatic stress disorder that persist 2-3 years after birth are associated with a dysregulated immune system that is characterized by increased inflammatory signaling, according to investigators.
These findings suggest that mental health screening for women who have given birth should continue beyond the first year post partum, reported lead author Jennifer M. Nicoloro-SantaBarbara, PhD, of Brigham and Women’s Hospital, Harvard Medical School, Boston, and colleagues.
“Delayed postpartum depression, also known as late-onset postpartum depression, can affect women up to 18 months after delivery,” the investigators wrote in the American Journal of Reproductive Immunology. “It can appear even later in some women, depending on the hormonal changes that occur after having a baby (for example, timing of weaning). However, the majority of research on maternal mental health focuses on the first year post birth, leaving a gap in research beyond 12 months post partum.”
To address this gap, the investigators enrolled 33 women who were 2-3 years post partum. Participants completed self-guided questionnaires on PTSD, depression, and anxiety, and provided blood samples for gene expression analysis.
Sixteen of the 33 women had clinically significant mood disturbances. and significantly reduced activation of genes associated with viral response.
“The results provide preliminary evidence of a mechanism (e.g., immune dysregulation) that might be contributing to mood disorders and bring us closer to the goal of identifying targetable biomarkers for mood disorders,” Dr. Nicoloro-SantaBarbara said in a written comment. “This work highlights the need for standardized and continual depression and anxiety screening in ob.gyn. and primary care settings that extends beyond the 6-week maternal visit and possibly beyond the first postpartum year.”
Findings draw skepticism
“The authors argue that mothers need to be screened for depression/anxiety longer than the first year post partum, and this is true, but it has nothing to do with their findings,” said Jennifer L. Payne, MD, an expert in reproductive psychiatry at the University of Virginia, Charlottesville.

In a written comment, she explained that the cross-sectional design makes it impossible to know whether the mood disturbances were linked with delivery at all.
“It is unclear if the depression/anxiety symptoms began after delivery or not,” Dr. Payne said. “In addition, it is unclear if the findings are causative or a result of depression/anxiety symptoms (the authors admit this in the limitations section). It is likely that the findings are not specific or even related to having delivered a child, but rather reflect a more general process related to depression/anxiety outside of the postpartum time period.”
Only prospective studies can answer these questions, she said.
Dr. Nicoloro-SantaBarbara agreed that further research is needed.
“Our findings are exciting, but still need to be replicated in larger samples with diverse women in order to make sure they generalize,” she said. “More work is needed to understand why inflammation plays a role in postpartum mental illness for some women and not others.”
The study was supported by a Cedars-Sinai Precision Health Grant, the Cousins Center for Psychoneuroimmunology, University of California, Los Angeles, and the National Institute of Mental Health. The investigators and Dr. Payne disclosed no relevant conflicts of interest.
Postpartum depression, anxiety, and posttraumatic stress disorder that persist 2-3 years after birth are associated with a dysregulated immune system that is characterized by increased inflammatory signaling, according to investigators.
These findings suggest that mental health screening for women who have given birth should continue beyond the first year post partum, reported lead author Jennifer M. Nicoloro-SantaBarbara, PhD, of Brigham and Women’s Hospital, Harvard Medical School, Boston, and colleagues.
“Delayed postpartum depression, also known as late-onset postpartum depression, can affect women up to 18 months after delivery,” the investigators wrote in the American Journal of Reproductive Immunology. “It can appear even later in some women, depending on the hormonal changes that occur after having a baby (for example, timing of weaning). However, the majority of research on maternal mental health focuses on the first year post birth, leaving a gap in research beyond 12 months post partum.”
To address this gap, the investigators enrolled 33 women who were 2-3 years post partum. Participants completed self-guided questionnaires on PTSD, depression, and anxiety, and provided blood samples for gene expression analysis.
Sixteen of the 33 women had clinically significant mood disturbances. and significantly reduced activation of genes associated with viral response.
“The results provide preliminary evidence of a mechanism (e.g., immune dysregulation) that might be contributing to mood disorders and bring us closer to the goal of identifying targetable biomarkers for mood disorders,” Dr. Nicoloro-SantaBarbara said in a written comment. “This work highlights the need for standardized and continual depression and anxiety screening in ob.gyn. and primary care settings that extends beyond the 6-week maternal visit and possibly beyond the first postpartum year.”
Findings draw skepticism
“The authors argue that mothers need to be screened for depression/anxiety longer than the first year post partum, and this is true, but it has nothing to do with their findings,” said Jennifer L. Payne, MD, an expert in reproductive psychiatry at the University of Virginia, Charlottesville.
In a written comment, she explained that the cross-sectional design makes it impossible to know whether the mood disturbances were linked with delivery at all.
“It is unclear if the depression/anxiety symptoms began after delivery or not,” Dr. Payne said. “In addition, it is unclear if the findings are causative or a result of depression/anxiety symptoms (the authors admit this in the limitations section). It is likely that the findings are not specific or even related to having delivered a child, but rather reflect a more general process related to depression/anxiety outside of the postpartum time period.”
Only prospective studies can answer these questions, she said.
Dr. Nicoloro-SantaBarbara agreed that further research is needed.
“Our findings are exciting, but still need to be replicated in larger samples with diverse women in order to make sure they generalize,” she said. “More work is needed to understand why inflammation plays a role in postpartum mental illness for some women and not others.”
The study was supported by a Cedars-Sinai Precision Health Grant, the Cousins Center for Psychoneuroimmunology, University of California, Los Angeles, and the National Institute of Mental Health. The investigators and Dr. Payne disclosed no relevant conflicts of interest.
FROM THE AMERICAN JOURNAL OF REPRODUCTIVE IMMUNOLOGY
‘Striking’ rate of mental health comorbidities in epilepsy
NASHVILLE, TENN. – , new research reveals.
“We hope these results inspire epileptologists and neurologists to both recognize and screen for suicide ideation and behaviors in their adolescent patients,” said study investigator Hadley Greenwood, a third-year medical student at New York University.
The new data should also encourage providers “to become more comfortable” providing support to patients, “be that by increasing their familiarity with prescribing different antidepressants or by being well versed in how to connect patients to resources within their community,” said Mr. Greenwood.
The findings were presented here at the annual meeting of the American Epilepsy Society.
Little research
Previous studies have reported on the prevalence of suicidality as well as depression and anxiety among adults with epilepsy. “We wanted to look at adolescents because there’s much less in the literature out there about psychiatric comorbidity, and specifically suicidality, in this population,” said Mr. Greenwood.
Researchers used data from the Human Epilepsy Project, a study that collected data from 34 sites in the United States, Canada, Europe, and Australia from 2012 to 2017.
From a cohort of more than 400 participants, researchers identified 67 patients aged 11-17 years who were enrolled within 4 months of starting treatment for focal epilepsy.
Participants completed the Columbia–Suicide Severity Rating Scale (C-SSRS) at enrollment and at follow-ups over 36 months. The C-SSRS measures suicidal ideation and severity, said Mr. Greenwood.
“It’s scaled from passive suicide ideation, such as thoughts of ‘I wish I were dead’ without active intent, all the way up to active suicidal ideation with a plan and intent.”
Researchers were able to distinguish individuals with passive suicide ideation from those with more serious intentions, said Mr. Greenwood. They used medical records to evaluate the prevalence of suicidal ideation and behavior.
The investigators found that more than one in five (20.9%) teens endorsed any lifetime suicide ideation. This, said Mr. Greenwood, is “roughly equivalent” to the prevalence reported earlier in the adult cohort of the Human Epilepsy Project (21.6%).
‘Striking’ rate
The fact that one in five adolescents had any lifetime suicide ideation is “definitely a striking number,” said Mr. Greenwood.
Researchers found that 15% of patients experienced active suicide ideation, 7.5% exhibited preparatory or suicidal behaviors, and 3% had made a prior suicide attempt.
All of these percentages increased at 3 years: Thirty-one percent for suicide ideation; 25% for active suicide behavior, 15% for preparatory or suicide behaviors, and 5% for prior suicide attempt.
The fact that nearly one in three adolescents endorsed suicide ideation at 3 years is another “striking” finding, said Mr. Greenwood.
Of the 53 adolescents who had never had suicide ideation at the time of enrollment, 7 endorsed new-onset suicide ideation in the follow-up period. Five of 14 who had had suicide ideation at some point prior to enrollment continued to endorse it.
“The value of the study is identifying the prevalence and identifying the significant number of adolescents with epilepsy who are endorsing either suicide ideation or suicidal behaviors,” said Mr. Greenwood.
The researchers found that among younger teens (aged 11–14 years) rates of suicide ideation were higher than among their older counterparts (aged 15–17 years).
The study does not shed light on the biological connection between epilepsy and suicidality, but Mr. Greenwood noted that prior research has suggested a bidirectional relationship.
“Depression and other psychiatric comorbidities might exist prior to epileptic activity and actually predispose to epileptic activity.”
Mr. Greenwood noted that suicide ideation has “spiked” recently across the general population, and so it’s difficult to compare the prevalence in her study with “today’s prevalence.”
However, other research generally shows that the suicide ideation rate in the general adolescent population is much lower than in teens with epilepsy.
Unique aspects of the current study are that it reports suicide ideation and behaviors at around the time of an epilepsy diagnosis and documents how suicidality progresses or resolves over time, said Mr. Greenwood.
Underdiagnosed, undertreated
Commenting on the research, Elizabeth Donner, MD, director of the comprehensive epilepsy program, Hospital for Sick Children, and associate professor, department of pediatrics, University of Toronto, said a “key point” from the study is that the suicidality rate among teens with epilepsy exceeds that of children not living with epilepsy.
“We are significantly underdiagnosing and undertreating the mental health comorbidities in epilepsy,” said Dr. Donner. “Epilepsy is a brain disease and so are mental health disorders, so it shouldn’t come as any surprise that they coexist in individuals with epilepsy.”
The new results contribute to what is already known about the significant mortality rates among persons with epilepsy, said Dr. Donner. She referred to a 2018 study that showed that people with epilepsy were 3.5 times more likely to die by suicide.
Other research has shown that people with epilepsy are 10 times more likely to die by drowning, mostly in the bathtub, said Dr. Donner.
“You would think that we’re educating these people about risks related to their epilepsy, but either the messages don’t get through, or they don’t know how to keep themselves safe,” she said.
“This needs to be seen in a bigger picture, and the bigger picture is we need to recognize comorbid mental health issues; we need to address them once recognized; and then we need to counsel and support people to live safely with their epilepsy.
The study received funding from the Epilepsy Study Consortium, Finding a Cure for Epilepsy and Seizures (FACES) and other related foundations, UCB, Pfizer, Eisai, Lundbeck, and Sunovion. Mr. Greenwood and Dr. Donner report no relevant financial relationships.
A version of this article first appeared on Medscape.com.
AT AES 2022
SSRI tied to improved cognition in comorbid depression, dementia
The results of the 12-week open-label, single-group study are positive, study investigator Michael Cronquist Christensen, MPA, DrPH, a director with the Lundbeck pharmaceutical company, told this news organization before presenting the results in a poster at the 15th Clinical Trials on Alzheimer’s Disease conference.
“The study confirms earlier findings of improvement in both depressive symptoms and cognitive performance with vortioxetine in patients with depression and dementia and adds to this research that these clinical effects also extend to improvement in health-related quality of life and patients’ daily functioning,” Dr. Christensen said.
“It also demonstrates that patients with depression and comorbid dementia can be safely treated with 20 mg vortioxetine – starting dose of 5 mg for the first week and up-titration to 10 mg at day 8,” he added.
However, he reported that Lundbeck doesn’t plan to seek approval from the U.S. Food and Drug Administration for a new indication. Vortioxetine received FDA approval in 2013 to treat MDD, but 3 years later the agency rejected an expansion of its indication to include cognitive dysfunction.
“Vortioxetine is approved for MDD, but the product can be used in patients with MDD who have other diseases, including other mental illnesses,” Dr. Christensen said.
Potential neurotransmission modulator
Vortioxetine is a selective serotonin reuptake inhibitor and serotonin receptor modulator. According to Dr. Christensen, evidence suggests the drug’s receptor targets “have the potential to modulate neurotransmitter systems that are essential for regulation of cognitive function.”
The researchers recruited 83 individuals aged 55-85 with recurrent MDD that had started before the age of 55. All had MDD episodes within the previous 6 months and comorbid dementia for at least 6 months.
Of the participants, 65.9% were female. In addition, 42.7% had Alzheimer’s disease, 26.8% had mixed-type dementia, and the rest had other types of dementia.
The daily oral dose of vortioxetine started at 5 mg for up to week 1 and then was increased to 10 mg. It was then increased to 20 mg or decreased to 5 mg “based on investigator judgment and patient response.” The average daily dose was 12.3 mg.
In regard to the primary outcome, at week 12 (n = 70), scores on the Montgomery-Åsberg Depression Rating Scale (MADRS) fell by a mean of –12.4 (.78, P < .0001), which researchers deemed to be a significant reduction in severe symptoms.
“A significant and clinically meaningful effect was observed from week 1,” the researchers reported.
“As a basis for comparison, we typically see an improvement around 13-14 points during 8 weeks of antidepressant treatment in adults with MDD who do not have dementia,” Dr. Christensen added.
More than a third of patients (35.7%) saw a reduction in MADRS score by more than 50% at week 12, and 17.2% were considered to have reached MDD depression remission, defined as a MADRS score at or under 10.
For secondary outcomes, the total Digit Symbol Substitution test score grew by 0.65 (standardized effect size) by week 12, showing significant improvement (P < .0001). In addition, participants improved on some other cognitive measures, and Dr. Christensen noted that “significant improvement was also observed in the patients’ health-related quality of life and daily functioning.”
A third of patients had drug-related treatment-emergent adverse events.
Vortioxetine is one of the most expensive antidepressants: It has a list price of $444 a month, and no generic version is currently available.
Small trial, open-label design
In a comment, Claire Sexton, DPhil, senior director of scientific programs and outreach at the Alzheimer’s Association, said the study “reflects a valuable aspect of treatment research because of the close connection between depression and dementia. Depression is a known risk factor for dementia, including Alzheimer’s disease, and those who have dementia may experience depression.”

She cautioned, however, that the trial was small and had an open-label design instead of the “gold standard” of a double-blinded trial with a control group.
The study was funded by Lundbeck, where Dr. Christensen is an employee. Another author is a Lundbeck employee, and a third author reported various disclosures. Dr. Sexton reported no disclosures.
A version of this article first appeared on Medscape.com.
The results of the 12-week open-label, single-group study are positive, study investigator Michael Cronquist Christensen, MPA, DrPH, a director with the Lundbeck pharmaceutical company, told this news organization before presenting the results in a poster at the 15th Clinical Trials on Alzheimer’s Disease conference.
“The study confirms earlier findings of improvement in both depressive symptoms and cognitive performance with vortioxetine in patients with depression and dementia and adds to this research that these clinical effects also extend to improvement in health-related quality of life and patients’ daily functioning,” Dr. Christensen said.
“It also demonstrates that patients with depression and comorbid dementia can be safely treated with 20 mg vortioxetine – starting dose of 5 mg for the first week and up-titration to 10 mg at day 8,” he added.
However, he reported that Lundbeck doesn’t plan to seek approval from the U.S. Food and Drug Administration for a new indication. Vortioxetine received FDA approval in 2013 to treat MDD, but 3 years later the agency rejected an expansion of its indication to include cognitive dysfunction.
“Vortioxetine is approved for MDD, but the product can be used in patients with MDD who have other diseases, including other mental illnesses,” Dr. Christensen said.
Potential neurotransmission modulator
Vortioxetine is a selective serotonin reuptake inhibitor and serotonin receptor modulator. According to Dr. Christensen, evidence suggests the drug’s receptor targets “have the potential to modulate neurotransmitter systems that are essential for regulation of cognitive function.”
The researchers recruited 83 individuals aged 55-85 with recurrent MDD that had started before the age of 55. All had MDD episodes within the previous 6 months and comorbid dementia for at least 6 months.
Of the participants, 65.9% were female. In addition, 42.7% had Alzheimer’s disease, 26.8% had mixed-type dementia, and the rest had other types of dementia.
The daily oral dose of vortioxetine started at 5 mg for up to week 1 and then was increased to 10 mg. It was then increased to 20 mg or decreased to 5 mg “based on investigator judgment and patient response.” The average daily dose was 12.3 mg.
In regard to the primary outcome, at week 12 (n = 70), scores on the Montgomery-Åsberg Depression Rating Scale (MADRS) fell by a mean of –12.4 (.78, P < .0001), which researchers deemed to be a significant reduction in severe symptoms.
“A significant and clinically meaningful effect was observed from week 1,” the researchers reported.
“As a basis for comparison, we typically see an improvement around 13-14 points during 8 weeks of antidepressant treatment in adults with MDD who do not have dementia,” Dr. Christensen added.
More than a third of patients (35.7%) saw a reduction in MADRS score by more than 50% at week 12, and 17.2% were considered to have reached MDD depression remission, defined as a MADRS score at or under 10.
For secondary outcomes, the total Digit Symbol Substitution test score grew by 0.65 (standardized effect size) by week 12, showing significant improvement (P < .0001). In addition, participants improved on some other cognitive measures, and Dr. Christensen noted that “significant improvement was also observed in the patients’ health-related quality of life and daily functioning.”
A third of patients had drug-related treatment-emergent adverse events.
Vortioxetine is one of the most expensive antidepressants: It has a list price of $444 a month, and no generic version is currently available.
Small trial, open-label design
In a comment, Claire Sexton, DPhil, senior director of scientific programs and outreach at the Alzheimer’s Association, said the study “reflects a valuable aspect of treatment research because of the close connection between depression and dementia. Depression is a known risk factor for dementia, including Alzheimer’s disease, and those who have dementia may experience depression.”
She cautioned, however, that the trial was small and had an open-label design instead of the “gold standard” of a double-blinded trial with a control group.
The study was funded by Lundbeck, where Dr. Christensen is an employee. Another author is a Lundbeck employee, and a third author reported various disclosures. Dr. Sexton reported no disclosures.
A version of this article first appeared on Medscape.com.
FROM CTAD 2022
How does gender-affirming hormone therapy affect QOL in transgender patients?
Evidence summary
GAHT may improve depression and quality of life, but not anxiety
A well-done systematic review of transgender men and transgender women demonstrated that GAHT of more than a year’s duration was associated with modestly improved standardized scores for QOL, depression, and possibly anxiety.1 It was also associated with improved scores for depression in transgender adolescents.
The authors identified 15 prospective cohort studies (n = 626 transgender adults [mean age, 25-34 years]; 198 transgender adolescent girls and boys [mean age, 15-16 years]), 2 retrospective cohort studies (n = 1756 adults; mean age, 25-32 years), and 4 cross-sectional studies (n = 336 adults; mean age, 30-37 years).
Researchers recruited participants using strict eligibility criteria (psychiatric evaluation and formal diagnosis of gender dysphoria), with no prior history of GAHT, largely from gender-affirming specialty clinics at university hospitals. Most studies were conducted after the year 2000, predominantly in Europe (8 studies in Italy; 2 each in Belgium, the Netherlands, the United States, and Spain).
GAHT comprised testosterone for transgender men (14 studies used injectable testosterone cypionate, enanthate, undecanoate, or transdermal gels), estrogens (usually with an anti-androgen such as cyproterone acetate or spironolactone) for transgender women (10 studies used transdermal, oral, or injectable estradiol valerate or conjugated estrogens), and gonadotropin-releasing hormone (GnRH) therapy for transgender adolescents (3 studies).
Researchers evaluated the outcomes of QOL, depression, and anxiety with standardized scores on validated screening tools and suicide (2 studies) by medical records. GAHT in adult transgender men and transgender women was associated with modest improvements in QOL (3 of 5 studies) and depression (8 of 12 studies), and some improvement in anxiety scores (2 of 8 studies; see TABLE1). There was insufficient evidence to determine whether GAHT had any effect on suicide. In adolescent transgender girls and boys, GAHT was associated with modest improvements in depression but not QOL or anxiety scores.

The authors rated the strength of evidence from the included studies as low, based on study quality (small study sizes, uncontrolled confounding factors, and risk of bias in study designs).
Additional research supports GAHT’s association with improved outcomes
Three studies, published after the systematic review, evaluated outcomes before and after GAHT and found similar results. All studies recruited treatment-seeking participants from specialty clinics.
Continue to: An Australian propsective longitudinal..
An Australian prospective longitudinal controlled study (n = 77 transgender adults; 103 cisgender controls) evaluated GAHT outcomes after 6 months and found a significant reduction in gender dysphoria scores in both transgender males (adjusted mean difference [aMD] = –6.8; 95% CI, –8.7 to –4.9; P < .001) and transgender females (aMD = –4.2; 95% CI, –6.2 to –2.2; P < .001) vs controls. QOL scores (emotional well-being, social functioning) improved only for transgender males (well-being: aMD = +7.5; 95% CI, 1.3 to 13.6; P < .018; social functioning: aMD = +12.5; 95% CI, 2.8 to 22.2; P = .011).2
A US prospective cohort study (n = 104 adolescents; mean age, 16 years) examined the effect of GnRH and/or GAHT over a 12-month period and found significant decreases in standardized scores for depression (adjusted odds ratio [aOR] = 0.4; 95% CI, 0.17-0.95) and suicidality (aOR = 0.27; 95% CI, 0.11-0.65) but not for anxiety. Participants who did not receive hormonal interventions had increased scores for depression and suicidality at 3 and 6 months’ follow-up.3
A prospective cohort study from the UK (n = 178 transgender adults) examined outcomes before and after GAHT treatment over 18 months and found significant decreases in standardized scores for depression (transgender males: –2.1; 95% CI, –3.2 to –1.2; P < .001; transgender females: –1.9; 95% CI, –2.8 to –1.0; P < .001) but not for anxiety.4
A large US study shows GAHT may reduce depression scores
A recent large cross-sectional study from the United States (n = 11,914 transgender or nonbinary youth, ages 13-24 years) found that receiving GAHT was associated with significantly lower odds of recent depression (aOR = 0.73; P < .001) and suicidality (aOR = 0.74; P < .001) compared to those who wanted GAHT but did not receive it. The authors were unable to differentiate the effects of receiving GAHT from the effects of parental support for their child’s gender identity, which may be a confounding factor.5
Recommendations from others
The World Professional Association for Transgender Health Standards of Care state that “gender incongruence that causes clinically significant distress and impairment often requires medically necessary clinical interventions” and recommends “health care professionals initiate and continue gender-affirming hormone therapy … due to demonstrated improvement in psychosocial functioning and quality of life.”6 The Endocrine Society Position Statement on Transgender Health states that “medical intervention for transgender youth and adults (including … hormone therapy) is effective, relatively safe (when appropriately monitored), and has been established as the standard of care.”7 The American Academy of Family Physicians “supports gender-affirming care as an evidence-informed intervention that can promote health equity for gender-diverse individuals.”8
Editor’s takeaway
Family physicians commonly address many factors that can impact the QOL for our patients with gender dysphoria: lack of fixed residence, underemployment, food insecurity, and trauma. GAHT, especially in male-to-female transgender patients, may further improve QOL without evidence of harm.
1. Baker KE, Wilson LM, Sharma R, et al. Hormone therapy, mental health, and quality of life among transgender people: a systematic review. J Endocr Soc. 2021;5:bvab011. doi: 10.1210/jendso/bvab011
2. Foster Skewis L, Bretherton I, Leemaqz, SY, et al. Short-term effects of gender-affirming hormone therapy on dysphoria and quality of life in transgender individuals: a prospective controlled study. Front Endocrinol (Lausanne). 2021;12:717766.
3. Tordoff DM, Wanta JW, Collin A, et al. Mental health outcomes in transgender and nonbinary youths receiving gender-affirming care. JAMA Netw Open. 2022;5:e220978. doi: 10.1001/jamanetworkopen.2022.0978
4. Aldridge Z, Patel S, Guo B, et al. Long-term effect of gender-affirming hormone treatment on depression and anxiety symptoms in transgender people: a prospective cohort study. Andrology. 2021;9:1808-1816. doi: 10.1111/andr.12884
5. Green AE, DeChants JP, Price MN, et al. Association of gender-affirming hormone therapy with depression, thoughts of suicide, and attempted suicide among transgender and nonbinary youth. J Adolesc Health. 2022;70:643-649. doi: 10.1016/j.jadohealth.2021.10.036
6. World Professional Association for Transgender Health. Standards of Care for the Health of Transsexual, Transgender, and Gender Nonconforming People. 8th version. Published 2022. Accessed November 17, 2022. www.wpath.org/publications/soc
7. Endocrine Society. Transgender health: an Endocrine Society position statement. Updated December 16, 2020. Accessed November 17, 2022. www.endocrine.org/advocacy/position-statements/transgender-health
8. American Academy of Family Physicians. Care for the transgender and gender nonbinary patient. Updated September 2022. Accessed November 17, 2022. www.aafp.org/about/policies/all/transgender-nonbinary.html
Evidence summary
GAHT may improve depression and quality of life, but not anxiety
A well-done systematic review of transgender men and transgender women demonstrated that GAHT of more than a year’s duration was associated with modestly improved standardized scores for QOL, depression, and possibly anxiety.1 It was also associated with improved scores for depression in transgender adolescents.
The authors identified 15 prospective cohort studies (n = 626 transgender adults [mean age, 25-34 years]; 198 transgender adolescent girls and boys [mean age, 15-16 years]), 2 retrospective cohort studies (n = 1756 adults; mean age, 25-32 years), and 4 cross-sectional studies (n = 336 adults; mean age, 30-37 years).
Researchers recruited participants using strict eligibility criteria (psychiatric evaluation and formal diagnosis of gender dysphoria), with no prior history of GAHT, largely from gender-affirming specialty clinics at university hospitals. Most studies were conducted after the year 2000, predominantly in Europe (8 studies in Italy; 2 each in Belgium, the Netherlands, the United States, and Spain).
GAHT comprised testosterone for transgender men (14 studies used injectable testosterone cypionate, enanthate, undecanoate, or transdermal gels), estrogens (usually with an anti-androgen such as cyproterone acetate or spironolactone) for transgender women (10 studies used transdermal, oral, or injectable estradiol valerate or conjugated estrogens), and gonadotropin-releasing hormone (GnRH) therapy for transgender adolescents (3 studies).
Researchers evaluated the outcomes of QOL, depression, and anxiety with standardized scores on validated screening tools and suicide (2 studies) by medical records. GAHT in adult transgender men and transgender women was associated with modest improvements in QOL (3 of 5 studies) and depression (8 of 12 studies), and some improvement in anxiety scores (2 of 8 studies; see TABLE1). There was insufficient evidence to determine whether GAHT had any effect on suicide. In adolescent transgender girls and boys, GAHT was associated with modest improvements in depression but not QOL or anxiety scores.
The authors rated the strength of evidence from the included studies as low, based on study quality (small study sizes, uncontrolled confounding factors, and risk of bias in study designs).
Additional research supports GAHT’s association with improved outcomes
Three studies, published after the systematic review, evaluated outcomes before and after GAHT and found similar results. All studies recruited treatment-seeking participants from specialty clinics.
Continue to: An Australian propsective longitudinal..
An Australian prospective longitudinal controlled study (n = 77 transgender adults; 103 cisgender controls) evaluated GAHT outcomes after 6 months and found a significant reduction in gender dysphoria scores in both transgender males (adjusted mean difference [aMD] = –6.8; 95% CI, –8.7 to –4.9; P < .001) and transgender females (aMD = –4.2; 95% CI, –6.2 to –2.2; P < .001) vs controls. QOL scores (emotional well-being, social functioning) improved only for transgender males (well-being: aMD = +7.5; 95% CI, 1.3 to 13.6; P < .018; social functioning: aMD = +12.5; 95% CI, 2.8 to 22.2; P = .011).2
A US prospective cohort study (n = 104 adolescents; mean age, 16 years) examined the effect of GnRH and/or GAHT over a 12-month period and found significant decreases in standardized scores for depression (adjusted odds ratio [aOR] = 0.4; 95% CI, 0.17-0.95) and suicidality (aOR = 0.27; 95% CI, 0.11-0.65) but not for anxiety. Participants who did not receive hormonal interventions had increased scores for depression and suicidality at 3 and 6 months’ follow-up.3
A prospective cohort study from the UK (n = 178 transgender adults) examined outcomes before and after GAHT treatment over 18 months and found significant decreases in standardized scores for depression (transgender males: –2.1; 95% CI, –3.2 to –1.2; P < .001; transgender females: –1.9; 95% CI, –2.8 to –1.0; P < .001) but not for anxiety.4
A large US study shows GAHT may reduce depression scores
A recent large cross-sectional study from the United States (n = 11,914 transgender or nonbinary youth, ages 13-24 years) found that receiving GAHT was associated with significantly lower odds of recent depression (aOR = 0.73; P < .001) and suicidality (aOR = 0.74; P < .001) compared to those who wanted GAHT but did not receive it. The authors were unable to differentiate the effects of receiving GAHT from the effects of parental support for their child’s gender identity, which may be a confounding factor.5
Recommendations from others
The World Professional Association for Transgender Health Standards of Care state that “gender incongruence that causes clinically significant distress and impairment often requires medically necessary clinical interventions” and recommends “health care professionals initiate and continue gender-affirming hormone therapy … due to demonstrated improvement in psychosocial functioning and quality of life.”6 The Endocrine Society Position Statement on Transgender Health states that “medical intervention for transgender youth and adults (including … hormone therapy) is effective, relatively safe (when appropriately monitored), and has been established as the standard of care.”7 The American Academy of Family Physicians “supports gender-affirming care as an evidence-informed intervention that can promote health equity for gender-diverse individuals.”8
Editor’s takeaway
Family physicians commonly address many factors that can impact the QOL for our patients with gender dysphoria: lack of fixed residence, underemployment, food insecurity, and trauma. GAHT, especially in male-to-female transgender patients, may further improve QOL without evidence of harm.
1. Baker KE, Wilson LM, Sharma R, et al. Hormone therapy, mental health, and quality of life among transgender people: a systematic review. J Endocr Soc. 2021;5:bvab011. doi: 10.1210/jendso/bvab011
2. Foster Skewis L, Bretherton I, Leemaqz, SY, et al. Short-term effects of gender-affirming hormone therapy on dysphoria and quality of life in transgender individuals: a prospective controlled study. Front Endocrinol (Lausanne). 2021;12:717766.
3. Tordoff DM, Wanta JW, Collin A, et al. Mental health outcomes in transgender and nonbinary youths receiving gender-affirming care. JAMA Netw Open. 2022;5:e220978. doi: 10.1001/jamanetworkopen.2022.0978
4. Aldridge Z, Patel S, Guo B, et al. Long-term effect of gender-affirming hormone treatment on depression and anxiety symptoms in transgender people: a prospective cohort study. Andrology. 2021;9:1808-1816. doi: 10.1111/andr.12884
5. Green AE, DeChants JP, Price MN, et al. Association of gender-affirming hormone therapy with depression, thoughts of suicide, and attempted suicide among transgender and nonbinary youth. J Adolesc Health. 2022;70:643-649. doi: 10.1016/j.jadohealth.2021.10.036
6. World Professional Association for Transgender Health. Standards of Care for the Health of Transsexual, Transgender, and Gender Nonconforming People. 8th version. Published 2022. Accessed November 17, 2022. www.wpath.org/publications/soc
7. Endocrine Society. Transgender health: an Endocrine Society position statement. Updated December 16, 2020. Accessed November 17, 2022. www.endocrine.org/advocacy/position-statements/transgender-health
8. American Academy of Family Physicians. Care for the transgender and gender nonbinary patient. Updated September 2022. Accessed November 17, 2022. www.aafp.org/about/policies/all/transgender-nonbinary.html
EVIDENCE-BASED ANSWER:
There are modest effects on depression but not anxiety. Gender-affirming hormone therapy (GAHT) is associated with modest improvements in standardized scores for quality of life (QOL) and depression in adult male-to-female and female-to-male transgender people and modest improvements in depression scores in transgender adolescents, but the effect on anxiety is uncertain (strength of recommendation [SOR]: B, based on a preponderance of low-quality prospective cohort studies with inconsistent results).
GAHT is associated with reduced gender dysphoria and decreased suicidality (SOR: B, based on a prospective cohort study). However, there is insufficient evidence to determine any effect on suicide completion. No studies associated GAHT with worsened QOL, depression, or anxiety scores.
