User login
Methodological Progress Note: Group Level Assessment
Group Level Assessment (GLA) is a qualitative research methodology designed to enable groups of stakeholders to generate and evaluate data in participatory sessions.1 It has been used in diverse health-related settings for multiple research purposes, including needs/resource assessment, program evaluation, quality improvement, intervention development, feasibility/acceptability testing, knowledge generation, and prioritization.2-6 Unlike traditional qualitative research methods in which participants provide data and researchers analyze it, GLA uses a seven-step structured process (Table) that actively involves a large group of stakeholders in the generation, interpretation, and synthesis of data and allows salient themes to be identified from stakeholders’ perspectives.7 GLA deliverables include a set of action items that are relevant to the target issue and representative of the collective view of stakeholders. In this issue of the Journal of Hospital Medicine, Choe and colleagues used GLA methodology to identify the perspectives of pediatric medical providers and interpreters with regard to the use of interpreter services for hospitalized children having limited English proficiency (LEP).8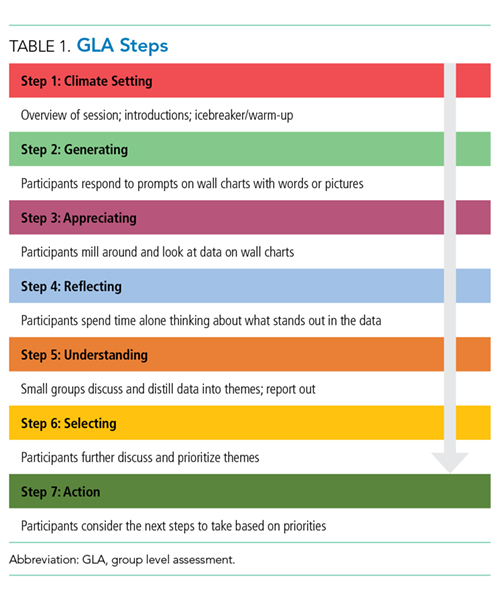
Each individual GLA session is intended for a group of 15-60 stakeholders. Ideally, a GLA session is scheduled for approximately three hours with a skilled facilitator guiding the group through the steps of the session.1 Depending on the study scope and research questions, modifications to GLA can be made when engaging fewer stakeholders, conducting the GLA across several shorter sessions with the same group, or conducting multiple sessions with different stakeholder groups wherein results are integrated across the groups.1
APPLICATION OF GLA
Stakeholder Recruitment
GLAs are designed to bring diverse groups together to be able to generate and evaluate ideas collectively, which in turn helps to reduce potential power differentials between or among participants. Depending on the research question(s), relevant stakeholders may include local community residents, patients, caregivers, community leaders, practitioners, providers, community-based organizations, and even CEOs. The use of purposeful sampling techniques can obtain a diverse group of stakeholders, thus helping ensure a wide range of ideas and perspectives. Choe and colleagues used flyers and announcements at staff meetings to recruit physicians, nursing staff, and interpreters who were subsequently assigned to GLA sessions to ensure engagement from a range of stakeholder roles at each session.8
Session Logistics
Strategies to create an open, equitable atmosphere in GLA sessions include role-based assigning of individuals to specific groups, avoiding introductions that emphasize status, pre-education for any leaders and supervisors about the participatory and equitable nature of GLA, and minimizing cliques and overly dominant voices throughout the session. Stakeholders who take part in activities in a GLA session typically receive an incentive for participating. Additional supports such as food and childcare may be considered. GLA sessions involving children may require providing the young participants assistance in writing their responses and/or the use of additional facilitators to keep the small groups on track.5 Interpreters and facilitators can be incorporated into GLA sessions to assist stakeholders who may need assistance with understanding and responding to prompts, such as language interpretation and translation services.
Prompt Development
Similar to the development of questions for interview and focus group guides, creating effective prompts is a critical component of data collection in GLA. Prompts are statements worded as incomplete or fill-in-the-blank sentences that should be open ended to allow participants to respond with their own thoughts and experiences. Prompts that resemble the beginning of a sentence (eg, “The biggest challenge we face is…”) encourage honest reflection rather than questions that can make participants feel like they are being evaluated. We recommend varying the number of prompts based on the group size: approximately one chart and prompt per person attending, with a maximum of 35 prompts at one session.1 This allows for sufficient variability in the responses generated without being overwhelming or too time-consuming. For example, Choe et al. developed a pool of 51 unique prompts addressing their research questions and then used 15-32 prompts in each GLA session, depending on the number of participants. 8 Prompts should be written with some purposeful redundancy, targeting the research question from several angles. The emphasis should be on the content’s alignment with the research questions rather than the actual wording of the prompts as a way of ensuring that the generated data is both valid and useful.
Prompts should also vary in format, style (eg, different color markers, pictures, fonts, etc.), and placement on each flip chart page. An individual flip chart can include multiple related prompts: for example, “split-halves” in two columns or rows (ie, the best part/worst part). Taken as a whole, the flip charts and accompanying prompts create different lenses for gathering participant perspectives on the research questions. See Appendix Table for suggested prompt characteristics and examples from a hypothetical study related to pediatric healthcare.
GLA prompt development will ideally occur in collaboration with an advisory team comprised of representative members from each of the stakeholder groups. Using a participatory research approach in the research design and preparation phases ensures that GLA prompts are understandable and relevant to participants and are able to appropriately capture the underlying purpose of the study.
Description of the Seven Steps in GLA
In step one, climate setting, the facilitator provides an overview of the session, including a description of the GLA rationale and process. Typically, an icebreaker or brief introduction activity is conducted. Step two, generating, is a hallmark step of GLA in which participants walk around and respond to prompts prewritten on flip charts hung on walls in a large room. Participants use markers and respond to each prompt by either providing a unique comment and/or corroborating an existing comment by adding a checkmark or star. During this step, organizers typically play music and encourage participants to enjoy food, chat with fellow participants, and leisurely move from prompt to prompt in any order. Step three, appreciating, is a brief interim step where participants take a “gallery walk” and view responses written on the charts.
In step four, reflecting, participants reflect on the data and briefly write down their thoughts about the responses generated in the session. In step five, understanding, smaller groups synthesize responses across a subset of charts and report their findings to the larger group. Depending on the size and composition of the larger group, small groups of four to seven people are formed or assigned. Each small group is assigned a subset of approximately four to six charts. Using thematic analysis, participants look for relationships among the responses on their assigned charts, referring to individual responses as evidence for the main findings. Groups will take notes on the charts, circle key phrases, or draw arrows to show relationships in the data and thereafter develop themes. As each small group reports their findings, the facilitator will keep a running list of generated themes, ideally in the participants’ own words. Step six, selecting, involves participants discussing, further synthesizing, and prioritizing data. Step six can occur as a facilitated large group discussion or in a form in which participants can remain in the same small groups from step five and work together to complete this further step. Themes across all of the small groups are consolidated and developed into overarching themes. Step seven, action, includes planning the next steps to address priorities.
Data Analysis
Analyzing the data generated through a GLA is an iterative process incorporated into steps three to seven as described above and often continues after the GLA session is complete. Step seven can be scheduled as a separate action-planning session depending on time constraints and the study goals. This final step moves the group toward interpretation and dissemination as themes are prioritized and used to drive action steps toward a programmatic, policy, or community change. In some studies, themes will be aggregated across multiple GLAs to integrate the findings from several sessions. This step is sometimes completed with a smaller group of stakeholders, an advisory board, or the research team.
Complementary Data and Synthesis
Research teams often collect additional sources of data that are later used to analyze and interpret the initial stakeholder-developed findings (ie, demographic surveys) and to identify priority areas. Field notes, photographs of completed charts, and recorded participant quotes can also be incorporated into the thematic analysis. Small and large group discussions could be audio recorded and transcribed to capture participants’ individual comments and interpretations. In Choe et al. the team recorded detailed notes, including quotations from participants, and collected a demographic survey. After each GLA session, Choe and colleagues compiled all of the stakeholder-driven findings to develop an overarching set of themes related to communication with LEP families and priority areas that could inform subsequent action. Similar to the qualitative validation strategy of member checking, the authors shared and revised this overarching set of themes in discussion with stakeholders to ensure that participant ideas were adequately and accurately represented.8
STRENGTHS OF GLA
Compared to traditional qualitative methods such as one-on-one interviews and focus groups, GLA is designed for large groups and is used to promote active engagement of diverse stakeholders in the participatory process. Unlike many other qualitative methods, GLA provides a stakeholder-driven, structured format to elicit diverse stakeholder viewpoints in the moment and build consensus in a participatory manner about priorities and subsequent actions. The progression of the GLA process is collaborative, with stakeholders generating, analyzing, and prioritizing data from their own perspectives. In a focus group or one-on-one interviews, researchers would conduct the analysis after the audio recordings were transcribed. In GLA, stakeholders conduct a thematic analysis in real time, an aspect that adds the stakeholder perspective to analysis of the findings, interpretation, and implications. GLA offers a fun and interactive experience that can build a sense of community among participants (eg, walking around, impromptu conversation, working in small groups, sharing perspectives on the same issue from different vantage points, etc.). GLA is a versatile, flexible methodology that can be used to address different research objectives, be modified for use with various size groups, and be adapted based on the needs and characteristics of stakeholders (eg, children, people with disabilities, etc.).1 When used in recruitment, GLA is designed to include stakeholders representing different roles and levels of a system. GLA can be particularly useful when engaging underserved communities in research because the process is nonthreatening and promotive of shared perspectives and decision-making. Importantly, the final step of GLA provides interested stakeholders with a way to stay involved in the research through prioritization and action.
LIMITATIONS OF GLA
Like other self-report research methods, GLA relies on stakeholder comfort and willingness to share “public data.”1 Thus, controversial or sensitive issues may not be brought forth. Since the final themes of GLA are consensus based in terms of what the group of stakeholders finds to be most important, nuances and outlier data can be missed. Successfully conducting a GLA requires a skilled, flexible facilitator who can manage group dynamics while also balancing the structure of the seven-step process, promoting an open and equitable environment, and ensuring the research process remains rigorous. Large groups can be more difficult for facilitators to manage especially when there are power differentials, conflict, and hidden agendas among stakeholders. The large group design, multiple steps of GLA, and participatory atmosphere with music and food can be off-putting for some stakeholders who find the process too noisy, overwhelming, or unstructured. In addition, large groups can be challenging to schedule at times and to find locations that are convenient for stakeholders.
WHY DID THE AUTHORS USE GLA?
Compared to researcher-driven qualitative methods that can be resource-intensive and are limited by researcher perspective, GLA emphasizes the contextual, “lived” expertise of stakeholders and relies on them in real time to identify and prioritize matters relevant to the participants. The participatory process of GLA promotes stakeholder buy-in and builds on the collective wisdom of the stakeholder group. This is ideally seen in Choe et al.’s study where GLA offered the researchers a structured qualitative methodology that engaged a large number of medical providers and interpreters to identify effective practices that should ultimately enhance communication with families of hospitalized LEP children.
Disclosures
The authors have nothing to disclose.
1. Vaughn LM, Lohmueller M. Calling all stakeholders: group-level assessment (GLA)—a qualitative and participatory method for large groups. Eval Rev. 2014;38(4):336-355. https:// doi.org/10.1177/0193841X14544903.
2. Gosdin CH, Vaughn L. Perceptions of physician bedside handoff with nurse and family involvement. Hosp Pediatr. 2012;2(1):34-38. https://doi.org/10.1542/hpeds.2011-0008-2
3. Graham KE, Schellinger AR, Vaughn LM. Developing strategies for positive change: transitioning foster youth to adulthood. Child Youth Serv Rev. 2015;54:71-79. https://doi.org/10.1016/j.childyouth.2015.04.014
4. Schondelmeyer AC, Jenkins AM, Allison B, et al. Factors influencing use of continuous physiologic monitors for hospitalized pediatric patients. Hosp Pediatr. 2019;9(6):423-428. https://doi.org/10.1542/hpeds.2019-0007
5. Vaughn LM, Jacquez F, Zhao J, Lang M. Partnering with students to explore the health needs of an ethnically diverse, low-resource school: an innovative large group assessment approach. Fam Community Health. 2011;34(1):72-84. https://doi.org/10.1097/FCH.0b013e3181fded12
6. Vaughn LM. Group level assessment: a large group method for identifying primary issues and needs within a community. Sage Journals. 2014;38:336-355. https://doi.org/10.4135/978144627305014541626
7. Vaughn LM. Psychology and culture: thinking, feeling and behaving in a global context. 2nd ed. New York, NY: Taylor & Francis; 2019.
8. Choe A, Unaka N, Schondelmeyer AC, Bignall, RW, Vilvens H, Thomson J. Inpatient communication barriers and drivers when caring for children with limited English proficiency [published online ahead of print July 24, 2019]. J Hosp Med. https://doi.org/10.12788/jhm.3240.
Group Level Assessment (GLA) is a qualitative research methodology designed to enable groups of stakeholders to generate and evaluate data in participatory sessions.1 It has been used in diverse health-related settings for multiple research purposes, including needs/resource assessment, program evaluation, quality improvement, intervention development, feasibility/acceptability testing, knowledge generation, and prioritization.2-6 Unlike traditional qualitative research methods in which participants provide data and researchers analyze it, GLA uses a seven-step structured process (Table) that actively involves a large group of stakeholders in the generation, interpretation, and synthesis of data and allows salient themes to be identified from stakeholders’ perspectives.7 GLA deliverables include a set of action items that are relevant to the target issue and representative of the collective view of stakeholders. In this issue of the Journal of Hospital Medicine, Choe and colleagues used GLA methodology to identify the perspectives of pediatric medical providers and interpreters with regard to the use of interpreter services for hospitalized children having limited English proficiency (LEP).8
Each individual GLA session is intended for a group of 15-60 stakeholders. Ideally, a GLA session is scheduled for approximately three hours with a skilled facilitator guiding the group through the steps of the session.1 Depending on the study scope and research questions, modifications to GLA can be made when engaging fewer stakeholders, conducting the GLA across several shorter sessions with the same group, or conducting multiple sessions with different stakeholder groups wherein results are integrated across the groups.1
APPLICATION OF GLA
Stakeholder Recruitment
GLAs are designed to bring diverse groups together to be able to generate and evaluate ideas collectively, which in turn helps to reduce potential power differentials between or among participants. Depending on the research question(s), relevant stakeholders may include local community residents, patients, caregivers, community leaders, practitioners, providers, community-based organizations, and even CEOs. The use of purposeful sampling techniques can obtain a diverse group of stakeholders, thus helping ensure a wide range of ideas and perspectives. Choe and colleagues used flyers and announcements at staff meetings to recruit physicians, nursing staff, and interpreters who were subsequently assigned to GLA sessions to ensure engagement from a range of stakeholder roles at each session.8
Session Logistics
Strategies to create an open, equitable atmosphere in GLA sessions include role-based assigning of individuals to specific groups, avoiding introductions that emphasize status, pre-education for any leaders and supervisors about the participatory and equitable nature of GLA, and minimizing cliques and overly dominant voices throughout the session. Stakeholders who take part in activities in a GLA session typically receive an incentive for participating. Additional supports such as food and childcare may be considered. GLA sessions involving children may require providing the young participants assistance in writing their responses and/or the use of additional facilitators to keep the small groups on track.5 Interpreters and facilitators can be incorporated into GLA sessions to assist stakeholders who may need assistance with understanding and responding to prompts, such as language interpretation and translation services.
Prompt Development
Similar to the development of questions for interview and focus group guides, creating effective prompts is a critical component of data collection in GLA. Prompts are statements worded as incomplete or fill-in-the-blank sentences that should be open ended to allow participants to respond with their own thoughts and experiences. Prompts that resemble the beginning of a sentence (eg, “The biggest challenge we face is…”) encourage honest reflection rather than questions that can make participants feel like they are being evaluated. We recommend varying the number of prompts based on the group size: approximately one chart and prompt per person attending, with a maximum of 35 prompts at one session.1 This allows for sufficient variability in the responses generated without being overwhelming or too time-consuming. For example, Choe et al. developed a pool of 51 unique prompts addressing their research questions and then used 15-32 prompts in each GLA session, depending on the number of participants. 8 Prompts should be written with some purposeful redundancy, targeting the research question from several angles. The emphasis should be on the content’s alignment with the research questions rather than the actual wording of the prompts as a way of ensuring that the generated data is both valid and useful.
Prompts should also vary in format, style (eg, different color markers, pictures, fonts, etc.), and placement on each flip chart page. An individual flip chart can include multiple related prompts: for example, “split-halves” in two columns or rows (ie, the best part/worst part). Taken as a whole, the flip charts and accompanying prompts create different lenses for gathering participant perspectives on the research questions. See Appendix Table for suggested prompt characteristics and examples from a hypothetical study related to pediatric healthcare.
GLA prompt development will ideally occur in collaboration with an advisory team comprised of representative members from each of the stakeholder groups. Using a participatory research approach in the research design and preparation phases ensures that GLA prompts are understandable and relevant to participants and are able to appropriately capture the underlying purpose of the study.
Description of the Seven Steps in GLA
In step one, climate setting, the facilitator provides an overview of the session, including a description of the GLA rationale and process. Typically, an icebreaker or brief introduction activity is conducted. Step two, generating, is a hallmark step of GLA in which participants walk around and respond to prompts prewritten on flip charts hung on walls in a large room. Participants use markers and respond to each prompt by either providing a unique comment and/or corroborating an existing comment by adding a checkmark or star. During this step, organizers typically play music and encourage participants to enjoy food, chat with fellow participants, and leisurely move from prompt to prompt in any order. Step three, appreciating, is a brief interim step where participants take a “gallery walk” and view responses written on the charts.
In step four, reflecting, participants reflect on the data and briefly write down their thoughts about the responses generated in the session. In step five, understanding, smaller groups synthesize responses across a subset of charts and report their findings to the larger group. Depending on the size and composition of the larger group, small groups of four to seven people are formed or assigned. Each small group is assigned a subset of approximately four to six charts. Using thematic analysis, participants look for relationships among the responses on their assigned charts, referring to individual responses as evidence for the main findings. Groups will take notes on the charts, circle key phrases, or draw arrows to show relationships in the data and thereafter develop themes. As each small group reports their findings, the facilitator will keep a running list of generated themes, ideally in the participants’ own words. Step six, selecting, involves participants discussing, further synthesizing, and prioritizing data. Step six can occur as a facilitated large group discussion or in a form in which participants can remain in the same small groups from step five and work together to complete this further step. Themes across all of the small groups are consolidated and developed into overarching themes. Step seven, action, includes planning the next steps to address priorities.
Data Analysis
Analyzing the data generated through a GLA is an iterative process incorporated into steps three to seven as described above and often continues after the GLA session is complete. Step seven can be scheduled as a separate action-planning session depending on time constraints and the study goals. This final step moves the group toward interpretation and dissemination as themes are prioritized and used to drive action steps toward a programmatic, policy, or community change. In some studies, themes will be aggregated across multiple GLAs to integrate the findings from several sessions. This step is sometimes completed with a smaller group of stakeholders, an advisory board, or the research team.
Complementary Data and Synthesis
Research teams often collect additional sources of data that are later used to analyze and interpret the initial stakeholder-developed findings (ie, demographic surveys) and to identify priority areas. Field notes, photographs of completed charts, and recorded participant quotes can also be incorporated into the thematic analysis. Small and large group discussions could be audio recorded and transcribed to capture participants’ individual comments and interpretations. In Choe et al. the team recorded detailed notes, including quotations from participants, and collected a demographic survey. After each GLA session, Choe and colleagues compiled all of the stakeholder-driven findings to develop an overarching set of themes related to communication with LEP families and priority areas that could inform subsequent action. Similar to the qualitative validation strategy of member checking, the authors shared and revised this overarching set of themes in discussion with stakeholders to ensure that participant ideas were adequately and accurately represented.8
STRENGTHS OF GLA
Compared to traditional qualitative methods such as one-on-one interviews and focus groups, GLA is designed for large groups and is used to promote active engagement of diverse stakeholders in the participatory process. Unlike many other qualitative methods, GLA provides a stakeholder-driven, structured format to elicit diverse stakeholder viewpoints in the moment and build consensus in a participatory manner about priorities and subsequent actions. The progression of the GLA process is collaborative, with stakeholders generating, analyzing, and prioritizing data from their own perspectives. In a focus group or one-on-one interviews, researchers would conduct the analysis after the audio recordings were transcribed. In GLA, stakeholders conduct a thematic analysis in real time, an aspect that adds the stakeholder perspective to analysis of the findings, interpretation, and implications. GLA offers a fun and interactive experience that can build a sense of community among participants (eg, walking around, impromptu conversation, working in small groups, sharing perspectives on the same issue from different vantage points, etc.). GLA is a versatile, flexible methodology that can be used to address different research objectives, be modified for use with various size groups, and be adapted based on the needs and characteristics of stakeholders (eg, children, people with disabilities, etc.).1 When used in recruitment, GLA is designed to include stakeholders representing different roles and levels of a system. GLA can be particularly useful when engaging underserved communities in research because the process is nonthreatening and promotive of shared perspectives and decision-making. Importantly, the final step of GLA provides interested stakeholders with a way to stay involved in the research through prioritization and action.
LIMITATIONS OF GLA
Like other self-report research methods, GLA relies on stakeholder comfort and willingness to share “public data.”1 Thus, controversial or sensitive issues may not be brought forth. Since the final themes of GLA are consensus based in terms of what the group of stakeholders finds to be most important, nuances and outlier data can be missed. Successfully conducting a GLA requires a skilled, flexible facilitator who can manage group dynamics while also balancing the structure of the seven-step process, promoting an open and equitable environment, and ensuring the research process remains rigorous. Large groups can be more difficult for facilitators to manage especially when there are power differentials, conflict, and hidden agendas among stakeholders. The large group design, multiple steps of GLA, and participatory atmosphere with music and food can be off-putting for some stakeholders who find the process too noisy, overwhelming, or unstructured. In addition, large groups can be challenging to schedule at times and to find locations that are convenient for stakeholders.
WHY DID THE AUTHORS USE GLA?
Compared to researcher-driven qualitative methods that can be resource-intensive and are limited by researcher perspective, GLA emphasizes the contextual, “lived” expertise of stakeholders and relies on them in real time to identify and prioritize matters relevant to the participants. The participatory process of GLA promotes stakeholder buy-in and builds on the collective wisdom of the stakeholder group. This is ideally seen in Choe et al.’s study where GLA offered the researchers a structured qualitative methodology that engaged a large number of medical providers and interpreters to identify effective practices that should ultimately enhance communication with families of hospitalized LEP children.
Disclosures
The authors have nothing to disclose.
1. Vaughn LM, Lohmueller M. Calling all stakeholders: group-level assessment (GLA)—a qualitative and participatory method for large groups. Eval Rev. 2014;38(4):336-355. https:// doi.org/10.1177/0193841X14544903.
2. Gosdin CH, Vaughn L. Perceptions of physician bedside handoff with nurse and family involvement. Hosp Pediatr. 2012;2(1):34-38. https://doi.org/10.1542/hpeds.2011-0008-2
3. Graham KE, Schellinger AR, Vaughn LM. Developing strategies for positive change: transitioning foster youth to adulthood. Child Youth Serv Rev. 2015;54:71-79. https://doi.org/10.1016/j.childyouth.2015.04.014
4. Schondelmeyer AC, Jenkins AM, Allison B, et al. Factors influencing use of continuous physiologic monitors for hospitalized pediatric patients. Hosp Pediatr. 2019;9(6):423-428. https://doi.org/10.1542/hpeds.2019-0007
5. Vaughn LM, Jacquez F, Zhao J, Lang M. Partnering with students to explore the health needs of an ethnically diverse, low-resource school: an innovative large group assessment approach. Fam Community Health. 2011;34(1):72-84. https://doi.org/10.1097/FCH.0b013e3181fded12
6. Vaughn LM. Group level assessment: a large group method for identifying primary issues and needs within a community. Sage Journals. 2014;38:336-355. https://doi.org/10.4135/978144627305014541626
7. Vaughn LM. Psychology and culture: thinking, feeling and behaving in a global context. 2nd ed. New York, NY: Taylor & Francis; 2019.
8. Choe A, Unaka N, Schondelmeyer AC, Bignall, RW, Vilvens H, Thomson J. Inpatient communication barriers and drivers when caring for children with limited English proficiency [published online ahead of print July 24, 2019]. J Hosp Med. https://doi.org/10.12788/jhm.3240.
© 2019 Society of Hospital Medicine
Clinical Progress Note: Pediatric Acute Kidney Injury
Acute kidney injury (AKI) occurs in 5%-30% of noncritically ill hospitalized children.1 Initially thought to be simply a symptom of more severe pathologies, it is now recognized that AKI independently increases mortality and is associated with the development of chronic kidney disease (CKD), even in children.2 The wide acceptance of the Kidney Disease Improving Global Outcome (KDIGO) diagnostic criteria has enabled a more uniform definition of AKI from both clinical and research perspectives.2 A better understanding of the pathophysiology and risk factors for AKI has led to new methods for early detection and prevention efforts. While serum creatinine (SCr) was historically one of the sole markers of AKI, novel biomarkers can facilitate earlier diagnosis of AKI, identify subclinical AKI, and guide clinical management. This clinical practice update addresses the latest clinical advances in risk assessment, diagnosis, and prevention of pediatric AKI, with a focus on AKI biomarkers.
DIAGNOSIS, BIOMARKERS, AND DEFINITION
Several sets of criteria have been used to diagnose AKI. The KDIGO classification, based on a systematic review of the literature and developed through expert consensus, is the current recommended definition.3 Increasing AKI stage, as defined by the KDIGO classification, is associated with increased mortality, the need for renal replacement therapy, length of stay, and CKD, thus underscoring the importance of accurate classification.3 Stage 1 AKI is defined by a rise in SCr of ≥0.3 mg/dL,1.5-1.9 times the baseline SCr, or urine output <0.5 ml/kg/h for six to 12 hours; stage 2 by a rise of ≥2.0-2.9 times the baseline SCr or urine output <0.5 ml/kg/h for >12 hours; and stage 3 by a rise of ≥4.0 mg/dL, ≥three times the baseline SCr, initiation of renal replacement therapy, urine output <0.3 ml/kg/h for ≥24 hours, or anuria ≥12 hours. However, these criteria rely on SCr, which is a suboptimal marker of renal dysfunction, as it rises only once the glomerular filtration rate (GFR) has already decreased, in some cases by as much as 50%. Additionally, interpretation of SCr in the diagnosis of AKI requires a prior Scr measurement to determine the magnitude of change from the baseline value, which is often lacking in children. To mitigate this limitation, different formulas exist to estimate a baseline SCr value based on height or age, an approach that assumes patients have preexisting normal renal function.
The limitations of SCr have led to interest in identifying more accurate biomarkers of AKI. Although many candidates have been identified, we will limit our discussion to those currently available for clinical use: serum cystatin C, urine neutrophil gelatinase-associated lipocalin (NGAL), urine TIMP-2, and urine IGFBP7 (Table).4-8 While urine NGAL and cystatin C are measured individually, TIMP-2 and IGFBP7 are measured on the same panel and the product of their multiplied values is used for clinical guidance. While each of these biomarkers have good predictive accuracy for AKI when used independently, their combined use increases the accuracy of AKI diagnosis. These biomarkers can be divided into broad categories based on their utility as either functional markers or markers of injury.6 Serum cystatin C is a functional marker and as such can be used to estimate GFR more accurately than SCr.9 Comparatively, urine NGAL is a marker of renal injury, while TIMP2 and IGFBP7 are markers of renal stress. These markers are not useful in estimating GFR, but rather aid in the prediction and diagnosis of AKI (Figure). Despite the limitations of SCr, these biomarkers have yet to be incorporated into the diagnostic criteria. They have, however, helped to refine our understanding of the pathophysiology of AKI.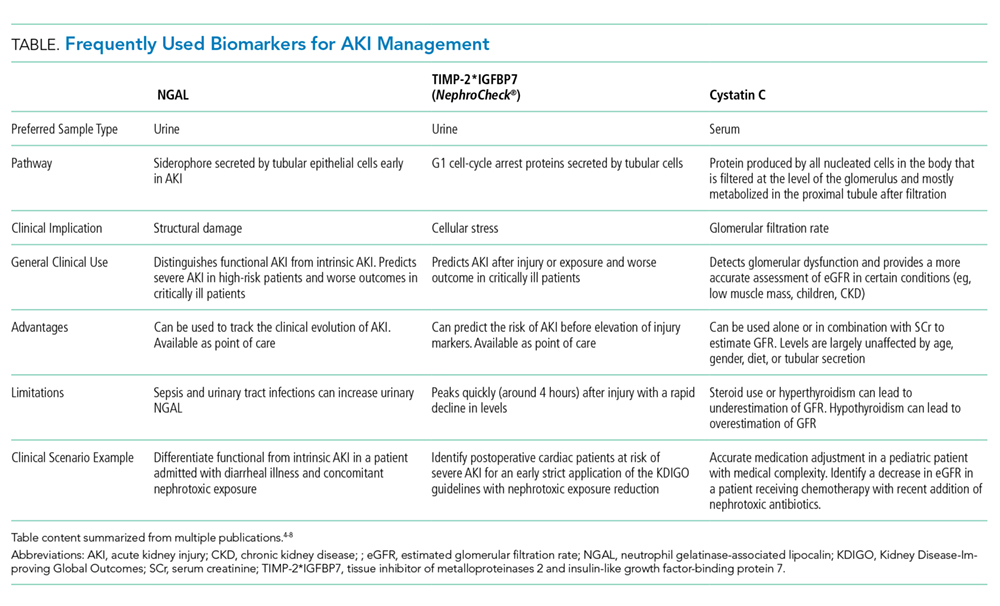
AKI has classically been divided into three categories based on the etiology of injury, namely prerenal azotemia, intrinsic renal disease, and postrenal causes. The discovery of new biomarkers adds nuance to the classification of AKI. Two groups of biomarkers are particularly helpful in this regard: markers of structural injury (eg, NGAL) and functional markers (eg, cystatin C). The combination of these biomarkers with SCr has refined the categories of AKI (Figure). For example, NGAL can accurately distinguish between a rise in SCr due to functional AKI, previously referred to as prerenal azotemia, and a rise in SCr due to intrinsic kidney injury. An elevation of structural injury biomarkers in the absence of a significant rise in SCr is referred to as subclinical AKI. Patients with subclinical AKI have worse outcomes than those without AKI but better outcomes than patients with AKI with elevation of both SCr and NGAL (Figure).2,6 Time to resolution of AKI further refines our ability to predict prognosis and outcomes. Transient AKI, defined as resolution within 48 hours, is associated with a better prognosis than persistent AKI. Renal dysfunction lasting more than seven days but less than 90 days is referred to as acute kidney disease (AKD). While both transient AKI and AKD represent different entities on the continuum between AKI and CKD, further research is needed to better elucidate these classifications.2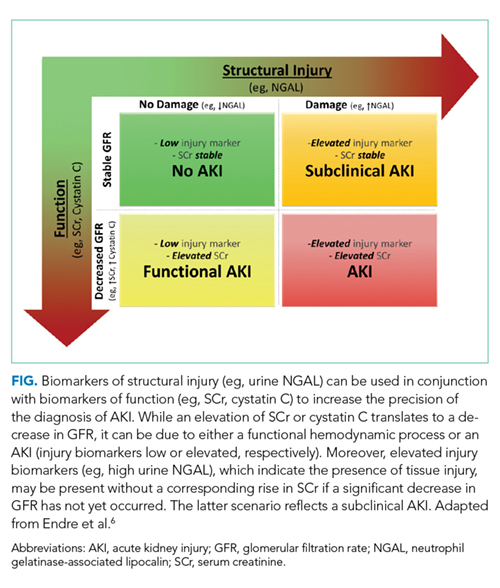
RISK STRATIFICATION
The renal angina index (RAI) identifies critically ill children at high risk for AKI. The RAI combines traditional markers of AKI, such as a change in estimated creatinine clearance and fluid overload, with patient factors, including need for ventilation, inotropic support, and history of transplantation (solid organ or bone marrow) to identify those patients who are at high risk for severe AKI. Patients identified as high risk by the patient factors component of the RAI have a much lower threshold for both a decrease in creatinine clearance and fluid overload to be considered at risk for severe AKI, as these early signs are more likely to reflect an early impending severe AKI in this high-risk group. Conversely, patients that do not meet these patient factors are more likely to simply have a transient or functional AKI, and therefore have a higher threshold for both a change in creatinine clearance and fluid overload in order to be considered at high risk for severe AKI.
The RAI has been validated in the critical care setting as a method to predict severe AKI at day three of admission to the pediatric intensive care unit, with a negative predictive value of 92%-99% when the score is negative in the first 12 hours.10 In selected high-risk patients (RAI ≥ 8), biomarkers become even more reliable for AKI prediction (eg, injury markers have an excellent area under the receiver operating characteristic curve (AUC) of 0.97 for severe AKI prediction in this high-risk group).11 While only validated for critically ill patients, the concept of renal angina is still applicable in the complex populations managed by hospitalists who practice outside of the intensive care unit setting. Early signs of renal dysfunction (eg, rising SCr, fluid overload ≥5%) in patients with risk factors (see below) should prompt a thorough evaluation, including urinalysis, daily SCr, nephrotoxin avoidance, and tissue injury biomarkers, if available.
The risk factors for AKI are numerous and tend to potentiate one another. The most frequent predisposing comorbidities include CKD, heart failure or congenital heart diseases, transplantation (bone marrow or solid organs), and diabetes. Disease-related factors include sepsis, cardiac surgery, cardio-pulmonary bypass, mechanical ventilation, and vasopressor use. Potentially modifiable factors include hypovolemia and multiple nephrotoxic exposures. 2,3
Nephrotoxic medications are now among the most common causes of AKI in hospitalized children.12 Approximately 80% of children are exposed to at least one nephrotoxin during an inpatient admission.12 Exposure to a single nephrotoxic medication is sufficient to place a child at risk of AKI, and each additional nephrotoxin further increases the risk.12 While some drugs are routinely recognized to be nephrotoxic (eg, ibuprofen), others are commonly overlooked, notably certain antibiotics (eg, cefotaxime, ceftazidime, cefuroxime, nafcillin, and piperacillin) and anticonvulsants (eg, zonisamide).12 Furthermore, the combination of multiple nephrotoxins can potentiate the risk of AKI. For example, the combination of vancomycin and piperacillin/tazobactam increases the risk of AKI by 3.4 times compared with the combination of vancomycin with another antipseudomonal beta-lactam antibiotic.13
Adequate monitoring, including daily SCr measurements and risk awareness, are critical as nephrotoxin-associated AKI can be easily missed in the absence of routine SCr monitoring, especially since these children are typically nonoliguric12. Quality improvement efforts focused on obtaining daily SCr in patients exposed to either three or more nephrotoxins or three days of either aminoglycoside or vancomycin, even without concomitant exposure to other nephrotoxins, have shown success in decreasing both the number of nephrotoxins and the rate of nephrotoxin-associated AKI.12
While a significant injury cannot always be avoided, a mindful clinical approach and management can help to prevent some complications of AKI. An awareness of fluid status is critical, as fluid overload greater than 10% of the patient’s weight independently increases the risk of mortality in both adults and children.14 To assess the risk of AKI progression and potential failure of conservative management with diuretics, a furosemide stress test (FST) is an easy, safe, and accessible functional assessment of tubular reserve in a patient without intravascular depletion.15 A growing body of literature in adults shows that FST-responders are less likely to progress to stage 3 AKI or need renal replacement therapy than nonresponders.15 The FST is currently being investigated and standardized in children.
CONCLUSION
Research in AKI has made significant strides over the last few years. Nevertheless, many areas of research remain to be explored (eg, the impact of IV fluid type in the pediatric population, AKD characterization and impact on CKD development). AKI is common, associated with significant morbidity and mortality and, in some instances, preventable. While no targeted therapeutic options are currently under investigation, recent advances allow for better identification of high-risk patients and offer opportunities for impactful preventive approaches. Thoughtful use of nephrotoxic medications, early identification of patients at high risk for AKI, and accurate diagnosis and appropriate management of AKI are the recommended best practice.
Disclosures
The authors have nothing to disclose.
1. McGregor TL, Jones DP, Wang L, et al. Acute kidney injury incidence in noncritically ill hospitalized children, adolescents, and young adults: a retrospective observational study. Am J Kidney Dis. 2016;67(3):384-390. https://doi.org/10.1053/j.ajkd.2015.07.019.
2. Chawla LS, Bellomo R, Bihorac A, et al. Acute kidney disease and renal recovery: consensus report of the Acute Disease Quality Initiative (ADQI) 16 Workgroup. Nat Rev Nephrol. 2017;13(4):241-257. https://doi.org/10.1038/nrneph.2017.2.
3. Khwaja A. KDIGO clinical practice guidelines for acute kidney injury. Nephron Clin Pract. 2012;120(4):179-184. https://doi.org/10.1159/000339789.
4. Filho LT, Grande AJ, Colonetti T, Della ÉSP, da Rosa MI. Accuracy of neutrophil gelatinase-associated lipocalin for acute kidney injury diagnosis in children: systematic review and meta-analysis. Pediatr Nephrol. 2017;32(10):1979-1988. https://doi.org/10.1007/s00467-017-3704-6.
5. Levey AS, Inker LA. Assessment of glomerular filtration rate in health and disease: a state of the art review. Clin Pharmacol Ther. 2017;102(3):405-419. https://doi.org/10.1002/cpt.729.
6. Endre ZH, Kellum JA, Di Somma S, et al. Differential diagnosis of AKI in clinical practice by functional and damage biomarkers: workgroup statements from the tenth Acute Dialysis Quality Initiative Consensus Conference. Contrib Nephrol. 2013;182:30-44. https://doi.org/10.1159/000349964.
7. Su LJ, Li YM, Kellum JA, Peng ZY. Predictive value of cell cycle arrest biomarkers for cardiac surgery-associated acute kidney injury: a meta-analysis. Br J Anaesth. 2018;121(2):350-357. https://doi.org/10.1016/j.bja.2018.02.069.
8. Westhoff JH, Tönshoff B, Waldherr S, et al. Urinary tissue inhibitor of metalloproteinase-2 (TIMP-2) · insulin-like growth factor-binding protein 7 (IGFBP7) predicts adverse outcome in pediatric acute kidney injury. PLoS One. 2015;10(11):1-16. https://doi.org/10.1371/journal.pone.0143628.
9. Berg UB, Nyman U, Bäck R, et al. New standardized cystatin C and creatinine GFR equations in children validated with inulin clearance. Pediatr Nephrol. 2015;30(8):1317-1326. https://doi.org/10.1007/s00467-015-3060-3.
10. Chawla LS, Goldstein SL, Kellum JA, Ronco C. Renal angina: concept and development of pretest probability assessment in acute kidney injury. Crit Care. 2015;19(1):93. https://doi.org/10.1186/s13054-015-0779-y.
11. Menon S, Goldstein SL, Mottes T, et al. Urinary biomarker incorporation into the renal angina index early in intensive care unit admission optimizes acute kidney injury prediction in critically ill children: a prospective cohort study. Nephrol Dial Transplant. 2016;31(4):586-594. https://doi.org/10.1093/ndt/gfv457.
12. Goldstein SL, Mottes T, Simpson K, et al. A sustained quality improvement program reduces nephrotoxic medication-associated acute kidney injury. Kidney Int. 2016;90(1):212-221. https://doi.org/10.1016/j.kint.2016.03.031.
13. Downes KJ, Cowden C, Laskin BL, et al. Association of acute kidney injury with concomitant vancomycin and piperacillin/tazobactam treatment among hospitalized children. JAMA Pediatr. 2017;19146:e173219-e173219. https://doi.org/10.1001/JAMAPEDIATRICS.2017.3219.
14. Naipaul A, Jefferson LS, Goldstein SL, Loftis LL, Zappitelli M, Arikan AA. Fluid overload is associated with impaired oxygenation and morbidity in critically ill children*. Pediatr Crit Care Med. 2011;13(3):253-258. https://doi.org/10.1097/pcc.0b013e31822882a3.
15. Lumlertgul N, Peerapornratana S, Trakarnvanich T, et al. Early versus standard initiation of renal replacement therapy in furosemide stress test non-responsive acute kidney injury patients (the FST trial). Crit Care. 2018;22(1):1-9. https://doi.org/10.1186/s13054-018-2021-1.
Acute kidney injury (AKI) occurs in 5%-30% of noncritically ill hospitalized children.1 Initially thought to be simply a symptom of more severe pathologies, it is now recognized that AKI independently increases mortality and is associated with the development of chronic kidney disease (CKD), even in children.2 The wide acceptance of the Kidney Disease Improving Global Outcome (KDIGO) diagnostic criteria has enabled a more uniform definition of AKI from both clinical and research perspectives.2 A better understanding of the pathophysiology and risk factors for AKI has led to new methods for early detection and prevention efforts. While serum creatinine (SCr) was historically one of the sole markers of AKI, novel biomarkers can facilitate earlier diagnosis of AKI, identify subclinical AKI, and guide clinical management. This clinical practice update addresses the latest clinical advances in risk assessment, diagnosis, and prevention of pediatric AKI, with a focus on AKI biomarkers.
DIAGNOSIS, BIOMARKERS, AND DEFINITION
Several sets of criteria have been used to diagnose AKI. The KDIGO classification, based on a systematic review of the literature and developed through expert consensus, is the current recommended definition.3 Increasing AKI stage, as defined by the KDIGO classification, is associated with increased mortality, the need for renal replacement therapy, length of stay, and CKD, thus underscoring the importance of accurate classification.3 Stage 1 AKI is defined by a rise in SCr of ≥0.3 mg/dL,1.5-1.9 times the baseline SCr, or urine output <0.5 ml/kg/h for six to 12 hours; stage 2 by a rise of ≥2.0-2.9 times the baseline SCr or urine output <0.5 ml/kg/h for >12 hours; and stage 3 by a rise of ≥4.0 mg/dL, ≥three times the baseline SCr, initiation of renal replacement therapy, urine output <0.3 ml/kg/h for ≥24 hours, or anuria ≥12 hours. However, these criteria rely on SCr, which is a suboptimal marker of renal dysfunction, as it rises only once the glomerular filtration rate (GFR) has already decreased, in some cases by as much as 50%. Additionally, interpretation of SCr in the diagnosis of AKI requires a prior Scr measurement to determine the magnitude of change from the baseline value, which is often lacking in children. To mitigate this limitation, different formulas exist to estimate a baseline SCr value based on height or age, an approach that assumes patients have preexisting normal renal function.
The limitations of SCr have led to interest in identifying more accurate biomarkers of AKI. Although many candidates have been identified, we will limit our discussion to those currently available for clinical use: serum cystatin C, urine neutrophil gelatinase-associated lipocalin (NGAL), urine TIMP-2, and urine IGFBP7 (Table).4-8 While urine NGAL and cystatin C are measured individually, TIMP-2 and IGFBP7 are measured on the same panel and the product of their multiplied values is used for clinical guidance. While each of these biomarkers have good predictive accuracy for AKI when used independently, their combined use increases the accuracy of AKI diagnosis. These biomarkers can be divided into broad categories based on their utility as either functional markers or markers of injury.6 Serum cystatin C is a functional marker and as such can be used to estimate GFR more accurately than SCr.9 Comparatively, urine NGAL is a marker of renal injury, while TIMP2 and IGFBP7 are markers of renal stress. These markers are not useful in estimating GFR, but rather aid in the prediction and diagnosis of AKI (Figure). Despite the limitations of SCr, these biomarkers have yet to be incorporated into the diagnostic criteria. They have, however, helped to refine our understanding of the pathophysiology of AKI.
AKI has classically been divided into three categories based on the etiology of injury, namely prerenal azotemia, intrinsic renal disease, and postrenal causes. The discovery of new biomarkers adds nuance to the classification of AKI. Two groups of biomarkers are particularly helpful in this regard: markers of structural injury (eg, NGAL) and functional markers (eg, cystatin C). The combination of these biomarkers with SCr has refined the categories of AKI (Figure). For example, NGAL can accurately distinguish between a rise in SCr due to functional AKI, previously referred to as prerenal azotemia, and a rise in SCr due to intrinsic kidney injury. An elevation of structural injury biomarkers in the absence of a significant rise in SCr is referred to as subclinical AKI. Patients with subclinical AKI have worse outcomes than those without AKI but better outcomes than patients with AKI with elevation of both SCr and NGAL (Figure).2,6 Time to resolution of AKI further refines our ability to predict prognosis and outcomes. Transient AKI, defined as resolution within 48 hours, is associated with a better prognosis than persistent AKI. Renal dysfunction lasting more than seven days but less than 90 days is referred to as acute kidney disease (AKD). While both transient AKI and AKD represent different entities on the continuum between AKI and CKD, further research is needed to better elucidate these classifications.2
RISK STRATIFICATION
The renal angina index (RAI) identifies critically ill children at high risk for AKI. The RAI combines traditional markers of AKI, such as a change in estimated creatinine clearance and fluid overload, with patient factors, including need for ventilation, inotropic support, and history of transplantation (solid organ or bone marrow) to identify those patients who are at high risk for severe AKI. Patients identified as high risk by the patient factors component of the RAI have a much lower threshold for both a decrease in creatinine clearance and fluid overload to be considered at risk for severe AKI, as these early signs are more likely to reflect an early impending severe AKI in this high-risk group. Conversely, patients that do not meet these patient factors are more likely to simply have a transient or functional AKI, and therefore have a higher threshold for both a change in creatinine clearance and fluid overload in order to be considered at high risk for severe AKI.
The RAI has been validated in the critical care setting as a method to predict severe AKI at day three of admission to the pediatric intensive care unit, with a negative predictive value of 92%-99% when the score is negative in the first 12 hours.10 In selected high-risk patients (RAI ≥ 8), biomarkers become even more reliable for AKI prediction (eg, injury markers have an excellent area under the receiver operating characteristic curve (AUC) of 0.97 for severe AKI prediction in this high-risk group).11 While only validated for critically ill patients, the concept of renal angina is still applicable in the complex populations managed by hospitalists who practice outside of the intensive care unit setting. Early signs of renal dysfunction (eg, rising SCr, fluid overload ≥5%) in patients with risk factors (see below) should prompt a thorough evaluation, including urinalysis, daily SCr, nephrotoxin avoidance, and tissue injury biomarkers, if available.
The risk factors for AKI are numerous and tend to potentiate one another. The most frequent predisposing comorbidities include CKD, heart failure or congenital heart diseases, transplantation (bone marrow or solid organs), and diabetes. Disease-related factors include sepsis, cardiac surgery, cardio-pulmonary bypass, mechanical ventilation, and vasopressor use. Potentially modifiable factors include hypovolemia and multiple nephrotoxic exposures. 2,3
Nephrotoxic medications are now among the most common causes of AKI in hospitalized children.12 Approximately 80% of children are exposed to at least one nephrotoxin during an inpatient admission.12 Exposure to a single nephrotoxic medication is sufficient to place a child at risk of AKI, and each additional nephrotoxin further increases the risk.12 While some drugs are routinely recognized to be nephrotoxic (eg, ibuprofen), others are commonly overlooked, notably certain antibiotics (eg, cefotaxime, ceftazidime, cefuroxime, nafcillin, and piperacillin) and anticonvulsants (eg, zonisamide).12 Furthermore, the combination of multiple nephrotoxins can potentiate the risk of AKI. For example, the combination of vancomycin and piperacillin/tazobactam increases the risk of AKI by 3.4 times compared with the combination of vancomycin with another antipseudomonal beta-lactam antibiotic.13
Adequate monitoring, including daily SCr measurements and risk awareness, are critical as nephrotoxin-associated AKI can be easily missed in the absence of routine SCr monitoring, especially since these children are typically nonoliguric12. Quality improvement efforts focused on obtaining daily SCr in patients exposed to either three or more nephrotoxins or three days of either aminoglycoside or vancomycin, even without concomitant exposure to other nephrotoxins, have shown success in decreasing both the number of nephrotoxins and the rate of nephrotoxin-associated AKI.12
While a significant injury cannot always be avoided, a mindful clinical approach and management can help to prevent some complications of AKI. An awareness of fluid status is critical, as fluid overload greater than 10% of the patient’s weight independently increases the risk of mortality in both adults and children.14 To assess the risk of AKI progression and potential failure of conservative management with diuretics, a furosemide stress test (FST) is an easy, safe, and accessible functional assessment of tubular reserve in a patient without intravascular depletion.15 A growing body of literature in adults shows that FST-responders are less likely to progress to stage 3 AKI or need renal replacement therapy than nonresponders.15 The FST is currently being investigated and standardized in children.
CONCLUSION
Research in AKI has made significant strides over the last few years. Nevertheless, many areas of research remain to be explored (eg, the impact of IV fluid type in the pediatric population, AKD characterization and impact on CKD development). AKI is common, associated with significant morbidity and mortality and, in some instances, preventable. While no targeted therapeutic options are currently under investigation, recent advances allow for better identification of high-risk patients and offer opportunities for impactful preventive approaches. Thoughtful use of nephrotoxic medications, early identification of patients at high risk for AKI, and accurate diagnosis and appropriate management of AKI are the recommended best practice.
Disclosures
The authors have nothing to disclose.
1. McGregor TL, Jones DP, Wang L, et al. Acute kidney injury incidence in noncritically ill hospitalized children, adolescents, and young adults: a retrospective observational study. Am J Kidney Dis. 2016;67(3):384-390. https://doi.org/10.1053/j.ajkd.2015.07.019.
2. Chawla LS, Bellomo R, Bihorac A, et al. Acute kidney disease and renal recovery: consensus report of the Acute Disease Quality Initiative (ADQI) 16 Workgroup. Nat Rev Nephrol. 2017;13(4):241-257. https://doi.org/10.1038/nrneph.2017.2.
3. Khwaja A. KDIGO clinical practice guidelines for acute kidney injury. Nephron Clin Pract. 2012;120(4):179-184. https://doi.org/10.1159/000339789.
4. Filho LT, Grande AJ, Colonetti T, Della ÉSP, da Rosa MI. Accuracy of neutrophil gelatinase-associated lipocalin for acute kidney injury diagnosis in children: systematic review and meta-analysis. Pediatr Nephrol. 2017;32(10):1979-1988. https://doi.org/10.1007/s00467-017-3704-6.
5. Levey AS, Inker LA. Assessment of glomerular filtration rate in health and disease: a state of the art review. Clin Pharmacol Ther. 2017;102(3):405-419. https://doi.org/10.1002/cpt.729.
6. Endre ZH, Kellum JA, Di Somma S, et al. Differential diagnosis of AKI in clinical practice by functional and damage biomarkers: workgroup statements from the tenth Acute Dialysis Quality Initiative Consensus Conference. Contrib Nephrol. 2013;182:30-44. https://doi.org/10.1159/000349964.
7. Su LJ, Li YM, Kellum JA, Peng ZY. Predictive value of cell cycle arrest biomarkers for cardiac surgery-associated acute kidney injury: a meta-analysis. Br J Anaesth. 2018;121(2):350-357. https://doi.org/10.1016/j.bja.2018.02.069.
8. Westhoff JH, Tönshoff B, Waldherr S, et al. Urinary tissue inhibitor of metalloproteinase-2 (TIMP-2) · insulin-like growth factor-binding protein 7 (IGFBP7) predicts adverse outcome in pediatric acute kidney injury. PLoS One. 2015;10(11):1-16. https://doi.org/10.1371/journal.pone.0143628.
9. Berg UB, Nyman U, Bäck R, et al. New standardized cystatin C and creatinine GFR equations in children validated with inulin clearance. Pediatr Nephrol. 2015;30(8):1317-1326. https://doi.org/10.1007/s00467-015-3060-3.
10. Chawla LS, Goldstein SL, Kellum JA, Ronco C. Renal angina: concept and development of pretest probability assessment in acute kidney injury. Crit Care. 2015;19(1):93. https://doi.org/10.1186/s13054-015-0779-y.
11. Menon S, Goldstein SL, Mottes T, et al. Urinary biomarker incorporation into the renal angina index early in intensive care unit admission optimizes acute kidney injury prediction in critically ill children: a prospective cohort study. Nephrol Dial Transplant. 2016;31(4):586-594. https://doi.org/10.1093/ndt/gfv457.
12. Goldstein SL, Mottes T, Simpson K, et al. A sustained quality improvement program reduces nephrotoxic medication-associated acute kidney injury. Kidney Int. 2016;90(1):212-221. https://doi.org/10.1016/j.kint.2016.03.031.
13. Downes KJ, Cowden C, Laskin BL, et al. Association of acute kidney injury with concomitant vancomycin and piperacillin/tazobactam treatment among hospitalized children. JAMA Pediatr. 2017;19146:e173219-e173219. https://doi.org/10.1001/JAMAPEDIATRICS.2017.3219.
14. Naipaul A, Jefferson LS, Goldstein SL, Loftis LL, Zappitelli M, Arikan AA. Fluid overload is associated with impaired oxygenation and morbidity in critically ill children*. Pediatr Crit Care Med. 2011;13(3):253-258. https://doi.org/10.1097/pcc.0b013e31822882a3.
15. Lumlertgul N, Peerapornratana S, Trakarnvanich T, et al. Early versus standard initiation of renal replacement therapy in furosemide stress test non-responsive acute kidney injury patients (the FST trial). Crit Care. 2018;22(1):1-9. https://doi.org/10.1186/s13054-018-2021-1.
© 2019 Society of Hospital Medicine
Nurturing Sustainability in a Growing Community Pediatric Hospital Medicine Workforce
Systematic efforts to measure and compare work hours emerged in the 19th century as laborers shifted from artisanal shops to factories, sparking debate over the appropriate length and intensity of work.1 Two centuries of unionization and regulation defined work hours for many United States employees, including graduate medical trainees, but left attending physicians largely untouched. Instead, the medical workforce has long relied on survey data to shape jobs that balance professional norms with local market demands. Leaders in young, dynamic specialties, such as pediatric hospital medicine (PHM), particularly require such data to recruit and retain talent.
PHM progressed swiftly from acknowledgment as a “distinct area of practice” in 1999 to a subspecialty recognition.2 Currently, at least 3,000 pediatric hospitalists3 practice in more than 800 US sites (Snow C, Personal communication regarding community PHM workforce survey). Approximately half of them work at community hospitals, where PHM groups often comprise fewer than five full-time equivalents (FTEs) and face unique challenges. Community PHM practices may assume broader responsibilities than university/children’s hospital colleagues, including advocacy for the needs of children in predominantly adult-oriented hospitals.4 Although data regarding academic PHM work demands are available,5 there is little information pertaining to community hospitalists regarding typical workloads or other characteristics of thriving practices.
In this issue of the Journal of Hospital Medicine, Alvarez et al. present the findings of structured interviews with 70 community PHM group leaders.6 Each participant answered 12 questions about their group, addressing the definition of a full-time workload and hours, the design of backup systems, and the respondent’s perception of the program’s sustainability. The sample is robust, with the caveats that it disproportionately represents the Midwest and West (34.3% each) and more than half of the groups were employed by an academic institution. The authors found a median work expectation per FTE of 1,882 hours/year and 21 weekends per year, although they noted significant variability in employers’ demands and services provided. The majority of hospitalist groups lacked census caps, formal backup systems, or processes to expand coverage during busy seasons. Among the site leaders, 63% perceived their program as sustainable, but no program design or employer characteristic was clearly associated with this perception.
The importance of this study derives from aggregating data about the largest cross section of community PHM groups yet reported. For many PHM group leaders, this will offer a new point of reference for key practice characteristics. Furthermore, the authors should be commended for attempting to distinguish how program sustainability manifests in community PHM, where hospitalists shoulder longer patient care hours and many of them sustain academic endeavors. It is concerning that more than a third of leaders do not perceive their program as sustainable, but the implications for the field are unclear. Perhaps part of this uncertainty arises from the terminology, as sustainability lacks a technical or a consensus definition and the authors purposefully did not define the term for the respondents. While many respondents probably worried about physician burnout, others might have channeled fears about group finances or competition with adult service lines for beds. In addition, leaders’ fears about sustainability may not exactly represent the concerns of front-line employees.
Sustainable work environments are complex constructs with several inputs. For example, supportive leaders, efficient delivery systems, optimized EHRs, competitive pay, and confidence about service line stability might all mitigate higher workloads. Ultimately, this complexity underscores an important caution about all workplace surveys in medicine; ie, average values can inform practice design, but hospitalists and administrators should always consider the local context. Blindly applying medians as benchmarks and ignoring the myriad other contributors to sustainable practice risk disrupting successful PHM programs. In other words, surveys describe how the world is, not how it should be. The spectrum of academic work and norms permeating community PHM groups instead call for a nuanced approach.
How does the field build upon this useful paper? First, the Society of Hospital Medicine (SHM) should engage PHM leaders to increase participation in regular remeasurement, a critical endeavor for this dynamic field. SHM’s State of Hospital Medicine Report queries about a wider variety of practice characteristics, but it has a smaller sample size that must grow to fill this void.7 As the work of repeated surveys transitions from academic inquiry to professional society service, SHM’s Practice Analysis Committee can meet the needs of PHM through relevant questions and efforts to foster adequate participation. Second, all practice leaders should follow the ballooning bodies of literature about burnout and healthcare value. Just as labor leaders had discovered in the industrial revolution, sustainable careers require not only measuring work hours but also advocating for safe, meaningful, and engaging work conditions. By continuously creating value for patients, families, and hospitals, we can strengthen our claim to the resources needed to optimize the work environment.
Disclosure
Andrew White is Chair of the Society of Hospital Medicine’s Practice Analysis Committee, an unpaid position. Dr. Marek serves on the American Academy of Pediatrics Section on Hospital Medicine Executive Committee which is a voluntary, unpaid, elected position.
1. Whaples R. Hours of Work in U.S. History. EH Net Encyclopedia. 2001. http://eh.net/encyclopedia/hours-of-work-in-u-s-history/. Accessed June 25, 2019.
2. Pediatric Hospital Medicine Certification. The American Board of Pediatrics.
https://www.abp.org/content/pediatric-hospital-medicine-certification.
Accessed 28 February, 2018.
3. Harbuck SM, Follmer AD, Dill MJ, Erikson C. Estimating the number and characteristics
of hospitalist physicians in the United States and their possible workforce
implications. Association of Medical Colleges. 2012. www.aamc.org/download/
300620/data/aibvol12_no3-hospitalist.pdf. Accessed June 25, 2019.
4. Roberts KB, Brown J, Quinonez RA, Percelay JM. Institutions and individuals:
what makes a hospitalist “academic”? Hosp Pediatr. 2014;4(5);326-327.
https://doi.org/10.1542/hpeds.2014-00.
5. Fromme HB, Chen CO, Fine BR, Gosdin C, Shaughnessy EE. Pediatric hospitalist
workload and sustainability in university-based programs: results from a
national interview-based survey. J Hosp Med. 2018;13(10):702-705. https://doi.
org/10.12788/jhm.2977.
6. Alvarez, F, McDaniel CE, Birnie K, et al. Community pediatric hospitalist
workload: results from a national survey. J Hosp Med. 2019; 14(11):682-685. https://
doi.org/10.12788/jhm.3263.
7. 2018 State of Hospital Medicine Report. Society of Hospital Medicine: Philadelphia,
Pennsylvania; 2019. https://www.hospitalmedicine.org/practice-management/
shms-state-of-hospital-medicine/. Accessed July 27, 2019.
Systematic efforts to measure and compare work hours emerged in the 19th century as laborers shifted from artisanal shops to factories, sparking debate over the appropriate length and intensity of work.1 Two centuries of unionization and regulation defined work hours for many United States employees, including graduate medical trainees, but left attending physicians largely untouched. Instead, the medical workforce has long relied on survey data to shape jobs that balance professional norms with local market demands. Leaders in young, dynamic specialties, such as pediatric hospital medicine (PHM), particularly require such data to recruit and retain talent.
PHM progressed swiftly from acknowledgment as a “distinct area of practice” in 1999 to a subspecialty recognition.2 Currently, at least 3,000 pediatric hospitalists3 practice in more than 800 US sites (Snow C, Personal communication regarding community PHM workforce survey). Approximately half of them work at community hospitals, where PHM groups often comprise fewer than five full-time equivalents (FTEs) and face unique challenges. Community PHM practices may assume broader responsibilities than university/children’s hospital colleagues, including advocacy for the needs of children in predominantly adult-oriented hospitals.4 Although data regarding academic PHM work demands are available,5 there is little information pertaining to community hospitalists regarding typical workloads or other characteristics of thriving practices.
In this issue of the Journal of Hospital Medicine, Alvarez et al. present the findings of structured interviews with 70 community PHM group leaders.6 Each participant answered 12 questions about their group, addressing the definition of a full-time workload and hours, the design of backup systems, and the respondent’s perception of the program’s sustainability. The sample is robust, with the caveats that it disproportionately represents the Midwest and West (34.3% each) and more than half of the groups were employed by an academic institution. The authors found a median work expectation per FTE of 1,882 hours/year and 21 weekends per year, although they noted significant variability in employers’ demands and services provided. The majority of hospitalist groups lacked census caps, formal backup systems, or processes to expand coverage during busy seasons. Among the site leaders, 63% perceived their program as sustainable, but no program design or employer characteristic was clearly associated with this perception.
The importance of this study derives from aggregating data about the largest cross section of community PHM groups yet reported. For many PHM group leaders, this will offer a new point of reference for key practice characteristics. Furthermore, the authors should be commended for attempting to distinguish how program sustainability manifests in community PHM, where hospitalists shoulder longer patient care hours and many of them sustain academic endeavors. It is concerning that more than a third of leaders do not perceive their program as sustainable, but the implications for the field are unclear. Perhaps part of this uncertainty arises from the terminology, as sustainability lacks a technical or a consensus definition and the authors purposefully did not define the term for the respondents. While many respondents probably worried about physician burnout, others might have channeled fears about group finances or competition with adult service lines for beds. In addition, leaders’ fears about sustainability may not exactly represent the concerns of front-line employees.
Sustainable work environments are complex constructs with several inputs. For example, supportive leaders, efficient delivery systems, optimized EHRs, competitive pay, and confidence about service line stability might all mitigate higher workloads. Ultimately, this complexity underscores an important caution about all workplace surveys in medicine; ie, average values can inform practice design, but hospitalists and administrators should always consider the local context. Blindly applying medians as benchmarks and ignoring the myriad other contributors to sustainable practice risk disrupting successful PHM programs. In other words, surveys describe how the world is, not how it should be. The spectrum of academic work and norms permeating community PHM groups instead call for a nuanced approach.
How does the field build upon this useful paper? First, the Society of Hospital Medicine (SHM) should engage PHM leaders to increase participation in regular remeasurement, a critical endeavor for this dynamic field. SHM’s State of Hospital Medicine Report queries about a wider variety of practice characteristics, but it has a smaller sample size that must grow to fill this void.7 As the work of repeated surveys transitions from academic inquiry to professional society service, SHM’s Practice Analysis Committee can meet the needs of PHM through relevant questions and efforts to foster adequate participation. Second, all practice leaders should follow the ballooning bodies of literature about burnout and healthcare value. Just as labor leaders had discovered in the industrial revolution, sustainable careers require not only measuring work hours but also advocating for safe, meaningful, and engaging work conditions. By continuously creating value for patients, families, and hospitals, we can strengthen our claim to the resources needed to optimize the work environment.
Disclosure
Andrew White is Chair of the Society of Hospital Medicine’s Practice Analysis Committee, an unpaid position. Dr. Marek serves on the American Academy of Pediatrics Section on Hospital Medicine Executive Committee which is a voluntary, unpaid, elected position.
1. Whaples R. Hours of Work in U.S. History. EH Net Encyclopedia. 2001. http://eh.net/encyclopedia/hours-of-work-in-u-s-history/. Accessed June 25, 2019.
2. Pediatric Hospital Medicine Certification. The American Board of Pediatrics.
https://www.abp.org/content/pediatric-hospital-medicine-certification.
Accessed 28 February, 2018.
3. Harbuck SM, Follmer AD, Dill MJ, Erikson C. Estimating the number and characteristics
of hospitalist physicians in the United States and their possible workforce
implications. Association of Medical Colleges. 2012. www.aamc.org/download/
300620/data/aibvol12_no3-hospitalist.pdf. Accessed June 25, 2019.
4. Roberts KB, Brown J, Quinonez RA, Percelay JM. Institutions and individuals:
what makes a hospitalist “academic”? Hosp Pediatr. 2014;4(5);326-327.
https://doi.org/10.1542/hpeds.2014-00.
5. Fromme HB, Chen CO, Fine BR, Gosdin C, Shaughnessy EE. Pediatric hospitalist
workload and sustainability in university-based programs: results from a
national interview-based survey. J Hosp Med. 2018;13(10):702-705. https://doi.
org/10.12788/jhm.2977.
6. Alvarez, F, McDaniel CE, Birnie K, et al. Community pediatric hospitalist
workload: results from a national survey. J Hosp Med. 2019; 14(11):682-685. https://
doi.org/10.12788/jhm.3263.
7. 2018 State of Hospital Medicine Report. Society of Hospital Medicine: Philadelphia,
Pennsylvania; 2019. https://www.hospitalmedicine.org/practice-management/
shms-state-of-hospital-medicine/. Accessed July 27, 2019.
© 2019 Society of Hospital Medicine
Fatal Drug-Resistant Invasive Pulmonary Aspergillus fumigatus in a 56-Year-Old Immunosuppressed Man (FULL)
Historically, aspergillosis in patients with hematopoietic stem cell transplantation (HSCT) has carried a high mortality rate. However, recent data demonstrate a dramatic improvement in outcomes for patients with HSCT: 90-day survival increased from 22% before 2000 to 45% over the past 15 years.1 Improved outcomes coincide with changes in transplant immunosuppression practices, use of cross-sectional imaging for early disease identification, galactomannan screening, and the development of novel treatment options.
Voriconazole is an azole drug that blocks the synthesis of ergosterol, a vital component of the cellular membrane of fungi. Voriconazole was approved in 2002 after a clinical trial demonstrated an improvement in 50% of patients with invasive aspergillosis in the voriconazole arm vs 30% in the amphotericin B arm at 12 weeks.2 Amphotericin B is a polyene antifungal drug that binds with ergosterol, creating leaks in the cell membrane that lead to cellular demise. Voriconazole quickly became the first-line therapy for invasive aspergillosis and is recommended by both the Infectious Disease Society of American (IDSA) and the European Conference on Infections in Leukemia.3
Case Presentation
A 55-year-old man with high-risk chronic myelogenous leukemia (CML) underwent a 10 of 10 human leukocyte antigen allele and antigen-matched peripheral blood allogeneic HSCT with a myeloablative-conditioning regimen of busulfan and cyclophosphamide, along with prophylactic voriconazole, sulfamethoxazole/trimethoprim, and acyclovir. After successful engraftment (without significant neutropenia), his posttransplant course was complicated by grade 2 graft vs host disease (GVHD) of the skin, eyes, and liver, which responded well to steroids and tacrolimus. Voriconazole was continued for 5 months until immunosuppression was minimized (tacrolimus 1 mg twice daily). Two months later, the patient’s GVHD worsened, necessitating treatment at an outside hospital with high-dose prednisone (2 mg/kg/d) and cyclosporine (300 mg twice daily). Voriconazole prophylaxis was not reinitiated at that time.
One year later, at a routine follow-up appointment, the patient endorsed several weeks of malaise, weight loss, and nonproductive cough. The patient’s immunosuppression recently had been reduced to 1 mg/kg/d of prednisone and 100 mg of cyclosporine twice daily. A chest X-ray demonstrated multiple pulmonary nodules; follow-up chest computed tomography (CT) confirmed multiple nodular infiltrates with surrounding ground-glass opacities suspicious with a fungal infection (Figure 1). 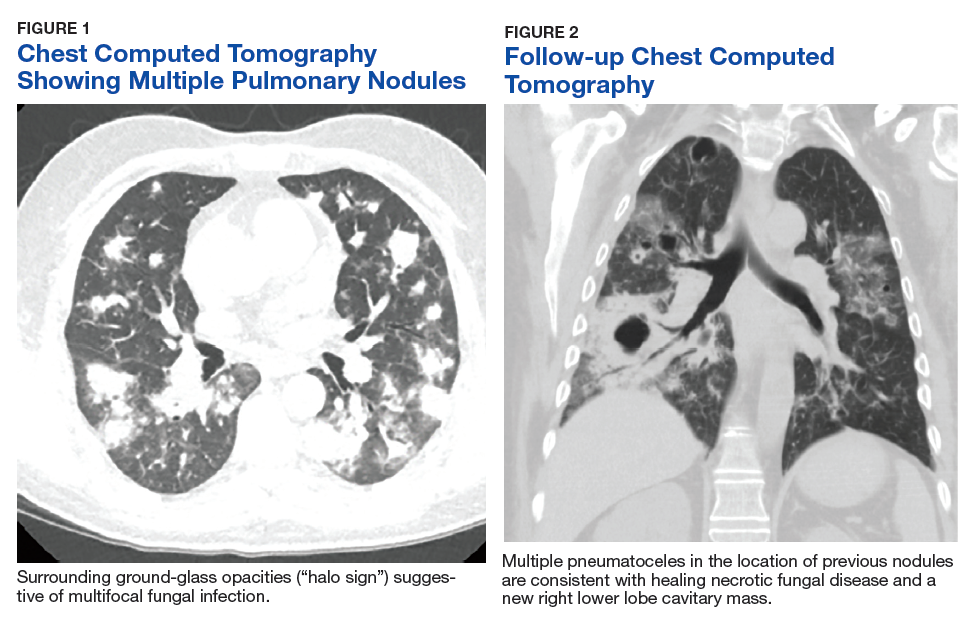
Treatment with oral voriconazole (300 mg twice daily) was initiated for probable pulmonary aspergillosis. Cyclosporine (150 mg twice daily) and prednisone (1 mg/kg/d) were continued throughout treatment out of concern for hepatic GVHD. The patient’s symptoms improved over the next 10 days, and follow-up chest imaging demonstrated improvement.
Two weeks after initiation of voriconazole treatment, the patient developed a new productive cough and dyspnea, associated with fevers and chills. Repeat imaging revealed right lower-lobe pneumonia. The serum voriconazole trough level was checked and was 3.1 mg/L, suggesting therapeutic dosing. The patient subsequently developed acute respiratory distress syndrome and required intubation and mechanical ventilation. Repeat BAL sampling demonstrated multidrug-resistant Escherichia coli, a BAL galactomannan level of 2.0 ODI, and negative fungal cultures. The patient’s hospital course was complicated by profound hypoxemia, requiring prone positioning and neuromuscular blockade. He was treated with meropenem and voriconazole. His immunosuppression was reduced, but he rapidly developed acute liver injury from hepatic GVHD that resolved after reinitiation of cyclosporine and prednisone at 0.75 mg/kg/d.
The patient improved over the next 3 weeks and was successfully extubated. Repeat chest CT imaging demonstrated numerous pneumatoceles in the location of previous nodules, consistent with healing necrotic fungal disease, and a new right lower-lobe cavitary mass (Figure 2). Two days after transferring out of the intensive care unit, the patient again developed hypoxemia and fevers to 39° C. Bronchoscopy with BAL of the right lower lobe revealed positive A fumigatus and Rhizopus sp polymerase chain reaction (PCR) assays, although fungal cultures were positive only for A fumigatus. Liposomal amphotericin B (5 mg/kg) was added to voriconazole therapy to treat mucormycosis and to provide a second active agent against A fumigatus.
Unfortunately, the patient’s clinical status continued to deteriorate with signs of progressive respiratory failure and infection despite empiric, broad-spectrum antibiotics and dual antifungal therapy. His serum voriconazole level continued to be therapeutic at 1.9 mg/L. The patient declined reintubation and invasive mechanical ventilation, and he ultimately transitioned to comfort measures and died with his family at the bedside.
Autopsy demonstrated widely disseminated Aspergillus infection as the cause of death, with evidence of myocardial, neural, and vascular invasion of A fumigatus (Figures 3 and 4). 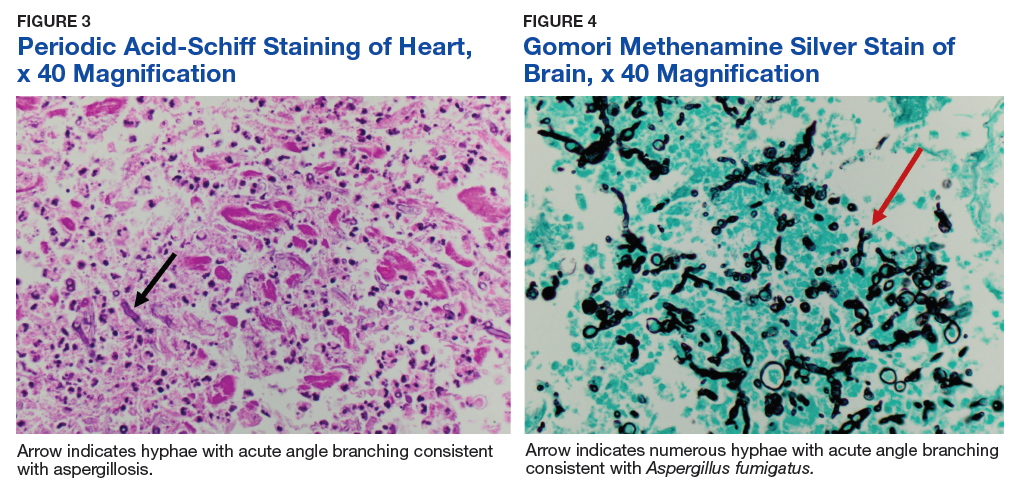
Discussion
This case of fatal, progressive, invasive, pulmonary aspergillosis demonstrates several important factors in the treatment of patients with this disease. Treatment failure usually relates to any of 4 possible factors: host immune status, severity or burden of disease, appropriate dosing of antifungal agents, and drug resistance. This patient’s immune system was heavily suppressed for a prolonged period. Attempts at reducing immunosuppression to the minimal required dosage to prevent a GVHD flare were unsuccessful and became an unmodifiable risk factor, a major contributor to his demise.
The risks of continuous high-dose immunosuppression in steroid-refractory GVHD is well understood and has been previously demonstrated to have up to 50% 4-year nonrelapse mortality, mainly due to overwhelming bacterial, viral, and fungal infections.4 All attempts should be made to cease or reduce immunosuppression in the setting of a severe infection, although this is sometimes impossible as in this case.
The patient’s disease burden was significant as evidenced by the bilateral, multifocal pulmonary nodules seen on chest imaging and the disseminated disease found at postmortem examination. His initial improvement in symptoms with voriconazole and the evolution of his images (with many of his initial pulmonary nodules becoming pneumatoceles) suggested a temporary positive immune response. The authors believe that the Rhizopus in his sputum represents noninvasive colonization of one of his pneumatoceles, because postmortem examination failed to reveal Rhizopus at any other location.
Voriconazole has excellent pulmonary and central nervous system penetration: In this patient serum levels were well within the therapeutic range. His peculiar drug resistance pattern (sensitivity to azoles and resistance to amphotericin) is unusual. Azole resistance in leukemia and patients with HSCT is more common than is amphotericin resistance, with current estimates of azole resistance close to 5%, ranging between 1% and 30%.5,6 Widespread use of antifungal prophylaxis with azoles likely selects for azole resistance.6
Despite this concern of azole resistance, current IDSA guidelines recommend against routine susceptibility testing of Aspergillus to azole therapy because of the current lack of consensus between the European Committee on Antibiotic Susceptibility Testing and Clinical and Laboratory Standards Institute on break points for resistance patterns.3,7 This is an area of emerging research, and proposed cut points for declaration of resistance do exist in the literature even if not globally agreed on.8
Combination antifungal therapy is an option for treatment in cases of possible drug resistance. Nonetheless, a recent randomized, double-blind, placebo-controlled, multicenter trial comparing voriconazole monotherapy with the combination of voriconazole and anidulafungin failed to demonstrate an overall mortality benefit in the primary analysis, although secondary analysis showed a mortality benefit with combination therapy in patients at highest risk for death.9
Despite the lack of unified standards with susceptibility testing, it may be reasonable to perform such tests in patients with demonstrating progressive disease. In this patient’s case, amphotericin B was added to treat the Rhizopus species found in his sputum, and while not the combination studied in the previously mentioned study, the drug should have provided an additional active agent for Aspergillus should this patient have had azole resistance.
Surprisingly, subsequent testing demonstrated the Aspergillus species to be resistant to amphotericin B. De novo amphotericin B-resistant A fumigates is extremely rare, with an expected incidence of 1% or less.10 The authors believe the patient may have demonstrated induction of amphotericin-B resistance through activation of fungal stress pathways by prior treatment with voriconazole. This has been demonstrated in vitro and should be considered should combination salvage therapy be required for the treatment of a refractory Aspergillus infection especially if patients have received prior treatment with voriconazole.11
Conclusion
This fatal case of invasive pulmonary aspergillosis illustrates the importance of considering the 4 main causes of treatment failure in an infection. Although the patient had a high burden of disease with a rare resistance pattern, he was treated with appropriate and well-dosed therapy. Ultimately, his unmodifiable immunosuppression was likely the driving factor leading to treatment failure and death. The indication for and number of bone marrow transplants continues to increase, thus exposure to and treatment of invasive fungal infections will increase accordingly. As such, providers should ensure that all causes of treatment failure are considered and addressed.
1. Upton A, Kirby KA, Carpenter P, Boeckh M, Marr KA. Invasive aspergillosis following hematopoietic cell transplantation: outcomes and prognostic factors associated with mortality. Clin Infect Dis. 2007;44(4):531-540.
2. Herbrecht R, Denning DW, Patterson TF, et al; Invasive Fungal Infections Group of the European Organisation for Research and Treatment of Cancer and the Global Aspergillus Study Group. Voriconazole versus amphotericin B for primary therapy of invasive aspergillosis. N Engl J Med. 2002;347(6):408-415.
3. Patterson TF, Thompson GR III, Denning DW, et al. Practice guidelines for the diagnosis and management of aspergillosis: 2016 update by the Infectious Disease Society of America. Clin Infect Dis. 2016;63(4):e1-e60.
4. García-Cadenas I, Rivera I, Martino R, et al. Patterns of infection and infection-related mortality in patients with steroid-refractory acute graft versus host disease. Bone Marrow Transplant. 2017;52(1):107-113.
5. Vermeulen E, Maertens J, De Bel A, et al. Nationwide surveillance of azole resistance in Aspergillus diseases. Antimicrob Agents Chemother. 2015;59(8):4569-4576.
6. Wiederhold NP, Patterson TF. Emergence of azole resistance in Aspergillus. Semin Respir Crit Care Med. 2015;36(5):673-680.
7. Cuenca-Estrella M, Moore CB, Barchiesi F, et al; AFST Subcommittee of the European Committee on Antimicrobial Susceptibility Testing. Multicenter evaluation of the reproducibility of the proposed antifungal susceptibility testing method for fermentative yeasts of the Antifungal Susceptibility Testing Subcommittee of the European Committee on Antimicrobial Susceptibility Testing (AFST-EUCAST). Clin Microbiol Infect. 2003;9(6):467-474.
8. Pfaller MA, Diekema DJ, Ghannoum MA, et al; Clinical and Laboratory Standards Institute Antifungal Testing Subcommittee. Wild-type MIC distribution and epidemiological cutoff values for Aspergillus fumigatus and three triazoles as determined by Clinical and Laboratory Standards Institute for broth microdilution methods. J Clin Microbiol. 2009;47(10):3142-3146.
9. Marr KA, Schlamm HT, Herbrecht R, et al. Combination antifungal therapy for invasive aspergillosis: a randomized trial. Ann Intern Med. 2015;162(2):81-89.
10. Tashiro M, Izumikawa K, Minematsu A, et al. Antifungal susceptibilities of Aspergillus fumigatus clinical isolates obtained in Nagasaki, Japan. Antimicrob Agents Chemother. 2012;56(1):584-587.
11. Rajendran R, Mowat E, Jones B, Williams C, Ramage G. Prior in vitro exposure to voriconazole confers resistance to amphotericin B in Aspergillus fumigatus biofilms. Int J Antimicrob Agents. 2015;46(3):342-345.
Historically, aspergillosis in patients with hematopoietic stem cell transplantation (HSCT) has carried a high mortality rate. However, recent data demonstrate a dramatic improvement in outcomes for patients with HSCT: 90-day survival increased from 22% before 2000 to 45% over the past 15 years.1 Improved outcomes coincide with changes in transplant immunosuppression practices, use of cross-sectional imaging for early disease identification, galactomannan screening, and the development of novel treatment options.
Voriconazole is an azole drug that blocks the synthesis of ergosterol, a vital component of the cellular membrane of fungi. Voriconazole was approved in 2002 after a clinical trial demonstrated an improvement in 50% of patients with invasive aspergillosis in the voriconazole arm vs 30% in the amphotericin B arm at 12 weeks.2 Amphotericin B is a polyene antifungal drug that binds with ergosterol, creating leaks in the cell membrane that lead to cellular demise. Voriconazole quickly became the first-line therapy for invasive aspergillosis and is recommended by both the Infectious Disease Society of American (IDSA) and the European Conference on Infections in Leukemia.3
Case Presentation
A 55-year-old man with high-risk chronic myelogenous leukemia (CML) underwent a 10 of 10 human leukocyte antigen allele and antigen-matched peripheral blood allogeneic HSCT with a myeloablative-conditioning regimen of busulfan and cyclophosphamide, along with prophylactic voriconazole, sulfamethoxazole/trimethoprim, and acyclovir. After successful engraftment (without significant neutropenia), his posttransplant course was complicated by grade 2 graft vs host disease (GVHD) of the skin, eyes, and liver, which responded well to steroids and tacrolimus. Voriconazole was continued for 5 months until immunosuppression was minimized (tacrolimus 1 mg twice daily). Two months later, the patient’s GVHD worsened, necessitating treatment at an outside hospital with high-dose prednisone (2 mg/kg/d) and cyclosporine (300 mg twice daily). Voriconazole prophylaxis was not reinitiated at that time.
One year later, at a routine follow-up appointment, the patient endorsed several weeks of malaise, weight loss, and nonproductive cough. The patient’s immunosuppression recently had been reduced to 1 mg/kg/d of prednisone and 100 mg of cyclosporine twice daily. A chest X-ray demonstrated multiple pulmonary nodules; follow-up chest computed tomography (CT) confirmed multiple nodular infiltrates with surrounding ground-glass opacities suspicious with a fungal infection (Figure 1).
Treatment with oral voriconazole (300 mg twice daily) was initiated for probable pulmonary aspergillosis. Cyclosporine (150 mg twice daily) and prednisone (1 mg/kg/d) were continued throughout treatment out of concern for hepatic GVHD. The patient’s symptoms improved over the next 10 days, and follow-up chest imaging demonstrated improvement.
Two weeks after initiation of voriconazole treatment, the patient developed a new productive cough and dyspnea, associated with fevers and chills. Repeat imaging revealed right lower-lobe pneumonia. The serum voriconazole trough level was checked and was 3.1 mg/L, suggesting therapeutic dosing. The patient subsequently developed acute respiratory distress syndrome and required intubation and mechanical ventilation. Repeat BAL sampling demonstrated multidrug-resistant Escherichia coli, a BAL galactomannan level of 2.0 ODI, and negative fungal cultures. The patient’s hospital course was complicated by profound hypoxemia, requiring prone positioning and neuromuscular blockade. He was treated with meropenem and voriconazole. His immunosuppression was reduced, but he rapidly developed acute liver injury from hepatic GVHD that resolved after reinitiation of cyclosporine and prednisone at 0.75 mg/kg/d.
The patient improved over the next 3 weeks and was successfully extubated. Repeat chest CT imaging demonstrated numerous pneumatoceles in the location of previous nodules, consistent with healing necrotic fungal disease, and a new right lower-lobe cavitary mass (Figure 2). Two days after transferring out of the intensive care unit, the patient again developed hypoxemia and fevers to 39° C. Bronchoscopy with BAL of the right lower lobe revealed positive A fumigatus and Rhizopus sp polymerase chain reaction (PCR) assays, although fungal cultures were positive only for A fumigatus. Liposomal amphotericin B (5 mg/kg) was added to voriconazole therapy to treat mucormycosis and to provide a second active agent against A fumigatus.
Unfortunately, the patient’s clinical status continued to deteriorate with signs of progressive respiratory failure and infection despite empiric, broad-spectrum antibiotics and dual antifungal therapy. His serum voriconazole level continued to be therapeutic at 1.9 mg/L. The patient declined reintubation and invasive mechanical ventilation, and he ultimately transitioned to comfort measures and died with his family at the bedside.
Autopsy demonstrated widely disseminated Aspergillus infection as the cause of death, with evidence of myocardial, neural, and vascular invasion of A fumigatus (Figures 3 and 4).
Discussion
This case of fatal, progressive, invasive, pulmonary aspergillosis demonstrates several important factors in the treatment of patients with this disease. Treatment failure usually relates to any of 4 possible factors: host immune status, severity or burden of disease, appropriate dosing of antifungal agents, and drug resistance. This patient’s immune system was heavily suppressed for a prolonged period. Attempts at reducing immunosuppression to the minimal required dosage to prevent a GVHD flare were unsuccessful and became an unmodifiable risk factor, a major contributor to his demise.
The risks of continuous high-dose immunosuppression in steroid-refractory GVHD is well understood and has been previously demonstrated to have up to 50% 4-year nonrelapse mortality, mainly due to overwhelming bacterial, viral, and fungal infections.4 All attempts should be made to cease or reduce immunosuppression in the setting of a severe infection, although this is sometimes impossible as in this case.
The patient’s disease burden was significant as evidenced by the bilateral, multifocal pulmonary nodules seen on chest imaging and the disseminated disease found at postmortem examination. His initial improvement in symptoms with voriconazole and the evolution of his images (with many of his initial pulmonary nodules becoming pneumatoceles) suggested a temporary positive immune response. The authors believe that the Rhizopus in his sputum represents noninvasive colonization of one of his pneumatoceles, because postmortem examination failed to reveal Rhizopus at any other location.
Voriconazole has excellent pulmonary and central nervous system penetration: In this patient serum levels were well within the therapeutic range. His peculiar drug resistance pattern (sensitivity to azoles and resistance to amphotericin) is unusual. Azole resistance in leukemia and patients with HSCT is more common than is amphotericin resistance, with current estimates of azole resistance close to 5%, ranging between 1% and 30%.5,6 Widespread use of antifungal prophylaxis with azoles likely selects for azole resistance.6
Despite this concern of azole resistance, current IDSA guidelines recommend against routine susceptibility testing of Aspergillus to azole therapy because of the current lack of consensus between the European Committee on Antibiotic Susceptibility Testing and Clinical and Laboratory Standards Institute on break points for resistance patterns.3,7 This is an area of emerging research, and proposed cut points for declaration of resistance do exist in the literature even if not globally agreed on.8
Combination antifungal therapy is an option for treatment in cases of possible drug resistance. Nonetheless, a recent randomized, double-blind, placebo-controlled, multicenter trial comparing voriconazole monotherapy with the combination of voriconazole and anidulafungin failed to demonstrate an overall mortality benefit in the primary analysis, although secondary analysis showed a mortality benefit with combination therapy in patients at highest risk for death.9
Despite the lack of unified standards with susceptibility testing, it may be reasonable to perform such tests in patients with demonstrating progressive disease. In this patient’s case, amphotericin B was added to treat the Rhizopus species found in his sputum, and while not the combination studied in the previously mentioned study, the drug should have provided an additional active agent for Aspergillus should this patient have had azole resistance.
Surprisingly, subsequent testing demonstrated the Aspergillus species to be resistant to amphotericin B. De novo amphotericin B-resistant A fumigates is extremely rare, with an expected incidence of 1% or less.10 The authors believe the patient may have demonstrated induction of amphotericin-B resistance through activation of fungal stress pathways by prior treatment with voriconazole. This has been demonstrated in vitro and should be considered should combination salvage therapy be required for the treatment of a refractory Aspergillus infection especially if patients have received prior treatment with voriconazole.11
Conclusion
This fatal case of invasive pulmonary aspergillosis illustrates the importance of considering the 4 main causes of treatment failure in an infection. Although the patient had a high burden of disease with a rare resistance pattern, he was treated with appropriate and well-dosed therapy. Ultimately, his unmodifiable immunosuppression was likely the driving factor leading to treatment failure and death. The indication for and number of bone marrow transplants continues to increase, thus exposure to and treatment of invasive fungal infections will increase accordingly. As such, providers should ensure that all causes of treatment failure are considered and addressed.
1. Upton A, Kirby KA, Carpenter P, Boeckh M, Marr KA. Invasive aspergillosis following hematopoietic cell transplantation: outcomes and prognostic factors associated with mortality. Clin Infect Dis. 2007;44(4):531-540.
2. Herbrecht R, Denning DW, Patterson TF, et al; Invasive Fungal Infections Group of the European Organisation for Research and Treatment of Cancer and the Global Aspergillus Study Group. Voriconazole versus amphotericin B for primary therapy of invasive aspergillosis. N Engl J Med. 2002;347(6):408-415.
3. Patterson TF, Thompson GR III, Denning DW, et al. Practice guidelines for the diagnosis and management of aspergillosis: 2016 update by the Infectious Disease Society of America. Clin Infect Dis. 2016;63(4):e1-e60.
4. García-Cadenas I, Rivera I, Martino R, et al. Patterns of infection and infection-related mortality in patients with steroid-refractory acute graft versus host disease. Bone Marrow Transplant. 2017;52(1):107-113.
5. Vermeulen E, Maertens J, De Bel A, et al. Nationwide surveillance of azole resistance in Aspergillus diseases. Antimicrob Agents Chemother. 2015;59(8):4569-4576.
6. Wiederhold NP, Patterson TF. Emergence of azole resistance in Aspergillus. Semin Respir Crit Care Med. 2015;36(5):673-680.
7. Cuenca-Estrella M, Moore CB, Barchiesi F, et al; AFST Subcommittee of the European Committee on Antimicrobial Susceptibility Testing. Multicenter evaluation of the reproducibility of the proposed antifungal susceptibility testing method for fermentative yeasts of the Antifungal Susceptibility Testing Subcommittee of the European Committee on Antimicrobial Susceptibility Testing (AFST-EUCAST). Clin Microbiol Infect. 2003;9(6):467-474.
8. Pfaller MA, Diekema DJ, Ghannoum MA, et al; Clinical and Laboratory Standards Institute Antifungal Testing Subcommittee. Wild-type MIC distribution and epidemiological cutoff values for Aspergillus fumigatus and three triazoles as determined by Clinical and Laboratory Standards Institute for broth microdilution methods. J Clin Microbiol. 2009;47(10):3142-3146.
9. Marr KA, Schlamm HT, Herbrecht R, et al. Combination antifungal therapy for invasive aspergillosis: a randomized trial. Ann Intern Med. 2015;162(2):81-89.
10. Tashiro M, Izumikawa K, Minematsu A, et al. Antifungal susceptibilities of Aspergillus fumigatus clinical isolates obtained in Nagasaki, Japan. Antimicrob Agents Chemother. 2012;56(1):584-587.
11. Rajendran R, Mowat E, Jones B, Williams C, Ramage G. Prior in vitro exposure to voriconazole confers resistance to amphotericin B in Aspergillus fumigatus biofilms. Int J Antimicrob Agents. 2015;46(3):342-345.
Tales From VA Anesthesiology
The patient grabbed my attention as I glanced through our clinic schedule. It was his age: He was 99 years old and scheduled for eye surgery. The plastic surgery resident’s note read: “Patient understands that this would involve surgery under general anesthesia and is agreeable to moving forward...Extremely high risk of anesthesia emphasized.”
I reviewed the patient’s history. At baseline, he had severe pulmonary hypertension, severe aortic stenosis (AS), diastolic heart failure, chronic atrial fibrillation, chronic kidney disease (estimated glomerular filtration rate of 26 mL/min [normal is > 60 mL/min]), anemia (hematocrit 26%), and a standing do not resuscitate (DNR) order. His maximal daily exercise was walking slowly across a room, primarily limited by joint pain. Recent geropsychiatry notes indicated mild cognitive impairment. The anesthesia record from an urgent hip fracture repair 7 months before under general anesthesia was unremarkable.
I phoned the attending plastic surgeon. Our conversation was as follows:
“Hi, I’m about to see a 99-year-old patient with a DNR who is scheduled for resection of an eyelid tumor. His medical history makes me nervous. Are you sure this is a good idea?”“Hmmm, 99-year-old…okay, that’s right,” he responded. “He has an invasive squamous that could become a big problem. The actual procedure is under 10 minutes. Waiting for the pathology report will be the longest part of the procedure.”
“Can it be done under local?” I asked.
“Yes,” he replied.
“Okay, I’ll talk to him and call you back.”
I found the patient in the waiting room, flanked by his 2 daughters and invited them into the clinic room. After introductions, I began asking whether they had any questions about the anesthesia. By midsentence a daughter was prompting him to discuss what happened “last time.” He described a history of posttraumatic stress disorder (PTSD) stemming from his hip surgery, which he blamed squarely on the anesthesia. His emotion was evident in the gathering pauses. “I hate that I am so emotional since they kept me awake during my surgery.”
Through the fog of multiple accounts, it became clear that he was traumatized by the loss of control during the administration of and emergence from the anesthesia.
“They told me it was only oxygen,” he said. “They lied. There was a taste to it…I was awake and skinned alive…They said I was a monster when I woke up thrashing.” He went on, explaining that in the recovery room “there were 2 people bothering me, man-handling me, asking me questions.”
One of his daughters showed me pictures of bruises on his face from ripping off the mask and pulling out the breathing tube. They were visibly upset by the memory of his postoperative combativeness and paranoia. The note written by the orthopedic surgery resident on the day after surgery stated succinctly, “Doing well, had some delirium from anesthesia overnight.” Subsequent geropsychiatry home visits attested to intrusive thoughts, flashbacks, and nightmares from his time as a combat soldier in World War II, 65 years in the past.
“It took me months…months to recover,” he said.
He was in the mood to reminisce, however, perhaps a willful distraction. He had the floor for at least 30 minutes, during which I spoke about 5 sentences. With every sad story he told there was a happy, humorous one, such as meeting his future wife while on leave in New Zealand during the war, recalled down to exact dates. And another story:
There we were in New Caledonia. All our supplies went out to replace what sank on [USS] Coolidge, including a lot of food. Well, there were deer on the island. So we took out a truck and a rifle and wouldn’t you know we came upon a roadblock in the form of a big steer. We figured it looked enough like a deer. My buddy shot it dead with one shot. We dressed it and loaded it into the jeep. Hardly before we even got back to the mess hall, the officers’ cook came sniffing around. He and our captain agreed it was easily the biggest deer they’d ever seen and appropriated it to the officers’ mess. Next day the CO [commanding officer] of the whole outfit came by and announced it was the best tasting ‘venison’ he’d ever had. I heard the farmer got paid a pretty penny for that steer. I didn’t get a damn bite.
He delivered this last bit with relish.
When the conversation returned to anesthesia, I read them the record of his hip fracture repair. I explained that on the face of it, the report seemed uneventful. One daughter asked astute questions about his awareness. I explained that although awareness during general anesthesia is possible, it seemed from the record, he’d had plenty of anesthesia during the case and that there is always less at the beginning and end, the periods that apparently had caused him distress. I also explained that most studies report the incidence of true awareness as at most 1 out of thousands of events and that he had none of the established risk factors for it, such as female gender, young age, chronic substance abuse, cardiac and obstetric surgery, and history of awareness.1
The other daughter wondered why he was so agitated afterward. I recited data on the frequency of postoperative delirium in elderly patients but explained that the range is wide, depending on the study and population, from about 1% in elderly patients undergoing ambulatory surgery to 65% for open aortic surgery.2,3 I added that their father had 2 of the strongest risk factors for delirium, advanced age and cognitive impairment.3 Only after airing each question about the hip surgery in detail were they ready to discuss the eye surgery.
He started that conversation with the right question: “Do I really need it?”
I quoted my surgical colleague’s concern. I told him that, should he opt to undergo the surgery, I was confident that this time around his experience would be different from the last.
“If you’re okay with it, all you need is some numbing medicine from the surgeon; you won’t need any anesthesia from me.”
I walked step-by-step through what they could expect on the day of surgery. Maintaining control was of obvious importance to him. He felt comfortable going forward. His daughters intuited that less would be more for a quick recovery.
We then addressed the DNR directive. I acknowledged his absolute right to self-determination and explained that the need for resuscitation is, at times, a consequence of the surgery and anesthesia. I reassured them that our plan made resuscitation and intubation highly unlikely. They also asked to use any interventions necessary to restart his heart if it should stop beating. I documented their decision in my notes and communicated it to the surgical team. We had talked for 90 minutes.
I met the patient and his daughters on the day of surgery in the preoperative holding area. I inserted an IV, applied electrocardiography leads, and affixed a pulse oximeter and a noninvasive blood pressure cuff. In the operating room (OR) we took time to place his 99-year-old joints into, as he said, the “least worst” position. He tolerated the injection of the local by the surgeon perfectly well. We were in the OR for 3 hours, during which he taught me a fair amount about boating and outboard engines among other things. Pathology reported clean margins. He was discharged home soon after and had an uneventful recovery.
Patient-First Approach
A core competency of the Accreditation Council for Graduate Medical Education for an anesthesia residency is the Interpersonal and Communication Skills program. A comprehensive discussion of communication is far beyond the scope here. But not surprisingly, deficient communication between physicians and patients can cause emotional distress, significant dissatisfaction among family members, and negative patient judgment of how well we communicate.4-6 These observations are particularly true in our increasingly elderly surgical population, in which both surgeons and anesthesiologists often feel unequal to the task of discussing concepts such as code status.7,8
In our practice and in residency training, the preoperative clinic often is the location where patient/provider communication occurs. Here we consider the latest American College of Cardiology/American Heart Association guidelines, examine airways, review electrocardiograms, and formulate plans agreeable to and understood by our anxious patients and their families. The potent anxiolytic effect of a preoperative visit by an anesthesiologist is well established.9 Anxiety about surgery is a risk factor for impaired decision making before surgery.10 And surgery is traumatic—as many as 7.6% of postoperative patients experience symptoms consistent with PTSD attributable to the surgery, placing it on a par with being mugged (8.0%).11,12
The patient in this case presented several communication challenges even absent his revelation of prior traumatic experience with anesthesia. He was elderly, anxious, and had multiple comorbidities. He had mild cognitive impairment and required a code status discussion. There also were the clinical challenges—navigating a 99-year-old with severe aortic stenosis and a right ventricular systolic pressure > 90 mm Hg through a general anesthetic gave me a sinking feeling.
He was fortunate that the procedure could be done with local anesthesia, mitigating his risk of cognitive dysfunction, including delirium. He also was fortunate in that his anesthesiologist and surgeon had created a collaborative, patient-first approach and that his US Department of Veterans Affairs (VA) clinic had the time, space, and staffing to accommodate an unexpected 90-minute visit. A big investment in communication, mainly my keeping quiet, made the intraoperative management simple. Such is life in an integrated health care system without financial incentives for high-volume care—and another reminder that VA physicians are blessed to guide patients through some of the most vulnerable and distressing moments of their lives.
Postscript
During the preparation of this manuscript, the patient passed away at the age of 100. His obituary was consistent with what I had learned about him and his family during our 2 encounters: a long successful career in local industry; extensive involvement in his community; an avid sportsman; and nearly 30 grandchildren, great-grandchildren, and great-great grandchildren. But there was one more detail that never came up during my extensive discussion with him and his daughters: He was awarded the Purple Heart for his service in World War II.
1. Ghoneim MM, Block RI, Haffarnan M, Mathews MJ. Awareness during anesthesia: risk factors, causes and sequelae: a review of reported cases in the literature. Anesth Analg. 2009;108(2):527-535.
2. Aya AGM, Pouchain PH, Thomas H, Ripart J, Cuvillon P. Incidence of postoperative delirium in elderly ambulatory patients: a prospective evaluation using the FAM-CAM instrument. J Clin Anesth. 2019;53:35-38.
3. Raats JW, Steunenberg SL, de Lange DC, van der Laan L. Risk factors of post-operative delirium after elective vascular surgery in the elderly: a systematic review. Int J Surg. 2016;35:1-6.
4. Roter DL, Hall JA, Kern DE, Barker LR, Cole KA, Roca RP. Improving physicians’ interviewing skills and reducing patients’ emotional distress: a randomized clinical trial. Arch Intern Med. 1995;155(17):1877-1884.
5. Wright AA, Keating NL, Ayanian JZ, et al. Family perspectives on aggressive cancer care near the end of life. JAMA. 2016;315(3):284-292.
6. Hall JA, Roter DL, Rand CS. Communication of affect between patient and physician. J Health Soc Behav. 1981;22(1):18-30.
7. Cooper Z, Meyers M, Keating NL, Gu X, Lipsitz SR, Rogers SO. Resident education and management of end-of-life care: the resident’s perspective. J Surg Educ. 2010;67(2):79-84.
8. Hickey TR, Cooper Z, Urman RD, Hepner DL, Bader AM. An agenda for improving perioperative code status discussion. A A Case Rep. 2016;6(12):411-415.
9. Egbert LD, Battit GE, Turndorf H, Beecher HK. The value of the preoperative visit by an anesthetist. JAMA. 1963;185(7):553-555.
10. Ankuda CK, Block SD, Cooper Z, et al. Measuring critical deficits in shared decision making before elective surgery. Patient Educ Couns. 2014;94(3):328-333.
11. Whitlock EL, Rodebaugh TL, Hassett AL, et al. Psychological sequelae of surgery in a prospective cohort of patients from three intraoperative awareness prevention trials. Anesth Analg. 2015;120(1):87-95.
12. Breslau N, Kessler RC, Chilcoat HD, Schultz LR, Davis GC, Andreski P. Trauma and posttraumatic stress disorder in the community: the 1996 Detroit Area Survey of Trauma. Arch Gen Psychiatry. 1998;55(7):626-632.
The patient grabbed my attention as I glanced through our clinic schedule. It was his age: He was 99 years old and scheduled for eye surgery. The plastic surgery resident’s note read: “Patient understands that this would involve surgery under general anesthesia and is agreeable to moving forward...Extremely high risk of anesthesia emphasized.”
I reviewed the patient’s history. At baseline, he had severe pulmonary hypertension, severe aortic stenosis (AS), diastolic heart failure, chronic atrial fibrillation, chronic kidney disease (estimated glomerular filtration rate of 26 mL/min [normal is > 60 mL/min]), anemia (hematocrit 26%), and a standing do not resuscitate (DNR) order. His maximal daily exercise was walking slowly across a room, primarily limited by joint pain. Recent geropsychiatry notes indicated mild cognitive impairment. The anesthesia record from an urgent hip fracture repair 7 months before under general anesthesia was unremarkable.
I phoned the attending plastic surgeon. Our conversation was as follows:
“Hi, I’m about to see a 99-year-old patient with a DNR who is scheduled for resection of an eyelid tumor. His medical history makes me nervous. Are you sure this is a good idea?”“Hmmm, 99-year-old…okay, that’s right,” he responded. “He has an invasive squamous that could become a big problem. The actual procedure is under 10 minutes. Waiting for the pathology report will be the longest part of the procedure.”
“Can it be done under local?” I asked.
“Yes,” he replied.
“Okay, I’ll talk to him and call you back.”
I found the patient in the waiting room, flanked by his 2 daughters and invited them into the clinic room. After introductions, I began asking whether they had any questions about the anesthesia. By midsentence a daughter was prompting him to discuss what happened “last time.” He described a history of posttraumatic stress disorder (PTSD) stemming from his hip surgery, which he blamed squarely on the anesthesia. His emotion was evident in the gathering pauses. “I hate that I am so emotional since they kept me awake during my surgery.”
Through the fog of multiple accounts, it became clear that he was traumatized by the loss of control during the administration of and emergence from the anesthesia.
“They told me it was only oxygen,” he said. “They lied. There was a taste to it…I was awake and skinned alive…They said I was a monster when I woke up thrashing.” He went on, explaining that in the recovery room “there were 2 people bothering me, man-handling me, asking me questions.”
One of his daughters showed me pictures of bruises on his face from ripping off the mask and pulling out the breathing tube. They were visibly upset by the memory of his postoperative combativeness and paranoia. The note written by the orthopedic surgery resident on the day after surgery stated succinctly, “Doing well, had some delirium from anesthesia overnight.” Subsequent geropsychiatry home visits attested to intrusive thoughts, flashbacks, and nightmares from his time as a combat soldier in World War II, 65 years in the past.
“It took me months…months to recover,” he said.
He was in the mood to reminisce, however, perhaps a willful distraction. He had the floor for at least 30 minutes, during which I spoke about 5 sentences. With every sad story he told there was a happy, humorous one, such as meeting his future wife while on leave in New Zealand during the war, recalled down to exact dates. And another story:
There we were in New Caledonia. All our supplies went out to replace what sank on [USS] Coolidge, including a lot of food. Well, there were deer on the island. So we took out a truck and a rifle and wouldn’t you know we came upon a roadblock in the form of a big steer. We figured it looked enough like a deer. My buddy shot it dead with one shot. We dressed it and loaded it into the jeep. Hardly before we even got back to the mess hall, the officers’ cook came sniffing around. He and our captain agreed it was easily the biggest deer they’d ever seen and appropriated it to the officers’ mess. Next day the CO [commanding officer] of the whole outfit came by and announced it was the best tasting ‘venison’ he’d ever had. I heard the farmer got paid a pretty penny for that steer. I didn’t get a damn bite.
He delivered this last bit with relish.
When the conversation returned to anesthesia, I read them the record of his hip fracture repair. I explained that on the face of it, the report seemed uneventful. One daughter asked astute questions about his awareness. I explained that although awareness during general anesthesia is possible, it seemed from the record, he’d had plenty of anesthesia during the case and that there is always less at the beginning and end, the periods that apparently had caused him distress. I also explained that most studies report the incidence of true awareness as at most 1 out of thousands of events and that he had none of the established risk factors for it, such as female gender, young age, chronic substance abuse, cardiac and obstetric surgery, and history of awareness.1
The other daughter wondered why he was so agitated afterward. I recited data on the frequency of postoperative delirium in elderly patients but explained that the range is wide, depending on the study and population, from about 1% in elderly patients undergoing ambulatory surgery to 65% for open aortic surgery.2,3 I added that their father had 2 of the strongest risk factors for delirium, advanced age and cognitive impairment.3 Only after airing each question about the hip surgery in detail were they ready to discuss the eye surgery.
He started that conversation with the right question: “Do I really need it?”
I quoted my surgical colleague’s concern. I told him that, should he opt to undergo the surgery, I was confident that this time around his experience would be different from the last.
“If you’re okay with it, all you need is some numbing medicine from the surgeon; you won’t need any anesthesia from me.”
I walked step-by-step through what they could expect on the day of surgery. Maintaining control was of obvious importance to him. He felt comfortable going forward. His daughters intuited that less would be more for a quick recovery.
We then addressed the DNR directive. I acknowledged his absolute right to self-determination and explained that the need for resuscitation is, at times, a consequence of the surgery and anesthesia. I reassured them that our plan made resuscitation and intubation highly unlikely. They also asked to use any interventions necessary to restart his heart if it should stop beating. I documented their decision in my notes and communicated it to the surgical team. We had talked for 90 minutes.
I met the patient and his daughters on the day of surgery in the preoperative holding area. I inserted an IV, applied electrocardiography leads, and affixed a pulse oximeter and a noninvasive blood pressure cuff. In the operating room (OR) we took time to place his 99-year-old joints into, as he said, the “least worst” position. He tolerated the injection of the local by the surgeon perfectly well. We were in the OR for 3 hours, during which he taught me a fair amount about boating and outboard engines among other things. Pathology reported clean margins. He was discharged home soon after and had an uneventful recovery.
Patient-First Approach
A core competency of the Accreditation Council for Graduate Medical Education for an anesthesia residency is the Interpersonal and Communication Skills program. A comprehensive discussion of communication is far beyond the scope here. But not surprisingly, deficient communication between physicians and patients can cause emotional distress, significant dissatisfaction among family members, and negative patient judgment of how well we communicate.4-6 These observations are particularly true in our increasingly elderly surgical population, in which both surgeons and anesthesiologists often feel unequal to the task of discussing concepts such as code status.7,8
In our practice and in residency training, the preoperative clinic often is the location where patient/provider communication occurs. Here we consider the latest American College of Cardiology/American Heart Association guidelines, examine airways, review electrocardiograms, and formulate plans agreeable to and understood by our anxious patients and their families. The potent anxiolytic effect of a preoperative visit by an anesthesiologist is well established.9 Anxiety about surgery is a risk factor for impaired decision making before surgery.10 And surgery is traumatic—as many as 7.6% of postoperative patients experience symptoms consistent with PTSD attributable to the surgery, placing it on a par with being mugged (8.0%).11,12
The patient in this case presented several communication challenges even absent his revelation of prior traumatic experience with anesthesia. He was elderly, anxious, and had multiple comorbidities. He had mild cognitive impairment and required a code status discussion. There also were the clinical challenges—navigating a 99-year-old with severe aortic stenosis and a right ventricular systolic pressure > 90 mm Hg through a general anesthetic gave me a sinking feeling.
He was fortunate that the procedure could be done with local anesthesia, mitigating his risk of cognitive dysfunction, including delirium. He also was fortunate in that his anesthesiologist and surgeon had created a collaborative, patient-first approach and that his US Department of Veterans Affairs (VA) clinic had the time, space, and staffing to accommodate an unexpected 90-minute visit. A big investment in communication, mainly my keeping quiet, made the intraoperative management simple. Such is life in an integrated health care system without financial incentives for high-volume care—and another reminder that VA physicians are blessed to guide patients through some of the most vulnerable and distressing moments of their lives.
Postscript
During the preparation of this manuscript, the patient passed away at the age of 100. His obituary was consistent with what I had learned about him and his family during our 2 encounters: a long successful career in local industry; extensive involvement in his community; an avid sportsman; and nearly 30 grandchildren, great-grandchildren, and great-great grandchildren. But there was one more detail that never came up during my extensive discussion with him and his daughters: He was awarded the Purple Heart for his service in World War II.
1. Ghoneim MM, Block RI, Haffarnan M, Mathews MJ. Awareness during anesthesia: risk factors, causes and sequelae: a review of reported cases in the literature. Anesth Analg. 2009;108(2):527-535.
2. Aya AGM, Pouchain PH, Thomas H, Ripart J, Cuvillon P. Incidence of postoperative delirium in elderly ambulatory patients: a prospective evaluation using the FAM-CAM instrument. J Clin Anesth. 2019;53:35-38.
3. Raats JW, Steunenberg SL, de Lange DC, van der Laan L. Risk factors of post-operative delirium after elective vascular surgery in the elderly: a systematic review. Int J Surg. 2016;35:1-6.
4. Roter DL, Hall JA, Kern DE, Barker LR, Cole KA, Roca RP. Improving physicians’ interviewing skills and reducing patients’ emotional distress: a randomized clinical trial. Arch Intern Med. 1995;155(17):1877-1884.
5. Wright AA, Keating NL, Ayanian JZ, et al. Family perspectives on aggressive cancer care near the end of life. JAMA. 2016;315(3):284-292.
6. Hall JA, Roter DL, Rand CS. Communication of affect between patient and physician. J Health Soc Behav. 1981;22(1):18-30.
7. Cooper Z, Meyers M, Keating NL, Gu X, Lipsitz SR, Rogers SO. Resident education and management of end-of-life care: the resident’s perspective. J Surg Educ. 2010;67(2):79-84.
8. Hickey TR, Cooper Z, Urman RD, Hepner DL, Bader AM. An agenda for improving perioperative code status discussion. A A Case Rep. 2016;6(12):411-415.
9. Egbert LD, Battit GE, Turndorf H, Beecher HK. The value of the preoperative visit by an anesthetist. JAMA. 1963;185(7):553-555.
10. Ankuda CK, Block SD, Cooper Z, et al. Measuring critical deficits in shared decision making before elective surgery. Patient Educ Couns. 2014;94(3):328-333.
11. Whitlock EL, Rodebaugh TL, Hassett AL, et al. Psychological sequelae of surgery in a prospective cohort of patients from three intraoperative awareness prevention trials. Anesth Analg. 2015;120(1):87-95.
12. Breslau N, Kessler RC, Chilcoat HD, Schultz LR, Davis GC, Andreski P. Trauma and posttraumatic stress disorder in the community: the 1996 Detroit Area Survey of Trauma. Arch Gen Psychiatry. 1998;55(7):626-632.
A Novel Pharmaceutical Care Model for High-Risk Patients
Nonadherence is a significant problem that has a negative impact on both patients and public health. Patients with multiple diseases often have complicated medication regimens, which can be difficult for them to manage. Unfortunately, nonadherence in these high-risk patients can have drastic consequences, including disease progression, hospitalization, and death, resulting in billions of dollars in unnecessary costs nationwide.1,2 The Wheel Model of Pharmaceutical Care (Figure) is a novel care model developed at the Gallup Indian Medical Center (GIMC) in New Mexico to address these problems by positioning pharmacy as a proactive service. The Wheel Model of Pharmaceutical Care was designed to improve adherence and patient outcomes and to encourage communication among the patient, pharmacists, prescribers, and other health care team members.
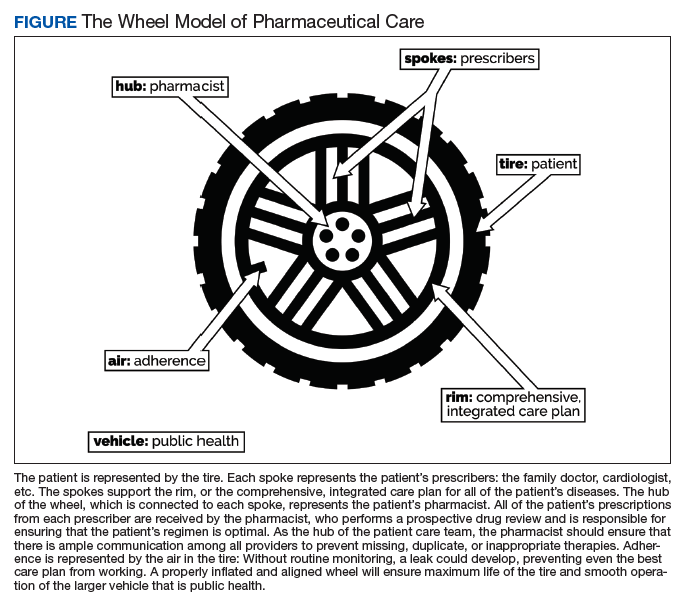
Pharmacists are central to managing patients’ medication therapies and coordinating communication among the health care providers (HCPs).1,3 Medication therapy management (MTM), a required component of Medicare Part D plans, helps ensure appropriate drug use and reduce the risk of adverse events.3 Since pharmacists receive prescriptions from all of the patient’s HCPs, patients may see pharmacists more often than they see any other HCP. GIMC is currently piloting a new clinic, the Medication Optimization, Synchronization, and Adherence Improvement Clinic (MOSAIC), that was created to implement the Wheel Model of Pharmaceutical Care. MOSAIC aims to provide proactive pharmacy services and continuous MTM to high-risk patients and will enable the effectiveness of this new pharmaceutical care model to be assessed.
Methods
Studies have identified certain populations who are at an increased risk for nonadherence: the elderly, patients with complex or extensive medication regimens, patients with multiple chronic medical conditions, substance misusers, certain ethnicities, patients of lower socioeconomic status, patients with limited literacy, and the homeless.2,4 Federal regulations require that Medicare Part D plans target beneficiaries who meet specific criteria for MTM programs. Under these rules, plans must target beneficiaries with ≥ 3 chronic diseases and ≥ 8 chronic medications, although plans also may include patients with fewer medications and diseases.3 Although the Wheel Model of Pharmaceutical Care is postulated to be an accurate model for the ideal care of all patients, initial implementation should be targeted toward populations who are likely to benefit the most from intervention. For these reasons, elderly Native American patients who have ≥ 2 chronic diseases and who take ≥ 5 chronic medications were targeted for initial enrollment in MOSAIC at GIMC.
Overview
In MOSAIC, pharmacists act as the hub of the pharmaceutical care wheel. Pharmacists work to ensure optimization of the patient’s comprehensive, integrated care plan—the rim of the wheel. As a part of this optimization process, MOSAIC pharmacists facilitate synchronization of the patient’s prescriptions to a monthly or quarterly target fill date. The patient’s current medication therapy is organized, and pharmacists track which medications are due to be filled instead of depending on the patient to request each prescription refill. This process effectively changes pharmacy from a requested service to a provided service.
Pharmacists also monitor the air in the tire to promote adherence. This is accomplished by providing efficient monthly or quarterly telephone or in-person consultations, which helps the patient better understand his or her comprehensive, integrated care plan. MOSAIC eliminates the possibility of nonadherence due to running out of refills. Specialized packaging, such as pill boxes or blister packs, can also improve adherence for certain patients.
MOSAIC ensures that pharmacists stay connected with the spokes, which represent a patient’s numerous prescribers, and close communication loops. Pharmacists can make prescribers aware of potential gaps or overlaps in treatment and assist them in the optimization and development of the patient’s comprehensive, integrated care plan. Pharmacists also make sure that the patient’s medication profile is current and accurate in the electronic health record (EHR). Any pertinent information discovered during MOSAIC encounters, such as abnormal laboratory results or changes in medications or disease, is documented in an EHR note. The patient’s prescribers are made aware of this information by tagging them as additional signers to the note in the EHR.
Keeping patients—the tires—healthy will ensure smooth operation of the vehicle and have a positive impact on public health. MOSAIC is expected to not only improve individual patient outcomes, but also decrease health care costs for patients and society due to nonadherence, suboptimal regimens, stockpiled home medications, and preventable hospital admissions.
Traditionally, pharmacy has been a requested service: A patient requests each of their prescriptions to be refilled, and the pharmacy fills the prescription. Ideally, pharmacy must become a provided service, with pharmacists keeping track of when a patient’s medications are due to be filled and actively looking for medication therapy optimization opportunities. This is accomplished by synchronizing the patient’s medications to the same monthly or quarterly fill date; screening for any potentially inappropriate medications, including high-risk medications in elderly patients, duplications, and omissions; verifying any medication changes with the patient each fill; and then providing all needed medications to the patient at a scheduled time.
To facilitate this process, custom software was developed for MOSAIC. In addition, a collaborative practice agreement (CPA) was drafted that allowed MOSAIC pharmacists to make certain medication therapy optimizations on behalf of the patient’s primary care provider. As part of this CPA, pharmacists also may order and act on certain laboratory tests, which helps to monitor disease progression, ensure safe medication use, and meet Government Performance and Results Act (GPRA) measures. As a novel model of pharmaceutical care, the effects of this approach are not yet known; however, research suggests that increased communication among HCPs and patient-centered approaches to care are beneficial to patient outcomes, adherence, and public health.1,5
Investigated Outcomes
As patients continue to enroll in MOSAIC, the effectiveness of the clinic will be evaluated. Specifically, quality of life, patient and HCP satisfaction with the program, adherence metrics, hospitalization rates, and all-cause mortality will be assessed for patients enrolled in MOSAIC as well as similar patients who are not enrolled in MOSAIC. Also, pharmacists will log all recommended medication therapy interventions so that the optimization component of MOSAIC may be quantified. GPRA measures and the financial implications of the interventions made by MOSAIC will also be evaluated.
Discussion
There are a number of factors, such as MTM services and interprofessional care teams, that research has shown to independently improve patient outcomes, adherence, or public health. By synthesizing these factors, a completely new approach—the Wheel Model of Pharmaceutical Care—was developed. This model presents a radical departure from traditional, requested-service practices and posits pharmacy as a provided service instead. Although the ideas of MTM and interprofessional care teams are not new, there has never been a practical way to truly integrate community pharmacists into the patient care team or to ensure adequate communication among all of the patient’s HCPs. The Wheel Model of Pharmaceutical Care includes public health as one of its core components and provides a framework for pharmacies to meaningfully impact health outcomes for patients.
The Wheel Model of Pharmaceutical Care was designed to minimize the likelihood of nonadherence. Despite this, patients might willfully choose to be nonadherent, forget to take their medications, or neglect to pick up their medications. Additionally, in health care systems where patients must pay for their medications, prescription drug costs might be a barrier to adherence.
When nonadherence is suspected, the Wheel Model of Pharmaceutical Care directs pharmacists in MOSAIC to take action. First, the underlying cause of the nonadherence must be determined. For example, if a patient is nonadherent because of an adverse drug reaction, a therapy change may be indicated. If a patient is nonadherent due to apathy toward their health or therapy, the patient may benefit from education about their condition and treatment options; thus, the patient can make shared, informed decisions and feel more actively involved with his or her health. If a patients is nonadherent due to forgetfulness, adherence packaging dispense methods should be considered as an alternative to traditional vials. Depending on the services offered by a given pharmacy, adherence packaging options may include blister packs, pill boxes, or strips prepared by robotic dispensing systems. The use of medication reminders, whether in the form of a smartphone application or a simple alarm clock, should be discussed with the patient. If the patient does not pick up their medications on time, a pharmacist can contact the patient to determine why the medications were not picked up and to assess any nonadherence. In this case, mail order pharmacy services, if available, should be offered to patients as a more convenient option.
The medication regimen optimization component of MOSAIC helps reduce the workload of primary care providers and allows pharmacists to act autonomously based on clinical judgment, within the scope of the CPA. This can prevent delays in care caused by no refills remaining on a prescription. The laboratory monitoring component allows pharmacists to track diseases and take action if necessary, which should have a favorable impact on GPRA measures. Medication optimizations can reduce wasted resources by identifying cost-saving formulary alternatives, potentially inappropriate medications, and suboptimal doses.
Since many Indian Health Service beneficiaries do not have private insurance and therefore do not generate third-party reimbursements for services and care provided by GIMC, keeping patients healthy and out of the hospital is a top priority. As more patients are enrolled in MOSAIC, the program is expected to have a favorable impact on pharmacy workload and workflow as well. Prescriptions are anticipated and filled in advance, which decreases the amount of patients calling and presenting to the pharmacy for same-day refill requests. Scheduling when MOSAIC patients’ medications are to be filled and dispensed creates a predictable workload that allows the pharmacy staff to be managed more efficiently.
Conclusion
Adherence is the responsibility of the patient, but the Wheel Model of Pharmaceutical Care aims to provide pharmacists with a framework to monitor and encourage adherence in their patients. By taking this patient-centered approach, MOSAIC is expected to improve outcomes and decrease hospitalizations for high-risk patients who simply need a little extra help with their medications.
1. Bosworth HB, Granger BB, Mendys P, et al. Medication adherence: a call for action. Am Heart J. 2011;162(3):412-424.
2. Vlasnik JJ, Aliotta SL, DeLor B. Medication adherence: factors influencing compliance with prescribed medication plans. Case Manager. 2005;16(2):47-51.
3. Drug utilization management, quality assurance, and medication therapy management programs (MTMPs). Fed Regist. 2012;77(71):2207-22175. To be codified at 42 CFR § 423.153.
4. Thiruchselvam T, Naglie G, Moineddin R, et al. Risk factors for medication nonadherence in older adults with cognitive impairment who live alone. Int J Geriatr Psychiatry. 2012;27(12):1275-1282.
5. Liddy C, Blazkho V, Mill K. Challenges of self-management when living with multiple chronic conditions: systematic review of the qualitative literature. Can Fam Physician. 2014;60(12):1123-1133.
Nonadherence is a significant problem that has a negative impact on both patients and public health. Patients with multiple diseases often have complicated medication regimens, which can be difficult for them to manage. Unfortunately, nonadherence in these high-risk patients can have drastic consequences, including disease progression, hospitalization, and death, resulting in billions of dollars in unnecessary costs nationwide.1,2 The Wheel Model of Pharmaceutical Care (Figure) is a novel care model developed at the Gallup Indian Medical Center (GIMC) in New Mexico to address these problems by positioning pharmacy as a proactive service. The Wheel Model of Pharmaceutical Care was designed to improve adherence and patient outcomes and to encourage communication among the patient, pharmacists, prescribers, and other health care team members.
Pharmacists are central to managing patients’ medication therapies and coordinating communication among the health care providers (HCPs).1,3 Medication therapy management (MTM), a required component of Medicare Part D plans, helps ensure appropriate drug use and reduce the risk of adverse events.3 Since pharmacists receive prescriptions from all of the patient’s HCPs, patients may see pharmacists more often than they see any other HCP. GIMC is currently piloting a new clinic, the Medication Optimization, Synchronization, and Adherence Improvement Clinic (MOSAIC), that was created to implement the Wheel Model of Pharmaceutical Care. MOSAIC aims to provide proactive pharmacy services and continuous MTM to high-risk patients and will enable the effectiveness of this new pharmaceutical care model to be assessed.
Methods
Studies have identified certain populations who are at an increased risk for nonadherence: the elderly, patients with complex or extensive medication regimens, patients with multiple chronic medical conditions, substance misusers, certain ethnicities, patients of lower socioeconomic status, patients with limited literacy, and the homeless.2,4 Federal regulations require that Medicare Part D plans target beneficiaries who meet specific criteria for MTM programs. Under these rules, plans must target beneficiaries with ≥ 3 chronic diseases and ≥ 8 chronic medications, although plans also may include patients with fewer medications and diseases.3 Although the Wheel Model of Pharmaceutical Care is postulated to be an accurate model for the ideal care of all patients, initial implementation should be targeted toward populations who are likely to benefit the most from intervention. For these reasons, elderly Native American patients who have ≥ 2 chronic diseases and who take ≥ 5 chronic medications were targeted for initial enrollment in MOSAIC at GIMC.
Overview
In MOSAIC, pharmacists act as the hub of the pharmaceutical care wheel. Pharmacists work to ensure optimization of the patient’s comprehensive, integrated care plan—the rim of the wheel. As a part of this optimization process, MOSAIC pharmacists facilitate synchronization of the patient’s prescriptions to a monthly or quarterly target fill date. The patient’s current medication therapy is organized, and pharmacists track which medications are due to be filled instead of depending on the patient to request each prescription refill. This process effectively changes pharmacy from a requested service to a provided service.
Pharmacists also monitor the air in the tire to promote adherence. This is accomplished by providing efficient monthly or quarterly telephone or in-person consultations, which helps the patient better understand his or her comprehensive, integrated care plan. MOSAIC eliminates the possibility of nonadherence due to running out of refills. Specialized packaging, such as pill boxes or blister packs, can also improve adherence for certain patients.
MOSAIC ensures that pharmacists stay connected with the spokes, which represent a patient’s numerous prescribers, and close communication loops. Pharmacists can make prescribers aware of potential gaps or overlaps in treatment and assist them in the optimization and development of the patient’s comprehensive, integrated care plan. Pharmacists also make sure that the patient’s medication profile is current and accurate in the electronic health record (EHR). Any pertinent information discovered during MOSAIC encounters, such as abnormal laboratory results or changes in medications or disease, is documented in an EHR note. The patient’s prescribers are made aware of this information by tagging them as additional signers to the note in the EHR.
Keeping patients—the tires—healthy will ensure smooth operation of the vehicle and have a positive impact on public health. MOSAIC is expected to not only improve individual patient outcomes, but also decrease health care costs for patients and society due to nonadherence, suboptimal regimens, stockpiled home medications, and preventable hospital admissions.
Traditionally, pharmacy has been a requested service: A patient requests each of their prescriptions to be refilled, and the pharmacy fills the prescription. Ideally, pharmacy must become a provided service, with pharmacists keeping track of when a patient’s medications are due to be filled and actively looking for medication therapy optimization opportunities. This is accomplished by synchronizing the patient’s medications to the same monthly or quarterly fill date; screening for any potentially inappropriate medications, including high-risk medications in elderly patients, duplications, and omissions; verifying any medication changes with the patient each fill; and then providing all needed medications to the patient at a scheduled time.
To facilitate this process, custom software was developed for MOSAIC. In addition, a collaborative practice agreement (CPA) was drafted that allowed MOSAIC pharmacists to make certain medication therapy optimizations on behalf of the patient’s primary care provider. As part of this CPA, pharmacists also may order and act on certain laboratory tests, which helps to monitor disease progression, ensure safe medication use, and meet Government Performance and Results Act (GPRA) measures. As a novel model of pharmaceutical care, the effects of this approach are not yet known; however, research suggests that increased communication among HCPs and patient-centered approaches to care are beneficial to patient outcomes, adherence, and public health.1,5
Investigated Outcomes
As patients continue to enroll in MOSAIC, the effectiveness of the clinic will be evaluated. Specifically, quality of life, patient and HCP satisfaction with the program, adherence metrics, hospitalization rates, and all-cause mortality will be assessed for patients enrolled in MOSAIC as well as similar patients who are not enrolled in MOSAIC. Also, pharmacists will log all recommended medication therapy interventions so that the optimization component of MOSAIC may be quantified. GPRA measures and the financial implications of the interventions made by MOSAIC will also be evaluated.
Discussion
There are a number of factors, such as MTM services and interprofessional care teams, that research has shown to independently improve patient outcomes, adherence, or public health. By synthesizing these factors, a completely new approach—the Wheel Model of Pharmaceutical Care—was developed. This model presents a radical departure from traditional, requested-service practices and posits pharmacy as a provided service instead. Although the ideas of MTM and interprofessional care teams are not new, there has never been a practical way to truly integrate community pharmacists into the patient care team or to ensure adequate communication among all of the patient’s HCPs. The Wheel Model of Pharmaceutical Care includes public health as one of its core components and provides a framework for pharmacies to meaningfully impact health outcomes for patients.
The Wheel Model of Pharmaceutical Care was designed to minimize the likelihood of nonadherence. Despite this, patients might willfully choose to be nonadherent, forget to take their medications, or neglect to pick up their medications. Additionally, in health care systems where patients must pay for their medications, prescription drug costs might be a barrier to adherence.
When nonadherence is suspected, the Wheel Model of Pharmaceutical Care directs pharmacists in MOSAIC to take action. First, the underlying cause of the nonadherence must be determined. For example, if a patient is nonadherent because of an adverse drug reaction, a therapy change may be indicated. If a patient is nonadherent due to apathy toward their health or therapy, the patient may benefit from education about their condition and treatment options; thus, the patient can make shared, informed decisions and feel more actively involved with his or her health. If a patients is nonadherent due to forgetfulness, adherence packaging dispense methods should be considered as an alternative to traditional vials. Depending on the services offered by a given pharmacy, adherence packaging options may include blister packs, pill boxes, or strips prepared by robotic dispensing systems. The use of medication reminders, whether in the form of a smartphone application or a simple alarm clock, should be discussed with the patient. If the patient does not pick up their medications on time, a pharmacist can contact the patient to determine why the medications were not picked up and to assess any nonadherence. In this case, mail order pharmacy services, if available, should be offered to patients as a more convenient option.
The medication regimen optimization component of MOSAIC helps reduce the workload of primary care providers and allows pharmacists to act autonomously based on clinical judgment, within the scope of the CPA. This can prevent delays in care caused by no refills remaining on a prescription. The laboratory monitoring component allows pharmacists to track diseases and take action if necessary, which should have a favorable impact on GPRA measures. Medication optimizations can reduce wasted resources by identifying cost-saving formulary alternatives, potentially inappropriate medications, and suboptimal doses.
Since many Indian Health Service beneficiaries do not have private insurance and therefore do not generate third-party reimbursements for services and care provided by GIMC, keeping patients healthy and out of the hospital is a top priority. As more patients are enrolled in MOSAIC, the program is expected to have a favorable impact on pharmacy workload and workflow as well. Prescriptions are anticipated and filled in advance, which decreases the amount of patients calling and presenting to the pharmacy for same-day refill requests. Scheduling when MOSAIC patients’ medications are to be filled and dispensed creates a predictable workload that allows the pharmacy staff to be managed more efficiently.
Conclusion
Adherence is the responsibility of the patient, but the Wheel Model of Pharmaceutical Care aims to provide pharmacists with a framework to monitor and encourage adherence in their patients. By taking this patient-centered approach, MOSAIC is expected to improve outcomes and decrease hospitalizations for high-risk patients who simply need a little extra help with their medications.
1. Bosworth HB, Granger BB, Mendys P, et al. Medication adherence: a call for action. Am Heart J. 2011;162(3):412-424.
2. Vlasnik JJ, Aliotta SL, DeLor B. Medication adherence: factors influencing compliance with prescribed medication plans. Case Manager. 2005;16(2):47-51.
3. Drug utilization management, quality assurance, and medication therapy management programs (MTMPs). Fed Regist. 2012;77(71):2207-22175. To be codified at 42 CFR § 423.153.
4. Thiruchselvam T, Naglie G, Moineddin R, et al. Risk factors for medication nonadherence in older adults with cognitive impairment who live alone. Int J Geriatr Psychiatry. 2012;27(12):1275-1282.
5. Liddy C, Blazkho V, Mill K. Challenges of self-management when living with multiple chronic conditions: systematic review of the qualitative literature. Can Fam Physician. 2014;60(12):1123-1133.
Quality of Care for Veterans With In-Hospital Stroke
Stroke is a leading cause of death and long-term disability in the US.1 Quality improvement efforts for acute stroke care delivery have successfully led to increased rates of thrombolytic utilization.2 Increasing attention is now being paid to additional quality metrics for stroke care, including hospital management and initiation of appropriate secondary stroke prevention measures at discharge. Many organizations, including the Veterans Health Administration (VHA), use these measures to monitor health care quality and certify centers that are committed to excellence in stroke care.3-6 It is anticipated that collection, evaluation, and feedback from these data may lead to improvements in outcomes after stroke.7
Patients who experience onset of stroke symptoms while already admitted to a hospital may be uniquely suited for quality improvement strategies. In-hospital strokes (IHS) are not uncommon and have been associated with higher stroke severity and increased mortality compared with patients with stroke symptoms prior to arriving at the emergency department (ED).8-10 A potential reason for the higher observed mortality is that patients with IHS may have poorer access to acute stroke resources, such as stroke teams and neuroimaging, as well as increased rates of medical comorbidities.9,11,12 Furthermore, stroke management protocols are typically created based on ED resources, which may not be equivalent to resources available on inpatient settings.
Although many studies have examined clinical characteristics of patients with IHS, few studies have looked at the quality of stroke care for IHS. Information on stroke quality data is even more limited in VHA hospitals due to the small number of admitted patients with stroke.13 VHA released a directive on Acute Stroke Treatment (Directive 2011-03) in 2011 with a recent update in 2018, which aimed to implement quality improvement strategies for stroke care in VHA hospitals.14 Although focusing primarily on acute stroke care in the ED, this directive has led to increased awareness of areas for improvement, particularly among larger VHA hospitals. Prior to this directive, although national stroke guidelines were well-defined, more variability likely existed in stroke protocols and the manner in which stroke care was delivered across care settings. As efforts to measure and improve stroke care evolve, it is important to ensure that strategies used in ED settings also are implemented for patients already admitted to the hospital. This study seeks to define the quality of care in VHA hospitals between patients having an in-hospital ischemic stroke compared with those presenting to the ED.
Methods
As a secondary analysis, we examined stroke care quality data from an 11-site VHA stroke quality improvement study.15 Sites participating in this study were high stroke volume VHA hospitals from various geographic regions of the US. This study collected data on ICD-9 discharge diagnosis-defined ischemic stroke admissions between January 2009 and June 2012. Patient charts were reviewed by a group of central, trained abstractors who collected information on patient demographics, clinical history, and stroke characteristics. Stroke severity was defined using the National Institutes of Health Stroke Scale (NIHSS), assessed by standardized retrospective review of admission physical examination documentation.16 A multidisciplinary team defined 11 stroke quality indicators (QIs; the 8 Joint Commission indictors and 3 additional indicators: smoking cessation and dysphagia screening, and NIHSS assessment), and the chart abstractors’ data were used to evaluate eligibility and passing rates for each QI.
For our analysis, patients were stratified into 2 categories: patients admitted to the hospital for another diagnosis who developed an IHS, and patients presenting with stroke to the ED. We excluded patients transferred from other facilities. We then compared the demographic and clinical features of the 2 groups as well as eligibility and passing rates for each of the 11 QIs. Patients were recorded as eligible if they did not have any clinical contraindication to receiving the assessment or intervention measured by the quality metric. Passing rates were defined by the presence of clear documentation in the patient record that the quality metric was met or fulfilled. Comparisons were made using nonparametric Mann-Whitney U tests and chi-square tests. All tests were performed at α .05 level.
Results
A total of 1823 patients were included in this analysis: 35 IHS and 1788 ED strokes. The 2 groups did not differ with respect to age, race, or sex (Table 1). Patients with IHS had higher stroke severity (mean NIHSS 11.3 vs 5.1, P <.01) and longer length of stay than did ED patients with stroke (mean 12.8 vs 7.3 days, P < .01). Patients with IHS also were less likely to be discharged home when compared with ED patients with stroke (34.3% vs 63.8%, P < .01).
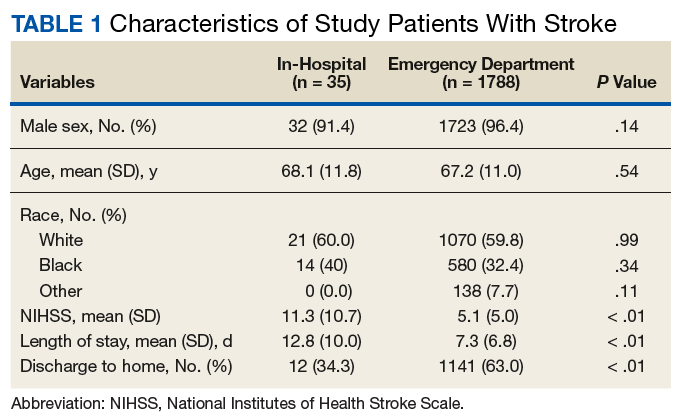
Table 2 summarizes our findings on eligibility and passing rates for the 11 QIs. For acute care metrics, we found that stroke severity documentation rates did not differ but were low for each patient group (51% vs 48%, P = .07). Patients with IHS were more likely to be eligible for IV tissue plasminogen activator (tPA; P < .01) although utilization rates did not differ. Only 2% of ED patients met eligibility criteria to receive tPA (36 of 1788), and among these patients only 16 actually received the drug. By comparison, 5 of 6 of eligible patients with IHS received tPA. Rates of dysphagia screening also were low for both groups, and patients with IHS were less likely to receive this screen prior to initiation of oral intake than were ED patients with stroke (27% vs 50%, P = .01).
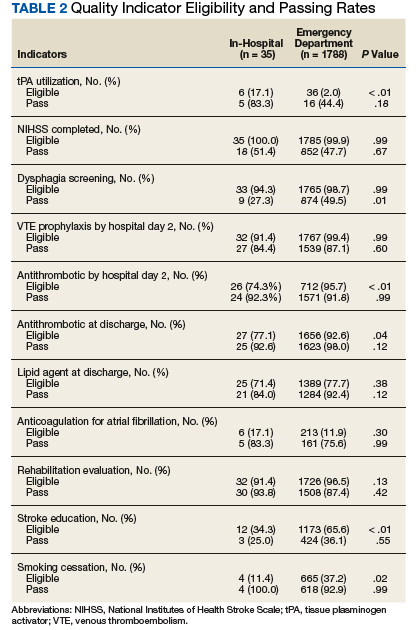
Beyond the acute period, we found that patients with IHS were less likely than were ED patients with stroke to be eligible to receive antithrombotic therapy by 2 days after their initial stroke evaluation (74% vs 96%, P < .01), although treatment rates were similar between the 2 groups (P = .99). In patients with documented atrial fibrillation, initiation of anticoagulation therapy also did not differ (P = .99). The 2 groups were similar with respect to initiation of venous thromboembolism (VTE) prophylaxis (P = .596) and evaluation for rehabilitation needs (P = .42). Although rates of smoking cessation counseling and stroke education prior to discharge did not differ, overall rates of stroke education were very low for both groups (25% vs 36%, P = .55).
Similar to initiation of antithrombotic therapy in the hospital, we found lower rates of eligibility to receive antithrombotic therapy on discharge in the IHS group when compared with the ED group (77% vs 93%, P = .04). However, actual treatment initiation rates did not differ (P = .12). Use of lipid-lowering agents was similar for the 2 groups (P = .12).
Discussion
Our study found that veterans who develop an IHS received similar quality of care as did those presenting to the ED with stroke symptoms for many QIs, although there were some notable differences. We were pleased to find that overall rates of secondary stroke prevention initiation (antithrombotic and statin therapy), VTE prophylaxis, rehabilitation evaluations, and smoking cessation counseling were high for both groups, in keeping with evidence-based guidelines.17 This likely reflected the fact that these metrics typically involve care outside of the acute period and are less likely to be influenced by the location of initial stroke evaluation. Furthermore, efforts to improve smoking cessation and VTE prophylaxis are not exclusive to stroke care and have been the target of several nonstroke quality projects in the VHA. Many aspects of acute stroke care did differ, and present opportunities for quality improvement in the future.
In our sample, patients with IHS had higher IV thrombolytic eligibility, which has not typically been reported in other samples.10,11,18 In these studies, hospitalized patients have been reported to more often have contraindications to tPA, such as recent surgery or lack of stroke symptom recognition due to delirium or medication effects. Interestingly, patients presenting to VHA EDs had extremely low rates of tPA eligibility (2%), which is lower than many reported estimates of tPA eligibility outside of the VHA.19,20 This may be due to multiple influences, such as geographic barriers, patient perceptions about stroke symptoms, access to emergency medical services (EMS), EMS routing patterns, and social/cultural factors. Although not statistically significant due to small sample size, tPA use also was twice as high in the IHS group.
Given that a significant proportion of patients with IHS in the VHA system may be eligible for acute thrombolysis, our findings highlight the need for acute stroke protocols to ensure that patients with IHS receive the same rapid stroke assessment and access to thrombolytics as do patients evaluated in the ED. Further investigation is needed to determine whether there are unique features of patients with IHS in VHA hospitals, which may make them more eligible for IV thrombolysis.
Dysphagia is associated with increased risks for aspiration pneumonia in stroke patients.21 We found that patients with IHS were less likely to receive dysphagia screening compared with that of stroke patients admitted through the ED. This finding is consistent with the fact that care for patients with IHS is less frequently guided by specific stroke care protocols and algorithms that are more often used in EDs.8,11 Although attention to swallowing function may lead to improved outcomes in stroke, this can be easily overlooked in patients with IHS.22 However, low dysphagia screening also was found in patients admitted through the ED, suggesting that low screening rates cannot be solely explained by differences in where the initial stroke evaluation is occurring. These findings suggest a need for novel approaches to dysphagia screening in VHA stroke patients that can be universally implemented throughout the hospital.
Finally, we also found very low rates of stroke education prior to discharge for both groups. Given the risk of stroke recurrence and the overall poor level of public knowledge about stroke, providing patients with stroke with formal oral and written information on stroke is a critical component of secondary prevention.23,24 Educational tools, including those that are veteran specific, are now available for use in VHA hospitals and should be incorporated into quality improvement strategies for stroke care in VHA hospitals.
In 2012, the VHA Acute Stroke Treatment Directive was published in an effort to improve stroke care systemwide. Several of the metrics examined in this study are addressed in this directive. The data presented in this study is one of the only samples of stroke quality metrics within the VHA that largely predates the directive and can serve as a baseline comparator for future work examining stroke care after release of the directive. At present, although continuous internal reviews of quality data are ongoing, longitudinal description of stroke care quality since publication of the directive will help to inform future efforts to improve stroke care for veterans.
Limitations
Despite the strength of being a multicenter sampling of stroke care in high volume VHA hospitals, our study had several limitations. The IHS sample size was small, which limited our ability to evaluate differences between the groups, to evaluate generalizability, and account for estimation error.13 It is possible that differences existed between the groups that could not be observed in this sample due to small size (type II error) or that patient-specific characteristics not captured by these data could influence these metrics. Assessments of eligibility and passing were based on retrospective chart review and post hoc coding. Our sample assessed only patients who presented to larger VHA hospitals with higher stroke volumes, thus these findings may not be generalizable to smaller VHA hospitals with less systematized stroke care. This sample did not describe the specialty care services that were received by each patient, which may have influenced their stroke care. Finally, this study is an analysis of use of QIs in stroke care and did not examine how these indicators affect outcomes.
Conclusion
Despite reassuring findings for several inpatient ischemic stroke quality metrics, we found several differences in stroke care between patients with IHS compared with those presenting to the ED, emphasizing the need for standardized approaches to stroke care regardless of care setting. Although patients with IHS may be more likely to be eligible for tPA, these patients received dysphagia screening and less often than did ED patients with stroke. Ongoing quality initiatives should continue to place emphasis on improving all quality metrics (particularly dysphagia screening, stroke severity documentation, and stroke education) for patients with stroke at VHA hospitals across all care settings. Future work will be needed to examine how specific patient characteristics and revisions to stroke protocols may affect stroke quality metrics and outcomes between patients with IHS and those presenting to the ED.
Acknowledgments
The authors would like to thank Danielle Sager for her contributions to this project.
1. Go AS, Mozaffarian D, Roger VL, et al; American Heart Association Statistics Committee and Stroke Statistics Subcommittee. Heart disease and stroke statistics—2014 update: a report from the American Heart Association. Circulation. 2014;129:e28-e292.
2. Schwamm LH, Ali SF, Reeves MJ, et al. Temporal trends in patient characteristics and treatment with intravenous thrombolysis among acute ischemic stroke patients at Get With the Guidelines—Stroke hospitals. Circ Cardiovasc Qual Outcomes. 2013;6(5):543-549.
3. Reeves MJ, Parker C, Fonarow GC, Smith EE, Schwamm LH. Development of stroke performance measures: definitions, methods, and current measures. Stroke. 2010;41(7):1573-1578.
4. The Joint Commission. Certificate of distinction for primary stroke centers. https://www.jointcommission.org/certificate_of_distinction_for_primary_stroke_centers_/.Published April 30, 2012. Accessed July 9, 2019.
5. US Department of Veterans Affairs. Center highlight: acute ischemic stroke care for veterans. https://www.queri.research.va.gov/center_highlights/stroke.cfm. Updated February 20, 2014. Accessed July 16, 2019.
6. Chumbler NR, Jia H, Phipps MS, et al. Does inpatient quality of care differ by age among US veterans with ischemic stroke? J Stroke Cerebrovasc Dis. 2012;21(8):844-851.
7. Katzan IL, Spertus J, Bettger JP, et al; American Heart Association Stroke Council; Council on Quality of Care and Outcomes Research; Council on Cardiovascular and Stroke Nursing; Council on Cardiovascular Radiology and Intervention; Council on Cardiovascular Surgery and Anesthesia; Council on Clinical Cardiology. Risk adjustment of ischemic stroke outcomes for comparing hospital performance: a statement for healthcare professionals from the American Heart Association/American Stroke Association. Stroke. 2014;45(3):918-944.
8. Cumbler E, Wald H, Bhatt DL, et al. Quality of care and outcomes for in-hospital ischemic stroke: findings from the National Get With the Guidelines—Stroke. Stroke. 2014;45(1):231-238.
9. Blacker DJ. In-hospital stroke. Lancet Neurol. 2003;2(12):741-746.
10. Farooq MU, Reeves MJ, Gargano J, Wehner S, Hickenbottom S, Majid A; Paul Coverdell National Acute Stroke Registry Michigan Prototype Investigators. In-hospital stroke in a statewide stroke registry. Cerebrovascular Dis. 2008;25(1-2):12-20.
11. Bhalla A, Smeeton N, Rudd AG, Heuschmann P, Wolfe CD. A comparison of characteristics and resource use between in-hospital and admitted patients with stroke. J Stroke Cerebrovasc Dis. 2010;19:(5)357-363.
12. Garcia-Santibanez R, Liang J, Walker A, Matos-Diaz I, Kahkeshani K, Boniece I. Comparison of stroke codes in the emergency room and inpatient setting. J Stroke Cerebrovasc Dis. 2015;24(8):1948-1950.
13. Arling G, Reeves M, Ross J, et al. Estimating and reporting on the quality of inpatient stroke care by Veterans Health Administration medical centers. Circ Cardiovasc Qual Outcomes. 2012;5(1):44-51.
14. US Department of Veterans Affairs. Treatment of Acute Ischemic Stroke (AIS). VHA Directive 2011-038. https://www.hsrd.research.va.gov/news/feature/stroke.cfm. Updated January 20, 2014. Accessed July 17, 2019.
15. Williams LS, Daggett V, Slaven J, et al. Abstract 18: Does quality improvement training add to audit and feedback for inpatient stroke care processes? [International Stroke Conference abstract 18] Stroke. 2014;45(suppl 1):A18.
16. Williams LS, Yilmaz EY, Lopez-Yunez AM. Retrospective assessment of initial stroke severity with the NIH Stroke Scale. Stroke. 2000;31(4):858-862.
17. Jauch EC, Saver JL, Adams HP Jr, et al; American Heart Association Stroke Council; Council on Cardiovascular Nursing; Council on Peripheral Vascular Disease; Council on Clinical Cardiology. Guidelines for the early management of patients with acute ischemic stroke: a guideline for healthcare professionals from the American Heart Association/American Stroke Association. Stroke. 2013;44(3):870-947.
18. Park HJ, Cho HJ, Kim YD, et al. Comparison of the characteristics for in-hospital and out-of-hospital ischaemic strokes. Eur J Neurol. 2009;16(5):582-588.
19. Messé SR, Fonarow GC, Smith EE, et al. Use of tissue-type plasminogen activator before and after publication of the European Cooperative Acute Stroke Study III in Get With the Guidelines-Stroke. Circ Cardiovasc Qual Outcomes. 2012;5(3):321-326.
20. Allen NB, Kaltenbach L, Goldstein LB, et al. Regional variation in recommended treatments for ischemic stroke and TIA: Get With the Guidelines—Stroke 2003-2010. Stroke. 2012;43(7):1858-1864.
21. Martino R, Foley N, Bhogal S, Diamant N, Speechley M, Teasell R. Dysphagia after stroke: incidence, diagnosis, and pulmonary complications. Stroke. 2005;36(12):2756-2763.
22. Bravata DM, Wells CK, Lo AC, et al. Processes of care associated with acute stroke outcomes. Arch Intern Med. 2010;170(9):804-810.
23. Mosley I, Nicol M, Donnan G, Patrick I, Dewey H. Stroke symptoms and the decision to call for an ambulance. Stroke; a journal of cerebral circulation. 2007;38(2):361-366.
24. Jurkowski JM, Maniccia DM, Dennison BA, Samuels SJ, Spicer DA. Awareness of necessity to call 9-1-1 for stroke symptoms, upstate New York. Prev Chronic Dis. 2008;5(2):A41.
Stroke is a leading cause of death and long-term disability in the US.1 Quality improvement efforts for acute stroke care delivery have successfully led to increased rates of thrombolytic utilization.2 Increasing attention is now being paid to additional quality metrics for stroke care, including hospital management and initiation of appropriate secondary stroke prevention measures at discharge. Many organizations, including the Veterans Health Administration (VHA), use these measures to monitor health care quality and certify centers that are committed to excellence in stroke care.3-6 It is anticipated that collection, evaluation, and feedback from these data may lead to improvements in outcomes after stroke.7
Patients who experience onset of stroke symptoms while already admitted to a hospital may be uniquely suited for quality improvement strategies. In-hospital strokes (IHS) are not uncommon and have been associated with higher stroke severity and increased mortality compared with patients with stroke symptoms prior to arriving at the emergency department (ED).8-10 A potential reason for the higher observed mortality is that patients with IHS may have poorer access to acute stroke resources, such as stroke teams and neuroimaging, as well as increased rates of medical comorbidities.9,11,12 Furthermore, stroke management protocols are typically created based on ED resources, which may not be equivalent to resources available on inpatient settings.
Although many studies have examined clinical characteristics of patients with IHS, few studies have looked at the quality of stroke care for IHS. Information on stroke quality data is even more limited in VHA hospitals due to the small number of admitted patients with stroke.13 VHA released a directive on Acute Stroke Treatment (Directive 2011-03) in 2011 with a recent update in 2018, which aimed to implement quality improvement strategies for stroke care in VHA hospitals.14 Although focusing primarily on acute stroke care in the ED, this directive has led to increased awareness of areas for improvement, particularly among larger VHA hospitals. Prior to this directive, although national stroke guidelines were well-defined, more variability likely existed in stroke protocols and the manner in which stroke care was delivered across care settings. As efforts to measure and improve stroke care evolve, it is important to ensure that strategies used in ED settings also are implemented for patients already admitted to the hospital. This study seeks to define the quality of care in VHA hospitals between patients having an in-hospital ischemic stroke compared with those presenting to the ED.
Methods
As a secondary analysis, we examined stroke care quality data from an 11-site VHA stroke quality improvement study.15 Sites participating in this study were high stroke volume VHA hospitals from various geographic regions of the US. This study collected data on ICD-9 discharge diagnosis-defined ischemic stroke admissions between January 2009 and June 2012. Patient charts were reviewed by a group of central, trained abstractors who collected information on patient demographics, clinical history, and stroke characteristics. Stroke severity was defined using the National Institutes of Health Stroke Scale (NIHSS), assessed by standardized retrospective review of admission physical examination documentation.16 A multidisciplinary team defined 11 stroke quality indicators (QIs; the 8 Joint Commission indictors and 3 additional indicators: smoking cessation and dysphagia screening, and NIHSS assessment), and the chart abstractors’ data were used to evaluate eligibility and passing rates for each QI.
For our analysis, patients were stratified into 2 categories: patients admitted to the hospital for another diagnosis who developed an IHS, and patients presenting with stroke to the ED. We excluded patients transferred from other facilities. We then compared the demographic and clinical features of the 2 groups as well as eligibility and passing rates for each of the 11 QIs. Patients were recorded as eligible if they did not have any clinical contraindication to receiving the assessment or intervention measured by the quality metric. Passing rates were defined by the presence of clear documentation in the patient record that the quality metric was met or fulfilled. Comparisons were made using nonparametric Mann-Whitney U tests and chi-square tests. All tests were performed at α .05 level.
Results
A total of 1823 patients were included in this analysis: 35 IHS and 1788 ED strokes. The 2 groups did not differ with respect to age, race, or sex (Table 1). Patients with IHS had higher stroke severity (mean NIHSS 11.3 vs 5.1, P <.01) and longer length of stay than did ED patients with stroke (mean 12.8 vs 7.3 days, P < .01). Patients with IHS also were less likely to be discharged home when compared with ED patients with stroke (34.3% vs 63.8%, P < .01).
Table 2 summarizes our findings on eligibility and passing rates for the 11 QIs. For acute care metrics, we found that stroke severity documentation rates did not differ but were low for each patient group (51% vs 48%, P = .07). Patients with IHS were more likely to be eligible for IV tissue plasminogen activator (tPA; P < .01) although utilization rates did not differ. Only 2% of ED patients met eligibility criteria to receive tPA (36 of 1788), and among these patients only 16 actually received the drug. By comparison, 5 of 6 of eligible patients with IHS received tPA. Rates of dysphagia screening also were low for both groups, and patients with IHS were less likely to receive this screen prior to initiation of oral intake than were ED patients with stroke (27% vs 50%, P = .01).
Beyond the acute period, we found that patients with IHS were less likely than were ED patients with stroke to be eligible to receive antithrombotic therapy by 2 days after their initial stroke evaluation (74% vs 96%, P < .01), although treatment rates were similar between the 2 groups (P = .99). In patients with documented atrial fibrillation, initiation of anticoagulation therapy also did not differ (P = .99). The 2 groups were similar with respect to initiation of venous thromboembolism (VTE) prophylaxis (P = .596) and evaluation for rehabilitation needs (P = .42). Although rates of smoking cessation counseling and stroke education prior to discharge did not differ, overall rates of stroke education were very low for both groups (25% vs 36%, P = .55).
Similar to initiation of antithrombotic therapy in the hospital, we found lower rates of eligibility to receive antithrombotic therapy on discharge in the IHS group when compared with the ED group (77% vs 93%, P = .04). However, actual treatment initiation rates did not differ (P = .12). Use of lipid-lowering agents was similar for the 2 groups (P = .12).
Discussion
Our study found that veterans who develop an IHS received similar quality of care as did those presenting to the ED with stroke symptoms for many QIs, although there were some notable differences. We were pleased to find that overall rates of secondary stroke prevention initiation (antithrombotic and statin therapy), VTE prophylaxis, rehabilitation evaluations, and smoking cessation counseling were high for both groups, in keeping with evidence-based guidelines.17 This likely reflected the fact that these metrics typically involve care outside of the acute period and are less likely to be influenced by the location of initial stroke evaluation. Furthermore, efforts to improve smoking cessation and VTE prophylaxis are not exclusive to stroke care and have been the target of several nonstroke quality projects in the VHA. Many aspects of acute stroke care did differ, and present opportunities for quality improvement in the future.
In our sample, patients with IHS had higher IV thrombolytic eligibility, which has not typically been reported in other samples.10,11,18 In these studies, hospitalized patients have been reported to more often have contraindications to tPA, such as recent surgery or lack of stroke symptom recognition due to delirium or medication effects. Interestingly, patients presenting to VHA EDs had extremely low rates of tPA eligibility (2%), which is lower than many reported estimates of tPA eligibility outside of the VHA.19,20 This may be due to multiple influences, such as geographic barriers, patient perceptions about stroke symptoms, access to emergency medical services (EMS), EMS routing patterns, and social/cultural factors. Although not statistically significant due to small sample size, tPA use also was twice as high in the IHS group.
Given that a significant proportion of patients with IHS in the VHA system may be eligible for acute thrombolysis, our findings highlight the need for acute stroke protocols to ensure that patients with IHS receive the same rapid stroke assessment and access to thrombolytics as do patients evaluated in the ED. Further investigation is needed to determine whether there are unique features of patients with IHS in VHA hospitals, which may make them more eligible for IV thrombolysis.
Dysphagia is associated with increased risks for aspiration pneumonia in stroke patients.21 We found that patients with IHS were less likely to receive dysphagia screening compared with that of stroke patients admitted through the ED. This finding is consistent with the fact that care for patients with IHS is less frequently guided by specific stroke care protocols and algorithms that are more often used in EDs.8,11 Although attention to swallowing function may lead to improved outcomes in stroke, this can be easily overlooked in patients with IHS.22 However, low dysphagia screening also was found in patients admitted through the ED, suggesting that low screening rates cannot be solely explained by differences in where the initial stroke evaluation is occurring. These findings suggest a need for novel approaches to dysphagia screening in VHA stroke patients that can be universally implemented throughout the hospital.
Finally, we also found very low rates of stroke education prior to discharge for both groups. Given the risk of stroke recurrence and the overall poor level of public knowledge about stroke, providing patients with stroke with formal oral and written information on stroke is a critical component of secondary prevention.23,24 Educational tools, including those that are veteran specific, are now available for use in VHA hospitals and should be incorporated into quality improvement strategies for stroke care in VHA hospitals.
In 2012, the VHA Acute Stroke Treatment Directive was published in an effort to improve stroke care systemwide. Several of the metrics examined in this study are addressed in this directive. The data presented in this study is one of the only samples of stroke quality metrics within the VHA that largely predates the directive and can serve as a baseline comparator for future work examining stroke care after release of the directive. At present, although continuous internal reviews of quality data are ongoing, longitudinal description of stroke care quality since publication of the directive will help to inform future efforts to improve stroke care for veterans.
Limitations
Despite the strength of being a multicenter sampling of stroke care in high volume VHA hospitals, our study had several limitations. The IHS sample size was small, which limited our ability to evaluate differences between the groups, to evaluate generalizability, and account for estimation error.13 It is possible that differences existed between the groups that could not be observed in this sample due to small size (type II error) or that patient-specific characteristics not captured by these data could influence these metrics. Assessments of eligibility and passing were based on retrospective chart review and post hoc coding. Our sample assessed only patients who presented to larger VHA hospitals with higher stroke volumes, thus these findings may not be generalizable to smaller VHA hospitals with less systematized stroke care. This sample did not describe the specialty care services that were received by each patient, which may have influenced their stroke care. Finally, this study is an analysis of use of QIs in stroke care and did not examine how these indicators affect outcomes.
Conclusion
Despite reassuring findings for several inpatient ischemic stroke quality metrics, we found several differences in stroke care between patients with IHS compared with those presenting to the ED, emphasizing the need for standardized approaches to stroke care regardless of care setting. Although patients with IHS may be more likely to be eligible for tPA, these patients received dysphagia screening and less often than did ED patients with stroke. Ongoing quality initiatives should continue to place emphasis on improving all quality metrics (particularly dysphagia screening, stroke severity documentation, and stroke education) for patients with stroke at VHA hospitals across all care settings. Future work will be needed to examine how specific patient characteristics and revisions to stroke protocols may affect stroke quality metrics and outcomes between patients with IHS and those presenting to the ED.
Acknowledgments
The authors would like to thank Danielle Sager for her contributions to this project.
1. Go AS, Mozaffarian D, Roger VL, et al; American Heart Association Statistics Committee and Stroke Statistics Subcommittee. Heart disease and stroke statistics—2014 update: a report from the American Heart Association. Circulation. 2014;129:e28-e292.
2. Schwamm LH, Ali SF, Reeves MJ, et al. Temporal trends in patient characteristics and treatment with intravenous thrombolysis among acute ischemic stroke patients at Get With the Guidelines—Stroke hospitals. Circ Cardiovasc Qual Outcomes. 2013;6(5):543-549.
3. Reeves MJ, Parker C, Fonarow GC, Smith EE, Schwamm LH. Development of stroke performance measures: definitions, methods, and current measures. Stroke. 2010;41(7):1573-1578.
4. The Joint Commission. Certificate of distinction for primary stroke centers. https://www.jointcommission.org/certificate_of_distinction_for_primary_stroke_centers_/.Published April 30, 2012. Accessed July 9, 2019.
5. US Department of Veterans Affairs. Center highlight: acute ischemic stroke care for veterans. https://www.queri.research.va.gov/center_highlights/stroke.cfm. Updated February 20, 2014. Accessed July 16, 2019.
6. Chumbler NR, Jia H, Phipps MS, et al. Does inpatient quality of care differ by age among US veterans with ischemic stroke? J Stroke Cerebrovasc Dis. 2012;21(8):844-851.
7. Katzan IL, Spertus J, Bettger JP, et al; American Heart Association Stroke Council; Council on Quality of Care and Outcomes Research; Council on Cardiovascular and Stroke Nursing; Council on Cardiovascular Radiology and Intervention; Council on Cardiovascular Surgery and Anesthesia; Council on Clinical Cardiology. Risk adjustment of ischemic stroke outcomes for comparing hospital performance: a statement for healthcare professionals from the American Heart Association/American Stroke Association. Stroke. 2014;45(3):918-944.
8. Cumbler E, Wald H, Bhatt DL, et al. Quality of care and outcomes for in-hospital ischemic stroke: findings from the National Get With the Guidelines—Stroke. Stroke. 2014;45(1):231-238.
9. Blacker DJ. In-hospital stroke. Lancet Neurol. 2003;2(12):741-746.
10. Farooq MU, Reeves MJ, Gargano J, Wehner S, Hickenbottom S, Majid A; Paul Coverdell National Acute Stroke Registry Michigan Prototype Investigators. In-hospital stroke in a statewide stroke registry. Cerebrovascular Dis. 2008;25(1-2):12-20.
11. Bhalla A, Smeeton N, Rudd AG, Heuschmann P, Wolfe CD. A comparison of characteristics and resource use between in-hospital and admitted patients with stroke. J Stroke Cerebrovasc Dis. 2010;19:(5)357-363.
12. Garcia-Santibanez R, Liang J, Walker A, Matos-Diaz I, Kahkeshani K, Boniece I. Comparison of stroke codes in the emergency room and inpatient setting. J Stroke Cerebrovasc Dis. 2015;24(8):1948-1950.
13. Arling G, Reeves M, Ross J, et al. Estimating and reporting on the quality of inpatient stroke care by Veterans Health Administration medical centers. Circ Cardiovasc Qual Outcomes. 2012;5(1):44-51.
14. US Department of Veterans Affairs. Treatment of Acute Ischemic Stroke (AIS). VHA Directive 2011-038. https://www.hsrd.research.va.gov/news/feature/stroke.cfm. Updated January 20, 2014. Accessed July 17, 2019.
15. Williams LS, Daggett V, Slaven J, et al. Abstract 18: Does quality improvement training add to audit and feedback for inpatient stroke care processes? [International Stroke Conference abstract 18] Stroke. 2014;45(suppl 1):A18.
16. Williams LS, Yilmaz EY, Lopez-Yunez AM. Retrospective assessment of initial stroke severity with the NIH Stroke Scale. Stroke. 2000;31(4):858-862.
17. Jauch EC, Saver JL, Adams HP Jr, et al; American Heart Association Stroke Council; Council on Cardiovascular Nursing; Council on Peripheral Vascular Disease; Council on Clinical Cardiology. Guidelines for the early management of patients with acute ischemic stroke: a guideline for healthcare professionals from the American Heart Association/American Stroke Association. Stroke. 2013;44(3):870-947.
18. Park HJ, Cho HJ, Kim YD, et al. Comparison of the characteristics for in-hospital and out-of-hospital ischaemic strokes. Eur J Neurol. 2009;16(5):582-588.
19. Messé SR, Fonarow GC, Smith EE, et al. Use of tissue-type plasminogen activator before and after publication of the European Cooperative Acute Stroke Study III in Get With the Guidelines-Stroke. Circ Cardiovasc Qual Outcomes. 2012;5(3):321-326.
20. Allen NB, Kaltenbach L, Goldstein LB, et al. Regional variation in recommended treatments for ischemic stroke and TIA: Get With the Guidelines—Stroke 2003-2010. Stroke. 2012;43(7):1858-1864.
21. Martino R, Foley N, Bhogal S, Diamant N, Speechley M, Teasell R. Dysphagia after stroke: incidence, diagnosis, and pulmonary complications. Stroke. 2005;36(12):2756-2763.
22. Bravata DM, Wells CK, Lo AC, et al. Processes of care associated with acute stroke outcomes. Arch Intern Med. 2010;170(9):804-810.
23. Mosley I, Nicol M, Donnan G, Patrick I, Dewey H. Stroke symptoms and the decision to call for an ambulance. Stroke; a journal of cerebral circulation. 2007;38(2):361-366.
24. Jurkowski JM, Maniccia DM, Dennison BA, Samuels SJ, Spicer DA. Awareness of necessity to call 9-1-1 for stroke symptoms, upstate New York. Prev Chronic Dis. 2008;5(2):A41.
Decreasing Treatment of Asymptomatic Bacteriuria: An Interprofessional Approach to Antibiotic Stewardship
From the Mayo Clinic, Rochester, MN.
Abstract
- Objective: Asymptomatic bacteriuria (ASB) denotes asymptomatic carriage of bacteria within the urinary tract and does not require treatment in most patient populations. Unnecessary antimicrobial treatment has several consequences, including promotion of antimicrobial resistance, potential for medication adverse effects, and risk for Clostridiodes difficile infection. The aim of this quality improvement effort was to decrease both the unnecessary ordering of urine culture studies and unnecessary treatment of ASB.
- Methods: This is a single-center study of patients who received care on 3 internal medicine units at a large, academic medical center. We sought to determine the impact of information technology and educational interventions to decrease both inappropriate urine culture ordering and treatment of ASB. Data from included patients were collected over 3 1-month time periods: baseline, post-information technology intervention, and post-educational intervention.
- Results: There was a reduction in the percentage of patients who received antibiotics for ASB in the post-education intervention period as compared to baseline (35% vs 42%). The proportion of total urine cultures ordered by internal medicine clinicians did not change after an information technology intervention to redesign the computerized physician order entry screen for urine cultures.
- Conclusion: Educational interventions are effective ways to reduce rates of inappropriate treatment of ASB in patients admitted to internal medicine services.
Keywords: asymptomatic bacteriuria, UTI, information technology, education, quality.
Asymptomatic bacteriuria (ASB) is a common condition in which bacteria are recovered from a urine culture (UC) in patients without symptoms suggestive of urinary tract infection (UTI), with no pathologic consequences to most patients who are not treated.1,2 Patients with ASB do not exhibit symptoms of a UTI such as dysuria, increased frequency of urination, increased urgency, suprapubic tenderness, or costovertebral pain. Treatment with antibiotics is not indicated for most patients with ASB.1,3 According to the Infectious Diseases Society of America (IDSA), screening for bacteriuria and treatment for positive results is only indicated during pregnancy and prior to urologic procedures with anticipated breach of the mucosal lining.1
An estimated 20% to 52% of patients in hospital settings receive inappropriate treatment with antibiotics for ASB.4 Unnecessary prescribing of antibiotics has several negative consequences, including increased rates of antibiotic resistance, Clostridioides difficile infection, and medication adverse events, as well as increased health care costs.2,5 Antimicrobial stewardship programs to improve judicious use of antimicrobials are paramount to reducing these consequences, and their importance is heightened with recent requirements for antimicrobial stewardship put forth by The Joint Commission and the Centers for Medicare & Medicaid Services.6,7
A previous review of UC and antimicrobial use in patients for purposes of quality improvement at our institution over a 2-month period showed that of 59 patients with positive UCs, 47 patients (80%) did not have documented symptoms of a UTI. Of these 47 patients with ASB, 29 (61.7%) received antimicrobial treatment unnecessarily (unpublished data). We convened a group of clinicians and nonclinicians representing the areas of infectious disease, pharmacy, microbiology, statistics, and hospital internal medicine (IM) to examine the unnecessary treatment of ASB in our institution. Our objective was to address 2 antimicrobial stewardship issues: inappropriate UC ordering and unnecessary use of antibiotics to treat ASB. Our aim was to reduce the inappropriate ordering of UCs and to reduce treatment of ASB.
Methods
Setting
The study was conducted on 3 IM nursing units with a total of 83 beds at a large tertiary care academic medical center in the midwestern United States, and was approved by the organization’s Institutional Review Board.
Participants
We included all non-pregnant patients aged 18 years or older who received care from an IM primary service. These patients were admitted directly to an IM team through the emergency department (ED) or transferred to an IM team after an initial stay in the intensive care unit.
Data Source
Microbiology laboratory reports generated from the electronic health record were used to identify all patients with a collected UC sample who received care from an IM service prior to discharge. Urine samples were collected by midstream catch or catheterization. Data on urine Gram stain and urine dipstick were not included. Henceforth, the phrase “urine culture order” indicates that a UC was both ordered and performed. Data reports were generated for the month of August 2016 to determine the baseline number of UCs ordered. Charts of patients with positive UCs were reviewed to determine if antibiotics were started for the positive UC and whether the patient had signs or symptoms consistent with a UTI. If antibiotics were started in the absence of signs or symptoms to support a UTI, the patient was determined to have been unnecessarily treated for ASB. Reports were then generated for the month after each intervention was implemented, with the same chart review undertaken for positive UCs. Bacteriuria was defined in our study as the presence of microbial growth greater than 10,000 CFU/mL in UC.
Interventions
Initial analysis by our study group determined that lack of electronic clinical decision support (CDS) at the point of care and provider knowledge gaps in interpreting positive UCs were the 2 main contributors to unnecessary UC orders and unnecessary treatment of positive UCs, respectively. We reviewed the work of other groups who reported interventions to decrease treatment of ASB, ranging from educational presentations to pocket cards and treatment algorithms.8-13 We hypothesized that there would be a decrease in UC orders with CDS embedded in the computerized order entry screen, and that we would decrease unnecessary treatment of positive UCs by educating clinicians on indications for appropriate antibiotic prescribing in the setting of a positive UC.
Information technology intervention. The first intervention implemented involved redesign of the UC ordering screen in the computerized physician order entry (CPOE) system. This intervention went live hospital-wide, including the IM floors, intensive care units, and all other areas except the ED, on February 1, 2017 (Figure 1). The ordering screen required the prescriber to select from a list of appropriate indications for ordering a UC, including urine frequency, urgency, or dysuria; unexplained suprapubic or flank pain; fever in patients without another recognized cause; screening obtained prior to urologic procedure; or screening during pregnancy. An additional message advised prescribers to avoid ordering the culture if the patient had malodorous or cloudy urine, pyuria without urinary symptoms, or had an alternative cause of fever. Before we implemented the information technology (IT) intervention, there had been no specific point-of-care guidance on UC ordering.

Educational intervention. The second intervention, driven by clinical pharmacists, involved active and passive education of prescribers specifically designed to address unnecessary treatment of ASB. The IT intervention with CDS for UC ordering remained live. Presentations designed by the study group summarizing the appropriate indications for ordering a UC, distinguishing ASB from UTI, and discouraging treatment of ASB were delivered via a variety of routes by clinical pharmacists to nurses, nurse practitioners, physician assistants, pharmacists, medical residents, and staff physicians providing care to patients on the 3 IM units over a 1-month period in March 2017. The presentations contained the same basic content, but the information was delivered to target each specific audience group.
Medical residents received a 10-minute live presentation during a conference. Nurse practitioners, physician assistants, and staff physicians received a presentation via email, and highlights of the presentation were delivered by clinical pharmacists at their respective monthly group meetings. A handout was presented to nursing staff at nursing huddles, and presentation slides were distributed by email. Educational posters were posted in the medical resident workrooms, nursing breakrooms, and staff bathrooms on the units.
Outcome Measurements
The endpoints of interest were the percentage of patients with positive UCs unnecessarily treated for ASB before and after each intervention and the number of UCs ordered at baseline and after implementation of each intervention. Counterbalance measures assessed included the incidence of UTI, pyelonephritis, or urosepsis within 7 days of positive UC for patients who did not receive antibiotic treatment for ASB.
Results
Data from a total of 270 cultures were examined from IM nursing units. A total of 117 UCs were ordered during the baseline period before interventions were implemented. For a period of 1 month following activation of the IT intervention, 73 UCs were ordered. For a period of 1 month following the educational interventions, 80 UCs were ordered. Of these, 61 (52%) UCs were positive at baseline, 37 (51%) after the IT intervention, and 41 (51%) after the educational intervention. Patient characteristics were similar between the 3 groups (Table); 64.7% of patients were female in their early to mid-seventies. The majority of UCs were ordered by providers in the ED in all 3 periods examined (51%-70%). The percentage of patients who received antibiotics prior to UC for another indication (including bacteriuria) in the baseline, post-IT intervention, and post-education intervention groups were 30%, 27%, and 45%, respectively.

The study outcomes are summarized in Figure 2. Among patients with positive cultures, there was not a reduction in inappropriate treatment of ASB compared to baseline after the IT intervention (48% vs 42%). Following the education intervention, there was a reduction in unnecessary ASB treatment as compared both to baseline (35% vs 42%) and to post-IT intervention (35% vs 48%). There was no difference between the 3 study periods in the percentage of total UCs ordered by IM clinicians. The counterbalance measure showed that 1 patient who did not receive antibiotics within 7 days of a positive UC developed pyelonephritis, UTI, or sepsis due to a UTI in each intervention group.
 ordered and cases of asymptomatic bacteriuria (ASB) treated at baseline and after interventions. UTI, urinary tract infection.")
Discussion
The results of this study demonstrate the role of multimodal interventions in antimicrobial stewardship and add to the growing body of evidence supporting the work of antimicrobial stewardship programs. Our multidisciplinary study group and multipronged intervention follow recent guideline recommendations for antimicrobial stewardship program interventions against unnecessary treatment of ASB.14 Initial analysis by our study group determined lack of CDS at the point of care and provider knowledge gaps in interpreting positive UCs as the 2 main contributors to unnecessary UC orders and unnecessary treatment of positive UCs in our local practice culture. The IT component of our intervention was intended to provide CDS for ordering UCs, and the education component focused on informing clinicians’ treatment decisions for positive UCs.
It has been suggested that the type of stewardship intervention that is most effective fits the specific needs and resources of an institution.14,15 And although the IDSA does not recommend education as a stand-alone intervention,16 we found it to be an effective intervention for our clinicians in our work environment. However, since the CPOE guidance was in place during the educational study periods, it is possible that the effect was due to a combination of these 2 approaches. Our pre-intervention ASB treatment rates were consistent with a recent meta-analysis in which the rate of inappropriate treatment of ASB was 45%.17 This meta-analysis found educational and organizational interventions led to a mean absolute risk reduction of 33%. After the education intervention, we saw a 7% decrease in unnecessary treatment of ASB compared to baseline, and a 13% decrease compared to the month just prior to the educational intervention.
Lessons learned from our work included how clear review of local processes can inform quality improvement interventions. For instance, we initially hypothesized that IM clinicians would benefit from point-of-care CDS guidance, but such guidance used alone without educational interventions was not supported by the results. We also determined that the majority of UCs from patients on general medicine units were ordered by ED providers. This revealed an opportunity to implement similar interventions in the ED, as this was the initial point of contact for many of these patients.
As with any clinical intervention, the anticipated benefits should be weighed against potential harm. Using counterbalance measures, we found there was minimal risk in the occurrence of UTI, pyelonephritis, or sepsis if clinicians avoided treating ASB. This finding is consistent with IDSA guideline recommendations and other studies that suggest that withholding treatment for asymptomatic bacteriuria does not lead to worse outcomes.1
This study has several limitations. Data were obtained through review of the electronic health record and therefore documentation may be incomplete. Also, antimicrobials for empiric coverage or treatment for other infections (eg, pneumonia, sepsis) may have confounded our results, as empirical antimicrobials were given to 27% to 45% of patients prior to UC. This was a quality improvement project carried out over defined time intervals, and thus our sample size was limited and not adequately powered to show statistical significance. Additionally, given the bundling of interventions, it is difficult to determine the impact of each intervention independently. Although CDS for UC ordering may not have influenced ordering, it is possible that the IT intervention raised awareness of ASB and influenced treatment practices.
Conclusion
Our work supports the principles of antibiotic stewardship as brought forth by IDSA.16 This work was the effort of a multidisciplinary team, which aligns with recommendations by Daniel and colleagues, published after our study had ended, for reducing overtreatment of ASB.14 Additionally, our study results provided valuable information for our institution. Although improvements in management of ASB were modest, the success of provider education and identification of other work areas and clinicians to target for future intervention were helpful in consideration of further studies. This work will also aid us in developing an expected effect size for future studies. We plan to provide ongoing education for IM providers as well as education in the ED to target providers who make first contact with patients admitted to inpatient services. In addition, the CPOE UC ordering screen message will continue to be used hospital-wide and will be expanded to the ED ordering system. Our interventions, experiences, and challenges may be used by other institutions to design effective antimicrobial stewardship interventions directed towards reducing rates of inappropriate ASB treatment.
Corresponding author: Prasanna P. Narayanan, PharmD, 200 First Street SW, Rochester, MN 55905; [email protected].
Financial disclosures: None.
1. Nicolle LE, Gupta K, Bradley SF, et al. Clinical practice guideline for the management of asymptomatic bacteriuria: 2019 update by the Infectious Diseases Society of America. Clin Infect Dis. 2019;68:e83–75.
2. Trautner BW, Grigoryan L, Petersen NJ, et al. Effectiveness of an antimicrobial stewardship approach for urinary catheter-associated asymptomatic bacteriuria. JAMA Intern Med. 2015;175:1120-1127.
3. Horan TC, Andrus M, Dudeck MA. CDC/NHSN surveillance definition of health care-associated infection and criteria for specific types of infections in the acute care setting. Am J Infect Control. 2008;36:309-332.
4. Trautner BW. Asymptomatic bacteriuria: when the treatment is worse than the disease. Nat Rev Urol. 2011;9:85-93.
5. Costelloe C, Metcalfe C, Lovering A, et al. Effect of antibiotic prescribing in primary care on antimicrobial resistance in individual patients: systematic review and meta-analysis. BMJ. 2010;340:c2096.
6. The Joint Commission. Prepublication Requirements: New antimicrobial stewardship standard. Jun 22, 2016. www.jointcommission.org/assets/1/6/HAP-CAH_Antimicrobial_Prepub.pdf. Accessed January 24, 2019.
7. Federal Register. Medicare and Medicaid Programs; Hospital and Critical Access Hospital (CAH) Changes to Promote Innovation, Flexibility, and Improvement in Patient Care.Centers for Medicare & Medicaid Services. June 16, 2016. CMS-3295-P
8. Hartley SE, Kuhn L, Valley S, et al. Evaluating a hospitalist-based intervention to decrease unnecessary antimicrobial use in patients with asymptomatic bacteriuria. Infect Control Hosp Epidemiol. 2016;37:1044-1051.
9. Pavese P, Saurel N, Labarere J, et al. Does an educational session with an infectious diseases physician reduce the use of inappropriate antibiotic therapy for inpatients with positive urine culture results? A controlled before-and-after study. Infect Control Hosp Epidemiol. 2009;30:596-599.
10. Kelley D, Aaronson P, Poon E, et al. Evaluation of an antimicrobial stewardship approach to minimize overuse of antibiotics in patients with asymptomatic bacteriuria. Infect Control Hosp Epidemiol. 2014;35:193-195.
11. Chowdhury F, Sarkar K, Branche A, et al. Preventing the inappropriate treatment of asymptomatic bacteriuria at a community teaching hospital. J Community Hosp Intern Med Perspect. 2012;2.
12. Bonnal C, Baune B, Mion M, et al. Bacteriuria in a geriatric hospital: impact of an antibiotic improvement program. J Am Med Dir Assoc. 2008;9:605-609.
13. Linares LA, Thornton DJ, Strymish J, et al. Electronic memorandum decreases unnecessary antimicrobial use for asymptomatic bacteriuria and culture-negative pyuria. Infect Control Hosp Epidemiol. 2011;32:644-648.
14. Daniel M, Keller S, Mozafarihashjin M, et al. An implementation guide to reducing overtreatment of asymptomatic bacteriuria. JAMA Intern Med. 2018;178:271-276.
15. Redwood R, Knobloch MJ, Pellegrini DC, et al. Reducing unnecessary culturing: a systems approach to evaluating urine culture ordering and collection practices among nurses in two acute care settings. Antimicrob Resist Infect Control. 2018;7:4.
16. Barlam TF, Cosgrove SE, Abbo LM, et al. Implementing an antibiotic stewardship program: guidelines by the Infectious Diseases Society of America and the Society for Healthcare Epidemiology of America. Clin Infect Dis. 2016;62:e51–e7.
17. Flokas ME, Andreatos N, Alevizakos M, et al. Inappropriate management of asymptomatic patients with positive urine cultures: a systematic review and meta-analysis. Open Forum Infect Dis. 2017;4:1-10.
From the Mayo Clinic, Rochester, MN.
Abstract
- Objective: Asymptomatic bacteriuria (ASB) denotes asymptomatic carriage of bacteria within the urinary tract and does not require treatment in most patient populations. Unnecessary antimicrobial treatment has several consequences, including promotion of antimicrobial resistance, potential for medication adverse effects, and risk for Clostridiodes difficile infection. The aim of this quality improvement effort was to decrease both the unnecessary ordering of urine culture studies and unnecessary treatment of ASB.
- Methods: This is a single-center study of patients who received care on 3 internal medicine units at a large, academic medical center. We sought to determine the impact of information technology and educational interventions to decrease both inappropriate urine culture ordering and treatment of ASB. Data from included patients were collected over 3 1-month time periods: baseline, post-information technology intervention, and post-educational intervention.
- Results: There was a reduction in the percentage of patients who received antibiotics for ASB in the post-education intervention period as compared to baseline (35% vs 42%). The proportion of total urine cultures ordered by internal medicine clinicians did not change after an information technology intervention to redesign the computerized physician order entry screen for urine cultures.
- Conclusion: Educational interventions are effective ways to reduce rates of inappropriate treatment of ASB in patients admitted to internal medicine services.
Keywords: asymptomatic bacteriuria, UTI, information technology, education, quality.
Asymptomatic bacteriuria (ASB) is a common condition in which bacteria are recovered from a urine culture (UC) in patients without symptoms suggestive of urinary tract infection (UTI), with no pathologic consequences to most patients who are not treated.1,2 Patients with ASB do not exhibit symptoms of a UTI such as dysuria, increased frequency of urination, increased urgency, suprapubic tenderness, or costovertebral pain. Treatment with antibiotics is not indicated for most patients with ASB.1,3 According to the Infectious Diseases Society of America (IDSA), screening for bacteriuria and treatment for positive results is only indicated during pregnancy and prior to urologic procedures with anticipated breach of the mucosal lining.1
An estimated 20% to 52% of patients in hospital settings receive inappropriate treatment with antibiotics for ASB.4 Unnecessary prescribing of antibiotics has several negative consequences, including increased rates of antibiotic resistance, Clostridioides difficile infection, and medication adverse events, as well as increased health care costs.2,5 Antimicrobial stewardship programs to improve judicious use of antimicrobials are paramount to reducing these consequences, and their importance is heightened with recent requirements for antimicrobial stewardship put forth by The Joint Commission and the Centers for Medicare & Medicaid Services.6,7
A previous review of UC and antimicrobial use in patients for purposes of quality improvement at our institution over a 2-month period showed that of 59 patients with positive UCs, 47 patients (80%) did not have documented symptoms of a UTI. Of these 47 patients with ASB, 29 (61.7%) received antimicrobial treatment unnecessarily (unpublished data). We convened a group of clinicians and nonclinicians representing the areas of infectious disease, pharmacy, microbiology, statistics, and hospital internal medicine (IM) to examine the unnecessary treatment of ASB in our institution. Our objective was to address 2 antimicrobial stewardship issues: inappropriate UC ordering and unnecessary use of antibiotics to treat ASB. Our aim was to reduce the inappropriate ordering of UCs and to reduce treatment of ASB.
Methods
Setting
The study was conducted on 3 IM nursing units with a total of 83 beds at a large tertiary care academic medical center in the midwestern United States, and was approved by the organization’s Institutional Review Board.
Participants
We included all non-pregnant patients aged 18 years or older who received care from an IM primary service. These patients were admitted directly to an IM team through the emergency department (ED) or transferred to an IM team after an initial stay in the intensive care unit.
Data Source
Microbiology laboratory reports generated from the electronic health record were used to identify all patients with a collected UC sample who received care from an IM service prior to discharge. Urine samples were collected by midstream catch or catheterization. Data on urine Gram stain and urine dipstick were not included. Henceforth, the phrase “urine culture order” indicates that a UC was both ordered and performed. Data reports were generated for the month of August 2016 to determine the baseline number of UCs ordered. Charts of patients with positive UCs were reviewed to determine if antibiotics were started for the positive UC and whether the patient had signs or symptoms consistent with a UTI. If antibiotics were started in the absence of signs or symptoms to support a UTI, the patient was determined to have been unnecessarily treated for ASB. Reports were then generated for the month after each intervention was implemented, with the same chart review undertaken for positive UCs. Bacteriuria was defined in our study as the presence of microbial growth greater than 10,000 CFU/mL in UC.
Interventions
Initial analysis by our study group determined that lack of electronic clinical decision support (CDS) at the point of care and provider knowledge gaps in interpreting positive UCs were the 2 main contributors to unnecessary UC orders and unnecessary treatment of positive UCs, respectively. We reviewed the work of other groups who reported interventions to decrease treatment of ASB, ranging from educational presentations to pocket cards and treatment algorithms.8-13 We hypothesized that there would be a decrease in UC orders with CDS embedded in the computerized order entry screen, and that we would decrease unnecessary treatment of positive UCs by educating clinicians on indications for appropriate antibiotic prescribing in the setting of a positive UC.
Information technology intervention. The first intervention implemented involved redesign of the UC ordering screen in the computerized physician order entry (CPOE) system. This intervention went live hospital-wide, including the IM floors, intensive care units, and all other areas except the ED, on February 1, 2017 (Figure 1). The ordering screen required the prescriber to select from a list of appropriate indications for ordering a UC, including urine frequency, urgency, or dysuria; unexplained suprapubic or flank pain; fever in patients without another recognized cause; screening obtained prior to urologic procedure; or screening during pregnancy. An additional message advised prescribers to avoid ordering the culture if the patient had malodorous or cloudy urine, pyuria without urinary symptoms, or had an alternative cause of fever. Before we implemented the information technology (IT) intervention, there had been no specific point-of-care guidance on UC ordering.
Educational intervention. The second intervention, driven by clinical pharmacists, involved active and passive education of prescribers specifically designed to address unnecessary treatment of ASB. The IT intervention with CDS for UC ordering remained live. Presentations designed by the study group summarizing the appropriate indications for ordering a UC, distinguishing ASB from UTI, and discouraging treatment of ASB were delivered via a variety of routes by clinical pharmacists to nurses, nurse practitioners, physician assistants, pharmacists, medical residents, and staff physicians providing care to patients on the 3 IM units over a 1-month period in March 2017. The presentations contained the same basic content, but the information was delivered to target each specific audience group.
Medical residents received a 10-minute live presentation during a conference. Nurse practitioners, physician assistants, and staff physicians received a presentation via email, and highlights of the presentation were delivered by clinical pharmacists at their respective monthly group meetings. A handout was presented to nursing staff at nursing huddles, and presentation slides were distributed by email. Educational posters were posted in the medical resident workrooms, nursing breakrooms, and staff bathrooms on the units.
Outcome Measurements
The endpoints of interest were the percentage of patients with positive UCs unnecessarily treated for ASB before and after each intervention and the number of UCs ordered at baseline and after implementation of each intervention. Counterbalance measures assessed included the incidence of UTI, pyelonephritis, or urosepsis within 7 days of positive UC for patients who did not receive antibiotic treatment for ASB.
Results
Data from a total of 270 cultures were examined from IM nursing units. A total of 117 UCs were ordered during the baseline period before interventions were implemented. For a period of 1 month following activation of the IT intervention, 73 UCs were ordered. For a period of 1 month following the educational interventions, 80 UCs were ordered. Of these, 61 (52%) UCs were positive at baseline, 37 (51%) after the IT intervention, and 41 (51%) after the educational intervention. Patient characteristics were similar between the 3 groups (Table); 64.7% of patients were female in their early to mid-seventies. The majority of UCs were ordered by providers in the ED in all 3 periods examined (51%-70%). The percentage of patients who received antibiotics prior to UC for another indication (including bacteriuria) in the baseline, post-IT intervention, and post-education intervention groups were 30%, 27%, and 45%, respectively.
The study outcomes are summarized in Figure 2. Among patients with positive cultures, there was not a reduction in inappropriate treatment of ASB compared to baseline after the IT intervention (48% vs 42%). Following the education intervention, there was a reduction in unnecessary ASB treatment as compared both to baseline (35% vs 42%) and to post-IT intervention (35% vs 48%). There was no difference between the 3 study periods in the percentage of total UCs ordered by IM clinicians. The counterbalance measure showed that 1 patient who did not receive antibiotics within 7 days of a positive UC developed pyelonephritis, UTI, or sepsis due to a UTI in each intervention group.
Discussion
The results of this study demonstrate the role of multimodal interventions in antimicrobial stewardship and add to the growing body of evidence supporting the work of antimicrobial stewardship programs. Our multidisciplinary study group and multipronged intervention follow recent guideline recommendations for antimicrobial stewardship program interventions against unnecessary treatment of ASB.14 Initial analysis by our study group determined lack of CDS at the point of care and provider knowledge gaps in interpreting positive UCs as the 2 main contributors to unnecessary UC orders and unnecessary treatment of positive UCs in our local practice culture. The IT component of our intervention was intended to provide CDS for ordering UCs, and the education component focused on informing clinicians’ treatment decisions for positive UCs.
It has been suggested that the type of stewardship intervention that is most effective fits the specific needs and resources of an institution.14,15 And although the IDSA does not recommend education as a stand-alone intervention,16 we found it to be an effective intervention for our clinicians in our work environment. However, since the CPOE guidance was in place during the educational study periods, it is possible that the effect was due to a combination of these 2 approaches. Our pre-intervention ASB treatment rates were consistent with a recent meta-analysis in which the rate of inappropriate treatment of ASB was 45%.17 This meta-analysis found educational and organizational interventions led to a mean absolute risk reduction of 33%. After the education intervention, we saw a 7% decrease in unnecessary treatment of ASB compared to baseline, and a 13% decrease compared to the month just prior to the educational intervention.
Lessons learned from our work included how clear review of local processes can inform quality improvement interventions. For instance, we initially hypothesized that IM clinicians would benefit from point-of-care CDS guidance, but such guidance used alone without educational interventions was not supported by the results. We also determined that the majority of UCs from patients on general medicine units were ordered by ED providers. This revealed an opportunity to implement similar interventions in the ED, as this was the initial point of contact for many of these patients.
As with any clinical intervention, the anticipated benefits should be weighed against potential harm. Using counterbalance measures, we found there was minimal risk in the occurrence of UTI, pyelonephritis, or sepsis if clinicians avoided treating ASB. This finding is consistent with IDSA guideline recommendations and other studies that suggest that withholding treatment for asymptomatic bacteriuria does not lead to worse outcomes.1
This study has several limitations. Data were obtained through review of the electronic health record and therefore documentation may be incomplete. Also, antimicrobials for empiric coverage or treatment for other infections (eg, pneumonia, sepsis) may have confounded our results, as empirical antimicrobials were given to 27% to 45% of patients prior to UC. This was a quality improvement project carried out over defined time intervals, and thus our sample size was limited and not adequately powered to show statistical significance. Additionally, given the bundling of interventions, it is difficult to determine the impact of each intervention independently. Although CDS for UC ordering may not have influenced ordering, it is possible that the IT intervention raised awareness of ASB and influenced treatment practices.
Conclusion
Our work supports the principles of antibiotic stewardship as brought forth by IDSA.16 This work was the effort of a multidisciplinary team, which aligns with recommendations by Daniel and colleagues, published after our study had ended, for reducing overtreatment of ASB.14 Additionally, our study results provided valuable information for our institution. Although improvements in management of ASB were modest, the success of provider education and identification of other work areas and clinicians to target for future intervention were helpful in consideration of further studies. This work will also aid us in developing an expected effect size for future studies. We plan to provide ongoing education for IM providers as well as education in the ED to target providers who make first contact with patients admitted to inpatient services. In addition, the CPOE UC ordering screen message will continue to be used hospital-wide and will be expanded to the ED ordering system. Our interventions, experiences, and challenges may be used by other institutions to design effective antimicrobial stewardship interventions directed towards reducing rates of inappropriate ASB treatment.
Corresponding author: Prasanna P. Narayanan, PharmD, 200 First Street SW, Rochester, MN 55905; [email protected].
Financial disclosures: None.
1. Nicolle LE, Gupta K, Bradley SF, et al. Clinical practice guideline for the management of asymptomatic bacteriuria: 2019 update by the Infectious Diseases Society of America. Clin Infect Dis. 2019;68:e83–75.
2. Trautner BW, Grigoryan L, Petersen NJ, et al. Effectiveness of an antimicrobial stewardship approach for urinary catheter-associated asymptomatic bacteriuria. JAMA Intern Med. 2015;175:1120-1127.
3. Horan TC, Andrus M, Dudeck MA. CDC/NHSN surveillance definition of health care-associated infection and criteria for specific types of infections in the acute care setting. Am J Infect Control. 2008;36:309-332.
4. Trautner BW. Asymptomatic bacteriuria: when the treatment is worse than the disease. Nat Rev Urol. 2011;9:85-93.
5. Costelloe C, Metcalfe C, Lovering A, et al. Effect of antibiotic prescribing in primary care on antimicrobial resistance in individual patients: systematic review and meta-analysis. BMJ. 2010;340:c2096.
6. The Joint Commission. Prepublication Requirements: New antimicrobial stewardship standard. Jun 22, 2016. www.jointcommission.org/assets/1/6/HAP-CAH_Antimicrobial_Prepub.pdf. Accessed January 24, 2019.
7. Federal Register. Medicare and Medicaid Programs; Hospital and Critical Access Hospital (CAH) Changes to Promote Innovation, Flexibility, and Improvement in Patient Care.Centers for Medicare & Medicaid Services. June 16, 2016. CMS-3295-P
8. Hartley SE, Kuhn L, Valley S, et al. Evaluating a hospitalist-based intervention to decrease unnecessary antimicrobial use in patients with asymptomatic bacteriuria. Infect Control Hosp Epidemiol. 2016;37:1044-1051.
9. Pavese P, Saurel N, Labarere J, et al. Does an educational session with an infectious diseases physician reduce the use of inappropriate antibiotic therapy for inpatients with positive urine culture results? A controlled before-and-after study. Infect Control Hosp Epidemiol. 2009;30:596-599.
10. Kelley D, Aaronson P, Poon E, et al. Evaluation of an antimicrobial stewardship approach to minimize overuse of antibiotics in patients with asymptomatic bacteriuria. Infect Control Hosp Epidemiol. 2014;35:193-195.
11. Chowdhury F, Sarkar K, Branche A, et al. Preventing the inappropriate treatment of asymptomatic bacteriuria at a community teaching hospital. J Community Hosp Intern Med Perspect. 2012;2.
12. Bonnal C, Baune B, Mion M, et al. Bacteriuria in a geriatric hospital: impact of an antibiotic improvement program. J Am Med Dir Assoc. 2008;9:605-609.
13. Linares LA, Thornton DJ, Strymish J, et al. Electronic memorandum decreases unnecessary antimicrobial use for asymptomatic bacteriuria and culture-negative pyuria. Infect Control Hosp Epidemiol. 2011;32:644-648.
14. Daniel M, Keller S, Mozafarihashjin M, et al. An implementation guide to reducing overtreatment of asymptomatic bacteriuria. JAMA Intern Med. 2018;178:271-276.
15. Redwood R, Knobloch MJ, Pellegrini DC, et al. Reducing unnecessary culturing: a systems approach to evaluating urine culture ordering and collection practices among nurses in two acute care settings. Antimicrob Resist Infect Control. 2018;7:4.
16. Barlam TF, Cosgrove SE, Abbo LM, et al. Implementing an antibiotic stewardship program: guidelines by the Infectious Diseases Society of America and the Society for Healthcare Epidemiology of America. Clin Infect Dis. 2016;62:e51–e7.
17. Flokas ME, Andreatos N, Alevizakos M, et al. Inappropriate management of asymptomatic patients with positive urine cultures: a systematic review and meta-analysis. Open Forum Infect Dis. 2017;4:1-10.
Elevating Critical Care Pharmacy Services in a Resource-Limited Environment Through Establishment of a Pharmacist Team
From Robert Wood Johnson University Hospital Hamilton, Hamilton, NJ.
Abstract
- Background: Critical care pharmacy services are often provided by clinical specialists during limited hours and, otherwise, by general practice pharmacists, leading to varied level, expertise, and multidisciplinary expectations of these services.
- Objective: Since no published descriptions of successful models sustaining routine, high-quality critical care pharmacy services in a community-based, resource-limited environment exist, a critical care pharmacist team (CCPT) was created to meet this goal. After successful launch, the initiative’s primary goal was to assess whether team formation indeed standardized and increased the level of pharmacy services routinely provided. The secondary goal was to demonstrate cultural acceptance, and thus sustainability, of the model.
- Methods: A CCPT was formed from existing pharmacist resources. A longitudinal educational plan, including classroom, bedside, and practice modeling, assured consistent skills, knowledge, and confidence. Interventions performed by pharmacists before and after implementation were assessed to determine whether the model standardized type and level of service. Surveys of the CCPT and multidisciplinary teams assessed perceptions of expertise, confidence, and value as surrogates for model success and sustainability.
- Results: Interventions after CCPT formation reflected elevated and standardized critical care pharmacy services that advanced the multidisciplinary team’s perception of the pharmacist as an integral, essential team member. CCPT members felt empowered, as reflected by self-directed enrollment in PharmD programs and/or obtaining board certification. This success subsequently served to improve the culture of cooperation and spark similar evolution of other disciplines.
- Conclusion: The standardization and optimization of pharmacy services through a dedicated CCPT improved continuity of care and standardized multidisciplinary team expectations.
Keywords: critical care; clinical pharmacist; pharmaceutical care; standards of practice.
There has been significant evolution in the role, training, and overall understanding of the impact of critical care pharmacists over the past 2 decades. The specialized knowledge and role of pharmacists make them essential links in the provision of quality critical care services.1 The Society of Critical Care Medicine (SCCM) and the American College of Clinical Pharmacy (ACCP) have defined the level of clinical practice and specialized skills that characterize the critical care pharmacist and have made recommendations regarding both the personnel requirements for the provision of pharmaceutical care to critically ill patients and the fundamental, desirable, and optimal pharmacy services that should be provided to these patients (Table 1).2 Despite this, only two-thirds of US intensive care units (ICUs) have clinical pharmacists/specialists (defined as spending at least 50% of their time providing clinical services), resulting in fundamental activities dominating routine pharmacist services.3 The clinical nature of most desirable and optimal activities, such as code response and pharmacist-driven protocol management, is limited, but these activities correlate with decreases in mortality across hospitalized populations.4

Despite their demonstrated benefit and recognized role, critical care pharmacists remain a limited resource with limited physical presence in ICUs.5 This presents hospital pharmacies with a real dilemma: given that clinical pharmacy specialists are often a limited resource, what services (fundamental, desirable, or optimal) should be provided by which pharmacists over what hours and on which days? For many hospitals, personnel resources allow for a clinical pharmacy specialist (either trained or with significant experience in critical care) to participate in multidisciplinary rounds, but do not allow a specialist to be present 7 days per week across all times of the day. As a result, routine services may be inconsistent and limited to activities that are fundamental-to-desirable, due to the varied educational and training backgrounds of pharmacists providing nonrounding services. Where gaps have been identified, remote (tele-health) provision of targeted ICU pharmacist services are beneficial.5
In our organization, we recognized the significant variation created by this resource-defined model and sought to develop a process to move closer to published best practice standards for quality services2 through the creation of a formalized critical care pharmacist team (CCPT). This change was spurred by the transition of our organization’s clinical pharmacist to a board-certified, faculty-based specialist, which in turn spurred new focus on standardizing both the type and quality of services provided by the entire pharmacy team, targeting a higher, more consistent level of pharmacist care which better aligned with SCCM/ACCP-defined activities associated with quality services. The specialist proposed the formation of a CCPT, a process that involved targeted, intensive education and clinical skills development of a narrow pharmacist audience; administration approved this plan, provided that the CCPT arose from existing resources. This realignment focused on ensuring continuity of services across pharmacist roles (ie, rounding vs satellite) as well as across times (both days of the week and shifts). This report describes the methods used to recruit, train, and sustain a CCPT; the resulting changes observed in levels of pharmacy services after CCPT implementation; and the impressions of the CCPT members and the multidisciplinary team (physicians, nurses, dieticians, respiratory therapists, chaplains, and social workers in addition to the pharmacist), as cultural integration and perceived value are essential for sustainability and growth of the model.
Methods
Setting
Robert Wood Johnson University Hospital Hamilton is a 248-bed suburban community hospital in New Jersey with a 20-bed ICU that provides level II6 critical care services as part of an 11-hospital system. Critical care pharmacy services spanned from fundamental (eg, order review) to optimal (eg, independent pharmacotherapy evaluation) activities, with tremendous variability associated with who was engaged in care. In this original model, weekday ICU pharmacy services were provided by satellite-based general practice staff pharmacists (satellite pharmacy located in the ICU provides services for ICU, telemetry, and the emergency department) across 2 shifts (0700-2300; 9 pharmacists during the day shift and 2 on the evening shift). Satellite pharmacists largely focused on traditional/fundamental pharmacy practice, including order review, drug therapy evaluation, and adverse drug event identification. Additionally, a hospital-based, residency-trained clinical pharmacist rounded 3 days per week. General practice staff pharmacists provided weekend and overnight services. Very limited, prospective, independent clinical evaluation or individualized pharmacotherapy optimization occurred routinely. No established clinical assessment priorities or strategies existed, and thus expectations of pharmacy services were associated with the individual pharmacist present.
Team Structure and Recruitment
The staff pharmacists were well-established, with each having 25 to 41 years of practice experience. All 11 full-time staff pharmacists graduated with Bachelor of Science degrees in pharmacy, and 5 of them had returned to acquire Doctor of Pharmacy degrees prior to the initiative. None had completed post-doctoral training residencies, as residencies were not the standard when these pharmacists entered practice. The staffing model necessitated that pharmacists maintain Basic Life Support (BLS) and Advanced Cardiac Life Support (ACLS) competency as members of inpatient emergency response teams.
Three volunteers were recruited to the initial transformational process. These volunteer pharmacists were preferentially assigned to the ICU, with a clinically focused weekend rotation, to provide 7-day/week rounding continuity, but maintained general competencies and cross-functionality. Weekend responsibilities included critical care assessments and multidisciplinary rounding, inpatient emergency response, patient education/medication histories, and inpatient warfarin management consultations.
Team Training and Development
Longitudinal education of the CCPT included classroom, bedside, and practice-modeling training strategies to complement routine exposure and integration into the pharmacist’s practice in providing direct patient care. Concentrated learning occurred over a 3-month period, with extended bedside and patient-case-based learning continuing for another 3 months. Expectations of the critical care pharmacist as an independent consultant to the interdisciplinary team targeting holistic pharmacotherapy optimization were established, instilling independence and accountability within the role. Next, lecture and bedside training targeted the development of crucial assessment skills, including an understanding of device and equipment implications on pharmacotherapy decisions, pharmacokinetic and pharmacodynamic variations in critically ill patients, and supportive care. A minimum of 5 hours of group lectures were included for all members of the CCPT, with additional instruction provided based on individual needs. Lectures explored the evidence and practice associated with common diagnoses, including review of related literature, core guidelines, and institutional order sets. Fundamental topics included pain, agitation, and delirium (PAD) during mechanical ventilation, infectious diseases, and hemodynamic management.
To reinforce knowledge, build bedside assessment skills, and increase confidence, pharmacists routinely partnered with the specialist during independent morning bedside evaluations and rounds. Over time, the specialist role became increasingly supportive as the critical care pharmacist grew into the primary role. On weekends the specialist was not present but remained on call to discuss cases with the rounding critical care pharmacist. This served to reinforce clinical decision-making and expand knowledge; these patient-specific lessons were communicated with the team to support continued development and standardization.
In addition to these internal efforts, the specialist simultaneously recalibrated expectations among key ICU stakeholders, establishing uniform quality and scope of service from the CCPT. Historically, physicians and nurses sought input from specific pharmacists, and thus a cultural change regarding the perceived value of the team was required. To reinforce this, those demanding a specific pharmacist were referred to the CCPT member present.
The initial training process involved a significant proportion of the specialist’s time. Initially focused on classroom lecture and core skills development, time increasingly focused on individual learner’s needs and learning styles. Mentoring and partnering were key during this period. In the first 6 months, weekend calls were routine, but these quickly tapered as the team gained experience and confidence in their knowledge and skills.
Tools and Team Support
Beyond standardizing knowledge and skills, team effectiveness depended on establishing routine assessment criteria (Table 2), communication tools, and references. Rounding and sign-out processes were standardized to support continuity of care. A patient census report generated by the clinical computer system was used as the daily worksheet and was stored on a sign-out clipboard to readily communicate clinically pertinent history, assessments, recommendations, and pending follow-up. The report included patient demographics, admitting diagnosis, and a list of consulting physicians. The pharmacist routinely recorded daily bedside observations, his/her independent assessments (topics outlined in Table 2), pertinent history, events, and goals established on rounds. Verbal sign-out occurred twice daily (during weekdays)—from the rounding to satellite pharmacist after rounds (unless 1 person fulfilled both roles) and between day and evening shifts. Additionally, a resource binder provided rapid accessibility to key information (eg, published evidence, tools, institutional protocols), with select references residing on the sign-out clipboard for immediate access during rounding.

Monthly meetings were established to promote full engagement of the team, demonstrate ownership, and provide opportunity for discussion and information sharing. Meetings covered operational updates, strategic development of the service, educational topics, and discussions of difficult cases.
Assessment
While not directly studied, existing evidence suggests that appropriately trained critical care pharmacists should be able to perform a broad range of services, from fundamental to optimal.7 To evaluate if CCPT training elevated and standardized the type of interventions routinely made, services provided prior to the team’s formation were compared to those provided after formation through interrogation of the institution’s surveillance system. As a baseline, a comparison of the types of ICU interventions documented by the specialist during a 2-month period prior to the team’s formation were compared to the interventions documented by the staff pharmacists who became part of the CCPT. Since standardization of skills and practice were goals of the CCPT formation, the same comparison was conducted after team formation to assess whether the intervention types normalized across roles, reflecting a consistent level of service.
As assignment to the CCPT is voluntary, with no additional compensation or tangible benefits, the success of the CCPT relies on active pharmacist engagement and ongoing commitment. Thus, a personal belief that their commitment was valuable and increased professional satisfaction was key to sustain change. An online, voluntary, anonymous survey was conducted to assess the CCPT member’s perceptions of their preparedness, development of skills and comfort level, and acceptance by the multidisciplinary team, as these elements would influence members’ beliefs regarding the impact and value of the team and their justification for commitment to continuous, uncompensated learning and training. Their thoughts on professional satisfaction and development were collected as a surrogate for the model’s sustainability.
Success and sustainability also depend on the multidisciplinary team’s acceptance and perceived value of the CCPT, especially given its evolution from a model in which clinical feedback was sought and accepted exclusively from the specialist. To evaluate these components, an online, voluntary, anonymous survey of the multidisciplinary members was conducted.
Results
CCPT Interventions and Level of Service
Prior to CCPT formation, intervention categories documented by the specialist differed from those of the staff (Figure 1). The staff’s baseline interventions represented those arising from the established, routine assessments performed by all pharmacists for all inpatients, such as renal dose assessments. The specialist’s interventions largely focused on independent pharmacotherapy assessments and optimization strategies. After team formation, intervention type became increasingly consistent across the CCPT, with all members aligning with the specialist’s interventions. Intervention categories reflected the clinically focused, independent assessments targeted during training (eg, supportive care and pain/sedation assessment), expanding beyond the routine assessments performed across the general hospitalized population.
.")
When compared to SCCM/ACCP ideals, these interventions corresponded with an expansion from routinely fundamental to routinely broad (ie, fundamental, desirable, and optimal) critical care pharmacist activities, thus elevating the overall quality of services provided by the team while assuring continuity. Desirable activities adopted by the CCPT included multidisciplinary rounding on all ICU patients; drug history review for appropriate management during acute illness; and training of students and providing educational in-services. Optimal activities routinely integrated included independent and/or collaborative investigation of ICU guidelines/protocol impact and scholarship in peer-reviewed publications. Prior to CCPT formation, staff involvement of desirable activities was limited to resuscitation event response and clarification of effective dosage regimens, with no involvement in optimal activities.
CCPT Impressions
The online, voluntary, anonymous survey was completed by 5 of the 6 staff members (the 3 original members plus 3 staff members who were added several months into the program to enhance continuity and cross-shift coverage) comprising the team. Using a 5-point Likert scale, members ranked their comfort level with their critical care knowledge, bedside skills, ability to actively participate in rounds, and ability to address controversial clinical issues in their staffing role prior to team formation (ie, baseline) compared to their current CCPT practice. Overall, self-assessments reflected perceived increases across all categories. Prior to CCPT training and implementation, all team members were “not at all,” “slightly comfortable,” or “somewhat comfortable” with these points, while after training and implementation all reported being “comfortable” or “very comfortable” with the same points. All members reported feeling better prepared and confident in caring for critically ill patients and felt that the team and its standardized approach enhanced medication safety. When asked about their impressions of the perceived value of the CCPT by interdisciplinary peers, pharmacists felt it was perceived as bringing “a lot” or “a great deal” of value. Additionally, all members uniformly felt that the team supported their professional growth and enhanced their professional satisfaction.
Multidisciplinary Impressions of Service and Value
A total of 29 (90%) multidisciplinary team members completed the online, voluntary, anonymous survey of their impressions of the CCPT’s service and impact. Surveys represented the impressions of critical care physicians, the unit’s nursing leadership (administrative and clinical), nursing education, staff nurses, social work, and pastoral care. Using a 5-point Likert scale, all respondents reported that they “agreed” or “entirely agreed” that the CCPT enhanced care. Specifically, they reported that pharmacists were more visible and engaged, and provided more consistent and reliable care regardless of which member was present. Services were seen as more robust and seamless, meeting interdisciplinary needs. The CCPT was viewed as a cohesive, efficient group. Respondents felt that the CCPT’s presence and engagement on weekends enhanced continuity of pharmaceutical care. As a result, the CCPT was seen as enhancing interdisciplinary understanding of the pharmacist’s value in critical care.
Discussion
Realignment and development of existing personnel resources allowed our organization to assure greater continuity, consistency, and quality of pharmacy care in the critical care setting (Figure 2). By standardizing expectations and broadening multidisciplinary understanding of the CCPT’s unique value, the pharmacist’s role was solidified and became an integral, active part of routine patient bedside care.
 practice model before and after implementation of critical care pharmacist team (CCPT).")
Prior to forming the CCPT, the physical presence of the pharmacist, as well as the services provided, were inconsistent. While a general practice pharmacist was in the satellite pharmacy within the ICU for up to 2 shifts on weekdays, pharmacists largely focused on traditional functions associated with order review and drug dispensing or established hospital-wide programs such as renal dosing or intravenous-to-oral formulation switches. The pharmacist remained in the satellite, not visible on rounds or at the bedside. In fact, there was a clear lack of comfort, frequently articulated by the pharmacists, with clinical questions that required bedside assessment, leading to routine escalation to the clinical specialist, who was not always readily available. This dynamic set an expectation for the multidisciplinary team that there were segregated pharmacy services—the satellite provided order review and product and the clinical specialist, in the limited hours present, provided clinical consultation and education. The formation of the CCPT abolished this tiered level of expectations, establishing a physical and clinical presence of a critical care pharmacist with equal capability and comfort. Both the pharmacist and multidisciplinary members perceived enhancements and value associated with the standardization and consistency provided by implementing the CCPT. Intervention data from before and after team formation support that routine interventions in critical care normalized the care provided and increased the robustness of critical care pharmacy services, with a strong shift to both clinical and academic activities considered desirable to optimal by SCCM/ACCP standards.
The benefit of pharmacist presence in the ICU is well described, with studies showing that the presence of a pharmacist is associated with medication error prevention and adverse drug event identification.8-10 However, this body of evidence applies no standardized definition regarding critical care pharmacist qualifications, with many studies pre-dating the wider availability of post-doctoral training programs and national board certification for critical care pharmacists.11 Training and certification structures have evolved with increased recognition of the specialization required to optimize the pharmacist’s role in providing quality care, albeit at a slower pace than published standards.1,2 In 2018, 136 organizations offered America Society of Health-System Pharmacists–accredited critical care pharmacy residencies.12 National recognition of expertise as a critical care pharmacist was established by the Board of Pharmacy Specialists in 2015, with more than 1600 pharmacists currently recognized.12 Our project is the only known description of a pharmacist practice model that increases critical care pharmacist availability through the application of standardized criteria incorporating these updated qualifications, thus ensuring expertise and experience that correlates with practice quality and consistency.
Despite the advancements achieved through this project, several limitations exist. First, while this model largely normalized services over the day and evening shifts, our night shift continues to be covered by 1 general practice pharmacist. More recently, resource reallocation mandated reduction in satellite hours, although that CCPT member remains available from the main pharmacy. The specialist remains on call to support the general practice pharmacists, but in-house expertise cannot be made available in the absence of additional resources. To optimize existing staffing, the specialist begins clinical evaluations during the early morning, overlapping with the night-shift prior to the satellite pharmacist’s arrival. This both provides some pharmacist presence at the bedside for night shift nurses and extends the hours during which a critical care pharmacist is physically available. Second, while all efforts are made to stagger time off, unavoidable gaps in critical care pharmacist coverage occur; expansion of the original team from 3 to 6 members has greatly reduced the likelihood of such gaps. Last, the program was designed to achieve routine integration of activities shown in the literature as being associated with quality, and those activities were assessed as a surrogate for quality.
Informal input, confirmed through survey data, from various disciplines on our team has consistently supported that the establishment of the CCPT has met a need by both standardizing critical care pharmacy practice and optimizing the pharmacist role within the team. While we recognize the limitations associated with the size of these surveys, they represent large proportions of our team and reflect key elements known to be important in sustaining long-term cultural change—a belief that what one is doing is both justified and valuable. This success has been a catalyst for several ongoing projects, fostering the development and adoption of critical care pharmacist protocols to allow more autonomous practice within our scope. Team development and movement toward robust protocol management has sparked a cultural evolution across disciplines as we strive to achieve the SCCM description of a highly effective team2,13 that emphasizes each discipline practicing fully within its scope in a horizontal team structure. Thus, the ICU medical director has used the success of the CCPT structure as an example to support optimization and development of the practice by other disciplines within the team. This has led to a significant revision in our rounding structure and interdisciplinary care model.14
The survey of CCPT members revealed that the model both engaged and stimulated the pharmacists involved, reflective of the autonomy and accountability required for sustainable, transformational cultural change. Within a year of entering the CCPT, 2 of the 3 pharmacists initially engaged had earned their board certification in pharmacotherapy (ie, BCPS) and the other, who had not acquired her Doctor of Pharmacy degree prior to the CCPT initiative, enrolled in a program to do so. The pharmacists expressed that they obtained BCPS over the newly available critical care certification because of the expectation that they maintain expertise across patient populations. This level of self-driven motivation in the absence of compensation reflects the value and professional satisfaction gained from being voluntary members of the CCPT.
Conclusion
Critical care pharmacy practice has continued to evolve to include increasingly specialized training for newer graduates and, more recently, the availability of critical care pharmacist board certification. While it is optimal to apply these standards when filling open critical care pharmacist positions, many hospitals require existing staff to fulfill multiple roles across various patient populations, leading to a variation in educational, training, and practice backgrounds for pharmacists currently practicing in the ICU. To minimize the variation associated with this resource-limited structure in a manner that standardized and elevated the type and level of service provided, we created a CCPT with existing pharmacists who were willing to accept intensive training and demonstrate an ongoing commitment to maintain defined competencies and skills. Our goal was to solidify the essential role of the critical care pharmacist in providing quality critical care services as described in the literature. The CCPT was well-received by the multidisciplinary team and served as an example for other disciplines that had similar struggles. The team’s success expanded into several other ongoing initiatives, including critical care pharmacist–driven protocols.
Acknowledgment: The authors thank Nina Roberts, MSN, RN, CCRN, NEA-BC, and Carol Ash, DO, MBA, MHCDS, the ICU Nursing and Medical Directors, respectively, at the time of this program’s initiation, for supporting the development of the critical care pharmacist team initiative and review of this manuscript.
Corresponding author: Liza Barbarello Andrews, PharmD, BCCCP, BCPS, Ernest Mario School of Pharmacy, Rutgers, The State University of New Jersey, 160 Frelinghuysen Road, Piscataway, NJ 08854; [email protected].
Financial disclosures: None.
1. Brilli RJ, Spevetz A, Branson RD, et al. American College of Critical Care Medicine Task Force on Models of Critical Care Delivery. Critical care delivery in the intensive care unit: defining clinical roles and the best practice model. Crit Care Med. 2001;29:2007-2019.
2. Rudis MI, Brandl KM; Society of Critical Care Medicine and American College of Clinical Pharmacy Task Force on Critical Care Pharmacy Services. Position paper on critical care pharmacy services. Crit Care Med. 2000;28:3746-3750.
3. MacLaren R, Devlin JW, Martin SJ, et al. Critical care pharmacy services in United States hospitals. Ann Pharmacother. 2006;40:612-618.
4. Bond CA, Raehl CL. Clinical pharmacy services, pharmacy staffing, and hospital mortality rates. Pharmacotherapy. 2007;27:481-493.
5. Forni A, Skahan N, Hartman CA, et al. Evaluation of the impact of a tele-ICU pharmacist on the management of sedation in critically ill mechanically ventilated patients. Ann Pharmacother. 2010;44:432-438.
6. Haupt MT, Bekes CE, Brilli RJ, et al. Guidelines on critical care services and personnel: recommendations based on a system of categorization on three levels of care. Crit Care Med. 2003;31:2677-2683.
7. Board of Pharmacy Specialties. Critical Care Pharmacy. www.bpsweb.org/bps-specialties/critical-care-pharmacy/.
8. Montazeri M, Cook DJ. Impact of a clinical pharmacist in a multidisciplinary intensive care unit. Crit Care Med. 1994;22:1044-1048.
9. Leape L, Cullen D, Clapp M, et al. Pharmacist participation on physician rounds and adverse drug events in the intensive care unit. JAMA. 1999;282:267-270.
10. Horn E, Jacobi J. The critical care pharmacist: evolution of an essential team member. Crit Care Med. 2006;34(suppl):S46-S51.
11. Jacobi J. Measuring the impact of a pharmacist in the intensive care unit—are all pharmacists created equal? J Crit Care. 2015;30:1127-1128.
12. American Society of HealthSystem Pharmacists. Online residency directory. https://accred.ashp.org/aps/pages/directory/residencyProgramSearch.aspx. Accessed June 26, 2019.
13. Weled BJ, Adzhigirey LA, Hodgman TM, et al. Critical care delivery: the importance of process of care and ICU structure to improved outcomes: an update from the American College of Critical Care Medicine Task Force on Models of Critical Care. Crit Care Med. 2015;43:1520-1525.
14. Andrews LB, Roberts N, Ash C, et al. The LOTUS: a journey to value-based, patient-centered care. Creat Nurs. 2019;25:17-24.
From Robert Wood Johnson University Hospital Hamilton, Hamilton, NJ.
Abstract
- Background: Critical care pharmacy services are often provided by clinical specialists during limited hours and, otherwise, by general practice pharmacists, leading to varied level, expertise, and multidisciplinary expectations of these services.
- Objective: Since no published descriptions of successful models sustaining routine, high-quality critical care pharmacy services in a community-based, resource-limited environment exist, a critical care pharmacist team (CCPT) was created to meet this goal. After successful launch, the initiative’s primary goal was to assess whether team formation indeed standardized and increased the level of pharmacy services routinely provided. The secondary goal was to demonstrate cultural acceptance, and thus sustainability, of the model.
- Methods: A CCPT was formed from existing pharmacist resources. A longitudinal educational plan, including classroom, bedside, and practice modeling, assured consistent skills, knowledge, and confidence. Interventions performed by pharmacists before and after implementation were assessed to determine whether the model standardized type and level of service. Surveys of the CCPT and multidisciplinary teams assessed perceptions of expertise, confidence, and value as surrogates for model success and sustainability.
- Results: Interventions after CCPT formation reflected elevated and standardized critical care pharmacy services that advanced the multidisciplinary team’s perception of the pharmacist as an integral, essential team member. CCPT members felt empowered, as reflected by self-directed enrollment in PharmD programs and/or obtaining board certification. This success subsequently served to improve the culture of cooperation and spark similar evolution of other disciplines.
- Conclusion: The standardization and optimization of pharmacy services through a dedicated CCPT improved continuity of care and standardized multidisciplinary team expectations.
Keywords: critical care; clinical pharmacist; pharmaceutical care; standards of practice.
There has been significant evolution in the role, training, and overall understanding of the impact of critical care pharmacists over the past 2 decades. The specialized knowledge and role of pharmacists make them essential links in the provision of quality critical care services.1 The Society of Critical Care Medicine (SCCM) and the American College of Clinical Pharmacy (ACCP) have defined the level of clinical practice and specialized skills that characterize the critical care pharmacist and have made recommendations regarding both the personnel requirements for the provision of pharmaceutical care to critically ill patients and the fundamental, desirable, and optimal pharmacy services that should be provided to these patients (Table 1).2 Despite this, only two-thirds of US intensive care units (ICUs) have clinical pharmacists/specialists (defined as spending at least 50% of their time providing clinical services), resulting in fundamental activities dominating routine pharmacist services.3 The clinical nature of most desirable and optimal activities, such as code response and pharmacist-driven protocol management, is limited, but these activities correlate with decreases in mortality across hospitalized populations.4
Despite their demonstrated benefit and recognized role, critical care pharmacists remain a limited resource with limited physical presence in ICUs.5 This presents hospital pharmacies with a real dilemma: given that clinical pharmacy specialists are often a limited resource, what services (fundamental, desirable, or optimal) should be provided by which pharmacists over what hours and on which days? For many hospitals, personnel resources allow for a clinical pharmacy specialist (either trained or with significant experience in critical care) to participate in multidisciplinary rounds, but do not allow a specialist to be present 7 days per week across all times of the day. As a result, routine services may be inconsistent and limited to activities that are fundamental-to-desirable, due to the varied educational and training backgrounds of pharmacists providing nonrounding services. Where gaps have been identified, remote (tele-health) provision of targeted ICU pharmacist services are beneficial.5
In our organization, we recognized the significant variation created by this resource-defined model and sought to develop a process to move closer to published best practice standards for quality services2 through the creation of a formalized critical care pharmacist team (CCPT). This change was spurred by the transition of our organization’s clinical pharmacist to a board-certified, faculty-based specialist, which in turn spurred new focus on standardizing both the type and quality of services provided by the entire pharmacy team, targeting a higher, more consistent level of pharmacist care which better aligned with SCCM/ACCP-defined activities associated with quality services. The specialist proposed the formation of a CCPT, a process that involved targeted, intensive education and clinical skills development of a narrow pharmacist audience; administration approved this plan, provided that the CCPT arose from existing resources. This realignment focused on ensuring continuity of services across pharmacist roles (ie, rounding vs satellite) as well as across times (both days of the week and shifts). This report describes the methods used to recruit, train, and sustain a CCPT; the resulting changes observed in levels of pharmacy services after CCPT implementation; and the impressions of the CCPT members and the multidisciplinary team (physicians, nurses, dieticians, respiratory therapists, chaplains, and social workers in addition to the pharmacist), as cultural integration and perceived value are essential for sustainability and growth of the model.
Methods
Setting
Robert Wood Johnson University Hospital Hamilton is a 248-bed suburban community hospital in New Jersey with a 20-bed ICU that provides level II6 critical care services as part of an 11-hospital system. Critical care pharmacy services spanned from fundamental (eg, order review) to optimal (eg, independent pharmacotherapy evaluation) activities, with tremendous variability associated with who was engaged in care. In this original model, weekday ICU pharmacy services were provided by satellite-based general practice staff pharmacists (satellite pharmacy located in the ICU provides services for ICU, telemetry, and the emergency department) across 2 shifts (0700-2300; 9 pharmacists during the day shift and 2 on the evening shift). Satellite pharmacists largely focused on traditional/fundamental pharmacy practice, including order review, drug therapy evaluation, and adverse drug event identification. Additionally, a hospital-based, residency-trained clinical pharmacist rounded 3 days per week. General practice staff pharmacists provided weekend and overnight services. Very limited, prospective, independent clinical evaluation or individualized pharmacotherapy optimization occurred routinely. No established clinical assessment priorities or strategies existed, and thus expectations of pharmacy services were associated with the individual pharmacist present.
Team Structure and Recruitment
The staff pharmacists were well-established, with each having 25 to 41 years of practice experience. All 11 full-time staff pharmacists graduated with Bachelor of Science degrees in pharmacy, and 5 of them had returned to acquire Doctor of Pharmacy degrees prior to the initiative. None had completed post-doctoral training residencies, as residencies were not the standard when these pharmacists entered practice. The staffing model necessitated that pharmacists maintain Basic Life Support (BLS) and Advanced Cardiac Life Support (ACLS) competency as members of inpatient emergency response teams.
Three volunteers were recruited to the initial transformational process. These volunteer pharmacists were preferentially assigned to the ICU, with a clinically focused weekend rotation, to provide 7-day/week rounding continuity, but maintained general competencies and cross-functionality. Weekend responsibilities included critical care assessments and multidisciplinary rounding, inpatient emergency response, patient education/medication histories, and inpatient warfarin management consultations.
Team Training and Development
Longitudinal education of the CCPT included classroom, bedside, and practice-modeling training strategies to complement routine exposure and integration into the pharmacist’s practice in providing direct patient care. Concentrated learning occurred over a 3-month period, with extended bedside and patient-case-based learning continuing for another 3 months. Expectations of the critical care pharmacist as an independent consultant to the interdisciplinary team targeting holistic pharmacotherapy optimization were established, instilling independence and accountability within the role. Next, lecture and bedside training targeted the development of crucial assessment skills, including an understanding of device and equipment implications on pharmacotherapy decisions, pharmacokinetic and pharmacodynamic variations in critically ill patients, and supportive care. A minimum of 5 hours of group lectures were included for all members of the CCPT, with additional instruction provided based on individual needs. Lectures explored the evidence and practice associated with common diagnoses, including review of related literature, core guidelines, and institutional order sets. Fundamental topics included pain, agitation, and delirium (PAD) during mechanical ventilation, infectious diseases, and hemodynamic management.
To reinforce knowledge, build bedside assessment skills, and increase confidence, pharmacists routinely partnered with the specialist during independent morning bedside evaluations and rounds. Over time, the specialist role became increasingly supportive as the critical care pharmacist grew into the primary role. On weekends the specialist was not present but remained on call to discuss cases with the rounding critical care pharmacist. This served to reinforce clinical decision-making and expand knowledge; these patient-specific lessons were communicated with the team to support continued development and standardization.
In addition to these internal efforts, the specialist simultaneously recalibrated expectations among key ICU stakeholders, establishing uniform quality and scope of service from the CCPT. Historically, physicians and nurses sought input from specific pharmacists, and thus a cultural change regarding the perceived value of the team was required. To reinforce this, those demanding a specific pharmacist were referred to the CCPT member present.
The initial training process involved a significant proportion of the specialist’s time. Initially focused on classroom lecture and core skills development, time increasingly focused on individual learner’s needs and learning styles. Mentoring and partnering were key during this period. In the first 6 months, weekend calls were routine, but these quickly tapered as the team gained experience and confidence in their knowledge and skills.
Tools and Team Support
Beyond standardizing knowledge and skills, team effectiveness depended on establishing routine assessment criteria (Table 2), communication tools, and references. Rounding and sign-out processes were standardized to support continuity of care. A patient census report generated by the clinical computer system was used as the daily worksheet and was stored on a sign-out clipboard to readily communicate clinically pertinent history, assessments, recommendations, and pending follow-up. The report included patient demographics, admitting diagnosis, and a list of consulting physicians. The pharmacist routinely recorded daily bedside observations, his/her independent assessments (topics outlined in Table 2), pertinent history, events, and goals established on rounds. Verbal sign-out occurred twice daily (during weekdays)—from the rounding to satellite pharmacist after rounds (unless 1 person fulfilled both roles) and between day and evening shifts. Additionally, a resource binder provided rapid accessibility to key information (eg, published evidence, tools, institutional protocols), with select references residing on the sign-out clipboard for immediate access during rounding.
Monthly meetings were established to promote full engagement of the team, demonstrate ownership, and provide opportunity for discussion and information sharing. Meetings covered operational updates, strategic development of the service, educational topics, and discussions of difficult cases.
Assessment
While not directly studied, existing evidence suggests that appropriately trained critical care pharmacists should be able to perform a broad range of services, from fundamental to optimal.7 To evaluate if CCPT training elevated and standardized the type of interventions routinely made, services provided prior to the team’s formation were compared to those provided after formation through interrogation of the institution’s surveillance system. As a baseline, a comparison of the types of ICU interventions documented by the specialist during a 2-month period prior to the team’s formation were compared to the interventions documented by the staff pharmacists who became part of the CCPT. Since standardization of skills and practice were goals of the CCPT formation, the same comparison was conducted after team formation to assess whether the intervention types normalized across roles, reflecting a consistent level of service.
As assignment to the CCPT is voluntary, with no additional compensation or tangible benefits, the success of the CCPT relies on active pharmacist engagement and ongoing commitment. Thus, a personal belief that their commitment was valuable and increased professional satisfaction was key to sustain change. An online, voluntary, anonymous survey was conducted to assess the CCPT member’s perceptions of their preparedness, development of skills and comfort level, and acceptance by the multidisciplinary team, as these elements would influence members’ beliefs regarding the impact and value of the team and their justification for commitment to continuous, uncompensated learning and training. Their thoughts on professional satisfaction and development were collected as a surrogate for the model’s sustainability.
Success and sustainability also depend on the multidisciplinary team’s acceptance and perceived value of the CCPT, especially given its evolution from a model in which clinical feedback was sought and accepted exclusively from the specialist. To evaluate these components, an online, voluntary, anonymous survey of the multidisciplinary members was conducted.
Results
CCPT Interventions and Level of Service
Prior to CCPT formation, intervention categories documented by the specialist differed from those of the staff (Figure 1). The staff’s baseline interventions represented those arising from the established, routine assessments performed by all pharmacists for all inpatients, such as renal dose assessments. The specialist’s interventions largely focused on independent pharmacotherapy assessments and optimization strategies. After team formation, intervention type became increasingly consistent across the CCPT, with all members aligning with the specialist’s interventions. Intervention categories reflected the clinically focused, independent assessments targeted during training (eg, supportive care and pain/sedation assessment), expanding beyond the routine assessments performed across the general hospitalized population.
When compared to SCCM/ACCP ideals, these interventions corresponded with an expansion from routinely fundamental to routinely broad (ie, fundamental, desirable, and optimal) critical care pharmacist activities, thus elevating the overall quality of services provided by the team while assuring continuity. Desirable activities adopted by the CCPT included multidisciplinary rounding on all ICU patients; drug history review for appropriate management during acute illness; and training of students and providing educational in-services. Optimal activities routinely integrated included independent and/or collaborative investigation of ICU guidelines/protocol impact and scholarship in peer-reviewed publications. Prior to CCPT formation, staff involvement of desirable activities was limited to resuscitation event response and clarification of effective dosage regimens, with no involvement in optimal activities.
CCPT Impressions
The online, voluntary, anonymous survey was completed by 5 of the 6 staff members (the 3 original members plus 3 staff members who were added several months into the program to enhance continuity and cross-shift coverage) comprising the team. Using a 5-point Likert scale, members ranked their comfort level with their critical care knowledge, bedside skills, ability to actively participate in rounds, and ability to address controversial clinical issues in their staffing role prior to team formation (ie, baseline) compared to their current CCPT practice. Overall, self-assessments reflected perceived increases across all categories. Prior to CCPT training and implementation, all team members were “not at all,” “slightly comfortable,” or “somewhat comfortable” with these points, while after training and implementation all reported being “comfortable” or “very comfortable” with the same points. All members reported feeling better prepared and confident in caring for critically ill patients and felt that the team and its standardized approach enhanced medication safety. When asked about their impressions of the perceived value of the CCPT by interdisciplinary peers, pharmacists felt it was perceived as bringing “a lot” or “a great deal” of value. Additionally, all members uniformly felt that the team supported their professional growth and enhanced their professional satisfaction.
Multidisciplinary Impressions of Service and Value
A total of 29 (90%) multidisciplinary team members completed the online, voluntary, anonymous survey of their impressions of the CCPT’s service and impact. Surveys represented the impressions of critical care physicians, the unit’s nursing leadership (administrative and clinical), nursing education, staff nurses, social work, and pastoral care. Using a 5-point Likert scale, all respondents reported that they “agreed” or “entirely agreed” that the CCPT enhanced care. Specifically, they reported that pharmacists were more visible and engaged, and provided more consistent and reliable care regardless of which member was present. Services were seen as more robust and seamless, meeting interdisciplinary needs. The CCPT was viewed as a cohesive, efficient group. Respondents felt that the CCPT’s presence and engagement on weekends enhanced continuity of pharmaceutical care. As a result, the CCPT was seen as enhancing interdisciplinary understanding of the pharmacist’s value in critical care.
Discussion
Realignment and development of existing personnel resources allowed our organization to assure greater continuity, consistency, and quality of pharmacy care in the critical care setting (Figure 2). By standardizing expectations and broadening multidisciplinary understanding of the CCPT’s unique value, the pharmacist’s role was solidified and became an integral, active part of routine patient bedside care.
Prior to forming the CCPT, the physical presence of the pharmacist, as well as the services provided, were inconsistent. While a general practice pharmacist was in the satellite pharmacy within the ICU for up to 2 shifts on weekdays, pharmacists largely focused on traditional functions associated with order review and drug dispensing or established hospital-wide programs such as renal dosing or intravenous-to-oral formulation switches. The pharmacist remained in the satellite, not visible on rounds or at the bedside. In fact, there was a clear lack of comfort, frequently articulated by the pharmacists, with clinical questions that required bedside assessment, leading to routine escalation to the clinical specialist, who was not always readily available. This dynamic set an expectation for the multidisciplinary team that there were segregated pharmacy services—the satellite provided order review and product and the clinical specialist, in the limited hours present, provided clinical consultation and education. The formation of the CCPT abolished this tiered level of expectations, establishing a physical and clinical presence of a critical care pharmacist with equal capability and comfort. Both the pharmacist and multidisciplinary members perceived enhancements and value associated with the standardization and consistency provided by implementing the CCPT. Intervention data from before and after team formation support that routine interventions in critical care normalized the care provided and increased the robustness of critical care pharmacy services, with a strong shift to both clinical and academic activities considered desirable to optimal by SCCM/ACCP standards.
The benefit of pharmacist presence in the ICU is well described, with studies showing that the presence of a pharmacist is associated with medication error prevention and adverse drug event identification.8-10 However, this body of evidence applies no standardized definition regarding critical care pharmacist qualifications, with many studies pre-dating the wider availability of post-doctoral training programs and national board certification for critical care pharmacists.11 Training and certification structures have evolved with increased recognition of the specialization required to optimize the pharmacist’s role in providing quality care, albeit at a slower pace than published standards.1,2 In 2018, 136 organizations offered America Society of Health-System Pharmacists–accredited critical care pharmacy residencies.12 National recognition of expertise as a critical care pharmacist was established by the Board of Pharmacy Specialists in 2015, with more than 1600 pharmacists currently recognized.12 Our project is the only known description of a pharmacist practice model that increases critical care pharmacist availability through the application of standardized criteria incorporating these updated qualifications, thus ensuring expertise and experience that correlates with practice quality and consistency.
Despite the advancements achieved through this project, several limitations exist. First, while this model largely normalized services over the day and evening shifts, our night shift continues to be covered by 1 general practice pharmacist. More recently, resource reallocation mandated reduction in satellite hours, although that CCPT member remains available from the main pharmacy. The specialist remains on call to support the general practice pharmacists, but in-house expertise cannot be made available in the absence of additional resources. To optimize existing staffing, the specialist begins clinical evaluations during the early morning, overlapping with the night-shift prior to the satellite pharmacist’s arrival. This both provides some pharmacist presence at the bedside for night shift nurses and extends the hours during which a critical care pharmacist is physically available. Second, while all efforts are made to stagger time off, unavoidable gaps in critical care pharmacist coverage occur; expansion of the original team from 3 to 6 members has greatly reduced the likelihood of such gaps. Last, the program was designed to achieve routine integration of activities shown in the literature as being associated with quality, and those activities were assessed as a surrogate for quality.
Informal input, confirmed through survey data, from various disciplines on our team has consistently supported that the establishment of the CCPT has met a need by both standardizing critical care pharmacy practice and optimizing the pharmacist role within the team. While we recognize the limitations associated with the size of these surveys, they represent large proportions of our team and reflect key elements known to be important in sustaining long-term cultural change—a belief that what one is doing is both justified and valuable. This success has been a catalyst for several ongoing projects, fostering the development and adoption of critical care pharmacist protocols to allow more autonomous practice within our scope. Team development and movement toward robust protocol management has sparked a cultural evolution across disciplines as we strive to achieve the SCCM description of a highly effective team2,13 that emphasizes each discipline practicing fully within its scope in a horizontal team structure. Thus, the ICU medical director has used the success of the CCPT structure as an example to support optimization and development of the practice by other disciplines within the team. This has led to a significant revision in our rounding structure and interdisciplinary care model.14
The survey of CCPT members revealed that the model both engaged and stimulated the pharmacists involved, reflective of the autonomy and accountability required for sustainable, transformational cultural change. Within a year of entering the CCPT, 2 of the 3 pharmacists initially engaged had earned their board certification in pharmacotherapy (ie, BCPS) and the other, who had not acquired her Doctor of Pharmacy degree prior to the CCPT initiative, enrolled in a program to do so. The pharmacists expressed that they obtained BCPS over the newly available critical care certification because of the expectation that they maintain expertise across patient populations. This level of self-driven motivation in the absence of compensation reflects the value and professional satisfaction gained from being voluntary members of the CCPT.
Conclusion
Critical care pharmacy practice has continued to evolve to include increasingly specialized training for newer graduates and, more recently, the availability of critical care pharmacist board certification. While it is optimal to apply these standards when filling open critical care pharmacist positions, many hospitals require existing staff to fulfill multiple roles across various patient populations, leading to a variation in educational, training, and practice backgrounds for pharmacists currently practicing in the ICU. To minimize the variation associated with this resource-limited structure in a manner that standardized and elevated the type and level of service provided, we created a CCPT with existing pharmacists who were willing to accept intensive training and demonstrate an ongoing commitment to maintain defined competencies and skills. Our goal was to solidify the essential role of the critical care pharmacist in providing quality critical care services as described in the literature. The CCPT was well-received by the multidisciplinary team and served as an example for other disciplines that had similar struggles. The team’s success expanded into several other ongoing initiatives, including critical care pharmacist–driven protocols.
Acknowledgment: The authors thank Nina Roberts, MSN, RN, CCRN, NEA-BC, and Carol Ash, DO, MBA, MHCDS, the ICU Nursing and Medical Directors, respectively, at the time of this program’s initiation, for supporting the development of the critical care pharmacist team initiative and review of this manuscript.
Corresponding author: Liza Barbarello Andrews, PharmD, BCCCP, BCPS, Ernest Mario School of Pharmacy, Rutgers, The State University of New Jersey, 160 Frelinghuysen Road, Piscataway, NJ 08854; [email protected].
Financial disclosures: None.
1. Brilli RJ, Spevetz A, Branson RD, et al. American College of Critical Care Medicine Task Force on Models of Critical Care Delivery. Critical care delivery in the intensive care unit: defining clinical roles and the best practice model. Crit Care Med. 2001;29:2007-2019.
2. Rudis MI, Brandl KM; Society of Critical Care Medicine and American College of Clinical Pharmacy Task Force on Critical Care Pharmacy Services. Position paper on critical care pharmacy services. Crit Care Med. 2000;28:3746-3750.
3. MacLaren R, Devlin JW, Martin SJ, et al. Critical care pharmacy services in United States hospitals. Ann Pharmacother. 2006;40:612-618.
4. Bond CA, Raehl CL. Clinical pharmacy services, pharmacy staffing, and hospital mortality rates. Pharmacotherapy. 2007;27:481-493.
5. Forni A, Skahan N, Hartman CA, et al. Evaluation of the impact of a tele-ICU pharmacist on the management of sedation in critically ill mechanically ventilated patients. Ann Pharmacother. 2010;44:432-438.
6. Haupt MT, Bekes CE, Brilli RJ, et al. Guidelines on critical care services and personnel: recommendations based on a system of categorization on three levels of care. Crit Care Med. 2003;31:2677-2683.
7. Board of Pharmacy Specialties. Critical Care Pharmacy. www.bpsweb.org/bps-specialties/critical-care-pharmacy/.
8. Montazeri M, Cook DJ. Impact of a clinical pharmacist in a multidisciplinary intensive care unit. Crit Care Med. 1994;22:1044-1048.
9. Leape L, Cullen D, Clapp M, et al. Pharmacist participation on physician rounds and adverse drug events in the intensive care unit. JAMA. 1999;282:267-270.
10. Horn E, Jacobi J. The critical care pharmacist: evolution of an essential team member. Crit Care Med. 2006;34(suppl):S46-S51.
11. Jacobi J. Measuring the impact of a pharmacist in the intensive care unit—are all pharmacists created equal? J Crit Care. 2015;30:1127-1128.
12. American Society of HealthSystem Pharmacists. Online residency directory. https://accred.ashp.org/aps/pages/directory/residencyProgramSearch.aspx. Accessed June 26, 2019.
13. Weled BJ, Adzhigirey LA, Hodgman TM, et al. Critical care delivery: the importance of process of care and ICU structure to improved outcomes: an update from the American College of Critical Care Medicine Task Force on Models of Critical Care. Crit Care Med. 2015;43:1520-1525.
14. Andrews LB, Roberts N, Ash C, et al. The LOTUS: a journey to value-based, patient-centered care. Creat Nurs. 2019;25:17-24.
Infective endocarditis: Beyond the usual tests
Prompt diagnois of infective endocarditis is critical. Potential consequences of missed or delayed diagnosis, including heart failure, stroke, intracardiac abscess, conduction delays, prosthesis dysfunction, and cerebral emboli, are often catastrophic. Echocardiography is the test used most frequently to evaluate for infective endocarditis, but it misses the diagnosis in almost one-third of cases, and even more often if the patient has a prosthetic valve.

But now, several sophisticated imaging tests are available that complement echocardiography in diagnosing and assessing infective endocarditis; these include 4-dimensional computed tomography (4D CT), fluorodeoxyglucose positron emission tomography (FDG-PET), and leukocyte scintigraphy. These tests have greatly improved our ability not only to diagnose infective endocarditis, but also to determine the extent and spread of infection, and they aid in perioperative assessment. Abnormal findings on these tests have been incorporated into the European Society of Cardiology’s 2015 modified diagnostic criteria for infective endocarditis.1
This article details the indications, advantages, and limitations of the various imaging tests for diagnosing and evaluating infective endocarditis (Table 1).
INFECTIVE ENDOCARDITIS IS DIFFICULT TO DIAGNOSE AND TREAT
Infective endocarditis is difficult to diagnose and treat. Clinical and imaging clues can be subtle, and the diagnosis requires a high level of suspicion and visualization of cardiac structures.
Further, the incidence of infective endocarditis is on the rise in the United States, particularly in women and young adults, likely due to intravenous drug use.2,3
ECHOCARDIOGRAPHY HAS AN IMPORTANT ROLE, BUT IS LIMITED
Echocardiography remains the most commonly performed study for diagnosing infective endocarditis, as it is fast, widely accessible, and less expensive than other imaging tests.
Transthoracic echocardiography (TTE) is often the first choice for testing. However, its sensitivity is only about 70% for detecting vegetations on native valves and 50% for detecting vegetations on prosthetic valves.1 It is inherently constrained by the limited number of views by which a comprehensive external evaluation of the heart can be achieved. Using a 2-dimensional instrument to view a 3-dimensional object is difficult, and depending on several factors, it can be hard to see vegetations and abscesses that are associated with infective endocarditis. Further, TTE is impeded by obesity and by hyperinflated lungs from obstructive pulmonary disease or mechanical ventilation. It has poor sensitivity for detecting small vegetations and for detecting vegetations and paravalvular complications in patients who have a prosthetic valve or a cardiac implanted electronic device.
Transesophageal echocardiography (TEE) is the recommended first-line imaging test for patients with prosthetic valves and no contraindications to the test. Otherwise, it should be done after TTE if the results of TTE are negative but clinical suspicion for infective endocarditis remains high (eg, because the patient uses intravenous drugs). But although TEE has a higher sensitivity than TTE (up to 96% for vegetations on native valves and 92% for those on prosthetic valves, if performed by an experienced sonographer), it can still miss infective endocarditis. Also, TEE does not provide a significant advantage over TTE in patients who have a cardiac implanted electronic device.1,4,5
Regardless of whether TTE or TEE is used, they are estimated to miss up to 30% of cases of infective endocarditis and its sequelae.4 False-negative findings are likelier in patients who have preexisting severe valvular lesions, prosthetic valves, cardiac implanted electronic devices, small vegetations, or abscesses, or if a vegetation has already broken free and embolized. Furthermore, distinguishing between vegetations and thrombi, cardiac tumors, and myxomatous changes using echocardiography is difficult.
CARDIAC CT
For patients who have inconclusive results on echocardiography, contraindications to TEE, or poor sonic windows, cardiac CT can be an excellent alternative. It is especially useful in the setting of a prosthetic valve.
Synchronized (“gated”) with the patient’s heart rate and rhythm, CT machines can acquire images during diastole, reducing motion artifact, and can create 3D images of the heart. In addition, newer machines can acquire several images at different points in the heart cycle to add a fourth dimension—time. The resulting 4D images play like short video loops of the beating heart and allow noninvasive assessment of cardiac anatomy with remarkable detail and resolution.
4D CT is increasingly being used in infective endocarditis, and growing evidence indicates that its accuracy is similar to that of TEE in the preoperative evaluation of patients with aortic prosthetic valve endocarditis.6 In a study of 28 patients, complementary use of CT angiography led to a change in treatment strategy in 7 (25%) compared with routine clinical workup.7 Several studies have found no difference between 4D CT and preoperative TEE in detecting pseudoaneurysm, abscess, or valve dehiscence. TEE and 4D CT also have similar sensitivities for detecting infective endocarditis in native and prosthetic valves.8,9

 angiography with iodinated contrast, including 4D reconstruc-tion, in the same patient, however, shows an 11-mm vegetation on the bioprosthetic aortic valve leaflets (arrow).")
 in the same patient confirms the diagnosis, showing a 13-mm hypermetabolic focus on the prosthetic valve (arrow), yielding the diagnosis of infectious endocarditis.")
Coupled with CT angiography, 4D CT is also an excellent noninvasive way to perioperatively evaluate the coronary arteries without the risks associated with catheterization in those requiring nonemergency surgery (Figure 1A, B, and C).
4D CT performs well for detecting abscess and pseudoaneurysm but has slightly lower sensitivity for vegetations than TEE (91% vs 99%).9
Gated CT, PET, or both may be useful in cases of suspected prosthetic aortic valve endocarditis when TEE is negative. Pseudoaneurysms are not well visualized with TEE, and the atrial mitral curtain area is often thickened on TEE in cases of aortic prosthetic valve infective endocarditis that do not definitely involve abscesses. Gated CT and PET show this area better.8 This information is important in cases in which a surgeon may be unconvinced that the patient has prosthetic valve endocarditis.
Limitations of 4D cardiac CT
4D CT with or without angiography has limitations. It requires a wide-volume scanner and an experienced reader.
Patients with irregular heart rhythms or uncontrolled tachycardia pose technical problems for image acquisition. Cardiac CT is typically gated (ie, images are obtained within a defined time period) to acquire images during diastole. Ideally, images are acquired when the heart is in mid to late diastole, a time of minimal cardiac motion, so that motion artifact is minimized. To estimate the timing of image acquisition, the cardiac cycle must be predictable, and its duration should be as long as possible. Tachycardia or irregular rhythms such as frequent ectopic beats or atrial fibrillation make acquisition timing difficult, and thus make it nearly impossible to accurately obtain images when the heart is at minimum motion, limiting assessment of cardiac structures or the coronary tree.4,10
Extensive coronary calcification can hinder assessment of the coronary tree by CT coronary angiography.
Contrast exposure may limit the use of CT in some patients (eg, those with contrast allergies or renal dysfunction). However, modern scanners allow for much smaller contrast boluses without decreasing sensitivity.
4D CT involves radiation exposure, especially when done with angiography, although modern scanners have greatly reduced exposure. The average radiation dose in CT coronary angiography is 2.9 to 5.9 mSv11 compared with 7 mSv in diagnostic cardiac catheterization (without angioplasty or stenting) or 16 mSv in routine CT of the abdomen and pelvis with contrast.12,13 In view of the morbidity and mortality risks associated with infective endocarditis, especially if the diagnosis is delayed, this small radiation exposure may be justifiable.
Bottom line for cardiac CT
4D CT is an excellent alternative to echocardiography for select patients. Clinicians should strongly consider this study in the following situations:
- Patients with a prosthetic valve
- Patients who are strongly suspected of having infective endocarditis but who have a poor sonic window on TTE or TEE, as can occur with chronic obstructive lung disease, morbid obesity, or previous thoracic or cardiovascular surgery
- Patients who meet clinical indications for TEE, such as having a prosthetic valve or a high suspicion for native valve infective endocarditis with negative TTE, but who have contraindications to TEE
- As an alternative to TEE for preoperative evaluation in patients with known infective endocarditis.
Patients with tachycardia or irregular heart rhythms are not good candidates for this test.
FDG-PET AND LEUKOCYTE SCINTIGRAPHY
FDG-PET and leukocyte scintigraphy are other options for diagnosing infective endocarditis and determining the presence and extent of intra- and extracardiac infection. They are more sensitive than echocardiography for detecting infection of cardiac implanted electronic devices such as ventricular assist devices, pacemakers, implanted cardiac defibrillators, and cardiac resynchronization therapy devices.14–16
The utility of FDG-PET is founded on the uptake of 18F-fluorodeoxyglucose by cells, with higher uptake taking place in cells with higher metabolic activity (such as in areas of inflammation). Similarly, leukocyte scintigraphy relies on the use of radiolabeled leukocytes (ie, leukocytes previously extracted from the patient, labelled, and re-introduced into the patient) to allow for localization of inflamed tissue.
The most significant contribution of FDG-PET may be the ability to detect infective endocarditis early, when echocardiography is initially negative. When abnormal FDG uptake was included in the modified Duke criteria, it increased the sensitivity to 97% for detecting infective endocarditis on admission, leading some to propose its incorporation as a major criterion.17 In patients with prosthetic valves and suspected infective endocarditis, FDG-PET was found in one study to have a sensitivity of up to 91% and a specificity of up to 95%.18
Both FDG-PET and leukocyte scintigraphy have a high sensitivity, specificity, and negative predictive value for cardiac implanted electronic device infection, and should be strongly considered in patients in whom it is suspected but who have negative or inconclusive findings on echocardiography.14,15
In addition, a common conundrum faced by clinicians with use of echocardiography is the difficulty of differentiating thrombus from infected vegetation on valves or device lead wires. Some evidence indicates that FDG-PET may help to discriminate between vegetation and thrombus, although more rigorous studies are needed before its use for that purpose can be recommended.19
Limitations of nuclear studies
Both FDG-PET and leukocyte scintigraphy perform poorly for detecting native-valve infective endocarditis. In a study in which 90% of the patients had native-valve infective endocarditis according to the Duke criteria, FDG-PET had a specificity of 93% but a sensitivity of only 39%.20
Both studies can be cumbersome, laborious, and time-consuming for patients. FDG-PET requires a fasting or glucose-restricted diet before testing, and the test itself can be complicated by development of hyperglycemia, although this is rare.
While FDG-PET is most effective in detecting infections of prosthetic valves and cardiac implanted electronic devices, the results can be falsely positive in patients with a history of recent cardiac surgery (due to ongoing tissue healing), as well as maladies other than infective endocarditis that lead to inflammation, such as vasculitis or malignancy. Similarly, for unclear reasons, leukocyte scintigraphy can yield false-negative results in patients with enterococcal or candidal infective endocarditis.21
FDG-PET and leukocyte scintigraphy are more expensive than TEE and cardiac CT22 and are not widely available.
Both tests entail radiation exposure, with the average dose ranging from 7 to 14 mSv. However, this is less than the average amount acquired during percutaneous coronary intervention (16 mSv), and overlaps with the amount in chest CT with contrast when assessing for pulmonary embolism (7 to 9 mSv). Lower doses are possible with optimized protocols.12,13,15,23
Bottom line for nuclear studies

FDG-PET and leukocyte scintigraphy are especially useful for patients with a prosthetic valve or cardiac implanted electronic device. However, limitations must be kept in mind.
A suggested algorithm for testing with nuclear imaging is shown in Figure 2.1,4
CEREBRAL MAGNETIC RESONANCE IMAGING
Cerebral magnetic resonance imaging (MRI) is more sensitive than cerebral CT for detecting emboli in the brain. According to American Heart Association guidelines, cerebral MRI should be done in patients with known or suspected infective endocarditis and neurologic impairment, defined as headaches, meningeal symptoms, or neurologic deficits. It is also often used in neurologically asymptomatic patients with infective endocarditis who have indications for valve surgery to assess for mycotic aneurysms, which are associated with increased intracranial bleeding during surgery.
MRI use in other asymptomatic patients remains controversial.24 In cases with high clinical suspicion for infective endocarditis and no findings on echocardiography, cerebral MRI can increase the sensitivity of the Duke criteria by adding a minor criterion. Some have argued that, in patients with definite infective endocarditis, detecting silent cerebral complications can lead to management changes. However, more studies are needed to determine if there is indeed a group of neurologically asymptomatic infective endocarditis patients for whom cerebral MRI leads to improved outcomes.
Limitations of cerebral MRI
Cerebral MRI cannot be used in patients with non-MRI-compatible implanted hardware.
Gadolinium, the contrast agent typically used, can cause nephrogenic systemic fibrosis in patients who have poor renal function. This rare but serious adverse effect is characterized by irreversible systemic fibrosis affecting skin, muscles, and even visceral tissue such as lungs. The American College of Radiology allows for gadolinium use in patients without acute kidney injury and patients with stable chronic kidney disease with a glomerular filtration rate of at least 30 mL/min/1.73 m2. Its use should be avoided in patients with renal failure on replacement therapy, with advanced chronic kidney disease (glomerular filtration rate < 30 mL/min/1.73 m2), or with acute kidney injury, even if they do not need renal replacement therapy.25
Concerns have also been raised about gadolinium retention in the brain, even in patients with normal renal function.26–28 Thus far, no conclusive clinical adverse effects of retention have been found, although more study is warranted. Nevertheless, the US Food and Drug Administration now requires a black-box warning about this possibility and advises clinicians to counsel patients appropriately.
Bottom line on cerebral MRI
Cerebral MRI should be obtained when a patient presents with definite or possible infective endocarditis with neurologic impairment, such as new headaches, meningismus, or focal neurologic deficits. Routine brain MRI in patients with confirmed infective endocarditis without neurologic symptoms, or those without definite infective endocarditis, is discouraged.
CARDIAC MRI
Cardiac MRI, typically obtained with gadolinium contrast, allows for better 3D assessment of cardiac structures and morphology than echocardiography or CT, and can detect infiltrative cardiac disease, myopericarditis, and much more. It is increasingly used in the field of structural cardiology, but its role for evaluating infective endocarditis remains unclear.
Cardiac MRI does not appear to be better than echocardiography for diagnosing infective endocarditis. However, it may prove helpful in the evaluation of patients known to have infective endocarditis but who cannot be properly evaluated for disease extent because of poor image quality on echocardiography and contraindications to CT.1,29 Its role is limited in patients with cardiac implanted electronic devices, as most devices are incompatible with MRI use, although newer devices obviate this concern. But even for devices that are MRI-compatible, results are diminished due to an eclipsing effect, wherein the device parts can make it hard to see structures clearly because the “brightness” basically eclipses the surrounding area.4
Concerns regarding use of gadolinium as described above need also be considered.
The role of cardiac MRI in diagnosing and managing infective endocarditis may evolve, but at present, the 2017 American College of Cardiology and American Heart Association appropriate-use criteria discourage its use for these purposes.16
Bottom line for cardiac MRI
Cardiac MRI to evaluate a patient for suspected infective endocarditis is not recommended due to lack of superiority compared with echocardiography or CT, and the risk of nephrogenic systemic fibrosis from gadolinium in patients with renal compromise.
- Habib G, Lancellotti P, Antunes MJ, et al; ESC Scientific Document Group. 2015 ESC guidelines for the management of infective endocarditis: the Task Force for the Management of Infective Endocarditis of the European Society of Cardiology (ESC). Endorsed by: European Association for Cardio-Thoracic Surgery (EACTS), the European Association of Nuclear Medicine (EANM). Eur Heart J 2015; 36(44):3075–3128. doi:10.1093/eurheartj/ehv319
- Durante-Mangoni E, Bradley S, Selton-Suty C, et al; International Collaboration on Endocarditis Prospective Cohort Study Group. Current features of infective endocarditis in elderly patients: results of the International Collaboration on Endocarditis Prospective Cohort Study. Arch Intern Med 2008; 168(19):2095–2103. doi:10.1001/archinte.168.19.2095
- Wurcel AG, Anderson JE, Chui KK, et al. Increasing infectious endocarditis admissions among young people who inject drugs. Open Forum Infect Dis 2016; 3(3):ofw157. doi:10.1093/ofid/ofw157
- Gomes A, Glaudemans AW, Touw DJ, et al. Diagnostic value of imaging in infective endocarditis: a systematic review. Lancet Infect Dis 2017; 17(1):e1–e14. doi:10.1016/S1473-3099(16)30141-4
- Cahill TJ, Baddour LM, Habib G, et al. Challenges in infective endocarditis. J Am Coll Cardiol 2017; 69(3):325–344. doi:10.1016/j.jacc.2016.10.066
- Fagman E, Perrotta S, Bech-Hanssen O, et al. ECG-gated computed tomography: a new role for patients with suspected aortic prosthetic valve endocarditis. Eur Radiol 2012; 22(11):2407–2414. doi:10.1007/s00330-012-2491-5
- Habets J, Tanis W, van Herwerden LA, et al. Cardiac computed tomography angiography results in diagnostic and therapeutic change in prosthetic heart valve endocarditis. Int J Cardiovasc Imaging 2014; 30(2):377–387. doi:10.1007/s10554-013-0335-2
- Koneru S, Huang SS, Oldan J, et al. Role of preoperative cardiac CT in the evaluation of infective endocarditis: comparison with transesophageal echocardiography and surgical findings. Cardiovasc Diagn Ther 2018; 8(4):439–449. doi:10.21037/cdt.2018.07.07
- Koo HJ, Yang DH, Kang J, et al. Demonstration of infective endocarditis by cardiac CT and transoesophageal echocardiography: comparison with intra-operative findings. Eur Heart J Cardiovasc Imaging 2018; 19(2):199–207. doi:10.1093/ehjci/jex010
- Feuchtner GM, Stolzmann P, Dichtl W, et al. Multislice computed tomography in infective endocarditis: comparison with transesophageal echocardiography and intraoperative findings. J Am Coll Cardiol 2009; 53(5):436–444. doi:10.1016/j.jacc.2008.01.077
- Castellano IA, Nicol ED, Bull RK, Roobottom CA, Williams MC, Harden SP. A prospective national survey of coronary CT angiography radiation doses in the United Kingdom. J Cardiovasc Comput Tomogr 2017; 11(4):268–273. doi:10.1016/j.jcct.2017.05.002
- Mettler FA Jr, Huda W, Yoshizumi TT, Mahesh M. Effective doses in radiology and diagnostic nuclear medicine: a catalog. Radiology 2008; 248(1):254–263. doi:10.1148/radiol.2481071451
- Smith-Bindman R, Lipson J, Marcus R, et al. Radiation dose associated with common computed tomography examinations and the associated lifetime attributable risk of cancer. Arch Intern Med 2009; 169(22):2078–2086. doi:10.1001/archinternmed.2009.427
- Ploux S, Riviere A, Amraoui S, et al. Positron emission tomography in patients with suspected pacing system infections may play a critical role in difficult cases. Heart Rhythm 2011; 8(9):1478–1481. doi:10.1016/j.hrthm.2011.03.062
- Sarrazin J, Philippon F, Tessier M, et al. Usefulness of fluorine-18 positron emission tomography/computed tomography for identification of cardiovascular implantable electronic device infections. J Am Coll Cardiol 2012; 59(18):1616–1625. doi:10.1016/j.jacc.2011.11.059
- Doherty JU, Kort S, Mehran R, Schoenhagen P, Soman P; Rating Panel Members; Appropriate Use Criteria Task Force. ACC/AATS/AHA/ASE/ASNC/HRS/SCAI/SCCT/SCMR/STS 2017 Appropriate use criteria for multimodality imaging in valvular heart disease: a report of the American College of Cardiology Appropriate Use Criteria Task Force, American Association for Thoracic Surgery, American Heart Association, American Society of Echocardiography, American Society of Nuclear Cardiology, Heart Rhythm Society, Society for Cardiovascular Angiography and Interventions, Society of Cardiovascular Computed Tomography, Society for Cardiovascular Magnetic Resonance, and Society of Thoracic Surgeons. J Nucl Cardiol 2017; 24(6):2043–2063. doi:10.1007/s12350-017-1070-1
- Saby L, Laas O, Habib G, et al. Positron emission tomography/computed tomography for diagnosis of prosthetic valve endocarditis: increased valvular 18F-fluorodeoxyglucose uptake as a novel major criterion. J Am Coll Cardiol 2013; 61(23):2374–2382. doi:10.1016/j.jacc.2013.01.092
- Swart LE, Gomes A, Scholtens AM, et al. Improving the diagnostic performance of 18F-fluorodeoxyglucose positron-emission tomography/computed tomography in prosthetic heart valve endocarditis. Circulation 2018; 138(14):1412–1427. doi:10.1161/CIRCULATIONAHA.118.035032
- Graziosi M, Nanni C, Lorenzini M, et al. Role of 18F-FDG PET/CT in the diagnosis of infective endocarditis in patients with an implanted cardiac device: a prospective study. Eur J Nucl Med Mol Imaging 2014; 41(8):1617–1623. doi:10.1007/s00259-014-2773-z
- Kouijzer IJ, Vos FJ, Janssen MJ, van Dijk AP, Oyen WJ, Bleeker-Rovers CP. The value of 18F-FDG PET/CT in diagnosing infectious endocarditis. Eur J Nucl Med Mol Imaging 2013; 40(7):1102–1107. doi:10.1007/s00259-013-2376-0
- Wong D, Rubinshtein R, Keynan Y. Alternative cardiac imaging modalities to echocardiography for the diagnosis of infective endocarditis. Am J Cardiol 2016; 118(9):1410–1418. doi:10.1016/j.amjcard.2016.07.053
- Vos FJ, Bleeker-Rovers CP, Kullberg BJ, Adang EM, Oyen WJ. Cost-effectiveness of routine (18)F-FDG PET/CT in high-risk patients with gram-positive bacteremia. J Nucl Med 2011; 52(11):1673–1678. doi:10.2967/jnumed.111.089714
- McCollough CH, Bushberg JT, Fletcher JG, Eckel LJ. Answers to common questions about the use and safety of CT scans. Mayo Clin Proc 2015; 90(10):1380–1392. doi:10.1016/j.mayocp.2015.07.011
- Duval X, Iung B, Klein I, et al; IMAGE (Resonance Magnetic Imaging at the Acute Phase of Endocarditis) Study Group. Effect of early cerebral magnetic resonance imaging on clinical decisions in infective endocarditis: a prospective study. Ann Intern Med 2010; 152(8):497–504, W175. doi:10.7326/0003-4819-152-8-201004200-00006
- ACR Committee on Drugs and Contrast Media. ACR Manual on Contrast Media: 2018. www.acr.org/-/media/ACR/Files/Clinical-Resources/Contrast_Media.pdf. Accessed July 19, 2019.
- Kanda T, Fukusato T, Matsuda M, et al. Gadolinium-based contrast agent accumulates in the brain even in subjects without severe renal dysfunction: evaluation of autopsy brain specimens with inductively coupled plasma mass spectroscopy. Radiology 2015; 276(1):228–232. doi:10.1148/radiol.2015142690
- McDonald RJ, McDonald JS, Kallmes DF, et al. Intracranial gadolinium deposition after contrast-enhanced MR imaging. Radiology 2015; 275(3):772–782. doi:10.1148/radiol.15150025
- Kanda T, Ishii K, Kawaguchi H, Kitajima K, Takenaka D. High signal intensity in the dentate nucleus and globus pallidus on unenhanced T1-weighted MR images: relationship with increasing cumulative dose of a gadolinium-based contrast material. Radiology 2014; 270(3):834–841. doi:10.1148/radiol.13131669
- Expert Panel on Pediatric Imaging; Hayes LL, Palasis S, Bartel TB, et al. ACR appropriateness criteria headache-child. J Am Coll Radiol 2018; 15(5S):S78–S90. doi:10.1016/j.jacr.2018.03.017
Prompt diagnois of infective endocarditis is critical. Potential consequences of missed or delayed diagnosis, including heart failure, stroke, intracardiac abscess, conduction delays, prosthesis dysfunction, and cerebral emboli, are often catastrophic. Echocardiography is the test used most frequently to evaluate for infective endocarditis, but it misses the diagnosis in almost one-third of cases, and even more often if the patient has a prosthetic valve.
But now, several sophisticated imaging tests are available that complement echocardiography in diagnosing and assessing infective endocarditis; these include 4-dimensional computed tomography (4D CT), fluorodeoxyglucose positron emission tomography (FDG-PET), and leukocyte scintigraphy. These tests have greatly improved our ability not only to diagnose infective endocarditis, but also to determine the extent and spread of infection, and they aid in perioperative assessment. Abnormal findings on these tests have been incorporated into the European Society of Cardiology’s 2015 modified diagnostic criteria for infective endocarditis.1
This article details the indications, advantages, and limitations of the various imaging tests for diagnosing and evaluating infective endocarditis (Table 1).
INFECTIVE ENDOCARDITIS IS DIFFICULT TO DIAGNOSE AND TREAT
Infective endocarditis is difficult to diagnose and treat. Clinical and imaging clues can be subtle, and the diagnosis requires a high level of suspicion and visualization of cardiac structures.
Further, the incidence of infective endocarditis is on the rise in the United States, particularly in women and young adults, likely due to intravenous drug use.2,3
ECHOCARDIOGRAPHY HAS AN IMPORTANT ROLE, BUT IS LIMITED
Echocardiography remains the most commonly performed study for diagnosing infective endocarditis, as it is fast, widely accessible, and less expensive than other imaging tests.
Transthoracic echocardiography (TTE) is often the first choice for testing. However, its sensitivity is only about 70% for detecting vegetations on native valves and 50% for detecting vegetations on prosthetic valves.1 It is inherently constrained by the limited number of views by which a comprehensive external evaluation of the heart can be achieved. Using a 2-dimensional instrument to view a 3-dimensional object is difficult, and depending on several factors, it can be hard to see vegetations and abscesses that are associated with infective endocarditis. Further, TTE is impeded by obesity and by hyperinflated lungs from obstructive pulmonary disease or mechanical ventilation. It has poor sensitivity for detecting small vegetations and for detecting vegetations and paravalvular complications in patients who have a prosthetic valve or a cardiac implanted electronic device.
Transesophageal echocardiography (TEE) is the recommended first-line imaging test for patients with prosthetic valves and no contraindications to the test. Otherwise, it should be done after TTE if the results of TTE are negative but clinical suspicion for infective endocarditis remains high (eg, because the patient uses intravenous drugs). But although TEE has a higher sensitivity than TTE (up to 96% for vegetations on native valves and 92% for those on prosthetic valves, if performed by an experienced sonographer), it can still miss infective endocarditis. Also, TEE does not provide a significant advantage over TTE in patients who have a cardiac implanted electronic device.1,4,5
Regardless of whether TTE or TEE is used, they are estimated to miss up to 30% of cases of infective endocarditis and its sequelae.4 False-negative findings are likelier in patients who have preexisting severe valvular lesions, prosthetic valves, cardiac implanted electronic devices, small vegetations, or abscesses, or if a vegetation has already broken free and embolized. Furthermore, distinguishing between vegetations and thrombi, cardiac tumors, and myxomatous changes using echocardiography is difficult.
CARDIAC CT
For patients who have inconclusive results on echocardiography, contraindications to TEE, or poor sonic windows, cardiac CT can be an excellent alternative. It is especially useful in the setting of a prosthetic valve.
Synchronized (“gated”) with the patient’s heart rate and rhythm, CT machines can acquire images during diastole, reducing motion artifact, and can create 3D images of the heart. In addition, newer machines can acquire several images at different points in the heart cycle to add a fourth dimension—time. The resulting 4D images play like short video loops of the beating heart and allow noninvasive assessment of cardiac anatomy with remarkable detail and resolution.
4D CT is increasingly being used in infective endocarditis, and growing evidence indicates that its accuracy is similar to that of TEE in the preoperative evaluation of patients with aortic prosthetic valve endocarditis.6 In a study of 28 patients, complementary use of CT angiography led to a change in treatment strategy in 7 (25%) compared with routine clinical workup.7 Several studies have found no difference between 4D CT and preoperative TEE in detecting pseudoaneurysm, abscess, or valve dehiscence. TEE and 4D CT also have similar sensitivities for detecting infective endocarditis in native and prosthetic valves.8,9
Coupled with CT angiography, 4D CT is also an excellent noninvasive way to perioperatively evaluate the coronary arteries without the risks associated with catheterization in those requiring nonemergency surgery (Figure 1A, B, and C).
4D CT performs well for detecting abscess and pseudoaneurysm but has slightly lower sensitivity for vegetations than TEE (91% vs 99%).9
Gated CT, PET, or both may be useful in cases of suspected prosthetic aortic valve endocarditis when TEE is negative. Pseudoaneurysms are not well visualized with TEE, and the atrial mitral curtain area is often thickened on TEE in cases of aortic prosthetic valve infective endocarditis that do not definitely involve abscesses. Gated CT and PET show this area better.8 This information is important in cases in which a surgeon may be unconvinced that the patient has prosthetic valve endocarditis.
Limitations of 4D cardiac CT
4D CT with or without angiography has limitations. It requires a wide-volume scanner and an experienced reader.
Patients with irregular heart rhythms or uncontrolled tachycardia pose technical problems for image acquisition. Cardiac CT is typically gated (ie, images are obtained within a defined time period) to acquire images during diastole. Ideally, images are acquired when the heart is in mid to late diastole, a time of minimal cardiac motion, so that motion artifact is minimized. To estimate the timing of image acquisition, the cardiac cycle must be predictable, and its duration should be as long as possible. Tachycardia or irregular rhythms such as frequent ectopic beats or atrial fibrillation make acquisition timing difficult, and thus make it nearly impossible to accurately obtain images when the heart is at minimum motion, limiting assessment of cardiac structures or the coronary tree.4,10
Extensive coronary calcification can hinder assessment of the coronary tree by CT coronary angiography.
Contrast exposure may limit the use of CT in some patients (eg, those with contrast allergies or renal dysfunction). However, modern scanners allow for much smaller contrast boluses without decreasing sensitivity.
4D CT involves radiation exposure, especially when done with angiography, although modern scanners have greatly reduced exposure. The average radiation dose in CT coronary angiography is 2.9 to 5.9 mSv11 compared with 7 mSv in diagnostic cardiac catheterization (without angioplasty or stenting) or 16 mSv in routine CT of the abdomen and pelvis with contrast.12,13 In view of the morbidity and mortality risks associated with infective endocarditis, especially if the diagnosis is delayed, this small radiation exposure may be justifiable.
Bottom line for cardiac CT
4D CT is an excellent alternative to echocardiography for select patients. Clinicians should strongly consider this study in the following situations:
- Patients with a prosthetic valve
- Patients who are strongly suspected of having infective endocarditis but who have a poor sonic window on TTE or TEE, as can occur with chronic obstructive lung disease, morbid obesity, or previous thoracic or cardiovascular surgery
- Patients who meet clinical indications for TEE, such as having a prosthetic valve or a high suspicion for native valve infective endocarditis with negative TTE, but who have contraindications to TEE
- As an alternative to TEE for preoperative evaluation in patients with known infective endocarditis.
Patients with tachycardia or irregular heart rhythms are not good candidates for this test.
FDG-PET AND LEUKOCYTE SCINTIGRAPHY
FDG-PET and leukocyte scintigraphy are other options for diagnosing infective endocarditis and determining the presence and extent of intra- and extracardiac infection. They are more sensitive than echocardiography for detecting infection of cardiac implanted electronic devices such as ventricular assist devices, pacemakers, implanted cardiac defibrillators, and cardiac resynchronization therapy devices.14–16
The utility of FDG-PET is founded on the uptake of 18F-fluorodeoxyglucose by cells, with higher uptake taking place in cells with higher metabolic activity (such as in areas of inflammation). Similarly, leukocyte scintigraphy relies on the use of radiolabeled leukocytes (ie, leukocytes previously extracted from the patient, labelled, and re-introduced into the patient) to allow for localization of inflamed tissue.
The most significant contribution of FDG-PET may be the ability to detect infective endocarditis early, when echocardiography is initially negative. When abnormal FDG uptake was included in the modified Duke criteria, it increased the sensitivity to 97% for detecting infective endocarditis on admission, leading some to propose its incorporation as a major criterion.17 In patients with prosthetic valves and suspected infective endocarditis, FDG-PET was found in one study to have a sensitivity of up to 91% and a specificity of up to 95%.18
Both FDG-PET and leukocyte scintigraphy have a high sensitivity, specificity, and negative predictive value for cardiac implanted electronic device infection, and should be strongly considered in patients in whom it is suspected but who have negative or inconclusive findings on echocardiography.14,15
In addition, a common conundrum faced by clinicians with use of echocardiography is the difficulty of differentiating thrombus from infected vegetation on valves or device lead wires. Some evidence indicates that FDG-PET may help to discriminate between vegetation and thrombus, although more rigorous studies are needed before its use for that purpose can be recommended.19
Limitations of nuclear studies
Both FDG-PET and leukocyte scintigraphy perform poorly for detecting native-valve infective endocarditis. In a study in which 90% of the patients had native-valve infective endocarditis according to the Duke criteria, FDG-PET had a specificity of 93% but a sensitivity of only 39%.20
Both studies can be cumbersome, laborious, and time-consuming for patients. FDG-PET requires a fasting or glucose-restricted diet before testing, and the test itself can be complicated by development of hyperglycemia, although this is rare.
While FDG-PET is most effective in detecting infections of prosthetic valves and cardiac implanted electronic devices, the results can be falsely positive in patients with a history of recent cardiac surgery (due to ongoing tissue healing), as well as maladies other than infective endocarditis that lead to inflammation, such as vasculitis or malignancy. Similarly, for unclear reasons, leukocyte scintigraphy can yield false-negative results in patients with enterococcal or candidal infective endocarditis.21
FDG-PET and leukocyte scintigraphy are more expensive than TEE and cardiac CT22 and are not widely available.
Both tests entail radiation exposure, with the average dose ranging from 7 to 14 mSv. However, this is less than the average amount acquired during percutaneous coronary intervention (16 mSv), and overlaps with the amount in chest CT with contrast when assessing for pulmonary embolism (7 to 9 mSv). Lower doses are possible with optimized protocols.12,13,15,23
Bottom line for nuclear studies
FDG-PET and leukocyte scintigraphy are especially useful for patients with a prosthetic valve or cardiac implanted electronic device. However, limitations must be kept in mind.
A suggested algorithm for testing with nuclear imaging is shown in Figure 2.1,4
CEREBRAL MAGNETIC RESONANCE IMAGING
Cerebral magnetic resonance imaging (MRI) is more sensitive than cerebral CT for detecting emboli in the brain. According to American Heart Association guidelines, cerebral MRI should be done in patients with known or suspected infective endocarditis and neurologic impairment, defined as headaches, meningeal symptoms, or neurologic deficits. It is also often used in neurologically asymptomatic patients with infective endocarditis who have indications for valve surgery to assess for mycotic aneurysms, which are associated with increased intracranial bleeding during surgery.
MRI use in other asymptomatic patients remains controversial.24 In cases with high clinical suspicion for infective endocarditis and no findings on echocardiography, cerebral MRI can increase the sensitivity of the Duke criteria by adding a minor criterion. Some have argued that, in patients with definite infective endocarditis, detecting silent cerebral complications can lead to management changes. However, more studies are needed to determine if there is indeed a group of neurologically asymptomatic infective endocarditis patients for whom cerebral MRI leads to improved outcomes.
Limitations of cerebral MRI
Cerebral MRI cannot be used in patients with non-MRI-compatible implanted hardware.
Gadolinium, the contrast agent typically used, can cause nephrogenic systemic fibrosis in patients who have poor renal function. This rare but serious adverse effect is characterized by irreversible systemic fibrosis affecting skin, muscles, and even visceral tissue such as lungs. The American College of Radiology allows for gadolinium use in patients without acute kidney injury and patients with stable chronic kidney disease with a glomerular filtration rate of at least 30 mL/min/1.73 m2. Its use should be avoided in patients with renal failure on replacement therapy, with advanced chronic kidney disease (glomerular filtration rate < 30 mL/min/1.73 m2), or with acute kidney injury, even if they do not need renal replacement therapy.25
Concerns have also been raised about gadolinium retention in the brain, even in patients with normal renal function.26–28 Thus far, no conclusive clinical adverse effects of retention have been found, although more study is warranted. Nevertheless, the US Food and Drug Administration now requires a black-box warning about this possibility and advises clinicians to counsel patients appropriately.
Bottom line on cerebral MRI
Cerebral MRI should be obtained when a patient presents with definite or possible infective endocarditis with neurologic impairment, such as new headaches, meningismus, or focal neurologic deficits. Routine brain MRI in patients with confirmed infective endocarditis without neurologic symptoms, or those without definite infective endocarditis, is discouraged.
CARDIAC MRI
Cardiac MRI, typically obtained with gadolinium contrast, allows for better 3D assessment of cardiac structures and morphology than echocardiography or CT, and can detect infiltrative cardiac disease, myopericarditis, and much more. It is increasingly used in the field of structural cardiology, but its role for evaluating infective endocarditis remains unclear.
Cardiac MRI does not appear to be better than echocardiography for diagnosing infective endocarditis. However, it may prove helpful in the evaluation of patients known to have infective endocarditis but who cannot be properly evaluated for disease extent because of poor image quality on echocardiography and contraindications to CT.1,29 Its role is limited in patients with cardiac implanted electronic devices, as most devices are incompatible with MRI use, although newer devices obviate this concern. But even for devices that are MRI-compatible, results are diminished due to an eclipsing effect, wherein the device parts can make it hard to see structures clearly because the “brightness” basically eclipses the surrounding area.4
Concerns regarding use of gadolinium as described above need also be considered.
The role of cardiac MRI in diagnosing and managing infective endocarditis may evolve, but at present, the 2017 American College of Cardiology and American Heart Association appropriate-use criteria discourage its use for these purposes.16
Bottom line for cardiac MRI
Cardiac MRI to evaluate a patient for suspected infective endocarditis is not recommended due to lack of superiority compared with echocardiography or CT, and the risk of nephrogenic systemic fibrosis from gadolinium in patients with renal compromise.
- Habib G, Lancellotti P, Antunes MJ, et al; ESC Scientific Document Group. 2015 ESC guidelines for the management of infective endocarditis: the Task Force for the Management of Infective Endocarditis of the European Society of Cardiology (ESC). Endorsed by: European Association for Cardio-Thoracic Surgery (EACTS), the European Association of Nuclear Medicine (EANM). Eur Heart J 2015; 36(44):3075–3128. doi:10.1093/eurheartj/ehv319
- Durante-Mangoni E, Bradley S, Selton-Suty C, et al; International Collaboration on Endocarditis Prospective Cohort Study Group. Current features of infective endocarditis in elderly patients: results of the International Collaboration on Endocarditis Prospective Cohort Study. Arch Intern Med 2008; 168(19):2095–2103. doi:10.1001/archinte.168.19.2095
- Wurcel AG, Anderson JE, Chui KK, et al. Increasing infectious endocarditis admissions among young people who inject drugs. Open Forum Infect Dis 2016; 3(3):ofw157. doi:10.1093/ofid/ofw157
- Gomes A, Glaudemans AW, Touw DJ, et al. Diagnostic value of imaging in infective endocarditis: a systematic review. Lancet Infect Dis 2017; 17(1):e1–e14. doi:10.1016/S1473-3099(16)30141-4
- Cahill TJ, Baddour LM, Habib G, et al. Challenges in infective endocarditis. J Am Coll Cardiol 2017; 69(3):325–344. doi:10.1016/j.jacc.2016.10.066
- Fagman E, Perrotta S, Bech-Hanssen O, et al. ECG-gated computed tomography: a new role for patients with suspected aortic prosthetic valve endocarditis. Eur Radiol 2012; 22(11):2407–2414. doi:10.1007/s00330-012-2491-5
- Habets J, Tanis W, van Herwerden LA, et al. Cardiac computed tomography angiography results in diagnostic and therapeutic change in prosthetic heart valve endocarditis. Int J Cardiovasc Imaging 2014; 30(2):377–387. doi:10.1007/s10554-013-0335-2
- Koneru S, Huang SS, Oldan J, et al. Role of preoperative cardiac CT in the evaluation of infective endocarditis: comparison with transesophageal echocardiography and surgical findings. Cardiovasc Diagn Ther 2018; 8(4):439–449. doi:10.21037/cdt.2018.07.07
- Koo HJ, Yang DH, Kang J, et al. Demonstration of infective endocarditis by cardiac CT and transoesophageal echocardiography: comparison with intra-operative findings. Eur Heart J Cardiovasc Imaging 2018; 19(2):199–207. doi:10.1093/ehjci/jex010
- Feuchtner GM, Stolzmann P, Dichtl W, et al. Multislice computed tomography in infective endocarditis: comparison with transesophageal echocardiography and intraoperative findings. J Am Coll Cardiol 2009; 53(5):436–444. doi:10.1016/j.jacc.2008.01.077
- Castellano IA, Nicol ED, Bull RK, Roobottom CA, Williams MC, Harden SP. A prospective national survey of coronary CT angiography radiation doses in the United Kingdom. J Cardiovasc Comput Tomogr 2017; 11(4):268–273. doi:10.1016/j.jcct.2017.05.002
- Mettler FA Jr, Huda W, Yoshizumi TT, Mahesh M. Effective doses in radiology and diagnostic nuclear medicine: a catalog. Radiology 2008; 248(1):254–263. doi:10.1148/radiol.2481071451
- Smith-Bindman R, Lipson J, Marcus R, et al. Radiation dose associated with common computed tomography examinations and the associated lifetime attributable risk of cancer. Arch Intern Med 2009; 169(22):2078–2086. doi:10.1001/archinternmed.2009.427
- Ploux S, Riviere A, Amraoui S, et al. Positron emission tomography in patients with suspected pacing system infections may play a critical role in difficult cases. Heart Rhythm 2011; 8(9):1478–1481. doi:10.1016/j.hrthm.2011.03.062
- Sarrazin J, Philippon F, Tessier M, et al. Usefulness of fluorine-18 positron emission tomography/computed tomography for identification of cardiovascular implantable electronic device infections. J Am Coll Cardiol 2012; 59(18):1616–1625. doi:10.1016/j.jacc.2011.11.059
- Doherty JU, Kort S, Mehran R, Schoenhagen P, Soman P; Rating Panel Members; Appropriate Use Criteria Task Force. ACC/AATS/AHA/ASE/ASNC/HRS/SCAI/SCCT/SCMR/STS 2017 Appropriate use criteria for multimodality imaging in valvular heart disease: a report of the American College of Cardiology Appropriate Use Criteria Task Force, American Association for Thoracic Surgery, American Heart Association, American Society of Echocardiography, American Society of Nuclear Cardiology, Heart Rhythm Society, Society for Cardiovascular Angiography and Interventions, Society of Cardiovascular Computed Tomography, Society for Cardiovascular Magnetic Resonance, and Society of Thoracic Surgeons. J Nucl Cardiol 2017; 24(6):2043–2063. doi:10.1007/s12350-017-1070-1
- Saby L, Laas O, Habib G, et al. Positron emission tomography/computed tomography for diagnosis of prosthetic valve endocarditis: increased valvular 18F-fluorodeoxyglucose uptake as a novel major criterion. J Am Coll Cardiol 2013; 61(23):2374–2382. doi:10.1016/j.jacc.2013.01.092
- Swart LE, Gomes A, Scholtens AM, et al. Improving the diagnostic performance of 18F-fluorodeoxyglucose positron-emission tomography/computed tomography in prosthetic heart valve endocarditis. Circulation 2018; 138(14):1412–1427. doi:10.1161/CIRCULATIONAHA.118.035032
- Graziosi M, Nanni C, Lorenzini M, et al. Role of 18F-FDG PET/CT in the diagnosis of infective endocarditis in patients with an implanted cardiac device: a prospective study. Eur J Nucl Med Mol Imaging 2014; 41(8):1617–1623. doi:10.1007/s00259-014-2773-z
- Kouijzer IJ, Vos FJ, Janssen MJ, van Dijk AP, Oyen WJ, Bleeker-Rovers CP. The value of 18F-FDG PET/CT in diagnosing infectious endocarditis. Eur J Nucl Med Mol Imaging 2013; 40(7):1102–1107. doi:10.1007/s00259-013-2376-0
- Wong D, Rubinshtein R, Keynan Y. Alternative cardiac imaging modalities to echocardiography for the diagnosis of infective endocarditis. Am J Cardiol 2016; 118(9):1410–1418. doi:10.1016/j.amjcard.2016.07.053
- Vos FJ, Bleeker-Rovers CP, Kullberg BJ, Adang EM, Oyen WJ. Cost-effectiveness of routine (18)F-FDG PET/CT in high-risk patients with gram-positive bacteremia. J Nucl Med 2011; 52(11):1673–1678. doi:10.2967/jnumed.111.089714
- McCollough CH, Bushberg JT, Fletcher JG, Eckel LJ. Answers to common questions about the use and safety of CT scans. Mayo Clin Proc 2015; 90(10):1380–1392. doi:10.1016/j.mayocp.2015.07.011
- Duval X, Iung B, Klein I, et al; IMAGE (Resonance Magnetic Imaging at the Acute Phase of Endocarditis) Study Group. Effect of early cerebral magnetic resonance imaging on clinical decisions in infective endocarditis: a prospective study. Ann Intern Med 2010; 152(8):497–504, W175. doi:10.7326/0003-4819-152-8-201004200-00006
- ACR Committee on Drugs and Contrast Media. ACR Manual on Contrast Media: 2018. www.acr.org/-/media/ACR/Files/Clinical-Resources/Contrast_Media.pdf. Accessed July 19, 2019.
- Kanda T, Fukusato T, Matsuda M, et al. Gadolinium-based contrast agent accumulates in the brain even in subjects without severe renal dysfunction: evaluation of autopsy brain specimens with inductively coupled plasma mass spectroscopy. Radiology 2015; 276(1):228–232. doi:10.1148/radiol.2015142690
- McDonald RJ, McDonald JS, Kallmes DF, et al. Intracranial gadolinium deposition after contrast-enhanced MR imaging. Radiology 2015; 275(3):772–782. doi:10.1148/radiol.15150025
- Kanda T, Ishii K, Kawaguchi H, Kitajima K, Takenaka D. High signal intensity in the dentate nucleus and globus pallidus on unenhanced T1-weighted MR images: relationship with increasing cumulative dose of a gadolinium-based contrast material. Radiology 2014; 270(3):834–841. doi:10.1148/radiol.13131669
- Expert Panel on Pediatric Imaging; Hayes LL, Palasis S, Bartel TB, et al. ACR appropriateness criteria headache-child. J Am Coll Radiol 2018; 15(5S):S78–S90. doi:10.1016/j.jacr.2018.03.017
KEY POINTS
- Echocardiography can produce false-negative results in native-valve infective endocarditis and is even less sensitive in patients with a prosthetic valve or cardiac implanted electronic device.
- 4D CT is a reasonable alternative to transesophageal echocardiography. It can also be used as a second test if echocardiography is inconclusive. Coupled with angiography, it also provides a noninvasive method to evaluate coronary arteries perioperatively.
- Nuclear imaging tests—FDG-PET and leukocyte scintigraphy—increase the sensitivity of the Duke criteria for diagnosing infective endocarditis. They should be considered for evaluating suspected infective endocarditis in all patients who have a prosthetic valve or cardiac implanted electronic device, and whenever echocardiography is inconclusive and clinical suspicion remains high.