User login
Things We Do for No Reason™: Discontinuing Buprenorphine When Treating Acute Pain

Inspired by the ABIM Foundation’s Choosing Wisely® campaign, the “Things We Do for No Reason™” (TWDFNR™) series reviews practices that have become common parts of hospital care but may provide little value to our patients. Practices reviewed in the TWDFNR™ series do not represent “black and white” conclusions or clinical practice standards but are meant as a starting place for research and active discussions among hospitalists and patients. We invite you to be part of that discussion.
CLINICAL SCENARIO
A 40-year-old woman with a history of opioid use disorder (OUD) on buprenorphine-naloxone treatment is admitted to medicine following incision and drainage of a large forearm abscess with surrounding cellulitis. The patient reports severe pain following the procedure, which is not relieved by ibuprofen. The admitting hospitalist orders a pain regimen for the patient, which includes oral and intravenous hydromorphone and discontinues the patient’s buprenorphine-naloxone so that the short-acting opioids can take effect.
BACKGROUND
Medications to treat OUD include methadone, buprenorphine, and extended-release naltrexone. Buprenorphine is a Schedule III medication under the United States Food and Drug Administration that reduces opioid cravings, subsequently decreasing drug use1 and opioid-related overdose deaths.2 It has a favorable safety profile and can be prescribed for OUD in an office-based, outpatient setting since the Drug Addiction Treatment Act of 2000 (DATA 2000). Due to extensive first-pass metabolism, buprenorphine for OUD is typically administered sublingually, either alone or in a fixed combination with naloxone.
WHY YOU MIGHT THINK YOU SHOULD HOLD BUPRENORPHINE WHEN TREATING ACUTE PAIN
Buprenorphine is a partial opioid agonist with a long half-life and high affinity for the mu opioid receptor. Given these properties, prior recommendations assumed that buprenorphine blocked the effectiveness of additional opioid agonists.3,4 In 2004, guidelines by the Department of Health and Human Service Center for Substance Abuse Treatment recommended discontinuing buprenorphine in patients taking opioid pain medications.5 These suggestions were based on limited case reports describing difficulty controlling pain in patients with OUD with a high opioid tolerance who were receiving buprenorphine.6
Providers may hold buprenorphine when treating acute pain out of concern it could precipitate withdrawal by displacing full opioid agonists from the mu receptor. Providers may also believe that the naloxone component in the most commonly prescribed formulation, buprenorphine-naloxone, blocks the effects of opioid analgesics. Evolving understanding of buprenorphine pharmacology and the absence of high-quality evidence has resulted in providers holding buprenorphine in the setting of acute pain.
Finally, providers without dedicated training may feel they lack the necessary qualifications to prescribe buprenorphine in the inpatient setting. DATA 2000 requires mandatory X waiver training for physicians, nurse practitioners, and physician assistants to prescribe outpatient buprenorphine for OUD treatment outside of specialized opioid treatment programs.
WHY DISCONTINUING BUPRENORPHINE WHEN TREATING ACUTE PAIN IS NOT NECESSARY
Despite buprenorphine’s high affinity at the mu receptor, additional receptors remain available for full opioid agonists to bind and activate,6 providing effective pain relief even in patients using buprenorphine. In contrast to the 2004 Department of Health and Human Service guidelines, subsequent clinical studies have demonstrated that concurrent use of opioid analgesics is effective for patients maintained on buprenorphine, similar to patients on other forms of OUD treatment such as methadone.7,8
Precipitated withdrawal only occurs when buprenorphine is newly introduced to patients with already circulating opioids. Patients receiving buprenorphine-naloxone can also be exposed to opioids without precipitated withdrawal from the naloxone component, as naloxone is not absorbed via sublingual or buccal administration, but only present in the formulation to dissuade intravenous administration of the medication.
Even in the perioperative period, there is insufficient evidence to support the discontinuation of buprenorphine.9 Studies in this patient population have found that patients receiving buprenorphine may require higher doses of short-acting opioids to achieve adequate analgesia, but they experience similar pain control, lengths of stay, and functional outcomes to controls.10 Despite variable perioperative management of buprenorphine,11 protocols at major medical centers now recommend continuing or dose adjusting buprenorphine in the perioperative period rather than discontinuing.12-14
Patients physically dependent on opioid agonists, including buprenorphine, must be maintained on a daily equivalent opioid dose to avoid experiencing withdrawal. This maintenance requirement must be met before any analgesic effect for acute pain is obtained with additional opioids. Temporarily discontinuing buprenorphine introduces unnecessary complexity to a hospitalization, places the patient at risk of exacerbation of pain, opioid withdrawal, and predisposes the patient to return to use and overdose if not resumed before hospital discharge.5
Finally, clinicians do not require additional training or an X waiver to administer buprenorphine to hospitalized patients. These requirements are limited to providers managing buprenorphine in the outpatient setting or those prescribing buprenorphine to patients to take postdischarge. Hospitalists frequently prescribe opioid medications in the inpatient setting with similar or greater safety risk profiles to buprenorphine.
WHEN YOU SHOULD CONSIDER HOLDING BUPRENORPHINE
Providers may consider holding buprenorphine if a patient with OUD has not been taking buprenorphine before hospitalization and has severe acute pain needs. This history can be confirmed with the patient and the state’s online prescription drug monitoring program. If further clarification is needed, this can be accomplished with a pharmacist and urine testing or by verifying with the patient’s opioid treatment program, as some programs provide directly administered buprenorphine.
In cases where a patient may have stopped buprenorphine before admission but wants to restart it in the hospital, it is essential to ascertain when the patient last used an opioid. The buprenorphine reinduction should be timed to a sufficient number of hours since last opioid use and/or to when the patient shows signs of active withdrawal. The re-induction can take place before, during, or after an acute pain episode, depending on the individual circumstances.
Patient preference is extremely important in the management of both pain and OUD. After shared decision-making, some patients may ultimately opt to hold buprenorphine in certain situations or switch to an alternative treatment, such as methadone, during their hospitalization. Such adjustments should be made in conjunction with the patient, primary care provider, and pain or addiction medicine specialty consultation.
WHAT YOU SHOULD DO INSTEAD
For patients on buprenorphine admitted to the hospital with anticipated or unanticipated acute pain needs, hospitalists should continue buprenorphine. Continuation of buprenorphine meets a patient’s baseline opioid requirement while still allowing the use of additional short-acting opioid agonists as needed for pain.15
As with all pain, multimodal pain management should be provided with adjunctive medications such as acetaminophen, nonsteroidal anti-inflammatory drugs, neuropathic agents, topical analgesics, and regional anesthesia.8
Acute pain can be addressed by taking advantage of buprenorphine’s analgesic effects and adding additional short-acting opioids if needed.15 Several options are available, including:
1. Continuing daily buprenorphine and prescribing short-acting opioid agonists, preferably those with high intrinsic activity at the mu receptor (such as morphine, fentanyl, or hydromorphone). Full opioid agonist doses to achieve analgesia for patients on buprenorphine will be higher than in opioid naïve patients due to tolerance.16
2 .Dividing the total daily buprenorphine dose into three or four times per day dosing, since buprenorphine provides an analgesic effect lasting six to eight hours. Short-acting opioid agonists can still be prescribed on an as-needed basis for additional pain needs.
3. Temporarily increasing the total daily buprenorphine dose and dividing into three or four times per day dosing, as above. Short-acting opioid agonists can still be prescribed on an as-needed basis for additional pain needs.
It is essential to make a clear plan with the patient for initiation and discontinuation of short-acting opioid agonists or buprenorphine changes. Patients on buprenorphine should be managed collaboratively with the primary care provider or addiction specialist to coordinate prescribing and follow-up after discharge.
RECOMMENDATIONS
- Continue outpatient buprenorphine treatment for patients admitted with acute pain.
- Use adjunctive nonopioid pain medications and nonpharmacologic modalities to address acute pain.
- Adjust buprenorphine to address acute pain by dividing the total daily amount into three or four times a day dosing, and/or up-titrate the buprenorphine dose (federal prescribing regulations recommend a maximum of 24 mg daily, but state regulations may vary).
- Add short-acting opioid agonists on an as-needed basis in conjunction with a defined plan to discontinue short-acting opioid agonists to avoid a return to use.
- Make plans collaboratively with the patient and outpatient provider, and communicate medication changes and plan at discharge.
CONCLUSION
Concerning our case, the hospitalist can continue the patient’s buprenorphine-naloxone, even with her acute pain needs. The patient has a baseline opioid requirement, fulfilled by continuing buprenorphine. Additional short-acting opioid agonists, such as hydromorphone, will provide analgesia for the patient, though the clinician should be aware that higher doses might be required. The practice of holding buprenorphine during episodes of acute pain is not supported by current evidence and may predispose to inadequate analgesia, opioid withdrawal, and risk of return to use and death.2
Do you think this is a low-value practice? Is this truly a “Thing We Do for No Reason™?” Share what you do in your practice and join in the conversation online by retweeting it on Twitter (#TWDFNR) and liking it on Facebook. We invite you to propose ideas for other “Things We Do for No Reason™” topics by emailing [email protected].
Disclosures
The authors report no conflicts of interest.
1. Mattick RP, Breen C, Kimber J, Davoli M. Buprenorphine maintenance versus placebo or methadone maintenance for opioid dependence. Cochrane Database Syst Rev. 2014;(3):CD002207. https://doi.org/10.1002/14651858.CD002207.
2. Sordo L, Barrio G, Bravo M, et al. Morality risk during and after opioid substitution treatment: systemic review and meta-analysis of cohort studies. BMJ. 2017;357:1550. https://doi.org/10.1136/bmj.j1550.
3. Johnson RE, Fudula PJ, Payne R. Buprenorphine: considerations for pain management. J Pain Symptom Manage. 2005;29(3):297-326. https://doi.org/10.1016/j.jpainsymman.2004.07.005.
4. Marcelina JS, Rubinstein A. Continuous perioperative sublingual buprenorphine. J Pain Palliat Care Pharmacother. 2016;30(4):289-293. https://doi.org/10.1080/15360288.2016.1231734.
5. Greenwald MK, Johanson CE, Moody DE, et al. Effects of buprenorphine maintenance dose on mu-opioid receptor binding potential, plasma concentration and antagonist blockade in heroin-dependent volunteers. Neuropsychopharmacology. 2003;28(11):2000-2009. https://doi.org/10.1038/sj.npp.1300251.
6. Lembke A, Ottestad E, Schmiesing C. Patients maintained on buprenorphine for opioid use disorder should continue buprenorphine through the perioperative period. Pain Med. 2019;20(3):425-428. https://doi.org/10.1093/pm/pny019.
7. Kornfeld H, Manfredi L. Effectiveness of full agonist opioids in patients stabilized on buprenorphine undergoing major surgery: A case series. Am J Ther. 2010;17(5):523-528. https://doi.org/10.1097/MJT.0b013e3181be0804.
8. Harrison TK, Kornfeld H, Aggarwal AK, Lembke A. Perioperative considerations for the patient with opioid use disorder on buprenorphine, methadone, or naltrexone maintenance therapy. Anesthesiol Clin. 2018;36(3):345-359. https://doi.org/10.1016/j.anclin.2018.04.002.
9. Goel A, Azargive S, Lamba W, et al. The perioperative patient on buprenorphine: a systematic review of perioperative management strategies and patient outcomes. Can J Anesth. 2019; 66(2):201-217. https://doi.org/10.1007/s12630-018-1255-3.
10. Hansen LE, Stone GL, Matson CA, Tybor DJ, Pevear ME, Smith EL. Total joint arthroplasty in patients taking methadone or buprenorphine/naloxone preoperatively for prior heroin addiction: a prospective matched cohort study. J Arthroplasty. 2016;31(8):1698-1701. https://doi.org/10.1016/j.arth.2016.01.032.
11. Jonan AB, Kaye AD, Urman RD. Buprenorphine formulations: clinical best practice strategies recommendations for perioperative management of patients undergoing surgical or interventional pain procedures. Pain Physician. 2018;21(1):E1-12. PubMed
12. Quaye AN, Zhang Y. Perioperative management of buprenorphine: solving the conundrum. Pain Med. 2018. https://doi.org/10.1093/pm/pny217.
13. Silva MJ, Rubinstein A. Continuous perioperative sublingual buprenorphine. J Pain Palliative Care Pharmacother. 2016;30(4):289-293. https://doi.org/10.1080/15360288.2016.1231734.
14. Kampman K, Jarvis M. ASAM National practice guidelines for the use of medications in the treatment of addiction involving opioid use. J Addict Med. 2015;9(5):358-367. https://doi.org/10.1097/ADM.0000000000000166.
15. Childers JW, Arnold RM. Treatment of pain in patients taking buprenorphine for opioid addiction. J Palliat Med. 2012;15(5):613-614. https://doi.org/10.1089/jpm.2012.9591.
16. Alford DP, Compton P, Samet JH. Acute pain management for patients receiving maintenance methadone or buprenorphine therapy. Ann Intern Med. 2006;144(2):127-134. https://doi.org/10.7326/0003-4819-144-2-200601170-00010
Inspired by the ABIM Foundation’s Choosing Wisely® campaign, the “Things We Do for No Reason™” (TWDFNR™) series reviews practices that have become common parts of hospital care but may provide little value to our patients. Practices reviewed in the TWDFNR™ series do not represent “black and white” conclusions or clinical practice standards but are meant as a starting place for research and active discussions among hospitalists and patients. We invite you to be part of that discussion.
CLINICAL SCENARIO
A 40-year-old woman with a history of opioid use disorder (OUD) on buprenorphine-naloxone treatment is admitted to medicine following incision and drainage of a large forearm abscess with surrounding cellulitis. The patient reports severe pain following the procedure, which is not relieved by ibuprofen. The admitting hospitalist orders a pain regimen for the patient, which includes oral and intravenous hydromorphone and discontinues the patient’s buprenorphine-naloxone so that the short-acting opioids can take effect.
BACKGROUND
Medications to treat OUD include methadone, buprenorphine, and extended-release naltrexone. Buprenorphine is a Schedule III medication under the United States Food and Drug Administration that reduces opioid cravings, subsequently decreasing drug use1 and opioid-related overdose deaths.2 It has a favorable safety profile and can be prescribed for OUD in an office-based, outpatient setting since the Drug Addiction Treatment Act of 2000 (DATA 2000). Due to extensive first-pass metabolism, buprenorphine for OUD is typically administered sublingually, either alone or in a fixed combination with naloxone.
WHY YOU MIGHT THINK YOU SHOULD HOLD BUPRENORPHINE WHEN TREATING ACUTE PAIN
Buprenorphine is a partial opioid agonist with a long half-life and high affinity for the mu opioid receptor. Given these properties, prior recommendations assumed that buprenorphine blocked the effectiveness of additional opioid agonists.3,4 In 2004, guidelines by the Department of Health and Human Service Center for Substance Abuse Treatment recommended discontinuing buprenorphine in patients taking opioid pain medications.5 These suggestions were based on limited case reports describing difficulty controlling pain in patients with OUD with a high opioid tolerance who were receiving buprenorphine.6
Providers may hold buprenorphine when treating acute pain out of concern it could precipitate withdrawal by displacing full opioid agonists from the mu receptor. Providers may also believe that the naloxone component in the most commonly prescribed formulation, buprenorphine-naloxone, blocks the effects of opioid analgesics. Evolving understanding of buprenorphine pharmacology and the absence of high-quality evidence has resulted in providers holding buprenorphine in the setting of acute pain.
Finally, providers without dedicated training may feel they lack the necessary qualifications to prescribe buprenorphine in the inpatient setting. DATA 2000 requires mandatory X waiver training for physicians, nurse practitioners, and physician assistants to prescribe outpatient buprenorphine for OUD treatment outside of specialized opioid treatment programs.
WHY DISCONTINUING BUPRENORPHINE WHEN TREATING ACUTE PAIN IS NOT NECESSARY
Despite buprenorphine’s high affinity at the mu receptor, additional receptors remain available for full opioid agonists to bind and activate,6 providing effective pain relief even in patients using buprenorphine. In contrast to the 2004 Department of Health and Human Service guidelines, subsequent clinical studies have demonstrated that concurrent use of opioid analgesics is effective for patients maintained on buprenorphine, similar to patients on other forms of OUD treatment such as methadone.7,8
Precipitated withdrawal only occurs when buprenorphine is newly introduced to patients with already circulating opioids. Patients receiving buprenorphine-naloxone can also be exposed to opioids without precipitated withdrawal from the naloxone component, as naloxone is not absorbed via sublingual or buccal administration, but only present in the formulation to dissuade intravenous administration of the medication.
Even in the perioperative period, there is insufficient evidence to support the discontinuation of buprenorphine.9 Studies in this patient population have found that patients receiving buprenorphine may require higher doses of short-acting opioids to achieve adequate analgesia, but they experience similar pain control, lengths of stay, and functional outcomes to controls.10 Despite variable perioperative management of buprenorphine,11 protocols at major medical centers now recommend continuing or dose adjusting buprenorphine in the perioperative period rather than discontinuing.12-14
Patients physically dependent on opioid agonists, including buprenorphine, must be maintained on a daily equivalent opioid dose to avoid experiencing withdrawal. This maintenance requirement must be met before any analgesic effect for acute pain is obtained with additional opioids. Temporarily discontinuing buprenorphine introduces unnecessary complexity to a hospitalization, places the patient at risk of exacerbation of pain, opioid withdrawal, and predisposes the patient to return to use and overdose if not resumed before hospital discharge.5
Finally, clinicians do not require additional training or an X waiver to administer buprenorphine to hospitalized patients. These requirements are limited to providers managing buprenorphine in the outpatient setting or those prescribing buprenorphine to patients to take postdischarge. Hospitalists frequently prescribe opioid medications in the inpatient setting with similar or greater safety risk profiles to buprenorphine.
WHEN YOU SHOULD CONSIDER HOLDING BUPRENORPHINE
Providers may consider holding buprenorphine if a patient with OUD has not been taking buprenorphine before hospitalization and has severe acute pain needs. This history can be confirmed with the patient and the state’s online prescription drug monitoring program. If further clarification is needed, this can be accomplished with a pharmacist and urine testing or by verifying with the patient’s opioid treatment program, as some programs provide directly administered buprenorphine.
In cases where a patient may have stopped buprenorphine before admission but wants to restart it in the hospital, it is essential to ascertain when the patient last used an opioid. The buprenorphine reinduction should be timed to a sufficient number of hours since last opioid use and/or to when the patient shows signs of active withdrawal. The re-induction can take place before, during, or after an acute pain episode, depending on the individual circumstances.
Patient preference is extremely important in the management of both pain and OUD. After shared decision-making, some patients may ultimately opt to hold buprenorphine in certain situations or switch to an alternative treatment, such as methadone, during their hospitalization. Such adjustments should be made in conjunction with the patient, primary care provider, and pain or addiction medicine specialty consultation.
WHAT YOU SHOULD DO INSTEAD
For patients on buprenorphine admitted to the hospital with anticipated or unanticipated acute pain needs, hospitalists should continue buprenorphine. Continuation of buprenorphine meets a patient’s baseline opioid requirement while still allowing the use of additional short-acting opioid agonists as needed for pain.15
As with all pain, multimodal pain management should be provided with adjunctive medications such as acetaminophen, nonsteroidal anti-inflammatory drugs, neuropathic agents, topical analgesics, and regional anesthesia.8
Acute pain can be addressed by taking advantage of buprenorphine’s analgesic effects and adding additional short-acting opioids if needed.15 Several options are available, including:
1. Continuing daily buprenorphine and prescribing short-acting opioid agonists, preferably those with high intrinsic activity at the mu receptor (such as morphine, fentanyl, or hydromorphone). Full opioid agonist doses to achieve analgesia for patients on buprenorphine will be higher than in opioid naïve patients due to tolerance.16
2 .Dividing the total daily buprenorphine dose into three or four times per day dosing, since buprenorphine provides an analgesic effect lasting six to eight hours. Short-acting opioid agonists can still be prescribed on an as-needed basis for additional pain needs.
3. Temporarily increasing the total daily buprenorphine dose and dividing into three or four times per day dosing, as above. Short-acting opioid agonists can still be prescribed on an as-needed basis for additional pain needs.
It is essential to make a clear plan with the patient for initiation and discontinuation of short-acting opioid agonists or buprenorphine changes. Patients on buprenorphine should be managed collaboratively with the primary care provider or addiction specialist to coordinate prescribing and follow-up after discharge.
RECOMMENDATIONS
- Continue outpatient buprenorphine treatment for patients admitted with acute pain.
- Use adjunctive nonopioid pain medications and nonpharmacologic modalities to address acute pain.
- Adjust buprenorphine to address acute pain by dividing the total daily amount into three or four times a day dosing, and/or up-titrate the buprenorphine dose (federal prescribing regulations recommend a maximum of 24 mg daily, but state regulations may vary).
- Add short-acting opioid agonists on an as-needed basis in conjunction with a defined plan to discontinue short-acting opioid agonists to avoid a return to use.
- Make plans collaboratively with the patient and outpatient provider, and communicate medication changes and plan at discharge.
CONCLUSION
Concerning our case, the hospitalist can continue the patient’s buprenorphine-naloxone, even with her acute pain needs. The patient has a baseline opioid requirement, fulfilled by continuing buprenorphine. Additional short-acting opioid agonists, such as hydromorphone, will provide analgesia for the patient, though the clinician should be aware that higher doses might be required. The practice of holding buprenorphine during episodes of acute pain is not supported by current evidence and may predispose to inadequate analgesia, opioid withdrawal, and risk of return to use and death.2
Do you think this is a low-value practice? Is this truly a “Thing We Do for No Reason™?” Share what you do in your practice and join in the conversation online by retweeting it on Twitter (#TWDFNR) and liking it on Facebook. We invite you to propose ideas for other “Things We Do for No Reason™” topics by emailing [email protected].
Disclosures
The authors report no conflicts of interest.
1. Mattick RP, Breen C, Kimber J, Davoli M. Buprenorphine maintenance versus placebo or methadone maintenance for opioid dependence. Cochrane Database Syst Rev. 2014;(3):CD002207. https://doi.org/10.1002/14651858.CD002207.
2. Sordo L, Barrio G, Bravo M, et al. Morality risk during and after opioid substitution treatment: systemic review and meta-analysis of cohort studies. BMJ. 2017;357:1550. https://doi.org/10.1136/bmj.j1550.
3. Johnson RE, Fudula PJ, Payne R. Buprenorphine: considerations for pain management. J Pain Symptom Manage. 2005;29(3):297-326. https://doi.org/10.1016/j.jpainsymman.2004.07.005.
4. Marcelina JS, Rubinstein A. Continuous perioperative sublingual buprenorphine. J Pain Palliat Care Pharmacother. 2016;30(4):289-293. https://doi.org/10.1080/15360288.2016.1231734.
5. Greenwald MK, Johanson CE, Moody DE, et al. Effects of buprenorphine maintenance dose on mu-opioid receptor binding potential, plasma concentration and antagonist blockade in heroin-dependent volunteers. Neuropsychopharmacology. 2003;28(11):2000-2009. https://doi.org/10.1038/sj.npp.1300251.
6. Lembke A, Ottestad E, Schmiesing C. Patients maintained on buprenorphine for opioid use disorder should continue buprenorphine through the perioperative period. Pain Med. 2019;20(3):425-428. https://doi.org/10.1093/pm/pny019.
7. Kornfeld H, Manfredi L. Effectiveness of full agonist opioids in patients stabilized on buprenorphine undergoing major surgery: A case series. Am J Ther. 2010;17(5):523-528. https://doi.org/10.1097/MJT.0b013e3181be0804.
8. Harrison TK, Kornfeld H, Aggarwal AK, Lembke A. Perioperative considerations for the patient with opioid use disorder on buprenorphine, methadone, or naltrexone maintenance therapy. Anesthesiol Clin. 2018;36(3):345-359. https://doi.org/10.1016/j.anclin.2018.04.002.
9. Goel A, Azargive S, Lamba W, et al. The perioperative patient on buprenorphine: a systematic review of perioperative management strategies and patient outcomes. Can J Anesth. 2019; 66(2):201-217. https://doi.org/10.1007/s12630-018-1255-3.
10. Hansen LE, Stone GL, Matson CA, Tybor DJ, Pevear ME, Smith EL. Total joint arthroplasty in patients taking methadone or buprenorphine/naloxone preoperatively for prior heroin addiction: a prospective matched cohort study. J Arthroplasty. 2016;31(8):1698-1701. https://doi.org/10.1016/j.arth.2016.01.032.
11. Jonan AB, Kaye AD, Urman RD. Buprenorphine formulations: clinical best practice strategies recommendations for perioperative management of patients undergoing surgical or interventional pain procedures. Pain Physician. 2018;21(1):E1-12. PubMed
12. Quaye AN, Zhang Y. Perioperative management of buprenorphine: solving the conundrum. Pain Med. 2018. https://doi.org/10.1093/pm/pny217.
13. Silva MJ, Rubinstein A. Continuous perioperative sublingual buprenorphine. J Pain Palliative Care Pharmacother. 2016;30(4):289-293. https://doi.org/10.1080/15360288.2016.1231734.
14. Kampman K, Jarvis M. ASAM National practice guidelines for the use of medications in the treatment of addiction involving opioid use. J Addict Med. 2015;9(5):358-367. https://doi.org/10.1097/ADM.0000000000000166.
15. Childers JW, Arnold RM. Treatment of pain in patients taking buprenorphine for opioid addiction. J Palliat Med. 2012;15(5):613-614. https://doi.org/10.1089/jpm.2012.9591.
16. Alford DP, Compton P, Samet JH. Acute pain management for patients receiving maintenance methadone or buprenorphine therapy. Ann Intern Med. 2006;144(2):127-134. https://doi.org/10.7326/0003-4819-144-2-200601170-00010
© 2019 Society of Hospital Medicine
Clinical Progress Notes: Updates from the 4th Universal Definition of Myocardial Infarction
Elevated serum troponin clearly does not equal myocardial infarction (MI). This was the strong message in the 2018 publication of the Fourth Universal Definition of Myocardial Infarction1 (4UDMI), the first update to the international consensus document since 2012.
Most clinicians have learned how to accurately diagnose the classic Type 1 MI (T1MI) due to atherosclerotic plaque rupture; however, elevated troponin in the absence of T1MI is increasingly common due to more frequent and less discriminate troponin testing.2 Patients with elevated troponin in the absence of T1MI have traditionally created confusion and variability in diagnosis, management, and documentation. Interpretation and management of elevated troponin in the absence of T1MI has become difficult.
In this clinical practice update, we aim to review the updated definition of Type 2 MI (T2MI) and nonischemic myocardial injury (NIMI), since these are the two predominant diagnoses among patients with elevated troponin in the absence of T1MI. We also provide a clinical framework for clinicians to think through elevated serum cardiac troponin levels and identify opportunities for quality improvement around this critical issue.
DEFINITIONS OF MYOCARDIAL INJURY
The presence of an elevated serum troponin level is a critical component in determining the presence of cardiac myocyte injury and possible infarction. Myocardial injury is defined as the presence of serum troponin above the 99th percentile of the upper reference limit (URL), the absolute value of which varies by assay and which applies to traditional and highly sensitive subtypes. Myocardial injury can be confusing to assess, as it can be acute or chronic.
When troponin levels are elevated but stable, this is indicative of chronic (usually nonischemic) myocardial injury, as seen, for example, in patients who have end-stage renal disease. The presence of acute injury requires a change in the troponin value—specifically a rise and/or fall in troponin levels with serial measurements. What constitutes a significant “rise and/or fall” is a matter of some debate and is not precisely defined in the 4UDMI. The percent change in the troponin value over time (relative delta) is listed as part of the criteria for acute injury when the change is greater than or equal to 20%;1 however, clinicians should be aware that absolute delta in troponin (the change in ng/dL) has better performance characteristics3 in diagnosing acute myocardial injury. Regardless of whether clinicians use relative or absolute changes in the serum troponin level, clinical evaluation of patients with acute injury is critical to establishing whether the injury is ischemic (MI) or nonischemic (NIMI). The presence of at least one of the following is necessary to meet the current criteria for myocardial ischemia according to the fourth universal definition: new ischemic symptoms (eg, chest pain, dyspnea, etc.), new ischemic changes in the patient’s electrocardiogram (eg, new ST segment depression in leads II, III, and aVF), or cardiac imaging changes consistent with ischemic injury (eg, new wall motion abnormality in the inferior wall on echocardiography).
Following diagnosis of MI based on elevated troponin and new symptoms or signs, the cause of MI should then be determined. Type 1 MI remains defined as MI caused by atherosclerotic plaque disruption in a patient with coronary artery disease (CAD). Type 2 MI is not caused by plaque disruption but is due to a mismatch between oxygen supply and demand unrelated to acute atherothrombosis. T2MI is an ischemic myocardial injury traceable to some other illness that leads to inadequate myocyte oxygenation. Causes of T2MI are numerous, can overlap with nonischemic injury, and can include severe anemia, septic shock, rapid atrial fibrillation, and coronary dissection. While CAD may be present in patients with T2MI, it is not a requirement, and an increased demand for, or reduced supply of, myocyte oxygen alone can be sufficient to cause MI.
In the absence of clinical signs or symptoms of cardiac ischemia, clinicians should categorize patients as having a nonischemic myocardial injury. There is significant overlap between causes of T2MI and NIMI, for example, sepsis could cause either T2MI or NIMI. What distinguishes these two entities is whether the signs and symptoms for myocardial ischemia as outlined above are present. If these signs or symptoms are present, the diagnosis is T2MI. If no clinical signs or symptoms of ischemia are present, the diagnosis is NIMI. The assessment of the clinician, using all available clinical information, is pivotal. The characteristics of the three major types of myocardial injury are depicted in the Figure.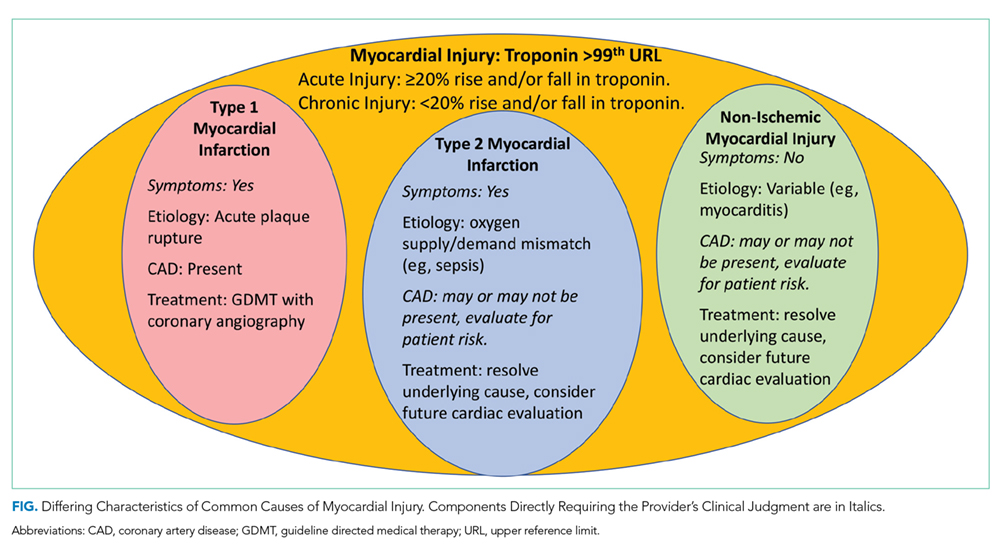
CLINICAL PRACTICE UPDATE
Proper distinction between infarction or injury without infarction is central to proper evaluation, treatment, and eventual documentation in patients with elevated troponin levels. In the case of T2MI and NIMI, identifying what underlying illness is causing the troponin elevation is essential for acute management.
Evaluation
Troponin elevation is associated with an elevated risk for major adverse cardiovascular events, regardless of etiology.4 While patients with suspected T1MI are most often evaluated by coronary angiography, this may not be necessary for patients with T2MI or NIMI. Developing an evaluation strategy for patients with T2MI or NIMI requires understanding the underlying etiology of myocardial injury. In patients with septic shock for example, there are many potential mechanisms for cardiac myocyte injury, many of which are nonischemic (eg, cytokine-mediated).5 Prompt evaluation and treatment of septic shock, therefore, often leads to resolution of cardiac dysfunction, and ischemic evaluation may not be necessary.6 In many cases of T2MI or NIMI, waiting for an acute underlying illness to resolve is necessary before deciding whether ischemic evaluation is appropriate. It is important that this decision is deferred but not forgotten though as patients with T2MI or NIMI may benefit from further cardiac evaluation. There are no society recommendations and minimal evidence to guide this evaluation, but clinical trials testing different evaluation strategies are underway.7 Until an optimal evidence-based evaluation strategy becomes clear, clinicians should focus on two key principles: first, determine and treat the underlying etiology; second, identify patients with traditional risk factors for CAD and consider further evaluation with either coronary angiography or cardiac imaging. Referral to a cardiologist for assistance with the latter issue, especially for challenging or equivocal cases, is encouraged.
Treatment
While T1MI therapies have a strong evidence base with high rates of appropriate treatment, there are relatively few evidence-based therapies for T2MI and NIMI. The benefits of traditional T1MI therapies should be considered in terms of each therapy’s risk-benefit profile. Among patients with T2MI or NIMI in whom atherosclerotic plaque rupture is unlikely, or in whom bleeding risk is high, antithrombotic agents such as unfractionated heparin and dual antiplatelet therapy represent low value and potentially harmful therapies.8 Conversely, patients with multiple risk factors for CAD may benefit from low-risk guideline directed medical therapies such as HMGCoA reductase inhibitors (ie, “statins”). Recent data suggest that lipid-lowering therapies may even be beneficial for preventing T2MI.9
Given the lack of evidence for therapies to treat patients with T2MI or NIMI, clinical judgment remains central to creating an optimal management plan. Clinicians should consider consultation with a cardiologist any time there is ambiguity in whether the diagnosis is T1MI or T2MI. For example, postoperative patients represent a particularly challenging clinical scenario due to the difficulty of assessing ischemic signs and symptoms in the operating room. In this setting, early evaluation by a cardiologist has been shown to improve outcomes.10
Documentation
Documentation of non-ST elevation MI (NSTEMI) for every case of elevated troponin, rather than using the more specific T1MI, T2MI, or NIMI terminology, can have adverse consequences for health systems. From a coding perspective, the terms STEMI and NSTEMI mean T1MI, and the ICD-10 codes used to identify T1MI patients for value-focused programs frequently include patients with T2MI and NIMI due to imprecise documentation.11 When T2MI and NIMI are imprecisely documented as NSTEMI, health systems and clinicians are held to the T1MI care standards. This can negatively skew the performance of a health system or individual clinician because T2MI and NIMI patients have worse outcomes than T1MI patients.4 Inaccurate categorization of patients can lead to inaccurate quality and registry reporting, which may hinder the ability of health systems to monitor and implement quality improvement programs for MI patients. The distinction between T1MI and T2MI in documentation is all the more important now that a new ICD-10 code exists for T2MI (I21.A1), which allows clinicians to more precisely identify these patients, both clinically and administratively, as distinct from T1MI patients.12 While there is no similarly specific ICD-10 code for NIMI, using the appropriate terminology in documentation should prompt coding personnel to use a code for “other abnormal findings of blood chemistry,” reflecting cardiac biomarker elevation (R79.89), rather than using one of the T1MI codes. Clinicians may not be able to determine the etiology of troponin elevation in the initial phase of a hospitalization, but a definitive diagnosis should be documented in the discharge summary.
From the patient perspective, documentation using STEMI and NSTEMI can mislead clinicians, given that this terminology does not specify the underlying cause (ie, plaque rupture or oxygen supply-demand mismatch), potentially leading to delayed initiation of appropriate therapy. Incorrect documentation, using STEMI/NSTEMI language or incorrectly labeling T2MI and NIMI, may lead patients to believe they have had a heart attack when they had myocardial injury instead. This may lead to unnecessary anxiety and change their interactions with the health system. These patients may be started on unnecessary therapies, have inaccurate preoperative evaluations, and be labeled with a preexisting condition for the rest of their lives.
Opportunities for Quality Improvement
Systems-based quality improvement can help to ensure that patients with NIMI and T2MI are labeled appropriately and receive the proper treatment.
CONCLUSIONS
Understanding the definitions of T1MI, T2MI, and NIMI will help clinicians to better identify the appropriate clinical care and consultation strategy for patients with elevated cardiac troponin. There are relatively few published quality improvement initiatives to help guide clinicians through these nuanced distinctions, but there is great potential in such approaches to help clinicians provide the highest value care possible.
Disclosures
No authors have any conflict of interest, financial or otherwise, to declare regarding this study.
Funding
Dr. Levy receives funding from National Institutes of Health (NIH) T32 Training Grant 5T32-HL007822.
1. Thygesen K, Alpert JS, Jaffe AS, et al. Fourth universal definition of myocardial infarction (2018). J Am Coll Cardiol. 2018;72(18):2231-2264. https://doi.org/10.1016/j.jacc.2018.08.1038.
2. Shah ASV, Sandoval Y, Noaman A, et al. Patient selection for high sensitivity cardiac troponin testing and diagnosis of myocardial infarction: prospective cohort study. BMJ. 2017;359:j4788. https://doi.org/10.1136/bmj.j4788.
3. Storrow AB, Nowak RM, Diercks DB, et al. Absolute and relative changes (delta) in troponin I for early diagnosis of myocardial infarction: results of a prospective multicenter trial. Clin Biochem. 2015;48(4-5):260-267. https://doi.org/10.1016/j.clinbiochem.2014.09.012.
4. Sandoval Y, Jaffe AS. Type 2 myocardial infarction. J Am Coll Cardiol. 2019;73(14):1846-1860. https://doi.org/10.1016/j.jacc.2019.02.018.
5. Martin L, Derwall M, Al Zoubi S, et al. The septic heart: current understanding of molecular mechanisms and clinical implications. Chest. 2019;155(2):427-437. https://doi.org/10.1016/j.chest.2018.08.1037.
6. Vallabhajosyula S, Jentzer JC, Geske JB, et al. New-onset heart failure and mortality in hospital survivors of sepsis-related left ventricular dysfunction. Shock. 2018;49(2):144-149. https://doi.org/10.1097/SHK.0000000000000952.
7. Lambrakis K, French JK, Scott IA, et al. The appropriateness of coronary investigation in myocardial injury and type 2 myocardial infarction (ACT-2): a randomized trial design. Am Heart J. 2019;208:11-20. https://doi.org/10.1016/j.ahj.2018.09.016.
8. Morrow A, Ahmad F, Steele C, McEntegart M, Murdoch D. Treating the troponin: adverse consequences of over-treatment of elevated troponin in non-coronary presentations. Scot Med J. 2019;64(1):10-15. https://doi.org/10.1177/0036933018809754.
9. White HD, Steg P, Szarek M, et al. Reduction of type 1 and type 2 myocardial infarctions in patients treated with alirocumab: insights from the ODYSSEY Trial. J Am Coll Cardiol. 2019;73(9):4. https://doi.org/10.1016/S0735-1097(19)30613-8.
10. Hua A, Pattenden H, Leung M, et al. Early cardiology assessment and intervention reduces mortality following myocardial injury after non-cardiac surgery (MINS). J Thorac Dis. 2016;8(5):920-924. https://doi.org/10.21037/jtd.2016.03.55.
11. Díaz-Garzón J, Sandoval Y, Smith S, et al. Discordance between ICD-coded myocardial infarction and diagnosis according to the universal definition of myocardial infarction. Clin Chem. 2017;63(1):415-419. https://doi.org/10.1373/clinchem.2016.263764.
12. Goyal A, Gluckman TJ, Tcheng JE. What’s in a name? The new ICD-10 (10th revision of the International Statistical Classification of Diseases and Related Health Problems) codes and type 2 myocardial infarction. Circulation. 2017;136(13):1180-1182. https://doi.org/10.1161/CIRCULATIONAHA.117.030347.
13. Goyal A GT, Levy AE, Mariani D, et al. Translating the fourth universal definition of myocardial infarction into clinical documentation. Cardiology. 2018:34-36.
Elevated serum troponin clearly does not equal myocardial infarction (MI). This was the strong message in the 2018 publication of the Fourth Universal Definition of Myocardial Infarction1 (4UDMI), the first update to the international consensus document since 2012.
Most clinicians have learned how to accurately diagnose the classic Type 1 MI (T1MI) due to atherosclerotic plaque rupture; however, elevated troponin in the absence of T1MI is increasingly common due to more frequent and less discriminate troponin testing.2 Patients with elevated troponin in the absence of T1MI have traditionally created confusion and variability in diagnosis, management, and documentation. Interpretation and management of elevated troponin in the absence of T1MI has become difficult.
In this clinical practice update, we aim to review the updated definition of Type 2 MI (T2MI) and nonischemic myocardial injury (NIMI), since these are the two predominant diagnoses among patients with elevated troponin in the absence of T1MI. We also provide a clinical framework for clinicians to think through elevated serum cardiac troponin levels and identify opportunities for quality improvement around this critical issue.
DEFINITIONS OF MYOCARDIAL INJURY
The presence of an elevated serum troponin level is a critical component in determining the presence of cardiac myocyte injury and possible infarction. Myocardial injury is defined as the presence of serum troponin above the 99th percentile of the upper reference limit (URL), the absolute value of which varies by assay and which applies to traditional and highly sensitive subtypes. Myocardial injury can be confusing to assess, as it can be acute or chronic.
When troponin levels are elevated but stable, this is indicative of chronic (usually nonischemic) myocardial injury, as seen, for example, in patients who have end-stage renal disease. The presence of acute injury requires a change in the troponin value—specifically a rise and/or fall in troponin levels with serial measurements. What constitutes a significant “rise and/or fall” is a matter of some debate and is not precisely defined in the 4UDMI. The percent change in the troponin value over time (relative delta) is listed as part of the criteria for acute injury when the change is greater than or equal to 20%;1 however, clinicians should be aware that absolute delta in troponin (the change in ng/dL) has better performance characteristics3 in diagnosing acute myocardial injury. Regardless of whether clinicians use relative or absolute changes in the serum troponin level, clinical evaluation of patients with acute injury is critical to establishing whether the injury is ischemic (MI) or nonischemic (NIMI). The presence of at least one of the following is necessary to meet the current criteria for myocardial ischemia according to the fourth universal definition: new ischemic symptoms (eg, chest pain, dyspnea, etc.), new ischemic changes in the patient’s electrocardiogram (eg, new ST segment depression in leads II, III, and aVF), or cardiac imaging changes consistent with ischemic injury (eg, new wall motion abnormality in the inferior wall on echocardiography).
Following diagnosis of MI based on elevated troponin and new symptoms or signs, the cause of MI should then be determined. Type 1 MI remains defined as MI caused by atherosclerotic plaque disruption in a patient with coronary artery disease (CAD). Type 2 MI is not caused by plaque disruption but is due to a mismatch between oxygen supply and demand unrelated to acute atherothrombosis. T2MI is an ischemic myocardial injury traceable to some other illness that leads to inadequate myocyte oxygenation. Causes of T2MI are numerous, can overlap with nonischemic injury, and can include severe anemia, septic shock, rapid atrial fibrillation, and coronary dissection. While CAD may be present in patients with T2MI, it is not a requirement, and an increased demand for, or reduced supply of, myocyte oxygen alone can be sufficient to cause MI.
In the absence of clinical signs or symptoms of cardiac ischemia, clinicians should categorize patients as having a nonischemic myocardial injury. There is significant overlap between causes of T2MI and NIMI, for example, sepsis could cause either T2MI or NIMI. What distinguishes these two entities is whether the signs and symptoms for myocardial ischemia as outlined above are present. If these signs or symptoms are present, the diagnosis is T2MI. If no clinical signs or symptoms of ischemia are present, the diagnosis is NIMI. The assessment of the clinician, using all available clinical information, is pivotal. The characteristics of the three major types of myocardial injury are depicted in the Figure.
CLINICAL PRACTICE UPDATE
Proper distinction between infarction or injury without infarction is central to proper evaluation, treatment, and eventual documentation in patients with elevated troponin levels. In the case of T2MI and NIMI, identifying what underlying illness is causing the troponin elevation is essential for acute management.
Evaluation
Troponin elevation is associated with an elevated risk for major adverse cardiovascular events, regardless of etiology.4 While patients with suspected T1MI are most often evaluated by coronary angiography, this may not be necessary for patients with T2MI or NIMI. Developing an evaluation strategy for patients with T2MI or NIMI requires understanding the underlying etiology of myocardial injury. In patients with septic shock for example, there are many potential mechanisms for cardiac myocyte injury, many of which are nonischemic (eg, cytokine-mediated).5 Prompt evaluation and treatment of septic shock, therefore, often leads to resolution of cardiac dysfunction, and ischemic evaluation may not be necessary.6 In many cases of T2MI or NIMI, waiting for an acute underlying illness to resolve is necessary before deciding whether ischemic evaluation is appropriate. It is important that this decision is deferred but not forgotten though as patients with T2MI or NIMI may benefit from further cardiac evaluation. There are no society recommendations and minimal evidence to guide this evaluation, but clinical trials testing different evaluation strategies are underway.7 Until an optimal evidence-based evaluation strategy becomes clear, clinicians should focus on two key principles: first, determine and treat the underlying etiology; second, identify patients with traditional risk factors for CAD and consider further evaluation with either coronary angiography or cardiac imaging. Referral to a cardiologist for assistance with the latter issue, especially for challenging or equivocal cases, is encouraged.
Treatment
While T1MI therapies have a strong evidence base with high rates of appropriate treatment, there are relatively few evidence-based therapies for T2MI and NIMI. The benefits of traditional T1MI therapies should be considered in terms of each therapy’s risk-benefit profile. Among patients with T2MI or NIMI in whom atherosclerotic plaque rupture is unlikely, or in whom bleeding risk is high, antithrombotic agents such as unfractionated heparin and dual antiplatelet therapy represent low value and potentially harmful therapies.8 Conversely, patients with multiple risk factors for CAD may benefit from low-risk guideline directed medical therapies such as HMGCoA reductase inhibitors (ie, “statins”). Recent data suggest that lipid-lowering therapies may even be beneficial for preventing T2MI.9
Given the lack of evidence for therapies to treat patients with T2MI or NIMI, clinical judgment remains central to creating an optimal management plan. Clinicians should consider consultation with a cardiologist any time there is ambiguity in whether the diagnosis is T1MI or T2MI. For example, postoperative patients represent a particularly challenging clinical scenario due to the difficulty of assessing ischemic signs and symptoms in the operating room. In this setting, early evaluation by a cardiologist has been shown to improve outcomes.10
Documentation
Documentation of non-ST elevation MI (NSTEMI) for every case of elevated troponin, rather than using the more specific T1MI, T2MI, or NIMI terminology, can have adverse consequences for health systems. From a coding perspective, the terms STEMI and NSTEMI mean T1MI, and the ICD-10 codes used to identify T1MI patients for value-focused programs frequently include patients with T2MI and NIMI due to imprecise documentation.11 When T2MI and NIMI are imprecisely documented as NSTEMI, health systems and clinicians are held to the T1MI care standards. This can negatively skew the performance of a health system or individual clinician because T2MI and NIMI patients have worse outcomes than T1MI patients.4 Inaccurate categorization of patients can lead to inaccurate quality and registry reporting, which may hinder the ability of health systems to monitor and implement quality improvement programs for MI patients. The distinction between T1MI and T2MI in documentation is all the more important now that a new ICD-10 code exists for T2MI (I21.A1), which allows clinicians to more precisely identify these patients, both clinically and administratively, as distinct from T1MI patients.12 While there is no similarly specific ICD-10 code for NIMI, using the appropriate terminology in documentation should prompt coding personnel to use a code for “other abnormal findings of blood chemistry,” reflecting cardiac biomarker elevation (R79.89), rather than using one of the T1MI codes. Clinicians may not be able to determine the etiology of troponin elevation in the initial phase of a hospitalization, but a definitive diagnosis should be documented in the discharge summary.
From the patient perspective, documentation using STEMI and NSTEMI can mislead clinicians, given that this terminology does not specify the underlying cause (ie, plaque rupture or oxygen supply-demand mismatch), potentially leading to delayed initiation of appropriate therapy. Incorrect documentation, using STEMI/NSTEMI language or incorrectly labeling T2MI and NIMI, may lead patients to believe they have had a heart attack when they had myocardial injury instead. This may lead to unnecessary anxiety and change their interactions with the health system. These patients may be started on unnecessary therapies, have inaccurate preoperative evaluations, and be labeled with a preexisting condition for the rest of their lives.
Opportunities for Quality Improvement
Systems-based quality improvement can help to ensure that patients with NIMI and T2MI are labeled appropriately and receive the proper treatment.
CONCLUSIONS
Understanding the definitions of T1MI, T2MI, and NIMI will help clinicians to better identify the appropriate clinical care and consultation strategy for patients with elevated cardiac troponin. There are relatively few published quality improvement initiatives to help guide clinicians through these nuanced distinctions, but there is great potential in such approaches to help clinicians provide the highest value care possible.
Disclosures
No authors have any conflict of interest, financial or otherwise, to declare regarding this study.
Funding
Dr. Levy receives funding from National Institutes of Health (NIH) T32 Training Grant 5T32-HL007822.
1. Thygesen K, Alpert JS, Jaffe AS, et al. Fourth universal definition of myocardial infarction (2018). J Am Coll Cardiol. 2018;72(18):2231-2264. https://doi.org/10.1016/j.jacc.2018.08.1038.
2. Shah ASV, Sandoval Y, Noaman A, et al. Patient selection for high sensitivity cardiac troponin testing and diagnosis of myocardial infarction: prospective cohort study. BMJ. 2017;359:j4788. https://doi.org/10.1136/bmj.j4788.
3. Storrow AB, Nowak RM, Diercks DB, et al. Absolute and relative changes (delta) in troponin I for early diagnosis of myocardial infarction: results of a prospective multicenter trial. Clin Biochem. 2015;48(4-5):260-267. https://doi.org/10.1016/j.clinbiochem.2014.09.012.
4. Sandoval Y, Jaffe AS. Type 2 myocardial infarction. J Am Coll Cardiol. 2019;73(14):1846-1860. https://doi.org/10.1016/j.jacc.2019.02.018.
5. Martin L, Derwall M, Al Zoubi S, et al. The septic heart: current understanding of molecular mechanisms and clinical implications. Chest. 2019;155(2):427-437. https://doi.org/10.1016/j.chest.2018.08.1037.
6. Vallabhajosyula S, Jentzer JC, Geske JB, et al. New-onset heart failure and mortality in hospital survivors of sepsis-related left ventricular dysfunction. Shock. 2018;49(2):144-149. https://doi.org/10.1097/SHK.0000000000000952.
7. Lambrakis K, French JK, Scott IA, et al. The appropriateness of coronary investigation in myocardial injury and type 2 myocardial infarction (ACT-2): a randomized trial design. Am Heart J. 2019;208:11-20. https://doi.org/10.1016/j.ahj.2018.09.016.
8. Morrow A, Ahmad F, Steele C, McEntegart M, Murdoch D. Treating the troponin: adverse consequences of over-treatment of elevated troponin in non-coronary presentations. Scot Med J. 2019;64(1):10-15. https://doi.org/10.1177/0036933018809754.
9. White HD, Steg P, Szarek M, et al. Reduction of type 1 and type 2 myocardial infarctions in patients treated with alirocumab: insights from the ODYSSEY Trial. J Am Coll Cardiol. 2019;73(9):4. https://doi.org/10.1016/S0735-1097(19)30613-8.
10. Hua A, Pattenden H, Leung M, et al. Early cardiology assessment and intervention reduces mortality following myocardial injury after non-cardiac surgery (MINS). J Thorac Dis. 2016;8(5):920-924. https://doi.org/10.21037/jtd.2016.03.55.
11. Díaz-Garzón J, Sandoval Y, Smith S, et al. Discordance between ICD-coded myocardial infarction and diagnosis according to the universal definition of myocardial infarction. Clin Chem. 2017;63(1):415-419. https://doi.org/10.1373/clinchem.2016.263764.
12. Goyal A, Gluckman TJ, Tcheng JE. What’s in a name? The new ICD-10 (10th revision of the International Statistical Classification of Diseases and Related Health Problems) codes and type 2 myocardial infarction. Circulation. 2017;136(13):1180-1182. https://doi.org/10.1161/CIRCULATIONAHA.117.030347.
13. Goyal A GT, Levy AE, Mariani D, et al. Translating the fourth universal definition of myocardial infarction into clinical documentation. Cardiology. 2018:34-36.
© 2019 Society of Hospital
Clinical Progress Note: Procalcitonin in the Diagnosis and Management of Community-Acquired Pneumonia in Hospitalized Adults
Community-acquired pneumonia (CAP) accounts for more than 1.5 million adult hospitalizations and 100,000 deaths each year in the United States.1 Antibiotic overuse in the hospital setting is an important contributor to the rise of antibiotic resistance, prompting increased efforts to limit inappropriate antibiotic use in hospitals.2 Procalcitonin, a precursor of the hormone calcitonin, is upregulated in bacterial infections and downregulated in viral infections. The US Food and Drug Administration has approved it as a serum biomarker to assist clinicians with decisions about using antibiotics.3
There is no consensus on how to best use procalcitonin in the management of CAP. We provide a practical update that includes a review of recent literature, added secondary analysis, and expert opinion surrounding the use of procalcitonin in the diagnosis and management of CAP in hospitalized adults.
INITIATION OF ANTIBIOTICS
Initial procalcitonin levels do not sufficiently exclude bacterial etiologies of CAP to withhold antibiotic prescription safely. The largest diagnostic accuracy study of procalcitonin in the diagnosis of CAP was a subanalysis of the Etiology of Pneumonia in the Community Study.4 A total of 1,735 adults hospitalized with CAP received procalcitonin testing along with systematic pathogen testing. The area under the receiver operating characteristic curve for procalcitonin in discriminating bacterial pathogens from viral pathogens was 0.73 (95% CI, 0.69-0.77). A procalcitonin cut-off of 0.1 ng/mL resulted in 80.9% (95% CI, 75.3%-85.7%) sensitivity and 51.6% (95% CI, 46.6%-56.5%) specificity for identification of any bacterial pathogen.
In a secondary analysis of this study, we calculated multilevel likelihood ratios (LRs) for ranges of procalcitonin values to determine the diagnostic accuracy of procalcitonin in distinguishing bacterial from viral etiologies of CAP (Table). Multilevel LRs offer more useful diagnostic information than dichotomizing at specified cut-points.5 A procalcitonin result less than 0.1 ng/mL has a negative LR of 0.4 (95% CI, 0.3-0.5), which is not low enough to rule out bacterial CAP effectively when starting with intermediate or high pretest probability. For a low result (<0.1 ng/mL) to be useful in ruling out bacterial CAP, for example having less than a 10% posttest probability of bacterial CAP, the pretest probability would have to be no greater than 22%. Even then, a 10% posttest probability of bacterial CAP may still be too high for clinicians to withhold initial antibiotics. For procalcitonin values between 0.1 ng/mL and 1.0 ng/mL, the probability of bacterial CAP does not change significantly, with an LR of 1.0 (95% CI, 0.8-1.3). Procalcitonin values up to 5 ng/mL reach a modest positive LR of 2.3 (95% CI, 0.8-4.3). Very high values, such as those >10 ng/mL, yield a positive LR of 5.5 (95% CI, 3.2-9.7), are potentially useful in decisions to initiate antibiotics in situations of very low pretest probability of bacterial CAP. For example, a 9% pretest probability of bacterial CAP is likely below many physicians’ threshold for starting antibiotics. A procalcitonin of 12 ng/mL in this patient would increase the posttest probability to 35%, a value that would prompt many physicians to initiate antibiotics.
Overall, there is insufficient evidence to support the use of procalcitonin as a stand-alone test for ruling out bacterial CAP, limiting its use in withholding antibiotics in patients with suspected bacterial CAP.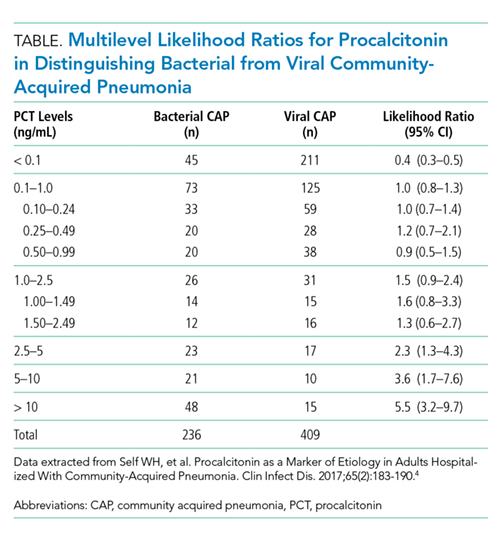
DISCONTINUATION OF ANTIBIOTICS
While initial procalcitonin measurements may not affect the initial antibiotic treatment decision, procalcitonin levels thereafter can guide the duration of therapy. A meta-analysis of procalcitonin-guided treatment in patients with upper or lower respiratory tract infection (LRTI) showed that procalcitonin guidance reduces antibiotic exposure and antibiotic-related adverse effects and improves survival, albeit a small absolute mortality difference of 1.4 percentage points, primarily observed in the intensive care unit setting.6 Most patients included in this meta-analysis were diagnosed with LRTI (91%), and CAP was the predominant subtype of LRTI (43%). The main effect of procalcitonin guidance for patients with CAP was earlier discontinuation of antibiotic treatment. Procalcitonin-guided algorithms in these trials discouraged, or strongly discouraged, antibiotics if procalcitonin was <0.25 ng/mL or <0.1 ng/mL, respectively. In addition, serial procalcitonin measurements were used to guide discontinuation of antibiotics if procalcitonin dropped below 0.25 ng/mL, or by 80% to 90% from the peak value. This approach safely shortened the duration of therapy in patients with CAP.
There are several limitations in the interpretation and generalizability of this meta-analysis. There is large heterogeneity across the included clinical trials in design, procalcitonin protocols, clinical setting, and respiratory infection type, including bronchitis, acute exacerbation of chronic obstructive pulmonary disease (AECOPD), and CAP. Results were consistent only in one moderate- to high-quality randomized trial specifically studying CAP in the inpatient setting.7 Additionally, most of these trials were conducted in Europe. Antibiotic prescribing practices may be different in the US, and prescribing practices on both continents may have changed over the years with greater awareness and appreciation of antibiotic stewardship.
PROCALCITONIN-GUIDED ALGORITHMS
The ProACT trial, the largest randomized, US multicenter trial to evaluate a procalcitonin-based algorithm to assist with antibiotic decision making, included over 1,600 emergency department patients at 14 academic medical centers.8 Procalcitonin guidance in this trial did not reduce antibiotic exposure compared with usual care for patients with suspected LRTI. However, its applicability to the practice of hospitalists and the inpatient setting is limited. First, only 48% of the study participants required hospitalization. Second, this study included all LRTIs, with CAP comprising just 20% of all final diagnoses. Third, the average number of antibiotic days during hospitalization for CAP was short in both groups (3.9 days in the procalcitonin group and 4.1 days in the usual care group). This relatively short antibiotic duration makes it difficult for any intervention to decrease antibiotic days meaningfully.
In a prepost controlled intervention study for inpatients at a single US tertiary care hospital, procalcitonin guidance in hospitalized patients safely reduced antibiotic use in LRTI, specifically for the discontinuation of antibiotics.9 The greatest benefit of procalcitonin guidance in antibiotic discontinuation was found in patients with AECOPD and patients with an admitting diagnosis of CAP, but with mild illness and a low procalcitonin. Although this prepost study suggested a safe reduction of antibiotic use due to implementation of procalcitonin guidance, the lack of randomization and the absence of a contemporaneous control group are important limitations. Given the mixed findings on the effectiveness of procalcitonin guidance for hospitalized CAP patients in the US, further investigation will be needed with large clinical trials in the inpatient setting for CAP.
CONCLUSIONS
There is insufficient evidence to support the use of serum procalcitonin to withhold initial antibiotics in patients with a clinical syndrome consistent with bacterial CAP. However, the literature supports the use of procalcitonin for the early discontinuation of antibiotics for cases in which the probability of bacterial CAP is low, and procalcitonin remains below 0.1 ng/mL (Figure).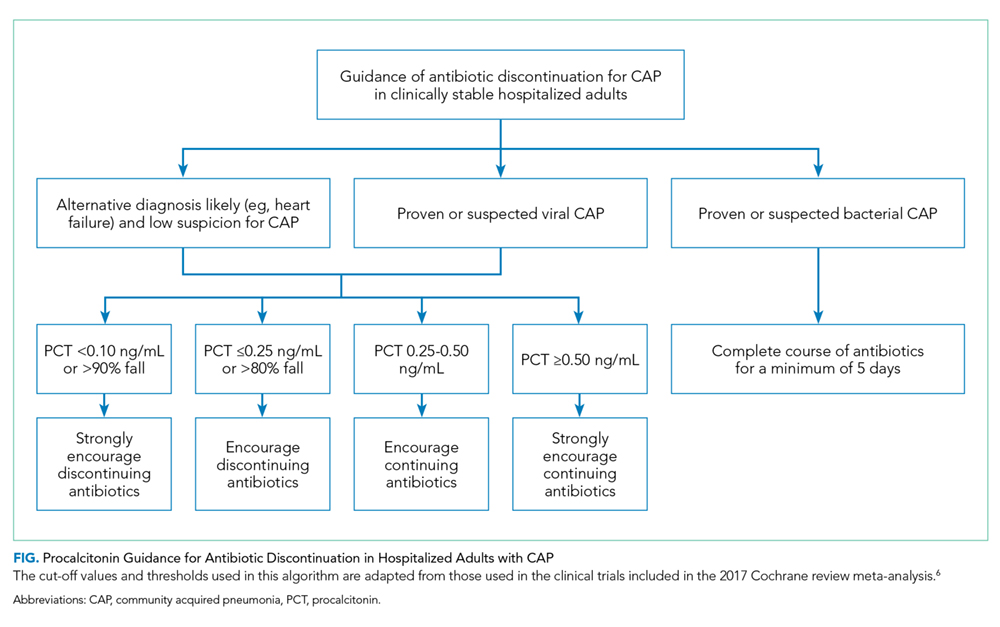
Serial measurements of procalcitonin every one to two days may also be used when clinical uncertainty remains regarding the need for antibiotics. Very low or significantly decreasing procalcitonin levels in patients with CAP and no identified bacterial pathogen likely indicate the infection was not bacterial or was bacterial, but has now been adequately treated with antibiotics. For cases of proven bacterial etiology or high clinical suspicion of bacterial CAP, there is insufficient evidence to recommend the early discontinuation of antibiotics based on procalcitonin levels short of the recommended five-day course according to current guidelines.10 Future clinical trials are needed to determine if procalcitonin guidance can safely decrease the duration of antibiotic therapy for confirmed bacterial CAP to less than five days.
There are discrepancies between the apparent test characteristics of procalcitonin and the recommended antibiotic decisions in many procalcitonin algorithms. For example, algorithms discourage antibiotics when procalcitonin values are 0.1-0.24 ng/mL, and encourage (or even strongly encourage) antibiotic use for higher procalcitonin values of 0.25-1.0 ng/mL. However, the LRs for these ranges are identical and are approximately 1.0 (Table), suggesting that decision-making should be similar across the entire procalcitonin range of 0.1 to 1.0. Future clinical trials should study revised algorithms with different cut-points, including the thresholds found in our secondary analysis of multilevel LRs. Until then, we believe there is insufficient evidence to deviate from current antibiotic decision recommendations at the traditional cut-points.
While procalcitonin is an imperfect biomarker for discriminating bacterial and nonbacterial etiologies of CAP, it may still provide helpful information for the hospitalist in antibiotic decision-making in the same way we apply other commonly used clinical variables such as fever, white blood cell count, band count, and the pattern of infiltrate in chest imaging.
Procalcitonin should be interpreted cautiously in certain populations in which it has not been extensively studied (eg, immunocompromised) or in noninfectious conditions that may elevate procalcitonin, such as major physiologic stress (eg, surgery, trauma, burns) and end-stage renal disease.12-14 Further investigation is needed to determine the efficacy and safety of procalcitonin-guided antibiotic therapy in these populations.
RECOMMENDATIONS
- Based on currently available data, a low procalcitonin value should not be used as a stand-alone test to withhold antibiotics in a patient with CAP.
- Serum procalcitonin measurements may help guide the early discontinuation of antibiotics for patients who the treating clinician judges the risks of bacterial etiology and clinical deterioration to be low.
- Interpret procalcitonin cautiously in immunocompromised patients, undergoing severe physiologic stress, or have underlying end-stage renal disease.
- Serum procalcitonin serves as an adjunct to, rather than a substitute for, clinical judgment.
Disclosures
Dr Choi, Dr Evans, and Dr Glesby have nothing to disclose. Dr Self reports receiving prior research funding from BRAHMS/Thermo-Fisher and BioMerieux for studies on procalcitonin. Dr Self reports personal fees from Inflammatix, grants from Axis Shield, Rapid Pathogen Screening, and BioMerieux, all outside the submitted work. Dr McCarthy reports receiving research funding from Allergan outside the submitted work. Dr Simon reports receiving consulting fees from Roche Diagnostics.
1. Ramirez JA, Wiemken TL, Peyrani P, et al. adults hospitalized with pneumonia in the united states: incidence, epidemiology, and mortality. Clin Infect Dis. 2017;65(11):1806-1812. https://doi.org/10.1093/cid/cix647.
2. Hecker MT, Aron DC, Patel NP, Lehmann MK, Donskey CJ. Unnecessary use of antimicrobials in hospitalized patients: current patterns of misuse with an emphasis on the antianaerobic spectrum of activity. Arch Intern Med. 2003;163(8):972-978. https://doi.org/10.1001/archinte.163.8.972.
3. Rhee C. Using procalcitonin to guide antibiotic therapy. Open Forum Infect Dis. 2017;4(1):ofw249. https://doi.org/10.1093/ofid/ofw249.
4. Self WH, Balk RA, Grijalva CG, et al. Procalcitonin as a marker of etiology in adults hospitalized with community-acquired pneumonia. Clin Infect Dis. 2017;65(2):183-190. https://doi.org/10.1093/cid/cix317.
5. Straus SE, Richardson WS, Glasziou P, Haynes RB. Evidence-Based Medicine: How to Practice and Teach It (4th Edition). Fourth Edition ed. London, England: Elsevier Churchill Livingstone; 2010.
6. Schuetz P, Wirz Y, Sager R, et al. Procalcitonin to initiate or discontinue antibiotics in acute respiratory tract infections. Cochrane Database Syst Rev. 2017;10:CD007498. https://doi.org/10.1164/rccm.200512-1922OC.
7. Christ-Crain M, Stolz D, Bingisser R, et al. Procalcitonin guidance of antibiotic therapy in community-acquired pneumonia: a randomized trial. Am J Respir Crit Care Med. 2006;174(1):84-93. https://doi.org/10.1056/NEJMoa1802670.
8. Huang DT, Yealy DM, Filbin MR, et al. Procalcitonin-guided use of antibiotics for lower respiratory tract infection. N Engl J Med. 2018;379(3):236-249. https://doi.org/10.1056/NEJMoa1802670
10. Townsend J, Adams V, Galiatsatos P, et al. Procalcitonin-guided antibiotic therapy reduces antibiotic use for lower respiratory tract infections in a United States medical center: results of a clinical trial. Open Forum Infect Dis. 2018;5(12):ofy327. https://doi.org/10.1093/ofid/ofy327.
11. Mandell LA, Wunderink RG, Anzueto A, et al. Infectious Diseases Society of America/American Thoracic Society consensus guidelines on the management of community-acquired pneumonia in adults. Clin Infect Dis. 2007;44 Suppl 2:S27-S72. https://doi.org/10.1086/511159.
12. Seoane L, Pértega S, Galeiras R, Astola I, Bouza T. Procalcitonin in the burn unit and the diagnosis of infection. Burns. 2014;40(2):223-229. https://doi.org/10.1016/j.burns.2013.11.018.
13. Dahaba AA, Rehak PH, List WF. Procalcitonin and C-reactive protein plasma concentrations in nonseptic uremic patients undergoing hemodialysis. Intensive Care Med. 2003;29(4):579-583. https://doi.org/10.1007/s00134-003-1664-8.
14. Ghabra H, White W, Townsend M, Boysen P, Nossaman B. Use of biomarkers in the prediction of culture-proven infection in the surgical intensive care unit. J Crit Care. 2019;49:149-154. https://doi.org/10.1016/j.jcrc.2018.10.023.
15. Hoshino K, Irie Y, Mizunuma M, Kawano K, Kitamura T, Ishikura H. Incidence of elevated procalcitonin and presepsin levels after severe trauma: a pilot cohort study. Anaesth Intensive Care. 2017;45(5):600-604. https://doi.org/10.1177/0310057X1704500510.
Community-acquired pneumonia (CAP) accounts for more than 1.5 million adult hospitalizations and 100,000 deaths each year in the United States.1 Antibiotic overuse in the hospital setting is an important contributor to the rise of antibiotic resistance, prompting increased efforts to limit inappropriate antibiotic use in hospitals.2 Procalcitonin, a precursor of the hormone calcitonin, is upregulated in bacterial infections and downregulated in viral infections. The US Food and Drug Administration has approved it as a serum biomarker to assist clinicians with decisions about using antibiotics.3
There is no consensus on how to best use procalcitonin in the management of CAP. We provide a practical update that includes a review of recent literature, added secondary analysis, and expert opinion surrounding the use of procalcitonin in the diagnosis and management of CAP in hospitalized adults.
INITIATION OF ANTIBIOTICS
Initial procalcitonin levels do not sufficiently exclude bacterial etiologies of CAP to withhold antibiotic prescription safely. The largest diagnostic accuracy study of procalcitonin in the diagnosis of CAP was a subanalysis of the Etiology of Pneumonia in the Community Study.4 A total of 1,735 adults hospitalized with CAP received procalcitonin testing along with systematic pathogen testing. The area under the receiver operating characteristic curve for procalcitonin in discriminating bacterial pathogens from viral pathogens was 0.73 (95% CI, 0.69-0.77). A procalcitonin cut-off of 0.1 ng/mL resulted in 80.9% (95% CI, 75.3%-85.7%) sensitivity and 51.6% (95% CI, 46.6%-56.5%) specificity for identification of any bacterial pathogen.
In a secondary analysis of this study, we calculated multilevel likelihood ratios (LRs) for ranges of procalcitonin values to determine the diagnostic accuracy of procalcitonin in distinguishing bacterial from viral etiologies of CAP (Table). Multilevel LRs offer more useful diagnostic information than dichotomizing at specified cut-points.5 A procalcitonin result less than 0.1 ng/mL has a negative LR of 0.4 (95% CI, 0.3-0.5), which is not low enough to rule out bacterial CAP effectively when starting with intermediate or high pretest probability. For a low result (<0.1 ng/mL) to be useful in ruling out bacterial CAP, for example having less than a 10% posttest probability of bacterial CAP, the pretest probability would have to be no greater than 22%. Even then, a 10% posttest probability of bacterial CAP may still be too high for clinicians to withhold initial antibiotics. For procalcitonin values between 0.1 ng/mL and 1.0 ng/mL, the probability of bacterial CAP does not change significantly, with an LR of 1.0 (95% CI, 0.8-1.3). Procalcitonin values up to 5 ng/mL reach a modest positive LR of 2.3 (95% CI, 0.8-4.3). Very high values, such as those >10 ng/mL, yield a positive LR of 5.5 (95% CI, 3.2-9.7), are potentially useful in decisions to initiate antibiotics in situations of very low pretest probability of bacterial CAP. For example, a 9% pretest probability of bacterial CAP is likely below many physicians’ threshold for starting antibiotics. A procalcitonin of 12 ng/mL in this patient would increase the posttest probability to 35%, a value that would prompt many physicians to initiate antibiotics.
Overall, there is insufficient evidence to support the use of procalcitonin as a stand-alone test for ruling out bacterial CAP, limiting its use in withholding antibiotics in patients with suspected bacterial CAP.
DISCONTINUATION OF ANTIBIOTICS
While initial procalcitonin measurements may not affect the initial antibiotic treatment decision, procalcitonin levels thereafter can guide the duration of therapy. A meta-analysis of procalcitonin-guided treatment in patients with upper or lower respiratory tract infection (LRTI) showed that procalcitonin guidance reduces antibiotic exposure and antibiotic-related adverse effects and improves survival, albeit a small absolute mortality difference of 1.4 percentage points, primarily observed in the intensive care unit setting.6 Most patients included in this meta-analysis were diagnosed with LRTI (91%), and CAP was the predominant subtype of LRTI (43%). The main effect of procalcitonin guidance for patients with CAP was earlier discontinuation of antibiotic treatment. Procalcitonin-guided algorithms in these trials discouraged, or strongly discouraged, antibiotics if procalcitonin was <0.25 ng/mL or <0.1 ng/mL, respectively. In addition, serial procalcitonin measurements were used to guide discontinuation of antibiotics if procalcitonin dropped below 0.25 ng/mL, or by 80% to 90% from the peak value. This approach safely shortened the duration of therapy in patients with CAP.
There are several limitations in the interpretation and generalizability of this meta-analysis. There is large heterogeneity across the included clinical trials in design, procalcitonin protocols, clinical setting, and respiratory infection type, including bronchitis, acute exacerbation of chronic obstructive pulmonary disease (AECOPD), and CAP. Results were consistent only in one moderate- to high-quality randomized trial specifically studying CAP in the inpatient setting.7 Additionally, most of these trials were conducted in Europe. Antibiotic prescribing practices may be different in the US, and prescribing practices on both continents may have changed over the years with greater awareness and appreciation of antibiotic stewardship.
PROCALCITONIN-GUIDED ALGORITHMS
The ProACT trial, the largest randomized, US multicenter trial to evaluate a procalcitonin-based algorithm to assist with antibiotic decision making, included over 1,600 emergency department patients at 14 academic medical centers.8 Procalcitonin guidance in this trial did not reduce antibiotic exposure compared with usual care for patients with suspected LRTI. However, its applicability to the practice of hospitalists and the inpatient setting is limited. First, only 48% of the study participants required hospitalization. Second, this study included all LRTIs, with CAP comprising just 20% of all final diagnoses. Third, the average number of antibiotic days during hospitalization for CAP was short in both groups (3.9 days in the procalcitonin group and 4.1 days in the usual care group). This relatively short antibiotic duration makes it difficult for any intervention to decrease antibiotic days meaningfully.
In a prepost controlled intervention study for inpatients at a single US tertiary care hospital, procalcitonin guidance in hospitalized patients safely reduced antibiotic use in LRTI, specifically for the discontinuation of antibiotics.9 The greatest benefit of procalcitonin guidance in antibiotic discontinuation was found in patients with AECOPD and patients with an admitting diagnosis of CAP, but with mild illness and a low procalcitonin. Although this prepost study suggested a safe reduction of antibiotic use due to implementation of procalcitonin guidance, the lack of randomization and the absence of a contemporaneous control group are important limitations. Given the mixed findings on the effectiveness of procalcitonin guidance for hospitalized CAP patients in the US, further investigation will be needed with large clinical trials in the inpatient setting for CAP.
CONCLUSIONS
There is insufficient evidence to support the use of serum procalcitonin to withhold initial antibiotics in patients with a clinical syndrome consistent with bacterial CAP. However, the literature supports the use of procalcitonin for the early discontinuation of antibiotics for cases in which the probability of bacterial CAP is low, and procalcitonin remains below 0.1 ng/mL (Figure).
Serial measurements of procalcitonin every one to two days may also be used when clinical uncertainty remains regarding the need for antibiotics. Very low or significantly decreasing procalcitonin levels in patients with CAP and no identified bacterial pathogen likely indicate the infection was not bacterial or was bacterial, but has now been adequately treated with antibiotics. For cases of proven bacterial etiology or high clinical suspicion of bacterial CAP, there is insufficient evidence to recommend the early discontinuation of antibiotics based on procalcitonin levels short of the recommended five-day course according to current guidelines.10 Future clinical trials are needed to determine if procalcitonin guidance can safely decrease the duration of antibiotic therapy for confirmed bacterial CAP to less than five days.
There are discrepancies between the apparent test characteristics of procalcitonin and the recommended antibiotic decisions in many procalcitonin algorithms. For example, algorithms discourage antibiotics when procalcitonin values are 0.1-0.24 ng/mL, and encourage (or even strongly encourage) antibiotic use for higher procalcitonin values of 0.25-1.0 ng/mL. However, the LRs for these ranges are identical and are approximately 1.0 (Table), suggesting that decision-making should be similar across the entire procalcitonin range of 0.1 to 1.0. Future clinical trials should study revised algorithms with different cut-points, including the thresholds found in our secondary analysis of multilevel LRs. Until then, we believe there is insufficient evidence to deviate from current antibiotic decision recommendations at the traditional cut-points.
While procalcitonin is an imperfect biomarker for discriminating bacterial and nonbacterial etiologies of CAP, it may still provide helpful information for the hospitalist in antibiotic decision-making in the same way we apply other commonly used clinical variables such as fever, white blood cell count, band count, and the pattern of infiltrate in chest imaging.
Procalcitonin should be interpreted cautiously in certain populations in which it has not been extensively studied (eg, immunocompromised) or in noninfectious conditions that may elevate procalcitonin, such as major physiologic stress (eg, surgery, trauma, burns) and end-stage renal disease.12-14 Further investigation is needed to determine the efficacy and safety of procalcitonin-guided antibiotic therapy in these populations.
RECOMMENDATIONS
- Based on currently available data, a low procalcitonin value should not be used as a stand-alone test to withhold antibiotics in a patient with CAP.
- Serum procalcitonin measurements may help guide the early discontinuation of antibiotics for patients who the treating clinician judges the risks of bacterial etiology and clinical deterioration to be low.
- Interpret procalcitonin cautiously in immunocompromised patients, undergoing severe physiologic stress, or have underlying end-stage renal disease.
- Serum procalcitonin serves as an adjunct to, rather than a substitute for, clinical judgment.
Disclosures
Dr Choi, Dr Evans, and Dr Glesby have nothing to disclose. Dr Self reports receiving prior research funding from BRAHMS/Thermo-Fisher and BioMerieux for studies on procalcitonin. Dr Self reports personal fees from Inflammatix, grants from Axis Shield, Rapid Pathogen Screening, and BioMerieux, all outside the submitted work. Dr McCarthy reports receiving research funding from Allergan outside the submitted work. Dr Simon reports receiving consulting fees from Roche Diagnostics.
1. Ramirez JA, Wiemken TL, Peyrani P, et al. adults hospitalized with pneumonia in the united states: incidence, epidemiology, and mortality. Clin Infect Dis. 2017;65(11):1806-1812. https://doi.org/10.1093/cid/cix647.
2. Hecker MT, Aron DC, Patel NP, Lehmann MK, Donskey CJ. Unnecessary use of antimicrobials in hospitalized patients: current patterns of misuse with an emphasis on the antianaerobic spectrum of activity. Arch Intern Med. 2003;163(8):972-978. https://doi.org/10.1001/archinte.163.8.972.
3. Rhee C. Using procalcitonin to guide antibiotic therapy. Open Forum Infect Dis. 2017;4(1):ofw249. https://doi.org/10.1093/ofid/ofw249.
4. Self WH, Balk RA, Grijalva CG, et al. Procalcitonin as a marker of etiology in adults hospitalized with community-acquired pneumonia. Clin Infect Dis. 2017;65(2):183-190. https://doi.org/10.1093/cid/cix317.
5. Straus SE, Richardson WS, Glasziou P, Haynes RB. Evidence-Based Medicine: How to Practice and Teach It (4th Edition). Fourth Edition ed. London, England: Elsevier Churchill Livingstone; 2010.
6. Schuetz P, Wirz Y, Sager R, et al. Procalcitonin to initiate or discontinue antibiotics in acute respiratory tract infections. Cochrane Database Syst Rev. 2017;10:CD007498. https://doi.org/10.1164/rccm.200512-1922OC.
7. Christ-Crain M, Stolz D, Bingisser R, et al. Procalcitonin guidance of antibiotic therapy in community-acquired pneumonia: a randomized trial. Am J Respir Crit Care Med. 2006;174(1):84-93. https://doi.org/10.1056/NEJMoa1802670.
8. Huang DT, Yealy DM, Filbin MR, et al. Procalcitonin-guided use of antibiotics for lower respiratory tract infection. N Engl J Med. 2018;379(3):236-249. https://doi.org/10.1056/NEJMoa1802670
10. Townsend J, Adams V, Galiatsatos P, et al. Procalcitonin-guided antibiotic therapy reduces antibiotic use for lower respiratory tract infections in a United States medical center: results of a clinical trial. Open Forum Infect Dis. 2018;5(12):ofy327. https://doi.org/10.1093/ofid/ofy327.
11. Mandell LA, Wunderink RG, Anzueto A, et al. Infectious Diseases Society of America/American Thoracic Society consensus guidelines on the management of community-acquired pneumonia in adults. Clin Infect Dis. 2007;44 Suppl 2:S27-S72. https://doi.org/10.1086/511159.
12. Seoane L, Pértega S, Galeiras R, Astola I, Bouza T. Procalcitonin in the burn unit and the diagnosis of infection. Burns. 2014;40(2):223-229. https://doi.org/10.1016/j.burns.2013.11.018.
13. Dahaba AA, Rehak PH, List WF. Procalcitonin and C-reactive protein plasma concentrations in nonseptic uremic patients undergoing hemodialysis. Intensive Care Med. 2003;29(4):579-583. https://doi.org/10.1007/s00134-003-1664-8.
14. Ghabra H, White W, Townsend M, Boysen P, Nossaman B. Use of biomarkers in the prediction of culture-proven infection in the surgical intensive care unit. J Crit Care. 2019;49:149-154. https://doi.org/10.1016/j.jcrc.2018.10.023.
15. Hoshino K, Irie Y, Mizunuma M, Kawano K, Kitamura T, Ishikura H. Incidence of elevated procalcitonin and presepsin levels after severe trauma: a pilot cohort study. Anaesth Intensive Care. 2017;45(5):600-604. https://doi.org/10.1177/0310057X1704500510.
© 2019 Society of Hospital Medicine
Barriers to Providing VTE Chemoprophylaxis to Hospitalized Patients: A Nursing-Focused Qualitative Evaluation
Venous thromboembolism (VTE), comprising deep venous thrombosis and pulmonary embolism (PE),1 is a serious medical condition that results in preventable morbidity and mortality.1-5 VTE affects all age groups, all races/ethnicities, and both genders, but there are known factors that increase the risk of developing VTE (eg, advanced age, undergoing surgery, hospitalization, and immobility).1-3,5-7 Prevention of VTE among hospitalized patients is of paramount importance to avoid preventable death, chronic illness/long-term complications,8 longer hospital stays, and increased hospital costs.9 Fortunately, there is clear evidence that provision of appropriate prophylaxis can decrease the risk of a VTE event occurring, and broadly accepted best-practice guidelines reflect this evidence.3,5
Given the inadequacy of current VTE-related quality measures to identify actionable failures in the provision of VTE prophylaxis, our group created a VTE process-of-care measure to assess adherence to the components of VTE prophylaxis: (1) early ambulation, (2) mechanical prophylaxis (sequential compression devices [SCDs]), and (3) chemoprophylaxis administered at the correct dose and frequency for the duration of the patient’s hospital stay.3,10,11 This quality measure was conceived, created, and iteratively revised to measure whether optimal care is provided to patients throughout their hospitalization and identify actionable areas in which failures of care occur, in order to decrease the risk of a VTE event. Data from our institution provided evidence that while ambulation and SCD component measure adherence is high, chemoprophylaxis adherence required significant improvement.10 When chemoprophylaxis process measure adherence data were analyzed further, a major failure mode was patient refusal of one or more doses. However, the drivers of patient refusal are not well defined in the literature, and previous studies have called for a greater focus on developing interventions to improve VTE chemoprophylaxis administration.12
Previous research has shown that nurses can influence patient compliance with VTE prophylaxis.13-15 A mixed-methods study by Elder et al. found that nurses in units with high rates of failure to provide optimal chemoprophylaxis offered the medication as optional, leading researchers to conclude that nurses perceived chemoprophylaxis as discretionary.13 Another study by Lee et al., conducted a survey of bedside registered nurses and identified nurses’ lack of education on VTE prevention as a significant barrier to providing care.14 These studies show that multiple levels of influence impact how nurses provide VTE chemoprophylaxis, particularly when they encounter patients who refuse chemoprophylaxis.
To explore the nuance and interplay of multiple influences, we used the Theoretical Domains Framework (TDF), an integrative framework that applies theoretical approaches to interventions aimed at behavior change.15-18 The framework contains 14 interrelated domains that characterize the behavior being studied, in this case, administration of VTE chemoprophylaxis. Consequently, we designed a nurse-focused, qualitative evaluation with the objective to identify nursing-related barriers to administration of VTE chemoprophylaxis.
METHODS
Inpatient Unit Selection
The study team accessed data from the hospital’s Enterprise Data Warehouse to review patient refusal rates of VTE chemoprophylaxis for each inpatient unit in the hospital. Patient refusal was utilized as a proxy measure for the behavior of nurses attempting to administer VTE chemoprophylaxis. Of the 14 medical and surgical units in the hospital, two medical and two surgical units were selected to participate in the qualitative evaluation based on having the highest patient refusal rates. One unit (surgical) was also selected to serve as a benchmark because it had the lowest patient refusal rate. Table 1 includes the refusal rates for the five units. Given the low refusal rate for the best performing unit, we suspected that it would be possible to decrease the patient refusal rate for other units with similar patient populations and interprofessional teams at the institution.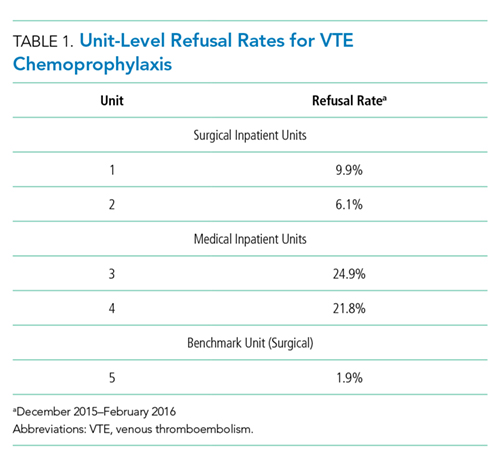
Observations
We observed chemoprophylaxis administration on the five units to understand the process for ordering and administering chemoprophylaxis. An observation protocol was utilized to document the date, time, and location of the observation as well as descriptive notes including accounts of particular events.19,20 Observations occurred in May 2016 and informed the creation of a process map outlining the procedure for ordering and administering VTE chemoprophylaxis. The process map was utilized to create the focus group interview guide and ensure the interview guide included pertinent questions for each step of the process (Appendix A).
Focus Group Interviews
We conducted focus group interviews with day and night shift nurses on the five units to assess nurses’ understanding of VTE chemoprophylaxis and nurses’ perceptions of barriers to administration of VTE chemoprophylaxis. The study team chose to conduct focus group interviews in an effort to maximize participation and to speak with multiple nurses within a shorter period of time. The focus group structure allowed the study team to speak with nurses during their shifts, as one could briefly step out, if required, for patient care and return to rejoin the discussion.
We developed a semistructured interview guide21 with questions focused on identifying nurses’ perceptions of guideline-recommended care for VTE chemoprophylaxis, where they learned these guidelines, how nurses discuss chemoprophylaxis with patients, how they handle the conversation with patients who refuse, and if there are times when chemoprophylaxis is not necessary. The interview guide was vetted by a multidisciplinary team consisting of clinical nursing coordinators and nurse managers from medical and surgical units, hospital quality leaders, surgeons and general internists, and qualitative research experts. The interview guide is included as Appendix B.
The unit clinical coordinators and nurse managers identified dates and times for the focus groups that would be minimally disruptive to the unit. For each of the four units with a high patient refusal rate, two focus groups were conducted during the lunch hour and one was conducted at the end of the night shift to ensure that both day and night shift nurses were included in the study. Two focus groups were conducted with the best-practice unit during the lunch hour. For each focus group, the clinical coordinator identified two to eight nurses who could step away from patient care to participate or who had completed their shifts. In total, approximately 67 nurses participated in the focus groups.
The focus groups (n = 14) lasted approximately 40 minutes during May and June 2016. Two members of the study team cofacilitated interviews, which were recorded and transcribed verbatim.
Coding and Data Analysis
To develop the code book, the study team, consisting of three qualitative researchers, independently read one focus group transcript and applied the TDF domains to the nurses’ perceptions of barriers to administration of VTE chemoprophylaxis.21-24 In addition to coding by domain, the study team also coded nursing perceptions as barriers or facilitators. The study team reviewed the coded transcript and reconciled any differences in coding. This process was repeated for a second transcript, and then all remaining transcripts were assigned to two out of three study team members for coding, with the entire study team meeting to reconcile any differences. If necessary, the team member who did not code a transcript acted as the tie-breaker if there were discrepancies in codes that could not be reconciled.
Once coding was completed, we identified the TDF domains that were most relevant to the administration of VTE chemoprophylaxis.16 Member checking (testing the analysis, interpretations, and conclusions with members of those groups from whom the data were originally obtained) was performed with the four clinical nursing coordinators and four nurse managers from the participating units to establish face validity of the themes identified from the focus group interviews.25
The study team used MaxQDA, V12 (Berlin, Germany) to support data coding and analysis.26 The Northwestern University institutional review board office deemed this project research on nonhuman-subjects because it focused on the process of providing VTE chemoprophylaxis and not about the patients themselves. The purpose of the study was explained at the beginning of each focus group, and nurses gave verbal consent to have the focus group recorded.
RESULTS
We conducted 14 focus groups with day and night shift nurses from five units (two medical and three surgical) at a single institution. All nurses invited to participate in a focus group agreed to participate. The data were coded and grouped by domain and identified as barriers or facilitators. The findings included below are for the domains most relevant to the provision of VTE prophylaxis. Table 2 provides illustrative verbatim quotes for each domain that was represented in the focus groups.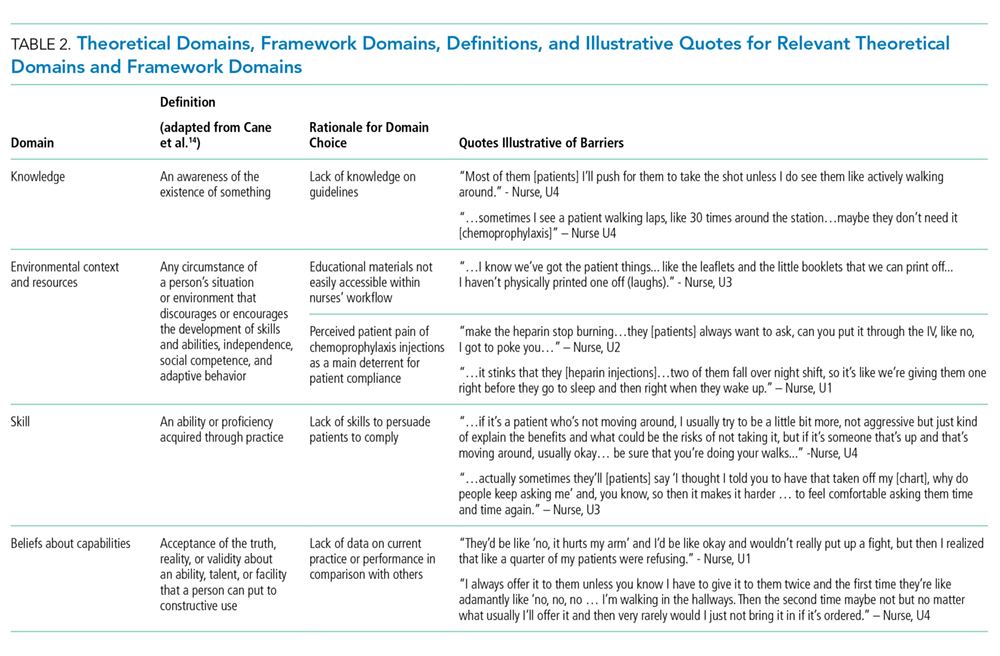
THEORETICAL DOMAINS FRAMEWORK DOMAINS
Knowledge
All interviewees recognized that providing some form of prophylaxis to mitigate the risk of a VTE event is essential. Some nurses stated that seeing a patient ambulating meant they would consider not administering prescribed chemoprophylaxis, while others would try to negotiate with patients by asking the patient to allow one dose of chemoprophylaxis prescribed two to three times daily because it was better than receiving no doses.
Environmental Context and Resources
Multiple barriers to providing optimal care were associated with the environmental context and a lack of resources. There was a lack of accessible, comprehensive, patient-centered education materials on VTE chemoprophylaxis to supplement a nurse’s explanation about the importance of chemoprophylaxis. Furthermore, many nurses cited the perceived patient pain of chemoprophylaxis injections as the main deterrent to patient compliance, especially subcutaneous heparin injections, which occur up to three times in 24 hours and often cause more pain at the site of injection than low-molecular-weight heparin. Nurses felt that transitioning patients from receiving subcutaneous heparin injections to receiving low-molecular-weight heparin could be a main driver to reduce patient refusals.
Skills
Nurses felt inadequately equipped to handle patient refusals. Many said that patient refusal of treatments was never discussed in nursing school. As a result, when patients refused treatments, the nurses did not know how to handle the situation. They felt that they lacked the tools and techniques to persuade the patient to comply.
Beliefs about Capabilities
Nurses did not know their own patient refusal rate or benchmarks of an acceptable refusal rate in contrast to one that is too high. Without this feedback, they were unable to assess their own behavior or performance related to providing VTE chemoprophylaxis.
DISCUSSION
Nurses play a critical role in providing VTE chemoprophylaxis to patients throughout their hospitalization. This study provided a unique opportunity to perform an in-depth, qualitative analysis of the barriers nurses face in providing patients with VTE chemoprophylaxis as part of their daily work caring for patients. We discovered several nursing-related barriers to the provision of VTE chemoprophylaxis, including lack of knowledge, resources, skill, and misconceptions of their capability to provide VTE chemoprophylaxis. We used a bottom-up approach by incorporating the voices of unit nurses, clinical coordinators, and nurse managers to understand potential barriers. Our findings brought to light the challenge of delivering standardized care in an area of care that is generally agreed upon, yet not fully followed. Some nurses display greater proficiency than others at communicating with patients who do not understand their risk for VTE and need for chemoprophylaxis. Furthermore, there is a pronounced misconception around the delivery of VTE chemoprophylaxis. Nurses have the inaccurate belief that even if ordered, chemoprophylaxis is not required. This misconception was widespread among nurses taking care of both medical and surgical patients. These factors appear to be modifiable targets for quality improvement and highlight the need for a skills-based education during the new hire onboarding process, as well as ongoing reeducation to ensure nursing staff have the skills to appropriately provide best-practice care for VTE chemoprophylaxis. Nurses felt ownership of the results of the qualitative evaluation because they were included in every aspect from the beginning.27 This sense of ownership will support future quality improvement efforts to develop a skills-based intervention to improve the provision of VTE chemoprophylaxis.18,27
This study has certain limitations. First, it was a qualitative study assessing nursing-related barriers to providing VTE chemoprophylaxis at a single institution, and the results cannot be generalized broadly. However, the techniques and results are transferable to other hospital settings and other clinical care situations. Thus, we believe that other institutions can utilize our methods and that similar lessons can be learned and applied. Furthermore, the validity of our study is bolstered by concordance between the results of this study and those of other studies conducted on the topic of provision of VTE prophylaxis by nurses.13-15,21 Other studies utilized observations and surveys to determine potential nurse-related barriers to the provision of VTE prophylaxis, such as lack of knowledge and the belief that the need for prophylaxis can be determined based on whether or not the patient is ambulating;13,14 however, by utilizing focus group interviews, we allowed nurses to speak in their own voices about their experiences with VTE prophylaxis, and we were able to delve deeper and identify additional barriers that emerged from discussions with nurses, such as the lack of skill and misconceptions of capability.28,29 Second, the study focused solely on nurses. Additional initiatives are underway to assess the roles of resident physicians, attending physicians, and patients in the provision of VTE prophylaxis.
Nursing-related barriers to the provision of VTE chemoprophylaxis include a lack of knowledge, resources, skills, and misconceptions of the consequences of missed elements of VTE prophylaxis. Future initiatives will focus on equipping nurses to have meaningful conversations with patients and engaging patients in their care through development of a multifaceted bundle of interventions. Furthermore, similar methods of qualitative inquiry will be used to identify the role of resident and attending physicians and patients in the provision of VTE chemoprophylaxis.
Acknowledgments
The authors thank Sonali Oberoi, Joanne Prinz, Nancy Tomaska, and Kate Paredes, as well as all the nurses who participated in focus group interviews for this study and the nurse managers and clinical coordinators who helped to schedule the focus group interviews.
Disclosures
The authors declare that they have no competing interests.
Funding
This study was funded by the Surgical Outcomes and Quality Improvement Center at Northwestern University.
1. Beckman MG, Hooper WC, Critchley SE, Ortel TL. Venous thromboembolism: a public health concern. Am J Prev Med. 2010;38(4):S495-S501. https://doi.org/10.1016/j.amepre.2009.12.017.
2. Falck-Ytter Y, Francis CW, Johanson NA, et al. Prevention of VTE in orthopedic surgery patients: Antithrombotic Therapy and Prevention of Thrombosis, 9th ed: American College of Chest Physicians evidence-based clinical practice guidelines. Chest. 2012;141(2):e278S-e325S. https://doi.org/10.1378/chest.11-2404.
3. Gould MK, Garcia DA, Wren SM, et al. Prevention of VTE in nonorthopedic surgical patients: antithrombotic therapy and prevention of thrombosis: American College of Chest Physicians evidence-based clinical practice guidelines. Chest. 2012;141(2):e227S-e277S. https://doi.org/10.1378/chest.11-2297.
4. Guyatt GH, Akl EA, Crowther M, et al. Executive summary: antithrombotic therapy and prevention of thrombosis: American College of Chest Physicians evidence-based clinical practice guidelines. Chest. 2012;141(2):7S-47S. https://doi.org/10.1378/chest.1412S3.
5. Office of the Surgeon General. National Heart L, and Blood Institute. The Surgeon General’s Call to Action to Prevent Deep Vein Thrombosis and Pulmonary Embolism. Rockville, MD; 2008.
6. Geerts WH, Pineo GF, Heit JA, et al. Prevention of venous thromboembolism: the Seventh ACCP Conference on Antithrombotic and Thrombolytic Therapy. Chest. 2004;126(3):338S-400S. https://doi.org/10.1378/chest.126.3_suppl.338S.
7. Haut ER, Lau BD, Kraus PS, et al. Preventability of hospital-acquired venous thromboembolism. JAMA Surg. 2015;150(9):912-915. https://doi.org/10.1001/jamasurg.2015.1340.
8. Kahn SR, Solymoss S, Lamping DL, Abenhaim L. Long-term outcomes after deep vein thrombosis: postphlebitic syndrome and quality of life. J Gen Intern Med. 2000;15(6):425-429. https://doi.org/10.1046/j.1525-1497.2000.06419.x.
9. Mahan CE, Holdsworth MT, Welch SM, Borrego M, Spyropoulos AC. Deep-vein thrombosis: a United States cost model for a preventable and costly adverse event. Thromb Haemost. 2011;106(3):405-415. https://doi.org/10.1160/TH11-02-0132.
10. Kinnier CV, Ju MH, Kmiecik T, et al. Development of a novel composite process measure for venous thromboembolism prophylaxis. Med Care. 2016;54(2):210-217. https://doi.org/10.1097/MLR.0000000000000474.
11. Schünemann HJ, Cushman M, Burnett AE, et al. American Society of Hematology 2018 guidelines for management of venous thromboembolism: prophylaxis for hospitalized and nonhospitalized medical patients. Blood Adv. 2018;2(22):3198-3225. https://doi.org/10.1182/bloodadvances.2018022954.
12. Lau BD, Streiff MB, Kraus PS, et al. Missed doses of venous thromboembolism (VTE) prophylaxis at community hospitals: cause for alarm. J Gen Intern Med. 2018;33(1):19-20. https://doi.org/10.1007/s11606-017-4203-y.
13. Elder S, Hobson DB, Rand CS, et al. Hidden barriers to delivery of pharmacological venous thromboembolism prophylaxis: the role of nursing beliefs and practices. J Patient Saf. 2016;12(2):63-68. https://doi.org/10.1097/PTS.0000000000000086.
14. Lee JA, Grochow D, Drake D, et al. Evaluation of hospital nurses’ perceived knowledge and practices of venous thromboembolism assessment and prevention. J Vasc Nurs. 2014;32(1):18-24. https://doi.org/10.1016/j.jvn.2013.06.001.
15. Shermock KM, Lau BD, Haut ER, et al. Patterns of non-administration of ordered doses of venous thromboembolism prophylaxis: implications for novel intervention strategies. PLOS ONE. 2013;8(6):e66311. https://doi.org/10.1371/journal.pone.0066311.
16. Lipworth W, Taylor N, Braithwaite J. Can the theoretical domains framework account for the implementation of clinical quality interventions? BMC Health Serv Res. 2013;13(1):530. https://doi.org/10.1186/1472-6963-13-530.
17. Taylor N, Lawton R, Moore S, et al. Collaborating with front-line healthcare professionals: the clinical and cost effectiveness of a theory based approach to the implementation of a national guideline. BMC Health Serv Res. 2014;14(1):648. https://doi.org/10.1186/s12913-014-0648-4.
18. Cane J, O’Connor D, Michie S. Validation of the theoretical domains framework for use in behaviour change and implementation research. Implement Sci. 2012;7(1):37. https://doi.org/10.1186/1748-5908-7-37.
19. Bogdan R, Biklen S. Qualitative Research for Education: an Introduction to Theory and Methods. Boston: Allyn & Bacon; 1992.
20. Creswell J. Research Design: Qualitative and Quantitative Approaches. Thousand Oaks, CA: Sage Publications; 1994.
21. Patton M. Qualitative Research & Evaluation Methods: Integrating Theory and Practice. 4th ed. Thousand Oaks, CA: SAGE Publications, Inc.; 2014.
22. Alexander KE, Brijnath B, Mazza D. Barriers and enablers to delivery of the Healthy Kids Check: an analysis informed by the theoretical domains framework and COM-B model. Implement Sci. 2014;9(1):60. https://doi.org/10.1186/1748-5908-9-60.
23. Birken SA, Presseau J, Ellis SD, Gerstel AA, Mayer DK. Potential determinants of health-care professionals’ use of survivorship care plans: a qualitative study using the theoretical domains framework. Implement Sci. 2014;9(1):167. https://doi.org/10.1186/s13012-014-0167-z.
24. Atkins L, Francis J, Islam R, et al. A guide to using the theoretical domains framework of behaviour change to investigate implementation problems. Implement Sci. 2017;12(1):77. https://doi.org/10.1186/s13012-017-0605-9.
25. Lincoln YS, Guba EG. Naturalistic Inquiry. Newbury Park, CA: Sage Publications; 1985.
26. Berlin G. MAXQDA, Software for Qualitative Data Analysis. VERBI Software – Consult. Sozialforschung GmbH [computer program]; 1989-2016.
27. Lipmanowicz H. Buy-in v. ownership. Liberating Structures. http://www.liberatingstructures.com/hl-articles/. Accessed July 5, 2019.
28. Morgan D. Why Should You Use Focus Groups? and what focus groups are (and are not). In: The Focus Group Guidebook. Thousand Oaks, CA: Sage Publications; 1998:9-15, 29-35.
29. Sofaer S. Qualitative methods: what are they and why use them? Health Serv Res. 1999;34(5):1101-1118.
Venous thromboembolism (VTE), comprising deep venous thrombosis and pulmonary embolism (PE),1 is a serious medical condition that results in preventable morbidity and mortality.1-5 VTE affects all age groups, all races/ethnicities, and both genders, but there are known factors that increase the risk of developing VTE (eg, advanced age, undergoing surgery, hospitalization, and immobility).1-3,5-7 Prevention of VTE among hospitalized patients is of paramount importance to avoid preventable death, chronic illness/long-term complications,8 longer hospital stays, and increased hospital costs.9 Fortunately, there is clear evidence that provision of appropriate prophylaxis can decrease the risk of a VTE event occurring, and broadly accepted best-practice guidelines reflect this evidence.3,5
Given the inadequacy of current VTE-related quality measures to identify actionable failures in the provision of VTE prophylaxis, our group created a VTE process-of-care measure to assess adherence to the components of VTE prophylaxis: (1) early ambulation, (2) mechanical prophylaxis (sequential compression devices [SCDs]), and (3) chemoprophylaxis administered at the correct dose and frequency for the duration of the patient’s hospital stay.3,10,11 This quality measure was conceived, created, and iteratively revised to measure whether optimal care is provided to patients throughout their hospitalization and identify actionable areas in which failures of care occur, in order to decrease the risk of a VTE event. Data from our institution provided evidence that while ambulation and SCD component measure adherence is high, chemoprophylaxis adherence required significant improvement.10 When chemoprophylaxis process measure adherence data were analyzed further, a major failure mode was patient refusal of one or more doses. However, the drivers of patient refusal are not well defined in the literature, and previous studies have called for a greater focus on developing interventions to improve VTE chemoprophylaxis administration.12
Previous research has shown that nurses can influence patient compliance with VTE prophylaxis.13-15 A mixed-methods study by Elder et al. found that nurses in units with high rates of failure to provide optimal chemoprophylaxis offered the medication as optional, leading researchers to conclude that nurses perceived chemoprophylaxis as discretionary.13 Another study by Lee et al., conducted a survey of bedside registered nurses and identified nurses’ lack of education on VTE prevention as a significant barrier to providing care.14 These studies show that multiple levels of influence impact how nurses provide VTE chemoprophylaxis, particularly when they encounter patients who refuse chemoprophylaxis.
To explore the nuance and interplay of multiple influences, we used the Theoretical Domains Framework (TDF), an integrative framework that applies theoretical approaches to interventions aimed at behavior change.15-18 The framework contains 14 interrelated domains that characterize the behavior being studied, in this case, administration of VTE chemoprophylaxis. Consequently, we designed a nurse-focused, qualitative evaluation with the objective to identify nursing-related barriers to administration of VTE chemoprophylaxis.
METHODS
Inpatient Unit Selection
The study team accessed data from the hospital’s Enterprise Data Warehouse to review patient refusal rates of VTE chemoprophylaxis for each inpatient unit in the hospital. Patient refusal was utilized as a proxy measure for the behavior of nurses attempting to administer VTE chemoprophylaxis. Of the 14 medical and surgical units in the hospital, two medical and two surgical units were selected to participate in the qualitative evaluation based on having the highest patient refusal rates. One unit (surgical) was also selected to serve as a benchmark because it had the lowest patient refusal rate. Table 1 includes the refusal rates for the five units. Given the low refusal rate for the best performing unit, we suspected that it would be possible to decrease the patient refusal rate for other units with similar patient populations and interprofessional teams at the institution.
Observations
We observed chemoprophylaxis administration on the five units to understand the process for ordering and administering chemoprophylaxis. An observation protocol was utilized to document the date, time, and location of the observation as well as descriptive notes including accounts of particular events.19,20 Observations occurred in May 2016 and informed the creation of a process map outlining the procedure for ordering and administering VTE chemoprophylaxis. The process map was utilized to create the focus group interview guide and ensure the interview guide included pertinent questions for each step of the process (Appendix A).
Focus Group Interviews
We conducted focus group interviews with day and night shift nurses on the five units to assess nurses’ understanding of VTE chemoprophylaxis and nurses’ perceptions of barriers to administration of VTE chemoprophylaxis. The study team chose to conduct focus group interviews in an effort to maximize participation and to speak with multiple nurses within a shorter period of time. The focus group structure allowed the study team to speak with nurses during their shifts, as one could briefly step out, if required, for patient care and return to rejoin the discussion.
We developed a semistructured interview guide21 with questions focused on identifying nurses’ perceptions of guideline-recommended care for VTE chemoprophylaxis, where they learned these guidelines, how nurses discuss chemoprophylaxis with patients, how they handle the conversation with patients who refuse, and if there are times when chemoprophylaxis is not necessary. The interview guide was vetted by a multidisciplinary team consisting of clinical nursing coordinators and nurse managers from medical and surgical units, hospital quality leaders, surgeons and general internists, and qualitative research experts. The interview guide is included as Appendix B.
The unit clinical coordinators and nurse managers identified dates and times for the focus groups that would be minimally disruptive to the unit. For each of the four units with a high patient refusal rate, two focus groups were conducted during the lunch hour and one was conducted at the end of the night shift to ensure that both day and night shift nurses were included in the study. Two focus groups were conducted with the best-practice unit during the lunch hour. For each focus group, the clinical coordinator identified two to eight nurses who could step away from patient care to participate or who had completed their shifts. In total, approximately 67 nurses participated in the focus groups.
The focus groups (n = 14) lasted approximately 40 minutes during May and June 2016. Two members of the study team cofacilitated interviews, which were recorded and transcribed verbatim.
Coding and Data Analysis
To develop the code book, the study team, consisting of three qualitative researchers, independently read one focus group transcript and applied the TDF domains to the nurses’ perceptions of barriers to administration of VTE chemoprophylaxis.21-24 In addition to coding by domain, the study team also coded nursing perceptions as barriers or facilitators. The study team reviewed the coded transcript and reconciled any differences in coding. This process was repeated for a second transcript, and then all remaining transcripts were assigned to two out of three study team members for coding, with the entire study team meeting to reconcile any differences. If necessary, the team member who did not code a transcript acted as the tie-breaker if there were discrepancies in codes that could not be reconciled.
Once coding was completed, we identified the TDF domains that were most relevant to the administration of VTE chemoprophylaxis.16 Member checking (testing the analysis, interpretations, and conclusions with members of those groups from whom the data were originally obtained) was performed with the four clinical nursing coordinators and four nurse managers from the participating units to establish face validity of the themes identified from the focus group interviews.25
The study team used MaxQDA, V12 (Berlin, Germany) to support data coding and analysis.26 The Northwestern University institutional review board office deemed this project research on nonhuman-subjects because it focused on the process of providing VTE chemoprophylaxis and not about the patients themselves. The purpose of the study was explained at the beginning of each focus group, and nurses gave verbal consent to have the focus group recorded.
RESULTS
We conducted 14 focus groups with day and night shift nurses from five units (two medical and three surgical) at a single institution. All nurses invited to participate in a focus group agreed to participate. The data were coded and grouped by domain and identified as barriers or facilitators. The findings included below are for the domains most relevant to the provision of VTE prophylaxis. Table 2 provides illustrative verbatim quotes for each domain that was represented in the focus groups.
THEORETICAL DOMAINS FRAMEWORK DOMAINS
Knowledge
All interviewees recognized that providing some form of prophylaxis to mitigate the risk of a VTE event is essential. Some nurses stated that seeing a patient ambulating meant they would consider not administering prescribed chemoprophylaxis, while others would try to negotiate with patients by asking the patient to allow one dose of chemoprophylaxis prescribed two to three times daily because it was better than receiving no doses.
Environmental Context and Resources
Multiple barriers to providing optimal care were associated with the environmental context and a lack of resources. There was a lack of accessible, comprehensive, patient-centered education materials on VTE chemoprophylaxis to supplement a nurse’s explanation about the importance of chemoprophylaxis. Furthermore, many nurses cited the perceived patient pain of chemoprophylaxis injections as the main deterrent to patient compliance, especially subcutaneous heparin injections, which occur up to three times in 24 hours and often cause more pain at the site of injection than low-molecular-weight heparin. Nurses felt that transitioning patients from receiving subcutaneous heparin injections to receiving low-molecular-weight heparin could be a main driver to reduce patient refusals.
Skills
Nurses felt inadequately equipped to handle patient refusals. Many said that patient refusal of treatments was never discussed in nursing school. As a result, when patients refused treatments, the nurses did not know how to handle the situation. They felt that they lacked the tools and techniques to persuade the patient to comply.
Beliefs about Capabilities
Nurses did not know their own patient refusal rate or benchmarks of an acceptable refusal rate in contrast to one that is too high. Without this feedback, they were unable to assess their own behavior or performance related to providing VTE chemoprophylaxis.
DISCUSSION
Nurses play a critical role in providing VTE chemoprophylaxis to patients throughout their hospitalization. This study provided a unique opportunity to perform an in-depth, qualitative analysis of the barriers nurses face in providing patients with VTE chemoprophylaxis as part of their daily work caring for patients. We discovered several nursing-related barriers to the provision of VTE chemoprophylaxis, including lack of knowledge, resources, skill, and misconceptions of their capability to provide VTE chemoprophylaxis. We used a bottom-up approach by incorporating the voices of unit nurses, clinical coordinators, and nurse managers to understand potential barriers. Our findings brought to light the challenge of delivering standardized care in an area of care that is generally agreed upon, yet not fully followed. Some nurses display greater proficiency than others at communicating with patients who do not understand their risk for VTE and need for chemoprophylaxis. Furthermore, there is a pronounced misconception around the delivery of VTE chemoprophylaxis. Nurses have the inaccurate belief that even if ordered, chemoprophylaxis is not required. This misconception was widespread among nurses taking care of both medical and surgical patients. These factors appear to be modifiable targets for quality improvement and highlight the need for a skills-based education during the new hire onboarding process, as well as ongoing reeducation to ensure nursing staff have the skills to appropriately provide best-practice care for VTE chemoprophylaxis. Nurses felt ownership of the results of the qualitative evaluation because they were included in every aspect from the beginning.27 This sense of ownership will support future quality improvement efforts to develop a skills-based intervention to improve the provision of VTE chemoprophylaxis.18,27
This study has certain limitations. First, it was a qualitative study assessing nursing-related barriers to providing VTE chemoprophylaxis at a single institution, and the results cannot be generalized broadly. However, the techniques and results are transferable to other hospital settings and other clinical care situations. Thus, we believe that other institutions can utilize our methods and that similar lessons can be learned and applied. Furthermore, the validity of our study is bolstered by concordance between the results of this study and those of other studies conducted on the topic of provision of VTE prophylaxis by nurses.13-15,21 Other studies utilized observations and surveys to determine potential nurse-related barriers to the provision of VTE prophylaxis, such as lack of knowledge and the belief that the need for prophylaxis can be determined based on whether or not the patient is ambulating;13,14 however, by utilizing focus group interviews, we allowed nurses to speak in their own voices about their experiences with VTE prophylaxis, and we were able to delve deeper and identify additional barriers that emerged from discussions with nurses, such as the lack of skill and misconceptions of capability.28,29 Second, the study focused solely on nurses. Additional initiatives are underway to assess the roles of resident physicians, attending physicians, and patients in the provision of VTE prophylaxis.
Nursing-related barriers to the provision of VTE chemoprophylaxis include a lack of knowledge, resources, skills, and misconceptions of the consequences of missed elements of VTE prophylaxis. Future initiatives will focus on equipping nurses to have meaningful conversations with patients and engaging patients in their care through development of a multifaceted bundle of interventions. Furthermore, similar methods of qualitative inquiry will be used to identify the role of resident and attending physicians and patients in the provision of VTE chemoprophylaxis.
Acknowledgments
The authors thank Sonali Oberoi, Joanne Prinz, Nancy Tomaska, and Kate Paredes, as well as all the nurses who participated in focus group interviews for this study and the nurse managers and clinical coordinators who helped to schedule the focus group interviews.
Disclosures
The authors declare that they have no competing interests.
Funding
This study was funded by the Surgical Outcomes and Quality Improvement Center at Northwestern University.
1. Beckman MG, Hooper WC, Critchley SE, Ortel TL. Venous thromboembolism: a public health concern. Am J Prev Med. 2010;38(4):S495-S501. https://doi.org/10.1016/j.amepre.2009.12.017.
2. Falck-Ytter Y, Francis CW, Johanson NA, et al. Prevention of VTE in orthopedic surgery patients: Antithrombotic Therapy and Prevention of Thrombosis, 9th ed: American College of Chest Physicians evidence-based clinical practice guidelines. Chest. 2012;141(2):e278S-e325S. https://doi.org/10.1378/chest.11-2404.
3. Gould MK, Garcia DA, Wren SM, et al. Prevention of VTE in nonorthopedic surgical patients: antithrombotic therapy and prevention of thrombosis: American College of Chest Physicians evidence-based clinical practice guidelines. Chest. 2012;141(2):e227S-e277S. https://doi.org/10.1378/chest.11-2297.
4. Guyatt GH, Akl EA, Crowther M, et al. Executive summary: antithrombotic therapy and prevention of thrombosis: American College of Chest Physicians evidence-based clinical practice guidelines. Chest. 2012;141(2):7S-47S. https://doi.org/10.1378/chest.1412S3.
5. Office of the Surgeon General. National Heart L, and Blood Institute. The Surgeon General’s Call to Action to Prevent Deep Vein Thrombosis and Pulmonary Embolism. Rockville, MD; 2008.
6. Geerts WH, Pineo GF, Heit JA, et al. Prevention of venous thromboembolism: the Seventh ACCP Conference on Antithrombotic and Thrombolytic Therapy. Chest. 2004;126(3):338S-400S. https://doi.org/10.1378/chest.126.3_suppl.338S.
7. Haut ER, Lau BD, Kraus PS, et al. Preventability of hospital-acquired venous thromboembolism. JAMA Surg. 2015;150(9):912-915. https://doi.org/10.1001/jamasurg.2015.1340.
8. Kahn SR, Solymoss S, Lamping DL, Abenhaim L. Long-term outcomes after deep vein thrombosis: postphlebitic syndrome and quality of life. J Gen Intern Med. 2000;15(6):425-429. https://doi.org/10.1046/j.1525-1497.2000.06419.x.
9. Mahan CE, Holdsworth MT, Welch SM, Borrego M, Spyropoulos AC. Deep-vein thrombosis: a United States cost model for a preventable and costly adverse event. Thromb Haemost. 2011;106(3):405-415. https://doi.org/10.1160/TH11-02-0132.
10. Kinnier CV, Ju MH, Kmiecik T, et al. Development of a novel composite process measure for venous thromboembolism prophylaxis. Med Care. 2016;54(2):210-217. https://doi.org/10.1097/MLR.0000000000000474.
11. Schünemann HJ, Cushman M, Burnett AE, et al. American Society of Hematology 2018 guidelines for management of venous thromboembolism: prophylaxis for hospitalized and nonhospitalized medical patients. Blood Adv. 2018;2(22):3198-3225. https://doi.org/10.1182/bloodadvances.2018022954.
12. Lau BD, Streiff MB, Kraus PS, et al. Missed doses of venous thromboembolism (VTE) prophylaxis at community hospitals: cause for alarm. J Gen Intern Med. 2018;33(1):19-20. https://doi.org/10.1007/s11606-017-4203-y.
13. Elder S, Hobson DB, Rand CS, et al. Hidden barriers to delivery of pharmacological venous thromboembolism prophylaxis: the role of nursing beliefs and practices. J Patient Saf. 2016;12(2):63-68. https://doi.org/10.1097/PTS.0000000000000086.
14. Lee JA, Grochow D, Drake D, et al. Evaluation of hospital nurses’ perceived knowledge and practices of venous thromboembolism assessment and prevention. J Vasc Nurs. 2014;32(1):18-24. https://doi.org/10.1016/j.jvn.2013.06.001.
15. Shermock KM, Lau BD, Haut ER, et al. Patterns of non-administration of ordered doses of venous thromboembolism prophylaxis: implications for novel intervention strategies. PLOS ONE. 2013;8(6):e66311. https://doi.org/10.1371/journal.pone.0066311.
16. Lipworth W, Taylor N, Braithwaite J. Can the theoretical domains framework account for the implementation of clinical quality interventions? BMC Health Serv Res. 2013;13(1):530. https://doi.org/10.1186/1472-6963-13-530.
17. Taylor N, Lawton R, Moore S, et al. Collaborating with front-line healthcare professionals: the clinical and cost effectiveness of a theory based approach to the implementation of a national guideline. BMC Health Serv Res. 2014;14(1):648. https://doi.org/10.1186/s12913-014-0648-4.
18. Cane J, O’Connor D, Michie S. Validation of the theoretical domains framework for use in behaviour change and implementation research. Implement Sci. 2012;7(1):37. https://doi.org/10.1186/1748-5908-7-37.
19. Bogdan R, Biklen S. Qualitative Research for Education: an Introduction to Theory and Methods. Boston: Allyn & Bacon; 1992.
20. Creswell J. Research Design: Qualitative and Quantitative Approaches. Thousand Oaks, CA: Sage Publications; 1994.
21. Patton M. Qualitative Research & Evaluation Methods: Integrating Theory and Practice. 4th ed. Thousand Oaks, CA: SAGE Publications, Inc.; 2014.
22. Alexander KE, Brijnath B, Mazza D. Barriers and enablers to delivery of the Healthy Kids Check: an analysis informed by the theoretical domains framework and COM-B model. Implement Sci. 2014;9(1):60. https://doi.org/10.1186/1748-5908-9-60.
23. Birken SA, Presseau J, Ellis SD, Gerstel AA, Mayer DK. Potential determinants of health-care professionals’ use of survivorship care plans: a qualitative study using the theoretical domains framework. Implement Sci. 2014;9(1):167. https://doi.org/10.1186/s13012-014-0167-z.
24. Atkins L, Francis J, Islam R, et al. A guide to using the theoretical domains framework of behaviour change to investigate implementation problems. Implement Sci. 2017;12(1):77. https://doi.org/10.1186/s13012-017-0605-9.
25. Lincoln YS, Guba EG. Naturalistic Inquiry. Newbury Park, CA: Sage Publications; 1985.
26. Berlin G. MAXQDA, Software for Qualitative Data Analysis. VERBI Software – Consult. Sozialforschung GmbH [computer program]; 1989-2016.
27. Lipmanowicz H. Buy-in v. ownership. Liberating Structures. http://www.liberatingstructures.com/hl-articles/. Accessed July 5, 2019.
28. Morgan D. Why Should You Use Focus Groups? and what focus groups are (and are not). In: The Focus Group Guidebook. Thousand Oaks, CA: Sage Publications; 1998:9-15, 29-35.
29. Sofaer S. Qualitative methods: what are they and why use them? Health Serv Res. 1999;34(5):1101-1118.
© 2019 Society of Hospital Medicine
Leveraging the Outpatient Pharmacy to Reduce Medication Waste in Pediatric Asthma Hospitalizations
Asthma results in approximately 125,000 hospitalizations for children annually in the United States.1,2 The National Heart, Lung, and Blood Institute guidelines recommend that children with persistent asthma be treated with a daily controller medication, ie, an inhaled corticosteroid (ICS).3 Hospitalization for an asthma exacerbation provides an opportunity to optimize daily controller medications and improve disease self-management by providing access to medications and teaching appropriate use of complicated inhalation devices.
To reduce readmission4 by mitigating low rates of postdischarge filling of ICS prescriptions,5,6 a strategy of “meds-in-hand” was implemented at discharge. “Meds-in-hand” mitigates medication access as a barrier to adherence by ensuring that patients are discharged from the hospital with all required medications in hand, removing any barriers to filling their initial prescriptions.7 The Asthma Improvement Collaborative at Cincinnati Children’s Hospital Medical Center (CCHMC) previously applied quality improvement methodology to implement “meds-in-hand” as a key intervention in a broad strategy that successfully reduced asthma-specific utilization for the 30-day period following an asthma-related hospitalization of publicly insured children from 12% to 7%.8,9
At the onset of the work described in this manuscript, children hospitalized with an acute exacerbation of persistent asthma were most often treated with an ICS while inpatients in addition to a standard short course of oral systemic corticosteroids. Conceptually, inpatient administration of ICS provided the opportunity to teach effective device usage with each inpatient administration and to reinforce daily use of the ICS as part of the patient’s daily home medication regimen. However, a proportion of patients admitted for an asthma exacerbation were noted to receive more than one ICS inhaler during their admission, most commonly due to a change in dose or type of ICS. When this occurred, the initially dispensed inhaler was discarded despite weeks of potential doses remaining. While some hospitals preferentially dispense ICS devices marketed to institutions with fewer doses per device, our pharmacy primarily dispensed ICS devices identical to retail locations containing at least a one-month supply of medication. In addition to the wasted medication, this practice resulted in additional work by healthcare staff, unnecessary patient charges, and potentially contributed to confusion about the discharge medication regimen.
Our specific aim for this quality improvement study was to reduce the monthly percentage of admissions for an acute asthma exacerbation treated with >1 ICS from 7% to 4% over a six-month period.
METHODS
Context
CCHMC is a quaternary care pediatric health system with more than 600 inpatient beds and 800-900 inpatient admissions per year for acute asthma exacerbation. The Hospital Medicine service cares for patients with asthma on five clinical teams across two different campuses. Care teams are supervised by an attending physician and may include residents, fellows, or nurse practitioners. Patients hospitalized for an acute asthma exacerbation may receive a consult from the Asthma Center consult team, staffed by faculty from either the Pediatric Pulmonology or Allergy/Immunology divisions. Respiratory therapists (RTs) administer inhaled medications and provide asthma education.
Planning the Intervention
Our improvement team included physicians from Hospital Medicine and Pulmonary Medicine, an Asthma Education Coordinator, a Clinical Pharmacist, a Pediatric Chief Resident, and a clinical research coordinator. Initial interventions targeted a single resident team at the main campus before spreading improvement activities to all resident teams at the main campus and then the satellite campus by February 2017.
Development of our process map (Figure 1) revealed that the decision for ordering inpatient ICS treatment frequently occurred at admission. Subsequently, the care team or consulting team might make a change in the ICS to fine-tune the outpatient medication regimen given that admission for asthma often results from suboptimal chronic symptom control. Baseline analysis of changes in ICS orders revealed that 81% of ICS changes were associated with a step-up in therapy, defined as an increase in the daily dose of the ICS or the addition of a long-acting beta-agonist. The other common ICS adjustment, accounting for 17%, was a change in corticosteroid without a step-up in therapy, (ie, beclomethasone to fluticasone) that typically occurred near the end of the hospitalization to accommodate outpatient insurance formularies, independent of patient factors related to illness severity.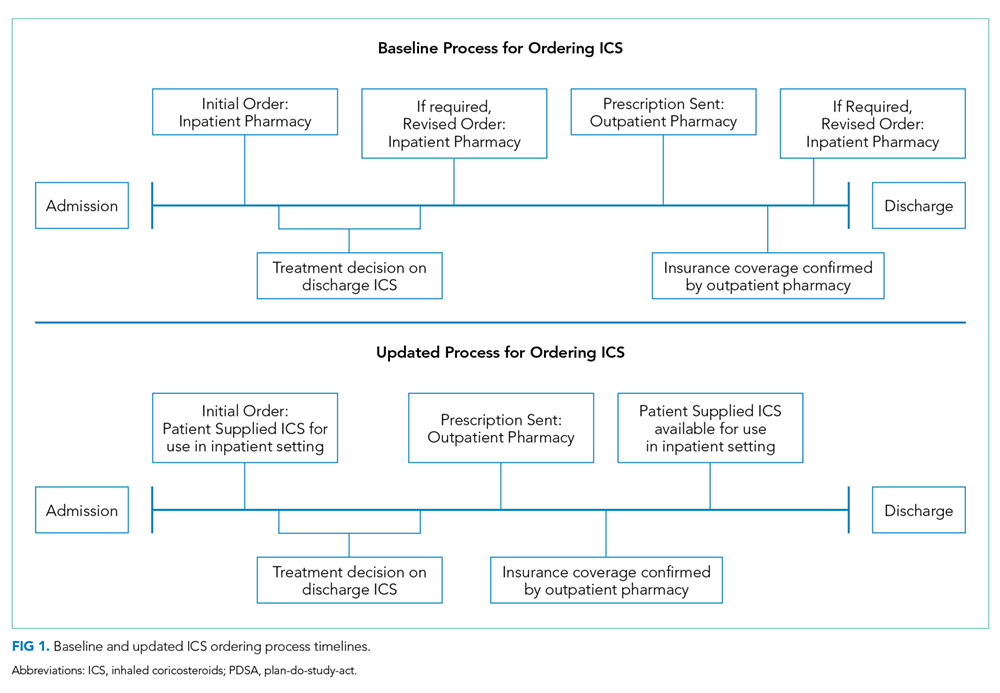
We utilized the model for improvement and sought to decrease the number of patients administered more than one ICS during an admission through a step-wise quality improvement approach, utilizing plan-do-study-act (PDSA) cycles.10 This study was reviewed and designated as not human subjects research by the CCHMC institutional review board.
Improvement Activities
We conceived key drivers or domains that would be necessary to address to effect change. Key drivers included a standardized process for delayed initiation of ICS and confirmation of outpatient insurance prescription drug coverage, prescriber education, and real-time failure notification.
PDSA Interventions
PDSA 1 & 2: Standardized Process for Initiation of ICS
Our initial tests of change targeted the timing of when an ICS was ordered during hospitalization for an asthma exacerbation. Providers were instructed to delay ordering an ICS until the patient’s albuterol treatments were spaced to every three hours and to include a standardized communication prompt within the albuterol order. The prompt instructed the RT to contact the provider once the patient’s albuterol treatments were spaced to every three hours and ask for an ICS order, if appropriate. This intervention was abandoned because it did not reliably occur.
The subsequent intervention delayed the start of ICS treatment by using a PRN indication advising that the ICS was to be administered once the patient’s albuterol treatments were spaced to every three hours. However, after an error resulted in the PRN indication being included on a discharge prescription for an ICS, the PRN indication was abandoned. Subsequent work to develop a standardized process for delayed initiation of ICS occurred as part of the workflow to address the confirmation of outpatient formulary coverage as described next.
PDSA 3: Prioritize the Use of the Institution’s Outpatient Pharmacy
Medication changes that occurred because of outpatient insurance formulary denials were a unique challenge; they required a medication change after the discharge treatment plan had been finalized, and a prescription was already submitted to the outpatient pharmacy. In addition, neither our inpatient electronic medical record nor our inpatient hospital pharmacy has access to decision support tools that incorporate outpatient prescription formulary coverage. Alternatively, outpatient pharmacies have a standard workflow that routinely confirms insurance coverage before dispensing medication. The institutional policy was modified to allow for the inpatient administration of patient-supplied medications, pursuant to an inpatient order. Patient-supplied medications include those brought from home or those supplied by the outpatient pharmacy.
Subsequently, we developed a standardized process to confirm outpatient prescription drug coverage by using our hospital-based outpatient pharmacy to dispense ICS for inpatient treatment and asthma education. This new workflow included placing an order for an ICS at admission as a patient-supplied medication with an administration comment to “please administer once available from the outpatient pharmacy” (Figure 1). Then, once the discharge medication plan is finalized, the prescription is submitted to the outpatient pharmacy. Following verification of insurance coverage, the outpatient pharmacy dispenses the ICS, allowing it to be used for patient education and inpatient administration. If the patient is ineligible to have their prescription filled by the outpatient pharmacy for reasons other than formulary coverage, the ICS is dispensed from the hospital inpatient pharmacy as per the previous standard workflow. Inpatient ICS inhalers are then relabeled for home use per the existing practice to support medications-in-hand.
Further workflow improvements occurred following the development of an algorithm to help the outpatient pharmacy contact the correct inpatient team, and augmentation of the medication delivery process included notification of the RT when the ICS was delivered to the inpatient unit.
PDSA 4: Prescriber Education
Prescribers received education regarding PDSA interventions before testing and throughout the improvement cycle. Education sessions included informal coaching by the Asthma Education Coordinator, e-mail reminders containing screenshots of the ordering process, and formal didactic sessions for ordering providers. The Asthma Education Coordinator also provided education to the nursing and respiratory therapy staff regarding the implemented process and workflow changes.
PDSA 5: Real-Time Failure Notification
To supplement education for the complicated process change, the improvement team utilized a decision support tool (Vigilanz Corp., Chicago, IL) linked to EMR data to provide notification of real-time process failures. When a patient with an admission diagnosis of asthma had a prescription for an ICS verified and dispensed by the inpatient pharmacy, an automated message with relevant patient information would be sent to a member of the improvement team. Following a brief chart review, directed feedback could be offered to the ordering provider, allowing the prescription to be redirected to the outpatient pharmacy.
Study of the Improvement
Patients of all ages, with the International Classification of Diseases, Ninth Revision, and Tenth Revision codes for asthma (493.xx or J45.xx) were included in data collection and analysis if they were treated by the Hospital Medicine service, as the first inpatient service or after transfer from the ICU, and prescribed an ICS with or without a long-acting beta-agonist. Data were collected retrospectively and aggregated monthly. The baseline period was from January 2015 through October 2016. The intervention period was from November 2016 through March 2018. The prolonged baseline and study periods were utilized to understand the seasonal nature of asthma exacerbations.
Measures
Our primary outcome measure was defined as the monthly number of patients admitted to Hospital Medicine for an acute asthma exacerbation administered more than one ICS divided by the total number of asthma patients administered at least one dose of an ICS (patient-supplied or dispensed from the inpatient pharmacy). A full list of ICS is included in the appendix Table.
A secondary process measure approximated our adherence to obtaining ICS from the outpatient pharmacy for inpatient use. All medications administered during hospitalization are documented in the medication administration report. However, only medications dispensed from the inpatient pharmacy are associated with a patient charge. Patient-supplied medications, including those dispensed from the hospital outpatient pharmacy, are not associated with an inpatient charge. Therefore, the secondary process measure was defined as the monthly number of asthma patients administered an ICS not associated with an inpatient charge divided by the total number of asthma patients administered an ICS.
A cost outcome measure was developed to track changes in the average cost of an ICS included on inpatient bills during hospitalization for an asthma exacerbation. This outcome measure was defined as the total monthly cost, using the average wholesale price, of the ICS included on the inpatient bill for an asthma exacerbation, divided by the total number of asthma patients administered at least one dose of an ICS (patient supplied or dispensed from the inpatient pharmacy).
Our a priori intent was to reduce ICS medication waste while maintaining a highly reliable system that included inpatient administration and education with ICS devices and maintain our medications-in-hand practice. A balancing measure was developed to monitor the reliability of inpatient administration of ICS. It was defined as the monthly number of patients who received a discharge prescription for an ICS and were administered an ICS while an inpatient divided by the total number of asthma patients with a discharge prescription for an ICS.
Analysis
Measures were evaluated using statistical process control charts and special cause variation was determined by previously established rules. Our primary, secondary, and balancing measures were all evaluated using a p-chart with variable subgroup size. The cost outcome measure was evaluated using an X-bar S control chart.11-13
RESULTS
Primary Outcome Measure
During the baseline period, 7.4% of patients admitted to Hospital Medicine for an acute asthma exacerbation were administered more than one ICS, ranging from 0%-20% of patients per month (Figure 2). Following the start of our interventions, we met criteria for special cause allowing adjustment of the centerline.13 The mean percentage of patients receiving more than one ICS decreased from 7.4% to 0.7%. Figure 2 includes the n-value displayed each month and represents all patients admitted to the Hospital Medicine service with an asthma exacerbation who were administered at least one ICS.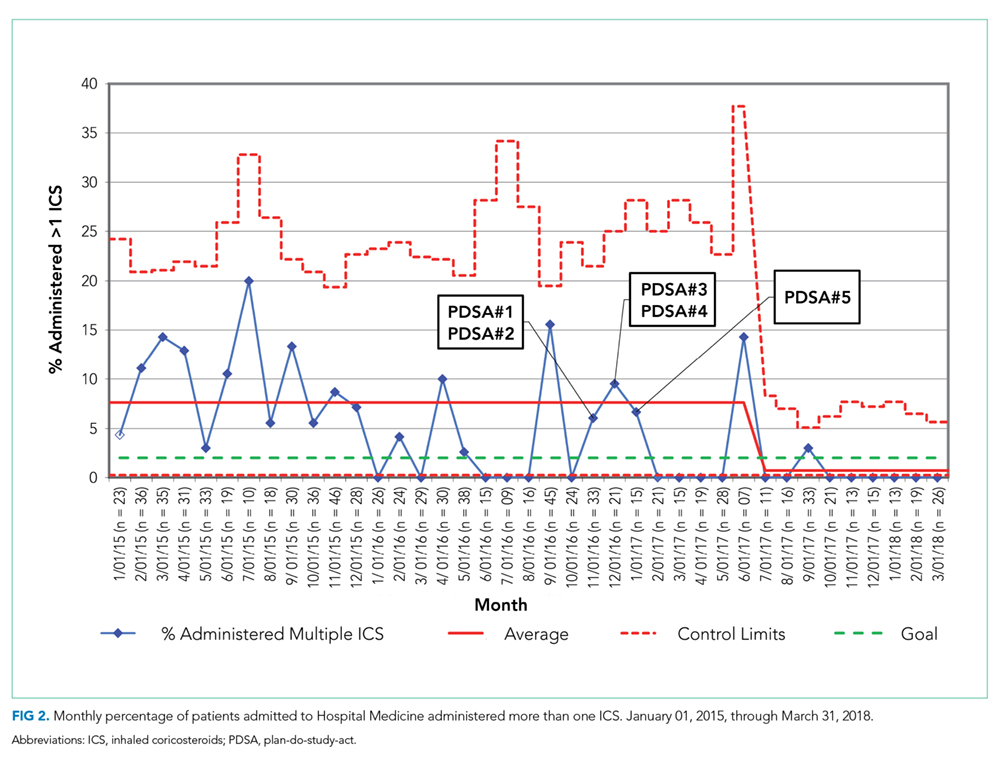
Secondary Process Measure
During the baseline period, there were only rare occurrences (less than 1%) of a patient-supplied ICS being administered during an asthma admission. Following the start of our intervention period, the frequency of inpatient administration of patient-supplied ICS showed a rapid increase and met rules for special cause with an increase in the mean percent from 0.7% to 50% (Figure 3). The n-value displayed each month represents all patients admitted to the Hospital Medicine service for an asthma exacerbation administered at least one ICS.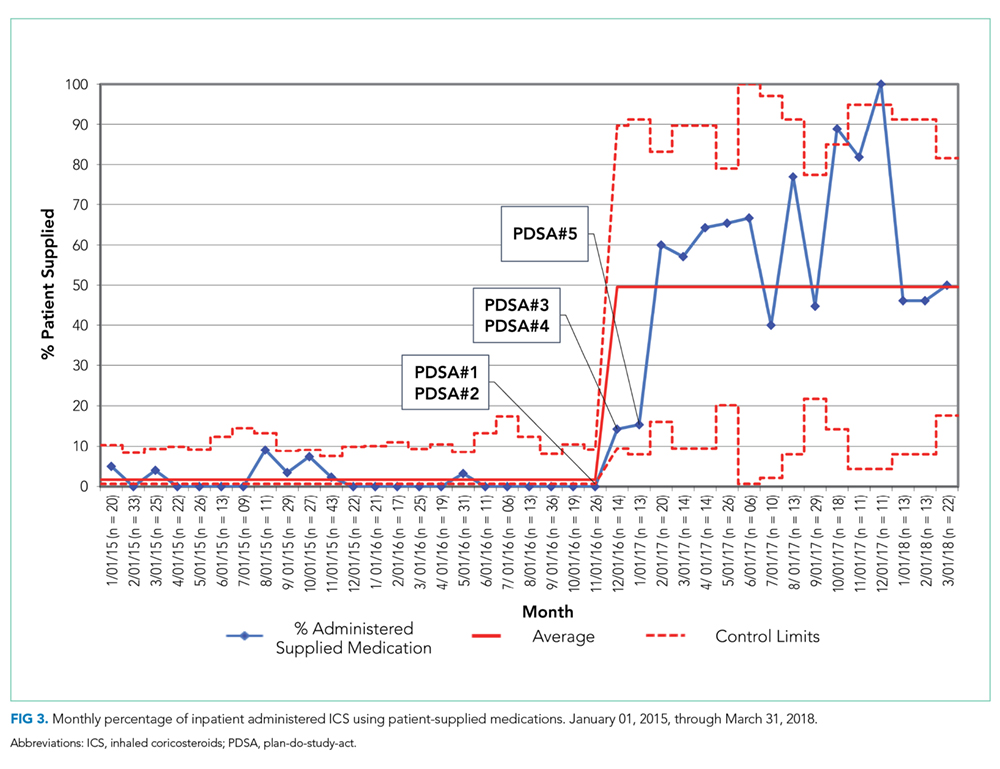
Cost Outcome Measure
The average cost of an ICS billed during hospitalization for an acute asthma exacerbation was $236.57 per ICS during the baseline period. After the intervention period, the average inpatient cost for ICS decreased by 62% to $90.25 per ICS (Figure 4).
Balancing Measure
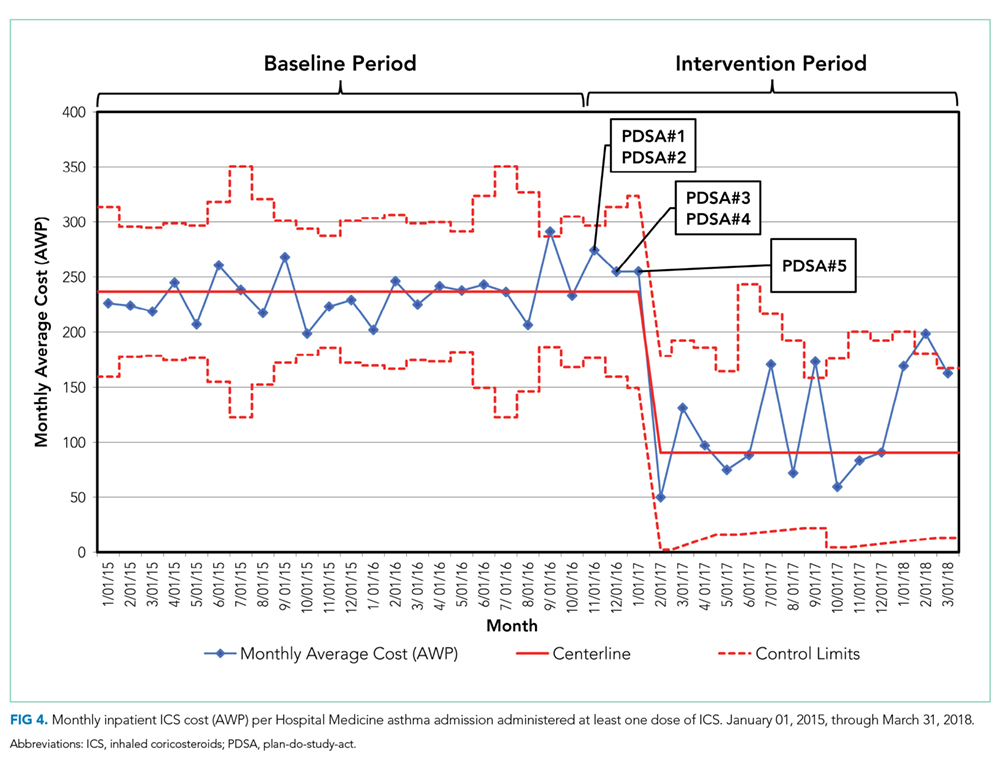
DISCUSSION
Our team reduced the monthly percent of children hospitalized with an acute asthma exacerbation administered more than one ICS from 7.4% to 0.7% after implementation of a new workflow process for ordering ICS utilizing the hospital-based outpatient pharmacy. The new workflow delayed ordering and administration of the initial inpatient ICS treatment, allowing time to consider a step-up in therapy. The brief delay in initiating ICS is not expected to have clinical consequence given the concomitant treatment with systemic corticosteroids. In addition, the outpatient pharmacy was utilized to verify insurance coverage reliably prior to dispensing ICS, reducing medication waste, and discharge delays due to outpatient medication formulary conflicts.
Our hospital’s previous approach to inpatient asthma care resulted in a highly reliable process to ensure patients were discharged with medications-in-hand as part of a broader system that effectively decreased reutilization. However, the previous process inadvertently resulted in medication waste. This waste included nearly full inhalers being discarded, additional work by the healthcare team (ordering providers, pharmacists, and RTs), and unnecessary patient charges.
While the primary driver of our decision to use the outpatient pharmacy was to adjudicate insurance prescription coverage reliably to prevent waste, this change likely resulted in a financial benefit to patients. The average cost per asthma admission of an inpatient billed for ICS using the average wholesale price, decreased by 62% following our interventions. The decrease in cost was primarily driven by using patient-supplied medications, including prescriptions newly filled by the on-site outpatient pharmacy, whose costs were not captured in this measure. While our secondary measure may underestimate the total expense incurred by families for an ICS, families likely receive their medications at a lower cost from the outpatient pharmacy than if the ICS was provided by an inpatient pharmacy. The average wholesale price is not what families are charged or pay for medications, partly due to differences in overhead costs that result in inpatient pharmacies having significantly higher charges than outpatient pharmacies. In addition, the 6.7% absolute reduction of our primary measure resulted in direct savings by reducing inpatient medication waste. Our process results in 67 fewer wasted ICS devices ($15,960) per 1,000 admissions for asthma exacerbation, extrapolated using the average cost ($238.20, average wholesale price) of each ICS during the baseline period.
Our quality improvement study had several limitations. (1) The interventions occurred at a single center with an established culture that embraces quality improvement, which may limit the generalizability of the work. (2) Our process verified insurance coverage with a hospital-based outpatient pharmacy. Some ICS prescriptions continued to be dispensed from the inpatient pharmacy, limiting our ability to verify insurance coverage. Local factors, including regulatory restrictions and delivery requirements, may limit the generalizability of using an outpatient pharmacy in this manner. (3) We achieved our goal of decreasing medication waste, but our a priori goal was to maintain our commitment to our established practice of interactive patient education with an ICS device as well as medications-in-hand at time of discharge. Our balancing measure showed a decrease in the percent of patients with a discharge prescription for an ICS who also received an inpatient dose of that ICS. This implies a decreased fidelity in our previously established education protocols. We had postulated that this occurred when the patient-supplied medication arrived on the day of discharge, but not close to when the medication was scheduled on the medication administration report, preventing administration. However, this is not a direct measure of patients receiving medications-in-hand or interactive medication education. Both may have occurred without administration of the ICS. (4) Despite a hospital culture that embraces quality improvement, this project required a significant change in the workflow that required considerable education at the time of implementation to integrate the new process reliably. However, once the process was in place, we have been able to sustain our improvement with limited educational investment.
CONCLUSIONS
Implementation of a new process for ordering ICS that emphasized delaying treatment until all necessary information was available and using an outpatient pharmacy to confirm insurance formulary coverage reduced the waste associated with more than one ICS being prescribed during a single admission.
Acknowledgments
The authors thank Sally Pope, MPH and Dr. Michael Carlisle, MD for their contribution to the quality improvement project. Thank you to Drs. Karen McDowell, MD and Carolyn Kercsmar, MD for advisement of our quality improvement project.
The authors appreciate the following individuals for their invaluable contributions. Dr. Hoefgen conceptualized and designed the study, was a member of the primary improvement team, carried out initial analysis, drafted the initial manuscript, and reviewed and revised the manuscript. Drs. Jones and Torres Garcia, and Mr. Hare were members of the primary improvement team who contributed to the design of the quality improvement study and interventions, ongoing data interpretation, and critically reviewed the manuscript. Dr. Courter contributed to the conceptualization and designed the study, was a member of the primary improvement team, designed data collection instruments, and critically reviewed and revised the manuscript. Dr. Simmons conceptualized and designed the study, critically reviewed the manuscript for important intellectual content, and reviewed and revised the manuscript. All authors approved the final manuscript as submitted and agree to be accountable for all aspects of the work.
Disclaimer
The information or content and conclusions are those of the author and should not be construed as the official position or policy of, nor should any endorsements be inferred by the BHPR, HRSA, DHHS, or the U.S. Government.
1. Akinbami LJ, Simon AE, Rossen LM. Changing trends in asthma prevalence among children. Pediatrics. 2016;137(1):e20152354. https://doi.org/10.1542/peds.2015-2354.
2. HCUP Databases. Healthcare Cost and Utilization Project (HCUP). www.hcup.us.ahrq.gov/kidoverview.jsp. Published 2016. Accessed September 14, 2016.
3. NHLBI. Expert Panel Report 3 (EPR-3): Guidelines for the diagnosis and management of asthma–summary report 2007. J Allergy Clin Immunol. 2007;120(5):S94-S138. https://doi.org/10.1016/j.jaci.2007.09.029.
4. Kenyon CC, Rubin DM, Zorc JJ, Mohamad Z, Faerber JA, Feudtner C. Childhood asthma hospital discharge medication fills and risk of subsequent readmission. J Pediatr. 2015;166(5):1121-1127. https://doi.org/10.1016/j.jpeds.2014.12.019.
5. Bollinger ME, Mudd KE, Boldt A, Hsu VD, Tsoukleris MG, Butz AM. Prescription fill patterns in underserved children with asthma receiving subspecialty care. Ann Allergy Asthma Immunol. 2013;111(3):185-189. https://doi.org/10.1016/j.anai.2013.06.009.
6. Cooper WO, Hickson GB. Corticosteroid prescription filling for children covered by Medicaid following an emergency department visit or a hospitalization for asthma. Arch Pediatr Adolesc Med. 2001;155(10):1111-1115. https://doi.org/10.1001/archpedi.155.10.1111.
7. Hatoun J, Bair-Merritt M, Cabral H, Moses J. Increasing medication possession at discharge for patients with asthma: the Meds-in-Hand Project. Pediatrics. 2016;137(3):e20150461-e20150461. https://doi.org/10.1542/peds.2015-0461.
8. Kercsmar CM, Beck AF, Sauers-Ford H, et al. Association of an asthma improvement collaborative with health care utilization in medicaid-insured pediatric patients in an urban community. JAMA Pediatr. 2017;171(11):1072-1080. https://doi.org/10.1001/jamapediatrics.2017.2600.
9. Sauers HS, Beck AF, Kahn RS, Simmons JM. Increasing recruitment rates in an inpatient clinical research study using quality improvement methods. Hosp Pediatr. 2014;4(6):335-341. https://doi.org/10.1542/hpeds.2014-0072.
10. Langley GJ, Moen R, Nolan KM, Nolan TW, Norman CL, Provost LP. The Improvement Guide: A Practical Approach to Enhancing Organizational Performance. Hoboken: John Wiley & Sons, Inc.; 2009.
11. Benneyan JC, Lloyd RC, Plsek PE. Statistical process control as a tool for research and healthcare improvement. Qual Saf Health Care. 2003;12(6):458-464. https://doi.org/10.1136/qhc.12.6.458.
12. Mohammed MA, Panesar JS, Laney DB, Wilson R. Statistical process control charts for attribute data involving very large sample sizes: a review of problems and solutions. BMJ Qual Saf. 2013;22(4):362-368. https://doi.org/10.1136/bmjqs-2012-001373.
13. Moen R, Nolan T, Provost L. Quality Improvement through Planned Experimentation. 2nd ed. New York City: McGraw-Hill Professional; 1998.
Asthma results in approximately 125,000 hospitalizations for children annually in the United States.1,2 The National Heart, Lung, and Blood Institute guidelines recommend that children with persistent asthma be treated with a daily controller medication, ie, an inhaled corticosteroid (ICS).3 Hospitalization for an asthma exacerbation provides an opportunity to optimize daily controller medications and improve disease self-management by providing access to medications and teaching appropriate use of complicated inhalation devices.
To reduce readmission4 by mitigating low rates of postdischarge filling of ICS prescriptions,5,6 a strategy of “meds-in-hand” was implemented at discharge. “Meds-in-hand” mitigates medication access as a barrier to adherence by ensuring that patients are discharged from the hospital with all required medications in hand, removing any barriers to filling their initial prescriptions.7 The Asthma Improvement Collaborative at Cincinnati Children’s Hospital Medical Center (CCHMC) previously applied quality improvement methodology to implement “meds-in-hand” as a key intervention in a broad strategy that successfully reduced asthma-specific utilization for the 30-day period following an asthma-related hospitalization of publicly insured children from 12% to 7%.8,9
At the onset of the work described in this manuscript, children hospitalized with an acute exacerbation of persistent asthma were most often treated with an ICS while inpatients in addition to a standard short course of oral systemic corticosteroids. Conceptually, inpatient administration of ICS provided the opportunity to teach effective device usage with each inpatient administration and to reinforce daily use of the ICS as part of the patient’s daily home medication regimen. However, a proportion of patients admitted for an asthma exacerbation were noted to receive more than one ICS inhaler during their admission, most commonly due to a change in dose or type of ICS. When this occurred, the initially dispensed inhaler was discarded despite weeks of potential doses remaining. While some hospitals preferentially dispense ICS devices marketed to institutions with fewer doses per device, our pharmacy primarily dispensed ICS devices identical to retail locations containing at least a one-month supply of medication. In addition to the wasted medication, this practice resulted in additional work by healthcare staff, unnecessary patient charges, and potentially contributed to confusion about the discharge medication regimen.
Our specific aim for this quality improvement study was to reduce the monthly percentage of admissions for an acute asthma exacerbation treated with >1 ICS from 7% to 4% over a six-month period.
METHODS
Context
CCHMC is a quaternary care pediatric health system with more than 600 inpatient beds and 800-900 inpatient admissions per year for acute asthma exacerbation. The Hospital Medicine service cares for patients with asthma on five clinical teams across two different campuses. Care teams are supervised by an attending physician and may include residents, fellows, or nurse practitioners. Patients hospitalized for an acute asthma exacerbation may receive a consult from the Asthma Center consult team, staffed by faculty from either the Pediatric Pulmonology or Allergy/Immunology divisions. Respiratory therapists (RTs) administer inhaled medications and provide asthma education.
Planning the Intervention
Our improvement team included physicians from Hospital Medicine and Pulmonary Medicine, an Asthma Education Coordinator, a Clinical Pharmacist, a Pediatric Chief Resident, and a clinical research coordinator. Initial interventions targeted a single resident team at the main campus before spreading improvement activities to all resident teams at the main campus and then the satellite campus by February 2017.
Development of our process map (Figure 1) revealed that the decision for ordering inpatient ICS treatment frequently occurred at admission. Subsequently, the care team or consulting team might make a change in the ICS to fine-tune the outpatient medication regimen given that admission for asthma often results from suboptimal chronic symptom control. Baseline analysis of changes in ICS orders revealed that 81% of ICS changes were associated with a step-up in therapy, defined as an increase in the daily dose of the ICS or the addition of a long-acting beta-agonist. The other common ICS adjustment, accounting for 17%, was a change in corticosteroid without a step-up in therapy, (ie, beclomethasone to fluticasone) that typically occurred near the end of the hospitalization to accommodate outpatient insurance formularies, independent of patient factors related to illness severity.
We utilized the model for improvement and sought to decrease the number of patients administered more than one ICS during an admission through a step-wise quality improvement approach, utilizing plan-do-study-act (PDSA) cycles.10 This study was reviewed and designated as not human subjects research by the CCHMC institutional review board.
Improvement Activities
We conceived key drivers or domains that would be necessary to address to effect change. Key drivers included a standardized process for delayed initiation of ICS and confirmation of outpatient insurance prescription drug coverage, prescriber education, and real-time failure notification.
PDSA Interventions
PDSA 1 & 2: Standardized Process for Initiation of ICS
Our initial tests of change targeted the timing of when an ICS was ordered during hospitalization for an asthma exacerbation. Providers were instructed to delay ordering an ICS until the patient’s albuterol treatments were spaced to every three hours and to include a standardized communication prompt within the albuterol order. The prompt instructed the RT to contact the provider once the patient’s albuterol treatments were spaced to every three hours and ask for an ICS order, if appropriate. This intervention was abandoned because it did not reliably occur.
The subsequent intervention delayed the start of ICS treatment by using a PRN indication advising that the ICS was to be administered once the patient’s albuterol treatments were spaced to every three hours. However, after an error resulted in the PRN indication being included on a discharge prescription for an ICS, the PRN indication was abandoned. Subsequent work to develop a standardized process for delayed initiation of ICS occurred as part of the workflow to address the confirmation of outpatient formulary coverage as described next.
PDSA 3: Prioritize the Use of the Institution’s Outpatient Pharmacy
Medication changes that occurred because of outpatient insurance formulary denials were a unique challenge; they required a medication change after the discharge treatment plan had been finalized, and a prescription was already submitted to the outpatient pharmacy. In addition, neither our inpatient electronic medical record nor our inpatient hospital pharmacy has access to decision support tools that incorporate outpatient prescription formulary coverage. Alternatively, outpatient pharmacies have a standard workflow that routinely confirms insurance coverage before dispensing medication. The institutional policy was modified to allow for the inpatient administration of patient-supplied medications, pursuant to an inpatient order. Patient-supplied medications include those brought from home or those supplied by the outpatient pharmacy.
Subsequently, we developed a standardized process to confirm outpatient prescription drug coverage by using our hospital-based outpatient pharmacy to dispense ICS for inpatient treatment and asthma education. This new workflow included placing an order for an ICS at admission as a patient-supplied medication with an administration comment to “please administer once available from the outpatient pharmacy” (Figure 1). Then, once the discharge medication plan is finalized, the prescription is submitted to the outpatient pharmacy. Following verification of insurance coverage, the outpatient pharmacy dispenses the ICS, allowing it to be used for patient education and inpatient administration. If the patient is ineligible to have their prescription filled by the outpatient pharmacy for reasons other than formulary coverage, the ICS is dispensed from the hospital inpatient pharmacy as per the previous standard workflow. Inpatient ICS inhalers are then relabeled for home use per the existing practice to support medications-in-hand.
Further workflow improvements occurred following the development of an algorithm to help the outpatient pharmacy contact the correct inpatient team, and augmentation of the medication delivery process included notification of the RT when the ICS was delivered to the inpatient unit.
PDSA 4: Prescriber Education
Prescribers received education regarding PDSA interventions before testing and throughout the improvement cycle. Education sessions included informal coaching by the Asthma Education Coordinator, e-mail reminders containing screenshots of the ordering process, and formal didactic sessions for ordering providers. The Asthma Education Coordinator also provided education to the nursing and respiratory therapy staff regarding the implemented process and workflow changes.
PDSA 5: Real-Time Failure Notification
To supplement education for the complicated process change, the improvement team utilized a decision support tool (Vigilanz Corp., Chicago, IL) linked to EMR data to provide notification of real-time process failures. When a patient with an admission diagnosis of asthma had a prescription for an ICS verified and dispensed by the inpatient pharmacy, an automated message with relevant patient information would be sent to a member of the improvement team. Following a brief chart review, directed feedback could be offered to the ordering provider, allowing the prescription to be redirected to the outpatient pharmacy.
Study of the Improvement
Patients of all ages, with the International Classification of Diseases, Ninth Revision, and Tenth Revision codes for asthma (493.xx or J45.xx) were included in data collection and analysis if they were treated by the Hospital Medicine service, as the first inpatient service or after transfer from the ICU, and prescribed an ICS with or without a long-acting beta-agonist. Data were collected retrospectively and aggregated monthly. The baseline period was from January 2015 through October 2016. The intervention period was from November 2016 through March 2018. The prolonged baseline and study periods were utilized to understand the seasonal nature of asthma exacerbations.
Measures
Our primary outcome measure was defined as the monthly number of patients admitted to Hospital Medicine for an acute asthma exacerbation administered more than one ICS divided by the total number of asthma patients administered at least one dose of an ICS (patient-supplied or dispensed from the inpatient pharmacy). A full list of ICS is included in the appendix Table.
A secondary process measure approximated our adherence to obtaining ICS from the outpatient pharmacy for inpatient use. All medications administered during hospitalization are documented in the medication administration report. However, only medications dispensed from the inpatient pharmacy are associated with a patient charge. Patient-supplied medications, including those dispensed from the hospital outpatient pharmacy, are not associated with an inpatient charge. Therefore, the secondary process measure was defined as the monthly number of asthma patients administered an ICS not associated with an inpatient charge divided by the total number of asthma patients administered an ICS.
A cost outcome measure was developed to track changes in the average cost of an ICS included on inpatient bills during hospitalization for an asthma exacerbation. This outcome measure was defined as the total monthly cost, using the average wholesale price, of the ICS included on the inpatient bill for an asthma exacerbation, divided by the total number of asthma patients administered at least one dose of an ICS (patient supplied or dispensed from the inpatient pharmacy).
Our a priori intent was to reduce ICS medication waste while maintaining a highly reliable system that included inpatient administration and education with ICS devices and maintain our medications-in-hand practice. A balancing measure was developed to monitor the reliability of inpatient administration of ICS. It was defined as the monthly number of patients who received a discharge prescription for an ICS and were administered an ICS while an inpatient divided by the total number of asthma patients with a discharge prescription for an ICS.
Analysis
Measures were evaluated using statistical process control charts and special cause variation was determined by previously established rules. Our primary, secondary, and balancing measures were all evaluated using a p-chart with variable subgroup size. The cost outcome measure was evaluated using an X-bar S control chart.11-13
RESULTS
Primary Outcome Measure
During the baseline period, 7.4% of patients admitted to Hospital Medicine for an acute asthma exacerbation were administered more than one ICS, ranging from 0%-20% of patients per month (Figure 2). Following the start of our interventions, we met criteria for special cause allowing adjustment of the centerline.13 The mean percentage of patients receiving more than one ICS decreased from 7.4% to 0.7%. Figure 2 includes the n-value displayed each month and represents all patients admitted to the Hospital Medicine service with an asthma exacerbation who were administered at least one ICS.
Secondary Process Measure
During the baseline period, there were only rare occurrences (less than 1%) of a patient-supplied ICS being administered during an asthma admission. Following the start of our intervention period, the frequency of inpatient administration of patient-supplied ICS showed a rapid increase and met rules for special cause with an increase in the mean percent from 0.7% to 50% (Figure 3). The n-value displayed each month represents all patients admitted to the Hospital Medicine service for an asthma exacerbation administered at least one ICS.
Cost Outcome Measure
The average cost of an ICS billed during hospitalization for an acute asthma exacerbation was $236.57 per ICS during the baseline period. After the intervention period, the average inpatient cost for ICS decreased by 62% to $90.25 per ICS (Figure 4).
Balancing Measure
DISCUSSION
Our team reduced the monthly percent of children hospitalized with an acute asthma exacerbation administered more than one ICS from 7.4% to 0.7% after implementation of a new workflow process for ordering ICS utilizing the hospital-based outpatient pharmacy. The new workflow delayed ordering and administration of the initial inpatient ICS treatment, allowing time to consider a step-up in therapy. The brief delay in initiating ICS is not expected to have clinical consequence given the concomitant treatment with systemic corticosteroids. In addition, the outpatient pharmacy was utilized to verify insurance coverage reliably prior to dispensing ICS, reducing medication waste, and discharge delays due to outpatient medication formulary conflicts.
Our hospital’s previous approach to inpatient asthma care resulted in a highly reliable process to ensure patients were discharged with medications-in-hand as part of a broader system that effectively decreased reutilization. However, the previous process inadvertently resulted in medication waste. This waste included nearly full inhalers being discarded, additional work by the healthcare team (ordering providers, pharmacists, and RTs), and unnecessary patient charges.
While the primary driver of our decision to use the outpatient pharmacy was to adjudicate insurance prescription coverage reliably to prevent waste, this change likely resulted in a financial benefit to patients. The average cost per asthma admission of an inpatient billed for ICS using the average wholesale price, decreased by 62% following our interventions. The decrease in cost was primarily driven by using patient-supplied medications, including prescriptions newly filled by the on-site outpatient pharmacy, whose costs were not captured in this measure. While our secondary measure may underestimate the total expense incurred by families for an ICS, families likely receive their medications at a lower cost from the outpatient pharmacy than if the ICS was provided by an inpatient pharmacy. The average wholesale price is not what families are charged or pay for medications, partly due to differences in overhead costs that result in inpatient pharmacies having significantly higher charges than outpatient pharmacies. In addition, the 6.7% absolute reduction of our primary measure resulted in direct savings by reducing inpatient medication waste. Our process results in 67 fewer wasted ICS devices ($15,960) per 1,000 admissions for asthma exacerbation, extrapolated using the average cost ($238.20, average wholesale price) of each ICS during the baseline period.
Our quality improvement study had several limitations. (1) The interventions occurred at a single center with an established culture that embraces quality improvement, which may limit the generalizability of the work. (2) Our process verified insurance coverage with a hospital-based outpatient pharmacy. Some ICS prescriptions continued to be dispensed from the inpatient pharmacy, limiting our ability to verify insurance coverage. Local factors, including regulatory restrictions and delivery requirements, may limit the generalizability of using an outpatient pharmacy in this manner. (3) We achieved our goal of decreasing medication waste, but our a priori goal was to maintain our commitment to our established practice of interactive patient education with an ICS device as well as medications-in-hand at time of discharge. Our balancing measure showed a decrease in the percent of patients with a discharge prescription for an ICS who also received an inpatient dose of that ICS. This implies a decreased fidelity in our previously established education protocols. We had postulated that this occurred when the patient-supplied medication arrived on the day of discharge, but not close to when the medication was scheduled on the medication administration report, preventing administration. However, this is not a direct measure of patients receiving medications-in-hand or interactive medication education. Both may have occurred without administration of the ICS. (4) Despite a hospital culture that embraces quality improvement, this project required a significant change in the workflow that required considerable education at the time of implementation to integrate the new process reliably. However, once the process was in place, we have been able to sustain our improvement with limited educational investment.
CONCLUSIONS
Implementation of a new process for ordering ICS that emphasized delaying treatment until all necessary information was available and using an outpatient pharmacy to confirm insurance formulary coverage reduced the waste associated with more than one ICS being prescribed during a single admission.
Acknowledgments
The authors thank Sally Pope, MPH and Dr. Michael Carlisle, MD for their contribution to the quality improvement project. Thank you to Drs. Karen McDowell, MD and Carolyn Kercsmar, MD for advisement of our quality improvement project.
The authors appreciate the following individuals for their invaluable contributions. Dr. Hoefgen conceptualized and designed the study, was a member of the primary improvement team, carried out initial analysis, drafted the initial manuscript, and reviewed and revised the manuscript. Drs. Jones and Torres Garcia, and Mr. Hare were members of the primary improvement team who contributed to the design of the quality improvement study and interventions, ongoing data interpretation, and critically reviewed the manuscript. Dr. Courter contributed to the conceptualization and designed the study, was a member of the primary improvement team, designed data collection instruments, and critically reviewed and revised the manuscript. Dr. Simmons conceptualized and designed the study, critically reviewed the manuscript for important intellectual content, and reviewed and revised the manuscript. All authors approved the final manuscript as submitted and agree to be accountable for all aspects of the work.
Disclaimer
The information or content and conclusions are those of the author and should not be construed as the official position or policy of, nor should any endorsements be inferred by the BHPR, HRSA, DHHS, or the U.S. Government.
1. Akinbami LJ, Simon AE, Rossen LM. Changing trends in asthma prevalence among children. Pediatrics. 2016;137(1):e20152354. https://doi.org/10.1542/peds.2015-2354.
2. HCUP Databases. Healthcare Cost and Utilization Project (HCUP). www.hcup.us.ahrq.gov/kidoverview.jsp. Published 2016. Accessed September 14, 2016.
3. NHLBI. Expert Panel Report 3 (EPR-3): Guidelines for the diagnosis and management of asthma–summary report 2007. J Allergy Clin Immunol. 2007;120(5):S94-S138. https://doi.org/10.1016/j.jaci.2007.09.029.
4. Kenyon CC, Rubin DM, Zorc JJ, Mohamad Z, Faerber JA, Feudtner C. Childhood asthma hospital discharge medication fills and risk of subsequent readmission. J Pediatr. 2015;166(5):1121-1127. https://doi.org/10.1016/j.jpeds.2014.12.019.
5. Bollinger ME, Mudd KE, Boldt A, Hsu VD, Tsoukleris MG, Butz AM. Prescription fill patterns in underserved children with asthma receiving subspecialty care. Ann Allergy Asthma Immunol. 2013;111(3):185-189. https://doi.org/10.1016/j.anai.2013.06.009.
6. Cooper WO, Hickson GB. Corticosteroid prescription filling for children covered by Medicaid following an emergency department visit or a hospitalization for asthma. Arch Pediatr Adolesc Med. 2001;155(10):1111-1115. https://doi.org/10.1001/archpedi.155.10.1111.
7. Hatoun J, Bair-Merritt M, Cabral H, Moses J. Increasing medication possession at discharge for patients with asthma: the Meds-in-Hand Project. Pediatrics. 2016;137(3):e20150461-e20150461. https://doi.org/10.1542/peds.2015-0461.
8. Kercsmar CM, Beck AF, Sauers-Ford H, et al. Association of an asthma improvement collaborative with health care utilization in medicaid-insured pediatric patients in an urban community. JAMA Pediatr. 2017;171(11):1072-1080. https://doi.org/10.1001/jamapediatrics.2017.2600.
9. Sauers HS, Beck AF, Kahn RS, Simmons JM. Increasing recruitment rates in an inpatient clinical research study using quality improvement methods. Hosp Pediatr. 2014;4(6):335-341. https://doi.org/10.1542/hpeds.2014-0072.
10. Langley GJ, Moen R, Nolan KM, Nolan TW, Norman CL, Provost LP. The Improvement Guide: A Practical Approach to Enhancing Organizational Performance. Hoboken: John Wiley & Sons, Inc.; 2009.
11. Benneyan JC, Lloyd RC, Plsek PE. Statistical process control as a tool for research and healthcare improvement. Qual Saf Health Care. 2003;12(6):458-464. https://doi.org/10.1136/qhc.12.6.458.
12. Mohammed MA, Panesar JS, Laney DB, Wilson R. Statistical process control charts for attribute data involving very large sample sizes: a review of problems and solutions. BMJ Qual Saf. 2013;22(4):362-368. https://doi.org/10.1136/bmjqs-2012-001373.
13. Moen R, Nolan T, Provost L. Quality Improvement through Planned Experimentation. 2nd ed. New York City: McGraw-Hill Professional; 1998.
© 2020 Society of Hospital Medicine
Impact of Preoperative Specialty Consults on Hospitalist Comanagement of Hip Fracture Patients
Hip fractures in the elderly are associated with significant morbidity and mortality.1 These are typically fragility fractures since they are caused by mechanical forces that would ordinarily not result in a serious injury, such as a fall from or below standing level. The incidence of hip fractures in the United States is expected to increase as the population ages; estimates project 512,000 hip fractures with an associated cost of $16 billion annually by the year 2040.2 Timely surgery is recommended for hip fracture patients as delayed surgery beyond 24 to 48 hours of presentation is associated with increased morbidity and mortality.3-6 Time to surgery (TTS) has been shown to be the major potentially modifiable risk factor in the management of a hip fracture.7
Factors that have been noted to influence TTS include the American Society of Anesthesiologists’ (ASA) score, the day of the week of hospital admission, and preoperative testing.8,9 Preoperative cardiology consultation and subsequent cardiac testing, in particular, can increase the TTS and length of stay (LOS) without changing perioperative management.9,10 In our review of literature, we could not identify any studies specifically looking at the impact of preoperative specialty consults on short-term mortality or comparison of care provided by hospitalists alone versus additionally involving subspecialists such as cardiologists. To our knowledge, there are no studies that have categorized recommendations from a preoperative specialty consult as minor, moderate, or major.
Our study evaluated whether preoperative specialty consults meaningfully change management and influence outcomes for hip fracture patients. At our institution, all hip fracture patients are admitted to the hospitalist service and comanaged with the orthopedic team. The hospitalist physician performs the preoperative evaluation as part of the admission history and physical exam. Preoperative specialty consult(s), if needed, are requested only by the hospitalist team. A consultant such as a cardiologist provides input; however, final management decisions are coordinated by the hospitalist physician.
METHODS
Study Design
We performed a retrospective cohort study of patients aged 50 years and older who underwent surgery for an isolated fragility fracture of the hip at Hartford Hospital, a level one trauma and tertiary care medical center, within the 24-month period from April 2015 to March 2017. Fragility hip fracture is defined as one occurring from a fall of a height of standing or less. A consult referred to a specialty or subspecialty consultation, other than hospital medicine, obtained prior to surgery. Patients with additional skeletal trauma and periprosthetic fractures were excluded. A total of 491 unique patients met the inclusion criteria, and data were obtained from chart review and an orthopedic surgery registry. The Hartford Hospital Institutional Review Board approved this study.
Our primary predictor was the presence or absence of a preoperative specialty consultation requested by the hospitalist. We also analyzed the following: covariates of demographics (age, sex, race), the ASA score, and severity of comorbidities using the Charlson comorbidity index (CCI) with a Quan modification;11 “R program package, International Classification of Disease (ICD)”12 was used to calculate the CCI using ICD-9 and ICD-10 diagnostic codes.
The primary outcome measures were TTS (measured in hours), LOS (measured in days), complications, and preoperative specialty consult resulting in a change in perioperative management. TTS was defined as the time elapsed from the presentation at the emergency department (ED) to surgery start. For transfer or direct admission patients, the time of admission was used in place of time of presentation. The measured complications included postoperative venous thromboembolic events, surgical site infection, myocardial infarction, stroke, and sepsis. Secondary outcome measures included 30-day mortality, readmission rate, and rate of return to OR. There were no elective or planned readmissions postoperatively on review of our institution’s orthopedic surgery registry.
Our team performed an extensive chart review including reviewing the admission note, consulting physician notes, and relevant test results. Our senior investigator (MK) then rated each preoperative specialty consult on appropriateness, the relative strength of the consultant’s recommendation, and resulting change in perioperative management. Cardiology consultations were deemed reasonable if a patient’s cardiac risk was considered elevated by the admitting physician or an active cardiac condition was present (suggestion of or clear evidence for acute coronary syndrome, acute congestive heart failure, uncontrolled arrhythmia, or symptomatic valvular disease). The determination of “elevated cardiac risk” was made, if admit note contained verbiage expressing concern for further evaluation for cardiac issues or words such as “high risk” or “elevated risk”. A specific guideline-based score such as the revised cardiac risk index was not consistently available in this retrospective chart review. A noncardiology consult was deemed reasonable only if it would have been warranted for the specific clinical situation—for example, a neurology consult for an acute stroke or a pulmonary consult for acute respiratory failure. Consult recommendations or outcomes were rated as minor, moderate, or major (see Table 1 for detailed criteria). Some consults may generate more than one recommendation, in these cases, we determined that a major recommendation supersedes a moderate or minor recommendation and only one was counted in the final analysis. Next we determined if a consult recommendation led to a change in perioperative or therapeutic management, defined as a medication or dosage change, need to delay surgery to stabilize an unstable medical condition, invasive procedures (such as thoracentesis or cardiac catheterization) or change in postoperative monitoring. As a way of clarification, a consult may have a minor recommendation such as an EKG but if no other recommendations were given and there was no change in therapeutic management such as a medication change, this would be considered as a “no change”.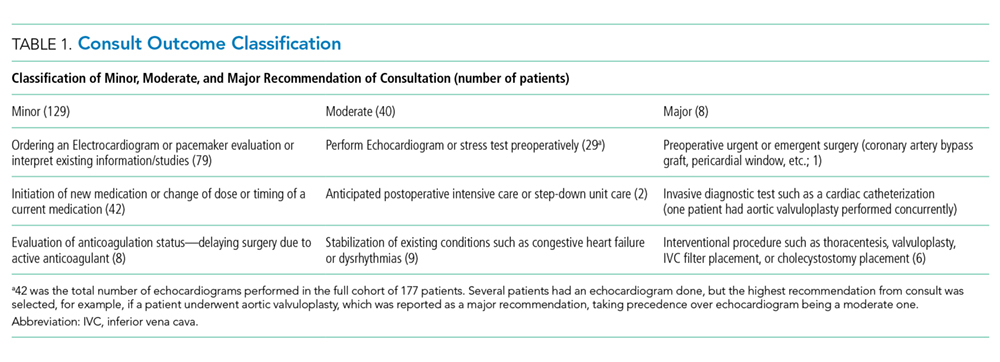
An independent rating of the entire dataset was subsequently performed by another hospitalist (KM) to establish interrater reliability. This reviewer was blinded to the initial rating and not involved in the initial design of the study or the data collection process. Because of the labor-intensive task of reviewing full charts, we followed a nonstandard process for interrater reliability. This rating was performed with the same dataset that was extracted by three members of our team (NB, SS, and MK); consequently, this does not account for variability in chart extraction as reiterated in the discussion.
Statistical Analysis
The main analyses compared the two patient subgroups (with or without preoperative specialty consults) around outcome measures. Primary outcome measures were TTS, LOS, complications, and consult resulting in a change in perioperative management. Secondary outcome measures were 30-day readmit, return to OR, and mortality. A preliminary analysis was conducted to explore distributions for TTS and LOS. As expected, none met the assumptions of normality and were thus analyzed with Wilcoxon ranked-sum tests. The other outcomes were dichotomous and analyzed with chi-square tests of proportion or Fisher’s exact test when the expected cell frequencies were too low. Dichotomized variables for TTS (within 24 hours and 48 hours) and LOS (within five days, the median LOS for this cohort) were calculated and subsequently analyzed with additional chi-square tests of proportion or Fisher’s exact test13. To explore the effect of preoperative specialty consults independent of potential confounders, logistic regression analyses predicting each of the dichotomous outcomes were conducted with age and CCI used as predictors in addition to the main variable of whether or not there was a preoperative specialty consult. Since the CCI and ASA scores were highly intercorrelated, only the former was chosen for the multivariate analyses based on the consistent algorithm used to calculate CCI.
Additional analyses with the subgroup of patients with a preoperative specialty consult explored whether the consult was reasonable, the relative strength of resulting recommendation and whether it resulted in a change in management. The statistical approach used was the same as for the other dichotomous outcomes. All analyses used 0.05 as the level of statistical significance; SPSSv21 (IBM, Armonk, New York) was the statistical software used.
The sample size for this retrospective analysis was determined by the available number of patients meeting the inclusion criteria. An a priori power calculation was done to determine if the expected volume would be sufficient for the multivariate analysis; the presence of a complication was selected for calculation. Based on an expected volume of approximately 500 and an estimate of a 10% serious complication rate, it was determined that the sample could support the analysis of up to five predictor variables, sufficient for the main variable and four potential confounders; this was considered adequate.14 Propensity scoring was considered but did not offer any advantages to logistic regression because we only had two observed covariates: CCI and age.
RESULTS
A total of 491 unique patients met our inclusion criteria, 177 patients had a preoperative specialty consult. Of these 177 patients, 24 patients had more than one consult; hence, the total number of consults was 201. Most of the consults were cardiology (159). Others were Infectious disease (11), Pulmonology (10), Neurology (7), and Miscellaneous (14, which included Nephrology, Gastroenterology, Hematology, and Oncology).
No significant differences were found between the consult and no-consult groups with respect to gender, race, body mass index, type of anesthesia, and day of the week of surgery. We did note that patients with a consult were older and had a significantly higher CCI and ASA score (Table 2).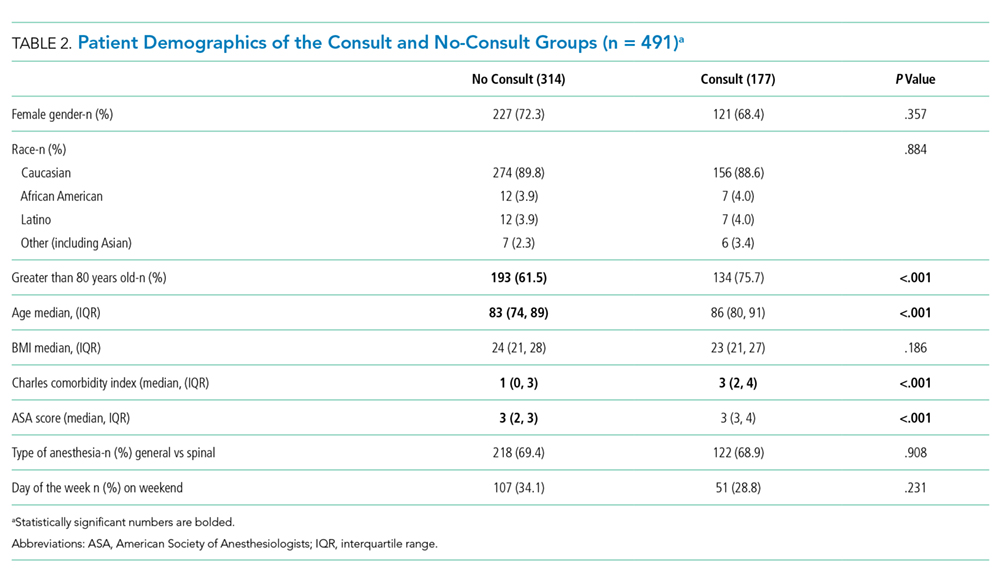
Initial analyses compared those with and without consults unadjusted for other factors with respect to TTS, LOS, 30-day readmission rate, 30-day return to OR rate, and 30-day mortality rate. The median TTS was 22.1 hours for the no-consult group compared with 34.3 hours for the consult group. The percentage of patients with TTS within 24 hours was higher (58.6% compared with 23.7%) and TTS within 48 hours was higher (90.1% compared to 76.8%) if there was no consult. The median LOS was five days for the no-consult group compared with six days for the consult group. There was no difference in complications between the two groups. Patients with consults were more likely to have a readmission (Table 3). No association was found between the type of consult (cardiology, pulmonary, etc.) and outcomes.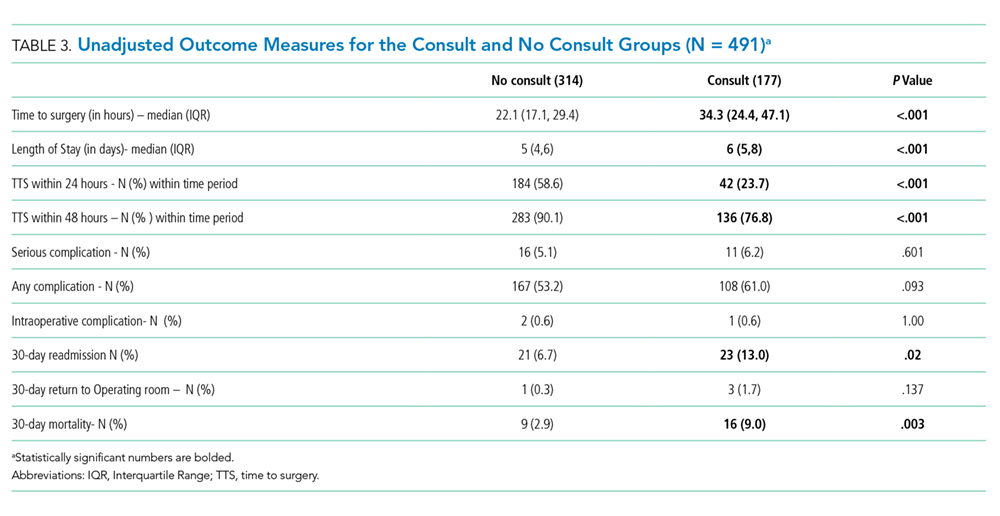
In the main analyses adjusted for potential confounders of age and CCI, consults were more likely to be independently associated with TTS beyond 24 hours, TTS beyond 48 hours, an extended LOS, and a higher 30-day readmission rate. CCI independently predicted a higher LOS, 30-day mortality rate, and serious complication rate. Similarly, age predicted 30-day mortality. Consults were not independently associated with 30-day mortality (Table 4).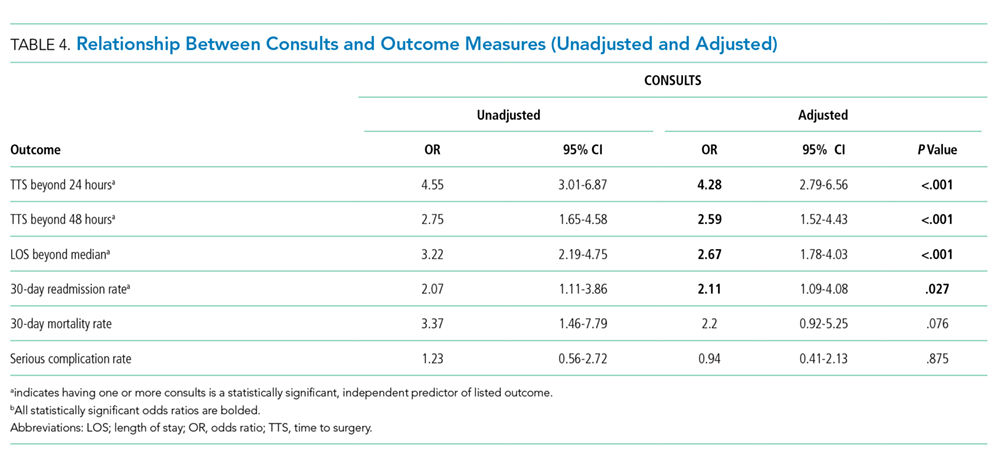
Of the 177 patients with one or more consults, 163 (92%) were deemed reasonable. Of the patients, 129 (72.8%) had minor, 40 (22.6%) moderate, and 8 (4.5%) major recommendations as a result of the consultation. There was an identifiable change in perioperative management for 66 (37%) patients with consults. The independent review done for interrater reliability examined the entire dataset. This review demonstrated the following percent agreements: 99.4% for if the consult was indicated (kappa = 0.962), 97.7% for the consult outcome classification (minor, moderate, or major; kappa = 0.947), and 94.4% for if the intervention resulted in a change in management (kappa = 0.878).
While reviewing our subset of cardiology consults, we noted moderate or major recommendations from a cardiologist only in cases where an active cardiac condition was suspected by the hospitalist requesting the consult. Only eight patients in our study had major recommendations from a consult, of which, three underwent aortic valvuloplasty and one patient each underwent the following: pericardial window for tamponade, cholecystostomy tube placement to treat acute cholecystitis, thoracentesis, endoscopic retrograde cholangiopancreatography for obstructive jaundice, and inferior vena cava filter placement for acute pulmonary embolism. All these procedures were done prior to hip fracture repair. Interestingly, 42 out of the 177 patients in our consult group had a preoperative echocardiogram performed, with only three patients with critical aortic stenosis undergoing valvuloplasty preoperatively.
DISCUSSION
Patients with preoperative specialty consults were older and had more comorbidities than patients without consults. Our findings suggest that consults contribute to delays to surgery and may lead to higher LOS and higher risk of 30-day readmission after controlling for age and comorbidities in a multivariate analysis. This observation is significant considering that consults were requested more frequently on patients with a higher comorbidity burden and included patients who did not get additional preoperative testing, suggesting that a delay from waiting for a consult alone may be deleterious. This was a unique observation in our study; prior studies examining this subject have attributed delays to additional testing and not consults alone. Even though most consult requests appear to be reasonable according to our criteria, the majority of recommendations were minor (72.9%), and 62.7% of consults resulted in no change in perioperative management. Major changes in perioperative management were noted in only 4.5% of patients.
Our finding that a majority of patients in the consult group had no significant change in perioperative management raises an important area of potential improvement in the care of hip fracture patients. We believe that narrowing indications for preoperative specialty consults may result in shorter TTS and LOS for this group of frail elderly patients without sacrificing the quality of care. Since all patients in our study were comanaged by hospitalists and patients without additional consults had similar or better outcomes, we believe that hospitalist physicians are well positioned to provide standardized comanagement to this patient group without additional consultation unless absolutely necessary.
The primary limitation of our study was that this was a retrospective case analysis. The designation of minor, moderate, or major recommendation was done after the consults were already completed, and it may not be possible to predict that a consult results in no change without it being actually performed. Additionally, our classification of recommendations is somewhat arbitrary and subjective; for example, some readers might argue that a medication change counts as a moderate recommendation. We rated a medication change to be minor as we believe that an experienced hospitalist may likely make such management decisions on their own, and if this is the only recommendation from a consult, it is not additional information critical to patient care. There may also be an “unmeasured complexity” noted by the admitting physician, which was not necessarily accounted for by multivariate analysis of age and CCI but one that led to higher mortality and readmissions. However, we feel that this “unmeasured complexity” is likely inconsequential as the vast majority of consults did not result in any change in management. We did adjust for covariates as noted, but some confounding by indication is likely to remain. Additionally, categorization of consult recommendations and consequent changes by one physician could be considered subjective. We did control for this by having another physician review the entire dataset and rate it independently for interrater reliability with excellent correlation and kappa, although these may be inflated to some degree because our chart review did not account for variability among chart extractors.
A prospective evaluation of a clinical protocol that delineates reasonable indications for a preoperative consult would be helpful to validate our findings. In our study, we noted moderate or major recommendations from a cardiologist only in cases where an active cardiac condition was suspected by the hospitalist requesting the consult; hence, limiting preoperative cardiology consults to active cardiac conditions may be a reasonable approach to evaluate in a prospective study.
In conclusion, a majority of preoperative specialty consults do not appear to meaningfully influence management and may indirectly increase morbidity by delaying surgery and extending hospital stays. Our data suggest that unless the patient is clinically unstable and likely to require active management by a consultant prior to hip fracture repair, consults may offer limited benefit. Appropriately standardized perioperative management of this patient group by hospitalist physicians appears to manage most hip fracture patients as effectively with faster TTS and shorter hospital LOS.
Acknowledgments
The authors would like to thank John Corradi, PhD (Research Department at Hartford Hospital) for his input in calculating the Charlson comorbidity index.12,13
1. Youm T, Koval KJ, Zuckerman JD. The economic impact of geriatric hip fractures. Am J Orthop. 1999;28(7):423-428.
2. Cummings SR, Rubin SM, Black D. The future of hip fractures in the United States: numbers, costs, and potential effects of post-menopausal estrogen. Clin Orthop Relat Res. 1990;(252):163-166.z
3. Mitchell SM, Chung AS, Walker JB, Hustedt JW, Russell GV, Jones CB. Delay in hip fracture surgery prolongs postoperative hospital length of stay but does not adversely affect outcomes at 30 days. J Orthop Trauma. 2018;32(12):629-633. https://doi.org/10.1097/BOT.0000000000001306.
4. Sobolev B, Guy P, Sheehan KJ, et al. Mortality effects of timing alternatives for hip fracture surgery. CMAJ. 2018;190(31):E923-E932. https://doi.org/10.1503/cmaj.171512.
5. Pincus D, Ravi B, Wasserstein D, et al. Association between wait time and 30-day mortality in adults undergoing hip fracture surgery. JAMA. 2017;318(20):1994-2003. https://doi.org/10.1001/jama.2017.17606.
6. Fu MC, Boddapati V, Gausden EB, Samuel AM, Russell LA, Lane JM. Surgery for a fracture of the hip within 24 hours of admission is independently associated with reduced short-term post-operative complications. Bone Joint J. 2017;99-B(9):1216-1222. https://doi.org/10.1302/0301-620X.99B9.BJJ-2017-0101.R1.
7. Belmont PJ Jr, Garcia EJ, Romano D, Bader JO, Nelso KJ, Schoenfeld AJ. Risk factors for complications and in-hospital mortality following hip fractures: a study using the National Trauma Data Bank. Arch Orthop Trauma Surg. 2014;134(5):597-604. https://doi.org/10.1007/s00402-014-1959-y.
8. Ricci WM, Brandt A, McAndrew C, Gardner MJ. Factors affecting delay to surgery and length of stay for patients with hip fracture. J Orthop Trauma. 2015;29(3):e109-e114. https://doi.org/10.1097/BOT.0000000000000221.
9. Bernstein J, Roberts FO, Wiesel BB, Ahn J. Preoperative testing for hip fracture patients delays surgery, prolongs hospital stays, and rarely dictates care. J Orthop Trauma. 2016;30(2):78-80. https://doi.org/10.1097/BOT.0000000000000444.
10, , Borrelli J. The medical and economic impact of preoperative cardiac testing in elderly patients with hip fractures. Injury. 2007;38(suppl 3):S49-S52. https://doi.org/10.1016/j.injury.2007.08.011.
11. Quan H, Li B, Couris CM, et al. Updating and validating the Charlson comorbidity index and score for risk adjustment in hospital discharge abstracts using data from 6 countries. Am J Epidemiol. 2011;173(6):676-682. https://doi.org/10.1093/aje/kwq433.
12. Wasey JO. icd: Tools for working with ICD-9 and ICD-10 codes, and finding comorbidities. R package version 3.2.0. https://CRAN.R-project.org/package=icd. Published 2018. Accessed November 13, 2018.
13. Uitenbroek D. The Fisher exact test for 2*5 or smaller crosstable. Quantitativeskills.com. https://www.quantitativeskills.com/sisa/statistics/fiveby2.htm. Published 2019. Accessed November 13, 2018.
14. Peduzzi P, Concato J, Kemper E, Holford TR, Feinstein AR. A simulation study of the number of events per variable in logistic regression analysis. J Clin Epidemiol. 1996;49(12):1373-1379. https://doi.org/10.1016/S0895-4356(96)00236-3.
Hip fractures in the elderly are associated with significant morbidity and mortality.1 These are typically fragility fractures since they are caused by mechanical forces that would ordinarily not result in a serious injury, such as a fall from or below standing level. The incidence of hip fractures in the United States is expected to increase as the population ages; estimates project 512,000 hip fractures with an associated cost of $16 billion annually by the year 2040.2 Timely surgery is recommended for hip fracture patients as delayed surgery beyond 24 to 48 hours of presentation is associated with increased morbidity and mortality.3-6 Time to surgery (TTS) has been shown to be the major potentially modifiable risk factor in the management of a hip fracture.7
Factors that have been noted to influence TTS include the American Society of Anesthesiologists’ (ASA) score, the day of the week of hospital admission, and preoperative testing.8,9 Preoperative cardiology consultation and subsequent cardiac testing, in particular, can increase the TTS and length of stay (LOS) without changing perioperative management.9,10 In our review of literature, we could not identify any studies specifically looking at the impact of preoperative specialty consults on short-term mortality or comparison of care provided by hospitalists alone versus additionally involving subspecialists such as cardiologists. To our knowledge, there are no studies that have categorized recommendations from a preoperative specialty consult as minor, moderate, or major.
Our study evaluated whether preoperative specialty consults meaningfully change management and influence outcomes for hip fracture patients. At our institution, all hip fracture patients are admitted to the hospitalist service and comanaged with the orthopedic team. The hospitalist physician performs the preoperative evaluation as part of the admission history and physical exam. Preoperative specialty consult(s), if needed, are requested only by the hospitalist team. A consultant such as a cardiologist provides input; however, final management decisions are coordinated by the hospitalist physician.
METHODS
Study Design
We performed a retrospective cohort study of patients aged 50 years and older who underwent surgery for an isolated fragility fracture of the hip at Hartford Hospital, a level one trauma and tertiary care medical center, within the 24-month period from April 2015 to March 2017. Fragility hip fracture is defined as one occurring from a fall of a height of standing or less. A consult referred to a specialty or subspecialty consultation, other than hospital medicine, obtained prior to surgery. Patients with additional skeletal trauma and periprosthetic fractures were excluded. A total of 491 unique patients met the inclusion criteria, and data were obtained from chart review and an orthopedic surgery registry. The Hartford Hospital Institutional Review Board approved this study.
Our primary predictor was the presence or absence of a preoperative specialty consultation requested by the hospitalist. We also analyzed the following: covariates of demographics (age, sex, race), the ASA score, and severity of comorbidities using the Charlson comorbidity index (CCI) with a Quan modification;11 “R program package, International Classification of Disease (ICD)”12 was used to calculate the CCI using ICD-9 and ICD-10 diagnostic codes.
The primary outcome measures were TTS (measured in hours), LOS (measured in days), complications, and preoperative specialty consult resulting in a change in perioperative management. TTS was defined as the time elapsed from the presentation at the emergency department (ED) to surgery start. For transfer or direct admission patients, the time of admission was used in place of time of presentation. The measured complications included postoperative venous thromboembolic events, surgical site infection, myocardial infarction, stroke, and sepsis. Secondary outcome measures included 30-day mortality, readmission rate, and rate of return to OR. There were no elective or planned readmissions postoperatively on review of our institution’s orthopedic surgery registry.
Our team performed an extensive chart review including reviewing the admission note, consulting physician notes, and relevant test results. Our senior investigator (MK) then rated each preoperative specialty consult on appropriateness, the relative strength of the consultant’s recommendation, and resulting change in perioperative management. Cardiology consultations were deemed reasonable if a patient’s cardiac risk was considered elevated by the admitting physician or an active cardiac condition was present (suggestion of or clear evidence for acute coronary syndrome, acute congestive heart failure, uncontrolled arrhythmia, or symptomatic valvular disease). The determination of “elevated cardiac risk” was made, if admit note contained verbiage expressing concern for further evaluation for cardiac issues or words such as “high risk” or “elevated risk”. A specific guideline-based score such as the revised cardiac risk index was not consistently available in this retrospective chart review. A noncardiology consult was deemed reasonable only if it would have been warranted for the specific clinical situation—for example, a neurology consult for an acute stroke or a pulmonary consult for acute respiratory failure. Consult recommendations or outcomes were rated as minor, moderate, or major (see Table 1 for detailed criteria). Some consults may generate more than one recommendation, in these cases, we determined that a major recommendation supersedes a moderate or minor recommendation and only one was counted in the final analysis. Next we determined if a consult recommendation led to a change in perioperative or therapeutic management, defined as a medication or dosage change, need to delay surgery to stabilize an unstable medical condition, invasive procedures (such as thoracentesis or cardiac catheterization) or change in postoperative monitoring. As a way of clarification, a consult may have a minor recommendation such as an EKG but if no other recommendations were given and there was no change in therapeutic management such as a medication change, this would be considered as a “no change”.
An independent rating of the entire dataset was subsequently performed by another hospitalist (KM) to establish interrater reliability. This reviewer was blinded to the initial rating and not involved in the initial design of the study or the data collection process. Because of the labor-intensive task of reviewing full charts, we followed a nonstandard process for interrater reliability. This rating was performed with the same dataset that was extracted by three members of our team (NB, SS, and MK); consequently, this does not account for variability in chart extraction as reiterated in the discussion.
Statistical Analysis
The main analyses compared the two patient subgroups (with or without preoperative specialty consults) around outcome measures. Primary outcome measures were TTS, LOS, complications, and consult resulting in a change in perioperative management. Secondary outcome measures were 30-day readmit, return to OR, and mortality. A preliminary analysis was conducted to explore distributions for TTS and LOS. As expected, none met the assumptions of normality and were thus analyzed with Wilcoxon ranked-sum tests. The other outcomes were dichotomous and analyzed with chi-square tests of proportion or Fisher’s exact test when the expected cell frequencies were too low. Dichotomized variables for TTS (within 24 hours and 48 hours) and LOS (within five days, the median LOS for this cohort) were calculated and subsequently analyzed with additional chi-square tests of proportion or Fisher’s exact test13. To explore the effect of preoperative specialty consults independent of potential confounders, logistic regression analyses predicting each of the dichotomous outcomes were conducted with age and CCI used as predictors in addition to the main variable of whether or not there was a preoperative specialty consult. Since the CCI and ASA scores were highly intercorrelated, only the former was chosen for the multivariate analyses based on the consistent algorithm used to calculate CCI.
Additional analyses with the subgroup of patients with a preoperative specialty consult explored whether the consult was reasonable, the relative strength of resulting recommendation and whether it resulted in a change in management. The statistical approach used was the same as for the other dichotomous outcomes. All analyses used 0.05 as the level of statistical significance; SPSSv21 (IBM, Armonk, New York) was the statistical software used.
The sample size for this retrospective analysis was determined by the available number of patients meeting the inclusion criteria. An a priori power calculation was done to determine if the expected volume would be sufficient for the multivariate analysis; the presence of a complication was selected for calculation. Based on an expected volume of approximately 500 and an estimate of a 10% serious complication rate, it was determined that the sample could support the analysis of up to five predictor variables, sufficient for the main variable and four potential confounders; this was considered adequate.14 Propensity scoring was considered but did not offer any advantages to logistic regression because we only had two observed covariates: CCI and age.
RESULTS
A total of 491 unique patients met our inclusion criteria, 177 patients had a preoperative specialty consult. Of these 177 patients, 24 patients had more than one consult; hence, the total number of consults was 201. Most of the consults were cardiology (159). Others were Infectious disease (11), Pulmonology (10), Neurology (7), and Miscellaneous (14, which included Nephrology, Gastroenterology, Hematology, and Oncology).
No significant differences were found between the consult and no-consult groups with respect to gender, race, body mass index, type of anesthesia, and day of the week of surgery. We did note that patients with a consult were older and had a significantly higher CCI and ASA score (Table 2).
Initial analyses compared those with and without consults unadjusted for other factors with respect to TTS, LOS, 30-day readmission rate, 30-day return to OR rate, and 30-day mortality rate. The median TTS was 22.1 hours for the no-consult group compared with 34.3 hours for the consult group. The percentage of patients with TTS within 24 hours was higher (58.6% compared with 23.7%) and TTS within 48 hours was higher (90.1% compared to 76.8%) if there was no consult. The median LOS was five days for the no-consult group compared with six days for the consult group. There was no difference in complications between the two groups. Patients with consults were more likely to have a readmission (Table 3). No association was found between the type of consult (cardiology, pulmonary, etc.) and outcomes.
In the main analyses adjusted for potential confounders of age and CCI, consults were more likely to be independently associated with TTS beyond 24 hours, TTS beyond 48 hours, an extended LOS, and a higher 30-day readmission rate. CCI independently predicted a higher LOS, 30-day mortality rate, and serious complication rate. Similarly, age predicted 30-day mortality. Consults were not independently associated with 30-day mortality (Table 4).
Of the 177 patients with one or more consults, 163 (92%) were deemed reasonable. Of the patients, 129 (72.8%) had minor, 40 (22.6%) moderate, and 8 (4.5%) major recommendations as a result of the consultation. There was an identifiable change in perioperative management for 66 (37%) patients with consults. The independent review done for interrater reliability examined the entire dataset. This review demonstrated the following percent agreements: 99.4% for if the consult was indicated (kappa = 0.962), 97.7% for the consult outcome classification (minor, moderate, or major; kappa = 0.947), and 94.4% for if the intervention resulted in a change in management (kappa = 0.878).
While reviewing our subset of cardiology consults, we noted moderate or major recommendations from a cardiologist only in cases where an active cardiac condition was suspected by the hospitalist requesting the consult. Only eight patients in our study had major recommendations from a consult, of which, three underwent aortic valvuloplasty and one patient each underwent the following: pericardial window for tamponade, cholecystostomy tube placement to treat acute cholecystitis, thoracentesis, endoscopic retrograde cholangiopancreatography for obstructive jaundice, and inferior vena cava filter placement for acute pulmonary embolism. All these procedures were done prior to hip fracture repair. Interestingly, 42 out of the 177 patients in our consult group had a preoperative echocardiogram performed, with only three patients with critical aortic stenosis undergoing valvuloplasty preoperatively.
DISCUSSION
Patients with preoperative specialty consults were older and had more comorbidities than patients without consults. Our findings suggest that consults contribute to delays to surgery and may lead to higher LOS and higher risk of 30-day readmission after controlling for age and comorbidities in a multivariate analysis. This observation is significant considering that consults were requested more frequently on patients with a higher comorbidity burden and included patients who did not get additional preoperative testing, suggesting that a delay from waiting for a consult alone may be deleterious. This was a unique observation in our study; prior studies examining this subject have attributed delays to additional testing and not consults alone. Even though most consult requests appear to be reasonable according to our criteria, the majority of recommendations were minor (72.9%), and 62.7% of consults resulted in no change in perioperative management. Major changes in perioperative management were noted in only 4.5% of patients.
Our finding that a majority of patients in the consult group had no significant change in perioperative management raises an important area of potential improvement in the care of hip fracture patients. We believe that narrowing indications for preoperative specialty consults may result in shorter TTS and LOS for this group of frail elderly patients without sacrificing the quality of care. Since all patients in our study were comanaged by hospitalists and patients without additional consults had similar or better outcomes, we believe that hospitalist physicians are well positioned to provide standardized comanagement to this patient group without additional consultation unless absolutely necessary.
The primary limitation of our study was that this was a retrospective case analysis. The designation of minor, moderate, or major recommendation was done after the consults were already completed, and it may not be possible to predict that a consult results in no change without it being actually performed. Additionally, our classification of recommendations is somewhat arbitrary and subjective; for example, some readers might argue that a medication change counts as a moderate recommendation. We rated a medication change to be minor as we believe that an experienced hospitalist may likely make such management decisions on their own, and if this is the only recommendation from a consult, it is not additional information critical to patient care. There may also be an “unmeasured complexity” noted by the admitting physician, which was not necessarily accounted for by multivariate analysis of age and CCI but one that led to higher mortality and readmissions. However, we feel that this “unmeasured complexity” is likely inconsequential as the vast majority of consults did not result in any change in management. We did adjust for covariates as noted, but some confounding by indication is likely to remain. Additionally, categorization of consult recommendations and consequent changes by one physician could be considered subjective. We did control for this by having another physician review the entire dataset and rate it independently for interrater reliability with excellent correlation and kappa, although these may be inflated to some degree because our chart review did not account for variability among chart extractors.
A prospective evaluation of a clinical protocol that delineates reasonable indications for a preoperative consult would be helpful to validate our findings. In our study, we noted moderate or major recommendations from a cardiologist only in cases where an active cardiac condition was suspected by the hospitalist requesting the consult; hence, limiting preoperative cardiology consults to active cardiac conditions may be a reasonable approach to evaluate in a prospective study.
In conclusion, a majority of preoperative specialty consults do not appear to meaningfully influence management and may indirectly increase morbidity by delaying surgery and extending hospital stays. Our data suggest that unless the patient is clinically unstable and likely to require active management by a consultant prior to hip fracture repair, consults may offer limited benefit. Appropriately standardized perioperative management of this patient group by hospitalist physicians appears to manage most hip fracture patients as effectively with faster TTS and shorter hospital LOS.
Acknowledgments
The authors would like to thank John Corradi, PhD (Research Department at Hartford Hospital) for his input in calculating the Charlson comorbidity index.12,13
1. Youm T, Koval KJ, Zuckerman JD. The economic impact of geriatric hip fractures. Am J Orthop. 1999;28(7):423-428.
2. Cummings SR, Rubin SM, Black D. The future of hip fractures in the United States: numbers, costs, and potential effects of post-menopausal estrogen. Clin Orthop Relat Res. 1990;(252):163-166.z
3. Mitchell SM, Chung AS, Walker JB, Hustedt JW, Russell GV, Jones CB. Delay in hip fracture surgery prolongs postoperative hospital length of stay but does not adversely affect outcomes at 30 days. J Orthop Trauma. 2018;32(12):629-633. https://doi.org/10.1097/BOT.0000000000001306.
4. Sobolev B, Guy P, Sheehan KJ, et al. Mortality effects of timing alternatives for hip fracture surgery. CMAJ. 2018;190(31):E923-E932. https://doi.org/10.1503/cmaj.171512.
5. Pincus D, Ravi B, Wasserstein D, et al. Association between wait time and 30-day mortality in adults undergoing hip fracture surgery. JAMA. 2017;318(20):1994-2003. https://doi.org/10.1001/jama.2017.17606.
6. Fu MC, Boddapati V, Gausden EB, Samuel AM, Russell LA, Lane JM. Surgery for a fracture of the hip within 24 hours of admission is independently associated with reduced short-term post-operative complications. Bone Joint J. 2017;99-B(9):1216-1222. https://doi.org/10.1302/0301-620X.99B9.BJJ-2017-0101.R1.
7. Belmont PJ Jr, Garcia EJ, Romano D, Bader JO, Nelso KJ, Schoenfeld AJ. Risk factors for complications and in-hospital mortality following hip fractures: a study using the National Trauma Data Bank. Arch Orthop Trauma Surg. 2014;134(5):597-604. https://doi.org/10.1007/s00402-014-1959-y.
8. Ricci WM, Brandt A, McAndrew C, Gardner MJ. Factors affecting delay to surgery and length of stay for patients with hip fracture. J Orthop Trauma. 2015;29(3):e109-e114. https://doi.org/10.1097/BOT.0000000000000221.
9. Bernstein J, Roberts FO, Wiesel BB, Ahn J. Preoperative testing for hip fracture patients delays surgery, prolongs hospital stays, and rarely dictates care. J Orthop Trauma. 2016;30(2):78-80. https://doi.org/10.1097/BOT.0000000000000444.
10, , Borrelli J. The medical and economic impact of preoperative cardiac testing in elderly patients with hip fractures. Injury. 2007;38(suppl 3):S49-S52. https://doi.org/10.1016/j.injury.2007.08.011.
11. Quan H, Li B, Couris CM, et al. Updating and validating the Charlson comorbidity index and score for risk adjustment in hospital discharge abstracts using data from 6 countries. Am J Epidemiol. 2011;173(6):676-682. https://doi.org/10.1093/aje/kwq433.
12. Wasey JO. icd: Tools for working with ICD-9 and ICD-10 codes, and finding comorbidities. R package version 3.2.0. https://CRAN.R-project.org/package=icd. Published 2018. Accessed November 13, 2018.
13. Uitenbroek D. The Fisher exact test for 2*5 or smaller crosstable. Quantitativeskills.com. https://www.quantitativeskills.com/sisa/statistics/fiveby2.htm. Published 2019. Accessed November 13, 2018.
14. Peduzzi P, Concato J, Kemper E, Holford TR, Feinstein AR. A simulation study of the number of events per variable in logistic regression analysis. J Clin Epidemiol. 1996;49(12):1373-1379. https://doi.org/10.1016/S0895-4356(96)00236-3.
© 2020 Society of Hospital Medicine
Community Pediatric Hospitalist Workload: Results from a National Survey
As a newly recognized specialty, pediatric hospital medicine (PHM) continues to expand and diversify.1 Pediatric hospitalists care for children in hospitals ranging from small, rural community hospitals to large, free-standing quaternary children’s hospitals.2-4 In addition, more than 10% of graduating pediatric residents are seeking future careers within PHM.5
In 2018, Fromme et al. published a study describing clinical workload for pediatric hospitalists within university-based settings.6 They characterized the diversity of work models and programmatic sustainability but limited the study to university-based programs. With over half of children receiving care within community hospitals,7 workforce patterns for community-based pediatric hospitalists should be characterized to maximize sustainability and minimize attrition across the field.
In this study, we describe programmatic variability in clinical work expectations of 70 community-based PHM programs. We aimed to describe existing work models and expectations of community-based program leaders as they relate to their unique clinical setting.
METHODS
We conducted a cross-sectional survey of community-based PHM site directors through structured interviews. Community hospital programs were self-defined by the study participants, although typically defined as general hospitals that admit pediatric patients and are not free-standing or children’s hospitals within a general hospital. Survey respondents were asked to answer questions only reflecting expectations at their community hospital.
Survey Design and Content
Building from a tool used by Fromme et al.6 we created a 12-question structured interview questionnaire focused on three areas: (1) full-time employment (FTE) metrics including definitions of a 1.0 FTE, “typical” shifts, and weekend responsibilities; (2) work volume including census parameters, service-line coverage expectations, back-up systems, and overnight call responsibilities; and (3) programmatic model including sense of sustainability (eg, minimizing burnout and attrition), support for activities such as administrative or research time, and employer model (Appendix).
We modified the survey through research team consensus. After pilot-testing by research team members at their own sites, the survey was refined for item clarity, structural design, and length. We chose to administer surveys through phone interviews over a traditional distribution due to anticipated variability in work models. The research team discussed how each question should be asked, and responses were clarified to maintain consistency.
Survey Administration
Given the absence of a national registry or database for community-based PHM programs, study participation was solicited through an invitation posted on the American Academy of Pediatrics Section on Hospital Medicine (AAP SOHM) Listserv and the AAP SOHM Community Hospitalist Listserv in May 2018. Invitations were posted twice at two weeks apart. Each research team member completed 6-19 interviews. Responses to survey questions were recorded in REDCap, a secure, web-based data capture instrument.8
Participating in the study was considered implied consent, and participants did not receive a monetary incentive, although respondents were offered deidentified survey data for participation. The study was exempted through the University of Chicago Institutional Review Board.
Data Analysis
Employers were dichotomized as community hospital employer (including primary community hospital employment/private organization) or noncommunity hospital employer (including children’s/university hospital employment or school of medicine). Descriptive statistics were reported to compare the demographics of two employer groups. P values were calculated using two-sample t-tests for the continuous variables and chi-square or Fisher-exact tests for the categorical variables. Mann–Whitney U-test was performed for continuous variables without normality. Analyses were performed using the R Statistical Programming Language (R Foundation for Statistical Computing, Vienna, Austria), version 3.4.3.
RESULTS
Participation and Program Characteristics
We interviewed 70 community-based PHM site directors representing programs across 29 states (Table 1) and five geographic regions: Midwest (34.3%), Northeast (11.4%), Southeast (15.7%), Southwest (4.3%), and West (34.3%). Employer models varied across groups, with more noncommunity hospital employers (57%) than community hospital employers (43%). The top three services covered by pediatric hospitalists were pediatric inpatient or observation bed admissions (97%), emergency department consults (89%), and general newborns (67%). PHM programs also provided coverage for other services, including newborn deliveries (43%), Special Care Nursery/Level II Neonatal Intensive Care Unit (41%), step-down unit (20%), and mental health units (13%). About 59% of programs provided education for family medicine residents, 36% were for pediatric residents, and 70% worked with advanced practice providers. The majority of programs (70%) provided in-house coverage overnight.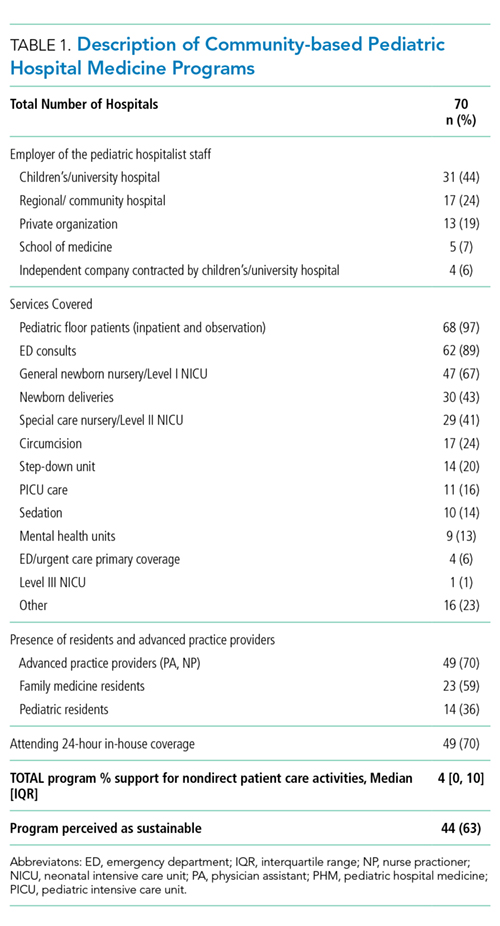
Clinical Work Expectations and Employer Model
Clinical work expectations varied broadly across programs (Table 2). The median expected hours for a 1.0 FTE was 1,882 hours per year (interquartile range [IQR] 1,805, 2,016), and the median expected weekend coverage/year (defined as covering two days or two nights of the weekend) was 21 (IQR 14, 24). Most programs did not expand staff coverage based on seasonality (73%), and less than 20% of programs operated with a census cap. Median support for nondirect patient care activities was 4% (IQR 0,10) of a program’s total FTE (ie, a 5.0 FTE program would have 0.20 FTE support). Programs with community hospital employers had an 8% higher expectation of 1.0 FTE hours/year (P = .01) and viewed an appropriate pediatric morning census as 20% higher (P = .01; Table 2).
Program Sustainability
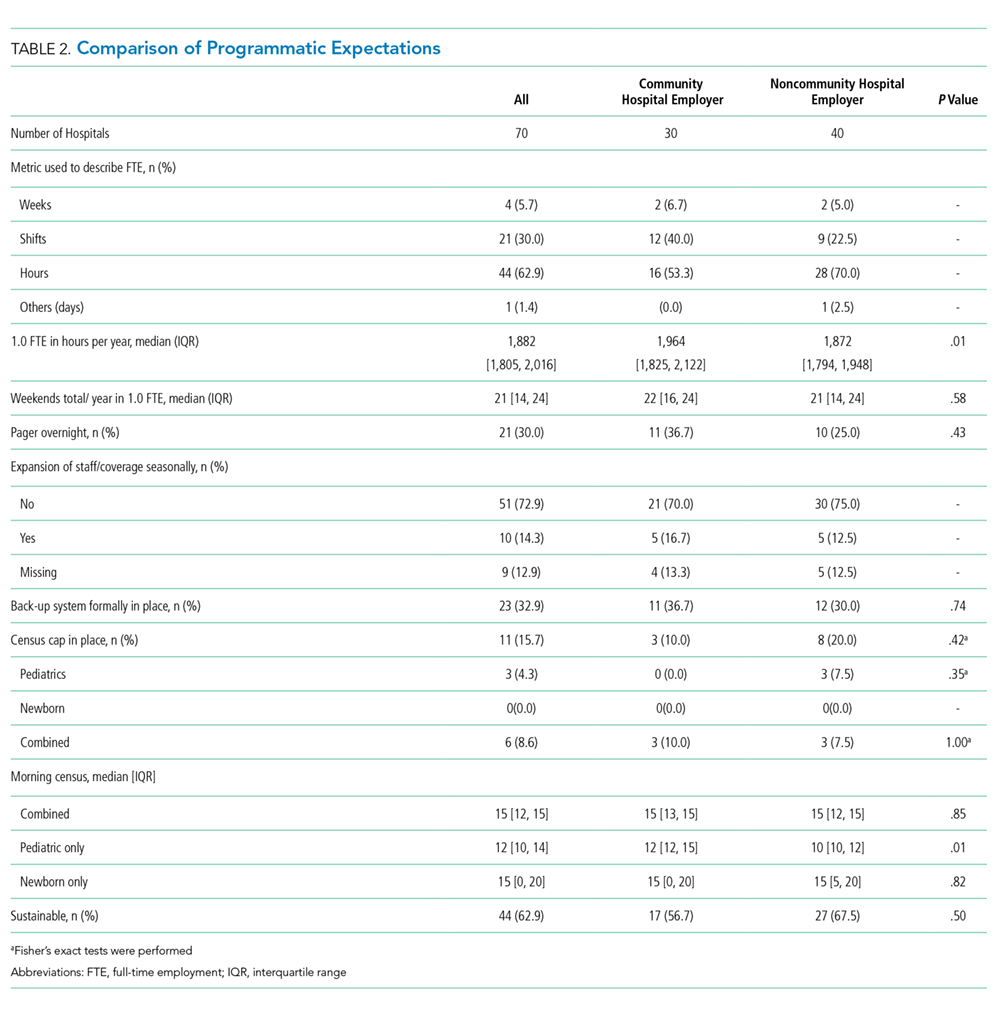
DISCUSSION
To our knowledge, this study is the first to describe clinical work models exclusively for pediatric community hospitalist programs. We found that expectations for clinical FTE hours, weekend coverage, appropriate morning census, support for nondirect patient care activities, and perception of sustainability varied broadly across programs. The only variable affecting some of these differences was employer model, with those employed by a community hospital employer having a higher expectation for hours/year and appropriate morning pediatric census than those employed by noncommunity hospital employers.
With a growing emphasis on physician burnout and career satisfaction,9-11 understanding the characteristics of community hospital work settings is critical for identifying and building sustainable employment models. Previous studies have identified that the balance of clinical and nonclinical responsibilities and the setting of community versus university-based programs are major contributors to burnout and career satisfaction.9,11 Interestingly, although community hospital-based programs have limited FTE for nondirect patient care activities, we found that a higher percentage of program site directors perceived their program models as sustainable when compared with university-based programs in prior research (63% versus 50%).6 Elucidating why community hospital PHM programs are perceived as more sustainable provides an opportunity for future research. Potential reasons may include fewer academic requirements for promotion or an increased connection to a local community.
We also found that the employer model had a statistically significant impact on expected FTE hours per year but not on perception of sustainability. Programs employed by community hospitals worked 8% more hours per year than those employed by noncommunity hospital employers and accepted a higher morning pediatric census. This variation in hours and census level appropriateness is likely multifactorial, potentially from higher nonclinical expectations for promotion (eg, academic or scholarly production) at school of medicine or children’s hospital employed programs versus limited reimbursement for administrative responsibilities within community hospital employment models.
There are several potential next steps for our findings. As our data are the first attempt (to our knowledge) at describing the current practice and expectations exclusively within community hospital programs, this study can be used as a starting point for the development of workload expectation standards. Increasing transparency nationally for individual community programs potentially promotes discussions around burnout and attrition. Having objective data to compare program models may assist in advocating with local hospital leadership for restructuring that better aligns with national norms.
Our study has several limitations. First, our sampling frame was based upon a self-selection of program directors. This may have led to a biased representation of programs with higher workloads motivated to develop a standard to compare with other programs, which may have potentially led to an overestimation of hours. Second, without a registry or database for community-based pediatric hospitalist programs, we do not know the percentage of community-based programs that our sample represents. Although our results cannot speak for all community PHM programs, we attempted to mitigate nonresponse bias through the breadth of programs represented, which spanned 29 states, five geographic regions, and teaching and nonteaching programs. The interview-based method for data collection allowed the research team to clarify questions and responses across sites, thereby improving the quality and consistency of the data for the represented study sample. Finally, other factors possibly contributed to sustainability that we did not address in this study, such as programs that are dependent on billable encounters as part of their salary support.
CONCLUSION
As a newly recognized subspecialty, creating a reference for community-based program leaders to determine and discuss individual models and expectations with hospital administrators may help address programmatic sustainability. It may also allow for the analysis of long-term career satisfaction and longevity within community PHM programs based on workload. Future studies should further explore root causes for workload discrepancies between community and university employed programs along with establishing potential standards for PHM program development.
Acknowledgments
We would like to thank the Stanford School of Medicine Quantitative Sciences Unit staff for their assistance in statistical analysis.
Disclosure
The authors have nothing to disclose.
1. Robert MW, Lee G. Zero to 50,000—The 20th anniversary of the hospitalist. N Engl J Med. 2016;375(11):1009-1011. https://doi.org/10.1056/NEJMp1607958.
2. Gosdin C, Simmons J, Yau C, Sucharew H, Carlson D, Paciorkowski N. Survey of academic pediatric hospitalist programs in the US: organizational, administrative, and financial factors. J Hosp Med. 2013;8(6):285-291. https://doi.org/10.1002/jhm.2020.
3. Paul DH, Jennifer D, Elizabeth R, et al. Proposed dashboard for pediatric hospital medicine groups. Hosp Pediatr. 2012;2(2):59-68. https://doi.org/10.1542/hpeds.2012-0004
4. Gary LF, Kathryn B, Kamilah N, Indu L. Characteristics of the pediatric hospitalist workforce: its roles and work environment. Pediatrics 2007;120(1):33-39. https://doi.org/10.1542/peds.2007-0304
5. Leyenaar JK, Frintner MP. Graduating pediatric residents entering the hospital medicine workforce. 2006-2015. Acad Pediatr. 2018;18(2):200-207. https://doi.org/10.1016/j.acap.2017.05.001.
6. Fromme HB, Chen CO, Fine BR, Gosdin C, Shaughnessy EE. Pediatric hospitalist workload and sustainability in university-based programs: results from a national interview-based survey. J Hosp Med. 2018;13(10):702-705. https://doi.org/10.12788/jhm.2977.
7. Leyenaar JK, Ralston SL, Shieh MS, Pekow PS, Mangione-Smith R, Lindenauer PK. Epidemiology of pediatric hospitalizations at general hospitals and freestanding children’s hospitals in the United States. J Hosp Med. 2016;11(11):743-749. https://doi.org/10.1002/jhm.2624.
8. Harris PA, Taylor R, Thielke R, Payne J, Gonzalez N, Conde JG. Research electronic data capture (REDCap)--a metadata-driven methodology and workflow process for providing translational research informatics support. J Biomed Inform. 2009;42(2):377-381. https://doi.org/10.1016/j.jbi.2008.08.010.
9. Laurie AP, Aisha BD, Mary CO. Association between practice setting and pediatric hospitalist career satisfaction. Hosp Pediatr. 2013;3(3):285-291. https://doi.org/10.1542/hpeds.2012-0085
10. Hinami K, Whelan CT, Wolosin RJ, Miller JA, Wetterneck TB. Worklife and satisfaction of hospitalists: toward flourishing careers. J Gen Intern Med. 2011;27(1):28-36. https://doi.org/10.1007/s11606-011-1780-z.
11. Hinami K, Whelan CT, Miller JA, Wolosin RJ, Wetterneck TB. Job characteristics, satisfaction, and burnout across hospitalist practice models. J Hosp Med. 2012;7(5):402-410. https://doi.org/10.1002/jhm.1907
As a newly recognized specialty, pediatric hospital medicine (PHM) continues to expand and diversify.1 Pediatric hospitalists care for children in hospitals ranging from small, rural community hospitals to large, free-standing quaternary children’s hospitals.2-4 In addition, more than 10% of graduating pediatric residents are seeking future careers within PHM.5
In 2018, Fromme et al. published a study describing clinical workload for pediatric hospitalists within university-based settings.6 They characterized the diversity of work models and programmatic sustainability but limited the study to university-based programs. With over half of children receiving care within community hospitals,7 workforce patterns for community-based pediatric hospitalists should be characterized to maximize sustainability and minimize attrition across the field.
In this study, we describe programmatic variability in clinical work expectations of 70 community-based PHM programs. We aimed to describe existing work models and expectations of community-based program leaders as they relate to their unique clinical setting.
METHODS
We conducted a cross-sectional survey of community-based PHM site directors through structured interviews. Community hospital programs were self-defined by the study participants, although typically defined as general hospitals that admit pediatric patients and are not free-standing or children’s hospitals within a general hospital. Survey respondents were asked to answer questions only reflecting expectations at their community hospital.
Survey Design and Content
Building from a tool used by Fromme et al.6 we created a 12-question structured interview questionnaire focused on three areas: (1) full-time employment (FTE) metrics including definitions of a 1.0 FTE, “typical” shifts, and weekend responsibilities; (2) work volume including census parameters, service-line coverage expectations, back-up systems, and overnight call responsibilities; and (3) programmatic model including sense of sustainability (eg, minimizing burnout and attrition), support for activities such as administrative or research time, and employer model (Appendix).
We modified the survey through research team consensus. After pilot-testing by research team members at their own sites, the survey was refined for item clarity, structural design, and length. We chose to administer surveys through phone interviews over a traditional distribution due to anticipated variability in work models. The research team discussed how each question should be asked, and responses were clarified to maintain consistency.
Survey Administration
Given the absence of a national registry or database for community-based PHM programs, study participation was solicited through an invitation posted on the American Academy of Pediatrics Section on Hospital Medicine (AAP SOHM) Listserv and the AAP SOHM Community Hospitalist Listserv in May 2018. Invitations were posted twice at two weeks apart. Each research team member completed 6-19 interviews. Responses to survey questions were recorded in REDCap, a secure, web-based data capture instrument.8
Participating in the study was considered implied consent, and participants did not receive a monetary incentive, although respondents were offered deidentified survey data for participation. The study was exempted through the University of Chicago Institutional Review Board.
Data Analysis
Employers were dichotomized as community hospital employer (including primary community hospital employment/private organization) or noncommunity hospital employer (including children’s/university hospital employment or school of medicine). Descriptive statistics were reported to compare the demographics of two employer groups. P values were calculated using two-sample t-tests for the continuous variables and chi-square or Fisher-exact tests for the categorical variables. Mann–Whitney U-test was performed for continuous variables without normality. Analyses were performed using the R Statistical Programming Language (R Foundation for Statistical Computing, Vienna, Austria), version 3.4.3.
RESULTS
Participation and Program Characteristics
We interviewed 70 community-based PHM site directors representing programs across 29 states (Table 1) and five geographic regions: Midwest (34.3%), Northeast (11.4%), Southeast (15.7%), Southwest (4.3%), and West (34.3%). Employer models varied across groups, with more noncommunity hospital employers (57%) than community hospital employers (43%). The top three services covered by pediatric hospitalists were pediatric inpatient or observation bed admissions (97%), emergency department consults (89%), and general newborns (67%). PHM programs also provided coverage for other services, including newborn deliveries (43%), Special Care Nursery/Level II Neonatal Intensive Care Unit (41%), step-down unit (20%), and mental health units (13%). About 59% of programs provided education for family medicine residents, 36% were for pediatric residents, and 70% worked with advanced practice providers. The majority of programs (70%) provided in-house coverage overnight.
Clinical Work Expectations and Employer Model
Clinical work expectations varied broadly across programs (Table 2). The median expected hours for a 1.0 FTE was 1,882 hours per year (interquartile range [IQR] 1,805, 2,016), and the median expected weekend coverage/year (defined as covering two days or two nights of the weekend) was 21 (IQR 14, 24). Most programs did not expand staff coverage based on seasonality (73%), and less than 20% of programs operated with a census cap. Median support for nondirect patient care activities was 4% (IQR 0,10) of a program’s total FTE (ie, a 5.0 FTE program would have 0.20 FTE support). Programs with community hospital employers had an 8% higher expectation of 1.0 FTE hours/year (P = .01) and viewed an appropriate pediatric morning census as 20% higher (P = .01; Table 2).
Program Sustainability
DISCUSSION
To our knowledge, this study is the first to describe clinical work models exclusively for pediatric community hospitalist programs. We found that expectations for clinical FTE hours, weekend coverage, appropriate morning census, support for nondirect patient care activities, and perception of sustainability varied broadly across programs. The only variable affecting some of these differences was employer model, with those employed by a community hospital employer having a higher expectation for hours/year and appropriate morning pediatric census than those employed by noncommunity hospital employers.
With a growing emphasis on physician burnout and career satisfaction,9-11 understanding the characteristics of community hospital work settings is critical for identifying and building sustainable employment models. Previous studies have identified that the balance of clinical and nonclinical responsibilities and the setting of community versus university-based programs are major contributors to burnout and career satisfaction.9,11 Interestingly, although community hospital-based programs have limited FTE for nondirect patient care activities, we found that a higher percentage of program site directors perceived their program models as sustainable when compared with university-based programs in prior research (63% versus 50%).6 Elucidating why community hospital PHM programs are perceived as more sustainable provides an opportunity for future research. Potential reasons may include fewer academic requirements for promotion or an increased connection to a local community.
We also found that the employer model had a statistically significant impact on expected FTE hours per year but not on perception of sustainability. Programs employed by community hospitals worked 8% more hours per year than those employed by noncommunity hospital employers and accepted a higher morning pediatric census. This variation in hours and census level appropriateness is likely multifactorial, potentially from higher nonclinical expectations for promotion (eg, academic or scholarly production) at school of medicine or children’s hospital employed programs versus limited reimbursement for administrative responsibilities within community hospital employment models.
There are several potential next steps for our findings. As our data are the first attempt (to our knowledge) at describing the current practice and expectations exclusively within community hospital programs, this study can be used as a starting point for the development of workload expectation standards. Increasing transparency nationally for individual community programs potentially promotes discussions around burnout and attrition. Having objective data to compare program models may assist in advocating with local hospital leadership for restructuring that better aligns with national norms.
Our study has several limitations. First, our sampling frame was based upon a self-selection of program directors. This may have led to a biased representation of programs with higher workloads motivated to develop a standard to compare with other programs, which may have potentially led to an overestimation of hours. Second, without a registry or database for community-based pediatric hospitalist programs, we do not know the percentage of community-based programs that our sample represents. Although our results cannot speak for all community PHM programs, we attempted to mitigate nonresponse bias through the breadth of programs represented, which spanned 29 states, five geographic regions, and teaching and nonteaching programs. The interview-based method for data collection allowed the research team to clarify questions and responses across sites, thereby improving the quality and consistency of the data for the represented study sample. Finally, other factors possibly contributed to sustainability that we did not address in this study, such as programs that are dependent on billable encounters as part of their salary support.
CONCLUSION
As a newly recognized subspecialty, creating a reference for community-based program leaders to determine and discuss individual models and expectations with hospital administrators may help address programmatic sustainability. It may also allow for the analysis of long-term career satisfaction and longevity within community PHM programs based on workload. Future studies should further explore root causes for workload discrepancies between community and university employed programs along with establishing potential standards for PHM program development.
Acknowledgments
We would like to thank the Stanford School of Medicine Quantitative Sciences Unit staff for their assistance in statistical analysis.
Disclosure
The authors have nothing to disclose.
1. Robert MW, Lee G. Zero to 50,000—The 20th anniversary of the hospitalist. N Engl J Med. 2016;375(11):1009-1011. https://doi.org/10.1056/NEJMp1607958.
2. Gosdin C, Simmons J, Yau C, Sucharew H, Carlson D, Paciorkowski N. Survey of academic pediatric hospitalist programs in the US: organizational, administrative, and financial factors. J Hosp Med. 2013;8(6):285-291. https://doi.org/10.1002/jhm.2020.
3. Paul DH, Jennifer D, Elizabeth R, et al. Proposed dashboard for pediatric hospital medicine groups. Hosp Pediatr. 2012;2(2):59-68. https://doi.org/10.1542/hpeds.2012-0004
4. Gary LF, Kathryn B, Kamilah N, Indu L. Characteristics of the pediatric hospitalist workforce: its roles and work environment. Pediatrics 2007;120(1):33-39. https://doi.org/10.1542/peds.2007-0304
5. Leyenaar JK, Frintner MP. Graduating pediatric residents entering the hospital medicine workforce. 2006-2015. Acad Pediatr. 2018;18(2):200-207. https://doi.org/10.1016/j.acap.2017.05.001.
6. Fromme HB, Chen CO, Fine BR, Gosdin C, Shaughnessy EE. Pediatric hospitalist workload and sustainability in university-based programs: results from a national interview-based survey. J Hosp Med. 2018;13(10):702-705. https://doi.org/10.12788/jhm.2977.
7. Leyenaar JK, Ralston SL, Shieh MS, Pekow PS, Mangione-Smith R, Lindenauer PK. Epidemiology of pediatric hospitalizations at general hospitals and freestanding children’s hospitals in the United States. J Hosp Med. 2016;11(11):743-749. https://doi.org/10.1002/jhm.2624.
8. Harris PA, Taylor R, Thielke R, Payne J, Gonzalez N, Conde JG. Research electronic data capture (REDCap)--a metadata-driven methodology and workflow process for providing translational research informatics support. J Biomed Inform. 2009;42(2):377-381. https://doi.org/10.1016/j.jbi.2008.08.010.
9. Laurie AP, Aisha BD, Mary CO. Association between practice setting and pediatric hospitalist career satisfaction. Hosp Pediatr. 2013;3(3):285-291. https://doi.org/10.1542/hpeds.2012-0085
10. Hinami K, Whelan CT, Wolosin RJ, Miller JA, Wetterneck TB. Worklife and satisfaction of hospitalists: toward flourishing careers. J Gen Intern Med. 2011;27(1):28-36. https://doi.org/10.1007/s11606-011-1780-z.
11. Hinami K, Whelan CT, Miller JA, Wolosin RJ, Wetterneck TB. Job characteristics, satisfaction, and burnout across hospitalist practice models. J Hosp Med. 2012;7(5):402-410. https://doi.org/10.1002/jhm.1907
© 2019 Society of Hospital Medicine
Improving Resident Feedback on Diagnostic Reasoning after Handovers: The LOOP Project
One of the most promising methods for improving medical decision-making is learning from the outcomes of one’s decisions and either maintaining or modifying future decision-making based on those outcomes.1-3 This process of iterative improvement over time based on feedback is called calibration and is one of the most important drivers of lifelong learning and improvement.1
Despite the importance of knowing the outcomes of one’s decisions, this seldom occurs in modern medical education.4 Learners do not often obtain specific feedback about the decisions they make within a short enough time frame to intentionally reflect upon and modify that decision-making process.3,5 In addition, almost every patient admitted to a teaching hospital will be cared for by multiple physicians over the course of a hospitalization. These care transitions may be seen as barriers to high-quality care and education, but we suggest a different paradigm: transitions of care present opportunities for trainees to be teammates in each other’s calibration. Peers can provide specific feedback about the diagnostic process and inform one another about patient outcomes. Transitions of care allow for built-in “second opinions,” and trainees can intentionally learn by comparing the clinical reasoning involved at different points in a patient’s course. The diagnostic process is dynamic and complex; it is fundamental that trainees have the opportunity to reflect on the process to identify how and why the diagnostic process evolved throughout a patient’s hospitalization. Most inpatient diagnoses are “working diagnoses” that are likely to change. Thus, identifying the twists and turns in a patient’s diagnostic journey provides invaluable learning for future practice.
Herein, we describe the implementation and impact of a multisite initiative to engage residents in delivering feedback to their peers about medical decisions around transitions of care.
METHODS
The LOOP Project is a prospective clinical educational study that aimed to engage resident physicians to deliver feedback and updates about their colleagues’ diagnostic decision-making around care transitions. This study was deemed exempt from review by the University of Minnesota Institutional Review Board and either approved or deemed exempt by the corresponding Institutional Review Boards at all participating institutions. The study was conducted by seven programs at six institutions and included Internal Medicine, Pediatrics, and Internal Medicine–Pediatrics (PGY 1-4) residents from February 2017 to June 2017. Residents rotating through participating clinical services during the study period were invited to participate and given further information by site leads via informational presentations, written handouts, and/or emails.
The intervention entailed residents delivering structured feedback to their colleagues regarding their patients’ diagnoses after transitions of care. The predominant setting was the inpatient hospital medicine day-shift team providing feedback to the night-shift team regarding overnight admissions. Feedback about patients (usually chosen by the day-shift team) was delivered through completion of a standard templated form (Figure) usually sent within 24 hours after hospital admission through secure messaging (ie, EPIC In-Basket message utilizing a Smartphrase of the LOOP feedback form). A 24-hour time period was chosen to allow for rapid cycling of feedback focusing on initial diagnostic assessment. Site leads and resident champions promoted the project through presentations, informal discussions, and prizes for high completion rates of forms and surveys (ie, coffee cards and pizza).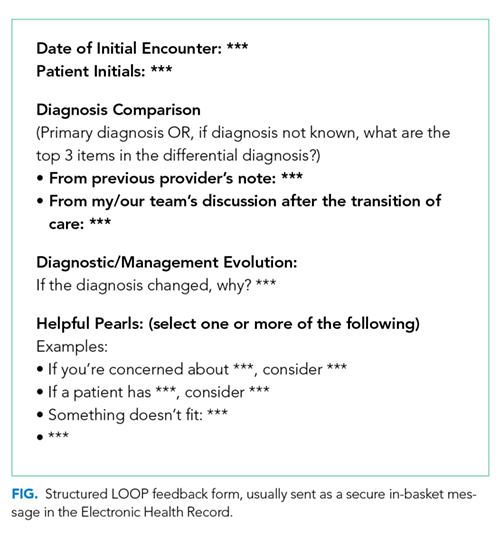
Feedback forms were collected by site leads. A categorization rubric was developed during a pilot phase. Diagnoses before and after the transition of care were categorized as no change, diagnostic refinement (ie, the initial diagnosis was modified to be more specific), disease evolution (ie, the patient’s physiology or disease course changed), or major diagnostic change (ie, the initial and subsequent diagnoses differed substantially). Site leads acted as single-coders and conference calls were held to discuss coding and build consensus regarding the taxonomy. Diagnoses were not labeled as “right” or “wrong”; instead, categorization focused on differences between diagnoses before and after transitions of care.
Residents were invited to complete surveys before and after the rotation during which they had the opportunity to give or receive feedback. A unique identifier was entered by each participant to allow pairing of pre- and postsurveys. The survey (Appendix 1) was developed and refined during the initial pilot phase at the University of Minnesota. Surveys were collected using RedCap and analyzed using SAS version 9.3 (SAS Institute Inc., Cary, North Carolina). Differences between pre- and postsurveys were calculated using paired t-tests for continuous variables, and descriptive statistics were used for demographic and other items. Only surveys completed by individuals who completed both pre- and postsurveys were included in the analysis.
RESULTS
Overall, there were 716 current residents in the training programs that participated in this study; one site planned on participating but did not complete any forms. A total of 405 residents were eligible to participate during the study period. Overall, 221 (54.5%)
Survey results (Table) indicated significantly improved self-efficacy in identifying cognitive errors in residents’ own practice, identifying why those errors occurred, and identifying strategies to decrease future diagnostic errors. Participants noted increased frequency of discussions within teams regarding differential diagnoses, diagnostic errors, and why diagnoses changed over time. The feedback process was viewed positively by participants, who were also generally satisfied with the overall quality, frequency, and value of the feedback received. After the intervention, participants reported an increase in the amount of feedback received for night admissions and an overall increase in the perception that nighttime admissions were as “educational” as daytime admissions.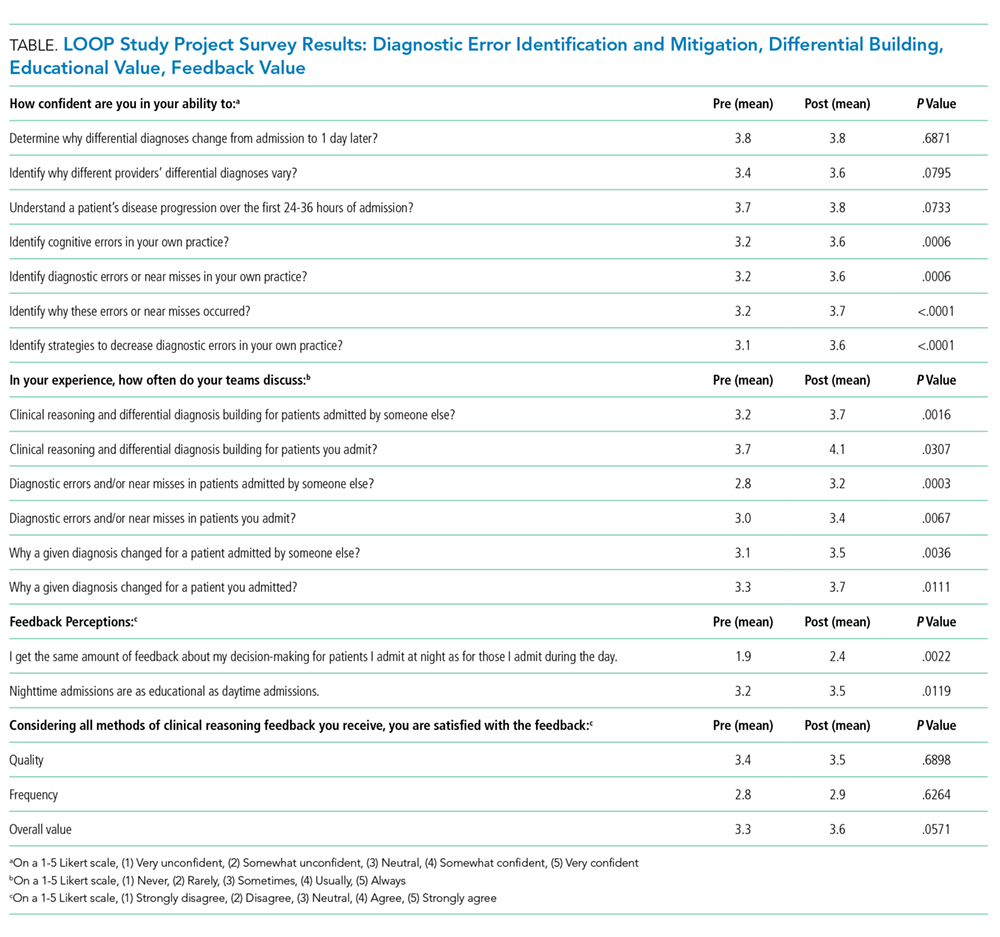
Of 544 collected forms, 238 (43.7%) showed some diagnostic change. These changes were further categorized into disease evolution (60 forms, 11.0%), diagnostic refinement (109 forms, 20.0%), and major diagnostic change (69 forms, 12.7%).
CONCLUSION
This study suggests that an intervention to operationalize standardized, structured feedback about diagnostic decision-making around transitions of care is a promising approach to improve residents’ understanding of changes in, and evolution of, the diagnostic process, as well as improve the perceived educational value of overnight admissions. In our results, over 40% of the patients admitted by residents had some change in their diagnoses after a transition of care during their early hospitalization. This finding highlights the importance of ensuring that trainees have the opportunity to know the outcomes of their decisions. Indeed, residents should be encouraged to follow-up on their own patients without prompting; however, studies show that this practice is uncommon and interventions beyond admonition are necessary.4
The diagnostic change rate observed in this study confirms that diagnosis is an iterative process and that the concept of a working diagnosis is key—a diagnosis made at admission will very likely be modified by time, the natural history of the disease, and new clinical information. When diagnoses are viewed as working diagnoses, trainees may be empowered to better understand the diagnostic process. As learners and teachers adopt this perspective, training programs are more likely to be successful in helping learners calibrate toward expertise.
Previous studies have questioned whether resident physicians view overnight admissions as valuable.6 After our intervention, we found an increase in both the amount of feedback received and the proportion of participants who agreed that night and day admissions were equally educational, suggesting that targeted diagnostic reasoning feedback can bolster educational value of nighttime admissions.
This study presents a number of limitations. First, the survey response rate was low, which could potentially lead to biased results. We excluded those respondents who did not respond to both the pre- and postsurveys from the analysis. Second, we did not measure actual change in diagnostic performance. While learners did report learning and saw feedback as valuable, self-identified learning points may not always translate to improved patient care. Additionally, residents chose the patients for whom feedback was provided, and the diagnostic change rate described may be overestimated. We did not track the total number of admissions for which feedback could have been delivered during the study. We did not include a control group, and the intervention may not be responsible for changing learners’ perceptions. However, the included programs were not implementing other new protocols focused on diagnostic reasoning during the study period. In addition, we addressed diagnostic changes early in a hospital course; a comprehensive program should address more feedback loops (eg, discharging team to admitting team).
This work is a pilot study; for future interventions focused on improving calibration to be sustainable, they should be congruent with existing clinical workflows and avoid adding to the stress and/or cognitive load of an already-busy clinical experience. The most optimal strategies for delivering feedback about clinical reasoning remain unclear.
In summary, a program to deliver structured feedback among resident physicians about diagnostic reasoning across care transitions for selected hospitalized patients is viewed positively by trainees, is feasible, and leads to changes in resident perception and self-efficacy. Future studies and interventions should aim to provide feedback more systematically, rather than just for selected patients, and objectively track diagnostic changes over time in hospitalized patients. While truly objective diagnostic information is challenging to obtain, comparing admission and other inpatient diagnoses to discharge diagnoses or diagnoses from primary care follow-up visits may be helpful. In addition, studies should aim to track trainees’ clinical decision-making over time and determine the effectiveness of feedback at improving diagnostic performance through calibration.
Acknowledgments
The authors thank the trainees who participated in this study, as well as the residency leadership at participating institutions. The authors also thank Qi Wang, PhD, for providing statistical analysis.
Disclosures
The authors have nothing to disclose.
Funding
The study was funded by an AAIM Innovation Grant and local support at each participating institution.
1. Croskerry P. The feedback sanction. Acad Emerg Med. 2000;7(11):1232-1238. https://doi.org/10.1111/j.1553-2712.2000.tb00468.x.
2. Trowbridge RL, Dhaliwal G, Cosby KS. Educational agenda for diagnostic error reduction. BMJ Qual Saf. 2013;22(Suppl 2):ii28-ii32. https://doi.org/10.1136/bmjqs-2012-001622.
3. Dhaliwal G. Clinical excellence: make it a habit. Acad Med. 2012;87(11):1473. https://doi.org/10.1097/ACM.0b013e31826d68d9.
4. Shenvi EC, Feupe SF, Yang H, El-Kareh R. Closing the loop: a mixed-methods study about resident learning from outcome feedback after patient handoffs. Diagnosis. 2018;5(4):235-242. https://doi.org/10.1515/dx-2018-0013.
5. Rencic J. Twelve tips for teaching expertise in clinical reasoning. Med Teach. 2011;33(11):887-892. https://doi.org/10.3109/0142159X.2011.558142.
6. Bump GM, Zimmer SM, McNeil MA, Elnicki DM. Hold-over admissions: are they educational for residents? J Gen Intern Med. 2014;29(3):463-467. https://doi.org/10.1007/s11606-013-2667-y.
One of the most promising methods for improving medical decision-making is learning from the outcomes of one’s decisions and either maintaining or modifying future decision-making based on those outcomes.1-3 This process of iterative improvement over time based on feedback is called calibration and is one of the most important drivers of lifelong learning and improvement.1
Despite the importance of knowing the outcomes of one’s decisions, this seldom occurs in modern medical education.4 Learners do not often obtain specific feedback about the decisions they make within a short enough time frame to intentionally reflect upon and modify that decision-making process.3,5 In addition, almost every patient admitted to a teaching hospital will be cared for by multiple physicians over the course of a hospitalization. These care transitions may be seen as barriers to high-quality care and education, but we suggest a different paradigm: transitions of care present opportunities for trainees to be teammates in each other’s calibration. Peers can provide specific feedback about the diagnostic process and inform one another about patient outcomes. Transitions of care allow for built-in “second opinions,” and trainees can intentionally learn by comparing the clinical reasoning involved at different points in a patient’s course. The diagnostic process is dynamic and complex; it is fundamental that trainees have the opportunity to reflect on the process to identify how and why the diagnostic process evolved throughout a patient’s hospitalization. Most inpatient diagnoses are “working diagnoses” that are likely to change. Thus, identifying the twists and turns in a patient’s diagnostic journey provides invaluable learning for future practice.
Herein, we describe the implementation and impact of a multisite initiative to engage residents in delivering feedback to their peers about medical decisions around transitions of care.
METHODS
The LOOP Project is a prospective clinical educational study that aimed to engage resident physicians to deliver feedback and updates about their colleagues’ diagnostic decision-making around care transitions. This study was deemed exempt from review by the University of Minnesota Institutional Review Board and either approved or deemed exempt by the corresponding Institutional Review Boards at all participating institutions. The study was conducted by seven programs at six institutions and included Internal Medicine, Pediatrics, and Internal Medicine–Pediatrics (PGY 1-4) residents from February 2017 to June 2017. Residents rotating through participating clinical services during the study period were invited to participate and given further information by site leads via informational presentations, written handouts, and/or emails.
The intervention entailed residents delivering structured feedback to their colleagues regarding their patients’ diagnoses after transitions of care. The predominant setting was the inpatient hospital medicine day-shift team providing feedback to the night-shift team regarding overnight admissions. Feedback about patients (usually chosen by the day-shift team) was delivered through completion of a standard templated form (Figure) usually sent within 24 hours after hospital admission through secure messaging (ie, EPIC In-Basket message utilizing a Smartphrase of the LOOP feedback form). A 24-hour time period was chosen to allow for rapid cycling of feedback focusing on initial diagnostic assessment. Site leads and resident champions promoted the project through presentations, informal discussions, and prizes for high completion rates of forms and surveys (ie, coffee cards and pizza).
Feedback forms were collected by site leads. A categorization rubric was developed during a pilot phase. Diagnoses before and after the transition of care were categorized as no change, diagnostic refinement (ie, the initial diagnosis was modified to be more specific), disease evolution (ie, the patient’s physiology or disease course changed), or major diagnostic change (ie, the initial and subsequent diagnoses differed substantially). Site leads acted as single-coders and conference calls were held to discuss coding and build consensus regarding the taxonomy. Diagnoses were not labeled as “right” or “wrong”; instead, categorization focused on differences between diagnoses before and after transitions of care.
Residents were invited to complete surveys before and after the rotation during which they had the opportunity to give or receive feedback. A unique identifier was entered by each participant to allow pairing of pre- and postsurveys. The survey (Appendix 1) was developed and refined during the initial pilot phase at the University of Minnesota. Surveys were collected using RedCap and analyzed using SAS version 9.3 (SAS Institute Inc., Cary, North Carolina). Differences between pre- and postsurveys were calculated using paired t-tests for continuous variables, and descriptive statistics were used for demographic and other items. Only surveys completed by individuals who completed both pre- and postsurveys were included in the analysis.
RESULTS
Overall, there were 716 current residents in the training programs that participated in this study; one site planned on participating but did not complete any forms. A total of 405 residents were eligible to participate during the study period. Overall, 221 (54.5%)
Survey results (Table) indicated significantly improved self-efficacy in identifying cognitive errors in residents’ own practice, identifying why those errors occurred, and identifying strategies to decrease future diagnostic errors. Participants noted increased frequency of discussions within teams regarding differential diagnoses, diagnostic errors, and why diagnoses changed over time. The feedback process was viewed positively by participants, who were also generally satisfied with the overall quality, frequency, and value of the feedback received. After the intervention, participants reported an increase in the amount of feedback received for night admissions and an overall increase in the perception that nighttime admissions were as “educational” as daytime admissions.
Of 544 collected forms, 238 (43.7%) showed some diagnostic change. These changes were further categorized into disease evolution (60 forms, 11.0%), diagnostic refinement (109 forms, 20.0%), and major diagnostic change (69 forms, 12.7%).
CONCLUSION
This study suggests that an intervention to operationalize standardized, structured feedback about diagnostic decision-making around transitions of care is a promising approach to improve residents’ understanding of changes in, and evolution of, the diagnostic process, as well as improve the perceived educational value of overnight admissions. In our results, over 40% of the patients admitted by residents had some change in their diagnoses after a transition of care during their early hospitalization. This finding highlights the importance of ensuring that trainees have the opportunity to know the outcomes of their decisions. Indeed, residents should be encouraged to follow-up on their own patients without prompting; however, studies show that this practice is uncommon and interventions beyond admonition are necessary.4
The diagnostic change rate observed in this study confirms that diagnosis is an iterative process and that the concept of a working diagnosis is key—a diagnosis made at admission will very likely be modified by time, the natural history of the disease, and new clinical information. When diagnoses are viewed as working diagnoses, trainees may be empowered to better understand the diagnostic process. As learners and teachers adopt this perspective, training programs are more likely to be successful in helping learners calibrate toward expertise.
Previous studies have questioned whether resident physicians view overnight admissions as valuable.6 After our intervention, we found an increase in both the amount of feedback received and the proportion of participants who agreed that night and day admissions were equally educational, suggesting that targeted diagnostic reasoning feedback can bolster educational value of nighttime admissions.
This study presents a number of limitations. First, the survey response rate was low, which could potentially lead to biased results. We excluded those respondents who did not respond to both the pre- and postsurveys from the analysis. Second, we did not measure actual change in diagnostic performance. While learners did report learning and saw feedback as valuable, self-identified learning points may not always translate to improved patient care. Additionally, residents chose the patients for whom feedback was provided, and the diagnostic change rate described may be overestimated. We did not track the total number of admissions for which feedback could have been delivered during the study. We did not include a control group, and the intervention may not be responsible for changing learners’ perceptions. However, the included programs were not implementing other new protocols focused on diagnostic reasoning during the study period. In addition, we addressed diagnostic changes early in a hospital course; a comprehensive program should address more feedback loops (eg, discharging team to admitting team).
This work is a pilot study; for future interventions focused on improving calibration to be sustainable, they should be congruent with existing clinical workflows and avoid adding to the stress and/or cognitive load of an already-busy clinical experience. The most optimal strategies for delivering feedback about clinical reasoning remain unclear.
In summary, a program to deliver structured feedback among resident physicians about diagnostic reasoning across care transitions for selected hospitalized patients is viewed positively by trainees, is feasible, and leads to changes in resident perception and self-efficacy. Future studies and interventions should aim to provide feedback more systematically, rather than just for selected patients, and objectively track diagnostic changes over time in hospitalized patients. While truly objective diagnostic information is challenging to obtain, comparing admission and other inpatient diagnoses to discharge diagnoses or diagnoses from primary care follow-up visits may be helpful. In addition, studies should aim to track trainees’ clinical decision-making over time and determine the effectiveness of feedback at improving diagnostic performance through calibration.
Acknowledgments
The authors thank the trainees who participated in this study, as well as the residency leadership at participating institutions. The authors also thank Qi Wang, PhD, for providing statistical analysis.
Disclosures
The authors have nothing to disclose.
Funding
The study was funded by an AAIM Innovation Grant and local support at each participating institution.
1. Croskerry P. The feedback sanction. Acad Emerg Med. 2000;7(11):1232-1238. https://doi.org/10.1111/j.1553-2712.2000.tb00468.x.
2. Trowbridge RL, Dhaliwal G, Cosby KS. Educational agenda for diagnostic error reduction. BMJ Qual Saf. 2013;22(Suppl 2):ii28-ii32. https://doi.org/10.1136/bmjqs-2012-001622.
3. Dhaliwal G. Clinical excellence: make it a habit. Acad Med. 2012;87(11):1473. https://doi.org/10.1097/ACM.0b013e31826d68d9.
4. Shenvi EC, Feupe SF, Yang H, El-Kareh R. Closing the loop: a mixed-methods study about resident learning from outcome feedback after patient handoffs. Diagnosis. 2018;5(4):235-242. https://doi.org/10.1515/dx-2018-0013.
5. Rencic J. Twelve tips for teaching expertise in clinical reasoning. Med Teach. 2011;33(11):887-892. https://doi.org/10.3109/0142159X.2011.558142.
6. Bump GM, Zimmer SM, McNeil MA, Elnicki DM. Hold-over admissions: are they educational for residents? J Gen Intern Med. 2014;29(3):463-467. https://doi.org/10.1007/s11606-013-2667-y.
© 2019 Society of Hospital Medicine
An On-Treatment Analysis of the MARQUIS Study: Interventions to Improve Inpatient Medication Reconciliation
Unintentional medication discrepancies in the hospital setting are common and contribute to adverse drug events, resulting in patient harm.1 Discrepancies can be resolved by implementing high-quality medication reconciliation, but there are insufficient data to guide hospitals as to which interventions are most effective at improving medication reconciliation processes and reducing harm.2 We recently reported that implementation of a best practices toolkit reduced total medication discrepancies in the Multi-Center Medication Reconciliation Quality Improvement Study (MARQUIS).3 This report describes the effect of individual toolkit components on rates of medication discrepancies with the potential for patient harm.
METHODS
Detailed descriptions of the intervention toolkit and study design of MARQUIS are published.4,5 Briefly, MARQUIS was a pragmatic, mentored, quality improvement (QI) study in which five hospitals in the United States implemented interventions from a best practices toolkit to improve medication reconciliation on noncritical care medical and surgical units from September 2011 to July 2014. We used a mentored implementation approach, in which each site identified the leaders of their local quality improvement team (ie, mentees) who received mentorship from a trained physician with QI and medication safety experience.6 Mentors conducted monthly calls with their mentees and two site visits. Sites adapted and implemented one or more components from the MARQUIS toolkit, a compilation of evidence-based best practices in medication reconciliation.5,7
The primary outcome was unintentional medication discrepancies in admission and discharge orders with the potential for causing harm, as previously described.4 Trained study pharmacists at each site took “gold standard” medication histories on a random sample of up to 22 patients per month. These medications were then compared with admission and discharge medication orders, and all unintentional discrepancies were identified. The discrepancies were then adjudicated by physicians blinded to the treatment arm, who confirmed whether discrepancies were unintentional and carried the potential for patient harm.
We employed a modification of a stepped wedge methodology to measure the incremental effect of implementing nine different intervention components, introduced at different sites over the course of the study, on the number of potentially harmful discrepancies per patient. These analyses were restricted to the postimplementation period on hospital units that implemented at least one intervention. All interventions conducted at each site were categorized by component, including dates of implementation. Each intervention component could be applied more than once per site (eg, when involving a new group of providers) or implemented on a new hospital unit or service, in which case, all dates were included in the analysis. We conducted a multivariable Poisson regression (with time divided into months) adjusted for patient factors, season, and site, with the number of potentially harmful discrepancies as the dependent variable, and the total number of gold standard medications as a model offset. The model was designed to analyze changes in the y-intercept each time an intervention component was either implemented or spread and assumed the change in the y-intercept was the same for each of these events for any given component. The model also assumes that combinations of interventions had independent additive effects.
RESULTS
Across the five participating sites, 1,648 patients were enrolled from September 2011 to July 2014. This number included 613 patients during the preimplementation period and 1,035 patients during the postimplementation period, of which 791 were on intervention units and comprised the study population. Table 1 displays the intervention components implemented by site. Sites implemented between one and seven components. The most frequently implemented intervention component was training existing staff to take the best possible medication histories (BPMHs), implemented at four sites. The regression results are displayed in Table 2. Three interventions were associated with significant decreases in potentially harmful discrepancy rates: (1) clearly defining roles and responsibilities and communicating this with clinical staff (hazard ratio [HR] 0.53, 95% CI: 0.32–0.87); (2) training existing staff to perform discharge medication reconciliation and patient counseling (HR 0.64, 95% CI: 0.46–0.89); and (3) hiring additional staff to perform discharge medication reconciliation and patient counseling (HR 0.48, 95% CI: 0.31–0.77). Two interventions were associated with significant increases in potentially harmful discrepancy rates: training existing staff to take BPMHs (HR 1.38, 95% CI: 1.21–1.57) and implementing a new electronic health record (EHR; HR 2.21, 95% CI: 1.64–2.97).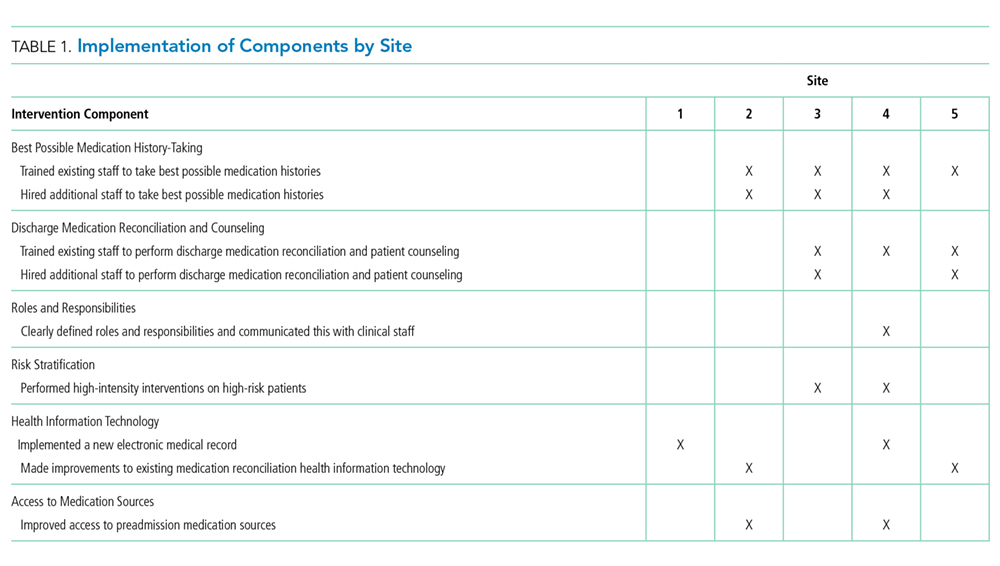
DISCUSSION
We noted that three intervention components were associated with decreased rates of unintentional medication discrepancies with potential for harm, whereas two were associated with increased rates. The components with a beneficial effect were not surprising. A prior qualitative study demonstrated the confusion related to clinicians’ roles and responsibilities during medication reconciliation; therefore, clear delineations should reduce rework and improve the medication reconciliation process.8 Other studies have shown the benefits of pharmacist involvement in the inpatient setting, particularly in reducing errors at discharge.9 However, we did not anticipate that training staff to take BPMHs would be detrimental. Possible reasons for this finding that are based on direct observations by mentors at site visits or noted during monthly calls include (1) training personnel on this task without certification of competency may not sufficiently improve their skills, leading instead to diffusion of responsibility; (2) training personnel without sufficient time to perform the task well (eg, frontline nurses with many other responsibilities) may be counterproductive compared with training a few personnel with time dedicated to this task; and (3) training existing personnel in history-taking may have been used to delay the necessary hiring of more staff to take BPMHs. Future studies could address several of these shortcomings in both the design and implementation of medication history-training intervention components.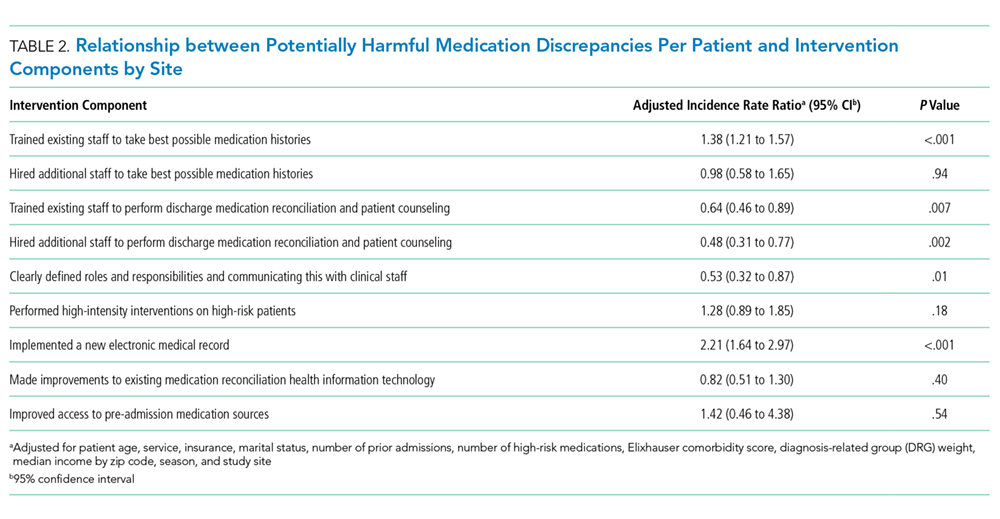
Several reasons may explain the association we found between implementing a new EHR and increased rates of discrepancies. Based on mentors’ experiences, we suspect it is because sitewide EHR implementation requires significant resources, time, and effort. Therefore, sitewide EHR implementation pulls attention away from a focus on medication safety
Our study has several limitations. We conducted an on-treatment analysis, which may be confounded by characteristics of sites that chose to implement different intervention components; however, we adjusted for sites in the analysis. Some results are based on a limited number of sites implementing an intervention component (eg, defining roles and responsibilities). Although this was a longitudinal study, and we adjusted for seasonal effects, it is possible that temporal trends and cointerventions confounded our results. The adjudication of discrepancies for the potential for harm was somewhat subjective, although we used a rigorous process to ensure the reliability of adjudication, as in prior studies.3,14 As in the main analysis of the MARQUIS study, this analysis did not measure intervention fidelity.
Based on these analyses and the literature base, we recommend that hospitals focus first on hiring and training dedicated staff (usually pharmacists) to assist with medication reconciliation at discharge.7 Hospitals should also be aware of potential increases in medication discrepancies when implementing a large vendor EHR across their institution. Further work is needed on the best ways to mitigate these adverse effects, at both the design and local site levels. Finally, the effect of medication history training on discrepancies warrants further study.
Disclosures
SK has served as a consultant to Verustat, a remote health monitoring company. All other authors have no disclosures or conflicts of interests.
Funding
This study was supported by the Agency for Healthcare Research and Quality (grant number: R18 HS019598). JLS has received funding from (1) Mallinckrodt Pharmaceuticals for an investigator-initiated study of opioid-related adverse drug events in postsurgical patients; (2) Horizon Blue Cross Blue Shield for an honorarium and travel expenses for workshop on medication reconciliation; (3) Island Peer Review Organization for honorarium and travel expenses for workshop on medication reconciliation; and, (4) Portola Pharmaceuticals for investigator-initiated study of inpatients who decline subcutaneous medications for venous thromboembolism prophylaxis. ASM was funded by a VA HSR&D Career Development Award (12-168).
Trial Registration
ClinicalTrials.gov NCT01337063
1. Cornish PL, Knowles SR, Marchesano R, et al. Unintended medication discrepancies at the time of hospital admission. Arch Intern Med. 2005;165(4):424-429. https://doi.org/10.1001/archinte.165.4.424.
2. Kaboli PJ, Fernandes O. Medication reconciliation: moving forward. Arch Intern Med. 2012;172(14):1069-1070. https://doi.org/10.1001/archinternmed.2012.2667. PubMed
3. Schnipper JL, Mixon A, Stein J, et al. Effects of a multifaceted medication reconciliation quality improvement intervention on patient safety: final results of the MARQUIS study. BMJ Qual Saf. 2018;27(12):954-964. https://doi.org/10.1136/bmjqs-2018-008233.
4. Salanitro AH, Kripalani S, Resnic J, et al. Rational and design of the Multicenter Medication Reconciliation Quality Improvement Study (MARQUIS). BMC Health Serv Res. 2013;13:230. https://doi.org/10.1186/1472-6963-13-230.
5. Mueller SK, Kripalani S, Stein J, et al. Development of a toolkit to disseminate best practices in inpatient medication reconciliation. Jt Comm J Qual Patient Saf. 2013;39(8):371-382. https://10.1016/S1553-7250(13)39051-5.
6. Maynard GA, Budnitz TL, Nickel WK, et al. 2011 John M. Eisenberg patient safety and quality awards. Mentored implementation: building leaders and achieving results through a collaborative improvement model. Innovation in patient safety and quality at the national level. Jt Comm J Qual Patient Saf. 2012;38(7):301-310. https://doi.org/10.1016/S1553-7250(12)38040-9.
7. Mueller SK, Sponsler KC, Kripalani S, Schnipper JL. Hospital-based medication reconciliation practices: a systematic review. Arch Intern Med. 2012;172(14):1057-1069. https://doi.org/10.1001/archinternmed.2012.2246.
8. Vogelsmeier A, Pepper GA, Oderda L, Weir C. Medication reconciliation: a qualitative analysis of clinicians’ perceptions. Res Social Adm Pharm. 2013;9(4):419-430. https://doi.org/10.1016/j.sapharm.2012.08.002.
9. Kaboli PJ, Hoth AB, McClimon BJ, Schnipper JL. Clinical pharmacists and inpatient medical care: a systematic review. Arch Intern Med. 2006;166(9):955-964. https://doi.org/10.1001/archinte.166.9.955.
10. Plaisant C, Wu J, Hettinger AZ, Powsner S, Shneiderman B. Novel user interface design for medication reconciliation: an evaluation of Twinlist. J Am Med Inform Assoc. 2015;22(2):340-349. https://doi.org/10.1093/jamia/ocu021.
11. Bassi J, Lau F, Bardal S. Use of information technology in medication reconciliation: a scoping review. Ann Pharmacother. 2010;44(5):885-897. https://doi.org/10.1345/aph.1M699.
12. Marien S, Krug B, Spinewine A. Electronic tools to support medication reconciliation: a systematic review. J Am Med Inform Assoc. 2017;24(1):227-240. https://doi.org/10.1093/jamia/ocw068.
13. Agrawal A. Medication errors: prevention using information technology systems. Br J Clin Pharmacol. 2009;67(6):681-686. https://doi.org/10.1111/j.1365-2125.2009.03427.x.
14. Pippins JR, Gandhi TK, Hamann C, et al. Classifying and predicting errors of inpatient medication reconciliation. J Gen Intern Med. 2008;23(9):1414-1422. https://doi.org/10.1007/s11606-008-0687-9.
Unintentional medication discrepancies in the hospital setting are common and contribute to adverse drug events, resulting in patient harm.1 Discrepancies can be resolved by implementing high-quality medication reconciliation, but there are insufficient data to guide hospitals as to which interventions are most effective at improving medication reconciliation processes and reducing harm.2 We recently reported that implementation of a best practices toolkit reduced total medication discrepancies in the Multi-Center Medication Reconciliation Quality Improvement Study (MARQUIS).3 This report describes the effect of individual toolkit components on rates of medication discrepancies with the potential for patient harm.
METHODS
Detailed descriptions of the intervention toolkit and study design of MARQUIS are published.4,5 Briefly, MARQUIS was a pragmatic, mentored, quality improvement (QI) study in which five hospitals in the United States implemented interventions from a best practices toolkit to improve medication reconciliation on noncritical care medical and surgical units from September 2011 to July 2014. We used a mentored implementation approach, in which each site identified the leaders of their local quality improvement team (ie, mentees) who received mentorship from a trained physician with QI and medication safety experience.6 Mentors conducted monthly calls with their mentees and two site visits. Sites adapted and implemented one or more components from the MARQUIS toolkit, a compilation of evidence-based best practices in medication reconciliation.5,7
The primary outcome was unintentional medication discrepancies in admission and discharge orders with the potential for causing harm, as previously described.4 Trained study pharmacists at each site took “gold standard” medication histories on a random sample of up to 22 patients per month. These medications were then compared with admission and discharge medication orders, and all unintentional discrepancies were identified. The discrepancies were then adjudicated by physicians blinded to the treatment arm, who confirmed whether discrepancies were unintentional and carried the potential for patient harm.
We employed a modification of a stepped wedge methodology to measure the incremental effect of implementing nine different intervention components, introduced at different sites over the course of the study, on the number of potentially harmful discrepancies per patient. These analyses were restricted to the postimplementation period on hospital units that implemented at least one intervention. All interventions conducted at each site were categorized by component, including dates of implementation. Each intervention component could be applied more than once per site (eg, when involving a new group of providers) or implemented on a new hospital unit or service, in which case, all dates were included in the analysis. We conducted a multivariable Poisson regression (with time divided into months) adjusted for patient factors, season, and site, with the number of potentially harmful discrepancies as the dependent variable, and the total number of gold standard medications as a model offset. The model was designed to analyze changes in the y-intercept each time an intervention component was either implemented or spread and assumed the change in the y-intercept was the same for each of these events for any given component. The model also assumes that combinations of interventions had independent additive effects.
RESULTS
Across the five participating sites, 1,648 patients were enrolled from September 2011 to July 2014. This number included 613 patients during the preimplementation period and 1,035 patients during the postimplementation period, of which 791 were on intervention units and comprised the study population. Table 1 displays the intervention components implemented by site. Sites implemented between one and seven components. The most frequently implemented intervention component was training existing staff to take the best possible medication histories (BPMHs), implemented at four sites. The regression results are displayed in Table 2. Three interventions were associated with significant decreases in potentially harmful discrepancy rates: (1) clearly defining roles and responsibilities and communicating this with clinical staff (hazard ratio [HR] 0.53, 95% CI: 0.32–0.87); (2) training existing staff to perform discharge medication reconciliation and patient counseling (HR 0.64, 95% CI: 0.46–0.89); and (3) hiring additional staff to perform discharge medication reconciliation and patient counseling (HR 0.48, 95% CI: 0.31–0.77). Two interventions were associated with significant increases in potentially harmful discrepancy rates: training existing staff to take BPMHs (HR 1.38, 95% CI: 1.21–1.57) and implementing a new electronic health record (EHR; HR 2.21, 95% CI: 1.64–2.97).
DISCUSSION
We noted that three intervention components were associated with decreased rates of unintentional medication discrepancies with potential for harm, whereas two were associated with increased rates. The components with a beneficial effect were not surprising. A prior qualitative study demonstrated the confusion related to clinicians’ roles and responsibilities during medication reconciliation; therefore, clear delineations should reduce rework and improve the medication reconciliation process.8 Other studies have shown the benefits of pharmacist involvement in the inpatient setting, particularly in reducing errors at discharge.9 However, we did not anticipate that training staff to take BPMHs would be detrimental. Possible reasons for this finding that are based on direct observations by mentors at site visits or noted during monthly calls include (1) training personnel on this task without certification of competency may not sufficiently improve their skills, leading instead to diffusion of responsibility; (2) training personnel without sufficient time to perform the task well (eg, frontline nurses with many other responsibilities) may be counterproductive compared with training a few personnel with time dedicated to this task; and (3) training existing personnel in history-taking may have been used to delay the necessary hiring of more staff to take BPMHs. Future studies could address several of these shortcomings in both the design and implementation of medication history-training intervention components.
Several reasons may explain the association we found between implementing a new EHR and increased rates of discrepancies. Based on mentors’ experiences, we suspect it is because sitewide EHR implementation requires significant resources, time, and effort. Therefore, sitewide EHR implementation pulls attention away from a focus on medication safety
Our study has several limitations. We conducted an on-treatment analysis, which may be confounded by characteristics of sites that chose to implement different intervention components; however, we adjusted for sites in the analysis. Some results are based on a limited number of sites implementing an intervention component (eg, defining roles and responsibilities). Although this was a longitudinal study, and we adjusted for seasonal effects, it is possible that temporal trends and cointerventions confounded our results. The adjudication of discrepancies for the potential for harm was somewhat subjective, although we used a rigorous process to ensure the reliability of adjudication, as in prior studies.3,14 As in the main analysis of the MARQUIS study, this analysis did not measure intervention fidelity.
Based on these analyses and the literature base, we recommend that hospitals focus first on hiring and training dedicated staff (usually pharmacists) to assist with medication reconciliation at discharge.7 Hospitals should also be aware of potential increases in medication discrepancies when implementing a large vendor EHR across their institution. Further work is needed on the best ways to mitigate these adverse effects, at both the design and local site levels. Finally, the effect of medication history training on discrepancies warrants further study.
Disclosures
SK has served as a consultant to Verustat, a remote health monitoring company. All other authors have no disclosures or conflicts of interests.
Funding
This study was supported by the Agency for Healthcare Research and Quality (grant number: R18 HS019598). JLS has received funding from (1) Mallinckrodt Pharmaceuticals for an investigator-initiated study of opioid-related adverse drug events in postsurgical patients; (2) Horizon Blue Cross Blue Shield for an honorarium and travel expenses for workshop on medication reconciliation; (3) Island Peer Review Organization for honorarium and travel expenses for workshop on medication reconciliation; and, (4) Portola Pharmaceuticals for investigator-initiated study of inpatients who decline subcutaneous medications for venous thromboembolism prophylaxis. ASM was funded by a VA HSR&D Career Development Award (12-168).
Trial Registration
ClinicalTrials.gov NCT01337063
1. Cornish PL, Knowles SR, Marchesano R, et al. Unintended medication discrepancies at the time of hospital admission. Arch Intern Med. 2005;165(4):424-429. https://doi.org/10.1001/archinte.165.4.424.
2. Kaboli PJ, Fernandes O. Medication reconciliation: moving forward. Arch Intern Med. 2012;172(14):1069-1070. https://doi.org/10.1001/archinternmed.2012.2667. PubMed
3. Schnipper JL, Mixon A, Stein J, et al. Effects of a multifaceted medication reconciliation quality improvement intervention on patient safety: final results of the MARQUIS study. BMJ Qual Saf. 2018;27(12):954-964. https://doi.org/10.1136/bmjqs-2018-008233.
4. Salanitro AH, Kripalani S, Resnic J, et al. Rational and design of the Multicenter Medication Reconciliation Quality Improvement Study (MARQUIS). BMC Health Serv Res. 2013;13:230. https://doi.org/10.1186/1472-6963-13-230.
5. Mueller SK, Kripalani S, Stein J, et al. Development of a toolkit to disseminate best practices in inpatient medication reconciliation. Jt Comm J Qual Patient Saf. 2013;39(8):371-382. https://10.1016/S1553-7250(13)39051-5.
6. Maynard GA, Budnitz TL, Nickel WK, et al. 2011 John M. Eisenberg patient safety and quality awards. Mentored implementation: building leaders and achieving results through a collaborative improvement model. Innovation in patient safety and quality at the national level. Jt Comm J Qual Patient Saf. 2012;38(7):301-310. https://doi.org/10.1016/S1553-7250(12)38040-9.
7. Mueller SK, Sponsler KC, Kripalani S, Schnipper JL. Hospital-based medication reconciliation practices: a systematic review. Arch Intern Med. 2012;172(14):1057-1069. https://doi.org/10.1001/archinternmed.2012.2246.
8. Vogelsmeier A, Pepper GA, Oderda L, Weir C. Medication reconciliation: a qualitative analysis of clinicians’ perceptions. Res Social Adm Pharm. 2013;9(4):419-430. https://doi.org/10.1016/j.sapharm.2012.08.002.
9. Kaboli PJ, Hoth AB, McClimon BJ, Schnipper JL. Clinical pharmacists and inpatient medical care: a systematic review. Arch Intern Med. 2006;166(9):955-964. https://doi.org/10.1001/archinte.166.9.955.
10. Plaisant C, Wu J, Hettinger AZ, Powsner S, Shneiderman B. Novel user interface design for medication reconciliation: an evaluation of Twinlist. J Am Med Inform Assoc. 2015;22(2):340-349. https://doi.org/10.1093/jamia/ocu021.
11. Bassi J, Lau F, Bardal S. Use of information technology in medication reconciliation: a scoping review. Ann Pharmacother. 2010;44(5):885-897. https://doi.org/10.1345/aph.1M699.
12. Marien S, Krug B, Spinewine A. Electronic tools to support medication reconciliation: a systematic review. J Am Med Inform Assoc. 2017;24(1):227-240. https://doi.org/10.1093/jamia/ocw068.
13. Agrawal A. Medication errors: prevention using information technology systems. Br J Clin Pharmacol. 2009;67(6):681-686. https://doi.org/10.1111/j.1365-2125.2009.03427.x.
14. Pippins JR, Gandhi TK, Hamann C, et al. Classifying and predicting errors of inpatient medication reconciliation. J Gen Intern Med. 2008;23(9):1414-1422. https://doi.org/10.1007/s11606-008-0687-9.
© 2019 Society of Hospital Medicine
Night Call in a Teaching Hospital: 1979 and 2019
N o matter the era, few aspects of residency are more defining or memorable than overnight call. Nights can be a time of growth and learning but also of fear and uncertainty, as residents take on the responsibility of managing sick patients on their own. One of us (ASD) started his residency in 1978 at the Massachusetts General Hospital in Boston; the other two (ST and BCY) started theirs in 2016 and 2017, respectively, at the University of Toronto. In this essay, we reflect on our experiences of night call separated by 40 years, highlighting what has changed and what has stayed the same.
1979
At 6
We carried one pager that was about 7 inches long and 2 inches wide clipped to the waist of our pants. It could only make a beep; we then had to call the page operator to find out who wanted us. However, the pages were relatively few. Nurses called only when a patient was unstable, and other residents called only when a new patient was ready in the emergency department. At 9
Gathering data about patients prior to the current hospitalization required reviewing the “old chart,” which had to be delivered from patient records but was generally available when the patient was still in the ED. It contained typed discharge summaries and progress notes often handwritten by coresidents whom we knew. The handwriting was often difficult to read, outpatient notes were not included, and information from other hospitals was absent—but despite these deficiencies, we somehow managed just fine.
The patients on the inpatient ward were mostly stable, but more importantly, we had very few medications and tests to order. I recall prescribing fewer than 20 drugs—furosemide, hydrochlorothiazide, penicillins, cephalosporins, gentamicin, isoniazid, lidocaine, nitroglycerin, aminophylline, alpha-methyldopa, clonidine, propranolol, digoxin, hydralazine, indomethacin, steroids, and morphine. Orders for tests and imaging had to be physically written in the chart and could not be inputted remotely, which was a nuisance when we were away from the ward. However, we rarely ordered any imaging beyond plain radiographs at night. We did draw arterial blood gases and venous blood, administer oxygen, insert intravenous and central lines, take electrocardiograms, and perform urinalyses by microscopy. We did all these tasks ourselves for patients on the “ward service” (as opposed to the “private service”, which had to do with the type of insurance the patients possessed). As a result, we became experts in both blood drawing and intravenous line insertion—skills that might be less familiar to today’s residents.
Of course, patients did get acutely ill during the night. I recall intubating, cardioverting, performing phlebotomy to alleviate pulmonary edema, sending patients to surgery, and pronouncing death. Nevertheless, we often got sleep, and sometimes, several hours in a row. I had a rule; I always took a shower the next morning and put on clean clothes (we stayed until 5
We were often frightened by the responsibility of managing sick patients alone. On particularly challenging nights, we would record our fears and feelings in a “night call diary” in one of the conference rooms—generally at 4
There was definitely competitiveness to the work. Those who responded quickly to deteriorating patients were applauded; those who did not really know what to do were subtly disdained. However, over time, we all got the hang of it, and this led to a growing confidence that we were indeed doctors. The graded autonomy afforded by night call was a crucial part of that journey.
2019
At 6
To enable rapid remote responses, we each carry an assortment of devices on our waists or lanyards and in our pockets, such as a personal pager, ED consult pager, code blue pager, and hospital-issued smartphones capable of receiving pages, text messages, phone calls, and e-mails. Nurses, pharmacists, and other consultants communicate with us through all of these channels. Few of these interactions occur face-to-face. To our frustration, encounters with patients are frequently interrupted by a stream of beeps, rings, and vibrations—irrespective of whether we are having a difficult discussion about goals of care or performing a delicate procedure.
The ED contains a work space dedicated for residents to enter electronic orders, type notes, and review new admissions. Between consults, we try to discuss exciting cases and provide teaching to the medical students and interns, which we enjoy. Dinner is generally devoured while inputting orders. In exceptional circumstances, a brief reprieve from pages may allow the on-call team to share a meal. Depending on our role, sleep may be possible on certain nights but is never guaranteed. Moments spent with the on-call team—all of us learning, commiserating, and growing together—are some of the most memorable of residency, and many of us become close friends by the end of the rotation.
However, apart from these few familiar faces, we rarely get acquainted with the nurses or residents from other services. Many often refer to themselves by specialty rather than name and phone calls that begin with “Are you Medicine?” can end with “You should really call Orthopedics.” Meanwhile, “Medicine” and “Orthopedics” may pass each other in the hallway without recognition beyond a vague familiarity of a voice heard on the phone.
Every 10 minutes spent with a new patient is accompanied by approximately one hour of “electronic” time, which includes reading through previous medical records, reviewing laboratory data and imaging, and creating an admission note. Interns might groan as they pull up a patient’s electronic health record (EHR); irrelevant details often arise with each click of the mouse, and the cursed “copy-paste” function means that new notes often duplicate older ones. However, with time, we learn to look past the EHR’s shortcomings and appreciate several of its advantages. For example, we are now able to access test results performed outside our hospital and thus limit our repetition of investigations. We can also use the EHR to rapidly glean salient information about a patient in time-critical scenarios. This is always a satisfying process, and it makes us wonder how physicians ever practiced in the era before computers.
Today’s patients are older and sicker than ever before. Many are receiving treatments that did not exist even a decade ago. As residents, we must recognize a seemingly endless variety of drugs—a challenging but intellectually satisfying responsibility. We must also decide whether the patient’s current health state permits their continuation, or whether safer alternatives exist. Some of these decisions cannot wait until the morning.
During handover at 8
No doubt, being on call is difficult. The next day brings a feeling of relief and accomplishment, knowing that we got through it—whether by floundering or flourishing—in one piece.
CONCLUSION
The two passages described here are personal descriptions of a typical night on-call in two different eras. Readers around the world may have a very different recollection of their own experience. Nevertheless, several aspects of being on call remain constant, such as anxiety about caring for sick patients alone, fond recollections of friends made, and relief when the morning comes. Most important, however, might be the tremendous satisfaction at the opportunity to learn and grow—to become a competent physician by testing one’s physical and intellectual limits through graded autonomy
On the other hand, certain elements of night call have undeniably changed—partly a consequence of the increased number of people involved in patient care and changing communication technology. Residents today encounter a greater number of interruptions to their work flow. Tasks that require long, continuous periods of full attention are now punctuated by texts, e-mails, calls, and pages. The EHR is often clumsy to navigate, but it can also be a veritable mine of information. Finally, although residents from the same specialty may be close friends, duty hour restrictions and remote asynchronous communication may reduce familiarity with residents from other programs.
Do these descriptions resonate with your experience of night call? Keeping in mind that the 1979 vignette is described through the rose-colored lens of nostalgia, both eras have their advantages and disadvantages. We leave it to the reader to decide what has changed (plus ça change) and what has stayed the same (plus c’est la même chose).
Acknowledgments
The authors thank Micheal A. Fifer, MD (Massachusetts General Hospital), and Timothy J. Judson, MD (UCSF), for their comments on an earlier draft of this essay.
Disclosures
The authors have nothing to disclose.
© 2019 Society of Hospital Medicine