User login
Supporting Hospitals During a New Wave of COVID-19
The COVID-19 pandemic has put an extraordinary strain on US hospitals.1 In spring 2020, many hospitals had to quickly adapt to treat a surge of patients, and many more had to prepare for a potential surge. Creating reserve capacity meant halting outpatient care and elective surgeries, repurposing inpatient units, and increasing critical care staffing. Hospitals again face these difficult decisions, as COVID-19 resurges and variants of SARS-CoV-2 increasingly circulate, with large financial losses projected for 2021.2 Some large hospital systems may have the financial reserves to weather this storm, but the precarious situation facing others likely requires policy action.
Hospitals’ financial stress emanates from multiple quarters. First, revenue from elective inpatient procedures and outpatient care dropped dramatically, has not fully rebounded,3,4 and is not fully offset by revenue from COVID-19 care. Second, high unemployment may force up to 20% of commercially insured Americans into lower-reimbursing public insurance or the ranks of the uninsured, generating a projected $95 billion annual loss for hospitals.5 Third, under the current payment system, the costs of preparing for a pandemic are not directly reimbursed. Yet—whether or not they ultimately experienced a large COVID-19 caseload—hospitals’ surge preparation has involved purchasing vast quantities of protective personal equipment (PPE) and other supplies and equipment, hiring additional staff, building SARS-CoV-2 testing capacity, and expanding occupational health services. Many expenses persist as “the new normal”: admissions now require SARS-CoV-2 testing, additional staff and PPE, and often, a private room. Physical distancing requirements mean hospitals’ capacity—and thus, revenue—will remain reduced.
Private insurers, by and large, are not volunteering to cover these increased costs, and it is difficult for hospitals to pass them along. Payment terms in many contracts (eg, for Medicare) are not modifiable; even where they are, renegotiating takes time. To date, federal relief payments from the CARES Act do not fully reimburse COVID-19 losses—a particular problem for smaller and safety-net hospitals without large reserves.
This situation raises ethical concerns. For example, it is ethically relevant that COVID-19 resurgence and hospitalizations are linked to states’ decisions to reopen quickly to ease economic burdens on businesses and workers. One result has been to shift some of the pandemic’s economic burden to the healthcare sector. From a fairness perspective, there should be limits on the losses hospitals are forced to shoulder to maintain COVID-19 preparedness and services. Even if hospitals have reserves, spending them threatens funding for other essential activities, such as capital investment.
The current situation is also fraught with perverse incentives that could jeopardize safe care. With elective care remaining at risk of being reduced,6 pressure intensifies to deliver as many services as possible as quickly as possible, which may not align with patients’ best interests. Across hospitals that need to maximize volume to survive, a push to keep elective services open may emerge, even as COVID-19 prevalence may favor a shutdown. Hospitals with a heavy COVID-19 caseload may have greater difficulty reopening than competitors with lower caseloads, potentially impacting quality if patients seek elective care at lower-volume centers or in ways that disrupt continuity of care.
Ethical dilemmas are also raised by the delicate balancing of interests that hospitals have been engaging in among patient groups. How should they balance the needs of COVID-19 patients against potential harms to others who must delay care?
It is wrong to ask hospitals to make such choices when policy solutions are available. With the resurgence of COVID-19 must come a fresh, sustained program of federal financial relief for hospitals. While direct government support is the swiftest path, consideration should be given to the role of private insurers, which have benefited economically from the widespread deferment and forgoing of elective care. Voluntary or mandatory investments by insurers in helping hospitals survive the pandemic and weather the new normal are consonant with insurers’ commitment to providing their members access to high-quality healthcare.
The 200-page National Strategy document released by the Biden administration on January 21, 2021, promises some important assistance to hospitals.7 It includes plans to accelerate the production of PPE and other essential supplies using the Defense Production Act and other federal authorities, to rationalize nationwide distribution of these supplies and take steps to prevent price gouging, and to deploy federal personnel and assets to help surge critical-care personnel.
These steps, if fully funded and implemented, would bring welcome respite from some of the most vexing problems hospitals have encountered during COVID-19 surges. Yet, plans for direct financial relief for hospitals are strikingly absent from the National Strategy. Nor does the recently passed $1.9 trillion federal stimulus package provide dedicated funds for hospitals, though some funds earmarked for vaccine delivery may land at hospitals. These are consequential omissions in otherwise comprehensive, thoughtful pandemic response plans.
Future legislation should include an immediate revenue infusion to reimburse hospitals’ COVID-19 preparations and lost volume and a firm commitment of ongoing financial support for preparedness through the end of the pandemic at a level sufficient to offset COVID-19–related losses. Experience with the CARES Act also suggests specific lessons for statutory design: support for hospitals should be allocated based on actual COVID-19–related burden for preparation and care, unlike CARES Act grants that were allocated based on hospitals’ past revenue and Medicare billing. This resulted in some large payments to relatively well-off hospitals and scant support for others (eg, rural or safety-net hospitals) with substantial COVID-19–related losses, a misstep that should not be repeated.
Hospitals are an integral part of the nation’s public health system. In the context of a pandemic, they should not be forced to serve as a backstop for shortcomings in other parts of the system without assistance. They, and their mission during the pandemic, are too important to fail.
1. Khullar D, Bond AM, Schpero WL. COVID-19 and the financial health of US hospitals. JAMA. 2020;323(21):2127-2128. https://doi.org/10.1001/jama.2020.6269
2. Coleman-Lochner L. Hospitals plead for bailout in face of runaway pandemic bills. February 26, 2021. Accessed March 25, 2021. https://www.bloomberg.com/news/articles/2021-02-26/hospitals-plead-for-bailout-in-face-of-runaway-pandemic-bills
3. American Hospital Association. Hospitals and health systems continue to face unprecedented financial challenges due to COVID-19. June 2020. Accessed February 5. 2021. https://www.aha.org/system/files/media/file/2020/06/aha-covid19-financial-impact-report.pdf
4. Birkmeyer JD, Barnato A, Birkmeyer N, Bessler R, Skinner J. The impact of the COVID-19 pandemic on hospital admissions in the United States. Health Aff (Millwood). 2020;39(11):2010-2017. https://doi.org/10.1377/hlthaff.2020.00980
5. Teasdale B, Schulman KA. Are U.S. hospitals still “recession-proof”? N Engl J Med. 2020;383(13):e82. https://doi.org/10.1056/NEJMp2018846
6. Meredith JW, High KP, Freischlag JA. Preserving elective surgeries in the COVID-19 pandemic and the future. JAMA. 2020;324(17):1725-1726. https://doi.org/10.1001/jama.2020.19594
7. Biden JR. National strategy for the COVID-19 response and pandemic preparedness. Bloomberg. January 2021. Accessed February 8, 2021. https://www.whitehouse.gov/wp-content/uploads/2021/01/National-Strategy-for-the-COVID-19-Response-and-Pandemic-Preparedness.pdf
The COVID-19 pandemic has put an extraordinary strain on US hospitals.1 In spring 2020, many hospitals had to quickly adapt to treat a surge of patients, and many more had to prepare for a potential surge. Creating reserve capacity meant halting outpatient care and elective surgeries, repurposing inpatient units, and increasing critical care staffing. Hospitals again face these difficult decisions, as COVID-19 resurges and variants of SARS-CoV-2 increasingly circulate, with large financial losses projected for 2021.2 Some large hospital systems may have the financial reserves to weather this storm, but the precarious situation facing others likely requires policy action.
Hospitals’ financial stress emanates from multiple quarters. First, revenue from elective inpatient procedures and outpatient care dropped dramatically, has not fully rebounded,3,4 and is not fully offset by revenue from COVID-19 care. Second, high unemployment may force up to 20% of commercially insured Americans into lower-reimbursing public insurance or the ranks of the uninsured, generating a projected $95 billion annual loss for hospitals.5 Third, under the current payment system, the costs of preparing for a pandemic are not directly reimbursed. Yet—whether or not they ultimately experienced a large COVID-19 caseload—hospitals’ surge preparation has involved purchasing vast quantities of protective personal equipment (PPE) and other supplies and equipment, hiring additional staff, building SARS-CoV-2 testing capacity, and expanding occupational health services. Many expenses persist as “the new normal”: admissions now require SARS-CoV-2 testing, additional staff and PPE, and often, a private room. Physical distancing requirements mean hospitals’ capacity—and thus, revenue—will remain reduced.
Private insurers, by and large, are not volunteering to cover these increased costs, and it is difficult for hospitals to pass them along. Payment terms in many contracts (eg, for Medicare) are not modifiable; even where they are, renegotiating takes time. To date, federal relief payments from the CARES Act do not fully reimburse COVID-19 losses—a particular problem for smaller and safety-net hospitals without large reserves.
This situation raises ethical concerns. For example, it is ethically relevant that COVID-19 resurgence and hospitalizations are linked to states’ decisions to reopen quickly to ease economic burdens on businesses and workers. One result has been to shift some of the pandemic’s economic burden to the healthcare sector. From a fairness perspective, there should be limits on the losses hospitals are forced to shoulder to maintain COVID-19 preparedness and services. Even if hospitals have reserves, spending them threatens funding for other essential activities, such as capital investment.
The current situation is also fraught with perverse incentives that could jeopardize safe care. With elective care remaining at risk of being reduced,6 pressure intensifies to deliver as many services as possible as quickly as possible, which may not align with patients’ best interests. Across hospitals that need to maximize volume to survive, a push to keep elective services open may emerge, even as COVID-19 prevalence may favor a shutdown. Hospitals with a heavy COVID-19 caseload may have greater difficulty reopening than competitors with lower caseloads, potentially impacting quality if patients seek elective care at lower-volume centers or in ways that disrupt continuity of care.
Ethical dilemmas are also raised by the delicate balancing of interests that hospitals have been engaging in among patient groups. How should they balance the needs of COVID-19 patients against potential harms to others who must delay care?
It is wrong to ask hospitals to make such choices when policy solutions are available. With the resurgence of COVID-19 must come a fresh, sustained program of federal financial relief for hospitals. While direct government support is the swiftest path, consideration should be given to the role of private insurers, which have benefited economically from the widespread deferment and forgoing of elective care. Voluntary or mandatory investments by insurers in helping hospitals survive the pandemic and weather the new normal are consonant with insurers’ commitment to providing their members access to high-quality healthcare.
The 200-page National Strategy document released by the Biden administration on January 21, 2021, promises some important assistance to hospitals.7 It includes plans to accelerate the production of PPE and other essential supplies using the Defense Production Act and other federal authorities, to rationalize nationwide distribution of these supplies and take steps to prevent price gouging, and to deploy federal personnel and assets to help surge critical-care personnel.
These steps, if fully funded and implemented, would bring welcome respite from some of the most vexing problems hospitals have encountered during COVID-19 surges. Yet, plans for direct financial relief for hospitals are strikingly absent from the National Strategy. Nor does the recently passed $1.9 trillion federal stimulus package provide dedicated funds for hospitals, though some funds earmarked for vaccine delivery may land at hospitals. These are consequential omissions in otherwise comprehensive, thoughtful pandemic response plans.
Future legislation should include an immediate revenue infusion to reimburse hospitals’ COVID-19 preparations and lost volume and a firm commitment of ongoing financial support for preparedness through the end of the pandemic at a level sufficient to offset COVID-19–related losses. Experience with the CARES Act also suggests specific lessons for statutory design: support for hospitals should be allocated based on actual COVID-19–related burden for preparation and care, unlike CARES Act grants that were allocated based on hospitals’ past revenue and Medicare billing. This resulted in some large payments to relatively well-off hospitals and scant support for others (eg, rural or safety-net hospitals) with substantial COVID-19–related losses, a misstep that should not be repeated.
Hospitals are an integral part of the nation’s public health system. In the context of a pandemic, they should not be forced to serve as a backstop for shortcomings in other parts of the system without assistance. They, and their mission during the pandemic, are too important to fail.
1. Khullar D, Bond AM, Schpero WL. COVID-19 and the financial health of US hospitals. JAMA. 2020;323(21):2127-2128. https://doi.org/10.1001/jama.2020.6269
2. Coleman-Lochner L. Hospitals plead for bailout in face of runaway pandemic bills. February 26, 2021. Accessed March 25, 2021. https://www.bloomberg.com/news/articles/2021-02-26/hospitals-plead-for-bailout-in-face-of-runaway-pandemic-bills
3. American Hospital Association. Hospitals and health systems continue to face unprecedented financial challenges due to COVID-19. June 2020. Accessed February 5. 2021. https://www.aha.org/system/files/media/file/2020/06/aha-covid19-financial-impact-report.pdf
4. Birkmeyer JD, Barnato A, Birkmeyer N, Bessler R, Skinner J. The impact of the COVID-19 pandemic on hospital admissions in the United States. Health Aff (Millwood). 2020;39(11):2010-2017. https://doi.org/10.1377/hlthaff.2020.00980
5. Teasdale B, Schulman KA. Are U.S. hospitals still “recession-proof”? N Engl J Med. 2020;383(13):e82. https://doi.org/10.1056/NEJMp2018846
6. Meredith JW, High KP, Freischlag JA. Preserving elective surgeries in the COVID-19 pandemic and the future. JAMA. 2020;324(17):1725-1726. https://doi.org/10.1001/jama.2020.19594
7. Biden JR. National strategy for the COVID-19 response and pandemic preparedness. Bloomberg. January 2021. Accessed February 8, 2021. https://www.whitehouse.gov/wp-content/uploads/2021/01/National-Strategy-for-the-COVID-19-Response-and-Pandemic-Preparedness.pdf
© 2021 Society of Hospital Medicine
Caught in the Hotbox
A 19-year-old woman presented to the emergency department (ED) with a 14-day history of progressive fevers, night sweats, abdominal pain, nonbloody and nonbilious vomiting, diarrhea, cough, and myalgia. The fever occurred daily with no noted temporal pattern, and she had no significant weight loss. The abdominal pain was diffuse and exacerbated by eating. She experienced multiple sporadic episodes of vomiting and diarrhea daily. She denied any rash or arthralgia.
She had no known medical history and took no medications. Family history was negative for autoinflammatory and autoimmune conditions. She had emigrated from Kenya to the United States 28 days ago. Her immunization status was unknown.
This patient has prolonged fevers and evidence of multisystem involvement. The most likely etiologic categories are infectious, inflammatory, rheumatologic, and neoplastic. For febrile patients who have recently emigrated to or travelled outside of the United States, it is important to consider common infections, as well as those endemic to the nation of exposure, which in this case includes malaria, typhoid fever, tuberculosis, cholera, acute viral hepatitis, chikungunya fever, dengue fever, yellow fever, and rickettsial disease. All of these, other than tuberculosis, commonly present with fever, vomiting, diarrhea, and myalgia. She may also have bacterial pneumonia or influenza given her fever and cough, although the chronicity and persistence of symptoms would be atypical. Acute infectious gastroenteritis is a common cause of fever, vomiting, and diarrhea. Most cases resolve in 7 to 10 days, so the duration raises suspicion for a nonviral etiology or an immunocompromised state.
Inflammatory causes could include the first presentation of inflammatory bowel disease (IBD), particularly if the patient develops weight loss or eye, skin, or joint manifestations. The lack of rash or arthralgia makes rheumatologic conditions less likely. Prolonged fevers and night sweats could indicate malignancy such as intra-abdominal lymphoma, although infectious etiologies should be ruled out first.
Previously, on day 9 of symptoms, the patient presented to an ED at another institution. Laboratory evaluation at that time demonstrated an elevated aspartate aminotransferase (AST) level of 229 IU/L (reference, 0-40 IU/L) and alanine aminotransferase (ALT) level of 60 IU/L (reference, 0-32 IU/L) with normal alkaline phosphatase and bilirubin levels, proteinuria to 3+ (normal, negative/trace), ketonuria to 2+ (normal, negative), and hematuria to 2+ (normal, negative). Complete blood count and electrolytes were normal. Computed tomography (CT) scans of the chest, abdomen, and pelvis with intravenous contrast were normal and without evidence of organomegaly.
AST and ALT elevations often indicate hepatocellular damage, although the normal bilirubin levels suggest normal hepatic function. Because CT may miss extrahepatic biliary pathology, a right upper quadrant ultrasound should be obtained to better evaluate patency of the biliary system and hepatic echotexture. Coagulation studies and viral hepatitis serology should be obtained. The disproportionate elevation of AST versus ALT can suggest alcohol use or nonhepatic etiologies such as myositis. Acute viral hepatitis is less likely given there is only mild to moderate elevation in aminotransferase levels. However, the remaining infectious etiologies can have this level of elevation and should still be considered.
Enteritis and IBD are still considerations despite the normal CT results. Transient asymptomatic hematuria or proteinuria can be seen in multiple conditions, particularly proteinuria with febrile illnesses. Urine microscopy to evaluate for casts could indicate a glomerular origin of the hematuria. First morning urine protein-to-creatinine ratio would help quantify the degree of proteinuria. Serum creatinine level should be measured to determine whether there is any renal dysfunction.
While early imaging can be falsely negative, the unremarkable chest CT makes pneumonia and active pulmonary tuberculosis less likely.
Vital signs during this presentation were: temperature, 39.7 °C; heart rate, 126 beats per minute; blood pressure, 109/64 mm Hg; respiratory rate, 20 breaths per minute; and oxygen saturation, 98% on room air. She was ill-appearing, with diffuse abdominal tenderness without peritoneal signs. Other than her tachycardia, findings from her cardiopulmonary, neurologic, and skin exams were normal.
Laboratory testing revealed a white blood cell count of 4,300/µL (reference range, 4,500-13,000/µL), a hemoglobin level of 10.9 g/dL (reference range, 11.7-15.7 g/dL) with a mean corpuscular volume of 77 fL (reference range, 80-96 fL) and reticulocyte percentage of 0.5% (reference range, 0.5%-1.5%), and a platelet count of 59,000/µL (reference range, 135,000-466,000/µL). Her prothrombin time was 13.5 seconds (reference range, 9.6-11.6 seconds) with an international normalized ratio of 1.3 (reference range, 0.8-1.1), erythrocyte sedimentation rate of 46 mm/h (reference range, 0-20 mm/h), C-reactive protein level of 7.49 mg/dL (reference range, <0.3 mg/dL), and AST level of 194 units/L (reference range, 9-35 units/L). ALT, total and direct bilirubin, lipase, electrolytes, and creatinine levels were normal. An abdominal x-ray showed scattered air-fluid levels in a nonobstructed pattern.
Her mildly elevated prothrombin time and international normalized ratio suggest a coagulopathy involving either her extrinsic or common coagulation pathway, with disseminated intravascular coagulation (DIC) being most likely given her new thrombocytopenia and anemia. Hemolytic uremic syndrome and thrombotic thrombocytopenic purpura should be considered but would not cause coagulopathy. A peripheral smear to evaluate for schistocytes associated with microangiopathic hemolysis and serum fibrinogen to distinguish between DIC (low) and thrombocytopenic purpura or hemolytic uremic syndrome (normal or elevated) should be obtained. A thick and thin smear for malaria should also be performed.
Her new pancytopenia suggests bone marrow suppression or infiltration with or without a concomitant consumptive process such as sepsis with resulting DIC. Given her clinical picture, marrow infiltrative processes might include tuberculosis or malignancy, and marrow suppression may be caused by HIV or other viral infection. If she is found to have HIV, disseminated fungal or mycobacterial infections would become more likely. She now has an isolated elevated AST level, which could be secondary to hemolysis rather than hepatocyte damage. Findings from her abdominal exam are nonfocal; this is consistent with her x-ray findings, which reflect possible enteritis or colitis.
The most likely diagnosis currently is an infectious enteritis with resulting hematologic and hepatic abnormalities. Given her recent emigration from Kenya, typhoid fever and cholera are both possible, although cholera typically does not present with prolonged fever or severe abdominal pain. The severity and duration of her illness, and the abnormalities of her laboratory findings, warrant empiric therapy with ceftriaxone to treat possible severe Salmonella enterica infection while awaiting blood and stool cultures.
The patient was admitted to the hospital and her symptoms continued. Results of serum HIV 1 and 2 polymerase chain reactions, herpes simplex virus 1 and 2 polymerase chain reactions, three malaria smears, human T-lymphotropic virus serologies, Toxoplasma serology, Bartonella serology, a stool culture, and multiple large volume blood cultures were negative. Serologic testing for hepatitis A, B, and C, Epstein-Barr virus, cytomegalovirus, and dengue virus were negative for acute infection. Results of an interferon-gamma release assay were indeterminate; results of purified protein derivative (PPD) and Candida antigen control testing were both negative. Ceruloplasmin and α1-antitrypsin levels were normal. An abdominal ultrasound showed central intrahepatic biliary duct dilatation, splenomegaly, and sluggish portal venous flow.
While central intrahepatic biliary ductal dilation could be caused by an obstructive lesion, none were seen on CT or ultrasound. Her normal alkaline phosphatase and bilirbuin levels also suggest functional patency of the biliary system. The thrombocytopenia, splenomegaly, and sluggish portal venous flow suggest possible portal hypertension, though no cirrhotic changes were noted on the ultrasound or abdominal CT. Her negative PPD and Candida antigen control results may suggest underlying immune dysregulation or suppression, though anergy could be secondary to sepsis.
Given her negative initial infectious evaluation, other etiologies such as atypical infections, rheumatologic disorders, and malignancies warrant consideration. She has no murmur; however, subacute bacterial endocarditis with a fastidious organism is possible, which could be investigated with a transthoracic echocardiogram. Other tests to consider include blood cultures for fungi and atypical mycobacterial species, and serology for Coxiella burnetii, chikungunya virus, and yellow fever. Rheumatologic conditions such as systemic lupus erythematosus, hemophagocytic lymphohistiocytosis (HLH), or adult Still’s disease should be considered. Complement levels and an antinuclear antibody panel, including those for dsDNA and Smith antigen, should be performed to evaluate for systemic lupus erythematosus. Serum ferritin, fibrinogen, and triglyceride levels should be measured to evaluate for HLH. Hematologic malignancy is also a consideration, particularly given her pancytopenia. Multicentric Castleman disease can cause prolonged fevers, pancytopenia, and elevated inflammatory markers, but is less likely without lymphadenopathy. A peripheral blood smear should be sent, and a bone marrow biopsy may be needed.
Empiric ciprofloxacin was initiated; however, the patient continued to have fevers up to 39.9 °C, abdominal pain, and myalgia. Ferritin level was over 3,000 ng/mL (reference range, 8-255 ng/mL), and a soluble interleukin-2 (IL-2) receptor level was 1,188 units/mL (reference range, 45-1,105 units/mL). Triglycerides were normal.
The elevated ferritin and soluble IL-2 levels raise concern for HLH. Hyperferritinemia is relatively nonspecific because extremely elevated ferritin can be seen with other conditions, such as renal failure, hepatocellular injury, infection, rheumatologic conditions, and hematologic malignancy. Soluble IL-2 receptor elevation is more specific for HLH than ferritin or triglycerides, but alone does not make the diagnosis because it can be elevated in other rheumatologic disorders and malignancy. The HLH-2004 criteria are commonly used and require either molecular diagnostic testing or meeting at least five out of eight clinical and lab criteria to make the diagnosis. Our patient currently meets three criteria (fever, splenomegaly, and elevated ferritin). Elevated soluble IL-2 is part of the HLH-2004 criteria, but her level of elevation does not meet the required threshold (≥2,400 units/mL). Her cytopenias have also not quite met the HLH-2004 thresholds (two of the following three: hemoglobin <9 g/dL, platelets <100,000/µL, and/or absolute neutrophil count <1,000/µL). Elevated aminotransferase levels and DIC are not part of the HLH-2004 criteria but are often seen with HLH.
Evaluation for an underlying infectious, rheumatologic, or malignant trigger should continue as previously discussed. If this patient does have HLH, it is most likely secondary to an infection, autoimmune disease, or malignancy rather than genetic HLH. HLH has a high mortality rate, but before beginning treatment with immunosuppressive agents, a peripheral smear and a bone marrow biopsy should be performed to evaluate for hematologic malignancy or signs of hemophagocytosis.
Empiric ciprofloxacin covers most bacterial etiologies of diarrhea, including those previously mentioned such as cholera and most strains of S enterica. Her symptoms and laboratory findings (including cytopenias, elevated aminotransferases, and coagulopathy) could suggest enteric fever due to S enterica serovar Typhi, which is endemic in Kenya. Results of blood and stool cultures, though negative, are relatively insensitive for this organism, particularly this far into the illness course. A bone marrow biopsy may also help with diagnosis of occult typhoid fever because marrow culture can be more sensitive than blood or stool culture.
A bone marrow aspiration revealed hemophagocytic histiocytes, no malignant cells, and negative bacterial (including anaerobic), fungal, and acid-fast bacilli cultures. Considering the high mortality rate of untreated HLH/macrophage activation syndrome (MAS), empiric glucocorticoid administration was considered. However, this was withheld due to concern for ongoing undetected infection given her persistent fever and systemic symptoms.
There should still be high suspicion for HLH. Further evaluation for other laboratory manifestations of HLH such as fibrinogen and natural killer cell activity should be considered, as well as repeating her complete blood count to see if her cytopenias have progressed. Her marrow shows no evidence of hematologic malignancy, so other triggers of possible HLH should be sought out by continuing the workup. Consulting specialists from rheumatology and infectious disease may help clarify possible underlying diagnoses and the best management plan. If she continues to have organ damage or clinically worsens, it may be prudent to empirically broaden her antibiotic coverage and begin antifungal agents while starting glucocorticoid therapy for suspected HLH.
A stool molecular screen from admission was returned positive for S enterica serovar Typhi. Ciprofloxacin was discontinued and ceftriaxone was started out of concern for antibiotic resistance. On hospital day 14, the patient’s brother presented to the ED with fever. His blood and stool cultures were positive for S enterica serovar Typhi with intermediate sensitivity to ciprofloxacin and sensitivity to ceftriaxone. With continued treatment with ceftriaxone, the patient improved significantly. Following discharge, she remained afebrile and asymptomatic. During outpatient follow up, a repeat PPD was positive and she was diagnosed with and treated for latent tuberculosis.
COMMENTARY
The evaluation of a patient who has recently emigrated from a foreign nation requires a broad differential diagnosis and a keen awareness of the clinical conditions present in the patient’s country of origin. This often involves knowledge of diseases infrequently encountered in daily practice, as well as awareness of the nuances of rare presentations and possible complications. When the presentation is not classic for a relevant infectious disease and clinical conditions from other diagnostic classes are considered, the evaluation and management of the patient is particularly challenging.
Typhoid fever is a severe systemic illness caused by the organism S enterica serovar Typhi. The organism is ingested, penetrates the small intestinal epithelium, enters the lymphoid tissue, and disseminates via the lymphatic and hematogenous routes. Onset of symptoms typically occurs 5 to 21 days after ingestion of contaminated food or water. Clinical features include fever, chills, relative bradycardia (pulse-temperature dissociation), abdominal pain, rose spots (salmon-colored macules) on the trunk and abdomen, and hepatosplenomegaly. Diarrhea is not a typical symptom of patients with typhoid fever, which can lead to a delayed or missed diagnosis. Life-threatening complications can be seen, including gastrointestinal bleeding, intestinal perforation, and meningitis.1 Typhoid fever is most prevalent in impoverished areas with poor access to sanitation. Regions with the highest incidence include south-central Asia, southeast Asia, and southern Africa.2-4 Approximately 200 to 300 cases are reported in the United States each year.5
Classically, the diagnosis is made by means of clinical symptoms and a positive culture from a sterile site. A recent study of 529 patients found that 61% had positive blood cultures and 96% had positive bone marrow cultures.6 Our patient’s diagnosis was significantly delayed by multiple negative cultures and failure to improve on first-line antibiotics, which initially suggested that the S enterica serovar Typhi stool molecular screen likely represented carriage caused by colonization. Chronic S enterica serovar Typhi carriage is defined as excretion of the organism in stool or urine 1 year or longer after acute infection. Rates of carriage range from 1% to 6%, and up to 25% of carriers have no history of typhoid fever.1,7,8 Carriage is more common in females and in those with biliary tract abnormalities.9,10
Once a presumptive diagnosis is made, antibiotic choice remains a challenge. Resistance to fluoroquinolones, the preferred drug for multidrug-resistant typhoid fever, is growing but remains rare, at approximately 5%.11,12 Ceftriaxone and azithromycin have been used successfully in areas with high resistance.13 Given the patient’s slow response to therapy even after transitioning from ciprofloxacin to ceftriaxone, her brother’s presentation and obtaining the antibiotic sensitivities for his organism were critical to confirming that our diagnosis and management decisions were correct.
One strongly considered diagnosis was HLH/MAS. MAS is an aggressive syndrome of excessive inflammation and tissue destruction caused by inappropriate immune system activation. It belongs to a group of histiocytic disorders collectively known as HLH. Aside from primary (genetic) forms, secondary forms exist that can be triggered by malignancy, infection, or rheumatologic disorders. In infection-associated HLH/MAS, viral infections are a common trigger, with Epstein-Barr virus being the most common. Association with bacterial infections, including tuberculosis and typhoid fever, has also been reported.14 Prompt therapy, often with immunosuppressive agents such as glucocorticoids, is essential for survival because there is a reported mortality rate of up to 50% when untreated.15 When infection-induced HLH/MAS occurs, treatment of the underlying infection is critical.14,15 The greatest barrier to a favorable outcome from HLH/MAS is often a delay in diagnosis because the rarity of this disease, the variable clinical presentation, and the lack of specificity of the clinical and laboratory findings make a conclusive diagnosis challenging.
In the presented case, diagnostic uncertainty challenged the decision to administer systemic glucocorticoids. Glucocorticoids conferred a risk of harm for multiple diagnoses that remained on the differential, including malignancy and infection. Her diagnostic evaluation made malignancy less likely, but because testing was unable to rule out tuberculosis as either the underlying cause or coinfection, the team opted to defer initiating glucocorticoids and instead closely monitor for a worsening inflammatory response. Following appropriate treatment of her systemic infection, her PPD was repeated and became positive. The negative PPD and Candida control obtained during her hospitalization were, therefore, likely caused by anergy in the setting of overwhelming systemic illness. Initiation of glucocorticoids prematurely in this case could have led to further harm because immunosuppression may have led to reactivation of latent tuberculosis or exacerbation of illness from an alternative but then undiagnosed infection.
The patient’s ultimate unifying diagnosis was typhoid fever; however, there are mixed expert opinions as to whether the systemic immune activation was significant enough to merit the diagnosis of infection-induced secondary HLH/MAS. Despite the high morbidity and mortality that can accompany HLH/MAS, it has been reported that a significant proportion of cases of secondary HLH/MAS can be managed effectively with treatment of the underlying etiology; this may have been the case for our patient.14,15 The clinicians in this case were caught between diagnoses, unable to safely reach either one—much like a baseball player stranded between bases. Fortunately for this patient, the diagnosis ultimately emerged after a careful and thorough workup, assisted by the more straightforward diagnosis of her brother with the same disease.
KEY TEACHING POINTS
- Salmonella enterica serovar Typhi has a high false-negative rate in blood and stool cultures; therefore, clinical suspicion should remain high in the setting of a high pre-test probability.
- Fluoroquinolones are traditionally first-line therapy for typhoid fever, but the use of ceftriaxone and azithromycin is increasing because of rising fluoroquinolone resistance.
- Hemophagocytic lymphohistiocytosis/macrophage activation syndrome is characterized by excessive inflammation and tissue destruction caused by inappropriate immune system activation. This syndrome can be fatal without appropriate immunosuppressive therapy; however, glucocorticoid administration must be pursued with caution when infection and malignancy are on the differential diagnosis.
1. Parry CM, Hien TT, Dougan G, et al. Typhoid fever. N Engl J Med. 2002;347(22):1770-1782. https://doi.org/10.1056/nejmra020201
2. Crump JA, Luby SP, Mintz ED. The global burden of typhoid fever. Bull World Health Organ. 2004;82(5):346-353.
3. Buckle GC, Walker CL, Black RE. Typhoid fever and paratyphoid fever: systematic review to estimate global morbidity and mortality for 2010. J Glob Health. 2012;2(1):010401. https://doi.org/10.7189/jogh.02.010401
4. Mogasale V, Maskery B, Ochiai RL, et al. Burden of typhoid fever in low-income and middle-income countries: a systematic, literature-based update with risk-factor adjustment. Lancet Glob Health. 2014;2(10):e570-e580. https://doi.org/10.1016/s2214-109x(14)70301-8
5. Lynch MF, Blanton EM, Bulens S, et al. Typhoid fever in the United States, 1999-2006. JAMA. 2009;302(8):859-865. https://doi.org/10.1001/jama.2009.1229
6. Mogasale V, Ramani E, Mogasale VV, Park J. What proportion of Salmonella typhi cases are detected by blood culture? a systematic literature review. Ann Clin Microbiol Antimicrob. 2016;15(1):32. https://doi.org/10.1186/s12941-016-0147-z
7. Merselis JG Jr, Kaye D, Connolly CS, Hook EW. Quantitative bacteriology of the Typhoid carrier state. Am J Trop Med Hyg. 1964;13:425-429. https://doi.org/10.4269/ajtmh.1964.13.425
8. Lanata CF, Levine MM, Ristori C, et al. Vi serology in detection of chronic Salmonella typhi carriers in an endemic area. Lancet. 1983;2(8347):441-443. https://doi.org/10.1016/s0140-6736(83)90401-4
9. Lai CW, Chan RC, Cheng AF, Sung JY, Leung JW. Common bile duct stones: a cause of chronic salmonellosis. Am J Gastroenterol. 1992;87(9):1198-1199.
10. Hofmann E, Chianale J, Rollán A, Pereira J, Ferrecio C, Sotomayor V. Blood group antigen secretion and gallstone disease in the Salmonella typhi chronic carrier state. J Infect Dis. 1993;167(4):993-994. https://doi.org/10.1093/infdis/167.4.993
11. Steel AD, Hay Burgess DC, Diaz Z, Carey ME, Zaidi AKM. Challenges and opportunities for typhoid fever control: a call for coordinated action. Clin Infect Dis. 2016;62 (Suppl 1):S4-S8. https://doi.org/10.1093/cid/civ976
12. Hendriksen RS, Leekitcharoenphon P, Lukjancenko O, et al. Genomic signature of multidrug resistant Salmonella enterica serovar Typhi isolates related to a massive outbreak in Zambia between 2010 and 2012. J Clin Microbiol. 2015;53(1):262-272. https://doi.org/10.1128/jcm.02026-14
13. Crump JA, Sjölund-Karlsson M, Gordon MA, Parry CM. Epidemiology, clinical presentation, laboratory diagnosis, antimicrobial resistance, and antimicrobial management of Salmonella infections. Clin Microbiol Rev. 2015;28(4):901-936. https://doi.org/10.1128/cmr.00002-15
14. Rouphael NG, Talati NJ, Vaughan C, Cunningham K, Moreira R, Gould C. Infections associated with haemophagocytic syndrome. Lancet Infect Dis. 2007;7(12):814-822. https://doi.org/10.1016/s1473-3099(07)70290-6
15. Fisman DN. Hemophagocytic syndromes and infection. Emerg Infect Dis. 2000;6(6):601-608. https://doi.org/10.3201/eid0606.000608
A 19-year-old woman presented to the emergency department (ED) with a 14-day history of progressive fevers, night sweats, abdominal pain, nonbloody and nonbilious vomiting, diarrhea, cough, and myalgia. The fever occurred daily with no noted temporal pattern, and she had no significant weight loss. The abdominal pain was diffuse and exacerbated by eating. She experienced multiple sporadic episodes of vomiting and diarrhea daily. She denied any rash or arthralgia.
She had no known medical history and took no medications. Family history was negative for autoinflammatory and autoimmune conditions. She had emigrated from Kenya to the United States 28 days ago. Her immunization status was unknown.
This patient has prolonged fevers and evidence of multisystem involvement. The most likely etiologic categories are infectious, inflammatory, rheumatologic, and neoplastic. For febrile patients who have recently emigrated to or travelled outside of the United States, it is important to consider common infections, as well as those endemic to the nation of exposure, which in this case includes malaria, typhoid fever, tuberculosis, cholera, acute viral hepatitis, chikungunya fever, dengue fever, yellow fever, and rickettsial disease. All of these, other than tuberculosis, commonly present with fever, vomiting, diarrhea, and myalgia. She may also have bacterial pneumonia or influenza given her fever and cough, although the chronicity and persistence of symptoms would be atypical. Acute infectious gastroenteritis is a common cause of fever, vomiting, and diarrhea. Most cases resolve in 7 to 10 days, so the duration raises suspicion for a nonviral etiology or an immunocompromised state.
Inflammatory causes could include the first presentation of inflammatory bowel disease (IBD), particularly if the patient develops weight loss or eye, skin, or joint manifestations. The lack of rash or arthralgia makes rheumatologic conditions less likely. Prolonged fevers and night sweats could indicate malignancy such as intra-abdominal lymphoma, although infectious etiologies should be ruled out first.
Previously, on day 9 of symptoms, the patient presented to an ED at another institution. Laboratory evaluation at that time demonstrated an elevated aspartate aminotransferase (AST) level of 229 IU/L (reference, 0-40 IU/L) and alanine aminotransferase (ALT) level of 60 IU/L (reference, 0-32 IU/L) with normal alkaline phosphatase and bilirubin levels, proteinuria to 3+ (normal, negative/trace), ketonuria to 2+ (normal, negative), and hematuria to 2+ (normal, negative). Complete blood count and electrolytes were normal. Computed tomography (CT) scans of the chest, abdomen, and pelvis with intravenous contrast were normal and without evidence of organomegaly.
AST and ALT elevations often indicate hepatocellular damage, although the normal bilirubin levels suggest normal hepatic function. Because CT may miss extrahepatic biliary pathology, a right upper quadrant ultrasound should be obtained to better evaluate patency of the biliary system and hepatic echotexture. Coagulation studies and viral hepatitis serology should be obtained. The disproportionate elevation of AST versus ALT can suggest alcohol use or nonhepatic etiologies such as myositis. Acute viral hepatitis is less likely given there is only mild to moderate elevation in aminotransferase levels. However, the remaining infectious etiologies can have this level of elevation and should still be considered.
Enteritis and IBD are still considerations despite the normal CT results. Transient asymptomatic hematuria or proteinuria can be seen in multiple conditions, particularly proteinuria with febrile illnesses. Urine microscopy to evaluate for casts could indicate a glomerular origin of the hematuria. First morning urine protein-to-creatinine ratio would help quantify the degree of proteinuria. Serum creatinine level should be measured to determine whether there is any renal dysfunction.
While early imaging can be falsely negative, the unremarkable chest CT makes pneumonia and active pulmonary tuberculosis less likely.
Vital signs during this presentation were: temperature, 39.7 °C; heart rate, 126 beats per minute; blood pressure, 109/64 mm Hg; respiratory rate, 20 breaths per minute; and oxygen saturation, 98% on room air. She was ill-appearing, with diffuse abdominal tenderness without peritoneal signs. Other than her tachycardia, findings from her cardiopulmonary, neurologic, and skin exams were normal.
Laboratory testing revealed a white blood cell count of 4,300/µL (reference range, 4,500-13,000/µL), a hemoglobin level of 10.9 g/dL (reference range, 11.7-15.7 g/dL) with a mean corpuscular volume of 77 fL (reference range, 80-96 fL) and reticulocyte percentage of 0.5% (reference range, 0.5%-1.5%), and a platelet count of 59,000/µL (reference range, 135,000-466,000/µL). Her prothrombin time was 13.5 seconds (reference range, 9.6-11.6 seconds) with an international normalized ratio of 1.3 (reference range, 0.8-1.1), erythrocyte sedimentation rate of 46 mm/h (reference range, 0-20 mm/h), C-reactive protein level of 7.49 mg/dL (reference range, <0.3 mg/dL), and AST level of 194 units/L (reference range, 9-35 units/L). ALT, total and direct bilirubin, lipase, electrolytes, and creatinine levels were normal. An abdominal x-ray showed scattered air-fluid levels in a nonobstructed pattern.
Her mildly elevated prothrombin time and international normalized ratio suggest a coagulopathy involving either her extrinsic or common coagulation pathway, with disseminated intravascular coagulation (DIC) being most likely given her new thrombocytopenia and anemia. Hemolytic uremic syndrome and thrombotic thrombocytopenic purpura should be considered but would not cause coagulopathy. A peripheral smear to evaluate for schistocytes associated with microangiopathic hemolysis and serum fibrinogen to distinguish between DIC (low) and thrombocytopenic purpura or hemolytic uremic syndrome (normal or elevated) should be obtained. A thick and thin smear for malaria should also be performed.
Her new pancytopenia suggests bone marrow suppression or infiltration with or without a concomitant consumptive process such as sepsis with resulting DIC. Given her clinical picture, marrow infiltrative processes might include tuberculosis or malignancy, and marrow suppression may be caused by HIV or other viral infection. If she is found to have HIV, disseminated fungal or mycobacterial infections would become more likely. She now has an isolated elevated AST level, which could be secondary to hemolysis rather than hepatocyte damage. Findings from her abdominal exam are nonfocal; this is consistent with her x-ray findings, which reflect possible enteritis or colitis.
The most likely diagnosis currently is an infectious enteritis with resulting hematologic and hepatic abnormalities. Given her recent emigration from Kenya, typhoid fever and cholera are both possible, although cholera typically does not present with prolonged fever or severe abdominal pain. The severity and duration of her illness, and the abnormalities of her laboratory findings, warrant empiric therapy with ceftriaxone to treat possible severe Salmonella enterica infection while awaiting blood and stool cultures.
The patient was admitted to the hospital and her symptoms continued. Results of serum HIV 1 and 2 polymerase chain reactions, herpes simplex virus 1 and 2 polymerase chain reactions, three malaria smears, human T-lymphotropic virus serologies, Toxoplasma serology, Bartonella serology, a stool culture, and multiple large volume blood cultures were negative. Serologic testing for hepatitis A, B, and C, Epstein-Barr virus, cytomegalovirus, and dengue virus were negative for acute infection. Results of an interferon-gamma release assay were indeterminate; results of purified protein derivative (PPD) and Candida antigen control testing were both negative. Ceruloplasmin and α1-antitrypsin levels were normal. An abdominal ultrasound showed central intrahepatic biliary duct dilatation, splenomegaly, and sluggish portal venous flow.
While central intrahepatic biliary ductal dilation could be caused by an obstructive lesion, none were seen on CT or ultrasound. Her normal alkaline phosphatase and bilirbuin levels also suggest functional patency of the biliary system. The thrombocytopenia, splenomegaly, and sluggish portal venous flow suggest possible portal hypertension, though no cirrhotic changes were noted on the ultrasound or abdominal CT. Her negative PPD and Candida antigen control results may suggest underlying immune dysregulation or suppression, though anergy could be secondary to sepsis.
Given her negative initial infectious evaluation, other etiologies such as atypical infections, rheumatologic disorders, and malignancies warrant consideration. She has no murmur; however, subacute bacterial endocarditis with a fastidious organism is possible, which could be investigated with a transthoracic echocardiogram. Other tests to consider include blood cultures for fungi and atypical mycobacterial species, and serology for Coxiella burnetii, chikungunya virus, and yellow fever. Rheumatologic conditions such as systemic lupus erythematosus, hemophagocytic lymphohistiocytosis (HLH), or adult Still’s disease should be considered. Complement levels and an antinuclear antibody panel, including those for dsDNA and Smith antigen, should be performed to evaluate for systemic lupus erythematosus. Serum ferritin, fibrinogen, and triglyceride levels should be measured to evaluate for HLH. Hematologic malignancy is also a consideration, particularly given her pancytopenia. Multicentric Castleman disease can cause prolonged fevers, pancytopenia, and elevated inflammatory markers, but is less likely without lymphadenopathy. A peripheral blood smear should be sent, and a bone marrow biopsy may be needed.
Empiric ciprofloxacin was initiated; however, the patient continued to have fevers up to 39.9 °C, abdominal pain, and myalgia. Ferritin level was over 3,000 ng/mL (reference range, 8-255 ng/mL), and a soluble interleukin-2 (IL-2) receptor level was 1,188 units/mL (reference range, 45-1,105 units/mL). Triglycerides were normal.
The elevated ferritin and soluble IL-2 levels raise concern for HLH. Hyperferritinemia is relatively nonspecific because extremely elevated ferritin can be seen with other conditions, such as renal failure, hepatocellular injury, infection, rheumatologic conditions, and hematologic malignancy. Soluble IL-2 receptor elevation is more specific for HLH than ferritin or triglycerides, but alone does not make the diagnosis because it can be elevated in other rheumatologic disorders and malignancy. The HLH-2004 criteria are commonly used and require either molecular diagnostic testing or meeting at least five out of eight clinical and lab criteria to make the diagnosis. Our patient currently meets three criteria (fever, splenomegaly, and elevated ferritin). Elevated soluble IL-2 is part of the HLH-2004 criteria, but her level of elevation does not meet the required threshold (≥2,400 units/mL). Her cytopenias have also not quite met the HLH-2004 thresholds (two of the following three: hemoglobin <9 g/dL, platelets <100,000/µL, and/or absolute neutrophil count <1,000/µL). Elevated aminotransferase levels and DIC are not part of the HLH-2004 criteria but are often seen with HLH.
Evaluation for an underlying infectious, rheumatologic, or malignant trigger should continue as previously discussed. If this patient does have HLH, it is most likely secondary to an infection, autoimmune disease, or malignancy rather than genetic HLH. HLH has a high mortality rate, but before beginning treatment with immunosuppressive agents, a peripheral smear and a bone marrow biopsy should be performed to evaluate for hematologic malignancy or signs of hemophagocytosis.
Empiric ciprofloxacin covers most bacterial etiologies of diarrhea, including those previously mentioned such as cholera and most strains of S enterica. Her symptoms and laboratory findings (including cytopenias, elevated aminotransferases, and coagulopathy) could suggest enteric fever due to S enterica serovar Typhi, which is endemic in Kenya. Results of blood and stool cultures, though negative, are relatively insensitive for this organism, particularly this far into the illness course. A bone marrow biopsy may also help with diagnosis of occult typhoid fever because marrow culture can be more sensitive than blood or stool culture.
A bone marrow aspiration revealed hemophagocytic histiocytes, no malignant cells, and negative bacterial (including anaerobic), fungal, and acid-fast bacilli cultures. Considering the high mortality rate of untreated HLH/macrophage activation syndrome (MAS), empiric glucocorticoid administration was considered. However, this was withheld due to concern for ongoing undetected infection given her persistent fever and systemic symptoms.
There should still be high suspicion for HLH. Further evaluation for other laboratory manifestations of HLH such as fibrinogen and natural killer cell activity should be considered, as well as repeating her complete blood count to see if her cytopenias have progressed. Her marrow shows no evidence of hematologic malignancy, so other triggers of possible HLH should be sought out by continuing the workup. Consulting specialists from rheumatology and infectious disease may help clarify possible underlying diagnoses and the best management plan. If she continues to have organ damage or clinically worsens, it may be prudent to empirically broaden her antibiotic coverage and begin antifungal agents while starting glucocorticoid therapy for suspected HLH.
A stool molecular screen from admission was returned positive for S enterica serovar Typhi. Ciprofloxacin was discontinued and ceftriaxone was started out of concern for antibiotic resistance. On hospital day 14, the patient’s brother presented to the ED with fever. His blood and stool cultures were positive for S enterica serovar Typhi with intermediate sensitivity to ciprofloxacin and sensitivity to ceftriaxone. With continued treatment with ceftriaxone, the patient improved significantly. Following discharge, she remained afebrile and asymptomatic. During outpatient follow up, a repeat PPD was positive and she was diagnosed with and treated for latent tuberculosis.
COMMENTARY
The evaluation of a patient who has recently emigrated from a foreign nation requires a broad differential diagnosis and a keen awareness of the clinical conditions present in the patient’s country of origin. This often involves knowledge of diseases infrequently encountered in daily practice, as well as awareness of the nuances of rare presentations and possible complications. When the presentation is not classic for a relevant infectious disease and clinical conditions from other diagnostic classes are considered, the evaluation and management of the patient is particularly challenging.
Typhoid fever is a severe systemic illness caused by the organism S enterica serovar Typhi. The organism is ingested, penetrates the small intestinal epithelium, enters the lymphoid tissue, and disseminates via the lymphatic and hematogenous routes. Onset of symptoms typically occurs 5 to 21 days after ingestion of contaminated food or water. Clinical features include fever, chills, relative bradycardia (pulse-temperature dissociation), abdominal pain, rose spots (salmon-colored macules) on the trunk and abdomen, and hepatosplenomegaly. Diarrhea is not a typical symptom of patients with typhoid fever, which can lead to a delayed or missed diagnosis. Life-threatening complications can be seen, including gastrointestinal bleeding, intestinal perforation, and meningitis.1 Typhoid fever is most prevalent in impoverished areas with poor access to sanitation. Regions with the highest incidence include south-central Asia, southeast Asia, and southern Africa.2-4 Approximately 200 to 300 cases are reported in the United States each year.5
Classically, the diagnosis is made by means of clinical symptoms and a positive culture from a sterile site. A recent study of 529 patients found that 61% had positive blood cultures and 96% had positive bone marrow cultures.6 Our patient’s diagnosis was significantly delayed by multiple negative cultures and failure to improve on first-line antibiotics, which initially suggested that the S enterica serovar Typhi stool molecular screen likely represented carriage caused by colonization. Chronic S enterica serovar Typhi carriage is defined as excretion of the organism in stool or urine 1 year or longer after acute infection. Rates of carriage range from 1% to 6%, and up to 25% of carriers have no history of typhoid fever.1,7,8 Carriage is more common in females and in those with biliary tract abnormalities.9,10
Once a presumptive diagnosis is made, antibiotic choice remains a challenge. Resistance to fluoroquinolones, the preferred drug for multidrug-resistant typhoid fever, is growing but remains rare, at approximately 5%.11,12 Ceftriaxone and azithromycin have been used successfully in areas with high resistance.13 Given the patient’s slow response to therapy even after transitioning from ciprofloxacin to ceftriaxone, her brother’s presentation and obtaining the antibiotic sensitivities for his organism were critical to confirming that our diagnosis and management decisions were correct.
One strongly considered diagnosis was HLH/MAS. MAS is an aggressive syndrome of excessive inflammation and tissue destruction caused by inappropriate immune system activation. It belongs to a group of histiocytic disorders collectively known as HLH. Aside from primary (genetic) forms, secondary forms exist that can be triggered by malignancy, infection, or rheumatologic disorders. In infection-associated HLH/MAS, viral infections are a common trigger, with Epstein-Barr virus being the most common. Association with bacterial infections, including tuberculosis and typhoid fever, has also been reported.14 Prompt therapy, often with immunosuppressive agents such as glucocorticoids, is essential for survival because there is a reported mortality rate of up to 50% when untreated.15 When infection-induced HLH/MAS occurs, treatment of the underlying infection is critical.14,15 The greatest barrier to a favorable outcome from HLH/MAS is often a delay in diagnosis because the rarity of this disease, the variable clinical presentation, and the lack of specificity of the clinical and laboratory findings make a conclusive diagnosis challenging.
In the presented case, diagnostic uncertainty challenged the decision to administer systemic glucocorticoids. Glucocorticoids conferred a risk of harm for multiple diagnoses that remained on the differential, including malignancy and infection. Her diagnostic evaluation made malignancy less likely, but because testing was unable to rule out tuberculosis as either the underlying cause or coinfection, the team opted to defer initiating glucocorticoids and instead closely monitor for a worsening inflammatory response. Following appropriate treatment of her systemic infection, her PPD was repeated and became positive. The negative PPD and Candida control obtained during her hospitalization were, therefore, likely caused by anergy in the setting of overwhelming systemic illness. Initiation of glucocorticoids prematurely in this case could have led to further harm because immunosuppression may have led to reactivation of latent tuberculosis or exacerbation of illness from an alternative but then undiagnosed infection.
The patient’s ultimate unifying diagnosis was typhoid fever; however, there are mixed expert opinions as to whether the systemic immune activation was significant enough to merit the diagnosis of infection-induced secondary HLH/MAS. Despite the high morbidity and mortality that can accompany HLH/MAS, it has been reported that a significant proportion of cases of secondary HLH/MAS can be managed effectively with treatment of the underlying etiology; this may have been the case for our patient.14,15 The clinicians in this case were caught between diagnoses, unable to safely reach either one—much like a baseball player stranded between bases. Fortunately for this patient, the diagnosis ultimately emerged after a careful and thorough workup, assisted by the more straightforward diagnosis of her brother with the same disease.
KEY TEACHING POINTS
- Salmonella enterica serovar Typhi has a high false-negative rate in blood and stool cultures; therefore, clinical suspicion should remain high in the setting of a high pre-test probability.
- Fluoroquinolones are traditionally first-line therapy for typhoid fever, but the use of ceftriaxone and azithromycin is increasing because of rising fluoroquinolone resistance.
- Hemophagocytic lymphohistiocytosis/macrophage activation syndrome is characterized by excessive inflammation and tissue destruction caused by inappropriate immune system activation. This syndrome can be fatal without appropriate immunosuppressive therapy; however, glucocorticoid administration must be pursued with caution when infection and malignancy are on the differential diagnosis.
1. Parry CM, Hien TT, Dougan G, et al. Typhoid fever. N Engl J Med. 2002;347(22):1770-1782. https://doi.org/10.1056/nejmra020201
2. Crump JA, Luby SP, Mintz ED. The global burden of typhoid fever. Bull World Health Organ. 2004;82(5):346-353.
3. Buckle GC, Walker CL, Black RE. Typhoid fever and paratyphoid fever: systematic review to estimate global morbidity and mortality for 2010. J Glob Health. 2012;2(1):010401. https://doi.org/10.7189/jogh.02.010401
4. Mogasale V, Maskery B, Ochiai RL, et al. Burden of typhoid fever in low-income and middle-income countries: a systematic, literature-based update with risk-factor adjustment. Lancet Glob Health. 2014;2(10):e570-e580. https://doi.org/10.1016/s2214-109x(14)70301-8
5. Lynch MF, Blanton EM, Bulens S, et al. Typhoid fever in the United States, 1999-2006. JAMA. 2009;302(8):859-865. https://doi.org/10.1001/jama.2009.1229
6. Mogasale V, Ramani E, Mogasale VV, Park J. What proportion of Salmonella typhi cases are detected by blood culture? a systematic literature review. Ann Clin Microbiol Antimicrob. 2016;15(1):32. https://doi.org/10.1186/s12941-016-0147-z
7. Merselis JG Jr, Kaye D, Connolly CS, Hook EW. Quantitative bacteriology of the Typhoid carrier state. Am J Trop Med Hyg. 1964;13:425-429. https://doi.org/10.4269/ajtmh.1964.13.425
8. Lanata CF, Levine MM, Ristori C, et al. Vi serology in detection of chronic Salmonella typhi carriers in an endemic area. Lancet. 1983;2(8347):441-443. https://doi.org/10.1016/s0140-6736(83)90401-4
9. Lai CW, Chan RC, Cheng AF, Sung JY, Leung JW. Common bile duct stones: a cause of chronic salmonellosis. Am J Gastroenterol. 1992;87(9):1198-1199.
10. Hofmann E, Chianale J, Rollán A, Pereira J, Ferrecio C, Sotomayor V. Blood group antigen secretion and gallstone disease in the Salmonella typhi chronic carrier state. J Infect Dis. 1993;167(4):993-994. https://doi.org/10.1093/infdis/167.4.993
11. Steel AD, Hay Burgess DC, Diaz Z, Carey ME, Zaidi AKM. Challenges and opportunities for typhoid fever control: a call for coordinated action. Clin Infect Dis. 2016;62 (Suppl 1):S4-S8. https://doi.org/10.1093/cid/civ976
12. Hendriksen RS, Leekitcharoenphon P, Lukjancenko O, et al. Genomic signature of multidrug resistant Salmonella enterica serovar Typhi isolates related to a massive outbreak in Zambia between 2010 and 2012. J Clin Microbiol. 2015;53(1):262-272. https://doi.org/10.1128/jcm.02026-14
13. Crump JA, Sjölund-Karlsson M, Gordon MA, Parry CM. Epidemiology, clinical presentation, laboratory diagnosis, antimicrobial resistance, and antimicrobial management of Salmonella infections. Clin Microbiol Rev. 2015;28(4):901-936. https://doi.org/10.1128/cmr.00002-15
14. Rouphael NG, Talati NJ, Vaughan C, Cunningham K, Moreira R, Gould C. Infections associated with haemophagocytic syndrome. Lancet Infect Dis. 2007;7(12):814-822. https://doi.org/10.1016/s1473-3099(07)70290-6
15. Fisman DN. Hemophagocytic syndromes and infection. Emerg Infect Dis. 2000;6(6):601-608. https://doi.org/10.3201/eid0606.000608
© 2021 Society of Hospital Medicine
Clinical Progress Note: Vascular Access Appropriateness Guidance for Pediatric Hospitalists
Hospitalized pediatric patients often require vascular access for necessary therapies, such as antibiotics. However, vascular access devices (VADs) are also associated with harm, ranging from insertion complications to life-threatening bloodstream infections or thrombosis.1 Pediatric hospitalists often guide VAD placement. There is a paucity of evidence to guide VAD selection based on the relative benefits and risks.2 The Michigan Appropriateness Guide for Intravenous Catheters in Pediatrics (miniMAGIC)2 offers the first set of standards. Like its adult predecessor guideline (MAGIC) published in 2015, it provides guidance on appropriate VAD selection based on current evidence and expertise from a multidisciplinary panel.2 The guideline informs device selection, device characteristics, and insertion technique for the pediatric population (term neonates to adolescents) and across a wide range of clinical indications.2 This review highlights key recommendations for pediatric hospitalists to help their decision-making.
METHODS USED IN PREPARING THE GUIDELINE
miniMAGIC was developed using the RAND/UCLA Appropriateness Method, a method proven to reduce inappropriate (ie, overused or underused) healthcare interventions.3 It combines rigorous evidence review with multidisciplinary expert opinion on real-world clinical scenarios to provide recommendations about an intervention’s appropriateness.3 This is particularly useful for clinical scenarios that lack high-quality evidence to guide decision-making. The RAND/UCLA method deems an intervention appropriate if the benefits outweigh the risks by a wide enough margin that proceeding is worthwhile, and it does not take cost into account.2 The method design consists of five phases: (1) defining the scope and key terms, (2) reviewing and synthesizing the literature, (3) selecting an expert panel, (4) developing case scenarios, and (5) conducting two rounds of appropriateness ratings by the expert panel for each clinical scenario.3 The guideline’s scope included term neonates (aged 0-30 days), infants (aged 31 days-1 year), children (aged 1-12 years), and adolescents (aged 12-18 years). Infants receiving care in the neonatal intensive care unit or special care nursery were excluded. Other specialized populations addressed based on setting or diagnosis were general hospitalized patients and patients with congenital cardiac disease, critical illness, oncologic and hematologic conditions, and long-term VAD-dependent conditions.3
A total of 133 studies or clinical practice guidelines (CPGs) met the eligibility criteria for the systematic review.4 Although the systematic review was conducted per the RAND/UCLA method using two independent reviewers who evaluated the methodologic quality, transparency, and relevancy of each article, there was no formal assessment of evidence quality. The recommendations were based primarily on observational studies and CPGs because there were few randomized controlled trials or systematic reviews on VAD selection for pediatric patients in the literature. Pediatric evidence was limited for certain scenarios or populations (eg, term neonates, midline catheters, difficult venous access, long-term VAD), so adult and/or neonatal evidence was included when applicable.
The panel included 14 pediatric clinical experts from cardiology, vascular access, critical care, hematology/oncology, emergency medicine, general surgery, hospital medicine, anesthesia, interventional radiology, pharmacology, and infectious diseases. The panel also included nonvoting panel members such as the panel facilitators, a methodologist, and a patient representative.
RESULTS OF THE CLINICAL REVIEW
We review four common clinical scenarios encountered by pediatric hospitalists and summarize key recommendations (Table

Peripherally Inserted Central Catheter
Patients may require peripherally inserted central catheters (PICCs) to facilitate a longer duration of intravenous (IV) therapy, such as delivery of antibiotics, or frequent blood draws. The need for prolonged vascular access is decreasing, as studies show many infections in children previously treated with prolonged IV antibiotics can be safely and equally effectively managed with early transition to oral therapy.5-8 These studies highlight the higher rate of complications and risks associated with PICCs, including thrombosis, infection, and mechanical issues, as well as the added healthcare utilization needed to evaluate and manage the complications. PICC-associated complication rates also increase with duration.4
However, there are some clinical scenarios that still warrant prolonged therapy and/or access; PICC recommendations are summarized in the Appendix Figure. The miniMAGIC panel deemed PICC lines appropriate for any nonperipheral therapy of any length. For peripherally compatible therapy, the panel rated PICC placement as inappropriate for therapy lasting less than 8 days, regardless of patient age. PICC placement in infants, children, and adolescents was rated appropriate for therapy with a duration exceeding 14 days, but the panel was uncertain about therapy expected to last between 8 and 14 days. Recognizing the additional challenges with maintaining peripheral IV catheter access in neonates, PICCs were deemed appropriate for neonates needing peripheral therapy lasting longer than 7 days.
The panel rated PICC placement appropriate for frequent blood draws (defined as more than one time per day) for more than 7 days in neonates or infants and more than 14 days in children and adolescents. But regardless of patient age, the PICC caliber must be at least 3F.
The miniMAGIC panel found that a single lumen is appropriate in most cases, highlighting that multilumen catheters increase the risk for infection, occlusion, and venous thrombosis.4 Multilumen catheters were rated as inappropriate in the case of reserving a lumen for blood products and blood sampling. When reserving a lumen for lipids and parenteral nutrition (PN), the panel was uncertain given the lack of evidence regarding the risks/benefits of the complications associated with the infusions themselves versus those of the device. Regardless, collaboration with a pharmacist and vascular access specialist is recommended to aid in choosing the most appropriate device characteristics.
Midline Catheters
Midline catheters are inserted in a peripheral vein, but the catheter tip terminates in the proximal extremity. Compared with peripheral IV catheters, midline catheters last longer and have lower rates of phlebitis. In addition, midline catheter placement does not require sedation or fluoroscopy and has lower rates of infection compared with PICC lines.9 Although there is good evidence in adults, and multiple panelists reported success in using midline catheters in various age groups, the evidence for their safe and efficacious use in pediatrics is limited, particularly for infants. Midline catheters were rated as appropriate for peripheral therapy lasting less than 8 days in neonates and less than 15 days in children and adolescents. Use in infants was deemed uncertain based on lack of published evidence. Midline catheters were also rated as appropriate for frequent blood draws of less than 8 days in neonates and less than 15 days in adolescents, but uncertain for children and infants.
Difficult Access and Insertion Procedure
The panel rated three or more attempts for peripheral IV catheter insertion by a single clinician as inappropriate and recommended early escalation to a more experienced inserter after 0 to 2 attempts by a single provider. The goal is to preserve insertion sites and reduce patient discomfort. If a patient loses access when only 1 day of therapy remains, the provider should transition to oral or intramuscular therapy when appropriate, particularly if there are no advanced insertion staff available or after two or more attempts at re-insertion are unsuccessful. There is high-quality evidence that supports vessel visualization (primarily ultrasound) with peripheral IV catheter and PICC placement.2 In the case of two or more unsuccessful attempts at peripheral IV catheter placement by an advanced inserter using technology assistance (ultrasound), PICC placement is considered appropriate by the panel to avoid delays in treatment and limit patient discomfort associated with repeat attempts.
Long-term Vascular Access
Children with medical complexity or chronic illness may require long-term (>2 months) or very-long-term (>1 year) vascular access. Common themes for VAD selection in this heterogeneous population include a focus on vessel preservation and complication prevention.2 The panel strongly recommended that clinicians partner with the patient and caregivers in the decision-making process. Shared decision-making is necessary to meet both the short-term and evolving needs of the of the patient and family. The panel also believed the frequency of hospitalization should not be used as a criterion for VAD selection since acute hospitalization is an unreliable proxy for disease severity in pediatric chronic disease conditions.2 Rather, the infusate characteristics and length/intermittency of therapy should be primary influencers of VAD selection. In general, the panel rated cuffed tunneled central VADs (CVADs) as appropriate for all age groups for long-term PN, long-term continuous infusions, and long-term intermittent therapies. For continuous non-PN infusions, appropriate ratings were given to PICCs for infants and children and total implanted venous devices (TIVDs) in children and adolescents. For intermittent (but at least daily) access, TIVDs and PICC lines were both rated as appropriate for children and adolescents but uncertain for neonates and infants. Peripheral devices were deemed inappropriate for all long-term complex therapies. For children and adolescents needing intermittent, regular peripheral treatments (eg, steroids or antibiotics), peripheral IVs and TIVDs were rated appropriate for short duration (<7 days) therapies. PICCs and midlines for this indication were uncertain because of the lack of evidence. For medium-duration intermittent therapies (8-14 days), PICCs, tunneled cuffed CVADs, and TIVDs were rated as appropriate. A recently released mobile application can help guide the clinician through many varied clinical scenarios and indications.10
LIMITATIONS AND GAPS
The guideline recommendations were more often reliant on clinical practice guidelines and expert panel opinion given the lack of high-quality pediatric evidence for most scenarios. The panel members were from the United States and Australia, so the recommendations may not be generalizable to care systems in other countries. Although the panel included experts from many specialties that care for patient populations needing VADs, not all subspecialty populations were considered, particularly those with long-term vascular access–dependent conditions who may be commonly hospitalized. Scenarios with disagreement or uncertainty highlight gaps in need of future study (eg, midline catheter use and device selection for blood draws).
CONCLUSIONS AND APPLICATION
miniMAGIC is the first appropriateness guideline to help standardize the safe use of VADs in children. Although some gaps remain, the authors intend it to be a living document that will need revisions as new evidence is published. A mobile health application facilitates use of the recommendations, providing quick, point-of-care decision support based on clinical features.10 Pediatric hospitalists should collaborate with their institutions to examine their current VAD use in hospitalized children and identify opportunities for practice change and standardization. Use of these recommendations may help hospitalists improve the care of hospitalized children by decreasing unnecessary PICC placement and better partner with patients and caregivers to limit discomfort surrounding VAD placement.
1. Ullman AJ, Marsh N, Mihala G, Cooke M, Rickard CM. Complications of central venous access devices: a systematic review. Pediatrics. 2015;136(5):e1331-e1344. https://doi.org/10.1542/peds.2015-1507
2. Ullman AJ, Bernstein SJ, Brown E, et al. The Michigan appropriateness guide for intravenous catheters in pediatrics: miniMAGIC. Pediatrics. 2020;145(Suppl 3):S269-S284. https://doi.org/10.1542/peds.2019-3474I
3. Ullman AJ, Chopra V, Brown E, et al. Developing appropriateness criteria for pediatric vascular access. Pediatrics. 2020;145(Suppl 3):S233-S242. https://doi.org/10.1542/peds.2019-3474G
4. Paterson RS, Chopra V, Brown E, et al. Selection and insertion of vascular access devices in pediatrics: a systematic review. Pediatrics. 2020;145(Suppl 3):S243-S268. https://doi.org/10.1542/peds.2019-3474H
5. Keren R, Shah SS, Srivastava R, et al. Comparative effectiveness of intravenous vs oral antibiotics for postdischarge treatment of acute osteomeyelitis in children. JAMA Pediatr. 2015;169(2):120-128. https://doi.org/10.1001/jamapediatrics.2014.2822
6. Shah SS, Srivastava R, Wu S, et al. Intravenous versus oral antibiotics for postdischarge treatment of complicated pneumonia. Pediatrics. 2016;138(6):e20161692. https://doi.org/10.1542/peds.2016-1692
7. Rangel SJ, Anderson BR, Srivastava R, et al. Intravenous versus oral antibiotics for the prevention of treatment failure in children with complicated appendicitis: has the abandonment of peripherally inserted catheters been justified? Ann Surg. 2017;266(2):361-368. https://doi.org/10.1097/SLA.0000000000001923
8. Desai S, Aronson PL, Shabanova V, et al. Parenteral antibiotic therapy duration in young infants with bacteremic urinary tract infections. Pediatrics. 2019;144(3):e20183844. https://doi.org/10.1542/peds.2018-3844
9. Anderson J, Greenwell A, Louderback J, Polivka BJ, Herron Behr J. Comparison of outcomes of extended dwell/midline peripheral intravenous catheters and peripherally inserted central catheters in children. J Assoc Vasc Access. 2016;21(3):158-164. https://doi.org/10.1016/j.java.2016.03.007
10. miniMAGIC: the Michigan Appropriateness Guide for Intravenous Catheters in Pediatrics app. Version 1.0.0. Alliance for Vascular Access Teaching and Research.
11. Shaughnessy EE, Morton K, Shah SS. Vascular access in hospitalized children. Pediatrics. 2020;145(Suppl 3):S298-S299. https://doi.org/10.1542/peds.2019-3474P
Hospitalized pediatric patients often require vascular access for necessary therapies, such as antibiotics. However, vascular access devices (VADs) are also associated with harm, ranging from insertion complications to life-threatening bloodstream infections or thrombosis.1 Pediatric hospitalists often guide VAD placement. There is a paucity of evidence to guide VAD selection based on the relative benefits and risks.2 The Michigan Appropriateness Guide for Intravenous Catheters in Pediatrics (miniMAGIC)2 offers the first set of standards. Like its adult predecessor guideline (MAGIC) published in 2015, it provides guidance on appropriate VAD selection based on current evidence and expertise from a multidisciplinary panel.2 The guideline informs device selection, device characteristics, and insertion technique for the pediatric population (term neonates to adolescents) and across a wide range of clinical indications.2 This review highlights key recommendations for pediatric hospitalists to help their decision-making.
METHODS USED IN PREPARING THE GUIDELINE
miniMAGIC was developed using the RAND/UCLA Appropriateness Method, a method proven to reduce inappropriate (ie, overused or underused) healthcare interventions.3 It combines rigorous evidence review with multidisciplinary expert opinion on real-world clinical scenarios to provide recommendations about an intervention’s appropriateness.3 This is particularly useful for clinical scenarios that lack high-quality evidence to guide decision-making. The RAND/UCLA method deems an intervention appropriate if the benefits outweigh the risks by a wide enough margin that proceeding is worthwhile, and it does not take cost into account.2 The method design consists of five phases: (1) defining the scope and key terms, (2) reviewing and synthesizing the literature, (3) selecting an expert panel, (4) developing case scenarios, and (5) conducting two rounds of appropriateness ratings by the expert panel for each clinical scenario.3 The guideline’s scope included term neonates (aged 0-30 days), infants (aged 31 days-1 year), children (aged 1-12 years), and adolescents (aged 12-18 years). Infants receiving care in the neonatal intensive care unit or special care nursery were excluded. Other specialized populations addressed based on setting or diagnosis were general hospitalized patients and patients with congenital cardiac disease, critical illness, oncologic and hematologic conditions, and long-term VAD-dependent conditions.3
A total of 133 studies or clinical practice guidelines (CPGs) met the eligibility criteria for the systematic review.4 Although the systematic review was conducted per the RAND/UCLA method using two independent reviewers who evaluated the methodologic quality, transparency, and relevancy of each article, there was no formal assessment of evidence quality. The recommendations were based primarily on observational studies and CPGs because there were few randomized controlled trials or systematic reviews on VAD selection for pediatric patients in the literature. Pediatric evidence was limited for certain scenarios or populations (eg, term neonates, midline catheters, difficult venous access, long-term VAD), so adult and/or neonatal evidence was included when applicable.
The panel included 14 pediatric clinical experts from cardiology, vascular access, critical care, hematology/oncology, emergency medicine, general surgery, hospital medicine, anesthesia, interventional radiology, pharmacology, and infectious diseases. The panel also included nonvoting panel members such as the panel facilitators, a methodologist, and a patient representative.
RESULTS OF THE CLINICAL REVIEW
We review four common clinical scenarios encountered by pediatric hospitalists and summarize key recommendations (Table
Peripherally Inserted Central Catheter
Patients may require peripherally inserted central catheters (PICCs) to facilitate a longer duration of intravenous (IV) therapy, such as delivery of antibiotics, or frequent blood draws. The need for prolonged vascular access is decreasing, as studies show many infections in children previously treated with prolonged IV antibiotics can be safely and equally effectively managed with early transition to oral therapy.5-8 These studies highlight the higher rate of complications and risks associated with PICCs, including thrombosis, infection, and mechanical issues, as well as the added healthcare utilization needed to evaluate and manage the complications. PICC-associated complication rates also increase with duration.4
However, there are some clinical scenarios that still warrant prolonged therapy and/or access; PICC recommendations are summarized in the Appendix Figure. The miniMAGIC panel deemed PICC lines appropriate for any nonperipheral therapy of any length. For peripherally compatible therapy, the panel rated PICC placement as inappropriate for therapy lasting less than 8 days, regardless of patient age. PICC placement in infants, children, and adolescents was rated appropriate for therapy with a duration exceeding 14 days, but the panel was uncertain about therapy expected to last between 8 and 14 days. Recognizing the additional challenges with maintaining peripheral IV catheter access in neonates, PICCs were deemed appropriate for neonates needing peripheral therapy lasting longer than 7 days.
The panel rated PICC placement appropriate for frequent blood draws (defined as more than one time per day) for more than 7 days in neonates or infants and more than 14 days in children and adolescents. But regardless of patient age, the PICC caliber must be at least 3F.
The miniMAGIC panel found that a single lumen is appropriate in most cases, highlighting that multilumen catheters increase the risk for infection, occlusion, and venous thrombosis.4 Multilumen catheters were rated as inappropriate in the case of reserving a lumen for blood products and blood sampling. When reserving a lumen for lipids and parenteral nutrition (PN), the panel was uncertain given the lack of evidence regarding the risks/benefits of the complications associated with the infusions themselves versus those of the device. Regardless, collaboration with a pharmacist and vascular access specialist is recommended to aid in choosing the most appropriate device characteristics.
Midline Catheters
Midline catheters are inserted in a peripheral vein, but the catheter tip terminates in the proximal extremity. Compared with peripheral IV catheters, midline catheters last longer and have lower rates of phlebitis. In addition, midline catheter placement does not require sedation or fluoroscopy and has lower rates of infection compared with PICC lines.9 Although there is good evidence in adults, and multiple panelists reported success in using midline catheters in various age groups, the evidence for their safe and efficacious use in pediatrics is limited, particularly for infants. Midline catheters were rated as appropriate for peripheral therapy lasting less than 8 days in neonates and less than 15 days in children and adolescents. Use in infants was deemed uncertain based on lack of published evidence. Midline catheters were also rated as appropriate for frequent blood draws of less than 8 days in neonates and less than 15 days in adolescents, but uncertain for children and infants.
Difficult Access and Insertion Procedure
The panel rated three or more attempts for peripheral IV catheter insertion by a single clinician as inappropriate and recommended early escalation to a more experienced inserter after 0 to 2 attempts by a single provider. The goal is to preserve insertion sites and reduce patient discomfort. If a patient loses access when only 1 day of therapy remains, the provider should transition to oral or intramuscular therapy when appropriate, particularly if there are no advanced insertion staff available or after two or more attempts at re-insertion are unsuccessful. There is high-quality evidence that supports vessel visualization (primarily ultrasound) with peripheral IV catheter and PICC placement.2 In the case of two or more unsuccessful attempts at peripheral IV catheter placement by an advanced inserter using technology assistance (ultrasound), PICC placement is considered appropriate by the panel to avoid delays in treatment and limit patient discomfort associated with repeat attempts.
Long-term Vascular Access
Children with medical complexity or chronic illness may require long-term (>2 months) or very-long-term (>1 year) vascular access. Common themes for VAD selection in this heterogeneous population include a focus on vessel preservation and complication prevention.2 The panel strongly recommended that clinicians partner with the patient and caregivers in the decision-making process. Shared decision-making is necessary to meet both the short-term and evolving needs of the of the patient and family. The panel also believed the frequency of hospitalization should not be used as a criterion for VAD selection since acute hospitalization is an unreliable proxy for disease severity in pediatric chronic disease conditions.2 Rather, the infusate characteristics and length/intermittency of therapy should be primary influencers of VAD selection. In general, the panel rated cuffed tunneled central VADs (CVADs) as appropriate for all age groups for long-term PN, long-term continuous infusions, and long-term intermittent therapies. For continuous non-PN infusions, appropriate ratings were given to PICCs for infants and children and total implanted venous devices (TIVDs) in children and adolescents. For intermittent (but at least daily) access, TIVDs and PICC lines were both rated as appropriate for children and adolescents but uncertain for neonates and infants. Peripheral devices were deemed inappropriate for all long-term complex therapies. For children and adolescents needing intermittent, regular peripheral treatments (eg, steroids or antibiotics), peripheral IVs and TIVDs were rated appropriate for short duration (<7 days) therapies. PICCs and midlines for this indication were uncertain because of the lack of evidence. For medium-duration intermittent therapies (8-14 days), PICCs, tunneled cuffed CVADs, and TIVDs were rated as appropriate. A recently released mobile application can help guide the clinician through many varied clinical scenarios and indications.10
LIMITATIONS AND GAPS
The guideline recommendations were more often reliant on clinical practice guidelines and expert panel opinion given the lack of high-quality pediatric evidence for most scenarios. The panel members were from the United States and Australia, so the recommendations may not be generalizable to care systems in other countries. Although the panel included experts from many specialties that care for patient populations needing VADs, not all subspecialty populations were considered, particularly those with long-term vascular access–dependent conditions who may be commonly hospitalized. Scenarios with disagreement or uncertainty highlight gaps in need of future study (eg, midline catheter use and device selection for blood draws).
CONCLUSIONS AND APPLICATION
miniMAGIC is the first appropriateness guideline to help standardize the safe use of VADs in children. Although some gaps remain, the authors intend it to be a living document that will need revisions as new evidence is published. A mobile health application facilitates use of the recommendations, providing quick, point-of-care decision support based on clinical features.10 Pediatric hospitalists should collaborate with their institutions to examine their current VAD use in hospitalized children and identify opportunities for practice change and standardization. Use of these recommendations may help hospitalists improve the care of hospitalized children by decreasing unnecessary PICC placement and better partner with patients and caregivers to limit discomfort surrounding VAD placement.
1. Ullman AJ, Marsh N, Mihala G, Cooke M, Rickard CM. Complications of central venous access devices: a systematic review. Pediatrics. 2015;136(5):e1331-e1344. https://doi.org/10.1542/peds.2015-1507
2. Ullman AJ, Bernstein SJ, Brown E, et al. The Michigan appropriateness guide for intravenous catheters in pediatrics: miniMAGIC. Pediatrics. 2020;145(Suppl 3):S269-S284. https://doi.org/10.1542/peds.2019-3474I
3. Ullman AJ, Chopra V, Brown E, et al. Developing appropriateness criteria for pediatric vascular access. Pediatrics. 2020;145(Suppl 3):S233-S242. https://doi.org/10.1542/peds.2019-3474G
4. Paterson RS, Chopra V, Brown E, et al. Selection and insertion of vascular access devices in pediatrics: a systematic review. Pediatrics. 2020;145(Suppl 3):S243-S268. https://doi.org/10.1542/peds.2019-3474H
5. Keren R, Shah SS, Srivastava R, et al. Comparative effectiveness of intravenous vs oral antibiotics for postdischarge treatment of acute osteomeyelitis in children. JAMA Pediatr. 2015;169(2):120-128. https://doi.org/10.1001/jamapediatrics.2014.2822
6. Shah SS, Srivastava R, Wu S, et al. Intravenous versus oral antibiotics for postdischarge treatment of complicated pneumonia. Pediatrics. 2016;138(6):e20161692. https://doi.org/10.1542/peds.2016-1692
7. Rangel SJ, Anderson BR, Srivastava R, et al. Intravenous versus oral antibiotics for the prevention of treatment failure in children with complicated appendicitis: has the abandonment of peripherally inserted catheters been justified? Ann Surg. 2017;266(2):361-368. https://doi.org/10.1097/SLA.0000000000001923
8. Desai S, Aronson PL, Shabanova V, et al. Parenteral antibiotic therapy duration in young infants with bacteremic urinary tract infections. Pediatrics. 2019;144(3):e20183844. https://doi.org/10.1542/peds.2018-3844
9. Anderson J, Greenwell A, Louderback J, Polivka BJ, Herron Behr J. Comparison of outcomes of extended dwell/midline peripheral intravenous catheters and peripherally inserted central catheters in children. J Assoc Vasc Access. 2016;21(3):158-164. https://doi.org/10.1016/j.java.2016.03.007
10. miniMAGIC: the Michigan Appropriateness Guide for Intravenous Catheters in Pediatrics app. Version 1.0.0. Alliance for Vascular Access Teaching and Research.
11. Shaughnessy EE, Morton K, Shah SS. Vascular access in hospitalized children. Pediatrics. 2020;145(Suppl 3):S298-S299. https://doi.org/10.1542/peds.2019-3474P
© 2021 Society of Hospital Medicine
SARS-CoV-2 Seroprevalence Among Healthcare Workers by Job Function and Work Location in a New York Inner-City Hospital
SARS-CoV-2 has infected 141 million people worldwide and 31 million people in the United States as of April 20, 2021.1,2 The influx of hospital admissions and deaths has severely strained healthcare systems worldwide and placed healthcare workers (HCWs) at increased risk for acquiring COVID-19.3-5
Several studies have described the impact of COVID-19 on this heterogeneous group of HCWs. Shields et al reported a seroprevalence of 24.4% in HCWs at University Hospitals Birmingham (UK), with the highest rate, 34.5%, in housekeeping staff.6 Steensels et al reported a lower prevalence of 6.4% at a tertiary care center in Belgium, and showed no increased risk for HCWs when directly involved in clinical care.7 The authors attributed this to adequate use of personal protective equipment (PPE). Other studies have reported seroprevalences ranging from 1.6% to 18%.8-11 In the New York City (NYC) metro area, Jeremias et al reported a seroprevalence of 9.8% in HCWs and found no difference by job title or work location,12 whereas Moscola et al reported a seroprevalence of 13.7% and demonstrated a 3% increased risk for those working in service or maintenance.13 Antibody tests were conducted between March and April 2020 in all but two of these studies; testing in these two studies was performed between April 13 and June 23, 2020, with one reporting a seroprevalence of 6%11 and the other, 13.7%.13
NYC became the earliest pandemic epicenter in the United States following untracked transmission from ongoing circulation of SARS-CoV-2 in Europe.14 As a result, the COVID-19 surge in NYC commenced in March and largely subsided by the end of May 2020. Most HCW data reported to date do not reflect the situation at the end of the surge, and may underestimate true seroprevalence. We describe SARS-CoV-2 seroprevalence in HCWs in a large inner-city hospital in NYC, with antibody testing conducted from May 18 to June 26, 2020, at the subsidence of the surge. To further our understanding of occupational risk among different groups of HCWs, we examined associations of seroprevalence with HCWs’ job function and work location.
METHODS
This was a cross-sectional seroprevalence study conducted in the BronxCare Health System located in South and Central Bronx, an area that experienced one of the highest incidences of SARS-CoV-2 infections within NYC’s five boroughs.
HCWs were offered voluntary testing for serum antibodies to SARS-CoV-2 between May 18 and June 26, 2020. Testing occurred in the institution’s auditorium, a central and easily accessible location. Weekly emails were sent to all employees and department heads during the testing period, offering antibody testing and providing location and testing time information. The Elecsys Anti-SARS-CoV-2 (Roche) assay measuring total qualitative antibodies was used; the assay has a reported sensitivity of 97.1% 14 days after a positive SARS-CoV-2 RNA polymerase chain reaction (PCR) test result and a specificity of 100%.15
Demographic and work-related information was abstracted from electronic medical records, including all comorbid conditions that affected 30 or more HCWs. Pulmonary diagnoses, including asthma and chronic obstructive pulmonary disease, were grouped as chronic lung disease, and cardiovascular diseases, including hypertension, as chronic heart disease. Personal identifiers and data were delinked upon completion of data abstraction. The study was approved by the hospital’s institutional review board.
Job Function and Work Location
HCWs were grouped by job function as follows: physicians; nurses (including physician assistants and nurse practitioners); allied HCW I (medical assistants, patient care, and electrocardiogram, radiology, and ear, nose and throat technicians); allied HCW II (social workers, dieticians and nutritionists, registration clerks and unit associates, physical and occupational therapists); nonclinical staff (patient transporters, housekeeping staff, and security staff); pharmacists; engineering; and administrative staff. Respiratory therapists were considered as a separate group as their work placed them at high risk for respiratory diseases.
Work locations were as follows: clinics (including dental, outpatient, and satellite clinics), emergency departments (ED), inpatient units (including floors and intensive care units [ICU]), radiology suite, laboratory and pharmacy, and offices.
Statistical Analysis
Descriptive statistics were calculated using χ2 analyses. All demographic variables were tested against serology status (positive/negative). A binary logistic regression analysis was used to calculate odds ratios (ORs). Eight separate univariate unadjusted ORs were calculated by running each predictor variable against serology status (dependent variable), which included the six categorical variables—race, ethnicity, age, sex, body mass index (BMI), and prior SARS-CoV-2 PCR results—and the two main predictors—job function and work location. To obtain adjusted ORs, two final separate multivariable logistic regression analyses were executed including the six covariates listed. Due to high collinearity between job function and work location (χ2 = 3030.13, df = 35 [6 levels of work location – 1]*[8 levels of job function – 1]; P < .001), we included only one of the main predictors in each model. The regressions were specified such that the reference groups for the work location and job function variables were office work and administration, respectively. This choice was made based on the fact that their nonclinical functions do not confer an exposure risk in excess of that experienced by typical community populations. Sensitivity analyses were performed on the subset of HCWs whose address zip codes indicated residence within NYC to exclude the effect of different community seroprevalences in areas outside of NYC. The 95% CI for seroprevalence of antibodies within tested HCWs was estimated using the Clopper-Pearson binomial method.
RESULTS
Among all HCWs in the institution (N = 4,807), 2,749 (57.2%) underwent voluntary testing. Of those who underwent testing, 831 were positive for antibodies to SARS-CoV-2 (Figure 1), a seroprevalence of 30.2% (95% CI, 29%-32%). Among the age groups, the 45-to-64−year group had the highest seropositivity at 33% (400/1203), and those ≥75 years of age, the lowest at 16.7% (2/12) (P < .009). 

Among all tested HCWs, 70.1% (1,928/2,749) resided in NYC. SARS-CoV-2 seroprevalence in this subset was 32% (616/1,928) (Figure 1). Demographic and comorbid conditions in HCWs who lived in NYC were similar to those of the whole group (Appendix Table 1).
HCWs who underwent voluntary antibody testing (Appendix Table 2) had a higher percentage of persons in the 45-to-64−year age group (43.8% vs 40.9%) and a lower percentage of persons in the 65-to-74−year age group (3.3% vs 5.3%) compared with the group of HCWs that did not undergo testing (P < .001). Gender, race, ethnicity, comorbid conditions, SARS-CoV-2 PCR testing, and work locations were not different between groups. The tested group had higher proportions of clinicians (physicians, nurses, allied HCWs I and II) than the untested nonparticipant group (P = .014).
SARS-CoV-2 PCR Tests on HCWs
More than one-third (34.1%; 938/2,749) of HCWs had a documented nasopharyngeal PCR test between March 23 and June 26, 2020 (Table). Of all PCRs performed, 262 were positive, giving an overall PCR positivity rate of 27.9%. Positivity was 51.4% in March and 36.6% in April. The reasons for PCR testing were not available, but likely represent a combination of exposure-related testing among asymptomatic individuals and diagnostic testing of symptomatic HCWs. In contrast, serology testing was indicative of prior infection and yielded a cumulative seroprevalence at the end of the surge. Findings were similar among HCWs residing in NYC
Work Location and Job Function
Among all HCWs (Table, Figure 2), there were differences in seropositivity by work location (P = .001). The largest number of HCWs worked in inpatient units (1,348/2,749, 49%), and the second largest in offices (554/2,749, 20%). The highest seropositivity rate was in the EDs, at 36.4% (64/176), followed by radiology suites, at 32.7% (17/52); the seropositivity rate in office locations was 25.8% (143/554). Among HCWs residing in NYC (Appendix Table 1, Appendix Figure 1), the rank order according to proportion seropositive by work location was similar to that of the whole group (P = .004), except that the second highest seropositivity rate was in the inpatient units (33.9% [323/953]). In the group of HCWs residing in NYC, office locations had a seropositivity of 27.4% (102/372). The seropositivity rates for both groups working in office locations were slightly higher than the 22% community seroprevalence in NYC reported for the same period.16

Among all HCWs, there were differences in seropositivity by job function (P = .001). The greatest proportion of HCWs were allied HCW II (23% [631/2,749]), followed by nurses (22.2% [611/2,749]) and physicians (21.3% [585/2,749] ). Seropositivity was highest for nonclinical staff (44.0% [51/116]), followed by nurses (37.5% [229/611]) and allied clinical HCW I and II (34.5% [143/414] and 32.0% [202/631], respectively). It was lowest for administrative staff (20.9% [42/201]) and pharmacists (11.1% [5/45]). Among HCWs residing in NYC, the rank order according to proportion seropositive by location was similar to that of the whole group. Administrative staff seropositivity was 18.3% (20/109). Administrative staff seropositivity for both groups was marginally lower than the 22% community seroprevalence in NYC for the same period.16
Odds Ratios for SARS-CoV-2 Seropositivity
For all HCWs, in unadjusted models (Appendix Table 3), age 45 to 64 years and Black race were associated with increased odds of being seropositive (1.26; 95% CI, 1.07-1.49 and 2.26; 95% CI, 1.51-3.37, respectively). Increased odds were seen for HCWs working in the ED (1.64; 95% CI, 1.14-2.36) and inpatient units (1.35; 95% CI, 1.08-1.69), and decreased odds were seen for those working in the laboratory and pharmacy (0.47; 95% CI, 0.26-0.86). Increased odds for seropositivity were found for nurses (2.27; 95% CI, 1.56-3.31), allied HCW I (2.00; 95% CI, 1.34-2.97), allied HCW II (1.78; 95% CI, 1.22-2.60), and nonclinical staff (2.97; 95% CI,1.80-4.90).
After adjusting for all covariates, HCWs who were Black remained at increased odds for being seropositive in the two final models (adjusted OR, 2.29; 95% CI, 1.38-3.81 and adjusted OR, 2.94; 95% CI, 1.78-4.85), as did those who had a BMI >30 kg/m2, with an adjusted OR of 1.36 (95% CI, 1.05-1.77) in one of the final models (Appendix Table 3). None of the other comorbid conditions had increased ORs. Those who worked in the ED and inpatient units also remained at increased odds after adjusting for covariates (2.27; 95% CI, 1.53-3.37 and 1.48; 95% CI, 1.14-1.92, respectively; Figure 3). Other job functions that had increased odds for seropositivity were nurses (2.54; 95% CI, 1.64-3.94), allied HCW I (1.83; 95% CI, 1.15-2.89) and II (1.70; 95% CI, 1.10-2.63), and nonclinical staff (2.51; 95% CI, 1.42-4.43).

Having a positive PCR for SAR-CoV-2 on nasopharyngeal swabs was strongly associated with seropositivity (OR, 47.26; 95% CI, 29.30-76.23 and OR, 44.79; 95% CI, 27.87-72.00) in the two multivariate-adjusted models. These findings were confirmed when the analyses were performed on HCWs who resided in NYC (Appendix Table 4 and Appendix Figure 2).
DISCUSSION
In a large inner-city New York hospital, we report a cumulative SARS-CoV-2 seroprevalence of 30.2% in HCWs at the end of the first surge of SARS-CoV-2 infections in NYC. We identified the highest seropositivity rates for nonclinical staff and nurses, followed by allied HCWs, with the odds of being seropositive ranging from 1.7 to 2.5. The work locations with the highest seroprevalences were the ED and inpatient units, with 2.3-fold and 1.5-fold increased odds of seropositivity, respectively.
Serosurveillance studies have reported the trajectory of community prevalence in NYC over the first wave. A 6.3% prevalence was reported in samples collected between March 23 and April 1, 2020.17 In a study by Rosenberg et al18 with testing performed from April 9 through April 28, 2020, prevalence increased to 22.7%. Serosurveillance data from the NYC Department of Health show prevalence ranging from 20.1% to 23.3% (average 22%) during the study period.16 Compared to the estimated seroprevalence of 9.3% in the United States,19 these rates established NYC as an early epicenter for the COVID-19 pandemic, with our institution’s HCW seroprevalence considerably higher than NYC community serosurveillance rates, 2.2 times higher than reported in the earlier HCW study in the greater NYC area,13 and higher than the 27% rate during May 2020 recently reported in another NYC hospital.20
Data from studies of hospital transmission and effects of mitigation measures, such as a universal masking policy for HCWs and patients, clearly demonstrate the high effectiveness of these measures in reducing hospital transmissions.21,22 This suggests HCW seroprevalence in institutions with well-implemented infection control and universal masking policies may not be a consequence of workplace exposures, but rather may be reflective of community rates.23 Our institution’s response commenced February 3, 2020, with implementation of social distancing, a universal masking policy, transmission-based precautions, and use of fitted N95 masks. Mid-March, elective surgeries were canceled, and inpatient visitation suspended. During the surge, these measures were widely and consistently implemented for all categories of HCWs throughout the work environment, based on emerging guidelines from the Centers for Disease Control and Prevention (CDC) and NYC Department of Health. Our overall observed HCW seroprevalence, well above that of the community, with differences in categories of job function and work locations, is therefore an important finding. Our sample of 2,749 HCWs lived in NYC and its surrounding suburbs and nearby states. There is heterogeneity in community seroprevalence between areas outside of NYC and NYC (an epicenter) itself. We therefore analyzed our data in the subset with NYC zip codes, confirming a similar overall prevalence and increased odds of seropositivity in nurses, allied HCWs, and nonclinical staff.
Physicians and administrative and office staff had seropositivity rates of 18.1%, 20.9%, and 25.8%, respectively, consistent with community rates and illustrating the effectiveness of PPE in the hospital setting. Since PPE use was part of a universal policy applied to all HCWs in our institution, other possible reasons may explain the differences we found. We speculate that the close working relationship nurses have with their patients resulted in a longer duration and higher frequency of daily interactions, increasing the risk for transmission and causing breakthrough infections.24,25 This increased risk is reflected in a study in which 28% of hospitalized patients were nurses and 9% certified nursing assistants.26
The CDC recently redefined close contact with someone with COVID-19 as a cumulative total of >15 minutes over 24 hours.25 Thus, several multiple short periods of exposure can increase risk for infection with SARS-CoV-2; such exposure is characteristic of the job function of nurses, nursing staff, and nonclinical staff. Further, housekeeping, transportation, and security officers are all nonclinical staff with significant and multiple exposures to COVID-19 patients during the surge, and for security officers, to continuous public traffic in and out of the hospital. SARS-CoV-2 spreads by virus shedding in large droplets and aerosols, with droplet nuclei <5 microns in size efficiently dispersed in air, an important additional mode of transmission.27-30 Airborne transmission coupled with virus shedding in asymptomatic and presymptomatic persons, which has been shown to cause secondary attack rates of up to 32%, are other factors that likely contributed to the increased seroprevalence in this group.31 Our observation is consistent with the Birmingham study, which reported the highest rate in housekeeping staff, with a prevalence of 34.5%, compared to 44% in this study.6 Similar reasons for high seropositivity rates apply to the two groups of allied HCWs (eg, medical assistants and patient care technicians, social workers, nutritionists and therapists), whose job functions place them in intermittent but significant proximity with inpatients and outpatients.
Consistent with public health data showing that minorities are disproportionately affected by this disease, we found that Black HCWs were three times more likely to be seropositive.32 However, an unexpected observation was the association between obesity and SARS-CoV-2 seropositivity. A possible explanation for this association may be inability to achieve optimal fit testing for N95 masks, thereby increasing the risk of exposure to droplet nuclei. This is important given that obesity is associated with poorer outcomes from COVID-19.
During the height of the first wave in NYC, EDs and inpatient units handled a large volume of COVID-19 patients with high PCR positivity rates (peak of 51% in March in our hospital). It was not unexpected that we observed increased odds of seropositivity in these work locations. As ICUs were at capacity, inpatient units cared for critically ill patients they would not normally have. HCWs in these locations coped with an increased workload, increased demand on PPE supplies, and work fatigue, which contributed to increased risk for hospital-acquired SARS-CoV-2 infections.
Reporting seroprevalence at a single institution was a limitation of the study. Approximately 57% of the hospital’s total HCW population was tested for antibodies. It is possible their risk profile influenced their decision to volunteer for testing when it became available, introducing selection bias. A comparison between tested and untested HCWs showed similarity in all demographic measures, including nasopharyngeal PCR testing, except for age. We did not have information on symptoms that would prompt PCR testing. HCWs who underwent voluntary testing were younger compared to those who did not undergo testing. Current NYC serosurveillance data showed higher seropositivity in the 45-to-64–year age group (27.8%-28.6%) compared to the 65-to-74–year age group (24.3%), which suggests that the tested group may overestimate seroprevalence among HCWs relative to a randomly selected sample.33 Similarly, there were more nurses, allied HCWs, physicians, and administrative staff in the tested group, with the former two having higher SARS-CoV-2 seropositivity compared to community prevalence, which could also overestimate seroprevalence. Our large sample size provided us with the power to detect differences within several different job functions and work locations, a strength of this study. It was not possible to differentiate community- from hospital-acquired infection in our HCWs, a limitation in many observational HCW seroprevalence studies. However, when we analyzed data restricted only to HCWs in NYC, to reduce the effect of differing community prevalences outside the city, our results were unchanged. Since it is possible that nonclinical HCWs are of a lower socioeconomic status compared to others (nurses and allied HCWs), we cannot exclude the possibility that higher SARS-CoV-2 seroprevalence associated with lower status explains, partly or completely, the increased odds of seropositivity we observed.34 Due to the high proportion of missing data for race (61.3%), we advise caution in interpreting our finding that the odds of seropositivity were three times higher for Black race, even though consistent with prior literature.34 Healthcare organizations have similar job function and work location categories incorporated in their infrastructure, suggesting that our observations may be generalizable to other hospitals in the United States.
CONCLUSION
These findings show that during the first surge in NYC, with its increased burden of disease, hospitalizations, morbidity, and mortality, seroprevalences varied based on job function and work location within this institution. Nurses were at highest risk for SARS-CoV-2 infection, as were those who worked in the ED. In preparation for subsequent waves of SARS-CoV-2 and other highly contagious respiratory infections, major medical centers need to enhance efforts aimed at protecting HCWs, with particular attention to these groups. This study also strongly supports the recent CDC guideline prioritizing HCWs to receive COVID-19 mRNA and adenovirus vector vaccines that have obtained emergency use authorization by the US Food and Drug Administration.35
Acknowledgments
The authors thank all the residents, nurses, and staff of the Department of Family Medicine for their contribution to this work.
1. Liu YC, Kuo RL, Shih SR. COVID-19: The first documented coronavirus pandemic in history. Biomed J. 2020;43(4):328-333. https://doi.org/10.1016/j.bj.2020.04.007
2. World Health Organization. WHO coronavirus disease (COVID-19) dashboard. Accessed April 12, 2021. https://covid19.who.int
3. Nguyen LH, Drew DA, Graham MS, et al. Risk of COVID-19 among front-line health-care workers and the general community: a prospective cohort study. Lancet Public Health. 2020;5(9):e475-e483. https://doi.org/10.1016/S2468-2667(20)30164-X
4. Gupta S, Federman DG. Hospital preparedness for COVID-19 pandemic: experience from department of medicine at Veterans Affairs Connecticut Healthcare System. Postgrad Med. 2020:1-6. https://doi.org/10.1080/00325481.2020.1761668
5. Woolley K, Smith R, Arumugam S. Personal protective equipment (PPE) guidelines, adaptations and lessons during the COVID-19 pandemic. Ethics Med Public Health. 2020;14:100546. https://doi.org/10.1016/j.jemep.2020.100546
6. Shields A, Faustini SE, Perez-Toledo M, et al. SARS-CoV-2 seroprevalence and asymptomatic viral carriage in healthcare workers: a cross-sectional study. Thorax. 2020;75(12):1089-1094. https://doi.org/10.1136/thoraxjnl-2020-215414
7. Steensels D, Oris E, Coninx L, et al. Hospital-wide SARS-CoV-2 antibody screening in 3056 staff in a tertiary center in Belgium. JAMA. 2020;324(2):195-197. https://doi.org/10.1001/jama.2020.11160
8. Stubblefield WB, Talbot HK, Feldstein L, et al. Seroprevalence of SARS-CoV-2 Among frontline healthcare personnel during the first month of caring for COVID-19 patients - Nashville, Tennessee. Clin Infect Dis. 2020. https://doi.org/10.1093/cid/ciaa936
9. Korth J, Wilde B, Dolff S, et al. SARS-CoV-2-specific antibody detection in healthcare workers in Germany with direct contact to COVID-19 patients. J Clin Virol. 2020;128:104437. https://doi.org/10.1016/j.jcv.2020.104437
10. Keeley AJ, Evans C, Colton H, et al. Roll-out of SARS-CoV-2 testing for healthcare workers at a large NHS Foundation Trust in the United Kingdom, March 2020. Euro Surveill. 2020;25(14). https://doi.org/10.2807/1560-7917.ES.2020.25.14.2000433
11. Self WH, Tenforde MW, Stubblefield WB, et al. Seroprevalence of SARS-CoV-2 among frontline health care personnel in a multistate hospital network - 13 academic medical centers, April-June 2020. MMWR Morb Mortal Wkly Rep. 2020;69(35):1221-1226. https://doi.org/10.15585/mmwr.mm6935e2
12. Jeremias A, Nguyen J, Levine J, et al. Prevalence of SARS-CoV-2 infection among health care workers in a tertiary community hospital. JAMA Intern Med. 2020 Aug 11:e204214. https://doi.org/10.1001/jamainternmed.2020.4214
13. Moscola J, Sembajwe G, Jarrett M, et al. Prevalence of SARS-CoV-2 antibodies in health care personnel in the New York City area. JAMA. 2020;324(9):893-895. https://doi.org/10.1001/jama.2020.14765
14. Gonzalez-Reiche AS, Hernandez MM, Sullivan MJ, et al. Introductions and early spread of SARS-CoV-2 in the New York City area. Science. 2020;369(6501):297-301. https://doi.org/10.1126/science.abc1917
15. Lau CS, Hoo SF, Yew SF, et al. Evaluation of the Roche Elecsys Anti-SARS-CoV-2 assay. Preprint. Posted online June 29, 2020. Accessed November 8, 2020. https://www.medrxiv.org/content/10.1101/2020.06.28.20142232v1 https://doi.org/10.1101/2020.06.28.20142232
16. New York City Department of Health. Covid-19: data. long-term trends. Antibody testing. Accessed March 5, 2021. https://www1.nyc.gov/site/doh/covid/covid-19-data-trends.page#antibody
17. Havers FP, Reed C, Lim T, et al. Seroprevalence of antibodies to SARS-CoV-2 in 10 sites in the United States, March 23-May 12, 2020. JAMA Intern Med. Published online July 21, 2020. https://doi.org/10.1001/jamainternmed.2020.4130
18. Rosenberg ES, Tesoriero JM, Rosenthal EM, et al. Cumulative incidence and diagnosis of SARS-CoV-2 infection in New York. Ann Epidemiol. Aug 2020;48:23-29 e4. https://doi.org/10.1016/j.annepidem.2020.06.004
19. Anand S, Montez-Rath M, Han J, et al. Prevalence of SARS-CoV-2 antibodies in a large nationwide sample of patients on dialysis in the USA: a cross-sectional study. Lancet. 2020;396(10259):1335-1344. https://doi.org/10.1016/S0140-6736(20)32009-2
20. Venugopal U, Jilani N, Rabah S, et al. SARS-CoV-2 seroprevalence among health care workers in a New York City hospital: a cross-sectional analysis during the COVID-19 pandemic. Int J Infect Dis. 2020;102:63-69. https://doi.org/10.1016/j.ijid.2020.10.036
21. Samaranayake LP, Fakhruddin KS, Ngo HC, Chang JWW, Panduwawala C. The effectiveness and efficacy of respiratory protective equipment (RPE) in dentistry and other health care settings: a systematic review. Acta Odontol Scand. 2020;78(8):626-639. https://doi.org/10.1080/00016357.2020.1810769
22. Seidelman JL, Lewis SS, Advani SD, et al. Universal masking is an effective strategy to flatten the severe acute respiratory coronavirus virus 2 (SARS-CoV-2) healthcare worker epidemiologic curve. Infect Control Hosp Epidemiol. 2020;41(12):1466-1467. https://doi.org/10.1017/ice.2020.313
23. Richterman A, Meyerowitz EA, Cevik M. Hospital-acquired SARS-CoV-2 infection: lessons for public health. JAMA. Published online November 13, 2020. https://doi.org/10.1001/jama.2020.21399
24. Degesys NF, Wang RC, Kwan E, Fahimi J, Noble JA, Raven MC. Correlation between n95 extended use and reuse and fit failure in an emergency department. JAMA. 2020;324(1):94-96. https://doi.org/10.1001/jama.2020.9843
25. Pringle JC, Leikauskas J, Ransom-Kelley S, et al. COVID-19 in a correctional facility employee following multiple brief exposures to persons with COVID-19 - Vermont, July-August 2020. MMWR Morb Mortal Wkly Rep. 2020;69(43):1569-1570. https://doi.org/10.15585/mmwr.mm6943e1
26. Kambhampati AK, O’Halloran AC, Whitaker M, et al. COVID-19-associated hospitalizations among health care personnel - COVID-NET, 13 states, March 1-May 31, 2020. MMWR Morb Mortal Wkly Rep. 2020;69(43):1576-1583. https://doi.org/10.15585/mmwr.mm6943e3
27. Zhang R, Li Y, Zhang AL, Wang Y, Molina MJ. Identifying airborne transmission as the dominant route for the spread of COVID-19. Proc Natl Acad Sci U S A. 2020;117(26):14857-14863. https://doi.org/10.1073/pnas.2009637117
28. Setti L, Passarini F, De Gennaro G, et al. Airborne transmission route of COVID-19: why 2 meters/6 feet of inter-personal distance could not be enough. Int J Environ Res Public Health. 2020;17(8):2932. https://doi.org/doi:10.3390/ijerph17082932
29. Klompas M, Baker MA, Rhee C. Airborne transmission of SARS-CoV-2: theoretical considerations and available evidence. JAMA. 2020;324(5):441-442. https://doi.org/10.1001/jama.2020.12458
30. Bourouiba L. Turbulent gas clouds and respiratory pathogen emissions: potential implications for reducing transmission of COVID-19. JAMA. 2020;323(18):1837-1838. https://doi.org/10.1001/jama.2020.4756
31. Qiu X, Nergiz A, Maraolo A, Bogoch I, Low N, Cevik M. The role of asymptomatic and pre-symptomatic infection in SARS-CoV-2 transmission – a living systematic review. Clin Mibrobiol Infect. 2021;20:S1198-743X(21)00038-0. Published online January 20, 2021. https://doi.org/10.1016/j.cmi.2021.01.011
32. Price-Haywood EG, Burton J, Fort D, Seoane L. Hospitalization and mortality among black patients and white patients with Covid-19. N Engl J Med. 2020;382(26):2534-2543. https://doi.org/doi:10.1056/NEJMsa2011686
33. New York City Department of Health. Covid-19: Data. Antibody testing by group - age. Accessed March 5, 2021. https://www1.nyc.gov/site/doh/covid/covid-19-data-totals.page#antibody
34. Patel JA, Nielsen FBH, Badiani AA, et al. Poverty, inequality and COVID-19: the forgotten vulnerable. Public Health. 2020;183:110-111. https://doi.org/10.1016/j.puhe.2020.05.006
35. Polack FP, Thomas SJ, Kitchin N, et al. Safety and efficacy of the BNT162b2 mRNA Covid-19 vaccine. N Engl J Med. 2020;383(27):2603-2615. https://doi.org/10.1056/NEJMoa2034577
SARS-CoV-2 has infected 141 million people worldwide and 31 million people in the United States as of April 20, 2021.1,2 The influx of hospital admissions and deaths has severely strained healthcare systems worldwide and placed healthcare workers (HCWs) at increased risk for acquiring COVID-19.3-5
Several studies have described the impact of COVID-19 on this heterogeneous group of HCWs. Shields et al reported a seroprevalence of 24.4% in HCWs at University Hospitals Birmingham (UK), with the highest rate, 34.5%, in housekeeping staff.6 Steensels et al reported a lower prevalence of 6.4% at a tertiary care center in Belgium, and showed no increased risk for HCWs when directly involved in clinical care.7 The authors attributed this to adequate use of personal protective equipment (PPE). Other studies have reported seroprevalences ranging from 1.6% to 18%.8-11 In the New York City (NYC) metro area, Jeremias et al reported a seroprevalence of 9.8% in HCWs and found no difference by job title or work location,12 whereas Moscola et al reported a seroprevalence of 13.7% and demonstrated a 3% increased risk for those working in service or maintenance.13 Antibody tests were conducted between March and April 2020 in all but two of these studies; testing in these two studies was performed between April 13 and June 23, 2020, with one reporting a seroprevalence of 6%11 and the other, 13.7%.13
NYC became the earliest pandemic epicenter in the United States following untracked transmission from ongoing circulation of SARS-CoV-2 in Europe.14 As a result, the COVID-19 surge in NYC commenced in March and largely subsided by the end of May 2020. Most HCW data reported to date do not reflect the situation at the end of the surge, and may underestimate true seroprevalence. We describe SARS-CoV-2 seroprevalence in HCWs in a large inner-city hospital in NYC, with antibody testing conducted from May 18 to June 26, 2020, at the subsidence of the surge. To further our understanding of occupational risk among different groups of HCWs, we examined associations of seroprevalence with HCWs’ job function and work location.
METHODS
This was a cross-sectional seroprevalence study conducted in the BronxCare Health System located in South and Central Bronx, an area that experienced one of the highest incidences of SARS-CoV-2 infections within NYC’s five boroughs.
HCWs were offered voluntary testing for serum antibodies to SARS-CoV-2 between May 18 and June 26, 2020. Testing occurred in the institution’s auditorium, a central and easily accessible location. Weekly emails were sent to all employees and department heads during the testing period, offering antibody testing and providing location and testing time information. The Elecsys Anti-SARS-CoV-2 (Roche) assay measuring total qualitative antibodies was used; the assay has a reported sensitivity of 97.1% 14 days after a positive SARS-CoV-2 RNA polymerase chain reaction (PCR) test result and a specificity of 100%.15
Demographic and work-related information was abstracted from electronic medical records, including all comorbid conditions that affected 30 or more HCWs. Pulmonary diagnoses, including asthma and chronic obstructive pulmonary disease, were grouped as chronic lung disease, and cardiovascular diseases, including hypertension, as chronic heart disease. Personal identifiers and data were delinked upon completion of data abstraction. The study was approved by the hospital’s institutional review board.
Job Function and Work Location
HCWs were grouped by job function as follows: physicians; nurses (including physician assistants and nurse practitioners); allied HCW I (medical assistants, patient care, and electrocardiogram, radiology, and ear, nose and throat technicians); allied HCW II (social workers, dieticians and nutritionists, registration clerks and unit associates, physical and occupational therapists); nonclinical staff (patient transporters, housekeeping staff, and security staff); pharmacists; engineering; and administrative staff. Respiratory therapists were considered as a separate group as their work placed them at high risk for respiratory diseases.
Work locations were as follows: clinics (including dental, outpatient, and satellite clinics), emergency departments (ED), inpatient units (including floors and intensive care units [ICU]), radiology suite, laboratory and pharmacy, and offices.
Statistical Analysis
Descriptive statistics were calculated using χ2 analyses. All demographic variables were tested against serology status (positive/negative). A binary logistic regression analysis was used to calculate odds ratios (ORs). Eight separate univariate unadjusted ORs were calculated by running each predictor variable against serology status (dependent variable), which included the six categorical variables—race, ethnicity, age, sex, body mass index (BMI), and prior SARS-CoV-2 PCR results—and the two main predictors—job function and work location. To obtain adjusted ORs, two final separate multivariable logistic regression analyses were executed including the six covariates listed. Due to high collinearity between job function and work location (χ2 = 3030.13, df = 35 [6 levels of work location – 1]*[8 levels of job function – 1]; P < .001), we included only one of the main predictors in each model. The regressions were specified such that the reference groups for the work location and job function variables were office work and administration, respectively. This choice was made based on the fact that their nonclinical functions do not confer an exposure risk in excess of that experienced by typical community populations. Sensitivity analyses were performed on the subset of HCWs whose address zip codes indicated residence within NYC to exclude the effect of different community seroprevalences in areas outside of NYC. The 95% CI for seroprevalence of antibodies within tested HCWs was estimated using the Clopper-Pearson binomial method.
RESULTS
Among all HCWs in the institution (N = 4,807), 2,749 (57.2%) underwent voluntary testing. Of those who underwent testing, 831 were positive for antibodies to SARS-CoV-2 (Figure 1), a seroprevalence of 30.2% (95% CI, 29%-32%). Among the age groups, the 45-to-64−year group had the highest seropositivity at 33% (400/1203), and those ≥75 years of age, the lowest at 16.7% (2/12) (P < .009).
Among all tested HCWs, 70.1% (1,928/2,749) resided in NYC. SARS-CoV-2 seroprevalence in this subset was 32% (616/1,928) (Figure 1). Demographic and comorbid conditions in HCWs who lived in NYC were similar to those of the whole group (Appendix Table 1).
HCWs who underwent voluntary antibody testing (Appendix Table 2) had a higher percentage of persons in the 45-to-64−year age group (43.8% vs 40.9%) and a lower percentage of persons in the 65-to-74−year age group (3.3% vs 5.3%) compared with the group of HCWs that did not undergo testing (P < .001). Gender, race, ethnicity, comorbid conditions, SARS-CoV-2 PCR testing, and work locations were not different between groups. The tested group had higher proportions of clinicians (physicians, nurses, allied HCWs I and II) than the untested nonparticipant group (P = .014).
SARS-CoV-2 PCR Tests on HCWs
More than one-third (34.1%; 938/2,749) of HCWs had a documented nasopharyngeal PCR test between March 23 and June 26, 2020 (Table). Of all PCRs performed, 262 were positive, giving an overall PCR positivity rate of 27.9%. Positivity was 51.4% in March and 36.6% in April. The reasons for PCR testing were not available, but likely represent a combination of exposure-related testing among asymptomatic individuals and diagnostic testing of symptomatic HCWs. In contrast, serology testing was indicative of prior infection and yielded a cumulative seroprevalence at the end of the surge. Findings were similar among HCWs residing in NYC
Work Location and Job Function
Among all HCWs (Table, Figure 2), there were differences in seropositivity by work location (P = .001). The largest number of HCWs worked in inpatient units (1,348/2,749, 49%), and the second largest in offices (554/2,749, 20%). The highest seropositivity rate was in the EDs, at 36.4% (64/176), followed by radiology suites, at 32.7% (17/52); the seropositivity rate in office locations was 25.8% (143/554). Among HCWs residing in NYC (Appendix Table 1, Appendix Figure 1), the rank order according to proportion seropositive by work location was similar to that of the whole group (P = .004), except that the second highest seropositivity rate was in the inpatient units (33.9% [323/953]). In the group of HCWs residing in NYC, office locations had a seropositivity of 27.4% (102/372). The seropositivity rates for both groups working in office locations were slightly higher than the 22% community seroprevalence in NYC reported for the same period.16
Among all HCWs, there were differences in seropositivity by job function (P = .001). The greatest proportion of HCWs were allied HCW II (23% [631/2,749]), followed by nurses (22.2% [611/2,749]) and physicians (21.3% [585/2,749] ). Seropositivity was highest for nonclinical staff (44.0% [51/116]), followed by nurses (37.5% [229/611]) and allied clinical HCW I and II (34.5% [143/414] and 32.0% [202/631], respectively). It was lowest for administrative staff (20.9% [42/201]) and pharmacists (11.1% [5/45]). Among HCWs residing in NYC, the rank order according to proportion seropositive by location was similar to that of the whole group. Administrative staff seropositivity was 18.3% (20/109). Administrative staff seropositivity for both groups was marginally lower than the 22% community seroprevalence in NYC for the same period.16
Odds Ratios for SARS-CoV-2 Seropositivity
For all HCWs, in unadjusted models (Appendix Table 3), age 45 to 64 years and Black race were associated with increased odds of being seropositive (1.26; 95% CI, 1.07-1.49 and 2.26; 95% CI, 1.51-3.37, respectively). Increased odds were seen for HCWs working in the ED (1.64; 95% CI, 1.14-2.36) and inpatient units (1.35; 95% CI, 1.08-1.69), and decreased odds were seen for those working in the laboratory and pharmacy (0.47; 95% CI, 0.26-0.86). Increased odds for seropositivity were found for nurses (2.27; 95% CI, 1.56-3.31), allied HCW I (2.00; 95% CI, 1.34-2.97), allied HCW II (1.78; 95% CI, 1.22-2.60), and nonclinical staff (2.97; 95% CI,1.80-4.90).
After adjusting for all covariates, HCWs who were Black remained at increased odds for being seropositive in the two final models (adjusted OR, 2.29; 95% CI, 1.38-3.81 and adjusted OR, 2.94; 95% CI, 1.78-4.85), as did those who had a BMI >30 kg/m2, with an adjusted OR of 1.36 (95% CI, 1.05-1.77) in one of the final models (Appendix Table 3). None of the other comorbid conditions had increased ORs. Those who worked in the ED and inpatient units also remained at increased odds after adjusting for covariates (2.27; 95% CI, 1.53-3.37 and 1.48; 95% CI, 1.14-1.92, respectively; Figure 3). Other job functions that had increased odds for seropositivity were nurses (2.54; 95% CI, 1.64-3.94), allied HCW I (1.83; 95% CI, 1.15-2.89) and II (1.70; 95% CI, 1.10-2.63), and nonclinical staff (2.51; 95% CI, 1.42-4.43).
Having a positive PCR for SAR-CoV-2 on nasopharyngeal swabs was strongly associated with seropositivity (OR, 47.26; 95% CI, 29.30-76.23 and OR, 44.79; 95% CI, 27.87-72.00) in the two multivariate-adjusted models. These findings were confirmed when the analyses were performed on HCWs who resided in NYC (Appendix Table 4 and Appendix Figure 2).
DISCUSSION
In a large inner-city New York hospital, we report a cumulative SARS-CoV-2 seroprevalence of 30.2% in HCWs at the end of the first surge of SARS-CoV-2 infections in NYC. We identified the highest seropositivity rates for nonclinical staff and nurses, followed by allied HCWs, with the odds of being seropositive ranging from 1.7 to 2.5. The work locations with the highest seroprevalences were the ED and inpatient units, with 2.3-fold and 1.5-fold increased odds of seropositivity, respectively.
Serosurveillance studies have reported the trajectory of community prevalence in NYC over the first wave. A 6.3% prevalence was reported in samples collected between March 23 and April 1, 2020.17 In a study by Rosenberg et al18 with testing performed from April 9 through April 28, 2020, prevalence increased to 22.7%. Serosurveillance data from the NYC Department of Health show prevalence ranging from 20.1% to 23.3% (average 22%) during the study period.16 Compared to the estimated seroprevalence of 9.3% in the United States,19 these rates established NYC as an early epicenter for the COVID-19 pandemic, with our institution’s HCW seroprevalence considerably higher than NYC community serosurveillance rates, 2.2 times higher than reported in the earlier HCW study in the greater NYC area,13 and higher than the 27% rate during May 2020 recently reported in another NYC hospital.20
Data from studies of hospital transmission and effects of mitigation measures, such as a universal masking policy for HCWs and patients, clearly demonstrate the high effectiveness of these measures in reducing hospital transmissions.21,22 This suggests HCW seroprevalence in institutions with well-implemented infection control and universal masking policies may not be a consequence of workplace exposures, but rather may be reflective of community rates.23 Our institution’s response commenced February 3, 2020, with implementation of social distancing, a universal masking policy, transmission-based precautions, and use of fitted N95 masks. Mid-March, elective surgeries were canceled, and inpatient visitation suspended. During the surge, these measures were widely and consistently implemented for all categories of HCWs throughout the work environment, based on emerging guidelines from the Centers for Disease Control and Prevention (CDC) and NYC Department of Health. Our overall observed HCW seroprevalence, well above that of the community, with differences in categories of job function and work locations, is therefore an important finding. Our sample of 2,749 HCWs lived in NYC and its surrounding suburbs and nearby states. There is heterogeneity in community seroprevalence between areas outside of NYC and NYC (an epicenter) itself. We therefore analyzed our data in the subset with NYC zip codes, confirming a similar overall prevalence and increased odds of seropositivity in nurses, allied HCWs, and nonclinical staff.
Physicians and administrative and office staff had seropositivity rates of 18.1%, 20.9%, and 25.8%, respectively, consistent with community rates and illustrating the effectiveness of PPE in the hospital setting. Since PPE use was part of a universal policy applied to all HCWs in our institution, other possible reasons may explain the differences we found. We speculate that the close working relationship nurses have with their patients resulted in a longer duration and higher frequency of daily interactions, increasing the risk for transmission and causing breakthrough infections.24,25 This increased risk is reflected in a study in which 28% of hospitalized patients were nurses and 9% certified nursing assistants.26
The CDC recently redefined close contact with someone with COVID-19 as a cumulative total of >15 minutes over 24 hours.25 Thus, several multiple short periods of exposure can increase risk for infection with SARS-CoV-2; such exposure is characteristic of the job function of nurses, nursing staff, and nonclinical staff. Further, housekeeping, transportation, and security officers are all nonclinical staff with significant and multiple exposures to COVID-19 patients during the surge, and for security officers, to continuous public traffic in and out of the hospital. SARS-CoV-2 spreads by virus shedding in large droplets and aerosols, with droplet nuclei <5 microns in size efficiently dispersed in air, an important additional mode of transmission.27-30 Airborne transmission coupled with virus shedding in asymptomatic and presymptomatic persons, which has been shown to cause secondary attack rates of up to 32%, are other factors that likely contributed to the increased seroprevalence in this group.31 Our observation is consistent with the Birmingham study, which reported the highest rate in housekeeping staff, with a prevalence of 34.5%, compared to 44% in this study.6 Similar reasons for high seropositivity rates apply to the two groups of allied HCWs (eg, medical assistants and patient care technicians, social workers, nutritionists and therapists), whose job functions place them in intermittent but significant proximity with inpatients and outpatients.
Consistent with public health data showing that minorities are disproportionately affected by this disease, we found that Black HCWs were three times more likely to be seropositive.32 However, an unexpected observation was the association between obesity and SARS-CoV-2 seropositivity. A possible explanation for this association may be inability to achieve optimal fit testing for N95 masks, thereby increasing the risk of exposure to droplet nuclei. This is important given that obesity is associated with poorer outcomes from COVID-19.
During the height of the first wave in NYC, EDs and inpatient units handled a large volume of COVID-19 patients with high PCR positivity rates (peak of 51% in March in our hospital). It was not unexpected that we observed increased odds of seropositivity in these work locations. As ICUs were at capacity, inpatient units cared for critically ill patients they would not normally have. HCWs in these locations coped with an increased workload, increased demand on PPE supplies, and work fatigue, which contributed to increased risk for hospital-acquired SARS-CoV-2 infections.
Reporting seroprevalence at a single institution was a limitation of the study. Approximately 57% of the hospital’s total HCW population was tested for antibodies. It is possible their risk profile influenced their decision to volunteer for testing when it became available, introducing selection bias. A comparison between tested and untested HCWs showed similarity in all demographic measures, including nasopharyngeal PCR testing, except for age. We did not have information on symptoms that would prompt PCR testing. HCWs who underwent voluntary testing were younger compared to those who did not undergo testing. Current NYC serosurveillance data showed higher seropositivity in the 45-to-64–year age group (27.8%-28.6%) compared to the 65-to-74–year age group (24.3%), which suggests that the tested group may overestimate seroprevalence among HCWs relative to a randomly selected sample.33 Similarly, there were more nurses, allied HCWs, physicians, and administrative staff in the tested group, with the former two having higher SARS-CoV-2 seropositivity compared to community prevalence, which could also overestimate seroprevalence. Our large sample size provided us with the power to detect differences within several different job functions and work locations, a strength of this study. It was not possible to differentiate community- from hospital-acquired infection in our HCWs, a limitation in many observational HCW seroprevalence studies. However, when we analyzed data restricted only to HCWs in NYC, to reduce the effect of differing community prevalences outside the city, our results were unchanged. Since it is possible that nonclinical HCWs are of a lower socioeconomic status compared to others (nurses and allied HCWs), we cannot exclude the possibility that higher SARS-CoV-2 seroprevalence associated with lower status explains, partly or completely, the increased odds of seropositivity we observed.34 Due to the high proportion of missing data for race (61.3%), we advise caution in interpreting our finding that the odds of seropositivity were three times higher for Black race, even though consistent with prior literature.34 Healthcare organizations have similar job function and work location categories incorporated in their infrastructure, suggesting that our observations may be generalizable to other hospitals in the United States.
CONCLUSION
These findings show that during the first surge in NYC, with its increased burden of disease, hospitalizations, morbidity, and mortality, seroprevalences varied based on job function and work location within this institution. Nurses were at highest risk for SARS-CoV-2 infection, as were those who worked in the ED. In preparation for subsequent waves of SARS-CoV-2 and other highly contagious respiratory infections, major medical centers need to enhance efforts aimed at protecting HCWs, with particular attention to these groups. This study also strongly supports the recent CDC guideline prioritizing HCWs to receive COVID-19 mRNA and adenovirus vector vaccines that have obtained emergency use authorization by the US Food and Drug Administration.35
Acknowledgments
The authors thank all the residents, nurses, and staff of the Department of Family Medicine for their contribution to this work.
1. Liu YC, Kuo RL, Shih SR. COVID-19: The first documented coronavirus pandemic in history. Biomed J. 2020;43(4):328-333. https://doi.org/10.1016/j.bj.2020.04.007
2. World Health Organization. WHO coronavirus disease (COVID-19) dashboard. Accessed April 12, 2021. https://covid19.who.int
3. Nguyen LH, Drew DA, Graham MS, et al. Risk of COVID-19 among front-line health-care workers and the general community: a prospective cohort study. Lancet Public Health. 2020;5(9):e475-e483. https://doi.org/10.1016/S2468-2667(20)30164-X
4. Gupta S, Federman DG. Hospital preparedness for COVID-19 pandemic: experience from department of medicine at Veterans Affairs Connecticut Healthcare System. Postgrad Med. 2020:1-6. https://doi.org/10.1080/00325481.2020.1761668
5. Woolley K, Smith R, Arumugam S. Personal protective equipment (PPE) guidelines, adaptations and lessons during the COVID-19 pandemic. Ethics Med Public Health. 2020;14:100546. https://doi.org/10.1016/j.jemep.2020.100546
6. Shields A, Faustini SE, Perez-Toledo M, et al. SARS-CoV-2 seroprevalence and asymptomatic viral carriage in healthcare workers: a cross-sectional study. Thorax. 2020;75(12):1089-1094. https://doi.org/10.1136/thoraxjnl-2020-215414
7. Steensels D, Oris E, Coninx L, et al. Hospital-wide SARS-CoV-2 antibody screening in 3056 staff in a tertiary center in Belgium. JAMA. 2020;324(2):195-197. https://doi.org/10.1001/jama.2020.11160
8. Stubblefield WB, Talbot HK, Feldstein L, et al. Seroprevalence of SARS-CoV-2 Among frontline healthcare personnel during the first month of caring for COVID-19 patients - Nashville, Tennessee. Clin Infect Dis. 2020. https://doi.org/10.1093/cid/ciaa936
9. Korth J, Wilde B, Dolff S, et al. SARS-CoV-2-specific antibody detection in healthcare workers in Germany with direct contact to COVID-19 patients. J Clin Virol. 2020;128:104437. https://doi.org/10.1016/j.jcv.2020.104437
10. Keeley AJ, Evans C, Colton H, et al. Roll-out of SARS-CoV-2 testing for healthcare workers at a large NHS Foundation Trust in the United Kingdom, March 2020. Euro Surveill. 2020;25(14). https://doi.org/10.2807/1560-7917.ES.2020.25.14.2000433
11. Self WH, Tenforde MW, Stubblefield WB, et al. Seroprevalence of SARS-CoV-2 among frontline health care personnel in a multistate hospital network - 13 academic medical centers, April-June 2020. MMWR Morb Mortal Wkly Rep. 2020;69(35):1221-1226. https://doi.org/10.15585/mmwr.mm6935e2
12. Jeremias A, Nguyen J, Levine J, et al. Prevalence of SARS-CoV-2 infection among health care workers in a tertiary community hospital. JAMA Intern Med. 2020 Aug 11:e204214. https://doi.org/10.1001/jamainternmed.2020.4214
13. Moscola J, Sembajwe G, Jarrett M, et al. Prevalence of SARS-CoV-2 antibodies in health care personnel in the New York City area. JAMA. 2020;324(9):893-895. https://doi.org/10.1001/jama.2020.14765
14. Gonzalez-Reiche AS, Hernandez MM, Sullivan MJ, et al. Introductions and early spread of SARS-CoV-2 in the New York City area. Science. 2020;369(6501):297-301. https://doi.org/10.1126/science.abc1917
15. Lau CS, Hoo SF, Yew SF, et al. Evaluation of the Roche Elecsys Anti-SARS-CoV-2 assay. Preprint. Posted online June 29, 2020. Accessed November 8, 2020. https://www.medrxiv.org/content/10.1101/2020.06.28.20142232v1 https://doi.org/10.1101/2020.06.28.20142232
16. New York City Department of Health. Covid-19: data. long-term trends. Antibody testing. Accessed March 5, 2021. https://www1.nyc.gov/site/doh/covid/covid-19-data-trends.page#antibody
17. Havers FP, Reed C, Lim T, et al. Seroprevalence of antibodies to SARS-CoV-2 in 10 sites in the United States, March 23-May 12, 2020. JAMA Intern Med. Published online July 21, 2020. https://doi.org/10.1001/jamainternmed.2020.4130
18. Rosenberg ES, Tesoriero JM, Rosenthal EM, et al. Cumulative incidence and diagnosis of SARS-CoV-2 infection in New York. Ann Epidemiol. Aug 2020;48:23-29 e4. https://doi.org/10.1016/j.annepidem.2020.06.004
19. Anand S, Montez-Rath M, Han J, et al. Prevalence of SARS-CoV-2 antibodies in a large nationwide sample of patients on dialysis in the USA: a cross-sectional study. Lancet. 2020;396(10259):1335-1344. https://doi.org/10.1016/S0140-6736(20)32009-2
20. Venugopal U, Jilani N, Rabah S, et al. SARS-CoV-2 seroprevalence among health care workers in a New York City hospital: a cross-sectional analysis during the COVID-19 pandemic. Int J Infect Dis. 2020;102:63-69. https://doi.org/10.1016/j.ijid.2020.10.036
21. Samaranayake LP, Fakhruddin KS, Ngo HC, Chang JWW, Panduwawala C. The effectiveness and efficacy of respiratory protective equipment (RPE) in dentistry and other health care settings: a systematic review. Acta Odontol Scand. 2020;78(8):626-639. https://doi.org/10.1080/00016357.2020.1810769
22. Seidelman JL, Lewis SS, Advani SD, et al. Universal masking is an effective strategy to flatten the severe acute respiratory coronavirus virus 2 (SARS-CoV-2) healthcare worker epidemiologic curve. Infect Control Hosp Epidemiol. 2020;41(12):1466-1467. https://doi.org/10.1017/ice.2020.313
23. Richterman A, Meyerowitz EA, Cevik M. Hospital-acquired SARS-CoV-2 infection: lessons for public health. JAMA. Published online November 13, 2020. https://doi.org/10.1001/jama.2020.21399
24. Degesys NF, Wang RC, Kwan E, Fahimi J, Noble JA, Raven MC. Correlation between n95 extended use and reuse and fit failure in an emergency department. JAMA. 2020;324(1):94-96. https://doi.org/10.1001/jama.2020.9843
25. Pringle JC, Leikauskas J, Ransom-Kelley S, et al. COVID-19 in a correctional facility employee following multiple brief exposures to persons with COVID-19 - Vermont, July-August 2020. MMWR Morb Mortal Wkly Rep. 2020;69(43):1569-1570. https://doi.org/10.15585/mmwr.mm6943e1
26. Kambhampati AK, O’Halloran AC, Whitaker M, et al. COVID-19-associated hospitalizations among health care personnel - COVID-NET, 13 states, March 1-May 31, 2020. MMWR Morb Mortal Wkly Rep. 2020;69(43):1576-1583. https://doi.org/10.15585/mmwr.mm6943e3
27. Zhang R, Li Y, Zhang AL, Wang Y, Molina MJ. Identifying airborne transmission as the dominant route for the spread of COVID-19. Proc Natl Acad Sci U S A. 2020;117(26):14857-14863. https://doi.org/10.1073/pnas.2009637117
28. Setti L, Passarini F, De Gennaro G, et al. Airborne transmission route of COVID-19: why 2 meters/6 feet of inter-personal distance could not be enough. Int J Environ Res Public Health. 2020;17(8):2932. https://doi.org/doi:10.3390/ijerph17082932
29. Klompas M, Baker MA, Rhee C. Airborne transmission of SARS-CoV-2: theoretical considerations and available evidence. JAMA. 2020;324(5):441-442. https://doi.org/10.1001/jama.2020.12458
30. Bourouiba L. Turbulent gas clouds and respiratory pathogen emissions: potential implications for reducing transmission of COVID-19. JAMA. 2020;323(18):1837-1838. https://doi.org/10.1001/jama.2020.4756
31. Qiu X, Nergiz A, Maraolo A, Bogoch I, Low N, Cevik M. The role of asymptomatic and pre-symptomatic infection in SARS-CoV-2 transmission – a living systematic review. Clin Mibrobiol Infect. 2021;20:S1198-743X(21)00038-0. Published online January 20, 2021. https://doi.org/10.1016/j.cmi.2021.01.011
32. Price-Haywood EG, Burton J, Fort D, Seoane L. Hospitalization and mortality among black patients and white patients with Covid-19. N Engl J Med. 2020;382(26):2534-2543. https://doi.org/doi:10.1056/NEJMsa2011686
33. New York City Department of Health. Covid-19: Data. Antibody testing by group - age. Accessed March 5, 2021. https://www1.nyc.gov/site/doh/covid/covid-19-data-totals.page#antibody
34. Patel JA, Nielsen FBH, Badiani AA, et al. Poverty, inequality and COVID-19: the forgotten vulnerable. Public Health. 2020;183:110-111. https://doi.org/10.1016/j.puhe.2020.05.006
35. Polack FP, Thomas SJ, Kitchin N, et al. Safety and efficacy of the BNT162b2 mRNA Covid-19 vaccine. N Engl J Med. 2020;383(27):2603-2615. https://doi.org/10.1056/NEJMoa2034577
© 2021 Society of Hospital Medicine
SARS-CoV-2 Seroprevalence Among Healthcare Workers by Workplace Exposure Risk in Kashmir, India
India is emerging as one of the world’s largest hotspots for SARS-CoV-2 infection (COVID-19)—second only to the United States—with more than 13,000,000 documented infections since the first case was recorded on January 30, 2020.1,2 Kashmir, a northern territory of India, reported its first case of COVID-19 on March 18, 2020, from the central District Srinagar; this region has accounted for more cases of COVID-19 than any other district throughout the pandemic.3 The large majority of healthcare in District Srinagar is provided by three tertiary care institutions, one district hospital, two subdistrict hospitals, and 70 primary healthcare centers. Potential occupational exposures place healthcare workers (HCWs) at higher risk of acquiring SARS-CoV-2 infection, which in turn may serve as an important source of infection for their families and other community members.4-6 Given the high frequency and geographic variability of asymptomatic infection, growing evidence suggests this hidden reservoir is a source of infection for the general population.7,8
Many countries have started testing for antibodies against SARS-CoV-2, both at the population level and in specific groups, such as HCWs. Seroepidemiological studies are crucial to understanding the dynamics of SARS-CoV-2 infection. Many seroepidemiological studies have been conducted among community populations, but there are insufficient data on HCWs. The World Health Organization also encouraged its member states to conduct seroepidemiological studies to attain a better understanding of COVID-19 infection prevalence and distribution.9-11 Therefore, to quantify the prevalence of SARS-CoV-2 infection among HCWs, we conducted a seroepidemiological study by testing for SARS-CoV-2–specific immunoglobulin (IgG) to gain insight into the extent of infection among specific subgroups of HCWs and to identify risk-factor profiles associated with seropositivity.
METHODS
Study Design and Settings
We conducted this seroepidemiological study to ascertain the presence of IgG antibodies against SARS-CoV-2 among HCWs in the District Srinagar of Kashmir, India. The 2-week period of data collection began on June 15, 2020. As part of healthcare system pandemic preparedness efforts, India’s Ministry of Health provided specific guidelines for health facilities to manage COVID-19. Hospitals were categorized as dedicated COVID and non-COVID hospitals. Dedicated COVID hospitals provided comprehensive care exclusively to patients with COVID-19 and were equipped with fully functional intensive care units, ventilators, and beds with reliable access to oxygen support.12 In addition, infection prevention and control strategies to limit the transmission of SARS-CoV-2 infection were implemented according to guidelines specified by India’s National Center for Disease Control.13 To strengthen service provision, HCWs from other hospitals, including resident physicians, were relocated to these dedicated COVID hospitals. The additional staff were selected by administrative leadership, without input from HCWs.
Study Population and Data Collection
We approached administrative heads of the hospitals in District Srinagar for permission to conduct our study and to invite their HCWs to participate in the study. As Figure 1 shows, we were denied permission by the administrative heads of two tertiary care hospitals. Finally, with a point person serving as a study liaison at each institution, HCWs from three dedicated COVID and seven non-COVID tertiary care hospitals, two subdistrict hospitals, and six primary healthcare centers across the District Srinagar were invited to participate. The sample primary healthcare centers were each selected randomly, after stratification, from six major regions of the district. All frontline HCWs, including physicians, administrative and laboratory personnel, technicians, field workers involved in surveillance activity, and other supporting staff were eligible for the study.

We collected information on an interview form using Epicollect5, a free data-gathering tool widely used in health research.14 Physicians specifically trained in the use of Epicollect5 conducted the face-to-face interview on a prespecified day and recorded the collected information through mobile phones. This information included the participants’ role in providing care to patients with COVID-19 and risk factors for SARS-CoV-2 infection (eg, history of travel since January 1, 2020, symptoms of an influenza-like illness [ILI] in the 4 weeks prior to the interview, close contact with a COVID-19 case). We defined close contact as an unmasked exposure within 6 feet of an infected individual for at least 15 minutes, irrespective of location (ie, community or the hospital).
Following the interview, trained phlebotomists collected 3 to 5 mL of venous blood under aseptic conditions. We strictly adhered to standard operating procedures during collection, transportation, and testing of blood samples. Following collection, the blood samples remained undisturbed for at least 30 minutes before centrifugation, which was performed at the collection site (or at the central laboratory for sites lacking the capability). The samples were then transported for further processing and testing through a cold chain supply line, using vaccine carriers with conditioned icepacks. All testing procedures were conducted with strict adherence to the manufacturers’ guidelines.
Laboratory Procedure
In accordance with the manufacturer’s recommendations, we used a chemiluminescent microparticle immunoassay to detect SARS-CoV-2–specific IgG antibodies in serum samples. The assay is an automated two-step immunoassay for the qualitative detection of IgG antibodies against the nucleocapsid of SARS-CoV-2 in human serum and plasma. The sensitivity and specificity of this test are 100% and 99%, respectively. The test result was considered positive for SARS-CoV-2 IgG if the index value was ≥1.4, consistent with guidance provided by the manufacturer.15
The IgG values were also entered into Epicollect5. Two trained medical interns independently entered the laboratory results in two separate forms. A third medical intern reviewed these forms for discrepancies, in response to which they referenced the source data for adjudication. The information gathered during the interview and the laboratory results were linked with the help of a unique identification number, which was generated at the time of the interview.
Statistical Analysis
We estimated the proportion (and logit-transformed 95% CI) of HCWs with a positive SARS-CoV-2–specific IgG antibody level, the primary outcome of interest. We compared seroprevalence rates by gender, age group, specific occupational group, and type of health facility (dedicated COVID hospital vs non-COVID hospital). Seroprevalence was also
RESULTS
Of the 7,346 HCWs we were granted permission to approach, 2,915 (39.7%) agreed to participate in the study. The participation rate was 49% at the dedicated COVID hospitals (57% physicians and 47% nonphysicians) and 39% at the non-COVID hospitals (46% physicians and 36% nonphysicians). We analyzed information gathered from 2,905 HCWs (Epicollect5 interview forms were missing for nine participants, and the laboratory report was missing for one participant).
The mean age of the participants was 38.6 years, and 35.8% of participants identified as female (Table 1). One third (33.7%) of the participants were physicians, nearly half of whom were residents. In our sample, the overall seroprevalence of SARS-CoV-2–specific antibodies was 2.5% (95% CI, 2.0%-3.1%). 
 Index Value of the Study Participants")
Of the 2,905 participating HCWs, 123 (4.2%) reported an ILI (ie, fever and cough) in the 4 weeks preceding the interview, and 339 (11.7%) reported close contact with a person with COVID-19 (Table 2). A total of 760 (26.2%) HCWs had undergone RT-PCR testing, 29 (3.8%) of whom had a positive result. Stratifying by workplace, history of nasopharyngeal RT-PCR positivity was reported by 4 of 77 (5.1%) participants from dedicated COVID hospitals compared to (3.7%) participants from the non-COVID hospital (P = .528).

As Table 2 also demonstrates, we found a significantly higher seropositivity rate among HCWs who had a history of ILI (P < .001), a history of positive RT-PCR (P < .001), history of ever being put under quarantine (P = .009), and a self-reported history of close contact with a person with COVID-19 (P = .014). Healthcare workers who had ever worked at a dedicated COVID hospital had a significantly lower seroprevalence of infection (P = .004).
Among HCWs who reported no ILI symptoms in the 4 weeks prior to the interview but who had positive RT-PCR test, 20.8% were seropositive. Of HCWs who reported both ILI and a positive RT-PCR test result, 60.0% were seropositive. Compared to employment at a non-COVID hospital, HCWs working in dedicated COVID hospitals had a reduced multivariate-adjusted risk of seropositivity (odds ratio, 0.21; 95% CI, 0.06-0.66).
DISCUSSION
We aimed to estimate the seroprevalence of SARS-CoV-2 infection in HCWs in different hospital settings in the District Srinagar of Kashmir, India. In general, seroprevalence was low (2.5%), with little difference across gender or occupational group.
Seroprevalence studies of HCWs across divergent workplace environments have revealed estimates ranging from 1% to 10.2%.16-19 Generally, the seroprevalence rates among HCWs are not significantly different from those of the general population, which reflects how different the dynamics of COVID-19 are compared to other infections in healthcare settings. The low seroprevalence observed in our study coincides with the overall low infection rate in the community population. During the study period, District Srinagar reported a median of 28 new infections daily (interquartile range, 17-46), which is indicative of the early phase of the pandemic in the population at the time of the study.20
Among the HCW occupational groups, ambulance drivers and housekeeping staff had the highest seroprevalence rates, followed by nurses and physicians. Possible explanations for higher seropositivity in these groups are improper use or inadequate supply of protective gear and lack of training on the use of personal protective equipment (PPE), resulting in increased exposure risk.21 Concordance of HCW and community infection rates in specific geographic areas suggests that community exposure may be the dominant source of healthcare exposure and infection. Additionally, careful in-hospital behavior of HCWs in dedicated COVID hospitals may have had a spillover effect on their out-of-hospital behavior, which may partially explain our finding that employment at dedicated COVID hospitals was associated with a markedly lower chance of seropositivity. A study of 6,510 HCWs in Chicago, Illinois, showed high seropositivity rates among support service workers, medical assistants, and nurses, with nurses identified as having a markedly higher adjusted odds of seropositivity relative to administrators. The authors of the study concluded that exposure in the community setting plays a crucial role in transmission among HCWs.22 Similarly, higher seroprevalence among housekeeping, nonadministrative staff, and other support service staff has been reported elsewhere.23 Certain underlying factors related to socioeconomic status and lifestyle may also contribute to higher seroprevalence in some occupational groups.24 Nonadherence to masking, social distancing, and proper hand hygiene outside the hospital setting could result in community-acquired infection.
Interestingly, participants who were working in a dedicated COVID hospital or who had ever worked at one had a seroprevalence of 0.6%, much lower than the 2.8% observed among other participants. This difference remained statistically significant after controlling for age, sex, place of work, and occupational group. As these facilities were dedicated to the management and care of patients with COVID-19, the hospital staff strictly adhered to safety precautions, with particular vigilance during patient contact. These hospitals also strictly adhered to infection prevention and control practices based on the latest guidelines released by India’s Ministry of Health and Family Welfare.13
A commitment was made to provide adequate PPE to the dedicated COVID hospitals and staff, commensurate with expected infected patient volumes and associated exposure risks. Healthcare workers were specifically trained on proper donning and doffing of PPE, self-health monitoring, and protocols for reporting symptoms and PPE breaches during patient encounters. Healthcare workers were regularly tested for COVID-19 using nasopharyngeal RT-PCR. Of critical importance, these hospitals implemented a buddy system wherein a team of two or more staff members was responsible for ensuring each other’s safety, proper PPE use, conformance to other protective measures, and reporting breaches of PPE compliance.25 Universal masking was mandatory for all hospital staff and patients at the COVID-focused facilities, with the additional use of N-95 masks, gloves, and face shields during times of patient contact. Administrative measures, including visitor restrictions and environmental sanitation, were rigorously enforced. Also, being a potentially high-risk area for transmission of infection, these facilities implemented staff-rationing to reduce the duration of exposure to the healthcare staff. Third, the HCWs of COVID-dedicated hospitals were provided with separate living accommodations during the period in which they were employed at a dedicated COVID hospital.
In contrast, in non-COVID hospitals, with the exception of HCWs, patients and the hospital visitors were not subject to a masking policy. Moreover, an adequate and timely supply of PPE was not prioritized at the non-COVID facilities due to resource constraints. Further, lack of testing of asymptomatic patients at non-COVID hospitals may have resulted in nosocomial transmission from asymptomatic carriers. Though routine infection prevention and control activities were performed at non-COVID hospitals, we did not assess adherence to infection prevention and control guidelines in the two different categories of hospitals. Our results are also supported by evidence from studies conducted in different hospital settings, the findings of which reiterate the importance of fundamental principles of prevention (eg, proper masking, hand hygiene, and distancing) and are of particular importance in resource-limited settings.17,26,27 The only published study quantifying seroprevalence among HCWs in India was performed in a single hospital setting with separate COVID and non-COVID units. The authors of that study reported a higher seroprevalence among HCWs in the COVID unit. However, this difference seems to be confounded by other factors as revealed by the multivariable analysis result.23
We found a two-fold higher seroprevalence (4.4%) in HCWs who reported close contact with a patient with COVID-19. Respiratory infections pose a greater health risk to HCWs in an occupational setting. Substantial evidence has emerged demonstrating that the respiratory system is the dominant route of SARS-CoV-2 transmission, with proximity and ventilation as key predictive factors.28 Globally, among thousands of HCWs infected with SARS-CoV-2, one of the leading risk factors identified was close contact with a patient with COVID-19; other identified risk factors were lack of PPE, poor infection prevention and control practices, work overload, and a preexisting health condition.29
The seroprevalence estimate among participants who reported an ILI in the 4 weeks preceding the interview was only 12.2%, suggesting an alternative etiology of these symptoms. Among those who reported a previously positive RT-PCR for SARS-CoV-2, only 27.6% showed the presence of SARS-CoV-2–specific IgG antibodies. The inability to mount an antibody-mediated immune response or early conversion to seronegative status during the convalescence phase has been suggested as an explanation for such discordant findings.30 On the contrary, seropositivity among participants who reported having a negative RT-PCR test was 1.9%. There are few plausible explanations for such observations. First, several studies have reported false-negative result rates from RT-PCR testing ranging from 2% to 29%.31-33 Second, the sensitivity of the SARS-CoV-2 assay is influenced by the timing of the test after the onset of symptoms or RT-PCR positivity. The sensitivity of the assay we used varies from 53.1% at day 7 to 100% at day 17 postinfection.34 Variable viral load and differences in duration of viral shedding are other possible reasons for false-negative RT-PCR results.35,36
In our study, seroconversion among asymptomatic HCWs who were RT-PCR-positive was 20.8%. Among HCWs who reported an ILI and were RT-PCR-positive, seropositivity was 60%. In one study, 40% of asymptomatic and 13% of symptomatic patients who tested positive for COVID-19 became seronegative after initial seropositivity—that is, 8 weeks after hospital discharge.37
Serological testing offers insight into both the exposure history and residual COVID-19 susceptibility of HCWs. However, current immunological knowledge does not allow us to conclude that seropositivity conveys high-level immunity against reinfection. As the epidemic evolves, HCWs will continue to be exposed to COVID-19 in the community and the workplace. Serial cross-sectional serosurveys can help monitor the progression of the pandemic within the healthcare setting and guide hospital authorities in resource allocation.
Strengths and Limitations
We used the Abbott Architect SARS-CoV-2 IgG assay, which has exhibited a high level of consistency and performance characteristics when tested in different patient populations. The participation rate was acceptable compared to similar studies, and we included all the major hospitals in the District Srinagar. The findings from our study can therefore be considered representative of the HCWs in the district.
The study results should be interpreted in the context of the following limitations. First, information on risk factors for seropositivity were based on participant report. Also, we did not collect information on the timing of symptoms or the date on which a participant became RT-PCR-positive. Second, information regarding place of exposure (ie, community or hospital setting) was not recorded, limiting conclusions regarding the effect of workplace exposures. Third, given the voluntary nature of participation in the study, there is a possibility of selection bias that may have limited the generalizability of our findings. For example, some HCWs with a recent exposure to COVID-19 or those who were symptomatic at the time of the study might not have participated based on the absence of an individual benefit from IgG testing in the early phase of infection. Conversely, some HCWs who had symptoms in the distant past might have been more likely to have participated in the study. However, we believe that selection bias does not vitiate the validity of the associations based on the plausible assumption that infection risk should be similar between respondents and nonrespondents due to comparable work environments. Finally, with a cross-sectional study design, we cannot ascertain the reconversion from an initial positive-IgG to negative-IgG status, which warrants a cohort study.
CONCLUSION
We conclude that the seroprevalence of SARS-CoV-2 infection was low among HCWs of District Srinagar at the time of the study. Healthcare workers in a dedicated COVID hospital or HCWs who had ever worked in such a facility had lower seroprevalence, suggesting both adherence to and effectiveness of standard protective measures during contact with patients who had COVID-19. Nonetheless, the careful in-hospital behavior of the HCWs at the COVID hospitals may have had a spillover effect on their out-of-hospital behaviors, which lead to community-acquired infection. On the contrary, lack of testing of asymptomatic patients at non-COVID hospitals may have resulted in nosocomial transmission from asymptomatic carriers. We believe that our findings highlight the value of implementing infection prevention and control measures in the hospital setting. Moreover, training and retraining of sanitation and other housekeeping staff on standard hygienic practices and appropriate use of the protective gear may further help reduce their rates of exposure.
Acknowledgments
The authors thank Principal and Dean of the Government Medical College, Srinagar, Professor Samia Rashid, and District Commissioner, Srinagar, Shahid Iqbal Chowdhary for their support. We also acknowledge the support rendered by the Directorate of Health Services, Kashmir; Chief Medical Officer Srinagar; Block Medical Officers; and Zonal Medical Officers of District Srinagar, Kashmir, and extend our appreciation to the medical interns for their efforts in data collection, and to laboratory in-charge Gulzar Ahmad Wani, PhD scholar, Biochemistry, and his staff, who were involved in this study. Finally, we thank the study participants for their understanding of the importance of this study and for their time and participation.
Data availability statement
Data shall be made available on request through the corresponding author.
1. Ministry of Health & Family Welfare. Government of India. Accessed January 11, 2021. https://www.mohfw.gov.in/
2. COVID19 India. Accessed January 11, 2021. https://www.covid19india.org/
3. Government of Jammu & Kashmir. Department of Information & Public Relations. Bulletin on Novel Corona Virus (COVID-19). Accessed January 11, 2021. http://new.jkdirinf.in/NewsDescription.aspx?ID=66598
4. Black JRM, Bailey C, Przewrocka J, Dijkstra KK, Swanton C. COVID-19: the case for health-care worker screening to prevent hospital transmission. Lancet. 2020;395(10234):1418-1420. https://doi.org/10.1016/s0140-6736(20)30917-x
5. Nguyen LH, Drew DA, Graham MS, et al; Coronavirus Pandemic Epidemiology Consortium. Risk of COVID-19 among front-line health-care workers and the general community: a prospective cohort study. Lancet Public Heal. 2020;5(9):e475-e483. https://doi.org/10.1016/s2468-2667(20)30164-x
6. The Lancet. COVID-19: protecting health-care workers. Lancet. 2020;395(10228):922. https://doi.org/10.1016/s0140-6736(20)30644-9
7. Byambasuren O, Cardona M, Bell K, Clark J, McLaws M-L, Glasziou P. Estimating the extent of asymptomatic COVID-19 and its potential for community transmission: systematic review and meta-analysis. Off J Assoc Med Microbiol Infect Dis Canada. 2020;5(4):223-234. https://doi.org/10.3138/jammi-2020-0030
8. Rosenbaum L. Facing Covid-19 in Italy—ethics, logistics, and therapeutics on the epidemic’s front line. N Engl J Med. 2020;382(20):1873-1875. https://doi.org/10.1056/nejmp2005492
9. World Health Organization. The Unity Studies: WHO Sero-epidemiological Investigations Protocols. Accessed January 11, 2021. https://www.who.int/emergencies/diseases/novel-coronavirus-2019/technical-guidance/early-investigations
10. Pollán M, Pérez-Gómez B, Pastor-Barriuso R, et al; ENE-COVID Study Group. Prevalence of SARS-CoV-2 in Spain (ENE-COVID): a nationwide, population-based seroepidemiological study. Lancet. 2020;396(10250):535-544. https://doi.org/10.1016/s0140-6736(20)31483-5
11. Folgueira MD, Muñoz-Ruipérez C, Alonso-López MA, Delgado R. SARS-CoV-2 infection in health care workers in a large public hospital in Madrid, Spain, during March 2020. MedRxiv Web site. Published April 27, 2020. Accessed March 9, 2021. https://doi.org/10.1101/2020.04.07.20055723
12. Ministry of Health & Family Welfare, Directorate General of Health Services, EMR Division. Guidance document on appropriate management of suspect/confirmed cases of COVID-19. Accessed January 11, 2021. https://www.mohfw.gov.in/pdf/FinalGuidanceonMangaementofCovidcasesversion2.pdf
13. Ministry of Health &Family Welfare Government of India. National guidelines for infection prevention and control in healthcare facilities. Accessed January 11, 2021. https://main.mohfw.gov.in/sites/default/files/National%20Guidelines%20for%20IPC%20in%20HCF%20-%20final%281%29.pdf
14. Epicollect5. Accessed January 11, 2021. https://five.epicollect.net/
15. SARS-CoV-2 Immunoassay. Abbott Core Laboratory. Accessed January 11, 2021. https://www.corelaboratory.abbott/us/en/offerings/segments/infectious-disease/sars-cov-2
16. Bendavid E, Mulaney B, Sood N, et al. COVID-19 antibody seroprevalence in Santa Clara County, California. medRxiv. Published online April 30, 2020. Accessed March 9, 2021. https://doi.org/10.1101/2020.04.14.20062463
17. Korth J, Wilde B, Dolff S, et al. SARS-CoV-2-specific antibody detection in healthcare workers in Germany with direct contact to COVID-19 patients. J Clin Virol. 2020;128:104437. https://doi.org/10.1016/j.jcv.2020.104437
18. Steensels D, Oris E, Coninx L, et al. Hospital-wide SARS-CoV-2 antibody screening in 3056 staff in a tertiary center in Belgium. JAMA. 2020;324(2):195-197. https://doi.org/10.1001/jama.2020.11160
19. Behrens GMN, Cossmann A, Stankov M V., et al. Perceived versus proven SARS-CoV-2-specific immune responses in health-care professionals. Infection. 2020;48(4):631-634. https://doi.org/10.1007/s15010-020-01461-0
20. COVID-19 Kashmir Tracker. Accessed January 11, 2021. https://covidkashmir.org/statistics
21. World Health Organization. Rational use of personal protective equipment for coronavirus disease (COVID-19) and considerations during severe shortages. Published December 23, 2020. Accessed January 11, 2021. https://www.who.int/publications/i/item/rational-use-of-personal-protective-equipment-for-coronavirus-disease-(covid-19)-and-considerations-during-severe-shortages
22. Wilkins JT, Gray EL, Wallia A, et al. Seroprevalence and correlates of SARS-CoV-2 antibodies in health care workers in Chicago. Open Forum Infect Dis. 2020;8(1):ofaa582. https://doi.org/10.1093/ofid/ofaa582
23. Goenka M, Afzalpurkar S, Goenka U, et al. Seroprevalence of COVID-19 amongst health care workers in a tertiary care hospital of a metropolitan city from India. J Assoc Physicians India. 2020;68(11):14-19. https://doi.org/10.2139/ssrn.3689618
24. Mutambudzi M, Niedwiedz C, Macdonald EB, et al. Occupation and risk of severe COVID-19: prospective cohort study of 120 075 UK Biobank participants. Occup Environ Med. 2020;oemed-2020-106731. https://doi.org/10.1136/oemed-2020-106731
25. Ministry of Health & Family Welfare, Directorate General of Health Services, EMR Division. Advisory for managing health care workers working in COVID and Non-COVID areas of the hospital. Accessed January 12, 2021. https://cdnbbsr.s3waas.gov.in/s3850af92f8d9903e7a4e0559a98ecc857/uploads/2020/06/2020061949.pdf
26. Rhee C, Baker M, Vaidya V, et al; CDC Prevention Epicenters Program. Incidence of nosocomial COVID-19 in patients hospitalized at a large US academic medical center. JAMA Netw Open. 2020;3(9):e2020498. https://doi.org/10.1001/jamanetworkopen.2020.20498
27. Seidelman J, Lewis SS, Advani SD, et al. Universal masking is an effective strategy to flatten the severe acute respiratory coronavirus virus 2 (SARS-2-CoV)healthcare worker epidemiologic curve. Infect Control Hosp Epidemiol. 2020;41(12):1466-1467. https://doi.org/10.1017/ice.2020.313
28. Meyerowitz EA, Richterman A, Gandhi RT, Sax PE. Transmission of SARS-CoV-2: a review of viral, host, and environmental factors. Ann Intern Med. 2020;174(1):69-79. https://doi.org/10.7326/m20-5008
29. Mhango M, Dzobo M, Chitungo I, Dzinamarira T. COVID-19 risk factors among health workers: a rapid review. Saf Health Work. 2020;11(3):262-265. https://doi.org/10.1016/j.shaw.2020.06.001
30. European Centre for Disease Prevention and Control. Immune responses and immunity to SARS-CoV-2. Updated June 30, 2020. Accessed January 12, 2021. https://www.ecdc.europa.eu/en/covid-19/latest-evidence/immune-responses
31. Arevalo-Rodriguez I, Buitrago-Garcia D, Simancas-Racines D, et al. False-negative results of initial RT-PCR assays for COVID-19: a systematic review. PLoS One. 2020;15(12):e0242958. https://doi.org/10.1371/journal.pone.0242958
32. Ai T, Yang Z, Hou H, et al. Correlation of chest CT and RT-PCR testing for coronavirus disease 2019 (COVID-19) in China: a report of 1014 cases. Radiology. 2020;296(2):E32-E40. https://doi.org/10.1148/radiol.2020200642
33. Woloshin S, Patel N, Kesselheim AS. False negative tests for SARS-CoV-2 infection — challenges and implications. N Engl J Med. 2020;383(6):e38. https://doi.org/10.1056/nejmp2015897
34. Bryan A, Pepper G, Wener MH, et al. Performance characteristics of the Abbott Architect SARS-CoV-2 IgG assay and seroprevalence in Boise, Idaho. J Clin Microbiol. 2020;58(8):e00941. https://doi.org/10.1128/jcm.00941-20
35. Long Q-X, Liu B-Z, Deng H-J, et al. Antibody responses to SARS-CoV-2 in patients with COVID-19. Nat Med. 2020;26(6):845-848. https://doi.org/10.1038/s41591-020-0897-1
36. Tahamtan A, Ardebili A. Real-time RT-PCR in COVID-19 detection: issues affecting the results. Expert Rev Mol Diagn. 2020;20(5):453-454. https://doi.org/10.1080/14737159.2020.1757437
37. Long Q-X, Tang X-J, Shi Q-L, et al. Clinical and immunological assessment of asymptomatic SARS-CoV-2 infections. Nat Med. 2020;26(8):1200-1204. https://doi.org/10.1038/s41591-020-0965-6
India is emerging as one of the world’s largest hotspots for SARS-CoV-2 infection (COVID-19)—second only to the United States—with more than 13,000,000 documented infections since the first case was recorded on January 30, 2020.1,2 Kashmir, a northern territory of India, reported its first case of COVID-19 on March 18, 2020, from the central District Srinagar; this region has accounted for more cases of COVID-19 than any other district throughout the pandemic.3 The large majority of healthcare in District Srinagar is provided by three tertiary care institutions, one district hospital, two subdistrict hospitals, and 70 primary healthcare centers. Potential occupational exposures place healthcare workers (HCWs) at higher risk of acquiring SARS-CoV-2 infection, which in turn may serve as an important source of infection for their families and other community members.4-6 Given the high frequency and geographic variability of asymptomatic infection, growing evidence suggests this hidden reservoir is a source of infection for the general population.7,8
Many countries have started testing for antibodies against SARS-CoV-2, both at the population level and in specific groups, such as HCWs. Seroepidemiological studies are crucial to understanding the dynamics of SARS-CoV-2 infection. Many seroepidemiological studies have been conducted among community populations, but there are insufficient data on HCWs. The World Health Organization also encouraged its member states to conduct seroepidemiological studies to attain a better understanding of COVID-19 infection prevalence and distribution.9-11 Therefore, to quantify the prevalence of SARS-CoV-2 infection among HCWs, we conducted a seroepidemiological study by testing for SARS-CoV-2–specific immunoglobulin (IgG) to gain insight into the extent of infection among specific subgroups of HCWs and to identify risk-factor profiles associated with seropositivity.
METHODS
Study Design and Settings
We conducted this seroepidemiological study to ascertain the presence of IgG antibodies against SARS-CoV-2 among HCWs in the District Srinagar of Kashmir, India. The 2-week period of data collection began on June 15, 2020. As part of healthcare system pandemic preparedness efforts, India’s Ministry of Health provided specific guidelines for health facilities to manage COVID-19. Hospitals were categorized as dedicated COVID and non-COVID hospitals. Dedicated COVID hospitals provided comprehensive care exclusively to patients with COVID-19 and were equipped with fully functional intensive care units, ventilators, and beds with reliable access to oxygen support.12 In addition, infection prevention and control strategies to limit the transmission of SARS-CoV-2 infection were implemented according to guidelines specified by India’s National Center for Disease Control.13 To strengthen service provision, HCWs from other hospitals, including resident physicians, were relocated to these dedicated COVID hospitals. The additional staff were selected by administrative leadership, without input from HCWs.
Study Population and Data Collection
We approached administrative heads of the hospitals in District Srinagar for permission to conduct our study and to invite their HCWs to participate in the study. As Figure 1 shows, we were denied permission by the administrative heads of two tertiary care hospitals. Finally, with a point person serving as a study liaison at each institution, HCWs from three dedicated COVID and seven non-COVID tertiary care hospitals, two subdistrict hospitals, and six primary healthcare centers across the District Srinagar were invited to participate. The sample primary healthcare centers were each selected randomly, after stratification, from six major regions of the district. All frontline HCWs, including physicians, administrative and laboratory personnel, technicians, field workers involved in surveillance activity, and other supporting staff were eligible for the study.
We collected information on an interview form using Epicollect5, a free data-gathering tool widely used in health research.14 Physicians specifically trained in the use of Epicollect5 conducted the face-to-face interview on a prespecified day and recorded the collected information through mobile phones. This information included the participants’ role in providing care to patients with COVID-19 and risk factors for SARS-CoV-2 infection (eg, history of travel since January 1, 2020, symptoms of an influenza-like illness [ILI] in the 4 weeks prior to the interview, close contact with a COVID-19 case). We defined close contact as an unmasked exposure within 6 feet of an infected individual for at least 15 minutes, irrespective of location (ie, community or the hospital).
Following the interview, trained phlebotomists collected 3 to 5 mL of venous blood under aseptic conditions. We strictly adhered to standard operating procedures during collection, transportation, and testing of blood samples. Following collection, the blood samples remained undisturbed for at least 30 minutes before centrifugation, which was performed at the collection site (or at the central laboratory for sites lacking the capability). The samples were then transported for further processing and testing through a cold chain supply line, using vaccine carriers with conditioned icepacks. All testing procedures were conducted with strict adherence to the manufacturers’ guidelines.
Laboratory Procedure
In accordance with the manufacturer’s recommendations, we used a chemiluminescent microparticle immunoassay to detect SARS-CoV-2–specific IgG antibodies in serum samples. The assay is an automated two-step immunoassay for the qualitative detection of IgG antibodies against the nucleocapsid of SARS-CoV-2 in human serum and plasma. The sensitivity and specificity of this test are 100% and 99%, respectively. The test result was considered positive for SARS-CoV-2 IgG if the index value was ≥1.4, consistent with guidance provided by the manufacturer.15
The IgG values were also entered into Epicollect5. Two trained medical interns independently entered the laboratory results in two separate forms. A third medical intern reviewed these forms for discrepancies, in response to which they referenced the source data for adjudication. The information gathered during the interview and the laboratory results were linked with the help of a unique identification number, which was generated at the time of the interview.
Statistical Analysis
We estimated the proportion (and logit-transformed 95% CI) of HCWs with a positive SARS-CoV-2–specific IgG antibody level, the primary outcome of interest. We compared seroprevalence rates by gender, age group, specific occupational group, and type of health facility (dedicated COVID hospital vs non-COVID hospital). Seroprevalence was also
RESULTS
Of the 7,346 HCWs we were granted permission to approach, 2,915 (39.7%) agreed to participate in the study. The participation rate was 49% at the dedicated COVID hospitals (57% physicians and 47% nonphysicians) and 39% at the non-COVID hospitals (46% physicians and 36% nonphysicians). We analyzed information gathered from 2,905 HCWs (Epicollect5 interview forms were missing for nine participants, and the laboratory report was missing for one participant).
The mean age of the participants was 38.6 years, and 35.8% of participants identified as female (Table 1). One third (33.7%) of the participants were physicians, nearly half of whom were residents. In our sample, the overall seroprevalence of SARS-CoV-2–specific antibodies was 2.5% (95% CI, 2.0%-3.1%).
Of the 2,905 participating HCWs, 123 (4.2%) reported an ILI (ie, fever and cough) in the 4 weeks preceding the interview, and 339 (11.7%) reported close contact with a person with COVID-19 (Table 2). A total of 760 (26.2%) HCWs had undergone RT-PCR testing, 29 (3.8%) of whom had a positive result. Stratifying by workplace, history of nasopharyngeal RT-PCR positivity was reported by 4 of 77 (5.1%) participants from dedicated COVID hospitals compared to (3.7%) participants from the non-COVID hospital (P = .528).
As Table 2 also demonstrates, we found a significantly higher seropositivity rate among HCWs who had a history of ILI (P < .001), a history of positive RT-PCR (P < .001), history of ever being put under quarantine (P = .009), and a self-reported history of close contact with a person with COVID-19 (P = .014). Healthcare workers who had ever worked at a dedicated COVID hospital had a significantly lower seroprevalence of infection (P = .004).
Among HCWs who reported no ILI symptoms in the 4 weeks prior to the interview but who had positive RT-PCR test, 20.8% were seropositive. Of HCWs who reported both ILI and a positive RT-PCR test result, 60.0% were seropositive. Compared to employment at a non-COVID hospital, HCWs working in dedicated COVID hospitals had a reduced multivariate-adjusted risk of seropositivity (odds ratio, 0.21; 95% CI, 0.06-0.66).
DISCUSSION
We aimed to estimate the seroprevalence of SARS-CoV-2 infection in HCWs in different hospital settings in the District Srinagar of Kashmir, India. In general, seroprevalence was low (2.5%), with little difference across gender or occupational group.
Seroprevalence studies of HCWs across divergent workplace environments have revealed estimates ranging from 1% to 10.2%.16-19 Generally, the seroprevalence rates among HCWs are not significantly different from those of the general population, which reflects how different the dynamics of COVID-19 are compared to other infections in healthcare settings. The low seroprevalence observed in our study coincides with the overall low infection rate in the community population. During the study period, District Srinagar reported a median of 28 new infections daily (interquartile range, 17-46), which is indicative of the early phase of the pandemic in the population at the time of the study.20
Among the HCW occupational groups, ambulance drivers and housekeeping staff had the highest seroprevalence rates, followed by nurses and physicians. Possible explanations for higher seropositivity in these groups are improper use or inadequate supply of protective gear and lack of training on the use of personal protective equipment (PPE), resulting in increased exposure risk.21 Concordance of HCW and community infection rates in specific geographic areas suggests that community exposure may be the dominant source of healthcare exposure and infection. Additionally, careful in-hospital behavior of HCWs in dedicated COVID hospitals may have had a spillover effect on their out-of-hospital behavior, which may partially explain our finding that employment at dedicated COVID hospitals was associated with a markedly lower chance of seropositivity. A study of 6,510 HCWs in Chicago, Illinois, showed high seropositivity rates among support service workers, medical assistants, and nurses, with nurses identified as having a markedly higher adjusted odds of seropositivity relative to administrators. The authors of the study concluded that exposure in the community setting plays a crucial role in transmission among HCWs.22 Similarly, higher seroprevalence among housekeeping, nonadministrative staff, and other support service staff has been reported elsewhere.23 Certain underlying factors related to socioeconomic status and lifestyle may also contribute to higher seroprevalence in some occupational groups.24 Nonadherence to masking, social distancing, and proper hand hygiene outside the hospital setting could result in community-acquired infection.
Interestingly, participants who were working in a dedicated COVID hospital or who had ever worked at one had a seroprevalence of 0.6%, much lower than the 2.8% observed among other participants. This difference remained statistically significant after controlling for age, sex, place of work, and occupational group. As these facilities were dedicated to the management and care of patients with COVID-19, the hospital staff strictly adhered to safety precautions, with particular vigilance during patient contact. These hospitals also strictly adhered to infection prevention and control practices based on the latest guidelines released by India’s Ministry of Health and Family Welfare.13
A commitment was made to provide adequate PPE to the dedicated COVID hospitals and staff, commensurate with expected infected patient volumes and associated exposure risks. Healthcare workers were specifically trained on proper donning and doffing of PPE, self-health monitoring, and protocols for reporting symptoms and PPE breaches during patient encounters. Healthcare workers were regularly tested for COVID-19 using nasopharyngeal RT-PCR. Of critical importance, these hospitals implemented a buddy system wherein a team of two or more staff members was responsible for ensuring each other’s safety, proper PPE use, conformance to other protective measures, and reporting breaches of PPE compliance.25 Universal masking was mandatory for all hospital staff and patients at the COVID-focused facilities, with the additional use of N-95 masks, gloves, and face shields during times of patient contact. Administrative measures, including visitor restrictions and environmental sanitation, were rigorously enforced. Also, being a potentially high-risk area for transmission of infection, these facilities implemented staff-rationing to reduce the duration of exposure to the healthcare staff. Third, the HCWs of COVID-dedicated hospitals were provided with separate living accommodations during the period in which they were employed at a dedicated COVID hospital.
In contrast, in non-COVID hospitals, with the exception of HCWs, patients and the hospital visitors were not subject to a masking policy. Moreover, an adequate and timely supply of PPE was not prioritized at the non-COVID facilities due to resource constraints. Further, lack of testing of asymptomatic patients at non-COVID hospitals may have resulted in nosocomial transmission from asymptomatic carriers. Though routine infection prevention and control activities were performed at non-COVID hospitals, we did not assess adherence to infection prevention and control guidelines in the two different categories of hospitals. Our results are also supported by evidence from studies conducted in different hospital settings, the findings of which reiterate the importance of fundamental principles of prevention (eg, proper masking, hand hygiene, and distancing) and are of particular importance in resource-limited settings.17,26,27 The only published study quantifying seroprevalence among HCWs in India was performed in a single hospital setting with separate COVID and non-COVID units. The authors of that study reported a higher seroprevalence among HCWs in the COVID unit. However, this difference seems to be confounded by other factors as revealed by the multivariable analysis result.23
We found a two-fold higher seroprevalence (4.4%) in HCWs who reported close contact with a patient with COVID-19. Respiratory infections pose a greater health risk to HCWs in an occupational setting. Substantial evidence has emerged demonstrating that the respiratory system is the dominant route of SARS-CoV-2 transmission, with proximity and ventilation as key predictive factors.28 Globally, among thousands of HCWs infected with SARS-CoV-2, one of the leading risk factors identified was close contact with a patient with COVID-19; other identified risk factors were lack of PPE, poor infection prevention and control practices, work overload, and a preexisting health condition.29
The seroprevalence estimate among participants who reported an ILI in the 4 weeks preceding the interview was only 12.2%, suggesting an alternative etiology of these symptoms. Among those who reported a previously positive RT-PCR for SARS-CoV-2, only 27.6% showed the presence of SARS-CoV-2–specific IgG antibodies. The inability to mount an antibody-mediated immune response or early conversion to seronegative status during the convalescence phase has been suggested as an explanation for such discordant findings.30 On the contrary, seropositivity among participants who reported having a negative RT-PCR test was 1.9%. There are few plausible explanations for such observations. First, several studies have reported false-negative result rates from RT-PCR testing ranging from 2% to 29%.31-33 Second, the sensitivity of the SARS-CoV-2 assay is influenced by the timing of the test after the onset of symptoms or RT-PCR positivity. The sensitivity of the assay we used varies from 53.1% at day 7 to 100% at day 17 postinfection.34 Variable viral load and differences in duration of viral shedding are other possible reasons for false-negative RT-PCR results.35,36
In our study, seroconversion among asymptomatic HCWs who were RT-PCR-positive was 20.8%. Among HCWs who reported an ILI and were RT-PCR-positive, seropositivity was 60%. In one study, 40% of asymptomatic and 13% of symptomatic patients who tested positive for COVID-19 became seronegative after initial seropositivity—that is, 8 weeks after hospital discharge.37
Serological testing offers insight into both the exposure history and residual COVID-19 susceptibility of HCWs. However, current immunological knowledge does not allow us to conclude that seropositivity conveys high-level immunity against reinfection. As the epidemic evolves, HCWs will continue to be exposed to COVID-19 in the community and the workplace. Serial cross-sectional serosurveys can help monitor the progression of the pandemic within the healthcare setting and guide hospital authorities in resource allocation.
Strengths and Limitations
We used the Abbott Architect SARS-CoV-2 IgG assay, which has exhibited a high level of consistency and performance characteristics when tested in different patient populations. The participation rate was acceptable compared to similar studies, and we included all the major hospitals in the District Srinagar. The findings from our study can therefore be considered representative of the HCWs in the district.
The study results should be interpreted in the context of the following limitations. First, information on risk factors for seropositivity were based on participant report. Also, we did not collect information on the timing of symptoms or the date on which a participant became RT-PCR-positive. Second, information regarding place of exposure (ie, community or hospital setting) was not recorded, limiting conclusions regarding the effect of workplace exposures. Third, given the voluntary nature of participation in the study, there is a possibility of selection bias that may have limited the generalizability of our findings. For example, some HCWs with a recent exposure to COVID-19 or those who were symptomatic at the time of the study might not have participated based on the absence of an individual benefit from IgG testing in the early phase of infection. Conversely, some HCWs who had symptoms in the distant past might have been more likely to have participated in the study. However, we believe that selection bias does not vitiate the validity of the associations based on the plausible assumption that infection risk should be similar between respondents and nonrespondents due to comparable work environments. Finally, with a cross-sectional study design, we cannot ascertain the reconversion from an initial positive-IgG to negative-IgG status, which warrants a cohort study.
CONCLUSION
We conclude that the seroprevalence of SARS-CoV-2 infection was low among HCWs of District Srinagar at the time of the study. Healthcare workers in a dedicated COVID hospital or HCWs who had ever worked in such a facility had lower seroprevalence, suggesting both adherence to and effectiveness of standard protective measures during contact with patients who had COVID-19. Nonetheless, the careful in-hospital behavior of the HCWs at the COVID hospitals may have had a spillover effect on their out-of-hospital behaviors, which lead to community-acquired infection. On the contrary, lack of testing of asymptomatic patients at non-COVID hospitals may have resulted in nosocomial transmission from asymptomatic carriers. We believe that our findings highlight the value of implementing infection prevention and control measures in the hospital setting. Moreover, training and retraining of sanitation and other housekeeping staff on standard hygienic practices and appropriate use of the protective gear may further help reduce their rates of exposure.
Acknowledgments
The authors thank Principal and Dean of the Government Medical College, Srinagar, Professor Samia Rashid, and District Commissioner, Srinagar, Shahid Iqbal Chowdhary for their support. We also acknowledge the support rendered by the Directorate of Health Services, Kashmir; Chief Medical Officer Srinagar; Block Medical Officers; and Zonal Medical Officers of District Srinagar, Kashmir, and extend our appreciation to the medical interns for their efforts in data collection, and to laboratory in-charge Gulzar Ahmad Wani, PhD scholar, Biochemistry, and his staff, who were involved in this study. Finally, we thank the study participants for their understanding of the importance of this study and for their time and participation.
Data availability statement
Data shall be made available on request through the corresponding author.
1. Ministry of Health & Family Welfare. Government of India. Accessed January 11, 2021. https://www.mohfw.gov.in/
2. COVID19 India. Accessed January 11, 2021. https://www.covid19india.org/
3. Government of Jammu & Kashmir. Department of Information & Public Relations. Bulletin on Novel Corona Virus (COVID-19). Accessed January 11, 2021. http://new.jkdirinf.in/NewsDescription.aspx?ID=66598
4. Black JRM, Bailey C, Przewrocka J, Dijkstra KK, Swanton C. COVID-19: the case for health-care worker screening to prevent hospital transmission. Lancet. 2020;395(10234):1418-1420. https://doi.org/10.1016/s0140-6736(20)30917-x
5. Nguyen LH, Drew DA, Graham MS, et al; Coronavirus Pandemic Epidemiology Consortium. Risk of COVID-19 among front-line health-care workers and the general community: a prospective cohort study. Lancet Public Heal. 2020;5(9):e475-e483. https://doi.org/10.1016/s2468-2667(20)30164-x
6. The Lancet. COVID-19: protecting health-care workers. Lancet. 2020;395(10228):922. https://doi.org/10.1016/s0140-6736(20)30644-9
7. Byambasuren O, Cardona M, Bell K, Clark J, McLaws M-L, Glasziou P. Estimating the extent of asymptomatic COVID-19 and its potential for community transmission: systematic review and meta-analysis. Off J Assoc Med Microbiol Infect Dis Canada. 2020;5(4):223-234. https://doi.org/10.3138/jammi-2020-0030
8. Rosenbaum L. Facing Covid-19 in Italy—ethics, logistics, and therapeutics on the epidemic’s front line. N Engl J Med. 2020;382(20):1873-1875. https://doi.org/10.1056/nejmp2005492
9. World Health Organization. The Unity Studies: WHO Sero-epidemiological Investigations Protocols. Accessed January 11, 2021. https://www.who.int/emergencies/diseases/novel-coronavirus-2019/technical-guidance/early-investigations
10. Pollán M, Pérez-Gómez B, Pastor-Barriuso R, et al; ENE-COVID Study Group. Prevalence of SARS-CoV-2 in Spain (ENE-COVID): a nationwide, population-based seroepidemiological study. Lancet. 2020;396(10250):535-544. https://doi.org/10.1016/s0140-6736(20)31483-5
11. Folgueira MD, Muñoz-Ruipérez C, Alonso-López MA, Delgado R. SARS-CoV-2 infection in health care workers in a large public hospital in Madrid, Spain, during March 2020. MedRxiv Web site. Published April 27, 2020. Accessed March 9, 2021. https://doi.org/10.1101/2020.04.07.20055723
12. Ministry of Health & Family Welfare, Directorate General of Health Services, EMR Division. Guidance document on appropriate management of suspect/confirmed cases of COVID-19. Accessed January 11, 2021. https://www.mohfw.gov.in/pdf/FinalGuidanceonMangaementofCovidcasesversion2.pdf
13. Ministry of Health &Family Welfare Government of India. National guidelines for infection prevention and control in healthcare facilities. Accessed January 11, 2021. https://main.mohfw.gov.in/sites/default/files/National%20Guidelines%20for%20IPC%20in%20HCF%20-%20final%281%29.pdf
14. Epicollect5. Accessed January 11, 2021. https://five.epicollect.net/
15. SARS-CoV-2 Immunoassay. Abbott Core Laboratory. Accessed January 11, 2021. https://www.corelaboratory.abbott/us/en/offerings/segments/infectious-disease/sars-cov-2
16. Bendavid E, Mulaney B, Sood N, et al. COVID-19 antibody seroprevalence in Santa Clara County, California. medRxiv. Published online April 30, 2020. Accessed March 9, 2021. https://doi.org/10.1101/2020.04.14.20062463
17. Korth J, Wilde B, Dolff S, et al. SARS-CoV-2-specific antibody detection in healthcare workers in Germany with direct contact to COVID-19 patients. J Clin Virol. 2020;128:104437. https://doi.org/10.1016/j.jcv.2020.104437
18. Steensels D, Oris E, Coninx L, et al. Hospital-wide SARS-CoV-2 antibody screening in 3056 staff in a tertiary center in Belgium. JAMA. 2020;324(2):195-197. https://doi.org/10.1001/jama.2020.11160
19. Behrens GMN, Cossmann A, Stankov M V., et al. Perceived versus proven SARS-CoV-2-specific immune responses in health-care professionals. Infection. 2020;48(4):631-634. https://doi.org/10.1007/s15010-020-01461-0
20. COVID-19 Kashmir Tracker. Accessed January 11, 2021. https://covidkashmir.org/statistics
21. World Health Organization. Rational use of personal protective equipment for coronavirus disease (COVID-19) and considerations during severe shortages. Published December 23, 2020. Accessed January 11, 2021. https://www.who.int/publications/i/item/rational-use-of-personal-protective-equipment-for-coronavirus-disease-(covid-19)-and-considerations-during-severe-shortages
22. Wilkins JT, Gray EL, Wallia A, et al. Seroprevalence and correlates of SARS-CoV-2 antibodies in health care workers in Chicago. Open Forum Infect Dis. 2020;8(1):ofaa582. https://doi.org/10.1093/ofid/ofaa582
23. Goenka M, Afzalpurkar S, Goenka U, et al. Seroprevalence of COVID-19 amongst health care workers in a tertiary care hospital of a metropolitan city from India. J Assoc Physicians India. 2020;68(11):14-19. https://doi.org/10.2139/ssrn.3689618
24. Mutambudzi M, Niedwiedz C, Macdonald EB, et al. Occupation and risk of severe COVID-19: prospective cohort study of 120 075 UK Biobank participants. Occup Environ Med. 2020;oemed-2020-106731. https://doi.org/10.1136/oemed-2020-106731
25. Ministry of Health & Family Welfare, Directorate General of Health Services, EMR Division. Advisory for managing health care workers working in COVID and Non-COVID areas of the hospital. Accessed January 12, 2021. https://cdnbbsr.s3waas.gov.in/s3850af92f8d9903e7a4e0559a98ecc857/uploads/2020/06/2020061949.pdf
26. Rhee C, Baker M, Vaidya V, et al; CDC Prevention Epicenters Program. Incidence of nosocomial COVID-19 in patients hospitalized at a large US academic medical center. JAMA Netw Open. 2020;3(9):e2020498. https://doi.org/10.1001/jamanetworkopen.2020.20498
27. Seidelman J, Lewis SS, Advani SD, et al. Universal masking is an effective strategy to flatten the severe acute respiratory coronavirus virus 2 (SARS-2-CoV)healthcare worker epidemiologic curve. Infect Control Hosp Epidemiol. 2020;41(12):1466-1467. https://doi.org/10.1017/ice.2020.313
28. Meyerowitz EA, Richterman A, Gandhi RT, Sax PE. Transmission of SARS-CoV-2: a review of viral, host, and environmental factors. Ann Intern Med. 2020;174(1):69-79. https://doi.org/10.7326/m20-5008
29. Mhango M, Dzobo M, Chitungo I, Dzinamarira T. COVID-19 risk factors among health workers: a rapid review. Saf Health Work. 2020;11(3):262-265. https://doi.org/10.1016/j.shaw.2020.06.001
30. European Centre for Disease Prevention and Control. Immune responses and immunity to SARS-CoV-2. Updated June 30, 2020. Accessed January 12, 2021. https://www.ecdc.europa.eu/en/covid-19/latest-evidence/immune-responses
31. Arevalo-Rodriguez I, Buitrago-Garcia D, Simancas-Racines D, et al. False-negative results of initial RT-PCR assays for COVID-19: a systematic review. PLoS One. 2020;15(12):e0242958. https://doi.org/10.1371/journal.pone.0242958
32. Ai T, Yang Z, Hou H, et al. Correlation of chest CT and RT-PCR testing for coronavirus disease 2019 (COVID-19) in China: a report of 1014 cases. Radiology. 2020;296(2):E32-E40. https://doi.org/10.1148/radiol.2020200642
33. Woloshin S, Patel N, Kesselheim AS. False negative tests for SARS-CoV-2 infection — challenges and implications. N Engl J Med. 2020;383(6):e38. https://doi.org/10.1056/nejmp2015897
34. Bryan A, Pepper G, Wener MH, et al. Performance characteristics of the Abbott Architect SARS-CoV-2 IgG assay and seroprevalence in Boise, Idaho. J Clin Microbiol. 2020;58(8):e00941. https://doi.org/10.1128/jcm.00941-20
35. Long Q-X, Liu B-Z, Deng H-J, et al. Antibody responses to SARS-CoV-2 in patients with COVID-19. Nat Med. 2020;26(6):845-848. https://doi.org/10.1038/s41591-020-0897-1
36. Tahamtan A, Ardebili A. Real-time RT-PCR in COVID-19 detection: issues affecting the results. Expert Rev Mol Diagn. 2020;20(5):453-454. https://doi.org/10.1080/14737159.2020.1757437
37. Long Q-X, Tang X-J, Shi Q-L, et al. Clinical and immunological assessment of asymptomatic SARS-CoV-2 infections. Nat Med. 2020;26(8):1200-1204. https://doi.org/10.1038/s41591-020-0965-6
©2021 Society of Hospital Medicine
Decreasing Hospital Observation Time for Febrile Infants
Febrile infants aged 0 to 60 days often undergo diagnostic testing to evaluate for invasive bacterial infections (IBI; ie, bacteremia and meningitis) and are subsequently hospitalized pending culture results. Only 1% to 2% of infants 0 to 60 days old have an IBI,1-3 and most hospitalized infants are discharged once physicians feel confident that pathogens are unlikely to be isolated from blood and cerebrospinal fluid (CSF) cultures. Practice regarding duration of hospitalization while awaiting blood and CSF culture results is not standardized in this population. Longer hospitalizations can lead to increased costs and familial stress, including difficulty with breastfeeding and anxiety in newly postpartum mothers.4,5
In 2010, an institutional evidence-based guideline for the management of febrile infants aged 0 to 60 days recommended discharge after 36 hours of observation if all cultures were negative.6 However, recent studies demonstrate that 85% to 93% of pathogens in blood and CSF cultures grow within 24 hours of incubation.7-9 Assuming a 2% prevalence of IBI, if 15% of pathogens were identified after 24 hours of incubation, only one out of 333 infants would have an IBI identified after 24 hours of hospital observation.7
Furthermore, a review of our institution’s electronic health records (EHR) over the past 5 years revealed that an observation period of 24 hours would have resulted in the discharge of three infants with an IBI. Two infants had bacteremia; both were discharged from the emergency department (ED) without antibiotics, returned to care after cultures were reported positive at 27 hours, and had no adverse outcomes. The third infant had meningitis, but also had an abnormal CSF Gram stain, which led to a longer hospitalization.
In 2019, our institution appraised the emerging literature and institutional data supporting the low absolute risk of missed IBI, and also leveraged local consensus among key stakeholders to update its evidence-based guideline for the evaluation and management of febrile infants aged 60 days and younger. The updated guideline recommends that clinicians consider discharging well-appearing neonates and infants if blood and CSF cultures remain negative at 24 hours.10 The objective of this study was to decrease the average hospital culture observation time (COT; culture incubation to hospital discharge) from 38 to 30 hours over a 12-month period in febrile infants aged 0 to 60 days.
METHODS
Context
Improvement efforts were conducted at Cincinnati Children’s Hospital Medical Center (CCHMC), a large, urban, academic hospital that admitted more than 8,000 noncritically ill patients to the hospital medicine (HM) service from July 1, 2018, through June 30, 2019. Hospital medicine teams, located at both the main and satellite campuses, are staffed by attending physicians, fellows, residents, medical students, and nurse practitioners. The two campuses, which are about 20 miles apart, share clinician providers but have distinct nursing pools.
Microbiology services for all CCHMC patients are provided at the main campus. Blood and CSF cultures at the satellite campus are transported to the main campus for incubation and monitoring via an urgent courier service. The microbiology laboratory at CCHMC uses a continuous monitoring system for blood cultures (BACT/ALERT Virtuo, BioMérieux). The system automatically alerts laboratory technicians of positive cultures; these results are reported to clinical providers within 30 minutes of detection. Laboratory technicians manually evaluate CSF cultures once daily for 5 days.
Improvement Team
Our improvement team included three HM attending physicians; two HM fellows; a pediatric chief resident; two nurses, who represented nursing pools at the main and satellite campuses; and a clinical pharmacist, who is a co-leader of the antimicrobial stewardship program at CCHMC. Supporting members for the improvement team included the CCHMC laboratory director; the microbiology laboratory director; an infectious disease physician, who is a co-leader of the antimicrobial stewardship program; and nursing directors of the HM units at both campuses.
Evidence-Based Guideline
Our improvement initiative was based on recommendations from the updated CCHMC Evidence-Based Care Guideline for Management of Infants 0 to 60 days with Fever of Unknown Source.10 This guideline, published in May 2019, was developed by a multidisciplinary working group composed of key stakeholders from HM, community pediatrics, emergency medicine, the pediatric residency program, infectious disease, and laboratory medicine. Several improvement team members were participants on the committee that published the evidence-based guideline. The committee first performed a systematic literature review and critical appraisal of the literature. Care recommendations were formulated via a consensus process directed by best evidence, patient and family preferences, and clinical expertise; the recommendations were subsequently reviewed and approved by clinical experts who were not involved in the development process.
Based on evidence review and multistakeholder consensus, the updated guideline recommends clinicians consider discharging neonates and infants aged 60 days and younger if there is no culture growth after an observation period of 24 hours (as documented in the EHR) and patients are otherwise medically ready for discharge (ie, well appearing with adequate oral intake).10,11 In addition, prior to discharge, there must be a documented working phone number on file for the patient’s parents/guardians, an established outpatient follow-up plan within 24 hours, and communication with the primary pediatrician who is in agreement with discharge at 24 hours.
Study Population
Infants 0 to 60 days old who had a documented or reported fever without an apparent source based on history and physical exam upon presentation to the ED, and who were subsequently admitted to the HM service at CCHMC between October 30, 2018, and July 10, 2020, were eligible for inclusion. We excluded infants who were admitted to other clinical services (eg, intensive care unit); had organisms identified on blood, urine, or CSF culture within 24 hours of incubation; had positive herpes simplex virus testing; had skin/soft tissue infections or another clearly documented source of bacterial infection; or had an alternative indication for hospitalization (eg, need for intravenous fluid or deep suctioning) after cultures had incubated for 24 hours. Infants who had a positive blood, urine, or CSF culture result after 24 hours of incubation were included in the study population. Organisms were classified as pathogen or contaminant based on treatment decisions made by the care team.
Improvement Activities
Key drivers critical to success of the improvement efforts were: (1) clearly defined standard of care for duration of observation in febrile infants 0 to 60 days old; (2) improved understanding of microbiology lab procedures; (3) effective communication of discharge criteria between providers and nurses; and (4) transparency of data with feedback (Figure 1).
Education and Structured Dissemination of Evidence-Based Guideline
The CCHMC febrile infant guideline10 was disseminated to HM physicians, residents, and nurses via the following means: (1) in-person announcements at staff meetings and educational conferences, (2) published highlights from the guideline in weekly newsletters, and (3) email announcements. Additionally, members of the study team educated HM attending physicians, nursing staff from the medical units at both campuses, and resident physicians about recent studies demonstrating safety of shorter length of stay (LOS) in febrile infants aged 0 to 60 days. The study team also provided residents, physicians, and nurses with data on the number of positive blood and CSF cultures and outcomes of patients at CCHMC within the past 5 years. In addition, team members led a journal club for residents discussing an article7 describing time-to-positivity of blood and CSF cultures in febrile infants. For ongoing engagement, the evidence-based guideline and a detailed explanation of microbiology procedures were published in the resident handbook, an internal resource that includes vital clinical pearls and practice guidelines across specialties. (Each resident receives an updated hard copy each year, and there is also an online link to the resource in the EHR.) Information about the guideline and COT was also included in the monthly chief resident’s orientation script, which is relayed to all residents on the first day of their HM rotation.
Clear Communication of Microbiology Procedures
Team members created a detailed process map describing the processing protocols for blood and CSF cultures collected at both CCHMC campuses. This information was shared with HM attending physicians and nurses via in-person announcements at staff meetings, flyers in team workrooms, and email communications. Residents received information on microbiology protocols via in-person announcements at educational conferences and dissemination in the weekly residency newsletter.Important information communicated included:
1. Definition of culture start time. We conveyed that there may be a delay of up to 4 hours between culture collection at the satellite campus and culture incubation at the main campus laboratory. As a result, the time of blood or CSF sample arrival to the main campus laboratory was a more accurate reflection of the culture incubation start time than the culture collection time.
2. Explanation of CSF culture processing. We discussed the process by which these cultures are plated upon arrival at the microbiology laboratory and read once per day in the morning. Therefore, a culture incubated at midnight would be evaluated once at 9 hours and not again until 33 hours.
Modification of Febrile Infant Order Set
Enhancements to the febrile infant order set improved communication and cultivated a shared mental model regarding discharge goals among all members of the care team. The EHR order set for febrile infants was updated as follows: (1) mandatory free-text fields that established the culture start time for blood and CSF cultures were added, (2) culture start time was clearly defined (ie, the time culture arrives at the main campus laboratory), and (3) a change was made in the default discharge criteria11 to “culture observation for 24 hours,” with the ability to modify COT (Appendix Figure 1). We embedded hyperlinks to the guideline and microbiology process map within the updated order set, which allowed providers to easily access this information and refresh their knowledge of the recommendations (Appendix Figure 1).
Identification of Failures and Follow-up With Near-Time Feedback
All cases of febrile infants were tracked weekly. For infants hospitalized longer than 24 hours, the study team contacted the discharging clinicians to discuss reasons for prolonged hospitalization, with an emphasis on identifying system-level barriers to earlier discharge.
Study of the Interventions
The institutional microbiology database was queried weekly to identify all infants 0 to 60 days old who had a blood culture obtained and were hospitalized on the HM service. Study team members conducted targeted EHR review to determine whether patients met exclusion criteria and to identify reasons for prolonged COT. Baseline data were collected retrospectively for a 3-month period prior to initiation of improvement activities. During the study period, queries were conducted weekly and reviewed by study team members to evaluate the impact of improvement activities and to inform new interventions.
Measures
Our primary outcome measure was COT, defined as the hours between final culture incubation and hospital discharge. The operational definition for “final culture incubation” was the documented time of arrival of the last collected culture to the microbiology laboratory. Our goal COT was 30 hours to account for a subset of patients whose blood and/or CSF culture were obtained overnight (ie, after 9
Analysis
Measures were evaluated using statistical process control charts and run charts, and Western Electric rules were employed to determine special cause variation.12 Annotated X-bar S control charts tracked the impact of improvement activities on average COT and LOS for all infants. Given that a relatively small number of patients (ie, two to four) met inclusion criteria each week, average COT was calculated per five patients.
This study was considered exempt from review by the CCHMC Institutional Review Board.
RESULTS
Of the 184 infants in this study, 46 were included as part of baseline data collection, and 138 were included during the intervention period. The median age was 26.6 days (range, 3-59 days); 52% of patients were female; two-thirds were non-Hispanic White; 22% were Black, and 5% were Hispanic (Appendix Table).
Average COT decreased from 38 hours to 32 hours with improvement activities (Figure 2) and was sustained for a total of 17 months. There were small decreases in COT after initial education was provided to attendings, nurses, and residents. 

After the launch of the updated order set, median usage of the EHR order set increased from 50% to 80%. Medical discharge criteria were entered for 80 (96%) of the 83 patients for whom the updated order set was applied; culture incubation start times were entered for 78 (94%) of these patients.
No infants in our cohort were found to have IBI after hospital discharge. There were no ED revisits within 48 hours of discharge, and there were no hospital readmissions within 7 days of index discharge. Furthermore, none of the patients included in the study had growth of a pathogenic organism after 24 hours.
Of the 138 infants hospitalized during the intervention period, 77 (56%) had a COT greater than 30 hours. Among these 77 patients, 49 (64%) had their final culture incubated between 9
DISCUSSION
Our study aimed to decrease the average COT from 38 hours to 30 hours among hospitalized infants aged 60 days and younger over a period of 12 months. An intervention featuring implementation of an evidence-based guideline through education, laboratory procedure transparency, creation of a standardized EHR order set, and near-time feedback was associated with a shorter average COT of 32 hours, sustained over a 17-month period. No infants with bacteremia or meningitis were inappropriately discharged during this study.
Interpretation
Prior to our improvement efforts, most febrile infants at CCHMC were observed for at least 36 hours based on a prior institutional guideline,6 despite recent evidence suggesting that most pathogens in blood and CSF cultures grow within 24 hours of incubation.7-9 The goal of this improvement initiative was to bridge the gap between emerging evidence and clinical practice by developing and disseminating an updated evidence-based guideline to safely decrease the hospital observation time in febrile infants aged 60 days and younger.
Similar to previous studies aimed at improving diagnosis and management among febrile infants,13-16 generation and structured dissemination of an institutional evidence-based guideline was crucial to safely shortening COT in our population. These prior studies established a goal COT of 36 to 42 hours for hospitalized febrile infants.13,15,16 Our study incorporated emerging evidence and local experience into an updated evidence-based practice guideline to further reduce COT to 32 hours for hospitalized infants. Key factors contributing to our success included multidisciplinary engagement, specifically partnering with nurses and resident physicians in designing and implementing our initiatives. Furthermore, improved transparency of culture monitoring practices allowed clinicians to better understand the recommended observation periods. Finally, we employed a standardized EHR order set as a no-cost, one-time, high-reliability intervention to establish 24 hours of culture monitoring as the default and to enhance transparency around start time for culture incubation.
Average COT remained stable at 32 hours for 17 months after initiation of the intervention. During the intervention period, 64% patients with hospital stays longer than 30 hours had cultures obtained between 9
Limitations
The study has several limitations. First, this single-center study was conducted at a quaternary care medical center with a robust quality improvement infrastructure. Our interventions took advantage of the existing processes in place that ensure timely discharge of medically ready patients.11 Furthermore, microbiology laboratory practices are unique to our institution. These factors limit the generalizability of this work. Second, due to small numbers of eligible infants, analyses were conducted per five patients. Infrequent hospitalizations limited our ability to learn quickly from PDSA cycles. Finally, we did not measure cost savings attributable to shorter hospital stays. However, in addition to financial savings from charges and decreased nonmedical costs such as lost earnings and childcare,17 shorter hospitalizations have many additional benefits, such as promoting bonding and breastfeeding and decreasing exposure to nosocomial infections. Shorter hospitalizations, with clearly communicated discharge times, also serve to optimize patient throughput.
CONCLUSION
Implementation of a clinical practice guideline resulted in reduction of average COT from 38 to 32 hours in febrile infants aged 60 days and younger, with no cases of missed IBI. Engagement of multidisciplinary stakeholders in the generation and structured dissemination of the evidence-based guideline, improved transparency of the microbiological blood and CSF culture process, and standardization of EHR order sets were crucial to the success of this work. Cultures incubated overnight and daily CSF culture-monitoring practices primarily contributed to an average LOS of more than 30 hours.
Future work will include collaboration with emergency physicians to improve evaluation efficiency and decrease LOS in the ED for febrile infants. Additionally, creation of an automated data dashboard of COT and LOS will provide clinicians with real-time feedback on hospitalization practices.
Acknowledgments
The authors thank Dr Jeffrey Simmons, MD, MSc, as well as the members of the 2019 Fever of Uncertain Source Evidence-Based Guideline Committee. We also thank the James M Anderson Center for Health System Excellence and the Rapid Cycle Improvement Collaborative for their support with guideline development as well as design and execution of our improvement efforts.
1. Cruz AT, Mahajan P, Bonsu BK, et al. Accuracy of complete blood cell counts to identify febrile infants 60 days or younger with invasive bacterial infections. JAMA Pediatr. 2017;171(11):e172927. https://doi.org/10.1001/jamapediatrics.2017.2927
2. Kuppermann N, Dayan PS, Levine DA, et al; Febrile Infant Working Group of the Pediatric Emergency Care Applied Research Network (PECARN). A clinical prediction rule to identify febrile infants 60 days and younger at low risk for serious bacterial infections. JAMA Pediatr. 2019;173(4):342-351. https://doi.org/10.1001/jamapediatrics.2018.5501
3. Nigrovic LE, Mahajan PV, Blumberg SM, et al; Febrile Infant Working Group of the Pediatric Emergency Care Applied Research Network (PECARN). The Yale Observation Scale Score and the risk of serious bacterial infections in febrile infants. Pediatrics. 2017;140(1):e20170695. https://doi.org/10.1542/peds.2017-0695
4. De S, Tong A, Isaacs D, Craig JC. Parental perspectives on evaluation and management of fever in young infants: an interview study. Arch Dis Child. 2014;99(8):717-723. https://doi.org/10.1136/archdischild-2013-305736
5. Paxton RD, Byington CL. An examination of the unintended consequences of the rule-out sepsis evaluation: a parental perspective. Clin Pediatr (Phila). 2001;40(2):71-77. https://doi.org/10.1177/000992280104000202
6. FUS Team. Cincinnati Children’s Hospital Medical Center. Evidence-based clinical care guideline for fever of uncertain source in infants 60 days of age or less. Guideline 2. 2010:1-4.
7. Aronson PL, Wang ME, Nigrovic LE, et al; Febrile Young Infant Research Collaborative. Time to pathogen detection for non-ill versus ill-appearing infants ≤60 days old with bacteremia and meningitis. Hosp Pediatr. 2018;8(7):379-384. https://doi.org/10.1542/hpeds.2018-0002
8. Biondi EA, Mischler M, Jerardi KE, et al; Pediatric Research in Inpatient Settings (PRIS) Network. Blood culture time to positivity in febrile infants with bacteremia. JAMA Pediatr. 2014;168(9):844-849. https://doi.org/10.1001/jamapediatrics.2014.895
9. Lefebvre CE, Renaud C, Chartrand C. Time to positivity of blood cultures in infants 0 to 90 days old presenting to the emergency department: is 36 hours enough? J Pediatric Infect Dis Soc. 2017;6(1):28-32. https://doi.org/10.1093/jpids/piv078
10. Unaka N, Statile A, Bensman, R, et al. Cincinnati Children’s Hospital Medical Center. Evidence-based clinical care guideline for evidence-based care guideline for management of infants 0 to 60 days seen in emergency department for fever of unknown source. Guideline 10. 2019;1-42. http://www.cincinnatichildrens.org/service/j/anderson-center/evidence-based-care/recommendations/default/
11. White CM, Statile AM, White DL, et al. Using quality improvement to optimise paediatric discharge efficiency. BMJ Qual Saf. 2014;23(5):428-436. https://doi.org/10.1136/bmjqs-2013-002556
12. Benneyan JC, Lloyd RC, Plsek PE. Statistical process control as a tool for research and healthcare improvement. Qual Saf Health Care. 2003;12(6):458-464. https://doi.org/10.1136/qhc.12.6.458
13. Biondi EA, McCulloh R, Staggs VS, et al; American Academy of Pediatrics’ Revise Collaborative. Reducing variability in the infant sepsis evaluation (REVISE): a national quality initiative. Pediatrics. 2019;144(3): e20182201. https://doi.org/10.1542/peds.2018-2201
14. McCulloh RJ, Commers T, Williams DD, Michael J, Mann K, Newland JG. Effect of combined clinical practice guideline and electronic order set implementation on febrile infant evaluation and management. Pediatr Emerg Care. 2021;37(1):e25-e31. https://doi.org/10.1097/pec.0000000000002012
15. Foster LZ, Beiner J, Duh-Leong C, et al. Implementation of febrile infant management guidelines reduces hospitalization. Pediatr Qual Saf. 2020;5(1):e252. https://doi.org/10.1097/pq9.0000000000000252
16. Byington CL, Reynolds CC, Korgenski K, et al. Costs and infant outcomes after implementation of a care process model for febrile infants. Pediatrics. 2012;130(1):e16-e24. https://doi.org/10.1542/peds.2012-0127
17. Chang LV, Shah AN, Hoefgen ER, et al; H2O Study Group. Lost earnings and nonmedical expenses of pediatric hospitalizations. Pediatrics. 2018;142(3):e20180195. https://doi.org/10.1542/peds.2018-0195
Febrile infants aged 0 to 60 days often undergo diagnostic testing to evaluate for invasive bacterial infections (IBI; ie, bacteremia and meningitis) and are subsequently hospitalized pending culture results. Only 1% to 2% of infants 0 to 60 days old have an IBI,1-3 and most hospitalized infants are discharged once physicians feel confident that pathogens are unlikely to be isolated from blood and cerebrospinal fluid (CSF) cultures. Practice regarding duration of hospitalization while awaiting blood and CSF culture results is not standardized in this population. Longer hospitalizations can lead to increased costs and familial stress, including difficulty with breastfeeding and anxiety in newly postpartum mothers.4,5
In 2010, an institutional evidence-based guideline for the management of febrile infants aged 0 to 60 days recommended discharge after 36 hours of observation if all cultures were negative.6 However, recent studies demonstrate that 85% to 93% of pathogens in blood and CSF cultures grow within 24 hours of incubation.7-9 Assuming a 2% prevalence of IBI, if 15% of pathogens were identified after 24 hours of incubation, only one out of 333 infants would have an IBI identified after 24 hours of hospital observation.7
Furthermore, a review of our institution’s electronic health records (EHR) over the past 5 years revealed that an observation period of 24 hours would have resulted in the discharge of three infants with an IBI. Two infants had bacteremia; both were discharged from the emergency department (ED) without antibiotics, returned to care after cultures were reported positive at 27 hours, and had no adverse outcomes. The third infant had meningitis, but also had an abnormal CSF Gram stain, which led to a longer hospitalization.
In 2019, our institution appraised the emerging literature and institutional data supporting the low absolute risk of missed IBI, and also leveraged local consensus among key stakeholders to update its evidence-based guideline for the evaluation and management of febrile infants aged 60 days and younger. The updated guideline recommends that clinicians consider discharging well-appearing neonates and infants if blood and CSF cultures remain negative at 24 hours.10 The objective of this study was to decrease the average hospital culture observation time (COT; culture incubation to hospital discharge) from 38 to 30 hours over a 12-month period in febrile infants aged 0 to 60 days.
METHODS
Context
Improvement efforts were conducted at Cincinnati Children’s Hospital Medical Center (CCHMC), a large, urban, academic hospital that admitted more than 8,000 noncritically ill patients to the hospital medicine (HM) service from July 1, 2018, through June 30, 2019. Hospital medicine teams, located at both the main and satellite campuses, are staffed by attending physicians, fellows, residents, medical students, and nurse practitioners. The two campuses, which are about 20 miles apart, share clinician providers but have distinct nursing pools.
Microbiology services for all CCHMC patients are provided at the main campus. Blood and CSF cultures at the satellite campus are transported to the main campus for incubation and monitoring via an urgent courier service. The microbiology laboratory at CCHMC uses a continuous monitoring system for blood cultures (BACT/ALERT Virtuo, BioMérieux). The system automatically alerts laboratory technicians of positive cultures; these results are reported to clinical providers within 30 minutes of detection. Laboratory technicians manually evaluate CSF cultures once daily for 5 days.
Improvement Team
Our improvement team included three HM attending physicians; two HM fellows; a pediatric chief resident; two nurses, who represented nursing pools at the main and satellite campuses; and a clinical pharmacist, who is a co-leader of the antimicrobial stewardship program at CCHMC. Supporting members for the improvement team included the CCHMC laboratory director; the microbiology laboratory director; an infectious disease physician, who is a co-leader of the antimicrobial stewardship program; and nursing directors of the HM units at both campuses.
Evidence-Based Guideline
Our improvement initiative was based on recommendations from the updated CCHMC Evidence-Based Care Guideline for Management of Infants 0 to 60 days with Fever of Unknown Source.10 This guideline, published in May 2019, was developed by a multidisciplinary working group composed of key stakeholders from HM, community pediatrics, emergency medicine, the pediatric residency program, infectious disease, and laboratory medicine. Several improvement team members were participants on the committee that published the evidence-based guideline. The committee first performed a systematic literature review and critical appraisal of the literature. Care recommendations were formulated via a consensus process directed by best evidence, patient and family preferences, and clinical expertise; the recommendations were subsequently reviewed and approved by clinical experts who were not involved in the development process.
Based on evidence review and multistakeholder consensus, the updated guideline recommends clinicians consider discharging neonates and infants aged 60 days and younger if there is no culture growth after an observation period of 24 hours (as documented in the EHR) and patients are otherwise medically ready for discharge (ie, well appearing with adequate oral intake).10,11 In addition, prior to discharge, there must be a documented working phone number on file for the patient’s parents/guardians, an established outpatient follow-up plan within 24 hours, and communication with the primary pediatrician who is in agreement with discharge at 24 hours.
Study Population
Infants 0 to 60 days old who had a documented or reported fever without an apparent source based on history and physical exam upon presentation to the ED, and who were subsequently admitted to the HM service at CCHMC between October 30, 2018, and July 10, 2020, were eligible for inclusion. We excluded infants who were admitted to other clinical services (eg, intensive care unit); had organisms identified on blood, urine, or CSF culture within 24 hours of incubation; had positive herpes simplex virus testing; had skin/soft tissue infections or another clearly documented source of bacterial infection; or had an alternative indication for hospitalization (eg, need for intravenous fluid or deep suctioning) after cultures had incubated for 24 hours. Infants who had a positive blood, urine, or CSF culture result after 24 hours of incubation were included in the study population. Organisms were classified as pathogen or contaminant based on treatment decisions made by the care team.
Improvement Activities
Key drivers critical to success of the improvement efforts were: (1) clearly defined standard of care for duration of observation in febrile infants 0 to 60 days old; (2) improved understanding of microbiology lab procedures; (3) effective communication of discharge criteria between providers and nurses; and (4) transparency of data with feedback (Figure 1).
Education and Structured Dissemination of Evidence-Based Guideline
The CCHMC febrile infant guideline10 was disseminated to HM physicians, residents, and nurses via the following means: (1) in-person announcements at staff meetings and educational conferences, (2) published highlights from the guideline in weekly newsletters, and (3) email announcements. Additionally, members of the study team educated HM attending physicians, nursing staff from the medical units at both campuses, and resident physicians about recent studies demonstrating safety of shorter length of stay (LOS) in febrile infants aged 0 to 60 days. The study team also provided residents, physicians, and nurses with data on the number of positive blood and CSF cultures and outcomes of patients at CCHMC within the past 5 years. In addition, team members led a journal club for residents discussing an article7 describing time-to-positivity of blood and CSF cultures in febrile infants. For ongoing engagement, the evidence-based guideline and a detailed explanation of microbiology procedures were published in the resident handbook, an internal resource that includes vital clinical pearls and practice guidelines across specialties. (Each resident receives an updated hard copy each year, and there is also an online link to the resource in the EHR.) Information about the guideline and COT was also included in the monthly chief resident’s orientation script, which is relayed to all residents on the first day of their HM rotation.
Clear Communication of Microbiology Procedures
Team members created a detailed process map describing the processing protocols for blood and CSF cultures collected at both CCHMC campuses. This information was shared with HM attending physicians and nurses via in-person announcements at staff meetings, flyers in team workrooms, and email communications. Residents received information on microbiology protocols via in-person announcements at educational conferences and dissemination in the weekly residency newsletter.Important information communicated included:
1. Definition of culture start time. We conveyed that there may be a delay of up to 4 hours between culture collection at the satellite campus and culture incubation at the main campus laboratory. As a result, the time of blood or CSF sample arrival to the main campus laboratory was a more accurate reflection of the culture incubation start time than the culture collection time.
2. Explanation of CSF culture processing. We discussed the process by which these cultures are plated upon arrival at the microbiology laboratory and read once per day in the morning. Therefore, a culture incubated at midnight would be evaluated once at 9 hours and not again until 33 hours.
Modification of Febrile Infant Order Set
Enhancements to the febrile infant order set improved communication and cultivated a shared mental model regarding discharge goals among all members of the care team. The EHR order set for febrile infants was updated as follows: (1) mandatory free-text fields that established the culture start time for blood and CSF cultures were added, (2) culture start time was clearly defined (ie, the time culture arrives at the main campus laboratory), and (3) a change was made in the default discharge criteria11 to “culture observation for 24 hours,” with the ability to modify COT (Appendix Figure 1). We embedded hyperlinks to the guideline and microbiology process map within the updated order set, which allowed providers to easily access this information and refresh their knowledge of the recommendations (Appendix Figure 1).
Identification of Failures and Follow-up With Near-Time Feedback
All cases of febrile infants were tracked weekly. For infants hospitalized longer than 24 hours, the study team contacted the discharging clinicians to discuss reasons for prolonged hospitalization, with an emphasis on identifying system-level barriers to earlier discharge.
Study of the Interventions
The institutional microbiology database was queried weekly to identify all infants 0 to 60 days old who had a blood culture obtained and were hospitalized on the HM service. Study team members conducted targeted EHR review to determine whether patients met exclusion criteria and to identify reasons for prolonged COT. Baseline data were collected retrospectively for a 3-month period prior to initiation of improvement activities. During the study period, queries were conducted weekly and reviewed by study team members to evaluate the impact of improvement activities and to inform new interventions.
Measures
Our primary outcome measure was COT, defined as the hours between final culture incubation and hospital discharge. The operational definition for “final culture incubation” was the documented time of arrival of the last collected culture to the microbiology laboratory. Our goal COT was 30 hours to account for a subset of patients whose blood and/or CSF culture were obtained overnight (ie, after 9
Analysis
Measures were evaluated using statistical process control charts and run charts, and Western Electric rules were employed to determine special cause variation.12 Annotated X-bar S control charts tracked the impact of improvement activities on average COT and LOS for all infants. Given that a relatively small number of patients (ie, two to four) met inclusion criteria each week, average COT was calculated per five patients.
This study was considered exempt from review by the CCHMC Institutional Review Board.
RESULTS
Of the 184 infants in this study, 46 were included as part of baseline data collection, and 138 were included during the intervention period. The median age was 26.6 days (range, 3-59 days); 52% of patients were female; two-thirds were non-Hispanic White; 22% were Black, and 5% were Hispanic (Appendix Table).
Average COT decreased from 38 hours to 32 hours with improvement activities (Figure 2) and was sustained for a total of 17 months. There were small decreases in COT after initial education was provided to attendings, nurses, and residents.
After the launch of the updated order set, median usage of the EHR order set increased from 50% to 80%. Medical discharge criteria were entered for 80 (96%) of the 83 patients for whom the updated order set was applied; culture incubation start times were entered for 78 (94%) of these patients.
No infants in our cohort were found to have IBI after hospital discharge. There were no ED revisits within 48 hours of discharge, and there were no hospital readmissions within 7 days of index discharge. Furthermore, none of the patients included in the study had growth of a pathogenic organism after 24 hours.
Of the 138 infants hospitalized during the intervention period, 77 (56%) had a COT greater than 30 hours. Among these 77 patients, 49 (64%) had their final culture incubated between 9
DISCUSSION
Our study aimed to decrease the average COT from 38 hours to 30 hours among hospitalized infants aged 60 days and younger over a period of 12 months. An intervention featuring implementation of an evidence-based guideline through education, laboratory procedure transparency, creation of a standardized EHR order set, and near-time feedback was associated with a shorter average COT of 32 hours, sustained over a 17-month period. No infants with bacteremia or meningitis were inappropriately discharged during this study.
Interpretation
Prior to our improvement efforts, most febrile infants at CCHMC were observed for at least 36 hours based on a prior institutional guideline,6 despite recent evidence suggesting that most pathogens in blood and CSF cultures grow within 24 hours of incubation.7-9 The goal of this improvement initiative was to bridge the gap between emerging evidence and clinical practice by developing and disseminating an updated evidence-based guideline to safely decrease the hospital observation time in febrile infants aged 60 days and younger.
Similar to previous studies aimed at improving diagnosis and management among febrile infants,13-16 generation and structured dissemination of an institutional evidence-based guideline was crucial to safely shortening COT in our population. These prior studies established a goal COT of 36 to 42 hours for hospitalized febrile infants.13,15,16 Our study incorporated emerging evidence and local experience into an updated evidence-based practice guideline to further reduce COT to 32 hours for hospitalized infants. Key factors contributing to our success included multidisciplinary engagement, specifically partnering with nurses and resident physicians in designing and implementing our initiatives. Furthermore, improved transparency of culture monitoring practices allowed clinicians to better understand the recommended observation periods. Finally, we employed a standardized EHR order set as a no-cost, one-time, high-reliability intervention to establish 24 hours of culture monitoring as the default and to enhance transparency around start time for culture incubation.
Average COT remained stable at 32 hours for 17 months after initiation of the intervention. During the intervention period, 64% patients with hospital stays longer than 30 hours had cultures obtained between 9
Limitations
The study has several limitations. First, this single-center study was conducted at a quaternary care medical center with a robust quality improvement infrastructure. Our interventions took advantage of the existing processes in place that ensure timely discharge of medically ready patients.11 Furthermore, microbiology laboratory practices are unique to our institution. These factors limit the generalizability of this work. Second, due to small numbers of eligible infants, analyses were conducted per five patients. Infrequent hospitalizations limited our ability to learn quickly from PDSA cycles. Finally, we did not measure cost savings attributable to shorter hospital stays. However, in addition to financial savings from charges and decreased nonmedical costs such as lost earnings and childcare,17 shorter hospitalizations have many additional benefits, such as promoting bonding and breastfeeding and decreasing exposure to nosocomial infections. Shorter hospitalizations, with clearly communicated discharge times, also serve to optimize patient throughput.
CONCLUSION
Implementation of a clinical practice guideline resulted in reduction of average COT from 38 to 32 hours in febrile infants aged 60 days and younger, with no cases of missed IBI. Engagement of multidisciplinary stakeholders in the generation and structured dissemination of the evidence-based guideline, improved transparency of the microbiological blood and CSF culture process, and standardization of EHR order sets were crucial to the success of this work. Cultures incubated overnight and daily CSF culture-monitoring practices primarily contributed to an average LOS of more than 30 hours.
Future work will include collaboration with emergency physicians to improve evaluation efficiency and decrease LOS in the ED for febrile infants. Additionally, creation of an automated data dashboard of COT and LOS will provide clinicians with real-time feedback on hospitalization practices.
Acknowledgments
The authors thank Dr Jeffrey Simmons, MD, MSc, as well as the members of the 2019 Fever of Uncertain Source Evidence-Based Guideline Committee. We also thank the James M Anderson Center for Health System Excellence and the Rapid Cycle Improvement Collaborative for their support with guideline development as well as design and execution of our improvement efforts.
1. Cruz AT, Mahajan P, Bonsu BK, et al. Accuracy of complete blood cell counts to identify febrile infants 60 days or younger with invasive bacterial infections. JAMA Pediatr. 2017;171(11):e172927. https://doi.org/10.1001/jamapediatrics.2017.2927
2. Kuppermann N, Dayan PS, Levine DA, et al; Febrile Infant Working Group of the Pediatric Emergency Care Applied Research Network (PECARN). A clinical prediction rule to identify febrile infants 60 days and younger at low risk for serious bacterial infections. JAMA Pediatr. 2019;173(4):342-351. https://doi.org/10.1001/jamapediatrics.2018.5501
3. Nigrovic LE, Mahajan PV, Blumberg SM, et al; Febrile Infant Working Group of the Pediatric Emergency Care Applied Research Network (PECARN). The Yale Observation Scale Score and the risk of serious bacterial infections in febrile infants. Pediatrics. 2017;140(1):e20170695. https://doi.org/10.1542/peds.2017-0695
4. De S, Tong A, Isaacs D, Craig JC. Parental perspectives on evaluation and management of fever in young infants: an interview study. Arch Dis Child. 2014;99(8):717-723. https://doi.org/10.1136/archdischild-2013-305736
5. Paxton RD, Byington CL. An examination of the unintended consequences of the rule-out sepsis evaluation: a parental perspective. Clin Pediatr (Phila). 2001;40(2):71-77. https://doi.org/10.1177/000992280104000202
6. FUS Team. Cincinnati Children’s Hospital Medical Center. Evidence-based clinical care guideline for fever of uncertain source in infants 60 days of age or less. Guideline 2. 2010:1-4.
7. Aronson PL, Wang ME, Nigrovic LE, et al; Febrile Young Infant Research Collaborative. Time to pathogen detection for non-ill versus ill-appearing infants ≤60 days old with bacteremia and meningitis. Hosp Pediatr. 2018;8(7):379-384. https://doi.org/10.1542/hpeds.2018-0002
8. Biondi EA, Mischler M, Jerardi KE, et al; Pediatric Research in Inpatient Settings (PRIS) Network. Blood culture time to positivity in febrile infants with bacteremia. JAMA Pediatr. 2014;168(9):844-849. https://doi.org/10.1001/jamapediatrics.2014.895
9. Lefebvre CE, Renaud C, Chartrand C. Time to positivity of blood cultures in infants 0 to 90 days old presenting to the emergency department: is 36 hours enough? J Pediatric Infect Dis Soc. 2017;6(1):28-32. https://doi.org/10.1093/jpids/piv078
10. Unaka N, Statile A, Bensman, R, et al. Cincinnati Children’s Hospital Medical Center. Evidence-based clinical care guideline for evidence-based care guideline for management of infants 0 to 60 days seen in emergency department for fever of unknown source. Guideline 10. 2019;1-42. http://www.cincinnatichildrens.org/service/j/anderson-center/evidence-based-care/recommendations/default/
11. White CM, Statile AM, White DL, et al. Using quality improvement to optimise paediatric discharge efficiency. BMJ Qual Saf. 2014;23(5):428-436. https://doi.org/10.1136/bmjqs-2013-002556
12. Benneyan JC, Lloyd RC, Plsek PE. Statistical process control as a tool for research and healthcare improvement. Qual Saf Health Care. 2003;12(6):458-464. https://doi.org/10.1136/qhc.12.6.458
13. Biondi EA, McCulloh R, Staggs VS, et al; American Academy of Pediatrics’ Revise Collaborative. Reducing variability in the infant sepsis evaluation (REVISE): a national quality initiative. Pediatrics. 2019;144(3): e20182201. https://doi.org/10.1542/peds.2018-2201
14. McCulloh RJ, Commers T, Williams DD, Michael J, Mann K, Newland JG. Effect of combined clinical practice guideline and electronic order set implementation on febrile infant evaluation and management. Pediatr Emerg Care. 2021;37(1):e25-e31. https://doi.org/10.1097/pec.0000000000002012
15. Foster LZ, Beiner J, Duh-Leong C, et al. Implementation of febrile infant management guidelines reduces hospitalization. Pediatr Qual Saf. 2020;5(1):e252. https://doi.org/10.1097/pq9.0000000000000252
16. Byington CL, Reynolds CC, Korgenski K, et al. Costs and infant outcomes after implementation of a care process model for febrile infants. Pediatrics. 2012;130(1):e16-e24. https://doi.org/10.1542/peds.2012-0127
17. Chang LV, Shah AN, Hoefgen ER, et al; H2O Study Group. Lost earnings and nonmedical expenses of pediatric hospitalizations. Pediatrics. 2018;142(3):e20180195. https://doi.org/10.1542/peds.2018-0195
© 2021 Society of Hospital Medicine
Nine Seasons of a Bronchiolitis Observation Unit and Home Oxygen Therapy Protocol
Bronchiolitis is the leading cause of hospitalization in infants aged <1 year in the United States.1-3 Estimates suggest that 1.5% to 2.0% of US infants require hospitalization every year, with a median (interquartile range) length of stay of 2 days (1-4),3 incurring direct medical costs of $555 million annually.1 Evidence suggests that few interventions, aside from supportive care, are effective for bronchiolitis.4-7 Adherence to standardized clinical guidelines could improve outcomes and resource use by streamlining care and limiting ineffective interventions, thereby decreasing hospital length of stay, which is a major medical cost.8-13 For this reason, many hospitals have adopted bronchiolitis guidelines, although institutional practices vary.14,15
Two relatively unexplored methods to reduce the inpatient burden of bronchiolitis are the use of observation units (OU) and home oxygen therapy (HOT). Motivated by research demonstrating the safety and effectiveness of an emergency department (ED)–based HOT protocol,16 where 36 of 37 patients with mild hypoxemia discharged on HOT avoided hospital admission, our institution implemented an observation unit and home oxygen therapy (OU-HOT) protocol designed to return children with bronchiolitis home earlier from the hospital. In the first winter season of implementation (2010 to 2011), the OU-HOT protocol was associated with significant reductions in length of stay and substantial cost savings, without an increase in return visits to the ED or inpatient readmissions.17 The objectives of this study were to determine whether these encouraging initial findings persisted and to measure the long-term impact of the OU-HOT protocol.
METHODS
We conducted a retrospective cohort study of children hospitalized with bronchiolitis at Primary Children’s Hospital, a freestanding children’s hospital in Salt Lake City, Utah. Discharge diagnosis and procedures codes, as well as laboratory, imaging, pharmacy, and supply costs, were obtained from the Intermountain Healthcare enterprise data warehouse. A crosswalk available from the Centers for Medicare and Medicaid Services was used to convert International Classification of Diseases (ICD)-10 discharge diagnosis and procedure codes to ICD-9 equivalents.18 This study was approved by the University of Utah institutional review board (00110419).
Patients
Children aged 3 to 24 months who were discharged with a diagnosis of bronchiolitis (466.xx) during winter seasons from 2007 to 2019 were included. A winter season was defined as November 1 to April 30. Both observation and inpatient encounters were included in the cohort. We excluded patients with discharge diagnosis or procedure codes indicating tracheostomy (519.0-519.09, V44.0, V55.0, 31.1, 31.21, 31.41, 31.74, 97.23), ventilator dependence (V46.1x), chronic lung disease (518.83, 770.7), or pulmonary hypertension (416.xx). Patients with both bronchiolitis and a concurrent diagnosis, such as otitis media or pneumonia, were included unless exclusion criteria were met.
Intervention and Process Measures
Our institution implemented the OU-HOT protocol at the start of the 2010-2011 winter season.17 The aim of the OU-HOT protocol was to discharge children with bronchiolitis home sooner by increasing use of both an OU, with frequent assessment of discharge readiness, and HOT to help children become ready for discharge. Similar to most OUs, admission to our unit was limited to patients who met hospital admission criteria, and had a short anticipated length of stay (<48 hours). As a self-contained 20-bed unit providing 24-hour dedicated pediatrician/pediatric emergency medicine physician and nursing coverage, the OU actively monitored patients’ discharge readiness, with a goal to facilitate patient throughput more akin to an ED rather than a traditional inpatient unit. Patients who could not be discharged from the OU within 48 hours were transferred to the inpatient unit. Although the OU existed at the time of protocol implementation, its use for patients with bronchiolitis was not actively encouraged until implementation.
Hospitalized patients—in either inpatient or observation units—were eligible for discharge on HOT if they met the following criteria: hypoxemia was the only indication for continued hospitalization, the child’s oxygen requirement was <0.5 L/min for at least 6 hours (0.8 L/min for children aged >1 year), the child’s caregiver(s) were willing to manage oxygen at home, and the child had reliable access to primary care provider follow up. We used two process measures across winter seasons: (1) the percentage of patients discharged from the OU, and (2) the percentage of patients discharged with HOT. The percentage of patients discharged on HOT was estimated by a manual chart review and an electronic medical record (EMR) HOT flag that came into existence with our hospital system’s adoption of a new EMR (2017-2019). Chart review randomly sampled patients from 2007-2017, totaling 457 patients. To estimate the reliability of this method, we calculated the sensitivity, specificity, positive predictive value, and negative predictive value of the EMR HOT flag using chart review as the gold standard.
Outcome Measures
The main outcome measure was mean hospital length of stay. Balancing measures were revisit rates (stratified into ED visits and readmissions) and annual per-population bronchiolitis admission rates. Visits were considered revisits if they occurred within 7 days of initial hospital discharge, and included visits to Primary Children’s Hospital as well as 22 other Intermountain Healthcare hospitals. Population estimates from the Utah Department of Health were used to calculate the annual population-based rate of bronchiolitis admissions to Primary Children’s Hospital.19 Annual admission rates were calculated per 10,000 children aged 3 to 24 months who resided in Utah each year of the study period, and were evaluated to determine if patients were admitted more frequently after OU-HOT implementation. Secondary outcome measures included the percentage of patients discharged within 24 hours and mean inflation-adjusted cost per episode of care (in 2019 dollars). Hospitalization costs were determined using Intermountain Healthcare’s internal cost accounting system, an activity-based method that aggregates costs of individual resources according to date of service.20 Costs were adjusted to 2019 dollars and were defined as the total costs of a patient’s initial hospitalization as well as any 7-day revisit encounters.
Data Analysis
Demographic data were compared before and after OU-HOT protocol implementation using Pearson chi-square tests. Multivariable linear or logistic regression models were used to compare measures before and after OU-HOT protocol implementation via an interrupted time-series approach. The interrupted time-series analysis measured two types of changes after protocol implementation during the 2010-2011 winter season: (1) any immediate change in the level of an outcome (immediate effect) and (2) any change of an outcome going forward over time (change in slope).21 Covariates in the regression models included patient age, sex, race, ethnicity, and insurance type, as well as presence of an underlying complex chronic condition, mechanical ventilation use, and pediatric intensive care unit (PICU) admission during hospitalization. Data were analyzed in STATA 15 (StataCorp LLC).22
RESULTS
A total of 7,116 patients met inclusion criteria over the study period (2,061 pre-implementation, 5,055 post-implementation). A comparison of patient characteristics before and after HOT protocol implementation is presented in Table 1. Patients were similar in terms of age, sex, and insurance type. Patients in the postimplementation period were more likely to have a complex chronic condition, require admission to the PICU, and need mechanical ventilation (P < .01). Differences between cohorts with regard to race/ethnicity distribution largely were a result of improved capture of these data elements in the postimplementation period. For example, 30% of patients were classified as “race/ethnicity unknown” in the preimplementation cohort, compared with 4% of patients in the postimplementation period.
 and Postimplementation (2010-2019) of the OU-HOT Protocol")
Process Measures
Figure 1 shows trends in OU and HOT use by winter season. The percentage of patients discharged from the OU increased immediately after OU-HOT protocol implementation (absolute 26.9% immediate increase; 95% CI, 21.9-42.2). The change in the proportion of OU use per season also increased (change in slope +3.9% per season; 95% CI, 3.4%-4.4%). The percentage of patients discharged with HOT increased immediately after OU-HOT protocol implementation (26.0% immediate change; 95% CI, 18.9%-33.1%); however, the immediate increase in HOT discharges was coupled with a declining rate of HOT discharges per season in the postprotocol period compared with the preprotocol period (change in slope –4.5% per season; 95% CI, –7.5% to –1.5%). Our chart review and EMR flag included 1,354 patients, or 19.0% of our cohort. Our EMR flag for HOT in the last two seasons of the study had a positive predictive value of 100% (5 of 5 identified by EMR flag as receiving HOT were confirmed by chart review) and negative predictive value of 89% (31 of 35 identified by EMR flag as not receiving HOT were confirmed by chart review). The specificity of the EMR flag was 100% (31 of 31 of those confirmed by chart review as not receiving HOT, who were correctly identified by EMR) and the sensitivity was 55% (5 of 9 of those confirmed by chart review as receiving HOT, who were correctly identified by EMR).

Primary and Secondary Outcomes
Trends in length of stay across winter seasons are presented in Figure 2. The OU-HOT protocol was associated with an immediate reduction of 30.6 hours in mean length of stay (95% CI, –37.1 to –24.2). The rate of change in length of stay postimplementation did not differ significantly from the rate of change preimplementation (change in slope –0.6 hours per season; 95% CI, –2.3 to 1.1 hours). The percentage of patients discharged within 24 hours of admission rose immediately after protocol implementation, by 23.8 absolute percentage points (95% CI, 11.7-28.8). Slopes of the preintervention and postintervention regression lines did not differ significantly (change in slope –0.1% per season; 95% CI, –1.4% to 1.1%). Immediate decreases in length of stay were accompanied by an immediate decrease in mean cost per episode of care (–$4,181; 95% CI, –$4,829 to –$3,533). Protocol implementation also was associated with a decreased slope in cost postimplementation (change in slope –$403 per season; 95% CI, –$543 to –$264). The total cost savings, estimated by the product of the average cost savings per episode of care and the number of bronchiolitis admissions included in the study after OU-HOT implementation, amounted to $21.1 million over the 9-year period, or $2.3 million per winter season.

Balancing Measures
We observed an immediate reduction in 7-day hospital revisits (–1.1% immediate change; 95% CI, –1.8% to –0.4%), but an increasing slope in revisits after implementation (change in slope 0.4% per season; 95% CI, 0.1%-0.8%) (Figure 3). Stratifying revisits into ED visits and readmissions revealed that the revisit findings reflected changes in ED return visits, for which there was an immediate reduction at the time of implementation (–1.0% immediate change; 95% CI, –1.6% to –0.4%), but an increasing slope postimplementation (change in slope 0.5% per season; 95% CI, 0.2-0.8). Neither an immediate intervention effect (0.0% immediate change; 95% CI, –0.5% to 0.4%) nor a change in slope (change in slope 0.0% per season; 95% CI, –0.1% to 0.1%) were observed for inpatient readmissions alone. The annual rate of bronchiolitis admissions to Primary Children’s Hospital per 10,000 children who reside in Utah decreased after implementation of the OU-HOT protocol (immediate intervention effect –6.2 admissions; 95% CI, –10.8 to –1.6; change in slope –1.8 admissions per season; 95% CI, –2.8 to –0.69).

DISCUSSION
Our OU-HOT protocol was associated with immediate improvements in care delivered to children hospitalized for bronchiolitis, including decreased length of stay and cost savings. These improvements in outcomes largely have been sustained over a 9-year period. The OU-HOT protocol also appears to be safe as evidenced by a stable rate of readmissions over the study period and only a small increase in revisits to EDs across Intermountain Healthcare facilities, which see most children in the catchment area. Our OU-HOT protocol represents a combination of two interventions: (1) the creation of an OU focused on discharge within 24 to 48 hours of admission and (2) encouragement to discharge children with HOT. We found that use of the OU and a commitment to timely discharges has been sustained in recent years, while the commitment to HOT has appeared to wane.
Earlier investigations have evaluated the efficacy of HOT in the ED setting to prevent hospital admissions, finding high levels of caregiver comfort, estimating $1,300 per patient cost savings, and reporting readmission rates of approximately 5%.16,23-25 Our study is unique in addressing HOT among a population of patients already hospitalized with bronchiolitis. The cost reductions we observed with our OU-HOT protocol were similar to those noted in the ED-based HOT protocols. However, we recorded lower readmission rates, likely because of the additional time allotted to caregivers to better gauge illness trajectory in the inpatient setting vs the ED, as well as additional time for hospitalized patients to reach the plateau or convalescent phase of illness. The small increase in ED revisits that we measured in recent years might be related to the concurrent rise in patient acuity and complexity.
Considering that length of stay has remained low despite less commitment to HOT, our results suggest that the OU might be the more impactful of the two interventions, and these data support the use of such a unit for a subset of patients with bronchiolitis. However, it is important to note that while the EMR HOT flag demonstrated high specificity, positive predictive value, and negative predictive value, the sensitivity was low (56%). As a result, it is possible that we have underestimated HOT use in the 2017-2018 and 2018-2019 seasons, the final two years of the study. Alternatively, the discrepancy between sustained outcomes and lagging use of HOT could be explained by improved identification of patients who would experience the greatest benefit with oxygen in terms of length of stay reductions, with fewer patients discharged on HOT but greater per-patient benefit. Finally, in an era that encourages reduced monitor use and less aggressive response to transient mild desaturations,13,26,27 it is possible that fewer patients are identified with clinically actionable hypoxemia around the time they would be otherwise discharged.
Our OU-HOT model is not unprecedented. Increasingly, other formerly inpatient indications are being successfully managed in the observation, outpatient, and home setting, such as parenteral antibiotic treatment28,29 and chemotherapy administration.30 Considering the inpatient burden of bronchiolitis, similar strategies to expedite discharge are needed. Although outpatient intravenous antibiotic and chemotherapy administration have been widely adopted, we are aware of only one other pediatric health care system in the United States (Children’s Hospital Colorado) that routinely discharges inpatients with bronchiolitis on HOT.
This study has several limitations. First, although the interrupted time-series analysis is designed to account for trends that precede an intervention and covariates that differ before and after the intervention, it is possible that important unmeasured patient factors or changes in practice patterns differed between the pre- and post-intervention cohorts. There were no major changes to the OU-HOT protocol or discharge criteria after implementation, but individual practice management of bronchiolitis during the study period likely has evolved as new evidence emerges. Second, one could postulate that the increase in discharges within 24 hours and accompanying decreases in average length of stay and cost could be achieved by hospitalizing healthier patients over time, which the presence of an OU might incentivize. To the contrary, we found that population-based bronchiolitis admission rates have declined and disease severity appears to be increased since implementation of the OU-HOT protocol. The increase in medically complex children and PICU use in our postimplementation cohort aligns with recently published data suggesting these are national trends.3,31 Third, HOT use was estimated from a sample of the cohort using a chart review and a newly available EMR flag. A low sensitivity and a small sample for the positive predictive value are limitations of the EMR flag.
Additionally, there are almost certainly unmeasured ambulatory burdens of HOT not captured by this study. ED-based protocols have estimated that patients discharged with HOT have a median of two follow-up ambulatory visits before oxygen is discontinued32; however, the ambulatory burden associated with discharge on HOT after a hospitalization and the extent to which demographic factors affect that burden is unknown. Furthermore, one insurance company charged $94 for a month of HOT in 2019; paying even a portion of this charge represents a nontrivial financial burden for many families, even considering inpatient cost savings. Although the decision to discharge on oxygen or remain hospitalized until the child did not need oxygen was left to the parents, their posthospitalization perspectives were not assessed in this study. Although reports indicate that families largely feel positive about HOT after discharge from an ED setting, with 90% of caregivers preferring HOT use to inpatient admission and most reporting no difficulty with home management,23 it is uncertain whether this would also apply after inpatient hospitalization.
CONCLUSION
The OU-HOT bronchiolitis protocol was associated with decreases in inpatient length of stay and cost while appearing safe to implement. The sustained use of the OU combined with declining use of HOT suggests that the OU might be the more impactful intervention. As previously inpatient indications such as parenteral antibiotics and chemotherapy increasingly have been administered in observation and outpatient settings, bronchiolitis appears ideal for a similar strategy that allows patients to spend less time in the hospital. Studies are needed to understand the outpatient burden of HOT and the generalizability of our findings.
1. Hasegawa K, Tsugawa Y, Brown DFM, Mansbach JM, Camargo CA. Trends in bronchiolitis hospitalizations in the United States, 2000-2009. Pediatrics. 2013;132(1):28-36. https://doi.org/10.1542/peds.2012-3877
2. Carroll KN, Gebretsadik T, Griffin MR, et al. Increasing burden and risk factors for bronchiolitis-related medical visits in infants enrolled in a state health care insurance plan. Pediatrics. 2008;122(1):58-64. https://doi.org/10.1542/peds.2007-2087
3. Fujiogi M, Goto T, Yasunaga H, et al. Trends in bronchiolitis hospitalizations in the United States: 2000–2016. Pediatrics. 2019;144(6):e20192614. https://doi.org/10.1542/peds.2019-2614
4. Schroeder AR, Mansbach JM. Recent evidence on the management of bronchiolitis. Curr Opin Pediatr. 2014;26(3):328-333. https://doi.org/10.1097/MOP.0000000000000090
5. American Academy of Pediatrics Subcommittee on Diagnosis and Management of Bronchiolitis. Diagnosis and management of bronchiolitis. Pediatrics. 2006;118(4):1774-1793. https://doi.org/10.1542/peds.2006-2223
6. Ralston SL, Lieberthal AS, Meissner HC, et al; American Academy of Pediatrics. Clinical practice guideline: the diagnosis, management, and prevention of bronchiolitis. Pediatrics. 2014;134(5):e1474. https://doi.org/10.1542/peds.2014-2742
7. Riese J, Porter T, Fierce J, Riese A, Richardson T, Alverson BK. Clinical outcomes of bronchiolitis after implementation of a general ward high flow nasal cannula guideline. Hosp Pediatr. 2017;7(4):197-203. https://doi.org/10.1542/hpeds.2016-0195
8. Perlstein PH, Kotagal UR, Bolling C, et al. Evaluation of an evidence-based guideline for bronchiolitis. Pediatrics. 1999;104(6):1334-1341. https://doi.org/10.1542/peds.104.6.1334
9. Perlstein PH, Kotagal UR, Schoettker PJ, et al. Sustaining the implementation of an evidence-based guideline for bronchiolitis. Arch Pediatr Adolesc Med. 2000;154(10):1001-1007. https://doi.org/10.1001/archpedi.154.10.1001
10. Wilson SD, Dahl BB, Wells RD. An evidence-based clinical pathway for bronchiolitis safely reduces antibiotic overuse. Am J Med Qual. 2002;17(5):195-199. https://doi.org/10.1177/106286060201700507
11. Barben J, Kuehni CE, Trachsel D, Hammer J; Swiss Paediatric Respiratory Research Group. Management of acute bronchiolitis: can evidence based guidelines alter clinical practice? Thorax. 2008;63(12):1103-1109. https://doi.org/10.1136/thx.2007.094706
12. Bryan MA, Desai AD, Wilson L, Wright DR, Mangione-Smith R. Association of bronchiolitis clinical pathway adherence with length of stay and costs. Pediatrics. 2017;139(3):e20163432. https://doi.org/10.1542/peds.2016-3432
13. Mittal S, Marlowe L, Blakeslee S, et al. Successful use of quality improvement methodology to reduce inpatient length of stay in bronchiolitis through judicious use of intermittent pulse oximetry. Hosp Pediatr. 2019;9(2):73-78. https://doi.org/10.1542/hpeds.2018-0023
14. Macias CG, Mansbach JM, Fisher ES, et al. Variability in inpatient management of children hospitalized with bronchiolitis. Acad Pediatr. 2015;15(1):69-76. https://doi.org/10.1016/j.acap.2014.07.005
15. Mittal V, Hall M, Morse R, et al. Impact of inpatient bronchiolitis clinical practice guideline implementation on testing and treatment. J Pediatr. 2014;165(3):570-6.e3. https://doi.org/10.1016/j.jpeds.2014.05.021
16. Bajaj L, Turner CG, Bothner J. A randomized trial of home oxygen therapy from the emergency department for acute bronchiolitis. Pediatrics. 2006;117(3):633-640. https://doi.org/10.1542/peds.2005-1322
17. Sandweiss DR, Mundorff MB, Hill T, et al. Decreasing hospital length of stay for bronchiolitis by using an observation unit and home oxygen therapy. JAMA Pediatr. 2013;167(5):422-428. https://doi.org/10.1001/jamapediatrics.2013.1435
18. National Bureau of Economic Research. ICD-9-CM to and from ICD-10-CM and ICD-10-PCS crosswalk or general equivalence mappings. Accessed December 2, 2020. http://www.nber.org/data/icd9-icd-10-cm-and-pcs-crosswalk-general-equivalence-mapping.html
19. Utah Department of Health, Indicator-Based Information System for Public Health. Accessed February 15, 2020. https://ibis.health.utah.gov/ibisph-view
20. James BC, Savitz LA. How Intermountain trimmed health care costs through robust quality improvement efforts. Health Aff (Millwood). 2011;30(6):1185-1191. https://doi.org/10.1377/hlthaff.2011.0358
21. Penfold RB, Zhang F. Use of interrupted time series analysis in evaluating health care quality improvements. Acad Pediatr. 2013;13(6 Suppl):S38-44. https://doi.org/10.1016/j.acap.2013.08.002
22. StataCorp. Stata Statistical Software: Release 15. StataCorp LLC; 2017.
23. Freeman JF, Deakyne S, Bajaj L. Emergency department-initiated home oxygen for bronchiolitis: a prospective study of community follow-up, caregiver satisfaction, and outcomes. Acad Emerg Med. 2017;24(8):920-929. https://doi.org/10.1111/acem.13179
24. Freeman JF, Brou L, Mistry R. Feasibility and capacity for widespread use of emergency department-based home oxygen for bronchiolitis. Am J Emerg Med. 2017;35(9):1379-1381. https://doi.org/10.1016/j.ajem.2017.03.069
25. Halstead S, Roosevelt G, Deakyne S, Bajaj L. Discharged on supplemental oxygen from an emergency department in patients with bronchiolitis. Pediatrics. 2012;129(3):e605-610. https://doi.org/10.1542/peds.2011-0889
26. Quinonez RA, Coon ER, Schroeder AR, Moyer VA. When technology creates uncertainty: pulse oximetry and overdiagnosis of hypoxaemia in bronchiolitis. BMJ. 2017;358:j3850. https://doi.org/10.1136/bmj.j3850
27. Burrows J, Berg K, McCulloh R. Intermittent pulse oximetry use and length of stay in bronchiolitis: bystander or primary Driver? Hosp Pediatr. 2019;9(2):142-143. https://doi.org/10.1542/hpeds.2018-0183
28. Norris AH, Shrestha NK, Allison GM, et al. 2018 Infectious Diseases Society of America clinical practice guideline for the management of outpatient parenteral antimicrobial therapy. Clin Infect Dis. 2019;68(1):e1-e35. https://doi.org/10.1093/cid/ciy745
29. Williams DN, Baker CA, Kind AC, Sannes MR. The history and evolution of outpatient parenteral antibiotic therapy (OPAT). Int J Antimicrob Agents. 2015;46(3):307-312. https://doi.org/10.1016/j.ijantimicag.2015.07.001
30. Beaty RS, Bernhardt MB, Berger AH, Hesselgrave JE, Russell HV, Okcu MF. Inpatient versus outpatient vincristine, dactinomycin, and cyclophosphamide for pediatric cancers: quality and cost implications. Pediatr Blood Cancer. 2015;62(11):1925-1928. https://doi.org/10.1002/pbc.25610
31. Coon ER, Stoddard G, Brady PW. Intensive care unit utilization after adoption of a ward-based high-flow nasal cannula protocol. J Hosp Med. 2020;15(6):325-330. https://doi.org/10.12788/jhm.3417
32. Freeman JF, Weng H-YC, Sandweiss D. Outpatient management of home oxygen for bronchiolitis. Clin Pediatr (Phila). 2015;54(1):62-66. https://doi.org/10.1177/0009922814547564
Bronchiolitis is the leading cause of hospitalization in infants aged <1 year in the United States.1-3 Estimates suggest that 1.5% to 2.0% of US infants require hospitalization every year, with a median (interquartile range) length of stay of 2 days (1-4),3 incurring direct medical costs of $555 million annually.1 Evidence suggests that few interventions, aside from supportive care, are effective for bronchiolitis.4-7 Adherence to standardized clinical guidelines could improve outcomes and resource use by streamlining care and limiting ineffective interventions, thereby decreasing hospital length of stay, which is a major medical cost.8-13 For this reason, many hospitals have adopted bronchiolitis guidelines, although institutional practices vary.14,15
Two relatively unexplored methods to reduce the inpatient burden of bronchiolitis are the use of observation units (OU) and home oxygen therapy (HOT). Motivated by research demonstrating the safety and effectiveness of an emergency department (ED)–based HOT protocol,16 where 36 of 37 patients with mild hypoxemia discharged on HOT avoided hospital admission, our institution implemented an observation unit and home oxygen therapy (OU-HOT) protocol designed to return children with bronchiolitis home earlier from the hospital. In the first winter season of implementation (2010 to 2011), the OU-HOT protocol was associated with significant reductions in length of stay and substantial cost savings, without an increase in return visits to the ED or inpatient readmissions.17 The objectives of this study were to determine whether these encouraging initial findings persisted and to measure the long-term impact of the OU-HOT protocol.
METHODS
We conducted a retrospective cohort study of children hospitalized with bronchiolitis at Primary Children’s Hospital, a freestanding children’s hospital in Salt Lake City, Utah. Discharge diagnosis and procedures codes, as well as laboratory, imaging, pharmacy, and supply costs, were obtained from the Intermountain Healthcare enterprise data warehouse. A crosswalk available from the Centers for Medicare and Medicaid Services was used to convert International Classification of Diseases (ICD)-10 discharge diagnosis and procedure codes to ICD-9 equivalents.18 This study was approved by the University of Utah institutional review board (00110419).
Patients
Children aged 3 to 24 months who were discharged with a diagnosis of bronchiolitis (466.xx) during winter seasons from 2007 to 2019 were included. A winter season was defined as November 1 to April 30. Both observation and inpatient encounters were included in the cohort. We excluded patients with discharge diagnosis or procedure codes indicating tracheostomy (519.0-519.09, V44.0, V55.0, 31.1, 31.21, 31.41, 31.74, 97.23), ventilator dependence (V46.1x), chronic lung disease (518.83, 770.7), or pulmonary hypertension (416.xx). Patients with both bronchiolitis and a concurrent diagnosis, such as otitis media or pneumonia, were included unless exclusion criteria were met.
Intervention and Process Measures
Our institution implemented the OU-HOT protocol at the start of the 2010-2011 winter season.17 The aim of the OU-HOT protocol was to discharge children with bronchiolitis home sooner by increasing use of both an OU, with frequent assessment of discharge readiness, and HOT to help children become ready for discharge. Similar to most OUs, admission to our unit was limited to patients who met hospital admission criteria, and had a short anticipated length of stay (<48 hours). As a self-contained 20-bed unit providing 24-hour dedicated pediatrician/pediatric emergency medicine physician and nursing coverage, the OU actively monitored patients’ discharge readiness, with a goal to facilitate patient throughput more akin to an ED rather than a traditional inpatient unit. Patients who could not be discharged from the OU within 48 hours were transferred to the inpatient unit. Although the OU existed at the time of protocol implementation, its use for patients with bronchiolitis was not actively encouraged until implementation.
Hospitalized patients—in either inpatient or observation units—were eligible for discharge on HOT if they met the following criteria: hypoxemia was the only indication for continued hospitalization, the child’s oxygen requirement was <0.5 L/min for at least 6 hours (0.8 L/min for children aged >1 year), the child’s caregiver(s) were willing to manage oxygen at home, and the child had reliable access to primary care provider follow up. We used two process measures across winter seasons: (1) the percentage of patients discharged from the OU, and (2) the percentage of patients discharged with HOT. The percentage of patients discharged on HOT was estimated by a manual chart review and an electronic medical record (EMR) HOT flag that came into existence with our hospital system’s adoption of a new EMR (2017-2019). Chart review randomly sampled patients from 2007-2017, totaling 457 patients. To estimate the reliability of this method, we calculated the sensitivity, specificity, positive predictive value, and negative predictive value of the EMR HOT flag using chart review as the gold standard.
Outcome Measures
The main outcome measure was mean hospital length of stay. Balancing measures were revisit rates (stratified into ED visits and readmissions) and annual per-population bronchiolitis admission rates. Visits were considered revisits if they occurred within 7 days of initial hospital discharge, and included visits to Primary Children’s Hospital as well as 22 other Intermountain Healthcare hospitals. Population estimates from the Utah Department of Health were used to calculate the annual population-based rate of bronchiolitis admissions to Primary Children’s Hospital.19 Annual admission rates were calculated per 10,000 children aged 3 to 24 months who resided in Utah each year of the study period, and were evaluated to determine if patients were admitted more frequently after OU-HOT implementation. Secondary outcome measures included the percentage of patients discharged within 24 hours and mean inflation-adjusted cost per episode of care (in 2019 dollars). Hospitalization costs were determined using Intermountain Healthcare’s internal cost accounting system, an activity-based method that aggregates costs of individual resources according to date of service.20 Costs were adjusted to 2019 dollars and were defined as the total costs of a patient’s initial hospitalization as well as any 7-day revisit encounters.
Data Analysis
Demographic data were compared before and after OU-HOT protocol implementation using Pearson chi-square tests. Multivariable linear or logistic regression models were used to compare measures before and after OU-HOT protocol implementation via an interrupted time-series approach. The interrupted time-series analysis measured two types of changes after protocol implementation during the 2010-2011 winter season: (1) any immediate change in the level of an outcome (immediate effect) and (2) any change of an outcome going forward over time (change in slope).21 Covariates in the regression models included patient age, sex, race, ethnicity, and insurance type, as well as presence of an underlying complex chronic condition, mechanical ventilation use, and pediatric intensive care unit (PICU) admission during hospitalization. Data were analyzed in STATA 15 (StataCorp LLC).22
RESULTS
A total of 7,116 patients met inclusion criteria over the study period (2,061 pre-implementation, 5,055 post-implementation). A comparison of patient characteristics before and after HOT protocol implementation is presented in Table 1. Patients were similar in terms of age, sex, and insurance type. Patients in the postimplementation period were more likely to have a complex chronic condition, require admission to the PICU, and need mechanical ventilation (P < .01). Differences between cohorts with regard to race/ethnicity distribution largely were a result of improved capture of these data elements in the postimplementation period. For example, 30% of patients were classified as “race/ethnicity unknown” in the preimplementation cohort, compared with 4% of patients in the postimplementation period.
Process Measures
Figure 1 shows trends in OU and HOT use by winter season. The percentage of patients discharged from the OU increased immediately after OU-HOT protocol implementation (absolute 26.9% immediate increase; 95% CI, 21.9-42.2). The change in the proportion of OU use per season also increased (change in slope +3.9% per season; 95% CI, 3.4%-4.4%). The percentage of patients discharged with HOT increased immediately after OU-HOT protocol implementation (26.0% immediate change; 95% CI, 18.9%-33.1%); however, the immediate increase in HOT discharges was coupled with a declining rate of HOT discharges per season in the postprotocol period compared with the preprotocol period (change in slope –4.5% per season; 95% CI, –7.5% to –1.5%). Our chart review and EMR flag included 1,354 patients, or 19.0% of our cohort. Our EMR flag for HOT in the last two seasons of the study had a positive predictive value of 100% (5 of 5 identified by EMR flag as receiving HOT were confirmed by chart review) and negative predictive value of 89% (31 of 35 identified by EMR flag as not receiving HOT were confirmed by chart review). The specificity of the EMR flag was 100% (31 of 31 of those confirmed by chart review as not receiving HOT, who were correctly identified by EMR) and the sensitivity was 55% (5 of 9 of those confirmed by chart review as receiving HOT, who were correctly identified by EMR).
Primary and Secondary Outcomes
Trends in length of stay across winter seasons are presented in Figure 2. The OU-HOT protocol was associated with an immediate reduction of 30.6 hours in mean length of stay (95% CI, –37.1 to –24.2). The rate of change in length of stay postimplementation did not differ significantly from the rate of change preimplementation (change in slope –0.6 hours per season; 95% CI, –2.3 to 1.1 hours). The percentage of patients discharged within 24 hours of admission rose immediately after protocol implementation, by 23.8 absolute percentage points (95% CI, 11.7-28.8). Slopes of the preintervention and postintervention regression lines did not differ significantly (change in slope –0.1% per season; 95% CI, –1.4% to 1.1%). Immediate decreases in length of stay were accompanied by an immediate decrease in mean cost per episode of care (–$4,181; 95% CI, –$4,829 to –$3,533). Protocol implementation also was associated with a decreased slope in cost postimplementation (change in slope –$403 per season; 95% CI, –$543 to –$264). The total cost savings, estimated by the product of the average cost savings per episode of care and the number of bronchiolitis admissions included in the study after OU-HOT implementation, amounted to $21.1 million over the 9-year period, or $2.3 million per winter season.
Balancing Measures
We observed an immediate reduction in 7-day hospital revisits (–1.1% immediate change; 95% CI, –1.8% to –0.4%), but an increasing slope in revisits after implementation (change in slope 0.4% per season; 95% CI, 0.1%-0.8%) (Figure 3). Stratifying revisits into ED visits and readmissions revealed that the revisit findings reflected changes in ED return visits, for which there was an immediate reduction at the time of implementation (–1.0% immediate change; 95% CI, –1.6% to –0.4%), but an increasing slope postimplementation (change in slope 0.5% per season; 95% CI, 0.2-0.8). Neither an immediate intervention effect (0.0% immediate change; 95% CI, –0.5% to 0.4%) nor a change in slope (change in slope 0.0% per season; 95% CI, –0.1% to 0.1%) were observed for inpatient readmissions alone. The annual rate of bronchiolitis admissions to Primary Children’s Hospital per 10,000 children who reside in Utah decreased after implementation of the OU-HOT protocol (immediate intervention effect –6.2 admissions; 95% CI, –10.8 to –1.6; change in slope –1.8 admissions per season; 95% CI, –2.8 to –0.69).
DISCUSSION
Our OU-HOT protocol was associated with immediate improvements in care delivered to children hospitalized for bronchiolitis, including decreased length of stay and cost savings. These improvements in outcomes largely have been sustained over a 9-year period. The OU-HOT protocol also appears to be safe as evidenced by a stable rate of readmissions over the study period and only a small increase in revisits to EDs across Intermountain Healthcare facilities, which see most children in the catchment area. Our OU-HOT protocol represents a combination of two interventions: (1) the creation of an OU focused on discharge within 24 to 48 hours of admission and (2) encouragement to discharge children with HOT. We found that use of the OU and a commitment to timely discharges has been sustained in recent years, while the commitment to HOT has appeared to wane.
Earlier investigations have evaluated the efficacy of HOT in the ED setting to prevent hospital admissions, finding high levels of caregiver comfort, estimating $1,300 per patient cost savings, and reporting readmission rates of approximately 5%.16,23-25 Our study is unique in addressing HOT among a population of patients already hospitalized with bronchiolitis. The cost reductions we observed with our OU-HOT protocol were similar to those noted in the ED-based HOT protocols. However, we recorded lower readmission rates, likely because of the additional time allotted to caregivers to better gauge illness trajectory in the inpatient setting vs the ED, as well as additional time for hospitalized patients to reach the plateau or convalescent phase of illness. The small increase in ED revisits that we measured in recent years might be related to the concurrent rise in patient acuity and complexity.
Considering that length of stay has remained low despite less commitment to HOT, our results suggest that the OU might be the more impactful of the two interventions, and these data support the use of such a unit for a subset of patients with bronchiolitis. However, it is important to note that while the EMR HOT flag demonstrated high specificity, positive predictive value, and negative predictive value, the sensitivity was low (56%). As a result, it is possible that we have underestimated HOT use in the 2017-2018 and 2018-2019 seasons, the final two years of the study. Alternatively, the discrepancy between sustained outcomes and lagging use of HOT could be explained by improved identification of patients who would experience the greatest benefit with oxygen in terms of length of stay reductions, with fewer patients discharged on HOT but greater per-patient benefit. Finally, in an era that encourages reduced monitor use and less aggressive response to transient mild desaturations,13,26,27 it is possible that fewer patients are identified with clinically actionable hypoxemia around the time they would be otherwise discharged.
Our OU-HOT model is not unprecedented. Increasingly, other formerly inpatient indications are being successfully managed in the observation, outpatient, and home setting, such as parenteral antibiotic treatment28,29 and chemotherapy administration.30 Considering the inpatient burden of bronchiolitis, similar strategies to expedite discharge are needed. Although outpatient intravenous antibiotic and chemotherapy administration have been widely adopted, we are aware of only one other pediatric health care system in the United States (Children’s Hospital Colorado) that routinely discharges inpatients with bronchiolitis on HOT.
This study has several limitations. First, although the interrupted time-series analysis is designed to account for trends that precede an intervention and covariates that differ before and after the intervention, it is possible that important unmeasured patient factors or changes in practice patterns differed between the pre- and post-intervention cohorts. There were no major changes to the OU-HOT protocol or discharge criteria after implementation, but individual practice management of bronchiolitis during the study period likely has evolved as new evidence emerges. Second, one could postulate that the increase in discharges within 24 hours and accompanying decreases in average length of stay and cost could be achieved by hospitalizing healthier patients over time, which the presence of an OU might incentivize. To the contrary, we found that population-based bronchiolitis admission rates have declined and disease severity appears to be increased since implementation of the OU-HOT protocol. The increase in medically complex children and PICU use in our postimplementation cohort aligns with recently published data suggesting these are national trends.3,31 Third, HOT use was estimated from a sample of the cohort using a chart review and a newly available EMR flag. A low sensitivity and a small sample for the positive predictive value are limitations of the EMR flag.
Additionally, there are almost certainly unmeasured ambulatory burdens of HOT not captured by this study. ED-based protocols have estimated that patients discharged with HOT have a median of two follow-up ambulatory visits before oxygen is discontinued32; however, the ambulatory burden associated with discharge on HOT after a hospitalization and the extent to which demographic factors affect that burden is unknown. Furthermore, one insurance company charged $94 for a month of HOT in 2019; paying even a portion of this charge represents a nontrivial financial burden for many families, even considering inpatient cost savings. Although the decision to discharge on oxygen or remain hospitalized until the child did not need oxygen was left to the parents, their posthospitalization perspectives were not assessed in this study. Although reports indicate that families largely feel positive about HOT after discharge from an ED setting, with 90% of caregivers preferring HOT use to inpatient admission and most reporting no difficulty with home management,23 it is uncertain whether this would also apply after inpatient hospitalization.
CONCLUSION
The OU-HOT bronchiolitis protocol was associated with decreases in inpatient length of stay and cost while appearing safe to implement. The sustained use of the OU combined with declining use of HOT suggests that the OU might be the more impactful intervention. As previously inpatient indications such as parenteral antibiotics and chemotherapy increasingly have been administered in observation and outpatient settings, bronchiolitis appears ideal for a similar strategy that allows patients to spend less time in the hospital. Studies are needed to understand the outpatient burden of HOT and the generalizability of our findings.
1. Hasegawa K, Tsugawa Y, Brown DFM, Mansbach JM, Camargo CA. Trends in bronchiolitis hospitalizations in the United States, 2000-2009. Pediatrics. 2013;132(1):28-36. https://doi.org/10.1542/peds.2012-3877
2. Carroll KN, Gebretsadik T, Griffin MR, et al. Increasing burden and risk factors for bronchiolitis-related medical visits in infants enrolled in a state health care insurance plan. Pediatrics. 2008;122(1):58-64. https://doi.org/10.1542/peds.2007-2087
3. Fujiogi M, Goto T, Yasunaga H, et al. Trends in bronchiolitis hospitalizations in the United States: 2000–2016. Pediatrics. 2019;144(6):e20192614. https://doi.org/10.1542/peds.2019-2614
4. Schroeder AR, Mansbach JM. Recent evidence on the management of bronchiolitis. Curr Opin Pediatr. 2014;26(3):328-333. https://doi.org/10.1097/MOP.0000000000000090
5. American Academy of Pediatrics Subcommittee on Diagnosis and Management of Bronchiolitis. Diagnosis and management of bronchiolitis. Pediatrics. 2006;118(4):1774-1793. https://doi.org/10.1542/peds.2006-2223
6. Ralston SL, Lieberthal AS, Meissner HC, et al; American Academy of Pediatrics. Clinical practice guideline: the diagnosis, management, and prevention of bronchiolitis. Pediatrics. 2014;134(5):e1474. https://doi.org/10.1542/peds.2014-2742
7. Riese J, Porter T, Fierce J, Riese A, Richardson T, Alverson BK. Clinical outcomes of bronchiolitis after implementation of a general ward high flow nasal cannula guideline. Hosp Pediatr. 2017;7(4):197-203. https://doi.org/10.1542/hpeds.2016-0195
8. Perlstein PH, Kotagal UR, Bolling C, et al. Evaluation of an evidence-based guideline for bronchiolitis. Pediatrics. 1999;104(6):1334-1341. https://doi.org/10.1542/peds.104.6.1334
9. Perlstein PH, Kotagal UR, Schoettker PJ, et al. Sustaining the implementation of an evidence-based guideline for bronchiolitis. Arch Pediatr Adolesc Med. 2000;154(10):1001-1007. https://doi.org/10.1001/archpedi.154.10.1001
10. Wilson SD, Dahl BB, Wells RD. An evidence-based clinical pathway for bronchiolitis safely reduces antibiotic overuse. Am J Med Qual. 2002;17(5):195-199. https://doi.org/10.1177/106286060201700507
11. Barben J, Kuehni CE, Trachsel D, Hammer J; Swiss Paediatric Respiratory Research Group. Management of acute bronchiolitis: can evidence based guidelines alter clinical practice? Thorax. 2008;63(12):1103-1109. https://doi.org/10.1136/thx.2007.094706
12. Bryan MA, Desai AD, Wilson L, Wright DR, Mangione-Smith R. Association of bronchiolitis clinical pathway adherence with length of stay and costs. Pediatrics. 2017;139(3):e20163432. https://doi.org/10.1542/peds.2016-3432
13. Mittal S, Marlowe L, Blakeslee S, et al. Successful use of quality improvement methodology to reduce inpatient length of stay in bronchiolitis through judicious use of intermittent pulse oximetry. Hosp Pediatr. 2019;9(2):73-78. https://doi.org/10.1542/hpeds.2018-0023
14. Macias CG, Mansbach JM, Fisher ES, et al. Variability in inpatient management of children hospitalized with bronchiolitis. Acad Pediatr. 2015;15(1):69-76. https://doi.org/10.1016/j.acap.2014.07.005
15. Mittal V, Hall M, Morse R, et al. Impact of inpatient bronchiolitis clinical practice guideline implementation on testing and treatment. J Pediatr. 2014;165(3):570-6.e3. https://doi.org/10.1016/j.jpeds.2014.05.021
16. Bajaj L, Turner CG, Bothner J. A randomized trial of home oxygen therapy from the emergency department for acute bronchiolitis. Pediatrics. 2006;117(3):633-640. https://doi.org/10.1542/peds.2005-1322
17. Sandweiss DR, Mundorff MB, Hill T, et al. Decreasing hospital length of stay for bronchiolitis by using an observation unit and home oxygen therapy. JAMA Pediatr. 2013;167(5):422-428. https://doi.org/10.1001/jamapediatrics.2013.1435
18. National Bureau of Economic Research. ICD-9-CM to and from ICD-10-CM and ICD-10-PCS crosswalk or general equivalence mappings. Accessed December 2, 2020. http://www.nber.org/data/icd9-icd-10-cm-and-pcs-crosswalk-general-equivalence-mapping.html
19. Utah Department of Health, Indicator-Based Information System for Public Health. Accessed February 15, 2020. https://ibis.health.utah.gov/ibisph-view
20. James BC, Savitz LA. How Intermountain trimmed health care costs through robust quality improvement efforts. Health Aff (Millwood). 2011;30(6):1185-1191. https://doi.org/10.1377/hlthaff.2011.0358
21. Penfold RB, Zhang F. Use of interrupted time series analysis in evaluating health care quality improvements. Acad Pediatr. 2013;13(6 Suppl):S38-44. https://doi.org/10.1016/j.acap.2013.08.002
22. StataCorp. Stata Statistical Software: Release 15. StataCorp LLC; 2017.
23. Freeman JF, Deakyne S, Bajaj L. Emergency department-initiated home oxygen for bronchiolitis: a prospective study of community follow-up, caregiver satisfaction, and outcomes. Acad Emerg Med. 2017;24(8):920-929. https://doi.org/10.1111/acem.13179
24. Freeman JF, Brou L, Mistry R. Feasibility and capacity for widespread use of emergency department-based home oxygen for bronchiolitis. Am J Emerg Med. 2017;35(9):1379-1381. https://doi.org/10.1016/j.ajem.2017.03.069
25. Halstead S, Roosevelt G, Deakyne S, Bajaj L. Discharged on supplemental oxygen from an emergency department in patients with bronchiolitis. Pediatrics. 2012;129(3):e605-610. https://doi.org/10.1542/peds.2011-0889
26. Quinonez RA, Coon ER, Schroeder AR, Moyer VA. When technology creates uncertainty: pulse oximetry and overdiagnosis of hypoxaemia in bronchiolitis. BMJ. 2017;358:j3850. https://doi.org/10.1136/bmj.j3850
27. Burrows J, Berg K, McCulloh R. Intermittent pulse oximetry use and length of stay in bronchiolitis: bystander or primary Driver? Hosp Pediatr. 2019;9(2):142-143. https://doi.org/10.1542/hpeds.2018-0183
28. Norris AH, Shrestha NK, Allison GM, et al. 2018 Infectious Diseases Society of America clinical practice guideline for the management of outpatient parenteral antimicrobial therapy. Clin Infect Dis. 2019;68(1):e1-e35. https://doi.org/10.1093/cid/ciy745
29. Williams DN, Baker CA, Kind AC, Sannes MR. The history and evolution of outpatient parenteral antibiotic therapy (OPAT). Int J Antimicrob Agents. 2015;46(3):307-312. https://doi.org/10.1016/j.ijantimicag.2015.07.001
30. Beaty RS, Bernhardt MB, Berger AH, Hesselgrave JE, Russell HV, Okcu MF. Inpatient versus outpatient vincristine, dactinomycin, and cyclophosphamide for pediatric cancers: quality and cost implications. Pediatr Blood Cancer. 2015;62(11):1925-1928. https://doi.org/10.1002/pbc.25610
31. Coon ER, Stoddard G, Brady PW. Intensive care unit utilization after adoption of a ward-based high-flow nasal cannula protocol. J Hosp Med. 2020;15(6):325-330. https://doi.org/10.12788/jhm.3417
32. Freeman JF, Weng H-YC, Sandweiss D. Outpatient management of home oxygen for bronchiolitis. Clin Pediatr (Phila). 2015;54(1):62-66. https://doi.org/10.1177/0009922814547564
© 2021 Society of Hospital Medicine
Automating Measurement of Trainee Work Hours
Across the country, residents are bound to a set of rules from the Accreditation Council for Graduate Medical Education (ACGME) designed to mini mize fatigue, maintain quality of life, and reduce fatigue-related patient safety events. Adherence to work hours regulations is required to maintain accreditation. Among other guidelines, residents are required to work fewer than 80 hours per week on average over 4 consecutive weeks.1 When work hour violations occur, programs risk citation, penalties, and harm to the program’s reputation.
Residents self-report their adherence to program regulations in an annual survey conducted by the ACGME.2 To collect more frequent data, most training programs monitor resident work hours through self-report on an electronic tracking platform.3 These data generally are used internally to identify problems and opportunities for improvement. However, self-report approaches are subject to imperfect recall and incomplete reporting, and require time and effort to complete.4
The widespread adoption of electronic health records (EHRs) brings new opportunity to measure and promote adherence to work hours. EHR log data capture when users log in and out of the system, along with their location and specific actions. These data offer a compelling alternative to self-report because they are already being collected and can be analyzed almost immediately. Recent studies using EHR log data to approximate resident work hours in a pediatric hospital successfully approximated scheduled hours, but the approach was customized to their hospital’s workflows and might not generalize to other settings.5 Furthermore, earlier studies have not captured evening out-of-hospital work, which contributes to total work hours and is associated with physician burnout.6
We developed a computational method that sought to accurately capture work hours, including out-of-hospital work, which could be used as a screening tool to identify at-risk residents and rotations in near real-time. We estimated work hours, including EHR and non-EHR work, from these EHR data and compared these daily estimations to self-report. We then used a heuristic to estimate the frequency of exceeding the 80-hour workweek in a large internal medicine residency program.
METHODS
The population included 82 internal medicine interns (PGY-1) and 121 residents (PGY-2 = 60, PGY-3 = 61) who rotated through University of California, San Francisco Medical Center (UCSFMC) between July 1, 2018, and June 30, 2019, on inpatient rotations. In the UCSF internal medicine residency program, interns spend an average of 5 months per year and residents spend an average of 2 months per year on inpatient rotations at UCSFMC. Scheduled inpatient rotations generally are in 1-month blocks and include general medical wards, cardiology, liver transplant, night-float, and a procedures and jeopardy rotation where interns perform procedures at UCSFMC and serve as backup for their colleagues across sites. Although expected shift duration differs by rotation, types of shifts include regular length days, call days that are not overnight (but expected duration of work is into the late evening), 28-hour overnight call (PGY-2 and PGY-3), and night-float.
Data Source
This computational method was developed at UCSFMC. This study was approved by the University of California, San Francisco institutional review board. Using the UCSF Epic Clarity database, EHR access log data were obtained, including all Epic logins/logoffs, times, and access devices. Access devices identified included medical center computers, personal computers, and mobile devices.
Trainees self-report their work hours in MedHub, a widely used electronic tracking platform for self-report of resident work hours.7 Data were extracted from this database for interns and residents who matched the criteria above. The self-report data were considered the gold standard for comparison, because it is the best available despite its known limitations.
We used data collected from UCSF’s physician scheduling platform, AMiON, to identify interns and residents assigned to rotations at UCSF hospitals.8 AMiON also was used to capture half-days of off-site scheduled clinics and teaching, which count toward the workday but would not be associated with on-campus logins.
Developing a Computational Method to Measure Work Hours
We developed a heuristic to accomplish two goals: (1) infer the duration of continuous in-hospital work hours while providing clinical care and (2) measure “out-of-hospital” work. Logins from medical center computers were considered to be “on-campus” work. Logins from personal computers were considered to be “out-of-hospital.” “Out-of-hospital” login sessions were further subdivided into “out-of-hospital work” and “out-of-hospital study” based on activity during the session; if any work activities listed in Appendix Table 1 were performed, the session was attributed to work. If only chart review was performed, the session was attributed to study and did not count towards total hours worked. Logins from mobile devices also did not count towards total hours worked.
We inferred continuous in-hospital work by linking on-campus EHR sessions from the first on-campus login until the last on-campus logoff (Figure 1). 
If there was overlapping time measurement between on-campus work and personal computer logins (for example, a resident was inferred to be doing on-campus work based on frequent medical center computer logins but there were also logins from personal computers), we inferred this to indicate that a personal device had been brought on-campus and the time was only attributed to on-campus work and was not double counted as out-of-hospital work. Out-of-hospital work that did not overlap with inferred on-campus work time contributed to the total hours worked in a week, consistent with ACGME guidelines.
Our internal medicine residents work at three hospitals: UCSFMC and two affiliated teaching hospitals. Although this study measured work hours while the residents were on an inpatient rotation at UCSFMC, trainees also might have occasional half-day clinics or teaching activities at other sites not captured by these EHR log data. The allocated time for that scheduled activity (extracted from AMiON) was counted as work hours. If the trainee was assigned to a morning half-day of off-site work (eg, didactics), this was counted the same as an 8
Comparison of EHR-Derived Work Hours Heuristic to Self-Report
Because resident adherence with daily self-report is imperfect, we compared EHR-derived work to self-report on days when both were available. We generated scatter plots of EHR-derived work hours compared with self-report and calculated the mean absolute error of estimation. We fit a linear mixed-effect model for each PGY, modeling self-reported hours as a linear function of estimated hours (fixed effect) with a random intercept (random effect) for each trainee to account for variations among individuals. StatsModels, version 0.11.1, was used for statistical analyses.9
We reviewed detailed data from outlier clusters to understand situations where the heuristic might not perform optimally. To assess whether EHR-derived work hours reasonably overlapped with expected shifts, 20 8-day blocks from separate interns and residents were randomly selected for qualitative detail review in comparison with AMiON schedule data.
Estimating Hours Worked and Work Hours Violations
After validating against self-report on a daily basis, we used our heuristic to infer the average rate at which the 80-hour workweek was exceeded across all inpatient rotations at UCSFMC. This was determined both including “out-of-hospital” work as derived from logins on personal computers and excluding it. Using the estimated daily hours worked, we built a near real-time dashboard to assist program leadership with identifying at-risk trainees and trends across the program.
RESULTS
Data from 82 interns (PGY-1) and 121 internal medicine residents (PGY-2 and PGY-3) who rotated at UCSFMC between July 1, 2018, and June 30, 2019, were included in the study. Table 1 shows the number of days and rotations worked at UCSFMC as well as the frequency of self-report of work hours according to program year. 

Qualitative review of EHR-derived data compared with schedule data showed that, although residents often reported homogenous daily work hours, EHR-derived work hours often varied as expected on a day-to-day basis according to the schedule (Appendix Table 2).
Because out-of-hospital EHR use does not count as work if done for educational purposes, we evaluated the proportion of out-of-hospital EHR use that is considered work and found that 67% of PGY-1, 50% of PGY-2, and 53% of PGY-3 out-of-hospital sessions included at least one work activity, as denoted in Appendix Table 1. Out-of-hospital work therefore represented 85% of PGY-1, 66% of PGY-2, and 73% of PGY-3 time spent in the EHR out-of-hospital. These sessions were counted towards work hours in accordance with ACGME rules and included 29% of PGY-1 workdays and 21% of PGY-2 and PGY-3 workdays. This amounted to a median of 1.0 hours per day (95% CI, 0.1-4.6 hours) of out-of-hospital work for PGY-1, 0.9 hours per day (95% CI, 0.1-4.1 hours) for PGY-2, and 0.8 hours per day (95% CI, 0.1-4.7 hours) for PGY-3 residents. Out-of-hospital logins that did not include work activities, as denoted in Appendix Table 1, were labeled out-of-hospital study and did not count towards work hours; this amounted to a median of 0.3 hours per day (95% CI, 0.02-1.6 hours) for PGY-1, 0.5 hours per day (95% CI, 0.04-0.25 hours) for PGY-2, and 0.3 hours per day (95% CI, 0.03-1.7 hours) for PGY-3. Mobile device logins also were not counted towards total work hours, with a median of 3 minutes per day for PGY-1, 6 minutes per day for PGY-2, and 5 minutes per day for PGY-3.
The percentage of rotation months where average hours worked exceeded 80 hours weekly is shown in Table 2. Inclusion of out-of-hospital work hours substantially increased the frequency at which the 80-hour workweek was exceeded. The frequency of individual residents working more than 80 hours weekly on average is shown in Appendix Figure 3. A narrow majority of PGY-1 and PGY-2 trainees and a larger majority of PGY-3 trainees never worked in excess of 80 hours per week when averaged over the course of a rotation, but several trainees did on several occasions.

Estimations from the computational method were built into a dashboard for use as screening tool by residency program directors (Appendix Figure 4).
DISCUSSION
EHR log data can be used to automate measurement of trainee work hours, providing timely data to program directors for identifying residents at risk of exceeding work hours limits. We demonstrated this by developing a data-driven approach to link on-campus logins that can be replicated in other training programs. We further demonstrated that out-of-hospital work substantially contributed to resident work hours and the frequency with which they exceed the 80-hour workweek, making it a critical component of any work hour estimation approach. Inclusive of out-of-hospital work, our computational method found that residents exceeded the 80-hour workweek 10% to 21% of the time, depending on their year in residency, with a small majority of residents never exceeding the 80-hour workweek.
Historically, most ACGME residency programs have relied on resident self-report to determine work hours.3 The validity of this method has been extensively studied and results remain mixed; in some surveys, residents admit to underreporting their hours while other validation studies, including the use of clock-in and clock-out or time-stamped parking data, align with self-report relatively well.10-12 Regardless of the reliability of self-report, it is a cumbersome task that residents have difficulty adhering to, as shown in our study, where only slightly more than one-half of the days worked had associated self-report. By relying on resident self-report, we are adding to the burden of clerical work, which is associated with physician burnout.13 Furthermore, because self-report typically does not happen in real-time, it limits a program’s ability to intervene on recent or impending work-hour violations. Our computational method enabled us to build a dashboard that is updated daily and provides critical insight into resident work hours at any time, without waiting for retrospective self-report.
Our study builds on previous work by Dziorny et al using EHR log data to algorithmically measure in-hospital work.5 In their study, the authors isolated shifts with a login gap of 4 hours and then combined shifts according to a set of heuristics. However, their logic integrated an extensive workflow analysis of trainee shifts, which might limit generalizability.5 Our approach computationally derives the temporal threshold for linking EHR sessions, which in our data was 5 hours but might differ at other sites. Automated derivation of this threshold will support generalizability to other programs and sites, although programs will still need to manually account for off-site work such as didactics. In a subsequent study evaluating the 80-hour workweek, Dziorny et al evaluated shift duration and appropriate time-off between shifts and found systematic underreporting of work.14 In our study, we prioritized evaluation of the 80-hour workweek and found general alignment between self-report and EHR-derived work-hour estimates, with a tendency to underestimate at lower reported work hours and overestimate at higher reported work hours (potentially because of underreporting as illustrated by Dziorny et al). We included the important out-of-hospital logins as discrete work events because out-of-hospital work contributes to the total hours worked and to the number of workweeks that exceed the 80-hour workweek, and might contribute to burnout.15 The incidence of exceeding the 80-hour workweek increased by 7% to 8% across all residents when out-of-hospital work was included, demonstrating that tools such as ResQ (ResQ Medical) that rely primarily on geolocation data might not sufficiently capture the ways in which residents spend their time working.16
Our approach has limitations. We determined on-campus vs out-of-hospital locations based on whether the login device belonged to the medical center or was a personal computer. Consequently, if trainees exclusively used a personal computer while on-campus and never used a medical center computer, we would have captured this work done while logged into the EHR but would not have inferred on-campus work. Although nearly all trainees in our organization use medical center computers throughout the day, this might impact generalizability for programs where trainees use personal computers exclusively in the hospital. Our approach also assumes trainees will use the EHR at the beginning and end of their workdays, which could lead to underestimation of work hours in trainees who do not employ this practice. With regards to work done on personal computers, our heuristic required that at least one work activity (as denoted in Appendix Table 1) be included in the session in order for it to count as work. Although this approach allows us to exclude sessions where trainees might be reviewing charts exclusively for educational purposes, it is difficult to infer the true intent of chart review.
There might be periods of time where residents are doing in-hospital work but more than 5 hours elapsed between EHR user sessions. As we have started adapting this computational method for other residency programs, we have added logic that allows for long periods of time in the operating room to be considered part of a continuous workday. There also are limitations to assigning blocks of time to off-site clinics; clinics that are associated with after-hours work but use a different EHR would not be captured in total out-of-hospital work.
Although correlation with self-report was good, we identified clusters of inaccuracy. This likely resulted from our residency program covering three medical centers, two of which were not included in the data set. For example, if a resident had an off-site clinic that was not accounted for in AMiON, EHR-derived work hours might have been underestimated relative to self-report. Operationally leveraging an automated system for measuring work hours in the form of dashboards and other tools could provide the impetus to ensure accurate documentation of schedule anomalies.
CONCLUSION
Implementation of our EHR-derived work-hour model will allow ACGME residency programs to understand and act upon trainee work-hour violations closer to real time, as the data extraction is daily and automated. Automation will save busy residents a cumbersome task, provide more complete data than self-report, and empower residency programs to intervene quickly to support overworked trainees.
Acknowledgments
The authors thank Drs Bradley Monash, Larissa Thomas, and Rebecca Berman for providing residency program input.
1. Accreditation Council for Graduate Medical Education. Common program requirements. Accessed August 12, 2020. https://www.acgme.org/What-We-Do/Accreditation/Common-Program-Requirements
2. Accreditation Council for Graduate Medical Education. Resident/fellow and faculty surveys. Accessed August 12, 2020. https://www.acgme.org/Data-Collection-Systems/Resident-Fellow-and-Faculty-Surveys
3. Petre M, Geana R, Cipparrone N, et al. Comparing electronic and manual tracking systems for monitoring resident duty hours. Ochsner J. 2016;16(1):16-21.
4. Gonzalo JD, Yang JJ, Ngo L, Clark A, Reynolds EE, Herzig SJ. Accuracy of residents’ retrospective perceptions of 16-hour call admitting shift compliance and characteristics. Grad Med Educ. 2013;5(4):630-633. https://doi.org/10.4300/jgme-d-12-00311.1
5. Dziorny AC, Orenstein EW, Lindell RB, Hames NA, Washington N, Desai B. Automatic detection of front-line clinician hospital shifts: a novel use of electronic health record timestamp data. Appl Clin Inform. 2019;10(1):28-37. https://doi.org/10.1055/s-0038-1676819
6. Gardner RL, Cooper E, Haskell J, et al. Physician stress and burnout: the impact of health information technology. J Am Med Inform Assoc. 2019;26(2):106-114. https://doi.org/10.1093/jamia/ocy145
7. MedHub. Accessed April 7, 2021. https://www.medhub.com
8. AMiON. Accessed April 7, 2021. https://www.amion.com
9. Seabold S, Perktold J. Statsmodels: econometric and statistical modeling with python. Proceedings of the 9th Python in Science Conference. https://conference.scipy.org/proceedings/scipy2010/pdfs/seabold.pdf
10. Todd SR, Fahy BN, Paukert JL, Mersinger D, Johnson ML, Bass BL. How accurate are self-reported resident duty hours? J Surg Educ. 2010;67(2):103-107. https://doi.org/10.1016/j.jsurg.2009.08.004
11. Chadaga SR, Keniston A, Casey D, Albert RK. Correlation between self-reported resident duty hours and time-stamped parking data. J Grad Med Educ. 2012;4(2):254-256. https://doi.org/10.4300/JGME-D-11-00142.1
12. Drolet BC, Schwede M, Bishop KD, Fischer SA. Compliance and falsification of duty hours: reports from residents and program directors. J Grad Med Educ. 2013;5(3):368-373. https://doi.org/10.4300/JGME-D-12-00375.1
13. Shanafelt TD, Dyrbye LN, West CP. Addressing physician burnout: the way forward. JAMA. 2017;317(9):901. https://doi.org/10.1001/jama.2017.0076
14. Dziorny AC, Orenstein EW, Lindell RB, Hames NA, Washington N, Desai B. Pediatric trainees systematically under-report duty hour violations compared to electronic health record defined shifts. PLOS ONE. 2019;14(12):e0226493. https://doi.org/10.1371/journal.pone.0226493
15. Saag HS, Shah K, Jones SA, Testa PA, Horwitz LI. Pajama time: working after work in the electronic health record. J Gen Intern Med. 2019;34(9):1695-1696. https://doi.org/10.1007/s11606-019-05055-x
16. ResQ Medical. Accessed April 7, 2021. https://resqmedical.com
Across the country, residents are bound to a set of rules from the Accreditation Council for Graduate Medical Education (ACGME) designed to mini mize fatigue, maintain quality of life, and reduce fatigue-related patient safety events. Adherence to work hours regulations is required to maintain accreditation. Among other guidelines, residents are required to work fewer than 80 hours per week on average over 4 consecutive weeks.1 When work hour violations occur, programs risk citation, penalties, and harm to the program’s reputation.
Residents self-report their adherence to program regulations in an annual survey conducted by the ACGME.2 To collect more frequent data, most training programs monitor resident work hours through self-report on an electronic tracking platform.3 These data generally are used internally to identify problems and opportunities for improvement. However, self-report approaches are subject to imperfect recall and incomplete reporting, and require time and effort to complete.4
The widespread adoption of electronic health records (EHRs) brings new opportunity to measure and promote adherence to work hours. EHR log data capture when users log in and out of the system, along with their location and specific actions. These data offer a compelling alternative to self-report because they are already being collected and can be analyzed almost immediately. Recent studies using EHR log data to approximate resident work hours in a pediatric hospital successfully approximated scheduled hours, but the approach was customized to their hospital’s workflows and might not generalize to other settings.5 Furthermore, earlier studies have not captured evening out-of-hospital work, which contributes to total work hours and is associated with physician burnout.6
We developed a computational method that sought to accurately capture work hours, including out-of-hospital work, which could be used as a screening tool to identify at-risk residents and rotations in near real-time. We estimated work hours, including EHR and non-EHR work, from these EHR data and compared these daily estimations to self-report. We then used a heuristic to estimate the frequency of exceeding the 80-hour workweek in a large internal medicine residency program.
METHODS
The population included 82 internal medicine interns (PGY-1) and 121 residents (PGY-2 = 60, PGY-3 = 61) who rotated through University of California, San Francisco Medical Center (UCSFMC) between July 1, 2018, and June 30, 2019, on inpatient rotations. In the UCSF internal medicine residency program, interns spend an average of 5 months per year and residents spend an average of 2 months per year on inpatient rotations at UCSFMC. Scheduled inpatient rotations generally are in 1-month blocks and include general medical wards, cardiology, liver transplant, night-float, and a procedures and jeopardy rotation where interns perform procedures at UCSFMC and serve as backup for their colleagues across sites. Although expected shift duration differs by rotation, types of shifts include regular length days, call days that are not overnight (but expected duration of work is into the late evening), 28-hour overnight call (PGY-2 and PGY-3), and night-float.
Data Source
This computational method was developed at UCSFMC. This study was approved by the University of California, San Francisco institutional review board. Using the UCSF Epic Clarity database, EHR access log data were obtained, including all Epic logins/logoffs, times, and access devices. Access devices identified included medical center computers, personal computers, and mobile devices.
Trainees self-report their work hours in MedHub, a widely used electronic tracking platform for self-report of resident work hours.7 Data were extracted from this database for interns and residents who matched the criteria above. The self-report data were considered the gold standard for comparison, because it is the best available despite its known limitations.
We used data collected from UCSF’s physician scheduling platform, AMiON, to identify interns and residents assigned to rotations at UCSF hospitals.8 AMiON also was used to capture half-days of off-site scheduled clinics and teaching, which count toward the workday but would not be associated with on-campus logins.
Developing a Computational Method to Measure Work Hours
We developed a heuristic to accomplish two goals: (1) infer the duration of continuous in-hospital work hours while providing clinical care and (2) measure “out-of-hospital” work. Logins from medical center computers were considered to be “on-campus” work. Logins from personal computers were considered to be “out-of-hospital.” “Out-of-hospital” login sessions were further subdivided into “out-of-hospital work” and “out-of-hospital study” based on activity during the session; if any work activities listed in Appendix Table 1 were performed, the session was attributed to work. If only chart review was performed, the session was attributed to study and did not count towards total hours worked. Logins from mobile devices also did not count towards total hours worked.
We inferred continuous in-hospital work by linking on-campus EHR sessions from the first on-campus login until the last on-campus logoff (Figure 1).
If there was overlapping time measurement between on-campus work and personal computer logins (for example, a resident was inferred to be doing on-campus work based on frequent medical center computer logins but there were also logins from personal computers), we inferred this to indicate that a personal device had been brought on-campus and the time was only attributed to on-campus work and was not double counted as out-of-hospital work. Out-of-hospital work that did not overlap with inferred on-campus work time contributed to the total hours worked in a week, consistent with ACGME guidelines.
Our internal medicine residents work at three hospitals: UCSFMC and two affiliated teaching hospitals. Although this study measured work hours while the residents were on an inpatient rotation at UCSFMC, trainees also might have occasional half-day clinics or teaching activities at other sites not captured by these EHR log data. The allocated time for that scheduled activity (extracted from AMiON) was counted as work hours. If the trainee was assigned to a morning half-day of off-site work (eg, didactics), this was counted the same as an 8
Comparison of EHR-Derived Work Hours Heuristic to Self-Report
Because resident adherence with daily self-report is imperfect, we compared EHR-derived work to self-report on days when both were available. We generated scatter plots of EHR-derived work hours compared with self-report and calculated the mean absolute error of estimation. We fit a linear mixed-effect model for each PGY, modeling self-reported hours as a linear function of estimated hours (fixed effect) with a random intercept (random effect) for each trainee to account for variations among individuals. StatsModels, version 0.11.1, was used for statistical analyses.9
We reviewed detailed data from outlier clusters to understand situations where the heuristic might not perform optimally. To assess whether EHR-derived work hours reasonably overlapped with expected shifts, 20 8-day blocks from separate interns and residents were randomly selected for qualitative detail review in comparison with AMiON schedule data.
Estimating Hours Worked and Work Hours Violations
After validating against self-report on a daily basis, we used our heuristic to infer the average rate at which the 80-hour workweek was exceeded across all inpatient rotations at UCSFMC. This was determined both including “out-of-hospital” work as derived from logins on personal computers and excluding it. Using the estimated daily hours worked, we built a near real-time dashboard to assist program leadership with identifying at-risk trainees and trends across the program.
RESULTS
Data from 82 interns (PGY-1) and 121 internal medicine residents (PGY-2 and PGY-3) who rotated at UCSFMC between July 1, 2018, and June 30, 2019, were included in the study. Table 1 shows the number of days and rotations worked at UCSFMC as well as the frequency of self-report of work hours according to program year.
Qualitative review of EHR-derived data compared with schedule data showed that, although residents often reported homogenous daily work hours, EHR-derived work hours often varied as expected on a day-to-day basis according to the schedule (Appendix Table 2).
Because out-of-hospital EHR use does not count as work if done for educational purposes, we evaluated the proportion of out-of-hospital EHR use that is considered work and found that 67% of PGY-1, 50% of PGY-2, and 53% of PGY-3 out-of-hospital sessions included at least one work activity, as denoted in Appendix Table 1. Out-of-hospital work therefore represented 85% of PGY-1, 66% of PGY-2, and 73% of PGY-3 time spent in the EHR out-of-hospital. These sessions were counted towards work hours in accordance with ACGME rules and included 29% of PGY-1 workdays and 21% of PGY-2 and PGY-3 workdays. This amounted to a median of 1.0 hours per day (95% CI, 0.1-4.6 hours) of out-of-hospital work for PGY-1, 0.9 hours per day (95% CI, 0.1-4.1 hours) for PGY-2, and 0.8 hours per day (95% CI, 0.1-4.7 hours) for PGY-3 residents. Out-of-hospital logins that did not include work activities, as denoted in Appendix Table 1, were labeled out-of-hospital study and did not count towards work hours; this amounted to a median of 0.3 hours per day (95% CI, 0.02-1.6 hours) for PGY-1, 0.5 hours per day (95% CI, 0.04-0.25 hours) for PGY-2, and 0.3 hours per day (95% CI, 0.03-1.7 hours) for PGY-3. Mobile device logins also were not counted towards total work hours, with a median of 3 minutes per day for PGY-1, 6 minutes per day for PGY-2, and 5 minutes per day for PGY-3.
The percentage of rotation months where average hours worked exceeded 80 hours weekly is shown in Table 2. Inclusion of out-of-hospital work hours substantially increased the frequency at which the 80-hour workweek was exceeded. The frequency of individual residents working more than 80 hours weekly on average is shown in Appendix Figure 3. A narrow majority of PGY-1 and PGY-2 trainees and a larger majority of PGY-3 trainees never worked in excess of 80 hours per week when averaged over the course of a rotation, but several trainees did on several occasions.
Estimations from the computational method were built into a dashboard for use as screening tool by residency program directors (Appendix Figure 4).
DISCUSSION
EHR log data can be used to automate measurement of trainee work hours, providing timely data to program directors for identifying residents at risk of exceeding work hours limits. We demonstrated this by developing a data-driven approach to link on-campus logins that can be replicated in other training programs. We further demonstrated that out-of-hospital work substantially contributed to resident work hours and the frequency with which they exceed the 80-hour workweek, making it a critical component of any work hour estimation approach. Inclusive of out-of-hospital work, our computational method found that residents exceeded the 80-hour workweek 10% to 21% of the time, depending on their year in residency, with a small majority of residents never exceeding the 80-hour workweek.
Historically, most ACGME residency programs have relied on resident self-report to determine work hours.3 The validity of this method has been extensively studied and results remain mixed; in some surveys, residents admit to underreporting their hours while other validation studies, including the use of clock-in and clock-out or time-stamped parking data, align with self-report relatively well.10-12 Regardless of the reliability of self-report, it is a cumbersome task that residents have difficulty adhering to, as shown in our study, where only slightly more than one-half of the days worked had associated self-report. By relying on resident self-report, we are adding to the burden of clerical work, which is associated with physician burnout.13 Furthermore, because self-report typically does not happen in real-time, it limits a program’s ability to intervene on recent or impending work-hour violations. Our computational method enabled us to build a dashboard that is updated daily and provides critical insight into resident work hours at any time, without waiting for retrospective self-report.
Our study builds on previous work by Dziorny et al using EHR log data to algorithmically measure in-hospital work.5 In their study, the authors isolated shifts with a login gap of 4 hours and then combined shifts according to a set of heuristics. However, their logic integrated an extensive workflow analysis of trainee shifts, which might limit generalizability.5 Our approach computationally derives the temporal threshold for linking EHR sessions, which in our data was 5 hours but might differ at other sites. Automated derivation of this threshold will support generalizability to other programs and sites, although programs will still need to manually account for off-site work such as didactics. In a subsequent study evaluating the 80-hour workweek, Dziorny et al evaluated shift duration and appropriate time-off between shifts and found systematic underreporting of work.14 In our study, we prioritized evaluation of the 80-hour workweek and found general alignment between self-report and EHR-derived work-hour estimates, with a tendency to underestimate at lower reported work hours and overestimate at higher reported work hours (potentially because of underreporting as illustrated by Dziorny et al). We included the important out-of-hospital logins as discrete work events because out-of-hospital work contributes to the total hours worked and to the number of workweeks that exceed the 80-hour workweek, and might contribute to burnout.15 The incidence of exceeding the 80-hour workweek increased by 7% to 8% across all residents when out-of-hospital work was included, demonstrating that tools such as ResQ (ResQ Medical) that rely primarily on geolocation data might not sufficiently capture the ways in which residents spend their time working.16
Our approach has limitations. We determined on-campus vs out-of-hospital locations based on whether the login device belonged to the medical center or was a personal computer. Consequently, if trainees exclusively used a personal computer while on-campus and never used a medical center computer, we would have captured this work done while logged into the EHR but would not have inferred on-campus work. Although nearly all trainees in our organization use medical center computers throughout the day, this might impact generalizability for programs where trainees use personal computers exclusively in the hospital. Our approach also assumes trainees will use the EHR at the beginning and end of their workdays, which could lead to underestimation of work hours in trainees who do not employ this practice. With regards to work done on personal computers, our heuristic required that at least one work activity (as denoted in Appendix Table 1) be included in the session in order for it to count as work. Although this approach allows us to exclude sessions where trainees might be reviewing charts exclusively for educational purposes, it is difficult to infer the true intent of chart review.
There might be periods of time where residents are doing in-hospital work but more than 5 hours elapsed between EHR user sessions. As we have started adapting this computational method for other residency programs, we have added logic that allows for long periods of time in the operating room to be considered part of a continuous workday. There also are limitations to assigning blocks of time to off-site clinics; clinics that are associated with after-hours work but use a different EHR would not be captured in total out-of-hospital work.
Although correlation with self-report was good, we identified clusters of inaccuracy. This likely resulted from our residency program covering three medical centers, two of which were not included in the data set. For example, if a resident had an off-site clinic that was not accounted for in AMiON, EHR-derived work hours might have been underestimated relative to self-report. Operationally leveraging an automated system for measuring work hours in the form of dashboards and other tools could provide the impetus to ensure accurate documentation of schedule anomalies.
CONCLUSION
Implementation of our EHR-derived work-hour model will allow ACGME residency programs to understand and act upon trainee work-hour violations closer to real time, as the data extraction is daily and automated. Automation will save busy residents a cumbersome task, provide more complete data than self-report, and empower residency programs to intervene quickly to support overworked trainees.
Acknowledgments
The authors thank Drs Bradley Monash, Larissa Thomas, and Rebecca Berman for providing residency program input.
1. Accreditation Council for Graduate Medical Education. Common program requirements. Accessed August 12, 2020. https://www.acgme.org/What-We-Do/Accreditation/Common-Program-Requirements
2. Accreditation Council for Graduate Medical Education. Resident/fellow and faculty surveys. Accessed August 12, 2020. https://www.acgme.org/Data-Collection-Systems/Resident-Fellow-and-Faculty-Surveys
3. Petre M, Geana R, Cipparrone N, et al. Comparing electronic and manual tracking systems for monitoring resident duty hours. Ochsner J. 2016;16(1):16-21.
4. Gonzalo JD, Yang JJ, Ngo L, Clark A, Reynolds EE, Herzig SJ. Accuracy of residents’ retrospective perceptions of 16-hour call admitting shift compliance and characteristics. Grad Med Educ. 2013;5(4):630-633. https://doi.org/10.4300/jgme-d-12-00311.1
5. Dziorny AC, Orenstein EW, Lindell RB, Hames NA, Washington N, Desai B. Automatic detection of front-line clinician hospital shifts: a novel use of electronic health record timestamp data. Appl Clin Inform. 2019;10(1):28-37. https://doi.org/10.1055/s-0038-1676819
6. Gardner RL, Cooper E, Haskell J, et al. Physician stress and burnout: the impact of health information technology. J Am Med Inform Assoc. 2019;26(2):106-114. https://doi.org/10.1093/jamia/ocy145
7. MedHub. Accessed April 7, 2021. https://www.medhub.com
8. AMiON. Accessed April 7, 2021. https://www.amion.com
9. Seabold S, Perktold J. Statsmodels: econometric and statistical modeling with python. Proceedings of the 9th Python in Science Conference. https://conference.scipy.org/proceedings/scipy2010/pdfs/seabold.pdf
10. Todd SR, Fahy BN, Paukert JL, Mersinger D, Johnson ML, Bass BL. How accurate are self-reported resident duty hours? J Surg Educ. 2010;67(2):103-107. https://doi.org/10.1016/j.jsurg.2009.08.004
11. Chadaga SR, Keniston A, Casey D, Albert RK. Correlation between self-reported resident duty hours and time-stamped parking data. J Grad Med Educ. 2012;4(2):254-256. https://doi.org/10.4300/JGME-D-11-00142.1
12. Drolet BC, Schwede M, Bishop KD, Fischer SA. Compliance and falsification of duty hours: reports from residents and program directors. J Grad Med Educ. 2013;5(3):368-373. https://doi.org/10.4300/JGME-D-12-00375.1
13. Shanafelt TD, Dyrbye LN, West CP. Addressing physician burnout: the way forward. JAMA. 2017;317(9):901. https://doi.org/10.1001/jama.2017.0076
14. Dziorny AC, Orenstein EW, Lindell RB, Hames NA, Washington N, Desai B. Pediatric trainees systematically under-report duty hour violations compared to electronic health record defined shifts. PLOS ONE. 2019;14(12):e0226493. https://doi.org/10.1371/journal.pone.0226493
15. Saag HS, Shah K, Jones SA, Testa PA, Horwitz LI. Pajama time: working after work in the electronic health record. J Gen Intern Med. 2019;34(9):1695-1696. https://doi.org/10.1007/s11606-019-05055-x
16. ResQ Medical. Accessed April 7, 2021. https://resqmedical.com
© 2021 Society of Hospital Medicine
Implementation of a Pharmacist-Managed Transitions of Care Tool
Effective transitions of care (TOC) are essential to ensure quality continuity of care after hospital discharge. About 20 to 30% of patients experience an adverse event (AE) in the peridischarge period when discharged to the community.1 Additionally, about two-thirds of AEs are preventable.1 The Joint Commission has identified various breakdowns in care that are associated with poor outcomes, including a lack of standardized discharge procedures, limited time dedicated to discharge planning and processes, and patients who lack the necessary resources or skills to implement discharge care plans.2
Background
The most impactful TOC programs are those that target patients who are at high risk for readmission or adverse outcomes.3 Factors such as advanced age, polypharmacy, cognitive impairment, and lack of social support are patient characteristics that have been associated with unfavorable outcomes after discharge.4 To identify this subset of high-risk individuals, various risk assessment scores have been developed, ranging from those that are used locally at the facility level to those that are nationally validated. The LACE score (Length of hospital stay; Acuity of the admission; Comorbidities measured with the Charlson comorbidity index score; and Emergency department visits within the past 6 months) is a validated index scoring tool that is used to identify medical and surgical patients at risk for readmission or death within 30 days of hospital discharge. On a 19-point scale, a score of ≥ 10 is considered high risk.5 Specific to the US Department of Veterans Affairs (VA), the Care Assessment Needs (CAN) score was developed to risk stratify the veteran population. The CAN score is generated using information including patient demographics, medical conditions, VA health care utilization, vital signs, laboratory values, medications, and socioeconomic status. This score is expressed as a percentile that compares the probability of death or admission among veterans at 90 days and 1 year postdischarge. Veterans in the 99th percentile have a 74% risk for these adverse outcomes at 1 year.6
The Joint Commission states that a fundamental component to assuring safe and effective TOC is medication management, which includes the involvement of pharmacists.2 TOC programs with pharmacist involvement have shown significant improvements related to reduced 30-day hospital readmissions and health care costs in addition to significant medication-related interventions.7-9 While this body of evidence continues to grow and demonstrates that pharmacists are an integral component of the TOC process, there is no gold standard program. Brantley and colleagues noted that a weakness of many TOC programs is that they are one dimensional, meaning that they focus on only 1 element of care transitions or 1 specific patient population or disease.10
There is well-supported evidence of high-impact interventions for pharmacists involved early in the admission process, but data are less robust on the discharge process. 11,12 Therefore, the primary focus of this project was to develop a pharmacist-based TOC program and implement a process for communicating high-risk patients who are discharging from our hospital across the continuum of care.
Setting
The Richard L. Roudebush VA Medical Center (RLRVAMC) is a tertiary care referral center for veterans in Indiana and eastern Illinois. Acute care clinical pharmacists are fully integrated into the acute care teams and practice under a comprehensive care model. Pharmacists attend daily patient care rounds and conduct discharge medication reconciliation for all patients with additional bedside counseling for patients who are being discharged home.
Primary care services are provided by patient aligned care teams (PACTs), multidisciplinary teams composed of physicians, advanced practice nurses, pharmacists, mental health care providers, registered nurses, dieticians, and care coordinators. Ambulatory Care or PACT clinical pharmacists are established within each RLRVAMC PACT clinic and provide comprehensive care management through an independent scope of practice for several chronic diseases, including hypertension, type 2 diabetes mellitus (T2DM), dyslipidemia, hypothyroidism, and tobacco cessation. Prior to this project implementation, there was no formalized or standardized method for facilitating routine communication of patients between acute care and PACT pharmacists in the TOC process.
Pilot Study
In 2017, RLRVAMC implemented a TOC pharmacy program pilot. A pharmacy resident and both acute care and PACT clinical pharmacy specialists (CPSs) developed the service. The pilot program was conducted from September 1, 2017 to March 1, 2018. The initial phase consisted of the development of an electronic TOC tool to standardize communication between acute care and PACT pharmacists. The TOC tool was created on a secure site accessible only to pharmacy personnel and not part of the formal medical record. (Figure 1).
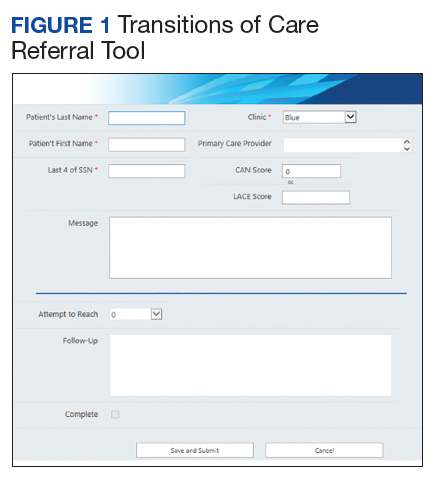
The acute care pharmacist identified high-risk patients through calculated CAN and LACE scores during the discharge process and offered PACT pharmacist follow-up to the patient during bedside discharge counseling. Information was then entered into the TOC tool, including patient identifiers and a message with specific information outlining the reason for referral. PACT pharmacists routinely reviewed the tool and attempted to phone each patient within 7 days of discharge. Follow-up included medication reconciliation and chronic disease management as warranted at the discretion of the PACT pharmacist. All postdischarge follow-up appointments were created and documented in the electronic health record. A retrospective chart review was completed on patients who were entered into the TOC tool.
Patients were eligible for referral if they were discharged during the study period with primary care established in one of the facility’s PACT clinics. Additionally, patients had to meet ≥ 1 of the following criteria, deeming them a high risk for readmission: LACE score ≥ 10, CAN score ≥ 90th percentile, or be considered high risk based on the discretion of the acute care pharmacist. Patients were included in the analysis if they met the CAN or LACE score requirement. Patients were excluded if they received primary care from a site other than a RLRVAMC PACT clinic. This included non-VA primary care, home-based primary care, or VA community-based outpatient clinics (CBOCs). Patients also were excluded if they required further institutional care postdischarge (ie, subacute rehabilitation, extended care facility, etc), discharged to hospice, or against medical advice.
The average referral rate per month during the pilot study was 19 patients, with 113 total referrals during the 6-month study period. Lower rates of index emergency department (ED) visits (5.3% vs 23.3%) and readmissions (1% vs 6.7%) were seen in the group of patients who received PACT pharmacist follow-up postdischarge compared with those who did not. Additionally, PACT pharmacists were able to make > 120 interventions, averaging 1.7 interventions per patient. Of note, these results were not statistically analyzed and were assessed as observational data to determine whether the program had the potential to be impactful. The results of the pilot study demonstrated positive outcomes associated with having a pharmacist-based TOC process and led to the desire for further development and implementation of the TOC program at the RLRVAMC. These positive results prompted a second phase project to address barriers, make improvements, and ensure sustainability.
Methods
Phase 2 was a quality improvement initiative; therefore, institutional review board approval was not needed. The aim of phase 2 was to improve, expand, and sustain the TOC program that was implemented in the pilot study. Barriers identified after discussion with acute care and PACT pharmacists included difficulty in making referrals due to required entry of cumbersome readmission risk factor calculations, limiting inclusion to patients who receive primary care at the main hospital facility, and the expansion of pharmacy staff with new pharmacists who were not knowledgeable of the referral process.
Design
To overcome barriers, 4 main targeted interventions were needed: streamlining the referral process, enhancing pharmacy staff education, updating the discharge note template, and expanding the criteria to include patients who receive care at VA CBOCs. The referral process was streamlined by removing required calculated readmission risk scores, allowing pharmacist judgement to take precedence for referrals. Focused face-to-face education was provided to acute care and PACT pharmacists about the referral process and inclusion criteria to increase awareness and provide guidance of who may benefit from entry into the tool. Unlike the first phase of the study, education was provided for outpatient staff pharmacists responsible for discharging patients on the weekends. Additionally, the pharmacists received a printed quick reference guide of the information covered during the education sessions (Figure 2). Referral prompts were embedded into the standard pharmacy discharge note template to serve as a reminder to discharging pharmacists to assess patients for inclusion into the tool and provided a direct link to the tool. Expansion to include VA CBOCs occurred postpilot study, allowing increased patient access to this TOC service. All other aspects of the program were continued from the pilot phase.
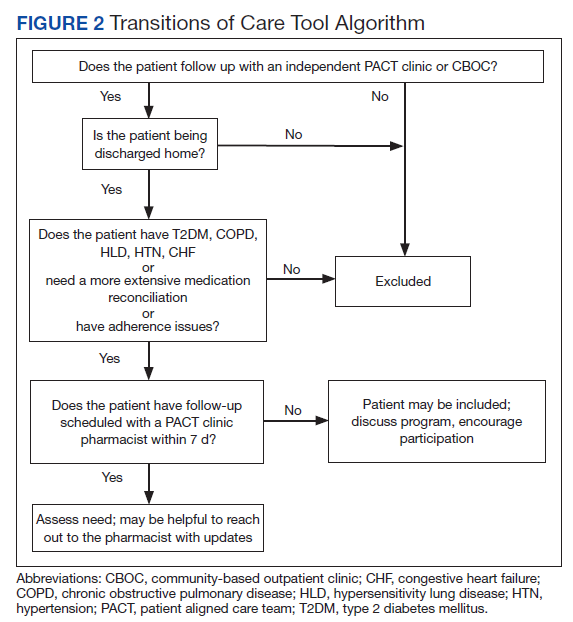
Patients were eligible if they were discharged from RLRVAMC between October 1, 2018 and February 28, 2019. Additionally, the patient had to be established in a PACT clinic for primary care and have been referred to the tool based on the discretion of an acute care pharmacist. Patients were excluded if they were discharged against medical advice or to any facility where the patient and/or caregiver would not be responsible for medication administration (eg, subacute rehabilitation, extended care facility), or if the patient refused pharmacy follow-up.
Outcomes
The primary outcomes assessed were all-cause and index ED visits and readmissions within 30 days of discharge. All-cause ED visits and readmissions were defined as a second visit to RLRVAMC , regardless of readmission diagnosis. Index ED visits and readmissions were defined as those that were related to the initial admission diagnosis. Additional data collected and analyzed included the number of patients referred by pharmacists, number and type of medication discrepancies, medication changes, counseling interventions, time to follow-up postdischarge, and number of patients added to the PACT pharmacist’s clinic schedule for further management. A discrepancy identified by a PACT pharmacist was defined as a difference between the discharge medication list and the patient-reported medication list at the time of follow-up. Patients who were referred to the TOC tool but were unable to be reached by telephone served as the control group for this study.
Data Collection
A retrospective chart review was completed on patients entered into the tool. Data were collected and kept in a secured Microsoft Excel workbook. Baseline characteristics were analyzed using either a χ2 for nominal data or Student t test for continuous data. The primary outcomes were analyzed using a χ2 test. All statistical tests were analyzed using MiniTab 19 Statistical Software.
Results
Pharmacists added 172 patients into the TOC tool; 139 patients met inclusion criteria. Of those excluded, most were because the PACT pharmacist did not attempt to contact the patient since they already had a primary care visit scheduled postdischarge (Table 1). Of the 139 patients who met the inclusion criteria, 99 were successfully contacted by a PACT pharmacist. Most patients were aged in their 60s, male, and white. Both groups had a similar quantity of outpatient medications on admission and medication changes made at discharge. Additionally, both groups had a similar number of patients with hospitalizations and/or ED visits in the 3 months before hospital admission that resulted in TOC tool referral (Table 2).
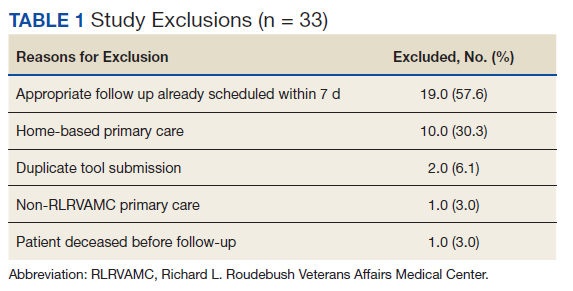
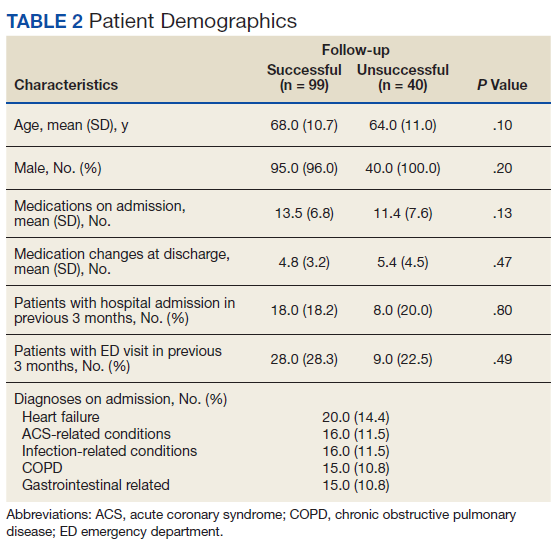
Hospital Readmission
Hospital 30-day readmission rates for patients who were successfully followed by pharmacy compared with those who were not were 5.1% vs 15.0% (P = .049) for index readmissions and 8.1% vs 27.5% (P = .03) for all-cause readmissions. No statistically significant difference existed between those patients with follow-up compared with those without follow-up for either index (10.1% vs 12.5%, respectively; P = .68) or for all-cause ED visit rates (15.2% vs 20.0%, respectively; P = .49).
Patient Encounters
The average time to follow-up was 8.8 days, which was above the predetermined goal of contact within 7 days. Additionally, this was a decline from the initial pilot study, which had an average time to reach of 4.7 days. All patients reached by a pharmacist received medication reconciliation, with ≥ 28% of patients having ≥ 1 discrepancy. There were 43 discrepancies among all patients. Of the discrepancies, 25 were reported as errors performed by the patient, and 18 were from an error during the discharge process. The discrepancies that resulted from patient error were primarily patients who took the wrong dose of prescribed medications. Other patient discrepancies included taking medications not as scheduled, omitting medications (both intentionally and mistakenly), continuing to take medications that had been discontinued by a health care provider and improper administration technique. Examples of provider errors that occurred during the discharge process included not ordering medications for patient to pick up at discharge, not discontinuing a medication from the patient’s profile, and failure to renew expired prescriptions.
Additional counseling was provided to 75% of patients: The most common reason for counseling was T2DM, hypertension, and dyslipidemia management. PACT pharmacists changed medication regimens for 27.3% of patients for improved control of chronic diseases or relief of medication AEs.
At the end of each visit, patients were assessed to determine whether they could benefit from additional pharmacy follow-up. Thirty-seven patients were added to the pharmacist schedules for disease management appointments. The most common conditions for these appointments were T2DM, hypertension, tobacco cessation, and hyperlipidemia. Among the 37 patients who had pharmacy follow-up, there were 137 additional pharmacy appointments within the study period.
Program Referrals
After expansion to include the VA CBOCs, elimination of the elevated LACE or CAN score requirement, and additional staff education, the rate of referrals per month increased during phase 2 in comparison to the pilot study (Figure 3). There were a mean (SD) of 34 (10) referrals per month. Although not statistically analyzed, it is an objective increase in comparison to a mean 19 referrals per month in the pilot study.
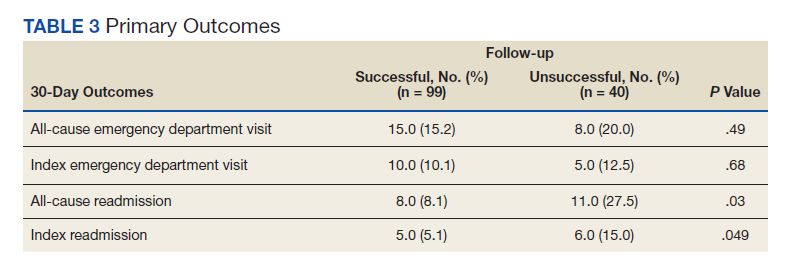
Discussion
The continued development and use of a pharmacist-driven TOC tool at RLRVAMC increased communication and follow-up of high-risk patients, demonstrated the ability of pharmacists to identify and intervene in medication-related issues postdischarge, and successfully reduce 30-day readmissions. This program emphasized pharmacist involvement during the discharge process and created a standardized mechanism for TOC follow-up, addressing multiple areas that were identified by The Joint Commission as being associated with poor outcomes. The advanced pharmacy practice model at RLRVAMC allowed for a multidimensional program, including prospective patient identification and multiple pharmacy touchpoints. This is unique in comparison to many of the one-dimensional programs described in the literature.
Polypharmacy has been identified as a major predictor of medication discrepancies postdischarge, and patients with ≥ 10 active medications have been found to be at highest risk.13,14 Patients in this study had a mean 13 active medications on admission, with a mean 5 medication changes at discharge. PACT pharmacists documented 28 of 99 patients with ≥ 1 medication-related discrepancy at postdischarge reconciliation. This 28% discrepancy rate is consistent with discrepancy rates previously reported in the literature, which ranged from 14 to 45% in large meta-analyses.14,15 The majority of these discrepancies (58%) were related to patients who took the wrong dose of a prescribed medication.
Targeted interventions to overcome barriers in the pilot study increased the referral rates to the TOC tool; however, the increase in referral rate was associated with increased time to follow up by ambulatory care pharmacists. The extended follow-up times were seen most often in the 2 busiest primary care clinics, one of which is considered a teaching clinic for medical residents. Pharmacists were required to integrate these calls into their normal work schedule and were not provided additional time for calling, allowing for an increased follow-up time. The increased follow-up time likely contributed to the increased number of patients excluded due to already having PACT follow-up, giving more time for the primary care provider to have an appointment with the patient. The ambulatory care pharmacist could then determine whether further intervention was needed. In the summer of 2018, a decrease in referral rates occurred for a short time, but this is likely explained by incoming new residents and staff within the pharmacy department and decreased awareness among the new staff. The enhanced staff education took place during September 2018 and lead to increased referral rates compared with those seen in months prior.
PACT pharmacists were not only able to identify discrepancies, but also provide timely intervention on a multitude of medication-related issues by using their scope of practice (SOP). Most interventions were related to medication or disease counseling, including lifestyle, device, and disease education. The independent SOP of our PACT pharmacists is a unique aspect of this program and allowed pharmacists to independently adjust many aspects of a patient’s medication regimen during follow-up visits.
The outcomes of 30-day index and all-cause readmissions, as well as index and all-cause ED visit rates, were lower in the subset of patients who received PACT pharmacist follow-up after discharge (Table 3). The difference was most pronounced in the all-cause readmission rates: Only 8.1% of patients who received PACT follow-up experienced a readmission compared with 27.5% of those who did not. The difference between the groups regarding ED visit rates were not as pronounced, but this may be attributed to a limited sample size. These data indicate that the role of the pharmacist in identifying discrepancies and performing interventions at follow-up may play a clinically significant part in reducing both ED visit rates and hospital readmissions.
Limitations
There are some limitations identified within this study. Although the referral criteria were relaxed from the pilot study and enhanced education was created, continued education regarding appropriate referral of TOC patients continues to be necessary given intermittent staff changeover, incorporation of pharmacy trainees, and modifications to clinic workflow. Patients who were discharged to facilities were not included. This ensured that appropriate and consistent PACT pharmacist follow-up would be available, but likely reduced our sample size.
Although performing this study in a closed health care system with pharmacists who have independent SOPs is a strength of our study, also it can limit generalizability. Not all facilities house both acute care and ambulatory care in one location with wide SOPs to allow for comprehensive and continued care. Last, this study used convenience sampling, potentially introducing selection bias, as patients unable to be reached by PACT pharmacists may inherently be at increased risk for hospital readmission. However, in the 3 months preceding the hospital admission that resulted in TOC tool referral, both groups had a similar number of patients with hospital admissions and ED visits.
The TOC tool has become fully integrated into the daily workflow for both acute care and PACT pharmacists. After the conclusion of the study period, the referral rates into the tool have been maintained at a steady level, even surpassing the rates seen during the study period. In comparison with the pilot study, PACT pharmacists reported a subjective increase in referrals placed for procedures such as medication reconciliation or adherence checks. This is likely because acute care pharmacists were able to use their clinical judgement rather than to rely solely on calculated readmission risk scores for TOC tool referral.
The success of the TOC program led to the expansion to other specialty areas. ED pharmacists now refer patients from the ED who were not admitted to the hospital but would benefit from PACT follow-up. Additionally, the option to refer hematology and oncology patients was added to allow these patients to be followed up by our hematology/oncology CPSs by phone appointments. Unique reasons for follow-up for this patient population include concerns about delayed chemotherapy cycles or chemotherapy-associated AEs.
Conclusions
This study outlines the creation and continued improvement of a pharmacist-based TOC program. The program was designed as a method of communication between acute care and PACT pharmacists about high-risk patients. The creation of this program allowed PACT pharmacists not only to identify discrepancies and make interventions on high-risk patients, but also demonstrate that having pharmacists involved in these programs may have a positive impact on readmissions and ED visits. The success of the TOC tool at the RLRVAMC has led to its expansion and is now an integral part of the daily workflow for both acute care and PACT pharmacists.
1. Forster AJ, Murff HJ, Peterson JF, Gandhi TK, Bates DW. The incidence and severity of adverse effects affecting patients after discharge from the hospital. Ann Intern Med. 2003;138(3):161-167. doi:10.7326/0003-4819-138-3-200302040-00007
2. The Joint Commission. Transitions of care: the need for collaboration across entire care continuum. Published February 2013. Accessed February 25, 2021. http://www.jointcommission.org/assets/1/6/TOC_Hot_Topics.pdf
3. Leppin AL, Gionfriddo MR, Kessler M, et al. Preventing 30-day hospital readmissions: a systematic review and meta-analysis of randomized trials. JAMA Intern Med. 2014;174(7):1095-1107. doi:10.1001/jamainternmed.2014.1608
4. Medicare Hospital Compare. Readmissions and deaths. Accessed February 25, 2021. https://www.cms.gov/Medicare/Quality-Initiatives-Patient-Assessment-Instruments/HospitalQualityInits/VA-Data
5. van Walraven C, Dhalla IA, Bell C, et al. Derivation and validation of an index to predict early death or unplanned readmission after discharge from hospital to the community. CMAJ. 2010;182(6):551-557. doi:10.1503/cmaj.091117
6. US Department of Veteran Affairs. Care Assessment Needs (CAN) score report. Updated May 14, 2019. Accessed February 25, 2021. https://www.va.gov/HEALTHCAREEXCELLENCE/about/organization/examples/care-assessment-needs.asp
7. Schnipper JL, Kirwin JL, Cotugno MC, et al. Role of pharmacist counseling in preventing adverse drug events after hospitalization. Arch Intern Med. 2006;166(5):565-571. doi:10.1001/archinte.166.5.565
8. Phatak A, Prusi R, Ward B, et al. Impact of pharmacist involvement in the transitional care of high-risk patients through medication reconciliation, medication education, and post-discharge call-backs. J Hosp Med. 2016;11(1):40-44. doi:10.1002/jhm.2493
9. Coleman EA, Min SJ, Chomiak A, Kramer AM. Posthospital care transitions: patterns, complications, and risk identification. Health Serv Res. 2004;39(5):1449-1465. doi:10.1111/j.1475-6773.2004.00298.x
10. Brantley AF, Rossi DM, Barnes-Warren S, Francisco JC, Schatten I, Dave V. Bridging gaps in care: implementation of a pharmacist-led transitions of care program. Am J Health Syst Pharm. 2018;75(5)(suppl 1):S1-S5. doi:10.2146/ajhp160652
11. Scarsi KK, Fotis MA, Noskin GA. Pharmacist participation in medical rounds reduces medical errors. Am J Health Syst Pharm. 2002;59(21):2089-2092. doi:10.1093/ajhp/59.21.2089
12. Pevnick JM, Nguyen C, Jackevicius CA, et al. Improving admission medication reconciliation with pharmacists or pharmacy technicians in the emergency department: a randomised controlled trial. BMJ Qual Saf. 2018;27:512-520. doi:10.1136/bmjqs-2017-006761.
13. Kirwin J, Canales AE, Bentley ML, et al; American College of Clinical Pharmacy. Process indicators of quality clinical pharmacy services during transitions of care. Pharmacotherapy. 2012;32(11):e338-e347. doi:10.1002/phar.1214
14. Kwan JL, Lo L, Sampson M, et al. Medication reconciliation during transitions of care as a patient safety strategy: a systematic review. Ann Intern Med. 2013;158(5, part 2):397-403. doi:10.7326/0003-4819-158-5-201303051-00006
15. Stitt DM, Elliot DP, Thompson SN. Medication discrepancies identified at time of hospital discharge in a geriatric population. Am J Geriatr Pharmacother. 2011;9(4):234-240. doi:10.1016/j.amjopharm.2011.06.002
Effective transitions of care (TOC) are essential to ensure quality continuity of care after hospital discharge. About 20 to 30% of patients experience an adverse event (AE) in the peridischarge period when discharged to the community.1 Additionally, about two-thirds of AEs are preventable.1 The Joint Commission has identified various breakdowns in care that are associated with poor outcomes, including a lack of standardized discharge procedures, limited time dedicated to discharge planning and processes, and patients who lack the necessary resources or skills to implement discharge care plans.2
Background
The most impactful TOC programs are those that target patients who are at high risk for readmission or adverse outcomes.3 Factors such as advanced age, polypharmacy, cognitive impairment, and lack of social support are patient characteristics that have been associated with unfavorable outcomes after discharge.4 To identify this subset of high-risk individuals, various risk assessment scores have been developed, ranging from those that are used locally at the facility level to those that are nationally validated. The LACE score (Length of hospital stay; Acuity of the admission; Comorbidities measured with the Charlson comorbidity index score; and Emergency department visits within the past 6 months) is a validated index scoring tool that is used to identify medical and surgical patients at risk for readmission or death within 30 days of hospital discharge. On a 19-point scale, a score of ≥ 10 is considered high risk.5 Specific to the US Department of Veterans Affairs (VA), the Care Assessment Needs (CAN) score was developed to risk stratify the veteran population. The CAN score is generated using information including patient demographics, medical conditions, VA health care utilization, vital signs, laboratory values, medications, and socioeconomic status. This score is expressed as a percentile that compares the probability of death or admission among veterans at 90 days and 1 year postdischarge. Veterans in the 99th percentile have a 74% risk for these adverse outcomes at 1 year.6
The Joint Commission states that a fundamental component to assuring safe and effective TOC is medication management, which includes the involvement of pharmacists.2 TOC programs with pharmacist involvement have shown significant improvements related to reduced 30-day hospital readmissions and health care costs in addition to significant medication-related interventions.7-9 While this body of evidence continues to grow and demonstrates that pharmacists are an integral component of the TOC process, there is no gold standard program. Brantley and colleagues noted that a weakness of many TOC programs is that they are one dimensional, meaning that they focus on only 1 element of care transitions or 1 specific patient population or disease.10
There is well-supported evidence of high-impact interventions for pharmacists involved early in the admission process, but data are less robust on the discharge process. 11,12 Therefore, the primary focus of this project was to develop a pharmacist-based TOC program and implement a process for communicating high-risk patients who are discharging from our hospital across the continuum of care.
Setting
The Richard L. Roudebush VA Medical Center (RLRVAMC) is a tertiary care referral center for veterans in Indiana and eastern Illinois. Acute care clinical pharmacists are fully integrated into the acute care teams and practice under a comprehensive care model. Pharmacists attend daily patient care rounds and conduct discharge medication reconciliation for all patients with additional bedside counseling for patients who are being discharged home.
Primary care services are provided by patient aligned care teams (PACTs), multidisciplinary teams composed of physicians, advanced practice nurses, pharmacists, mental health care providers, registered nurses, dieticians, and care coordinators. Ambulatory Care or PACT clinical pharmacists are established within each RLRVAMC PACT clinic and provide comprehensive care management through an independent scope of practice for several chronic diseases, including hypertension, type 2 diabetes mellitus (T2DM), dyslipidemia, hypothyroidism, and tobacco cessation. Prior to this project implementation, there was no formalized or standardized method for facilitating routine communication of patients between acute care and PACT pharmacists in the TOC process.
Pilot Study
In 2017, RLRVAMC implemented a TOC pharmacy program pilot. A pharmacy resident and both acute care and PACT clinical pharmacy specialists (CPSs) developed the service. The pilot program was conducted from September 1, 2017 to March 1, 2018. The initial phase consisted of the development of an electronic TOC tool to standardize communication between acute care and PACT pharmacists. The TOC tool was created on a secure site accessible only to pharmacy personnel and not part of the formal medical record. (Figure 1).
The acute care pharmacist identified high-risk patients through calculated CAN and LACE scores during the discharge process and offered PACT pharmacist follow-up to the patient during bedside discharge counseling. Information was then entered into the TOC tool, including patient identifiers and a message with specific information outlining the reason for referral. PACT pharmacists routinely reviewed the tool and attempted to phone each patient within 7 days of discharge. Follow-up included medication reconciliation and chronic disease management as warranted at the discretion of the PACT pharmacist. All postdischarge follow-up appointments were created and documented in the electronic health record. A retrospective chart review was completed on patients who were entered into the TOC tool.
Patients were eligible for referral if they were discharged during the study period with primary care established in one of the facility’s PACT clinics. Additionally, patients had to meet ≥ 1 of the following criteria, deeming them a high risk for readmission: LACE score ≥ 10, CAN score ≥ 90th percentile, or be considered high risk based on the discretion of the acute care pharmacist. Patients were included in the analysis if they met the CAN or LACE score requirement. Patients were excluded if they received primary care from a site other than a RLRVAMC PACT clinic. This included non-VA primary care, home-based primary care, or VA community-based outpatient clinics (CBOCs). Patients also were excluded if they required further institutional care postdischarge (ie, subacute rehabilitation, extended care facility, etc), discharged to hospice, or against medical advice.
The average referral rate per month during the pilot study was 19 patients, with 113 total referrals during the 6-month study period. Lower rates of index emergency department (ED) visits (5.3% vs 23.3%) and readmissions (1% vs 6.7%) were seen in the group of patients who received PACT pharmacist follow-up postdischarge compared with those who did not. Additionally, PACT pharmacists were able to make > 120 interventions, averaging 1.7 interventions per patient. Of note, these results were not statistically analyzed and were assessed as observational data to determine whether the program had the potential to be impactful. The results of the pilot study demonstrated positive outcomes associated with having a pharmacist-based TOC process and led to the desire for further development and implementation of the TOC program at the RLRVAMC. These positive results prompted a second phase project to address barriers, make improvements, and ensure sustainability.
Methods
Phase 2 was a quality improvement initiative; therefore, institutional review board approval was not needed. The aim of phase 2 was to improve, expand, and sustain the TOC program that was implemented in the pilot study. Barriers identified after discussion with acute care and PACT pharmacists included difficulty in making referrals due to required entry of cumbersome readmission risk factor calculations, limiting inclusion to patients who receive primary care at the main hospital facility, and the expansion of pharmacy staff with new pharmacists who were not knowledgeable of the referral process.
Design
To overcome barriers, 4 main targeted interventions were needed: streamlining the referral process, enhancing pharmacy staff education, updating the discharge note template, and expanding the criteria to include patients who receive care at VA CBOCs. The referral process was streamlined by removing required calculated readmission risk scores, allowing pharmacist judgement to take precedence for referrals. Focused face-to-face education was provided to acute care and PACT pharmacists about the referral process and inclusion criteria to increase awareness and provide guidance of who may benefit from entry into the tool. Unlike the first phase of the study, education was provided for outpatient staff pharmacists responsible for discharging patients on the weekends. Additionally, the pharmacists received a printed quick reference guide of the information covered during the education sessions (Figure 2). Referral prompts were embedded into the standard pharmacy discharge note template to serve as a reminder to discharging pharmacists to assess patients for inclusion into the tool and provided a direct link to the tool. Expansion to include VA CBOCs occurred postpilot study, allowing increased patient access to this TOC service. All other aspects of the program were continued from the pilot phase.
Patients were eligible if they were discharged from RLRVAMC between October 1, 2018 and February 28, 2019. Additionally, the patient had to be established in a PACT clinic for primary care and have been referred to the tool based on the discretion of an acute care pharmacist. Patients were excluded if they were discharged against medical advice or to any facility where the patient and/or caregiver would not be responsible for medication administration (eg, subacute rehabilitation, extended care facility), or if the patient refused pharmacy follow-up.
Outcomes
The primary outcomes assessed were all-cause and index ED visits and readmissions within 30 days of discharge. All-cause ED visits and readmissions were defined as a second visit to RLRVAMC , regardless of readmission diagnosis. Index ED visits and readmissions were defined as those that were related to the initial admission diagnosis. Additional data collected and analyzed included the number of patients referred by pharmacists, number and type of medication discrepancies, medication changes, counseling interventions, time to follow-up postdischarge, and number of patients added to the PACT pharmacist’s clinic schedule for further management. A discrepancy identified by a PACT pharmacist was defined as a difference between the discharge medication list and the patient-reported medication list at the time of follow-up. Patients who were referred to the TOC tool but were unable to be reached by telephone served as the control group for this study.
Data Collection
A retrospective chart review was completed on patients entered into the tool. Data were collected and kept in a secured Microsoft Excel workbook. Baseline characteristics were analyzed using either a χ2 for nominal data or Student t test for continuous data. The primary outcomes were analyzed using a χ2 test. All statistical tests were analyzed using MiniTab 19 Statistical Software.
Results
Pharmacists added 172 patients into the TOC tool; 139 patients met inclusion criteria. Of those excluded, most were because the PACT pharmacist did not attempt to contact the patient since they already had a primary care visit scheduled postdischarge (Table 1). Of the 139 patients who met the inclusion criteria, 99 were successfully contacted by a PACT pharmacist. Most patients were aged in their 60s, male, and white. Both groups had a similar quantity of outpatient medications on admission and medication changes made at discharge. Additionally, both groups had a similar number of patients with hospitalizations and/or ED visits in the 3 months before hospital admission that resulted in TOC tool referral (Table 2).
Hospital Readmission
Hospital 30-day readmission rates for patients who were successfully followed by pharmacy compared with those who were not were 5.1% vs 15.0% (P = .049) for index readmissions and 8.1% vs 27.5% (P = .03) for all-cause readmissions. No statistically significant difference existed between those patients with follow-up compared with those without follow-up for either index (10.1% vs 12.5%, respectively; P = .68) or for all-cause ED visit rates (15.2% vs 20.0%, respectively; P = .49).
Patient Encounters
The average time to follow-up was 8.8 days, which was above the predetermined goal of contact within 7 days. Additionally, this was a decline from the initial pilot study, which had an average time to reach of 4.7 days. All patients reached by a pharmacist received medication reconciliation, with ≥ 28% of patients having ≥ 1 discrepancy. There were 43 discrepancies among all patients. Of the discrepancies, 25 were reported as errors performed by the patient, and 18 were from an error during the discharge process. The discrepancies that resulted from patient error were primarily patients who took the wrong dose of prescribed medications. Other patient discrepancies included taking medications not as scheduled, omitting medications (both intentionally and mistakenly), continuing to take medications that had been discontinued by a health care provider and improper administration technique. Examples of provider errors that occurred during the discharge process included not ordering medications for patient to pick up at discharge, not discontinuing a medication from the patient’s profile, and failure to renew expired prescriptions.
Additional counseling was provided to 75% of patients: The most common reason for counseling was T2DM, hypertension, and dyslipidemia management. PACT pharmacists changed medication regimens for 27.3% of patients for improved control of chronic diseases or relief of medication AEs.
At the end of each visit, patients were assessed to determine whether they could benefit from additional pharmacy follow-up. Thirty-seven patients were added to the pharmacist schedules for disease management appointments. The most common conditions for these appointments were T2DM, hypertension, tobacco cessation, and hyperlipidemia. Among the 37 patients who had pharmacy follow-up, there were 137 additional pharmacy appointments within the study period.
Program Referrals
After expansion to include the VA CBOCs, elimination of the elevated LACE or CAN score requirement, and additional staff education, the rate of referrals per month increased during phase 2 in comparison to the pilot study (Figure 3). There were a mean (SD) of 34 (10) referrals per month. Although not statistically analyzed, it is an objective increase in comparison to a mean 19 referrals per month in the pilot study.
Discussion
The continued development and use of a pharmacist-driven TOC tool at RLRVAMC increased communication and follow-up of high-risk patients, demonstrated the ability of pharmacists to identify and intervene in medication-related issues postdischarge, and successfully reduce 30-day readmissions. This program emphasized pharmacist involvement during the discharge process and created a standardized mechanism for TOC follow-up, addressing multiple areas that were identified by The Joint Commission as being associated with poor outcomes. The advanced pharmacy practice model at RLRVAMC allowed for a multidimensional program, including prospective patient identification and multiple pharmacy touchpoints. This is unique in comparison to many of the one-dimensional programs described in the literature.
Polypharmacy has been identified as a major predictor of medication discrepancies postdischarge, and patients with ≥ 10 active medications have been found to be at highest risk.13,14 Patients in this study had a mean 13 active medications on admission, with a mean 5 medication changes at discharge. PACT pharmacists documented 28 of 99 patients with ≥ 1 medication-related discrepancy at postdischarge reconciliation. This 28% discrepancy rate is consistent with discrepancy rates previously reported in the literature, which ranged from 14 to 45% in large meta-analyses.14,15 The majority of these discrepancies (58%) were related to patients who took the wrong dose of a prescribed medication.
Targeted interventions to overcome barriers in the pilot study increased the referral rates to the TOC tool; however, the increase in referral rate was associated with increased time to follow up by ambulatory care pharmacists. The extended follow-up times were seen most often in the 2 busiest primary care clinics, one of which is considered a teaching clinic for medical residents. Pharmacists were required to integrate these calls into their normal work schedule and were not provided additional time for calling, allowing for an increased follow-up time. The increased follow-up time likely contributed to the increased number of patients excluded due to already having PACT follow-up, giving more time for the primary care provider to have an appointment with the patient. The ambulatory care pharmacist could then determine whether further intervention was needed. In the summer of 2018, a decrease in referral rates occurred for a short time, but this is likely explained by incoming new residents and staff within the pharmacy department and decreased awareness among the new staff. The enhanced staff education took place during September 2018 and lead to increased referral rates compared with those seen in months prior.
PACT pharmacists were not only able to identify discrepancies, but also provide timely intervention on a multitude of medication-related issues by using their scope of practice (SOP). Most interventions were related to medication or disease counseling, including lifestyle, device, and disease education. The independent SOP of our PACT pharmacists is a unique aspect of this program and allowed pharmacists to independently adjust many aspects of a patient’s medication regimen during follow-up visits.
The outcomes of 30-day index and all-cause readmissions, as well as index and all-cause ED visit rates, were lower in the subset of patients who received PACT pharmacist follow-up after discharge (Table 3). The difference was most pronounced in the all-cause readmission rates: Only 8.1% of patients who received PACT follow-up experienced a readmission compared with 27.5% of those who did not. The difference between the groups regarding ED visit rates were not as pronounced, but this may be attributed to a limited sample size. These data indicate that the role of the pharmacist in identifying discrepancies and performing interventions at follow-up may play a clinically significant part in reducing both ED visit rates and hospital readmissions.
Limitations
There are some limitations identified within this study. Although the referral criteria were relaxed from the pilot study and enhanced education was created, continued education regarding appropriate referral of TOC patients continues to be necessary given intermittent staff changeover, incorporation of pharmacy trainees, and modifications to clinic workflow. Patients who were discharged to facilities were not included. This ensured that appropriate and consistent PACT pharmacist follow-up would be available, but likely reduced our sample size.
Although performing this study in a closed health care system with pharmacists who have independent SOPs is a strength of our study, also it can limit generalizability. Not all facilities house both acute care and ambulatory care in one location with wide SOPs to allow for comprehensive and continued care. Last, this study used convenience sampling, potentially introducing selection bias, as patients unable to be reached by PACT pharmacists may inherently be at increased risk for hospital readmission. However, in the 3 months preceding the hospital admission that resulted in TOC tool referral, both groups had a similar number of patients with hospital admissions and ED visits.
The TOC tool has become fully integrated into the daily workflow for both acute care and PACT pharmacists. After the conclusion of the study period, the referral rates into the tool have been maintained at a steady level, even surpassing the rates seen during the study period. In comparison with the pilot study, PACT pharmacists reported a subjective increase in referrals placed for procedures such as medication reconciliation or adherence checks. This is likely because acute care pharmacists were able to use their clinical judgement rather than to rely solely on calculated readmission risk scores for TOC tool referral.
The success of the TOC program led to the expansion to other specialty areas. ED pharmacists now refer patients from the ED who were not admitted to the hospital but would benefit from PACT follow-up. Additionally, the option to refer hematology and oncology patients was added to allow these patients to be followed up by our hematology/oncology CPSs by phone appointments. Unique reasons for follow-up for this patient population include concerns about delayed chemotherapy cycles or chemotherapy-associated AEs.
Conclusions
This study outlines the creation and continued improvement of a pharmacist-based TOC program. The program was designed as a method of communication between acute care and PACT pharmacists about high-risk patients. The creation of this program allowed PACT pharmacists not only to identify discrepancies and make interventions on high-risk patients, but also demonstrate that having pharmacists involved in these programs may have a positive impact on readmissions and ED visits. The success of the TOC tool at the RLRVAMC has led to its expansion and is now an integral part of the daily workflow for both acute care and PACT pharmacists.
1. Forster AJ, Murff HJ, Peterson JF, Gandhi TK, Bates DW. The incidence and severity of adverse effects affecting patients after discharge from the hospital. Ann Intern Med. 2003;138(3):161-167. doi:10.7326/0003-4819-138-3-200302040-00007
2. The Joint Commission. Transitions of care: the need for collaboration across entire care continuum. Published February 2013. Accessed February 25, 2021. http://www.jointcommission.org/assets/1/6/TOC_Hot_Topics.pdf
3. Leppin AL, Gionfriddo MR, Kessler M, et al. Preventing 30-day hospital readmissions: a systematic review and meta-analysis of randomized trials. JAMA Intern Med. 2014;174(7):1095-1107. doi:10.1001/jamainternmed.2014.1608
4. Medicare Hospital Compare. Readmissions and deaths. Accessed February 25, 2021. https://www.cms.gov/Medicare/Quality-Initiatives-Patient-Assessment-Instruments/HospitalQualityInits/VA-Data
5. van Walraven C, Dhalla IA, Bell C, et al. Derivation and validation of an index to predict early death or unplanned readmission after discharge from hospital to the community. CMAJ. 2010;182(6):551-557. doi:10.1503/cmaj.091117
6. US Department of Veteran Affairs. Care Assessment Needs (CAN) score report. Updated May 14, 2019. Accessed February 25, 2021. https://www.va.gov/HEALTHCAREEXCELLENCE/about/organization/examples/care-assessment-needs.asp
7. Schnipper JL, Kirwin JL, Cotugno MC, et al. Role of pharmacist counseling in preventing adverse drug events after hospitalization. Arch Intern Med. 2006;166(5):565-571. doi:10.1001/archinte.166.5.565
8. Phatak A, Prusi R, Ward B, et al. Impact of pharmacist involvement in the transitional care of high-risk patients through medication reconciliation, medication education, and post-discharge call-backs. J Hosp Med. 2016;11(1):40-44. doi:10.1002/jhm.2493
9. Coleman EA, Min SJ, Chomiak A, Kramer AM. Posthospital care transitions: patterns, complications, and risk identification. Health Serv Res. 2004;39(5):1449-1465. doi:10.1111/j.1475-6773.2004.00298.x
10. Brantley AF, Rossi DM, Barnes-Warren S, Francisco JC, Schatten I, Dave V. Bridging gaps in care: implementation of a pharmacist-led transitions of care program. Am J Health Syst Pharm. 2018;75(5)(suppl 1):S1-S5. doi:10.2146/ajhp160652
11. Scarsi KK, Fotis MA, Noskin GA. Pharmacist participation in medical rounds reduces medical errors. Am J Health Syst Pharm. 2002;59(21):2089-2092. doi:10.1093/ajhp/59.21.2089
12. Pevnick JM, Nguyen C, Jackevicius CA, et al. Improving admission medication reconciliation with pharmacists or pharmacy technicians in the emergency department: a randomised controlled trial. BMJ Qual Saf. 2018;27:512-520. doi:10.1136/bmjqs-2017-006761.
13. Kirwin J, Canales AE, Bentley ML, et al; American College of Clinical Pharmacy. Process indicators of quality clinical pharmacy services during transitions of care. Pharmacotherapy. 2012;32(11):e338-e347. doi:10.1002/phar.1214
14. Kwan JL, Lo L, Sampson M, et al. Medication reconciliation during transitions of care as a patient safety strategy: a systematic review. Ann Intern Med. 2013;158(5, part 2):397-403. doi:10.7326/0003-4819-158-5-201303051-00006
15. Stitt DM, Elliot DP, Thompson SN. Medication discrepancies identified at time of hospital discharge in a geriatric population. Am J Geriatr Pharmacother. 2011;9(4):234-240. doi:10.1016/j.amjopharm.2011.06.002
VA Academic Affiliations Matter in the Era of Community Care: A Model From California
The Veterans Health Administration (VHA), 1 of 3 administrative branches in the US Department of Veterans Affairs (VA), is the largest integrated health care system in the United States.1 The VHA has 4 missions: providing health care to eligible veterans; supporting research to benefit veterans and the larger society; providing education for health care trainees; and supporting emergency response.1 In service of these goals, VA has academic affiliations with universities throughout the country, offering unique, extensive training and research opportunities. Both the VA and the affiliate benefit from these partnerships. For example, VA affiliations with University of California (UC) medical schools benefit veteran care while facilitating the UC academic mission. Through these affiliations, trainees who learn within the VHA’s highly effective integrated care model become health care professionals (HCPs) who are prepared to enter health care systems in California and meet the state’s demand for high-quality integrated care with an emphasis on primary care, mental health care, and care for aging populations.2,3
This report explores the history of the VHA, current veteran demographics and needs, VA academic affiliations, and the integrated care model of training in all VHA facilities. The VA and UC academic affiliation is described further with regard to shared research and educational functions. Finally, we identify potential risks to academic affiliations associated with increased VA reliance on community-based care following the implementation of recent legislation. We provide suggestions for VA academic affiliates to help assess and guide the potential impact of increased VA-managed community care.
VHA Resources
The VHA serves more than 9 million veterans through 170 medical centers and 1,074 outpatient care sites.1 In fiscal year 2017, the VA provided 109 million outpatient visits, and treated 615,000 inpatient medicine/surgical patients and 149,000 patients in inpatient mental health.4 The VHA focuses on the distinct concerns of veterans, which arise from military service as well as their broader health care needs. Veterans have higher rates of medical and mental health conditions than those of the general public; different cohorts in this population experience distinct medical and mental health concerns (Table 1).5
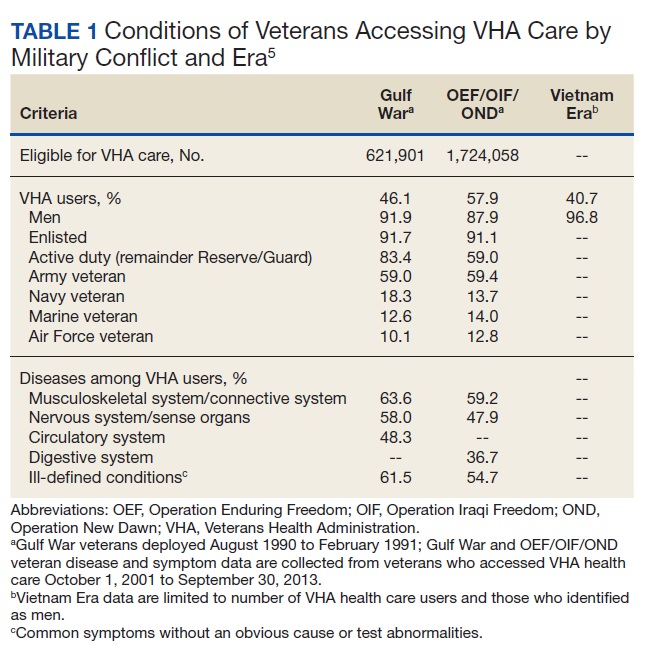
In addition, although veterans are disproportionately older men, the population is diversifying.6 For example, the number of female veterans is growing; furthermore, changes in the law now allow lesbian, gay, bisexual, and transgender (LGBT) individuals to serve openly, which has both reduced barriers for this population and allowed for LGBT veterans who were not eligible for VA care due to less than honorable discharges to have those discharges upgraded. As a result, care has been tailored to include the development of Women Veterans Program Managers and related services and LGBT and related identities resources such as LGBT Veteran Care Coordinators in every VA facility nationwide.7,8 The VA continues to adapt to serve all veterans; part of this adaptation is training HCPs to provide veteran-centered care for a growing and diversifying population.
VHA Resources in California
California has the largest population of veterans in the United States (Table 2).9,10 Of the 9,116,200 VA enrollees nationwide, 760,910 (8%) reside in California, and of those, 463,410 had at least 1 VA visit in the past year.3,10 The VHA is organized into 21 Veterans Integrated Service Networks (VISNs) that include multiple health care systems in the region associated with each VISN. California is part of VISN 21 (Northern California, Nevada, and Pacific Islands) and VISN 22 (Southern California, Nevada, and New Mexico). Among veterans who served in the recent Iraq and Afghanistan conflicts, 5.5% accessed care in VISN 21 and 9.3% accessed care in VISN 22.11 The VHA provides critical infrastructure for meeting complex veteran needs, as well as related specialized training, education, and research for HCPs. This specialization has been the basis for the broad system of affiliations between VA and academic systems.
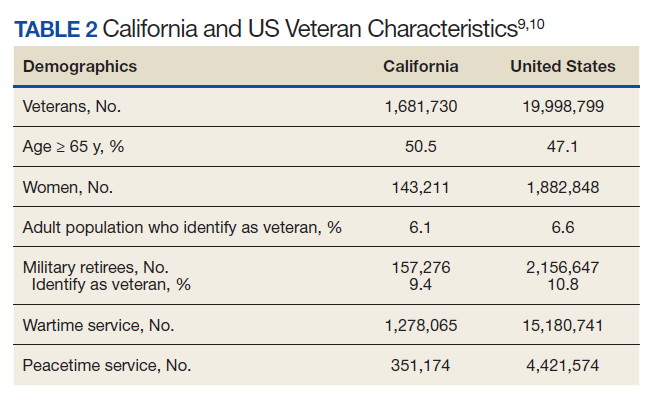
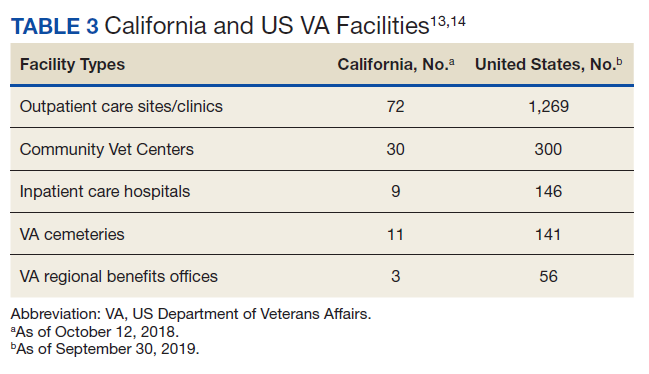
The VA continues to be a high priority in the federal budget process.12 In 2017, slightly more than 9% of the VA health care budget, $6.4 billion, was spent on medical care in California.10 Consequently, California has a noteworthy portion of VA infrastructure (Table 3).13,14 California has 8 VA medical centers (VAMCs) with hospital service (Fresno, Loma Linda, Long Beach, Palo Alto, Sacramento, San Diego, San Francisco, West Los Angeles), 3 VAMCs without hospital service (2 locations in the Palo Alto system and Sepulveda), 1 stand-alone extended-care facility (Martinez Community Living Center), and 1 stand-alone residential care facility (San Diego Domiciliary).9 The vast VA infrastructure in California and large population of veterans creates a strong demand for HCPs in the state.
VA Education and Collaboration
VA has been training clinicians and scholars since 1946, when VA academic affiliations were established by Memorandum Number 2.15,16 Today, the VA is the largest educator of HCPs in the United States.17 In 2015, an estimated $10.3 to $12.5 billion was spent on mandatory Medicare graduate medical education (GME).18 In 2017, the VA spent $1.78 billion of discretionary funding on GME to fund 11,000 full-time equivalent (FTE) slots, leading to > 43,000 physician residents (> 30% of all physician residents) spending part of their training in a VHA facility.18,19
This training mission has multiple benefits. It provides the VA with access to new HCPs who have the necessary training in veteran-specific needs, while supporting the national need for HCPs. In 2018, 120,890 clinical trainees received some or all of their training in the VA system.20 Of the 152 US medical schools that are accredited by the Liaison Committee on Medical Education, 95% collaborate with the VA for training while 100% of the 34 doctor of osteopathic medicine programs have VA training collaborations.20 The VA currently has an additional 18 partnerships with nursing schools.21 Further, 1,800 college and universities, including Hispanic-serving institutions and historically black colleges and universities, have VHA affiliations that provide training for more than 40 clinical health profession education programs.17
This training model has been successful in supporting VA staffing, as health care providers who trained in the VA are more likely to work in the VA.22 Among current VA employees, > 80% of optometrists, > 70% of podiatrists and psychologists, and > 60% of physicians received some part of their training in the VA system.23 In combination with recent increased funding for staffing, the ability of the VA to directly hire trainees in identified professions, and the expansion of loan forgiveness to high-demand specialties (eg, psychiatry), the training partnership between the VA and affiliates has been critical in maintaining the needed VA workforce.22,24,25
The VA Office of Academic Affiliations is responsible for all graduate medical and dental education administration in the VA system, which makes up 85% of its total budget. For each trainee, the VA provides approximately $60,000 toward their stipend in exchange for training and patient care time at a VHA hospital (Kenneth R. Jones, PhD, email communication, August 27, 2018).
California Health Care Education
The UC public university system, founded in 1869, currently has 10 campuses with a combined student body of > 280,000 students, along with 227,000 faculty and staff members.26 For every research dollar provided by California, the UC secures $7 in federal and private funding.26 The UC has 6 medical centers (Davis, Irvine, Los Angeles, Riverside, San Diego, and San Francisco); each is affiliated with at least 1 local VAMC.27,28
California trains a substantial share of health care trainees. In 2016, there were 10,429 physician residents in training in California.29 In 2017/2018, the San Francisco VAMC trained 1,178 medical students/residents, 57 pharmacy students, 25 nurse practitioner students, 19 optometry interns/students/residents, 11 dental students/residents, and 3 physical therapy students.20 In total, 6,223 UC health professions students were trained in VHA facilities during the 2017/2018 training year (Table 4).20 As of 2016, there were 105,907 physicians in California, and of those, 57% completed their GME in California.29 In California in 2015, 74 GME-sponsoring institutions graduated 3,568 residents and fellows, an increase of 10% since 1997.30 Of these sponsoring institutions, 6 of the top 8 programs were UC schools that graduated 48.4% (1,727) of all California residents and fellows in 2015.30
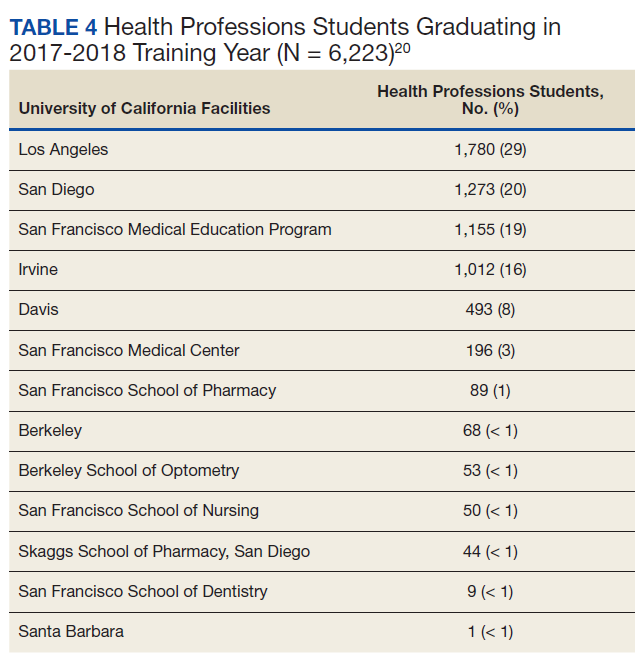
Despite these resources, California faces a major shortage of HCPs, particularly in primary, behavioral health, and older adult care.3 Today, 7 million Californians live in counties with a federally designated shortage of primary, dental, and mental health care providers.3 Most of these Californians are Latino, African American, or Native American, and they live in fast-growing rural and urban regions, including Los Angeles; the San Joaquin Valley; and the Inland Empire (San Bernardino and Riverside Counties).3 Current recommendations to meet increasing demands as California’s population increases, grows older, and faces increased health care demands include expanding residency programs to yield 1,872 additional primary care physicians and 2,202 additional psychiatrists by 2030.3 To meet this shortage and prepare for future health care demands, health care education is paramount; in California, VA and UC affiliations are central to addressing these needs.
The VA plays a particularly important role in supporting GME, which is essential to meeting both VA and California’s unmet HCP needs, as GME determines the number of medical practitioners available per specialty.30 The VA was the second largest GME fund provider in California at $90,662,608 (Medicare provided $552,235,626) and the California government provided a small portion of GME funding.30 VA education funding is a direct result of the VA provision of clinical care in one of the most innovative and modern health care systems in the world.
These VA training opportunities benefit the UC system and California by helping train integrated care practitioners to meet the increasing demand. Integrated care—the coordination of mental health care, substance use disorder treatment, and primary care services—is designed to improve health outcomes by helping people with multiple and complex health care needs access care.31,32
As the largest integrated health care system in the country, the VA brings important clinical, research, and educational opportunities to academic affiliates. A systematic review examining cost and quality outcomes in integrated care systems found improved quality of care compared with nonintegrated care systems; thus, many US government agencies and the World Health Organization are establishing integrated care systems as a standard and universal approach.31,33,34 While cost savings as a result of integrated care are unclear, most studies in this review reported a decrease in utilization of services.33 The presumption of more efficient and higher quality care is also predicated on features such as system-wide accessibility of comprehensive medical records that provide more information to HCPs, promote collaboration, and measure and reward performance, all of which are possible using the VA electronic health record (EHR) system.35,36 The VA offers an excellent opportunity for training in integrated care as this model is required of all VAMCs and community-based outpatient clinics (CBOCs).37
Providing integrated care to the citizens of California is among the 10 priorities of the California Future Health Workforce Commission (a group of California health care leaders cochaired by the UC system president) for immediate action and guides their recommendations on developing and expanding the health care workforce; therefore, training in an integrated health care system is especially important for California HCPs.3 Nearly three-quarters of California’s population aged ≥ 65 years has a chronic health condition that could benefit from integrated care; however, the current supply of HCPs is insufficient to meet the growing demand for geriatric care.38,39
The VA has a robust training program to produce scholars and practitioners who specialize in geriatric care. This includes the Geriatric Scholars Program, which has the goal of integrating geriatrics into primary care through professional development. The Geriatric Scholars Program is a component of the VA Geriatric Research Education and Clinical Centers at urban VAMCs to help provide education and clinical resource connections with rural CBOCs where geriatrics expertise is lacking.
The California Future Health Workforce Commission is highlighting the need to prioritize workforce development in primary care, mental health care, and care for the aging.3 These priorities are shared as foundational services within the VHA.40 The alignment of these priorities creates an excellent rationale for increasing training and education of the UC health care workforce in the California VA system through academic affiliations.
VA Research Collaborations
The VA Office of Research and Development has existed for more than 90 years with a mission to improve veteran health and well-being via research and attract, train, and retain high-caliber researchers. VA provides a rich environment to conduct observational and interventional research due to its large, diverse veteran population, institutional support, and integrated information system with extensive EHR data.41 The success of the VA in facilitating research is evidenced by the fact that 3 VA investigators have been awarded Nobel prizes, and 7 have received Lasker Foundation Awards.42 The size of the VA allows for innovative large-scale research, such as the Million Veteran Program (MVP). The MVP study developed a mega-biobank of VA health records, questionnaires, and blood samples from nearly 1 million veterans to study genetic influences on health and disease and integrate genetic testing into health care delivery.43 In addition to producing high-quality, innovative research, more than 60% of VA investigators also provide direct patient care.42
VA research areas of focus include homelessness, polytrauma, traumatic brain injury, hearing and vision loss, spinal cord injury, mental health, pain management, precision medicine, prosthetics and amputation care, women’s health, and chronic diseases, such as Parkinson and Alzheimer diseases.44 The VA estimates that, in 2021, total VA research spending will include a request of $787 million in addition to $370 million from the National Institutes of Health, the Department of Defense, and the Centers for Disease Control and Prevention, and $170 million from other nonfederal sources, for a projected total of $1.3 billion. This budget will support 2,200 projects with direct research and reimbursable employment of 3,275 FTEs,which are key to supporting VA academic affiliations.45 These funds translate into substantial benefits to the UC system, including shared research and training resources, grant-funding opportunities for UC faculty, and the ability to recruit top researchers, educators, and clinicians to its institutions.
VA Reliance on Community Care
The current VHA model is an integrated health care system that provides comprehensive, wraparound services to enrolled veterans, which are cost-effective, high quality, and consistently found to have equal or superior quality of care compared with that in the community.6,46-50 Despite public criticism about wait times and access to care in the VA system, one study showed that VA wait-time statistics were comparable with or faster than those for community HCPs.51,52 However, VA care coordination has undergone several changes to address these public criticisms, namely, the Veterans Access, Choice and Accountability Act of 2014 (38 USC § 1703 VACAA) and the VA MISSION Act of 2018 (42 USC § 274). VACAA was designed to increase access to care for veterans who live ≥ 40 miles from VA health care facilities or who are unable to been seen within 30 days of their preferred or clinically appropriate date.53 More than 2 million veterans (almost 25% of VHA-enrolled veterans) have received community care since the inception of VACAA in 2014.54
Recently, the MISSION Act mandated developing additional VA-coordinated community-based care through the establishment of a Veterans Community Care Program, which was established using existing VA 2019 fiscal year funds and did not include additional appropriations despite expanded criteria for community care referrals.55 Without additional future appropriations, VA funds would be shifted from VA care into community care. While increasing access to community care has in some cases led to care that is faster and closer and that was previously inaccessible in local VA specialty care, these efforts could reduce veteran engagement with the VA system.56
The changes implemented in VACAA and the VA MISSION Act were driven by important and valid concerns, including evidence of VA staff and officials covering up service deficiencies.51 Veterans in rural areas often have limited access to VA resources, and long travel to VAMCs or clinics can be an impediment. Veterans who have chosen community care tended to be those who have poorer health status, who live further away from VA facilities, women, and those who identified as White or Hispanic.56,57 While VA health care is on average equivalent to or better than community resources, there is significant variability in quality within the VA system. Advocates have argued that providing competition and choice for veterans places pressure on the VA to improve care where it is not meeting expectations. Therefore, access to community care is an important resource for veterans and needs to be implemented effectively and efficiently to help veterans receive the care they need. However, expansion of community care access, depending on how it is implemented, also can have effects on academic partnerships and the education and research missions that should be incorporated into planning.
Each VA health care system receives funding through the Veterans Equitable Reimbursement Allocation (VERA), which provides funds largely based on the number of enrolled veterans and the complexity of the care they receive.58 One potential implication of the shift among veterans to community care is a reduction in patients enrolled in VA programs, thus decreasing funding given to the VA to allocate for training and research. By definition, increased VA-managed community care means less opportunity for integrated training that brings together primary, mental health, and substance use care to meet patient needs. The Center for Medicare and Medicaid Services has developed a national initiative to help states develop programs in integrated care, particularly for individuals who are eligible for both Medicare and Medicaid.59 For states to develop integrated care, they need trainees who function well in this model. Integrated care training is particularly vulnerable to disruption because any portion of a veteran’s care being transferred to the community can impede integration. In effect, training in integrated care, likely the most efficient and cost-effective approach to health care for reasons discussed earlier, could be reduced as providers and trainees are required to manage and coordinate patient care between separate institutions.35
Educational Impact
The shift in usage from VA to community care has potential implications for academic affiliates, particularly in education and research.60 If more people are served in community settings, potentially some VAMCs could be reduced, realigned, or closed. If this restructuring happens, academic partnerships could be impacted negatively. The VA is instituting an Infrastructure Review Commission with the task of examining current VA utilization. If a VA site with an academic affiliate was considered for realignment or closure, the reduction would eliminate the ability of the academic affiliate to provide education and research collaborations at that site.
In a less drastic manner, increasing care in the community may change opportunities for academic affiliates to partner with the VA. As noted, the UC system and California veterans benefit immensely from the VHA as an integrated health care system with dedicated missions of education and research. This partnership is a model in which the VA is the primary source of care for eligible enrolled veterans and provides integrated comprehensive services. If the VA moves to serving primarily as a coordinator of community HCPs rather than a direct provider of health care, academic affiliates would need to make major adjustments to both the education and training models. This change could particularly affect specialty training programs that rely on having adequate volumes of patients to provide an extensive experience to meet training needs. If fewer veterans receive care directly from the VA and are instead dispersed in the community, that will reduce the ability of academic faculty to participate in the education of medical and affiliated trainees and to participate in research in VA settings. It is unclear what other model could replace such a system and be as beneficial to the VA and the academic partners with which it is currently affiliated.
Given the needs that led to the VA increasing access to care and the potential implications discussed for the VA and partnerships with academic affiliates, VA health care systems and academic affiliate partners should consider several steps. These steps involve assessment, coordination, and promotion.
Both the VA and academic affiliates would benefit if the VA shared assessment data on the use of community care, particularly identifying changes that relate to key training and/or research missions. Such data sharing can be critical to determine whether any risks (or potential opportunities) need to be addressed. In addition, increasing research on the outcomes related to both VA care and community-based care is of high value to determine whether the current changes are achieving intended goals. The VA recently funded such work through its research service, and such work is critical for guiding future policy for the VA and for the affiliates.
Coordination among the VA, academic affiliates, and community partners is vital for change. The issue of community care expansion should be a standing item on coordination meetings and shared governance councils between the institutions. It may make sense to establish specific workgroups or committees to coordinate tracking and assessment of the effect of community care expansion on the shared academic mission. One way to address the potential effect of increased community care on the research and education missions would be to include community partners into the partnerships. This strategy could potentially take a number of different forms, from providing education and training to community HCPs, having VA trainees rotate to community settings, or inviting community settings to be research sites for clinical trials. Such partnerships could potentially improve patient care and support the other academic missions. Coordination could be meaningfully improved by having community HCPs access the VA EHR, thus easing communications. Funding is available for EHR access in the VA MISSION Act and should be a high priority as community care expands. The more that community partners can access and connect with the VA EHR the better they will be able to coordinate care.
Third, the VA and its academic partners need to promote and educate veterans, their families, and their advocates on the benefits that are available through VA care and that are enhanced through academic partnerships. While the VA has been the target of justified criticism, many of its strengths addressed here are not broadly recognized. The VA could promote its sharing of staff and resources with the top academic health care institutions in an area and that veterans often have access to resources that otherwise would not be available without the academic affiliate. Making sure veterans are aware of the benefits available can potentially mitigate the need for community care.
Conclusions
Given changes from VACAA and the VA MISSION Act, VA and academic affiliates should be active partners in planning for future health care by providing input and feedback on VA structure to help shape federal and state systems moving forward. Institutions can take steps to steer their futures and meet growing clinical, training, and research needs. The VA and its academic partners in health care research are well positioned to develop projects to assess the effects of these changes. Evaluation of key variables including patient care, education, and research productivity are warranted to guide policymakers as they assess whether these changes in the VA are achieving the expressed goals of improving veteran care. Other opportunities to collaborate in the wake of the MISSION Act remain to be discovered within each academic affiliation. By strengthening working relationships between VA and academic teams, these deeply important partnerships can continue to produce clinical, research, and education outcomes that meet the needs of our veterans, our federal and state health care systems, and our country.
Acknowledgments
Dr. Sells was supported by the Department of Veterans Affairs, Veterans Health Administration, Office of Academic Affiliations VA Quality Scholars Advanced Fellowship Program.
1. US Department of Veterans Affairs, Veterans Health Administration. About VHA. Updated January 22, 2021. Accessed March 9, 2021. https://www.va.gov/health/aboutvha.asp
2. National Academies of Sciences, Engineering, and Medicine; Health and Medicine Division; Board on Health Care Services; Committee to Evaluate the Department of Veterans Affairs Mental Health Services. Evaluation of the Department of Veterans Affairs Mental Health Services. National Academies Press; 2018. Accessed March 9, 2021. https://www.ncbi.nlm.nih.gov/books/NBK499502/
3. California Future Health Workforce Commission. Meeting the demand for health: final report of the California Future Health Workforce Commission. Published February 2019. Accessed March 9, 2021. https://futurehealthworkforce.org/wp-content/uploads/2019/03/MeetingDemandForHealthFinalReportCFHWC.pdf
4. US Department of Veterans Affairs. Veterans Health Administration fiscal year 2017 annual report. Published 2017. Accessed March 9, 2021. https://www.va.gov/HEALTH/docs/VHA_AnnualReport_FY2017.pdf
5. US Department of Veterans Affairs. Public health: health care use by Gulf War & OEF/OIF/OND veterans. Updated March 28, 2017. Accessed March 9, 2021. https://www.publichealth.va.gov/epidemiology/reports/health-care-use-gulfwar-oefoifond/index.asp
6. Eibner C, Krull H, Brown KM, et al. Current and projected characteristics and unique health care needs of the patient population served by the Department of Veterans Affairs. Rand Health Q. 2016;5(4):13.
7. US Department of Veterans Affairs. Patient care services: veterans with lesbian, gay, bisexual and transgender (LGBT) and related identities. Updated August 31, 2020. Accessed March 9, 2021. https://www.patientcare.va.gov/LGBT/index.asp
8. US Department of Veterans Affairs. Women veterans health care: women veterans program managers. Updated March 28, 2017. Accessed March 9, 2021. https://www.womens health.va.gov/WOMENSHEALTH/programoverview/wvpm.asp
9. US Department of Veterans Affairs, National Center for Veterans Analysis and Statistics. VA facilities by state. Published May 15, 2017. Accessed March 9, 2021. https://www.va.gov/vetdata/docs/SpecialReports/VA_Facilities_By_State.PDF
10. US Department of Veterans Affairs, National Center for Veterans Analysis and Statistics. State summaries: California. Published September 2018. Accessed March 9, 2021. https://www.va.gov/vetdata/docs/SpecialReports/State_Summaries_California.pdf
11. US Department of Veterans Affairs, Veterans Health Administration, Office of Patient Care Services, Post-Deployment Health Group, Epidemiology Program. Analysis of VA health care utilization among Operation Enduring Freedom (OEF), Operation Iraqi Freedom (OIF), and Operation New Dawn (OND) veterans. Published January 2017. Accessed March 9, 2021. https://www.publichealth.va.gov/docs/epidemiology/healthcare-utilization-report-fy2015-qtr3.pdf
12. US Department of Veterans Affairs, Office of Budget. Annual budget submission, president’s budget request – fiscal year 2021. Updated February 10, 2020. Accessed March 9, 2021. https://www.va.gov/budget/products.asp
13. US Department of Veterans Affairs. Department of Veterans Affairs statistics at a glance. Updated February 2020. Accessed March 10, 2021. https://www.va.gov/vetdata/docs/Quickfacts/Stats_at_a_glance_4_6_20.PDF
14. US Department of Veterans Affairs VW. Locations, California. Updated October 12, 2018. Accessed March 10, 2021. https://www.va.gov/directory/guide/state.asp?dnum=ALL&STATE=CA
15. Baker, R. R., & Pickren, W. E. (2007). Psychology and the Department of Veterans Affairs: A historical analysis of training, research, practice, and advocacy. American Psychological Association. doi:10.1037/11544-000
16. Functions of Veterans Health Administration: health-care personnel education and training programs. 38 USC § 7302. Accessed March 16, 2021. https://www.govinfo.gov/app/details/USCODE-2011-title38/USCODE-2011-title38-partV-chap73-subchapI-sec7302
17. US Department of Veterans Affairs, Office of Academic Affiliations. Mission of the Office of Academic Affiliations. Published September 24, 2019. Accessed March 10, 2021. https://www.va.gov/oaa/oaa_mission.asp
18. Congressional Research Service. Federal support for graduate medical education: an overview. CRS report R44376. Updated December 27, 2018. Accessed March 10, 2021. https://fas.org/sgp/crs/misc/R44376.pdf
19. Association of American Medical Colleges. 2018 Report on residents. Table B3: number of active residents, by type of medical school, GME specialty, and sex. Accessed March 10, 2021. https://www.aamc.org/data-reports/students-residents/interactive-data/table-b3-number-active-residents-type-medical-school-gme-specialty-and-sex
20. US Department of Veterans Affairs, Office of Academic Affiliations. National summary trainees unique school list - academic year: 2017-2018.
21. US Department of Veterans Affairs, Office of Academic Affiliations. VA nursing academic partnerships. Updated December 12, 2018. Accessed March 10, 2021. https://www.va.gov/oaa/vanap/default.asp
22. Keitz SA, Aron DC, Brannen JL, et al. Impact of clinical training on recruiting graduating health professionals. Am J Manag Care. 2019;25(4):e111-e118. Published 2019 Apr 1.
23. US Department of Veterans Affairs, Office of Academic Affiliations. Health professions education: academic year 2019-2020. Published 2020. https://www.va.gov/OAA/docs/OAA_Statistics_2020.pdf
24. US Department of Veterans Affairs, Veterans Health Administration. Hiring programs and initiatives. Updated March 10, 2021. Accessed March 10, 2021. https://www.vacareers.va.gov/Benefits/HiringProgramsInitiatives/
25. US Department of Veterans Affairs, Veterans Health Administration. Students and trainees. Updated March 10, 2021. Accessed March 10, 2021. https://www.vacareers.va.gov/Careers/StudentsTrainees
26. The Regents of the University of California. The UC system. Accessed March 10, 2021. https://www.universityofcalifornia.edu/uc-system
27. The Regents of the University of California. The parts of UC. Accessed March 10, 2021. https://www.universityofcalifornia.edu/uc-system/parts-of-uc
28. US Department of Veterans Affairs. Locations: VISN 21: Sierra Pacific Network. Updated October 12, 2018. Accessed March 10, 2021. https://www.va.gov/directory/guide/region.asp?ID=1021
29. Association of American Medical Colleges. California physician workforce profile. Published 2017. Accessed March 10, 2021. https://www.aamc.org/system/files/2019-08/california2017.pdf
30. Rittenhouse D, Ament A, Grumbach K, Petterson S, Levin Z, Bazemore A. California Health Care Foundation: guide to graduate medical education funding in California. Published September 2018. Accessed March 10, 2021. https://www.chcf.org/wp-content/uploads/2018/08/GuideGraduateMedicalEducationFunding.pdf
31. US Department of Health and Human Services, Health Resources and Services Administration. Integrated behavioral health resource library. Accessed March 18, 2020. https://www.hrsa.gov/behavioral-health/library
32. US Department of Veterans Affairs. Patient care services: primary care - mental health integration (PC-MHI). Updated August 1, 2016. Accessed March 10, 2021. https://www.patientcare.va.gov/primarycare/PCMHI.asp

33. Hwang W, Chang J, Laclair M, Paz H. Effects of integrated delivery system on cost and quality. Am J Manag Care. 2013;19(5):e175-e184.
34. World Health Organization, World Organization of Family Doctors (Wonca). Integrating mental health into primary care: a global perspective. Published October 2008. Accessed March 10, 2021. https://www.who.int/mental_health/policy/Integratingmhintoprimarycare2008_lastversion.pdf
35. Congressional Budget Office. Comparing the costs of the veterans’ health care system with private-sector costs. Published December 10, 2014. Accessed March 10, 2021. https://www.cbo.gov/publication/49763
36. Souden M. Overview of VA data, information systems, national databases and research uses. Published October 2, 2017. Accessed March 10, 2021. https://www.hsrd.research.va.gov/for_researchers/cyber_seminars/archives/2376-notes.pdf
37. US Department of Veterans Affairs, Veterans Health Administration. Uniform mental health services in VA medical centers and clinics. VHA handbook 1160.01. Published September 11, 2008. Recertified September 30, 2013. Amended November 16, 2015. Published September 11, 2008. Accessed March 10, 2021. https://www.va.gov/vhapublications/ViewPublication.asp?pub_ID=1762
38. Coffman JM, Fix M, Ko M. California physician supply and distribution: headed for a drought? Published June 25, 2018. Accessed March 10, 2021. https://www.chcf.org/publication/californias-physicians-headed-drought
39. Meng YY, Ahman T, Pickett M. California Health Care Foundation: 2015 Edition—Californians with the top chronic conditions: 11 million and counting. Published April 23, 2015. Accessed March 10, 2021. https://www.chcf.org/publication/2015-edition-californians-top-chronic-conditions-11-million-counting
40. US Department of Veterans Affairs. Department of Veterans Affairs FY 2018-2024 strategic plan. Updated May 31, 2019. Accessed March 10, 2021. https://www.va.gov/oei/docs/va2018-2024strategicplan.pdf
41. Justice AC, Erdos J, Brandt C, Conigliaro J, Tierney W, Bryant K. The Veterans Affairs healthcare system: a unique laboratory for observational and interventional research. Med Care. 2006;44(8)(suppl 2):S7-S12. doi:10.1097/01.mlr.0000228027.80012.c5
42. US Department of Veterans Affairs, Office of Research and Development: About the Office of Research & Development. Published Updated March 4, 2021. Accessed March 10, 2021. https://www.research.va.gov/about/default.cfm
43. Gaziano JM, Concato J, Brophy M, et al. Million Veteran Program: a mega-biobank to study genetic influences on health and disease. J Clin Epidemiol. 2016;70:214-223. doi:10.1016/j.jclinepi.2015.09.016
44. US Department of Veterans Affairs. VA research program overview. Accessed March 12, 2021. https://www.research.va.gov/pubs/docs/va-research-overview-brochure.pdf
45. US Department of Veterans Affairs. FY 2021 budget submission: medical programs and information technology programs. Volume 2 of 4. Published February 2020. Accessed March 12, 2021. https://www.va.gov/budget/docs/summary/fy2021VAbudgetVolumeIImedicalProgramsAndInformationTechnology.pdf
46. Trivedi AN, Matula S, Miake-Lye I, Glassman PA, Shekelle P, Asch S. Systematic review: comparison of the quality of medical care in Veterans Affairs and non-Veterans Affairs settings. Med Care. 2011;49(1):76-88. doi:10.1097/MLR.0b013e3181f53575
47. Nugent GN, Hendricks A, Nugent L, Render ML. Value for taxpayers’ dollars: what VA care would cost at Medicare prices. Med Care Res Rev. 2004;61(4):495-508. doi:10.1177/1077558704269795
48. Anhang Price R, Sloss EM, Cefalu M, Farmer CM, Hussey PS. Comparing quality of care in Veterans Affairs and non-Veterans Affairs settings. J Gen Intern Med. 2018;33(10):1631-1638. doi:10.1007/s11606-018-4433-7
49. O’Hanlon C, Huang C, Sloss E, et al. Comparing VA and non-VA quality of care: a systematic review. J Gen Intern Med. 2017;32(1):105-121. doi:10.1007/s11606-016-3775-2
50. Vanneman ME, Wagner TH, Shwartz M, et al. Veterans’ experiences with outpatient care: comparing the Veterans Affairs system with community-based care. Health Aff (Millwood). 2020;39(8):1368-1376. doi:10.1377/hlthaff.2019.01375
51. US Department of Veterans Affairs, Office of Inspector General. Veterans Health Administration interim report: review of patient wait times, scheduling practices, and alleged patient deaths at the Phoenix health care system. Published May 28, 2014. Accessed March 12, 2021. https://www.va.gov/oig/pubs/VAOIG-14-02603-178.pdf
52. Penn M, Bhatnagar S, Kuy S, et al. Comparison of wait times for new patients between the private sector and United States Department of Veterans Affairs medical centers. JAMA Netw Open. 2019;2(1):e187096. doi:10.1001/jamanetworkopen.2018.7096
53. US Department of Veterans Affairs. Fact sheet: Veterans Access, Choice and Accountability Act of 2014 (“Choice Act”). Accessed March 12, 2021. https://www.va.gov/opa/choiceact/documents/choice-act-summary.pdf
54. Mattocks KM, Cunningham K, Elwy AR, et al. Recommendations for the evaluation of cross-system care coordination from the VA State-of-the-art Working Group on VA/Non-VA Care. J Gen Intern Med. 2019;34(Suppl 1):18-23. doi:10.1007/s11606-019-04972-1
55. US Department of Veterans Affairs. Fact sheet: VA MISSION Act and new veterans community care program. Published June 15, 2018. Accessed March 12, 2021. https://www.va.gov/COMMUNITYCARE/docs/pubfiles/factsheets/FactSheet_20-13.pdf
56. Stroupe KT, Martinez R, Hogan TP, et al. Experiences with the veterans’ choice program. J Gen Intern Med. 2019;34(10):2141-2149. doi:10.1007/s11606-019-05224-y
57. Yoon J, Leung LB, Rubenstein LV, et al. Use of the veterans’ choice program and attrition from Veterans Health Administration primary care. Med Care. 2020;58(12):1091-1097. doi:10.1097/MLR.0000000000001401
58. US Department of Veterans Affairs. Veterans Equitable Resource Allocation (VERA). Updated March 9, 2021. Accessed March 12, 2021. https://catalog.data.gov/dataset/veterans-equitable-resource-allocation-vera
59. Integrated Care Resource Center. About us. Accessed March 12, 2021. https://www.integratedcareresourcecenter.com/about-us
60. Duhaney T. How veteran utilization of the Veterans Health Administration could impact privatization. Public Policy Aging Rep. 2020;30(1):29-35. doi:10.1093/ppar/prz032
The Veterans Health Administration (VHA), 1 of 3 administrative branches in the US Department of Veterans Affairs (VA), is the largest integrated health care system in the United States.1 The VHA has 4 missions: providing health care to eligible veterans; supporting research to benefit veterans and the larger society; providing education for health care trainees; and supporting emergency response.1 In service of these goals, VA has academic affiliations with universities throughout the country, offering unique, extensive training and research opportunities. Both the VA and the affiliate benefit from these partnerships. For example, VA affiliations with University of California (UC) medical schools benefit veteran care while facilitating the UC academic mission. Through these affiliations, trainees who learn within the VHA’s highly effective integrated care model become health care professionals (HCPs) who are prepared to enter health care systems in California and meet the state’s demand for high-quality integrated care with an emphasis on primary care, mental health care, and care for aging populations.2,3
This report explores the history of the VHA, current veteran demographics and needs, VA academic affiliations, and the integrated care model of training in all VHA facilities. The VA and UC academic affiliation is described further with regard to shared research and educational functions. Finally, we identify potential risks to academic affiliations associated with increased VA reliance on community-based care following the implementation of recent legislation. We provide suggestions for VA academic affiliates to help assess and guide the potential impact of increased VA-managed community care.
VHA Resources
The VHA serves more than 9 million veterans through 170 medical centers and 1,074 outpatient care sites.1 In fiscal year 2017, the VA provided 109 million outpatient visits, and treated 615,000 inpatient medicine/surgical patients and 149,000 patients in inpatient mental health.4 The VHA focuses on the distinct concerns of veterans, which arise from military service as well as their broader health care needs. Veterans have higher rates of medical and mental health conditions than those of the general public; different cohorts in this population experience distinct medical and mental health concerns (Table 1).5
In addition, although veterans are disproportionately older men, the population is diversifying.6 For example, the number of female veterans is growing; furthermore, changes in the law now allow lesbian, gay, bisexual, and transgender (LGBT) individuals to serve openly, which has both reduced barriers for this population and allowed for LGBT veterans who were not eligible for VA care due to less than honorable discharges to have those discharges upgraded. As a result, care has been tailored to include the development of Women Veterans Program Managers and related services and LGBT and related identities resources such as LGBT Veteran Care Coordinators in every VA facility nationwide.7,8 The VA continues to adapt to serve all veterans; part of this adaptation is training HCPs to provide veteran-centered care for a growing and diversifying population.
VHA Resources in California
California has the largest population of veterans in the United States (Table 2).9,10 Of the 9,116,200 VA enrollees nationwide, 760,910 (8%) reside in California, and of those, 463,410 had at least 1 VA visit in the past year.3,10 The VHA is organized into 21 Veterans Integrated Service Networks (VISNs) that include multiple health care systems in the region associated with each VISN. California is part of VISN 21 (Northern California, Nevada, and Pacific Islands) and VISN 22 (Southern California, Nevada, and New Mexico). Among veterans who served in the recent Iraq and Afghanistan conflicts, 5.5% accessed care in VISN 21 and 9.3% accessed care in VISN 22.11 The VHA provides critical infrastructure for meeting complex veteran needs, as well as related specialized training, education, and research for HCPs. This specialization has been the basis for the broad system of affiliations between VA and academic systems.
The VA continues to be a high priority in the federal budget process.12 In 2017, slightly more than 9% of the VA health care budget, $6.4 billion, was spent on medical care in California.10 Consequently, California has a noteworthy portion of VA infrastructure (Table 3).13,14 California has 8 VA medical centers (VAMCs) with hospital service (Fresno, Loma Linda, Long Beach, Palo Alto, Sacramento, San Diego, San Francisco, West Los Angeles), 3 VAMCs without hospital service (2 locations in the Palo Alto system and Sepulveda), 1 stand-alone extended-care facility (Martinez Community Living Center), and 1 stand-alone residential care facility (San Diego Domiciliary).9 The vast VA infrastructure in California and large population of veterans creates a strong demand for HCPs in the state.
VA Education and Collaboration
VA has been training clinicians and scholars since 1946, when VA academic affiliations were established by Memorandum Number 2.15,16 Today, the VA is the largest educator of HCPs in the United States.17 In 2015, an estimated $10.3 to $12.5 billion was spent on mandatory Medicare graduate medical education (GME).18 In 2017, the VA spent $1.78 billion of discretionary funding on GME to fund 11,000 full-time equivalent (FTE) slots, leading to > 43,000 physician residents (> 30% of all physician residents) spending part of their training in a VHA facility.18,19
This training mission has multiple benefits. It provides the VA with access to new HCPs who have the necessary training in veteran-specific needs, while supporting the national need for HCPs. In 2018, 120,890 clinical trainees received some or all of their training in the VA system.20 Of the 152 US medical schools that are accredited by the Liaison Committee on Medical Education, 95% collaborate with the VA for training while 100% of the 34 doctor of osteopathic medicine programs have VA training collaborations.20 The VA currently has an additional 18 partnerships with nursing schools.21 Further, 1,800 college and universities, including Hispanic-serving institutions and historically black colleges and universities, have VHA affiliations that provide training for more than 40 clinical health profession education programs.17
This training model has been successful in supporting VA staffing, as health care providers who trained in the VA are more likely to work in the VA.22 Among current VA employees, > 80% of optometrists, > 70% of podiatrists and psychologists, and > 60% of physicians received some part of their training in the VA system.23 In combination with recent increased funding for staffing, the ability of the VA to directly hire trainees in identified professions, and the expansion of loan forgiveness to high-demand specialties (eg, psychiatry), the training partnership between the VA and affiliates has been critical in maintaining the needed VA workforce.22,24,25
The VA Office of Academic Affiliations is responsible for all graduate medical and dental education administration in the VA system, which makes up 85% of its total budget. For each trainee, the VA provides approximately $60,000 toward their stipend in exchange for training and patient care time at a VHA hospital (Kenneth R. Jones, PhD, email communication, August 27, 2018).
California Health Care Education
The UC public university system, founded in 1869, currently has 10 campuses with a combined student body of > 280,000 students, along with 227,000 faculty and staff members.26 For every research dollar provided by California, the UC secures $7 in federal and private funding.26 The UC has 6 medical centers (Davis, Irvine, Los Angeles, Riverside, San Diego, and San Francisco); each is affiliated with at least 1 local VAMC.27,28
California trains a substantial share of health care trainees. In 2016, there were 10,429 physician residents in training in California.29 In 2017/2018, the San Francisco VAMC trained 1,178 medical students/residents, 57 pharmacy students, 25 nurse practitioner students, 19 optometry interns/students/residents, 11 dental students/residents, and 3 physical therapy students.20 In total, 6,223 UC health professions students were trained in VHA facilities during the 2017/2018 training year (Table 4).20 As of 2016, there were 105,907 physicians in California, and of those, 57% completed their GME in California.29 In California in 2015, 74 GME-sponsoring institutions graduated 3,568 residents and fellows, an increase of 10% since 1997.30 Of these sponsoring institutions, 6 of the top 8 programs were UC schools that graduated 48.4% (1,727) of all California residents and fellows in 2015.30
Despite these resources, California faces a major shortage of HCPs, particularly in primary, behavioral health, and older adult care.3 Today, 7 million Californians live in counties with a federally designated shortage of primary, dental, and mental health care providers.3 Most of these Californians are Latino, African American, or Native American, and they live in fast-growing rural and urban regions, including Los Angeles; the San Joaquin Valley; and the Inland Empire (San Bernardino and Riverside Counties).3 Current recommendations to meet increasing demands as California’s population increases, grows older, and faces increased health care demands include expanding residency programs to yield 1,872 additional primary care physicians and 2,202 additional psychiatrists by 2030.3 To meet this shortage and prepare for future health care demands, health care education is paramount; in California, VA and UC affiliations are central to addressing these needs.
The VA plays a particularly important role in supporting GME, which is essential to meeting both VA and California’s unmet HCP needs, as GME determines the number of medical practitioners available per specialty.30 The VA was the second largest GME fund provider in California at $90,662,608 (Medicare provided $552,235,626) and the California government provided a small portion of GME funding.30 VA education funding is a direct result of the VA provision of clinical care in one of the most innovative and modern health care systems in the world.
These VA training opportunities benefit the UC system and California by helping train integrated care practitioners to meet the increasing demand. Integrated care—the coordination of mental health care, substance use disorder treatment, and primary care services—is designed to improve health outcomes by helping people with multiple and complex health care needs access care.31,32
As the largest integrated health care system in the country, the VA brings important clinical, research, and educational opportunities to academic affiliates. A systematic review examining cost and quality outcomes in integrated care systems found improved quality of care compared with nonintegrated care systems; thus, many US government agencies and the World Health Organization are establishing integrated care systems as a standard and universal approach.31,33,34 While cost savings as a result of integrated care are unclear, most studies in this review reported a decrease in utilization of services.33 The presumption of more efficient and higher quality care is also predicated on features such as system-wide accessibility of comprehensive medical records that provide more information to HCPs, promote collaboration, and measure and reward performance, all of which are possible using the VA electronic health record (EHR) system.35,36 The VA offers an excellent opportunity for training in integrated care as this model is required of all VAMCs and community-based outpatient clinics (CBOCs).37
Providing integrated care to the citizens of California is among the 10 priorities of the California Future Health Workforce Commission (a group of California health care leaders cochaired by the UC system president) for immediate action and guides their recommendations on developing and expanding the health care workforce; therefore, training in an integrated health care system is especially important for California HCPs.3 Nearly three-quarters of California’s population aged ≥ 65 years has a chronic health condition that could benefit from integrated care; however, the current supply of HCPs is insufficient to meet the growing demand for geriatric care.38,39
The VA has a robust training program to produce scholars and practitioners who specialize in geriatric care. This includes the Geriatric Scholars Program, which has the goal of integrating geriatrics into primary care through professional development. The Geriatric Scholars Program is a component of the VA Geriatric Research Education and Clinical Centers at urban VAMCs to help provide education and clinical resource connections with rural CBOCs where geriatrics expertise is lacking.
The California Future Health Workforce Commission is highlighting the need to prioritize workforce development in primary care, mental health care, and care for the aging.3 These priorities are shared as foundational services within the VHA.40 The alignment of these priorities creates an excellent rationale for increasing training and education of the UC health care workforce in the California VA system through academic affiliations.
VA Research Collaborations
The VA Office of Research and Development has existed for more than 90 years with a mission to improve veteran health and well-being via research and attract, train, and retain high-caliber researchers. VA provides a rich environment to conduct observational and interventional research due to its large, diverse veteran population, institutional support, and integrated information system with extensive EHR data.41 The success of the VA in facilitating research is evidenced by the fact that 3 VA investigators have been awarded Nobel prizes, and 7 have received Lasker Foundation Awards.42 The size of the VA allows for innovative large-scale research, such as the Million Veteran Program (MVP). The MVP study developed a mega-biobank of VA health records, questionnaires, and blood samples from nearly 1 million veterans to study genetic influences on health and disease and integrate genetic testing into health care delivery.43 In addition to producing high-quality, innovative research, more than 60% of VA investigators also provide direct patient care.42
VA research areas of focus include homelessness, polytrauma, traumatic brain injury, hearing and vision loss, spinal cord injury, mental health, pain management, precision medicine, prosthetics and amputation care, women’s health, and chronic diseases, such as Parkinson and Alzheimer diseases.44 The VA estimates that, in 2021, total VA research spending will include a request of $787 million in addition to $370 million from the National Institutes of Health, the Department of Defense, and the Centers for Disease Control and Prevention, and $170 million from other nonfederal sources, for a projected total of $1.3 billion. This budget will support 2,200 projects with direct research and reimbursable employment of 3,275 FTEs,which are key to supporting VA academic affiliations.45 These funds translate into substantial benefits to the UC system, including shared research and training resources, grant-funding opportunities for UC faculty, and the ability to recruit top researchers, educators, and clinicians to its institutions.
VA Reliance on Community Care
The current VHA model is an integrated health care system that provides comprehensive, wraparound services to enrolled veterans, which are cost-effective, high quality, and consistently found to have equal or superior quality of care compared with that in the community.6,46-50 Despite public criticism about wait times and access to care in the VA system, one study showed that VA wait-time statistics were comparable with or faster than those for community HCPs.51,52 However, VA care coordination has undergone several changes to address these public criticisms, namely, the Veterans Access, Choice and Accountability Act of 2014 (38 USC § 1703 VACAA) and the VA MISSION Act of 2018 (42 USC § 274). VACAA was designed to increase access to care for veterans who live ≥ 40 miles from VA health care facilities or who are unable to been seen within 30 days of their preferred or clinically appropriate date.53 More than 2 million veterans (almost 25% of VHA-enrolled veterans) have received community care since the inception of VACAA in 2014.54
Recently, the MISSION Act mandated developing additional VA-coordinated community-based care through the establishment of a Veterans Community Care Program, which was established using existing VA 2019 fiscal year funds and did not include additional appropriations despite expanded criteria for community care referrals.55 Without additional future appropriations, VA funds would be shifted from VA care into community care. While increasing access to community care has in some cases led to care that is faster and closer and that was previously inaccessible in local VA specialty care, these efforts could reduce veteran engagement with the VA system.56
The changes implemented in VACAA and the VA MISSION Act were driven by important and valid concerns, including evidence of VA staff and officials covering up service deficiencies.51 Veterans in rural areas often have limited access to VA resources, and long travel to VAMCs or clinics can be an impediment. Veterans who have chosen community care tended to be those who have poorer health status, who live further away from VA facilities, women, and those who identified as White or Hispanic.56,57 While VA health care is on average equivalent to or better than community resources, there is significant variability in quality within the VA system. Advocates have argued that providing competition and choice for veterans places pressure on the VA to improve care where it is not meeting expectations. Therefore, access to community care is an important resource for veterans and needs to be implemented effectively and efficiently to help veterans receive the care they need. However, expansion of community care access, depending on how it is implemented, also can have effects on academic partnerships and the education and research missions that should be incorporated into planning.
Each VA health care system receives funding through the Veterans Equitable Reimbursement Allocation (VERA), which provides funds largely based on the number of enrolled veterans and the complexity of the care they receive.58 One potential implication of the shift among veterans to community care is a reduction in patients enrolled in VA programs, thus decreasing funding given to the VA to allocate for training and research. By definition, increased VA-managed community care means less opportunity for integrated training that brings together primary, mental health, and substance use care to meet patient needs. The Center for Medicare and Medicaid Services has developed a national initiative to help states develop programs in integrated care, particularly for individuals who are eligible for both Medicare and Medicaid.59 For states to develop integrated care, they need trainees who function well in this model. Integrated care training is particularly vulnerable to disruption because any portion of a veteran’s care being transferred to the community can impede integration. In effect, training in integrated care, likely the most efficient and cost-effective approach to health care for reasons discussed earlier, could be reduced as providers and trainees are required to manage and coordinate patient care between separate institutions.35
Educational Impact
The shift in usage from VA to community care has potential implications for academic affiliates, particularly in education and research.60 If more people are served in community settings, potentially some VAMCs could be reduced, realigned, or closed. If this restructuring happens, academic partnerships could be impacted negatively. The VA is instituting an Infrastructure Review Commission with the task of examining current VA utilization. If a VA site with an academic affiliate was considered for realignment or closure, the reduction would eliminate the ability of the academic affiliate to provide education and research collaborations at that site.
In a less drastic manner, increasing care in the community may change opportunities for academic affiliates to partner with the VA. As noted, the UC system and California veterans benefit immensely from the VHA as an integrated health care system with dedicated missions of education and research. This partnership is a model in which the VA is the primary source of care for eligible enrolled veterans and provides integrated comprehensive services. If the VA moves to serving primarily as a coordinator of community HCPs rather than a direct provider of health care, academic affiliates would need to make major adjustments to both the education and training models. This change could particularly affect specialty training programs that rely on having adequate volumes of patients to provide an extensive experience to meet training needs. If fewer veterans receive care directly from the VA and are instead dispersed in the community, that will reduce the ability of academic faculty to participate in the education of medical and affiliated trainees and to participate in research in VA settings. It is unclear what other model could replace such a system and be as beneficial to the VA and the academic partners with which it is currently affiliated.
Given the needs that led to the VA increasing access to care and the potential implications discussed for the VA and partnerships with academic affiliates, VA health care systems and academic affiliate partners should consider several steps. These steps involve assessment, coordination, and promotion.
Both the VA and academic affiliates would benefit if the VA shared assessment data on the use of community care, particularly identifying changes that relate to key training and/or research missions. Such data sharing can be critical to determine whether any risks (or potential opportunities) need to be addressed. In addition, increasing research on the outcomes related to both VA care and community-based care is of high value to determine whether the current changes are achieving intended goals. The VA recently funded such work through its research service, and such work is critical for guiding future policy for the VA and for the affiliates.
Coordination among the VA, academic affiliates, and community partners is vital for change. The issue of community care expansion should be a standing item on coordination meetings and shared governance councils between the institutions. It may make sense to establish specific workgroups or committees to coordinate tracking and assessment of the effect of community care expansion on the shared academic mission. One way to address the potential effect of increased community care on the research and education missions would be to include community partners into the partnerships. This strategy could potentially take a number of different forms, from providing education and training to community HCPs, having VA trainees rotate to community settings, or inviting community settings to be research sites for clinical trials. Such partnerships could potentially improve patient care and support the other academic missions. Coordination could be meaningfully improved by having community HCPs access the VA EHR, thus easing communications. Funding is available for EHR access in the VA MISSION Act and should be a high priority as community care expands. The more that community partners can access and connect with the VA EHR the better they will be able to coordinate care.
Third, the VA and its academic partners need to promote and educate veterans, their families, and their advocates on the benefits that are available through VA care and that are enhanced through academic partnerships. While the VA has been the target of justified criticism, many of its strengths addressed here are not broadly recognized. The VA could promote its sharing of staff and resources with the top academic health care institutions in an area and that veterans often have access to resources that otherwise would not be available without the academic affiliate. Making sure veterans are aware of the benefits available can potentially mitigate the need for community care.
Conclusions
Given changes from VACAA and the VA MISSION Act, VA and academic affiliates should be active partners in planning for future health care by providing input and feedback on VA structure to help shape federal and state systems moving forward. Institutions can take steps to steer their futures and meet growing clinical, training, and research needs. The VA and its academic partners in health care research are well positioned to develop projects to assess the effects of these changes. Evaluation of key variables including patient care, education, and research productivity are warranted to guide policymakers as they assess whether these changes in the VA are achieving the expressed goals of improving veteran care. Other opportunities to collaborate in the wake of the MISSION Act remain to be discovered within each academic affiliation. By strengthening working relationships between VA and academic teams, these deeply important partnerships can continue to produce clinical, research, and education outcomes that meet the needs of our veterans, our federal and state health care systems, and our country.
Acknowledgments
Dr. Sells was supported by the Department of Veterans Affairs, Veterans Health Administration, Office of Academic Affiliations VA Quality Scholars Advanced Fellowship Program.
1. US Department of Veterans Affairs, Veterans Health Administration. About VHA. Updated January 22, 2021. Accessed March 9, 2021. https://www.va.gov/health/aboutvha.asp
2. National Academies of Sciences, Engineering, and Medicine; Health and Medicine Division; Board on Health Care Services; Committee to Evaluate the Department of Veterans Affairs Mental Health Services. Evaluation of the Department of Veterans Affairs Mental Health Services. National Academies Press; 2018. Accessed March 9, 2021. https://www.ncbi.nlm.nih.gov/books/NBK499502/
3. California Future Health Workforce Commission. Meeting the demand for health: final report of the California Future Health Workforce Commission. Published February 2019. Accessed March 9, 2021. https://futurehealthworkforce.org/wp-content/uploads/2019/03/MeetingDemandForHealthFinalReportCFHWC.pdf
4. US Department of Veterans Affairs. Veterans Health Administration fiscal year 2017 annual report. Published 2017. Accessed March 9, 2021. https://www.va.gov/HEALTH/docs/VHA_AnnualReport_FY2017.pdf
5. US Department of Veterans Affairs. Public health: health care use by Gulf War & OEF/OIF/OND veterans. Updated March 28, 2017. Accessed March 9, 2021. https://www.publichealth.va.gov/epidemiology/reports/health-care-use-gulfwar-oefoifond/index.asp
6. Eibner C, Krull H, Brown KM, et al. Current and projected characteristics and unique health care needs of the patient population served by the Department of Veterans Affairs. Rand Health Q. 2016;5(4):13.
7. US Department of Veterans Affairs. Patient care services: veterans with lesbian, gay, bisexual and transgender (LGBT) and related identities. Updated August 31, 2020. Accessed March 9, 2021. https://www.patientcare.va.gov/LGBT/index.asp
8. US Department of Veterans Affairs. Women veterans health care: women veterans program managers. Updated March 28, 2017. Accessed March 9, 2021. https://www.womens health.va.gov/WOMENSHEALTH/programoverview/wvpm.asp
9. US Department of Veterans Affairs, National Center for Veterans Analysis and Statistics. VA facilities by state. Published May 15, 2017. Accessed March 9, 2021. https://www.va.gov/vetdata/docs/SpecialReports/VA_Facilities_By_State.PDF
10. US Department of Veterans Affairs, National Center for Veterans Analysis and Statistics. State summaries: California. Published September 2018. Accessed March 9, 2021. https://www.va.gov/vetdata/docs/SpecialReports/State_Summaries_California.pdf
11. US Department of Veterans Affairs, Veterans Health Administration, Office of Patient Care Services, Post-Deployment Health Group, Epidemiology Program. Analysis of VA health care utilization among Operation Enduring Freedom (OEF), Operation Iraqi Freedom (OIF), and Operation New Dawn (OND) veterans. Published January 2017. Accessed March 9, 2021. https://www.publichealth.va.gov/docs/epidemiology/healthcare-utilization-report-fy2015-qtr3.pdf
12. US Department of Veterans Affairs, Office of Budget. Annual budget submission, president’s budget request – fiscal year 2021. Updated February 10, 2020. Accessed March 9, 2021. https://www.va.gov/budget/products.asp
13. US Department of Veterans Affairs. Department of Veterans Affairs statistics at a glance. Updated February 2020. Accessed March 10, 2021. https://www.va.gov/vetdata/docs/Quickfacts/Stats_at_a_glance_4_6_20.PDF
14. US Department of Veterans Affairs VW. Locations, California. Updated October 12, 2018. Accessed March 10, 2021. https://www.va.gov/directory/guide/state.asp?dnum=ALL&STATE=CA
15. Baker, R. R., & Pickren, W. E. (2007). Psychology and the Department of Veterans Affairs: A historical analysis of training, research, practice, and advocacy. American Psychological Association. doi:10.1037/11544-000
16. Functions of Veterans Health Administration: health-care personnel education and training programs. 38 USC § 7302. Accessed March 16, 2021. https://www.govinfo.gov/app/details/USCODE-2011-title38/USCODE-2011-title38-partV-chap73-subchapI-sec7302
17. US Department of Veterans Affairs, Office of Academic Affiliations. Mission of the Office of Academic Affiliations. Published September 24, 2019. Accessed March 10, 2021. https://www.va.gov/oaa/oaa_mission.asp
18. Congressional Research Service. Federal support for graduate medical education: an overview. CRS report R44376. Updated December 27, 2018. Accessed March 10, 2021. https://fas.org/sgp/crs/misc/R44376.pdf
19. Association of American Medical Colleges. 2018 Report on residents. Table B3: number of active residents, by type of medical school, GME specialty, and sex. Accessed March 10, 2021. https://www.aamc.org/data-reports/students-residents/interactive-data/table-b3-number-active-residents-type-medical-school-gme-specialty-and-sex
20. US Department of Veterans Affairs, Office of Academic Affiliations. National summary trainees unique school list - academic year: 2017-2018.
21. US Department of Veterans Affairs, Office of Academic Affiliations. VA nursing academic partnerships. Updated December 12, 2018. Accessed March 10, 2021. https://www.va.gov/oaa/vanap/default.asp
22. Keitz SA, Aron DC, Brannen JL, et al. Impact of clinical training on recruiting graduating health professionals. Am J Manag Care. 2019;25(4):e111-e118. Published 2019 Apr 1.
23. US Department of Veterans Affairs, Office of Academic Affiliations. Health professions education: academic year 2019-2020. Published 2020. https://www.va.gov/OAA/docs/OAA_Statistics_2020.pdf
24. US Department of Veterans Affairs, Veterans Health Administration. Hiring programs and initiatives. Updated March 10, 2021. Accessed March 10, 2021. https://www.vacareers.va.gov/Benefits/HiringProgramsInitiatives/
25. US Department of Veterans Affairs, Veterans Health Administration. Students and trainees. Updated March 10, 2021. Accessed March 10, 2021. https://www.vacareers.va.gov/Careers/StudentsTrainees
26. The Regents of the University of California. The UC system. Accessed March 10, 2021. https://www.universityofcalifornia.edu/uc-system
27. The Regents of the University of California. The parts of UC. Accessed March 10, 2021. https://www.universityofcalifornia.edu/uc-system/parts-of-uc
28. US Department of Veterans Affairs. Locations: VISN 21: Sierra Pacific Network. Updated October 12, 2018. Accessed March 10, 2021. https://www.va.gov/directory/guide/region.asp?ID=1021
29. Association of American Medical Colleges. California physician workforce profile. Published 2017. Accessed March 10, 2021. https://www.aamc.org/system/files/2019-08/california2017.pdf
30. Rittenhouse D, Ament A, Grumbach K, Petterson S, Levin Z, Bazemore A. California Health Care Foundation: guide to graduate medical education funding in California. Published September 2018. Accessed March 10, 2021. https://www.chcf.org/wp-content/uploads/2018/08/GuideGraduateMedicalEducationFunding.pdf
31. US Department of Health and Human Services, Health Resources and Services Administration. Integrated behavioral health resource library. Accessed March 18, 2020. https://www.hrsa.gov/behavioral-health/library
32. US Department of Veterans Affairs. Patient care services: primary care - mental health integration (PC-MHI). Updated August 1, 2016. Accessed March 10, 2021. https://www.patientcare.va.gov/primarycare/PCMHI.asp
33. Hwang W, Chang J, Laclair M, Paz H. Effects of integrated delivery system on cost and quality. Am J Manag Care. 2013;19(5):e175-e184.
34. World Health Organization, World Organization of Family Doctors (Wonca). Integrating mental health into primary care: a global perspective. Published October 2008. Accessed March 10, 2021. https://www.who.int/mental_health/policy/Integratingmhintoprimarycare2008_lastversion.pdf
35. Congressional Budget Office. Comparing the costs of the veterans’ health care system with private-sector costs. Published December 10, 2014. Accessed March 10, 2021. https://www.cbo.gov/publication/49763
36. Souden M. Overview of VA data, information systems, national databases and research uses. Published October 2, 2017. Accessed March 10, 2021. https://www.hsrd.research.va.gov/for_researchers/cyber_seminars/archives/2376-notes.pdf
37. US Department of Veterans Affairs, Veterans Health Administration. Uniform mental health services in VA medical centers and clinics. VHA handbook 1160.01. Published September 11, 2008. Recertified September 30, 2013. Amended November 16, 2015. Published September 11, 2008. Accessed March 10, 2021. https://www.va.gov/vhapublications/ViewPublication.asp?pub_ID=1762
38. Coffman JM, Fix M, Ko M. California physician supply and distribution: headed for a drought? Published June 25, 2018. Accessed March 10, 2021. https://www.chcf.org/publication/californias-physicians-headed-drought
39. Meng YY, Ahman T, Pickett M. California Health Care Foundation: 2015 Edition—Californians with the top chronic conditions: 11 million and counting. Published April 23, 2015. Accessed March 10, 2021. https://www.chcf.org/publication/2015-edition-californians-top-chronic-conditions-11-million-counting
40. US Department of Veterans Affairs. Department of Veterans Affairs FY 2018-2024 strategic plan. Updated May 31, 2019. Accessed March 10, 2021. https://www.va.gov/oei/docs/va2018-2024strategicplan.pdf
41. Justice AC, Erdos J, Brandt C, Conigliaro J, Tierney W, Bryant K. The Veterans Affairs healthcare system: a unique laboratory for observational and interventional research. Med Care. 2006;44(8)(suppl 2):S7-S12. doi:10.1097/01.mlr.0000228027.80012.c5
42. US Department of Veterans Affairs, Office of Research and Development: About the Office of Research & Development. Published Updated March 4, 2021. Accessed March 10, 2021. https://www.research.va.gov/about/default.cfm
43. Gaziano JM, Concato J, Brophy M, et al. Million Veteran Program: a mega-biobank to study genetic influences on health and disease. J Clin Epidemiol. 2016;70:214-223. doi:10.1016/j.jclinepi.2015.09.016
44. US Department of Veterans Affairs. VA research program overview. Accessed March 12, 2021. https://www.research.va.gov/pubs/docs/va-research-overview-brochure.pdf
45. US Department of Veterans Affairs. FY 2021 budget submission: medical programs and information technology programs. Volume 2 of 4. Published February 2020. Accessed March 12, 2021. https://www.va.gov/budget/docs/summary/fy2021VAbudgetVolumeIImedicalProgramsAndInformationTechnology.pdf
46. Trivedi AN, Matula S, Miake-Lye I, Glassman PA, Shekelle P, Asch S. Systematic review: comparison of the quality of medical care in Veterans Affairs and non-Veterans Affairs settings. Med Care. 2011;49(1):76-88. doi:10.1097/MLR.0b013e3181f53575
47. Nugent GN, Hendricks A, Nugent L, Render ML. Value for taxpayers’ dollars: what VA care would cost at Medicare prices. Med Care Res Rev. 2004;61(4):495-508. doi:10.1177/1077558704269795
48. Anhang Price R, Sloss EM, Cefalu M, Farmer CM, Hussey PS. Comparing quality of care in Veterans Affairs and non-Veterans Affairs settings. J Gen Intern Med. 2018;33(10):1631-1638. doi:10.1007/s11606-018-4433-7
49. O’Hanlon C, Huang C, Sloss E, et al. Comparing VA and non-VA quality of care: a systematic review. J Gen Intern Med. 2017;32(1):105-121. doi:10.1007/s11606-016-3775-2
50. Vanneman ME, Wagner TH, Shwartz M, et al. Veterans’ experiences with outpatient care: comparing the Veterans Affairs system with community-based care. Health Aff (Millwood). 2020;39(8):1368-1376. doi:10.1377/hlthaff.2019.01375
51. US Department of Veterans Affairs, Office of Inspector General. Veterans Health Administration interim report: review of patient wait times, scheduling practices, and alleged patient deaths at the Phoenix health care system. Published May 28, 2014. Accessed March 12, 2021. https://www.va.gov/oig/pubs/VAOIG-14-02603-178.pdf
52. Penn M, Bhatnagar S, Kuy S, et al. Comparison of wait times for new patients between the private sector and United States Department of Veterans Affairs medical centers. JAMA Netw Open. 2019;2(1):e187096. doi:10.1001/jamanetworkopen.2018.7096
53. US Department of Veterans Affairs. Fact sheet: Veterans Access, Choice and Accountability Act of 2014 (“Choice Act”). Accessed March 12, 2021. https://www.va.gov/opa/choiceact/documents/choice-act-summary.pdf
54. Mattocks KM, Cunningham K, Elwy AR, et al. Recommendations for the evaluation of cross-system care coordination from the VA State-of-the-art Working Group on VA/Non-VA Care. J Gen Intern Med. 2019;34(Suppl 1):18-23. doi:10.1007/s11606-019-04972-1
55. US Department of Veterans Affairs. Fact sheet: VA MISSION Act and new veterans community care program. Published June 15, 2018. Accessed March 12, 2021. https://www.va.gov/COMMUNITYCARE/docs/pubfiles/factsheets/FactSheet_20-13.pdf
56. Stroupe KT, Martinez R, Hogan TP, et al. Experiences with the veterans’ choice program. J Gen Intern Med. 2019;34(10):2141-2149. doi:10.1007/s11606-019-05224-y
57. Yoon J, Leung LB, Rubenstein LV, et al. Use of the veterans’ choice program and attrition from Veterans Health Administration primary care. Med Care. 2020;58(12):1091-1097. doi:10.1097/MLR.0000000000001401
58. US Department of Veterans Affairs. Veterans Equitable Resource Allocation (VERA). Updated March 9, 2021. Accessed March 12, 2021. https://catalog.data.gov/dataset/veterans-equitable-resource-allocation-vera
59. Integrated Care Resource Center. About us. Accessed March 12, 2021. https://www.integratedcareresourcecenter.com/about-us
60. Duhaney T. How veteran utilization of the Veterans Health Administration could impact privatization. Public Policy Aging Rep. 2020;30(1):29-35. doi:10.1093/ppar/prz032