User login
Clinical Guideline Highlights for the Hospitalist: Evaluation and Management of Well-Appearing Febrile Infants 8 to 60 Days Old
Invasive bacterial infections (IBI; ie, bacterial meningitis, bacteremia) are an uncommon but potentially devastating occurrence in young febrile infants. The challenge for clinicians is that physical examination cannot reliably exclude such infections. Thus, these infants have historically received comprehensive emergency department evaluation, including routine cerebrospinal fluid (CSF) assessment, and, often, required hospitalization for parenteral antibiotic administration while awaiting CSF culture results. The new American Academy of Pediatrics (AAP) guidelines were necessary given changing bacteriology, advances in diagnostic testing, greater insight into the differential risk of poor outcomes by site of infection, and better appreciation of the potential harms of unnecessary care and interventions.1 The 21 recommendations apply to well-appearing febrile infants 8 to 60 days of age, with recommendations stratified by age group, and exclude infants with certain conditions, including prematurity, focal bacterial infection, congenital or chromosomal abnormalities, and bronchiolitis. Four key recommendations are highlighted.
KEY RECOMMENDATIONS FOR THE HOSPITALIST
Recommendation 1: Diagnostic evaluation. For all age groups, blood culture and urinalysis (UA) are routinely recommended. For infants 8 to 21 days old, urine culture is routinely recommended. For older infants, urine culture is recommended if the UA is positive. All specimens for culture should be obtained via catheterization or suprapubic aspiration.
Infants 8 to 21 days old
- May assess inflammatory markers (grade B, weak).
- Should obtain CSF for analysis and culture (grade A, strong).
Infants 22 to 28 days old
- Should assess inflammatory markers (grade B, strong).
- May obtain CSF for analysis and culture even if no inflammatory marker obtained is abnormal (grade B, moderate).
- Should obtain CSF for analysis and culture if any inflammatory marker obtained is abnormal (procalcitonin >0.5 ng/mL [preferred]; C-reactive protein >20 mg/L; absolute neutrophil count >4000-5200/mm3; or temperature >38.5 °C) (grade B, moderate).
Infants 29 to 60 days old
- Should assess inflammatory markers (grade B, moderate).
- May obtain CSF for analysis and culture if any inflammatory marker is abnormal, (grade C, weak).
- Need not obtain CSF for analysis if all inflammatory markers obtained are normal (grade B, moderate).
Recommendation 2: Initial disposition decision
Infants 8 to 21 days old
- Admit (grade B, moderate).
Infants 22 to 28 days old
- Admit if CSF analysis is abnormal, UA is positive (A, strong), or if CSF is not obtained or is uninterpretable (grade B, weak).
- May manage at home if UA is normal, inflammatory markers are normal, CSF is normal or enterovirus positive, family has received verbal and written home monitoring instructions for concerning signs that should prompt immediate return for care, follow-up plan for reevaluation in 24 hours is in place, and means of communication for change in clinical status has been established (grade B, moderate).
Infants 29 to 60 days old
- Admit if CSF analysis is abnormal (grade A strong).
- May hospitalize if any inflammatory marker obtained is abnormal (grade B, moderate).
- Should manage at home if all the following are present: CSF is normal, if obtained; UA is negative; all inflammatory markers obtained are normal; teaching is complete; follow-up plan for reevaluation in 24 hours is in place; and means of communication for change in clinical status has been established (grade B, moderate).
Recommendation 3: Empiric antimicrobial treatment
Infants 8 to 21 days old
- Should initiate parenteral antimicrobial therapy (grade A, strong).
- This recommendation is based on the high prevalence of IBIs in this age category, and IBI may be present despite a negative UA and/or normal inflammatory markers.
Infants 22 to 28 days old
- Should initiate parenteral antimicrobial therapy if either CSF analysis suggests bacterial meningitis or UA is positive (grade A, strong).
- May administer parenteral antimicrobial therapy if any inflammatory marker is abnormal (grade B, moderate).
- May administer parenteral antimicrobial therapy even if everything is reassuring (grade B, weak).
- Should administer parenteral antimicrobial therapy to infant who will be managed at home even if all evaluation is reassuring (grade C, moderate).
Infants 29 to 60 days old
- Should start parenteral antimicrobials if CSF analysis suggests bacterial meningitis (grade A, strong).
- May use parenteral antimicrobials if any inflammatory marker is abnormal (grade B, moderate).
- Should initiate oral antimicrobial therapy if CSF is normal (if obtained), UA is positive, and no inflammatory markers obtained are abnormal (grade B, strong).
- Need not start antimicrobials if CSF is normal or enterovirus positive, UA is negative, and no inflammatory marker obtained is abnormal (grade B, moderate).
Recommendation 4: Hospital discharge decision
Infants 8 to 21 days old AND Infants 22 to 28 days ol
- Discontinue antibiotics and discharge infant when culture results are negative for 24 to 36 hours (or positive only for contaminants), the infant is well or improving, and there are no other reasons for hospitalization (grade B, strong).
Infants 29 to 60 days old
- Although no specific parameters are given for infants without UTI, presumably the discharge criteria for younger infants would also apply for this group.
- For infants with UTI, discharge if blood and CSF cultures are negative, infant is well or improving, and no other reasons for hospitalization remain (grade B, strong).
CRITIQUE
The guideline provides opportunities for safely doing less in a vulnerable population. For example, infants with UTIs may be managed differently (eg, often with oral antibiotics) from those with IBIs, which represents an important change from conventional practice.2 Additional strengths are the incorporation of procalcitonin, which has emerged as the most accurate marker for risk stratification;3 and deemphasis of complete blood count results.
Multiple exclusions for relatively common scenarios represent missed opportunities for a more complete set of recommendations for the febrile infant population. The decision to exclude infants in the first week of life is perplexing since infants 0 to 7 days old will receive CSF analysis, require admission, and generally be managed comparably to infants 8 to 21 days old. Infants with bronchiolitis are excluded; the absence of uniform guidance may perpetuate variability in management within and across institutions. Finally, exclusion of infants in whom perinatal or congenital herpes simplex virus is a consideration is not ideal. The requirement to consult separate guidance for herpes simplex virus evaluation fragments decision-making and may lead to inadvertent omissions of critical tests or treatment in at-risk infants.
Methods in Preparing the Guideline
The guideline working group included stakeholders from multiple specialties including general pediatrics, emergency medicine, hospital medicine, infectious diseases, and family medicine. In addition to published studies, the committee considered an Agency for Healthcare Research and Quality commissioned systematic review, as well as analyses of additional data solicited from previously published peer-reviewed studies. Once recommendations were formulated, additional input from physician focus groups and parents was solicited. Recommendations were rated based on strength of available evidence (A, B, C, D, X) as well as assessment of the benefit/harm profile (strong, moderate, weak).
Sources of Potential Conflicts of Interest or Bias
The guideline writing group was predominantly male, though we note that the broader working group was diverse in gender and specialty. No significant conflicts of interest were noted.
Generalizability
The complexity of this guideline, including age stratification, multiple exclusions, and multistep processes could lead to challenges in implementation; a health information technology application (app) could substantially ease the difficulty of implementation at the point of care.
AREAS IN NEED OF FUTURE STUDY
Additional areas in need of guidance include neonates with bronchiolitis and fever and neonates with focal infection. For the former, there is an abundance of evidence;4 what is needed is consensus. For the latter, additional study is needed such as the role of inflammatory markers in stratifying infants with focal infection who need additional evaluation prior to treatment.
1. Pantell RH, Roberts KB, Adams WG, et al; Subcommittee on Febrile Infants. Evaluation and management of well-appearing febrile infants 8-60 days old. Pediatrics. 2021; 148(2):e2021052228. https://doi.org/10.1542/peds.2021-052228
2. Chang PW, Wang ME, Schroeder AR. Diagnosis and management of UTI in febrile infants age 0-2 months: applicability of the AAP guideline. J Hosp Med. 2020;15(3): 176-180. https://doi.org/10.12788/jhm.3349
3. Wang ME, Srinivas N, McCulloh RJ. Clinical progress note: procalcitonin in the identification of invasive bacterial infections in febrile young infants. J Hosp Med. 2021; 16(3): 165-167. https://doi.org/10.12788/jhm.3451
4. Ralston S, Hill V, Waters A. Occult serious bacterial infection in infants younger than 60 to 90 days with bronchiolitis: a systematic review. Arch Pediatr Adolesc Med. 2011;165(10):951-956. https://doi.org/1 0.1001/archpediatrics.2011.155
Invasive bacterial infections (IBI; ie, bacterial meningitis, bacteremia) are an uncommon but potentially devastating occurrence in young febrile infants. The challenge for clinicians is that physical examination cannot reliably exclude such infections. Thus, these infants have historically received comprehensive emergency department evaluation, including routine cerebrospinal fluid (CSF) assessment, and, often, required hospitalization for parenteral antibiotic administration while awaiting CSF culture results. The new American Academy of Pediatrics (AAP) guidelines were necessary given changing bacteriology, advances in diagnostic testing, greater insight into the differential risk of poor outcomes by site of infection, and better appreciation of the potential harms of unnecessary care and interventions.1 The 21 recommendations apply to well-appearing febrile infants 8 to 60 days of age, with recommendations stratified by age group, and exclude infants with certain conditions, including prematurity, focal bacterial infection, congenital or chromosomal abnormalities, and bronchiolitis. Four key recommendations are highlighted.
KEY RECOMMENDATIONS FOR THE HOSPITALIST
Recommendation 1: Diagnostic evaluation. For all age groups, blood culture and urinalysis (UA) are routinely recommended. For infants 8 to 21 days old, urine culture is routinely recommended. For older infants, urine culture is recommended if the UA is positive. All specimens for culture should be obtained via catheterization or suprapubic aspiration.
Infants 8 to 21 days old
- May assess inflammatory markers (grade B, weak).
- Should obtain CSF for analysis and culture (grade A, strong).
Infants 22 to 28 days old
- Should assess inflammatory markers (grade B, strong).
- May obtain CSF for analysis and culture even if no inflammatory marker obtained is abnormal (grade B, moderate).
- Should obtain CSF for analysis and culture if any inflammatory marker obtained is abnormal (procalcitonin >0.5 ng/mL [preferred]; C-reactive protein >20 mg/L; absolute neutrophil count >4000-5200/mm3; or temperature >38.5 °C) (grade B, moderate).
Infants 29 to 60 days old
- Should assess inflammatory markers (grade B, moderate).
- May obtain CSF for analysis and culture if any inflammatory marker is abnormal, (grade C, weak).
- Need not obtain CSF for analysis if all inflammatory markers obtained are normal (grade B, moderate).
Recommendation 2: Initial disposition decision
Infants 8 to 21 days old
- Admit (grade B, moderate).
Infants 22 to 28 days old
- Admit if CSF analysis is abnormal, UA is positive (A, strong), or if CSF is not obtained or is uninterpretable (grade B, weak).
- May manage at home if UA is normal, inflammatory markers are normal, CSF is normal or enterovirus positive, family has received verbal and written home monitoring instructions for concerning signs that should prompt immediate return for care, follow-up plan for reevaluation in 24 hours is in place, and means of communication for change in clinical status has been established (grade B, moderate).
Infants 29 to 60 days old
- Admit if CSF analysis is abnormal (grade A strong).
- May hospitalize if any inflammatory marker obtained is abnormal (grade B, moderate).
- Should manage at home if all the following are present: CSF is normal, if obtained; UA is negative; all inflammatory markers obtained are normal; teaching is complete; follow-up plan for reevaluation in 24 hours is in place; and means of communication for change in clinical status has been established (grade B, moderate).
Recommendation 3: Empiric antimicrobial treatment
Infants 8 to 21 days old
- Should initiate parenteral antimicrobial therapy (grade A, strong).
- This recommendation is based on the high prevalence of IBIs in this age category, and IBI may be present despite a negative UA and/or normal inflammatory markers.
Infants 22 to 28 days old
- Should initiate parenteral antimicrobial therapy if either CSF analysis suggests bacterial meningitis or UA is positive (grade A, strong).
- May administer parenteral antimicrobial therapy if any inflammatory marker is abnormal (grade B, moderate).
- May administer parenteral antimicrobial therapy even if everything is reassuring (grade B, weak).
- Should administer parenteral antimicrobial therapy to infant who will be managed at home even if all evaluation is reassuring (grade C, moderate).
Infants 29 to 60 days old
- Should start parenteral antimicrobials if CSF analysis suggests bacterial meningitis (grade A, strong).
- May use parenteral antimicrobials if any inflammatory marker is abnormal (grade B, moderate).
- Should initiate oral antimicrobial therapy if CSF is normal (if obtained), UA is positive, and no inflammatory markers obtained are abnormal (grade B, strong).
- Need not start antimicrobials if CSF is normal or enterovirus positive, UA is negative, and no inflammatory marker obtained is abnormal (grade B, moderate).
Recommendation 4: Hospital discharge decision
Infants 8 to 21 days old AND Infants 22 to 28 days ol
- Discontinue antibiotics and discharge infant when culture results are negative for 24 to 36 hours (or positive only for contaminants), the infant is well or improving, and there are no other reasons for hospitalization (grade B, strong).
Infants 29 to 60 days old
- Although no specific parameters are given for infants without UTI, presumably the discharge criteria for younger infants would also apply for this group.
- For infants with UTI, discharge if blood and CSF cultures are negative, infant is well or improving, and no other reasons for hospitalization remain (grade B, strong).
CRITIQUE
The guideline provides opportunities for safely doing less in a vulnerable population. For example, infants with UTIs may be managed differently (eg, often with oral antibiotics) from those with IBIs, which represents an important change from conventional practice.2 Additional strengths are the incorporation of procalcitonin, which has emerged as the most accurate marker for risk stratification;3 and deemphasis of complete blood count results.
Multiple exclusions for relatively common scenarios represent missed opportunities for a more complete set of recommendations for the febrile infant population. The decision to exclude infants in the first week of life is perplexing since infants 0 to 7 days old will receive CSF analysis, require admission, and generally be managed comparably to infants 8 to 21 days old. Infants with bronchiolitis are excluded; the absence of uniform guidance may perpetuate variability in management within and across institutions. Finally, exclusion of infants in whom perinatal or congenital herpes simplex virus is a consideration is not ideal. The requirement to consult separate guidance for herpes simplex virus evaluation fragments decision-making and may lead to inadvertent omissions of critical tests or treatment in at-risk infants.
Methods in Preparing the Guideline
The guideline working group included stakeholders from multiple specialties including general pediatrics, emergency medicine, hospital medicine, infectious diseases, and family medicine. In addition to published studies, the committee considered an Agency for Healthcare Research and Quality commissioned systematic review, as well as analyses of additional data solicited from previously published peer-reviewed studies. Once recommendations were formulated, additional input from physician focus groups and parents was solicited. Recommendations were rated based on strength of available evidence (A, B, C, D, X) as well as assessment of the benefit/harm profile (strong, moderate, weak).
Sources of Potential Conflicts of Interest or Bias
The guideline writing group was predominantly male, though we note that the broader working group was diverse in gender and specialty. No significant conflicts of interest were noted.
Generalizability
The complexity of this guideline, including age stratification, multiple exclusions, and multistep processes could lead to challenges in implementation; a health information technology application (app) could substantially ease the difficulty of implementation at the point of care.
AREAS IN NEED OF FUTURE STUDY
Additional areas in need of guidance include neonates with bronchiolitis and fever and neonates with focal infection. For the former, there is an abundance of evidence;4 what is needed is consensus. For the latter, additional study is needed such as the role of inflammatory markers in stratifying infants with focal infection who need additional evaluation prior to treatment.
1. Pantell RH, Roberts KB, Adams WG, et al; Subcommittee on Febrile Infants. Evaluation and management of well-appearing febrile infants 8-60 days old. Pediatrics. 2021; 148(2):e2021052228. https://doi.org/10.1542/peds.2021-052228
2. Chang PW, Wang ME, Schroeder AR. Diagnosis and management of UTI in febrile infants age 0-2 months: applicability of the AAP guideline. J Hosp Med. 2020;15(3): 176-180. https://doi.org/10.12788/jhm.3349
3. Wang ME, Srinivas N, McCulloh RJ. Clinical progress note: procalcitonin in the identification of invasive bacterial infections in febrile young infants. J Hosp Med. 2021; 16(3): 165-167. https://doi.org/10.12788/jhm.3451
4. Ralston S, Hill V, Waters A. Occult serious bacterial infection in infants younger than 60 to 90 days with bronchiolitis: a systematic review. Arch Pediatr Adolesc Med. 2011;165(10):951-956. https://doi.org/1 0.1001/archpediatrics.2011.155
© 2021 Society of Hospital Medicine
The Expansion of Associated Health Training in the VA
The US Department of Veterans Affairs (VA) is the largest health care delivery system in the United States, comprising 1293 sites of care, including 171 medical centers.1 One of the 4 statutory missions of the VA is to train health care professionals (HCPs) to meet the needs of the VA and the nation.2 Through partnerships with more than 1800 accredited colleges, universities, and training programs, the VA provides training annually to nearly 118,000 health professions trainees (HPTs) across a variety of health care professions, and all of whom provide direct clinical care to veterans.3
In the VA, the Office of Academic Affiliations (OAA) is charged with overseeing health professions training and the VA’s partnership with medical and associated health (AH) professions schools, which was first codified in Policy Memorandum No. 2 in 1946.4,5 Given the scope and breadth of health professions education offered through the VA, OAA is in a unique position to address health care shortage areas as well as influence the educational standards for certain professions.
Many of these health care professions fall under the rubric of AH, which include mental health (MH) specialties, rehabilitative specialties, and others. These professions are critical to address in the expanding world of health care in the United States with its increased specialization and emphasis on coordination of care with interprofessional teams. During the 2019/2020 academic year, the VA provided clinical training to approximately 21,000 AH HPTs from > 40 professions with just over 20% receiving financial support through the OAA. Of the HPTs who train at VA without compensation, most spend shorter amounts of time in clinical rotations in the VA, are in pregraduate-degree education programs where payment for clinical rotations is not expected and may not be eligible for hire immediately on completion of their clinical training experience. The 17 funded professions have been strategically selected by the OAA to ensure a robust pipeline of HCPs to meet the needs of veterans and the nation.
To meet the demands of AH professionals (AHPs), the OAA implemented targeted expansion over the past 10 years. While not exhaustive, this paper describes several expansion efforts based on VA special initiatives, including enhancing clinical access in rural settings and shifting toward postgraduate-degree training and specialization. By aligning expansion with VA priorities as well as trends in health care more broadly, the OAA can ensure that there is a supply of well-trained AHPs who have developed the requisite competencies to contribute to our nation’s health care needs. Further, expansion can help train and recruit health professionals who can be hired into VA positions ready to care for the complex needs of veterans.
Associated Health Professionals
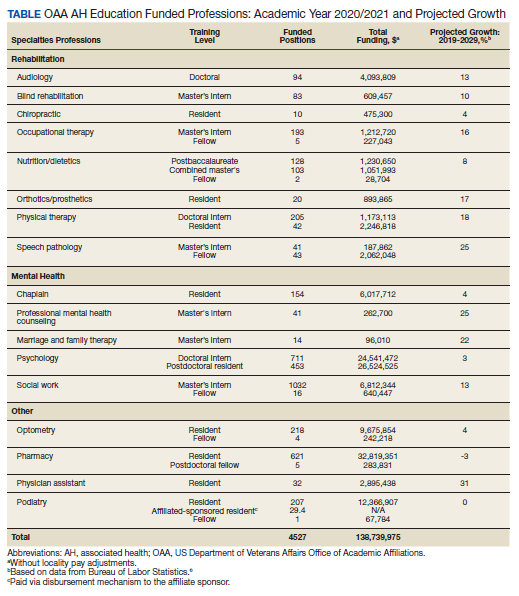
Overseen by the OAA, AH expansion is designed to address the specific needs of the VA and the US health care system. Data from the VA Workforce Management and Consulting (WMC) shows that the VA employment of AHPs has grown from 87,351 AHPs hired in fiscal year (FY) 2010 to 119,120 as of April 2020. This represents an average yearly growth rate of 3.4% and a total growth rate of 36%. The Bureau of Labor Statistics predictions for 2019/2029 suggest that certain AHPs are expected to have a 10-year growth rates of 20% or more to meet the changing health care needs of patients especially as the population ages; the growth rates for many AHPs far surpasses that of physicians, which is anticipated to be 4% (Table).6,7 The VA WMC expects an additional 52,283 AHPs will be hired by the VA by FY 2030 based on the 10-year average growth rate (Kali Clark, Veterans Health Administration Workforce Management and Consulting Office, email communication, May 28, 2020).
One of the driving forces behind the growth rate is the move toward using AHPs to supplement health care for a variety of health conditions.8,9 Examples include the integration of rehabilitation professionals, alternative care professionals (eg, massage therapists, practitioners who offer training in yoga and meditation), chiropractors, MH professionals, and pharmacists in the treatment of chronic pain, the use of a wider range of professionals in the treatment of MH conditions, and the integration of MH professionals into traditional medical settings, such as primary care. This intentional move to a more well-integrated model of interprofessional care is apparent in many other health care systems throughout the United States. Within the VA, this shift may be most evident through the introduction of the Whole Health model of care. The Whole Health model of care uses an interprofessional team to assess and care for veterans, using a personalized health plan addressing medical and MH conditions as well as behavioral, social, or spiritual concerns.10 The Whole Health model of care provides veterans with access to a variety of health care services, including but not limited to MH services, spiritual interventions, exercise-based programs, yoga, meditation, and nutrition counseling.
The OAA and AH education division have focused expansion to meet the increased need for MH and rehabilitation providers, to enhance interprofessional education, and to emphasize postgraduate-degree clinical training. This focus reflects the trends seen in health care training broadly throughout the nation and the intentional pivot is a model of these trends and a model for how to intentionally address these trends. Specific to the VA, focused expansion plans have allowed OAA to address VA strategic initiatives such as pain management and caring for rural veterans.
Funded Training Positions
As a result of recent AH expansion efforts, there has been a 33% increase in stipend-funded positions during the past 10 years, a rate that directly corresponds with the growth of AHPs in the VA. Recent AH expansion efforts can contribute to a particularly positive impact in highly rural and underserved areas where recruiting providers remains challenging.
The OAA launched the Mental Health Education Expansion (MHEE) initiative in 2012, which has now added 782 funded training slots across 10 health professions, 8 of which are psychology, pharmacy, chaplaincy, professional MH counseling, marriage and family therapy (MFT), social work (SW), occupational therapy (OT), and physician assistant (PA). Through the MHEE initiative, the VA has established funded internships for licensed professional mental health counselors and marriage and family therapists, as these professions are targeted for expanding the overall MH workforce in the VA. The OAA currently funds more than 50 total HPT positions for these 2 professions with an aim of increasing their recruitment to the VA MH workforce over the next decade. The MHEE is aligned with specified VA priorities to train a future VA workforce prepared for interprofessional collaboration and clinical care in an increasingly integrated and complex environment. This expansion effort also aligns with an increasing understanding of the importance of addressing the MH needs of our nation by ensuring there is an adequate supply of competent, well-trained clinicians entering the workforce.
The OAA has created and expanded residencies and fellowships in multiple rehabilitation professions, including chiropractic, physical therapy (PT), and OT. With the increased focus on the management of chronic pain in the nation combined with a specific emphasis on this clinical need in the VA, chiropractors have been deemed essential HCPs. In 2014, the VA established 5 chiropractic residency programs while partnering with the Council on Chiropractic Education to develop accreditation standards for residency training. OAA’s efforts have yielded 5 accredited residency programs, the first in the United States. In 2020, the VA doubled the number of available chiropractic residency programs, and future expansion is anticipated. Since 2010, PT residencies have expanded from 1 to 28 programs (42 funded positions) across 4 board certification specialties: cardiovascular-pulmonary, geriatric, neurologic, and orthopedic. Similarly, the VA was one of the first organizations to achieve accreditation for OT fellowships; there are currently 5 accredited OT fellowship programs across 3 areas of practice: assistive technology, MH, and physical rehabilitation. The VA OT fellowship program focused on assistive technology is the only program in the United States at this time.
Interprofessional Education
As one of the primary focus areas for AH expansion, interprofessional education (IPE) has been recognized as increasingly important for the provision of health care and the development of HPT programs. IPE can develop professionals who appreciate the roles of diverse professions and can use teamwork to enhance clinical outcomes for patients.11 There also are a growing number of professional organizations supporting the Interprofessional Education Collaborative with many representing AHPs.12 Collaboration across HCPs is an important way of reducing health care costs by enhancing clinical outcomes, communication, and teamwork.13-16 The VA and the nation’s health care system benefit from the by-products of interprofessional collaboration through investment in targeted training programs. In each phase of the AH expansion, special consideration was given to applicant programs offering unique and innovative clinical and educational experiences consistent with the promotion of interprofessional care. In doing so, increased numbers of AH HPTs have engaged in team-based clinical care.
Pain Management Pharmacy
The efforts of AH to align expansion with high-priority agency-wide efforts has resulted in the growth of pharmacy residency positions focused on pain management. Pharmacy postgraduate year (PGY) 2 residencies focusing on opioid reduction are an example of VA efforts to improve response to managing chronic pain and the long-term risks from opioid use during this national public health crisis.17 These residency programs focus on strategies to reduce the use of opioid medications in the clinical setting and teaching effective clinical interventions for reducing the rates of opioid addiction in veterans while still recognizing the need to identify and treat chronic pain. Before expansion efforts in 2018, there were 6 pharmacy residency programs focused on opioid use reduction in the VA, 8 pharmacy PGY2 residency positions were added in academic year 2019/2020, an additional 5 positions are being added in academic year 2021/2022 with the explicit goal of managing patients with high-risk chronic pain.
Rural Health
The lack of MH providers in rural areas has received much attention and is particularly important in the VA because veterans are more likely to live in less populated areas.18 The VA mandate to address this population was codified by the creation of the Office of Rural Health in 2006 via 38 USC § 7308.19Creating health professions training programs in rural settings provides HPTs the opportunity to learn professional competencies and train with faculty knowledgeable about this population—all of which provide a comprehensive training experience and serve as a recruitment pathway to hire HPTs into staff positions at these sites.19
When MHEE was initiated, not all regions of the country had funded VA psychology training programs, and this geographic gap in psychology training was a contributing factor to recruitment difficulties for psychologists in rural areas. As a result, the request for proposal process in the OAA highlighted and incentivized rurality when considering funding for new training programs. The OAA defined rurality as the number of patients served by the proposed health care facility who lived in a rural or highly rural zip code according to VA Support Service Center Capital Assets data.20 As a result, VA psychology doctoral internships expanded to be available in all states, the District of Columbia, and Puerto Rico. MH training programs were started in the highly rural states of Montana and Wyoming. These expansion efforts promise to be an essential component to addressing the gaps in coverage in rural settings as noted in recent research.21
Pregraduate to Postgraduate Programs
The OAA AH education division supports a significant number of pregraduate-degree and postgraduate-degree training. Some professions, such as psychology, pharmacy, SW, PT, speech pathology, OT, and nutrition/dietetics receive funding at both levels of training. More recent, the OAA has started to move funding from pregraduate to postgraduate-degree positions, specifically within professions where pregraduate funding is uncommon for both federal and nonfederal training positions. The effort is designed to better align stipend-paid training programs with the VA Professional Qualification Standards and the final level of training required for employment in the VA.22This means that HPTs receive stipend support during the highest level of their clinical training before degree conferral, eligibility for VA employment, or while participating in a postgraduate-degree residency or fellowship.
Additionally, this shift in focus and the resulting internal assessment of professions has allowed the OAA to fund more specialized training opportunities, which sometimes go beyond what is required by accrediting bodies or for recruitment into VA positions. For example, the OAA is supporting SW fellowship programs and PA residency positions to allow for greater specialization within these professions; the accrediting agencies for both professions have recently finalized their accreditation standards, and the OAA played a role in moving these standards forward.
While postgraduate residencies and fellowships are not required for all AH HPTs or for employment in the VA, there is a shift in some professions to encourage postgraduate training in advanced competencies in specialized areas. Participation in a residency or fellowship training program affords HPTs additional time and diverse clinical experiences to acquire clinical skills, all while under the supervision of a highly trained practitioner. This additional training also allows for a longitudinal assessment of the HPT to ensure an alignment of the HPTs’ knowledge, abilities, and skills with the expectation should they pursue VA employment.
In academic year 2019/2020, the OAA AH education division in conjunction with the PA national program office transitioned the entirety of the PA pregraduate-degree student positions (415 funded positions) to residency positions, increasing residency positions from 19 to 32 funded positions. This shift in emphasis for funding did not negatively impact the total number of pregraduate PA students receiving training in the VA and has created a pipeline of residency graduates who are ready to enter VA staff positions. To date, the VA has 14 PA residency programs across 3 specialties: emergency medicine (EM), MH, and primary care/geriatrics. Of these tracks, the VA offers 5 EM and 4 MH residencies that position graduates to be eligible for specialty certification. The National Commission on Certification of Physician Assistants established Certificates of Added Qualifications (CAQ) to recognize and document specialty knowledge, skills, and experience. The VA MH residency programs have been established to align with the CAQ expectations, and residents immediately qualify to take the CAQ examination after the completion of training.
Currently, the same process to move pregraduate to postgraduate funding is being implemented for PT and OT. Within the PT profession, there is increased momentum toward residency and fellowship training programs to respond to the changing complexity of the health care systemand reduce the need of complex care to be provided by non-VA providers in the community.23 Both PT and OT have entered the initial phases of transitioning to residency or fellowship-funded positions. The OAA is partnering with these professions to move positions to postgraduate degree within the next 3 years with a commensurate increase in funding. The initial data indicate that 80% of graduated VA PT residents are board-certification eligible, and 89% of those who are eligible passed the examination on their first attempt.
Since 2013, the VA psychology training also has realized a growth in postgraduate-degree residencies. Psychology residency positions have increased 99% to 453 funded positions. This growth represents increased specialization in neuropsychology, geropsychology, rehabilitation psychology, and health psychology. Additionally, postgraduate residencies meet most jurisdictional requirements for postdoctoral supervised experience and better prepare HPTs to enter specialty staff positions that are necessary to care for aging veterans.
Additional professions are being targeted for postgraduate-degree training programs, including dietetics and speech pathology, to align with upcoming changes in the qualification standards for employment. While the process to transition positions to postgraduate-degree training programs can take 3 to 5 years, the outcomes are expected to result in better prepared HPTs who can fill staff vacancies in the VA.
Conclusions
Through its funding and oversight of numerous professions, the OAA is uniquely situated to adapt its portfolio to meet the needs of the VA and the nation. Over the past 10 years, the OAA has expanded its total number of HPT positions to enhance interprofessional care, respond to the VA’s strategic initiatives, address the care needs of rural veterans, and shift positions to postgraduate training programs. The OAA’s investment in high-quality training programs builds a strong health care workforce ready to meet the needs of an increasingly complex and integrated health care environment.
The OAA anticipates future expansion, especially related to promoting rural training opportunities and shifting to postgraduate training programs as a means of promoting advanced health care and health system competencies while continuing to align with workforce projections. Furthermore, while there are data on the percentage of VA staff who participated in OAA training program through the VA All Employee Survey (AES), the range for AH professions is wide. For example, about 37% of rehabilitative staff reported participating in an OAA training program, and 72% of VA psychologists reported having an OAA training experience. To maximize the hiring of HPTs, OAA will continue its partnership with WMC to enact programs aimed at streamlining the hiring process so that veterans have access to HCPs who are specifically trained to work with them.
1. US Department of Veterans Affairs. Providing health care for veterans. Updated April 23, 2021. Accessed July 15, 2021. https://www.va.gov/health
2. Veterans’ Benefits. 38 USC §7301 and §7302 (1991). Accessed May 18, 2020. https://www.govinfo.gov/content/pkg/USCODE-2018-title38/pdf/USCODE-2018-title38-partV-chap73-subchapI-sec7302.pdf
3. US Department of Veterans Affairs, Veterans Health Administration, Office of Academic Affiliations. Health professions education: academic year 2019-2020. Published 2021. Accessed July 15, 2021. https://www.va.gov/OAA/docs/OAA_Statistics_2020.pdf
4. US Department of Veterans Affairs, VHA Office of Academic Affiliations. VA Policy Memorandum # 2. Policy in association of veterans’ hospitals with medical schools. Published January 30, 1946. Accessed October 13, 2020. https://www.va.gov/oaa/Archive/PolicyMemo2.pdf
5. US Department of Veterans Affairs, Veterans Health Administration, Office of Academic Affiliations. Mission of the office of academic affiliations. Updated September 24, 2019. Accessed July 15, 2021. https://www.va.gov/oaa/oaa_mission.asp
6. US Bureau of Labor Statistics, Office of Occupational Statistics and Employment Projections Occupational Outlook Handbook. Healthcare occupations. Updated May 14, 2021. Accessed July 15, 2021. https://www.bls.gov/ooh/healthcare/home.htm
7. Windmill IM, Freeman BA. Demand for audiology services: 30-yr projections and impact on academic programs. J Am Acad Audiol. 2013;24(5):407-416. doi:10.3766/jaaa.24.5.7
8. US Department of Health and Human Services, Health Resources and Services Administration, Bureau of Health Workforce. HRSA health workforce: behavioral health workforce projections, 2017-2030. Accessed July 15, 2021. https://bhw.hrsa.gov/sites/default/files/bureau-health-workforce/data-research/bh-workforce-projections-fact-sheet.pdf
9. Centers for Disease Control and Prevention, National Center for Health Statistics. NCHS data brief, No. 325. Use of yoga, meditation, and chiropractors among US adults aged 18 and over. Published November 2018. Accessed September 24, 2020. https://www.cdc.gov/nchs/data/databriefs/db325-h.pdf
10. US Department of Veterans Affairs, Veterans Health Administration Whole Health. Updated July 6, 2021. Accessed July 15, 2021. https://www.va.gov/wholehealth
11. Clark KM. Interprofessional education: making our way out of the silos. Respir Care. 2018;63(5): 637-639. doi:10.4187/respcare.06234
12. Interprofessional Education Collaborative. What is interprofessional education (IPE)? Accessed July 15, 2021. https://www.ipecollaborative.org/about-us
13. Nester J. The importance of interprofessional practice and education in the era of accountable care. N C Med J. 2016;77(2):128-132. doi.10.18043/ncm.77.2.128
14.. Hardin L, Kilian A, Murphy E. Bundled payments for care improvement: preparing for the medical diagnosis-related groups. J Nurs Adm. 2017;47(6): 313-319. doi:10.1097/NNA.0000000000000492
15. Guraya SY, Barr H. The effectiveness of interprofessional education in healthcare: a systematic review and meta-analysis. Kaohsiung J Med Sci. 2018;34(2):125-184. doi:10.1016/j.kjms.2017.12.009
16. Ateah CA, Snow W, Wenter P, et al. Stereotyping as a barrier to collaboration: does interprofessional education make a difference? Nurse Educ Today. 2011;31(2):208-213. doi:10.1016/j.nedt.2010.06.004
17. US Department of Veterans Affairs, US Department of Defense. VA/DoD Clinical Practice Guideline for Managing Opioid Therapy for Chronic Pain. Published May 7, 1991. Updated February 2017. Accessed July 15, 2021. https://www.va.gov/HOMELESS/nchav/resources/docs/mental-health/substance-abuse/VA_DoD-CLINICAL-PRACTICE-GUIDELINE-FOR-OPIOID-THERAPY-FOR-CHRONIC-PAIN-508.pdf
18. US Department of Veterans Affairs, Office of Rural Health. VHA office of rural health. Updated March 17, 2021. Accessed July 15, 2021. https://www.ruralhealth.va.gov19. Curran V, Rourke J. The role of medical education in the recruitment and retention of rural physicians. Med Teach. 2004;26(3):265-272. doi:10.1080/0142159042000192055
20. US Department of Veterans Affairs. VHA Support Service Center Capital Assets. Updated December 1, 2020. Accessed July 15, 2021. https://www.data.va.gov/dataset/VHA-Support-Service-Center-Capital-Assets-VSSC-/2fr5-sktm
21. Domino ME, Lin CC, Morrisey JP, et al. Training psychologists for rural practice: exploring opportunities and constraints. J Rural Health. 2019;35(1):35-41. doi:10.1111/jrh.12299
22. US Department of Veterans Affairs. VA Directive 5005: Staffing. Published March 4, 2020. Accessed July 15, 2021. https://www.va.gov/vapubs/viewPublication.asp?Pub_ID=1140&FType=2
23. Furze JA, Freeman BA. Physical therapy and fellowship education: reflections on the past, present, and future. Phys Ther. 2016;96(7):949-960. doi:10.2522/ptj.20150473
The US Department of Veterans Affairs (VA) is the largest health care delivery system in the United States, comprising 1293 sites of care, including 171 medical centers.1 One of the 4 statutory missions of the VA is to train health care professionals (HCPs) to meet the needs of the VA and the nation.2 Through partnerships with more than 1800 accredited colleges, universities, and training programs, the VA provides training annually to nearly 118,000 health professions trainees (HPTs) across a variety of health care professions, and all of whom provide direct clinical care to veterans.3
In the VA, the Office of Academic Affiliations (OAA) is charged with overseeing health professions training and the VA’s partnership with medical and associated health (AH) professions schools, which was first codified in Policy Memorandum No. 2 in 1946.4,5 Given the scope and breadth of health professions education offered through the VA, OAA is in a unique position to address health care shortage areas as well as influence the educational standards for certain professions.
Many of these health care professions fall under the rubric of AH, which include mental health (MH) specialties, rehabilitative specialties, and others. These professions are critical to address in the expanding world of health care in the United States with its increased specialization and emphasis on coordination of care with interprofessional teams. During the 2019/2020 academic year, the VA provided clinical training to approximately 21,000 AH HPTs from > 40 professions with just over 20% receiving financial support through the OAA. Of the HPTs who train at VA without compensation, most spend shorter amounts of time in clinical rotations in the VA, are in pregraduate-degree education programs where payment for clinical rotations is not expected and may not be eligible for hire immediately on completion of their clinical training experience. The 17 funded professions have been strategically selected by the OAA to ensure a robust pipeline of HCPs to meet the needs of veterans and the nation.
To meet the demands of AH professionals (AHPs), the OAA implemented targeted expansion over the past 10 years. While not exhaustive, this paper describes several expansion efforts based on VA special initiatives, including enhancing clinical access in rural settings and shifting toward postgraduate-degree training and specialization. By aligning expansion with VA priorities as well as trends in health care more broadly, the OAA can ensure that there is a supply of well-trained AHPs who have developed the requisite competencies to contribute to our nation’s health care needs. Further, expansion can help train and recruit health professionals who can be hired into VA positions ready to care for the complex needs of veterans.
Associated Health Professionals
Overseen by the OAA, AH expansion is designed to address the specific needs of the VA and the US health care system. Data from the VA Workforce Management and Consulting (WMC) shows that the VA employment of AHPs has grown from 87,351 AHPs hired in fiscal year (FY) 2010 to 119,120 as of April 2020. This represents an average yearly growth rate of 3.4% and a total growth rate of 36%. The Bureau of Labor Statistics predictions for 2019/2029 suggest that certain AHPs are expected to have a 10-year growth rates of 20% or more to meet the changing health care needs of patients especially as the population ages; the growth rates for many AHPs far surpasses that of physicians, which is anticipated to be 4% (Table).6,7 The VA WMC expects an additional 52,283 AHPs will be hired by the VA by FY 2030 based on the 10-year average growth rate (Kali Clark, Veterans Health Administration Workforce Management and Consulting Office, email communication, May 28, 2020).
One of the driving forces behind the growth rate is the move toward using AHPs to supplement health care for a variety of health conditions.8,9 Examples include the integration of rehabilitation professionals, alternative care professionals (eg, massage therapists, practitioners who offer training in yoga and meditation), chiropractors, MH professionals, and pharmacists in the treatment of chronic pain, the use of a wider range of professionals in the treatment of MH conditions, and the integration of MH professionals into traditional medical settings, such as primary care. This intentional move to a more well-integrated model of interprofessional care is apparent in many other health care systems throughout the United States. Within the VA, this shift may be most evident through the introduction of the Whole Health model of care. The Whole Health model of care uses an interprofessional team to assess and care for veterans, using a personalized health plan addressing medical and MH conditions as well as behavioral, social, or spiritual concerns.10 The Whole Health model of care provides veterans with access to a variety of health care services, including but not limited to MH services, spiritual interventions, exercise-based programs, yoga, meditation, and nutrition counseling.
The OAA and AH education division have focused expansion to meet the increased need for MH and rehabilitation providers, to enhance interprofessional education, and to emphasize postgraduate-degree clinical training. This focus reflects the trends seen in health care training broadly throughout the nation and the intentional pivot is a model of these trends and a model for how to intentionally address these trends. Specific to the VA, focused expansion plans have allowed OAA to address VA strategic initiatives such as pain management and caring for rural veterans.
Funded Training Positions
As a result of recent AH expansion efforts, there has been a 33% increase in stipend-funded positions during the past 10 years, a rate that directly corresponds with the growth of AHPs in the VA. Recent AH expansion efforts can contribute to a particularly positive impact in highly rural and underserved areas where recruiting providers remains challenging.
The OAA launched the Mental Health Education Expansion (MHEE) initiative in 2012, which has now added 782 funded training slots across 10 health professions, 8 of which are psychology, pharmacy, chaplaincy, professional MH counseling, marriage and family therapy (MFT), social work (SW), occupational therapy (OT), and physician assistant (PA). Through the MHEE initiative, the VA has established funded internships for licensed professional mental health counselors and marriage and family therapists, as these professions are targeted for expanding the overall MH workforce in the VA. The OAA currently funds more than 50 total HPT positions for these 2 professions with an aim of increasing their recruitment to the VA MH workforce over the next decade. The MHEE is aligned with specified VA priorities to train a future VA workforce prepared for interprofessional collaboration and clinical care in an increasingly integrated and complex environment. This expansion effort also aligns with an increasing understanding of the importance of addressing the MH needs of our nation by ensuring there is an adequate supply of competent, well-trained clinicians entering the workforce.
The OAA has created and expanded residencies and fellowships in multiple rehabilitation professions, including chiropractic, physical therapy (PT), and OT. With the increased focus on the management of chronic pain in the nation combined with a specific emphasis on this clinical need in the VA, chiropractors have been deemed essential HCPs. In 2014, the VA established 5 chiropractic residency programs while partnering with the Council on Chiropractic Education to develop accreditation standards for residency training. OAA’s efforts have yielded 5 accredited residency programs, the first in the United States. In 2020, the VA doubled the number of available chiropractic residency programs, and future expansion is anticipated. Since 2010, PT residencies have expanded from 1 to 28 programs (42 funded positions) across 4 board certification specialties: cardiovascular-pulmonary, geriatric, neurologic, and orthopedic. Similarly, the VA was one of the first organizations to achieve accreditation for OT fellowships; there are currently 5 accredited OT fellowship programs across 3 areas of practice: assistive technology, MH, and physical rehabilitation. The VA OT fellowship program focused on assistive technology is the only program in the United States at this time.
Interprofessional Education
As one of the primary focus areas for AH expansion, interprofessional education (IPE) has been recognized as increasingly important for the provision of health care and the development of HPT programs. IPE can develop professionals who appreciate the roles of diverse professions and can use teamwork to enhance clinical outcomes for patients.11 There also are a growing number of professional organizations supporting the Interprofessional Education Collaborative with many representing AHPs.12 Collaboration across HCPs is an important way of reducing health care costs by enhancing clinical outcomes, communication, and teamwork.13-16 The VA and the nation’s health care system benefit from the by-products of interprofessional collaboration through investment in targeted training programs. In each phase of the AH expansion, special consideration was given to applicant programs offering unique and innovative clinical and educational experiences consistent with the promotion of interprofessional care. In doing so, increased numbers of AH HPTs have engaged in team-based clinical care.
Pain Management Pharmacy
The efforts of AH to align expansion with high-priority agency-wide efforts has resulted in the growth of pharmacy residency positions focused on pain management. Pharmacy postgraduate year (PGY) 2 residencies focusing on opioid reduction are an example of VA efforts to improve response to managing chronic pain and the long-term risks from opioid use during this national public health crisis.17 These residency programs focus on strategies to reduce the use of opioid medications in the clinical setting and teaching effective clinical interventions for reducing the rates of opioid addiction in veterans while still recognizing the need to identify and treat chronic pain. Before expansion efforts in 2018, there were 6 pharmacy residency programs focused on opioid use reduction in the VA, 8 pharmacy PGY2 residency positions were added in academic year 2019/2020, an additional 5 positions are being added in academic year 2021/2022 with the explicit goal of managing patients with high-risk chronic pain.
Rural Health
The lack of MH providers in rural areas has received much attention and is particularly important in the VA because veterans are more likely to live in less populated areas.18 The VA mandate to address this population was codified by the creation of the Office of Rural Health in 2006 via 38 USC § 7308.19Creating health professions training programs in rural settings provides HPTs the opportunity to learn professional competencies and train with faculty knowledgeable about this population—all of which provide a comprehensive training experience and serve as a recruitment pathway to hire HPTs into staff positions at these sites.19
When MHEE was initiated, not all regions of the country had funded VA psychology training programs, and this geographic gap in psychology training was a contributing factor to recruitment difficulties for psychologists in rural areas. As a result, the request for proposal process in the OAA highlighted and incentivized rurality when considering funding for new training programs. The OAA defined rurality as the number of patients served by the proposed health care facility who lived in a rural or highly rural zip code according to VA Support Service Center Capital Assets data.20 As a result, VA psychology doctoral internships expanded to be available in all states, the District of Columbia, and Puerto Rico. MH training programs were started in the highly rural states of Montana and Wyoming. These expansion efforts promise to be an essential component to addressing the gaps in coverage in rural settings as noted in recent research.21
Pregraduate to Postgraduate Programs
The OAA AH education division supports a significant number of pregraduate-degree and postgraduate-degree training. Some professions, such as psychology, pharmacy, SW, PT, speech pathology, OT, and nutrition/dietetics receive funding at both levels of training. More recent, the OAA has started to move funding from pregraduate to postgraduate-degree positions, specifically within professions where pregraduate funding is uncommon for both federal and nonfederal training positions. The effort is designed to better align stipend-paid training programs with the VA Professional Qualification Standards and the final level of training required for employment in the VA.22This means that HPTs receive stipend support during the highest level of their clinical training before degree conferral, eligibility for VA employment, or while participating in a postgraduate-degree residency or fellowship.
Additionally, this shift in focus and the resulting internal assessment of professions has allowed the OAA to fund more specialized training opportunities, which sometimes go beyond what is required by accrediting bodies or for recruitment into VA positions. For example, the OAA is supporting SW fellowship programs and PA residency positions to allow for greater specialization within these professions; the accrediting agencies for both professions have recently finalized their accreditation standards, and the OAA played a role in moving these standards forward.
While postgraduate residencies and fellowships are not required for all AH HPTs or for employment in the VA, there is a shift in some professions to encourage postgraduate training in advanced competencies in specialized areas. Participation in a residency or fellowship training program affords HPTs additional time and diverse clinical experiences to acquire clinical skills, all while under the supervision of a highly trained practitioner. This additional training also allows for a longitudinal assessment of the HPT to ensure an alignment of the HPTs’ knowledge, abilities, and skills with the expectation should they pursue VA employment.
In academic year 2019/2020, the OAA AH education division in conjunction with the PA national program office transitioned the entirety of the PA pregraduate-degree student positions (415 funded positions) to residency positions, increasing residency positions from 19 to 32 funded positions. This shift in emphasis for funding did not negatively impact the total number of pregraduate PA students receiving training in the VA and has created a pipeline of residency graduates who are ready to enter VA staff positions. To date, the VA has 14 PA residency programs across 3 specialties: emergency medicine (EM), MH, and primary care/geriatrics. Of these tracks, the VA offers 5 EM and 4 MH residencies that position graduates to be eligible for specialty certification. The National Commission on Certification of Physician Assistants established Certificates of Added Qualifications (CAQ) to recognize and document specialty knowledge, skills, and experience. The VA MH residency programs have been established to align with the CAQ expectations, and residents immediately qualify to take the CAQ examination after the completion of training.
Currently, the same process to move pregraduate to postgraduate funding is being implemented for PT and OT. Within the PT profession, there is increased momentum toward residency and fellowship training programs to respond to the changing complexity of the health care systemand reduce the need of complex care to be provided by non-VA providers in the community.23 Both PT and OT have entered the initial phases of transitioning to residency or fellowship-funded positions. The OAA is partnering with these professions to move positions to postgraduate degree within the next 3 years with a commensurate increase in funding. The initial data indicate that 80% of graduated VA PT residents are board-certification eligible, and 89% of those who are eligible passed the examination on their first attempt.
Since 2013, the VA psychology training also has realized a growth in postgraduate-degree residencies. Psychology residency positions have increased 99% to 453 funded positions. This growth represents increased specialization in neuropsychology, geropsychology, rehabilitation psychology, and health psychology. Additionally, postgraduate residencies meet most jurisdictional requirements for postdoctoral supervised experience and better prepare HPTs to enter specialty staff positions that are necessary to care for aging veterans.
Additional professions are being targeted for postgraduate-degree training programs, including dietetics and speech pathology, to align with upcoming changes in the qualification standards for employment. While the process to transition positions to postgraduate-degree training programs can take 3 to 5 years, the outcomes are expected to result in better prepared HPTs who can fill staff vacancies in the VA.
Conclusions
Through its funding and oversight of numerous professions, the OAA is uniquely situated to adapt its portfolio to meet the needs of the VA and the nation. Over the past 10 years, the OAA has expanded its total number of HPT positions to enhance interprofessional care, respond to the VA’s strategic initiatives, address the care needs of rural veterans, and shift positions to postgraduate training programs. The OAA’s investment in high-quality training programs builds a strong health care workforce ready to meet the needs of an increasingly complex and integrated health care environment.
The OAA anticipates future expansion, especially related to promoting rural training opportunities and shifting to postgraduate training programs as a means of promoting advanced health care and health system competencies while continuing to align with workforce projections. Furthermore, while there are data on the percentage of VA staff who participated in OAA training program through the VA All Employee Survey (AES), the range for AH professions is wide. For example, about 37% of rehabilitative staff reported participating in an OAA training program, and 72% of VA psychologists reported having an OAA training experience. To maximize the hiring of HPTs, OAA will continue its partnership with WMC to enact programs aimed at streamlining the hiring process so that veterans have access to HCPs who are specifically trained to work with them.
1. US Department of Veterans Affairs. Providing health care for veterans. Updated April 23, 2021. Accessed July 15, 2021. https://www.va.gov/health
2. Veterans’ Benefits. 38 USC §7301 and §7302 (1991). Accessed May 18, 2020. https://www.govinfo.gov/content/pkg/USCODE-2018-title38/pdf/USCODE-2018-title38-partV-chap73-subchapI-sec7302.pdf
3. US Department of Veterans Affairs, Veterans Health Administration, Office of Academic Affiliations. Health professions education: academic year 2019-2020. Published 2021. Accessed July 15, 2021. https://www.va.gov/OAA/docs/OAA_Statistics_2020.pdf
4. US Department of Veterans Affairs, VHA Office of Academic Affiliations. VA Policy Memorandum # 2. Policy in association of veterans’ hospitals with medical schools. Published January 30, 1946. Accessed October 13, 2020. https://www.va.gov/oaa/Archive/PolicyMemo2.pdf
5. US Department of Veterans Affairs, Veterans Health Administration, Office of Academic Affiliations. Mission of the office of academic affiliations. Updated September 24, 2019. Accessed July 15, 2021. https://www.va.gov/oaa/oaa_mission.asp
6. US Bureau of Labor Statistics, Office of Occupational Statistics and Employment Projections Occupational Outlook Handbook. Healthcare occupations. Updated May 14, 2021. Accessed July 15, 2021. https://www.bls.gov/ooh/healthcare/home.htm
7. Windmill IM, Freeman BA. Demand for audiology services: 30-yr projections and impact on academic programs. J Am Acad Audiol. 2013;24(5):407-416. doi:10.3766/jaaa.24.5.7
8. US Department of Health and Human Services, Health Resources and Services Administration, Bureau of Health Workforce. HRSA health workforce: behavioral health workforce projections, 2017-2030. Accessed July 15, 2021. https://bhw.hrsa.gov/sites/default/files/bureau-health-workforce/data-research/bh-workforce-projections-fact-sheet.pdf
9. Centers for Disease Control and Prevention, National Center for Health Statistics. NCHS data brief, No. 325. Use of yoga, meditation, and chiropractors among US adults aged 18 and over. Published November 2018. Accessed September 24, 2020. https://www.cdc.gov/nchs/data/databriefs/db325-h.pdf
10. US Department of Veterans Affairs, Veterans Health Administration Whole Health. Updated July 6, 2021. Accessed July 15, 2021. https://www.va.gov/wholehealth
11. Clark KM. Interprofessional education: making our way out of the silos. Respir Care. 2018;63(5): 637-639. doi:10.4187/respcare.06234
12. Interprofessional Education Collaborative. What is interprofessional education (IPE)? Accessed July 15, 2021. https://www.ipecollaborative.org/about-us
13. Nester J. The importance of interprofessional practice and education in the era of accountable care. N C Med J. 2016;77(2):128-132. doi.10.18043/ncm.77.2.128
14.. Hardin L, Kilian A, Murphy E. Bundled payments for care improvement: preparing for the medical diagnosis-related groups. J Nurs Adm. 2017;47(6): 313-319. doi:10.1097/NNA.0000000000000492
15. Guraya SY, Barr H. The effectiveness of interprofessional education in healthcare: a systematic review and meta-analysis. Kaohsiung J Med Sci. 2018;34(2):125-184. doi:10.1016/j.kjms.2017.12.009
16. Ateah CA, Snow W, Wenter P, et al. Stereotyping as a barrier to collaboration: does interprofessional education make a difference? Nurse Educ Today. 2011;31(2):208-213. doi:10.1016/j.nedt.2010.06.004
17. US Department of Veterans Affairs, US Department of Defense. VA/DoD Clinical Practice Guideline for Managing Opioid Therapy for Chronic Pain. Published May 7, 1991. Updated February 2017. Accessed July 15, 2021. https://www.va.gov/HOMELESS/nchav/resources/docs/mental-health/substance-abuse/VA_DoD-CLINICAL-PRACTICE-GUIDELINE-FOR-OPIOID-THERAPY-FOR-CHRONIC-PAIN-508.pdf
18. US Department of Veterans Affairs, Office of Rural Health. VHA office of rural health. Updated March 17, 2021. Accessed July 15, 2021. https://www.ruralhealth.va.gov19. Curran V, Rourke J. The role of medical education in the recruitment and retention of rural physicians. Med Teach. 2004;26(3):265-272. doi:10.1080/0142159042000192055
20. US Department of Veterans Affairs. VHA Support Service Center Capital Assets. Updated December 1, 2020. Accessed July 15, 2021. https://www.data.va.gov/dataset/VHA-Support-Service-Center-Capital-Assets-VSSC-/2fr5-sktm
21. Domino ME, Lin CC, Morrisey JP, et al. Training psychologists for rural practice: exploring opportunities and constraints. J Rural Health. 2019;35(1):35-41. doi:10.1111/jrh.12299
22. US Department of Veterans Affairs. VA Directive 5005: Staffing. Published March 4, 2020. Accessed July 15, 2021. https://www.va.gov/vapubs/viewPublication.asp?Pub_ID=1140&FType=2
23. Furze JA, Freeman BA. Physical therapy and fellowship education: reflections on the past, present, and future. Phys Ther. 2016;96(7):949-960. doi:10.2522/ptj.20150473
Feasibility of Risk Stratification of Patients Presenting to the Emergency Department With Chest Pain Using HEART Score
From the Department of Internal Medicine, Mount Sinai Health System, Icahn School of Medicine at Mount Sinai, New York, NY (Dr. Gandhi), and the School of Medicine, Seth Gordhandas Sunderdas Medical College, and King Edward Memorial Hospital, Mumbai, India (Drs. Gandhi and Tiwari).
Objective: Calculation of HEART score to (1) stratify patients as low-risk, intermediate-risk, high-risk, and to predict the short-term incidence of major adverse cardiovascular events (MACE), and (2) demonstrate feasibility of HEART score in our local settings.
Design: A prospective cohort study of patients with a chief complaint of chest pain concerning for acute coronary syndrome.
Setting: Participants were recruited from the emergency department (ED) of King Edward Memorial Hospital, a tertiary care academic medical center and a resource-limited setting in Mumbai, India.
Participants: We evaluated 141 patients aged 18 years and older presenting to the ED and stratified them using the HEART score. To assess patients’ progress, a follow-up phone call was made within 6 weeks after presentation to the ED.
Measurements: The primary outcomes were a risk stratification, 6-week occurrence of MACE, and performance of unscheduled revascularization or stress testing. The secondary outcomes were discharge or death.
Results: The 141 participants were stratified into low-risk, intermediate-risk, and high-risk groups: 67 (47.52%), 44 (31.21%), and 30 (21.28%), respectively. The 6-week incidence of MACE in each category was 1.49%, 18.18%, and 90%, respectively. An acute myocardial infarction was diagnosed in 24 patients (17.02%), 15 patients (10.64%) underwent percutaneous coronary intervention (PCI), and 4 patients (2.84%) underwent coronary artery bypass graft (CABG). Overall, 98.5% of low-risk patients and 93.33% of high-risk patients had an uneventful recovery following discharge; therefore, extrapolation based on results demonstrated reduced health care utilization. All the survey respondents found the HEART score to be feasible. The patient characteristics and risk profile of the patients with and without MACE demonstrated that: patients with MACE were older and had a higher proportion of males, hypertension, type 2 diabetes mellitus, smoking, hypercholesterolemia, prior history of PCI/CABG, and history of stroke.
Conclusion: The HEART score seems to be a useful tool for risk stratification and a reliable predictor of outcomes in chest pain patients and can therefore be used for triage.
Keywords: chest pain; emergency department; HEART score; acute coronary syndrome; major adverse cardiac events; myocardial infarction; revascularization.
Cardiovascular diseases (CVDs), especially coronary heart disease (CHD), have epidemic proportions worldwide. Globally, in 2012, CVD led to 17.5 million deaths,1,2 with more than 75% of them occurring in developing countries. In contrast to developed countries, where mortality from CHD is rapidly declining, it is increasing in developing countries.1,3 Current estimates from epidemiologic studies from various parts of India indicate the prevalence of CHD in India to be between 7% and 13% in urban populations and 2% and 7% in rural populations.4
Premature mortality in terms of years of life lost because of CVD in India increased by 59% over a 20-year span, from 23.2 million in 1990 to 37 million in 2010.5 Studies conducted in Mumbai (Mumbai Cohort Study) reported very high CVD mortality rates, approaching 500 per 100 000 for men and 250 per 100 000 for women.6,7 However, to the best of our knowledge, in the Indian population, there are minimal data on utilization of a triage score, such as the HEART score, in chest pain patients in the emergency department (ED) in a resource-limited setting.
The most common reason for admitting patients to the ED is chest pain.8 There are various cardiac and noncardiac etiologies of chest pain presentation. Acute coronary syndrome (ACS) needs to be ruled out first in every patient presenting with chest pain. However, 80% of patients with ACS have no clear diagnostic features on presentation.9 The timely diagnosis and treatment of patients with ACS improves their prognosis. Therefore, clinicians tend to start each patient on ACS treatment to reduce the risk, which often leads to increased costs due to unnecessary, time-consuming diagnostic procedures that may place burdens on both the health care system and the patient.10
Several risk-stratifying tools have been developed in the last few years. Both the GRACE and TIMI risk scores have been designed for risk stratification of patients with proven ACS and not for the chest pain population at the ED.11 Some of these tools are applicable to patients with all types of chest pain presenting to the ED, such as the Manchester Triage System. Other, more selective systems are devoted to the risk stratification of suspected ACS in the ED. One is the HEART score.12
The first study on the HEART score—an acronym that stands for History, Electrocardiogram, Age, Risk factors, and Troponin—was done by Backus et al, who proved that the HEART score is an easy, quick, and reliable predictor of outcomes in chest pain patients.10 The HEART score predicts the short-term incidence of major adverse cardiac events (MACE), which allows clinicians to stratify patients as low-risk, intermediate-risk, and high-risk and to guide their clinical decision-making accordingly. It was developed to provide clinicians with a simple, reliable predictor of cardiac risk on the basis of the lowest score of 0 (very low-risk) up to a score of 10 (very high-risk).
We studied the clinical performance of the HEART score in patients with chest pain, focusing on the efficacy and safety of rapidly identifying patients at risk of MACE. We aimed to determine (1) whether the HEART score is a reliable predictor of outcomes of chest pain patients presenting to the ED; (2) whether the score is feasible in our local settings; and (3) whether it describes the risk profile of patients with and without MACE.
Methods
Setting
Participants were recruited from the ED of King Edward Memorial Hospital, a municipal teaching hospital in Mumbai. The study institute is a tertiary care academic medical center located in Parel, Mumbai, Maharashtra, and is a resource-limited setting serving urban, suburban, and rural populations. Participants requiring urgent attention are first seen by a casualty officer and then referred to the emergency ward. Here, the physician on duty evaluates them and decides on admission to the various wards, like the general ward, medical intensive care unit (ICU), coronary care unit (CCU), etc. The specialist’s opinion may also be obtained before admission. Critically ill patients are initially admitted to the emergency ward and stabilized before being shifted to other areas of the hospital.
Participants
Patients aged 18 years and older presenting with symptoms of acute chest pain or suspected ACS were stratified by priority using the chest pain scoring system—the HEART score. Only patients presenting to the ED were eligible for the study. Informed consent from the patient or next of kin was mandatory for participation in the study.
Patients were determined ineligible for the following reasons: a clear cause for chest pain other than ACS (eg, trauma, diagnosed aortic dissection), persisting or recurrent chest pain caused by rheumatic diseases or cancer (a terminal illness), pregnancy, unable or unwilling to provide informed consent, or incomplete data.
Study design
We conducted a
We conducted our study to determine the importance of calculating the HEART score in each patient, which will help to correctly place them into low-, intermediate-, and high-risk groups for clinically important, irreversible adverse cardiac events and guide the clinical decision-making. Patients with low risk will avoid costly tests and hospital admissions, thus decreasing the cost of treatment and ensuring timely discharge from the ED. Patients with high risk will be treated immediately, to possibly prevent a life-threatening, ACS-related incident. Thus, the HEART score will serve as a quick and reliable predictor of outcomes in chest pain patients and help clinicians to make accurate diagnostic and therapeutic choices in uncertain situations.
HEART score
The total number of points for History, Electrocardiogram (ECG), Age, Risk factors, and Troponin was noted as the HEART score (Table 1).
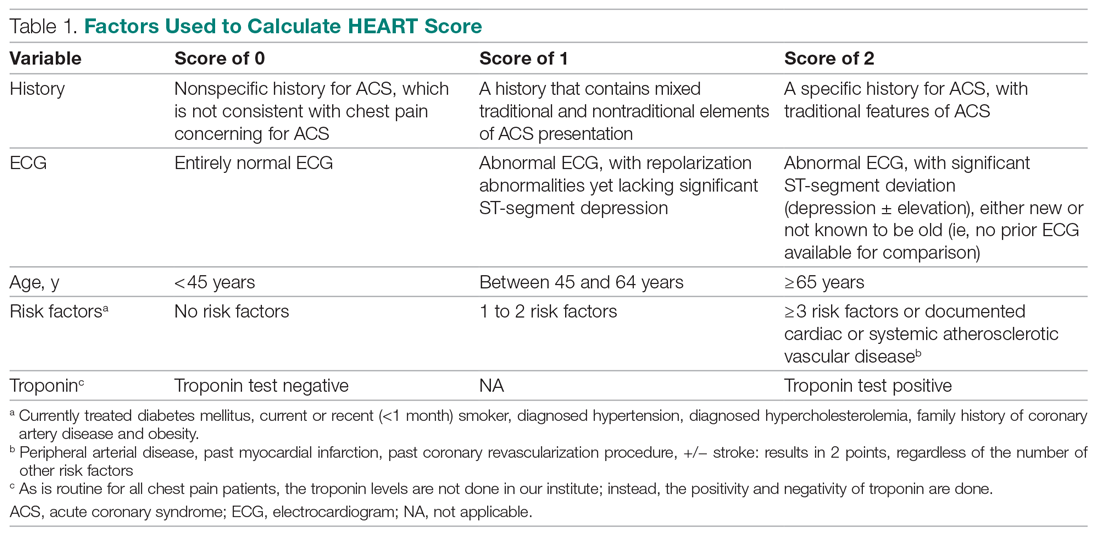
For this study, the patient’s history and ECGs were interpreted by internal medicine attending physicians in the ED. The ECG taken in the emergency room was reviewed and classified, and a copy of the admission ECG was added to the file. The recommendation for patients with a HEART score in a particular range was evaluated. Notably, those with a score of 3 or lower led to a recommendation of reassurance and early discharge. Those with a HEART score in the intermediate range (4-6) were admitted to the hospital for further clinical observation and testing, whereas a high HEART score (7-10) led to admission for intensive monitoring and early intervention. In the analysis of HEART score data, we only used those patients having records for all 5 parameters, excluding patients without an ECG or troponin test.
Results
Myocardial infarction (MI) was defined based on Universal Definition of Myocardial Infarction.13 Coronary revascularization was defined as angioplasty with or without stent placement or coronary artery bypass surgery.14 Percutaneous coronary intervention (PCI) was defined as any therapeutic catheter intervention in the coronary arteries. Coronary artery bypass graft (CABG) surgery was defined as any cardiac surgery in which coronary arteries were operated on.
The primary outcomes in this study were the (1) risk stratification of chest pain patients into low-risk, intermediate-risk, and high-risk categories; (2) incidence of a MACE within 6 weeks of initial presentation. MACE consists of acute myocardial infarction (AMI), PCI, CABG, coronary angiography revealing procedurally correctable stenosis managed conservatively, and death due to any cause.
Our secondary outcomes were discharge or death due to any cause within 6 weeks after presentation.
Follow-up
Within 6 weeks after presentation to the ED, a follow-up phone call was placed to assess the patient’s progress. The follow-up focused on the endpoint of MACE, comprising all-cause death, MI, and revascularization. No patient was lost to follow-up.
Statistical analysis
We aimed to find a difference in the 6-week MACE between low-, intermediate-, and high-risk categories of the HEART score. The prevalence of CHD in India is 10%,4 and assuming an α of 0.05, we needed a sample of 141 patients from the ED patient population. Continuous variables were presented by mean (SD), and categorical variables as percentages. We used t test and the Mann-Whitney U test for comparison of means for continuous variables, χ2 for categorical variables, and Fisher’s exact test for comparison of the categorical variables. Results with P < .05 were considered statistically significant.
We evaluated 141 patients presenting to the ED with chest pain concerning for ACS during the study period, from July 2019 to October 2019.
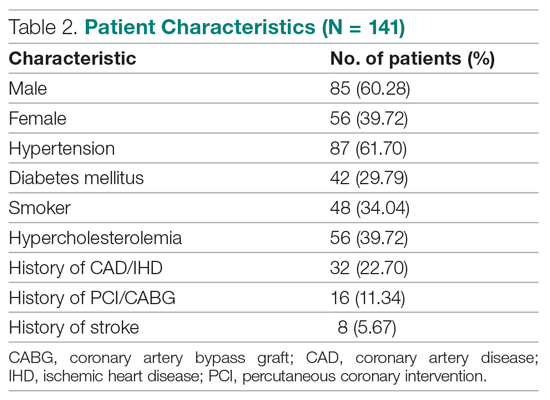
Primary outcomes
The risk stratification of the HEART score in chest pain patients and the incidence of 6-week MACE are outlined in Table 3
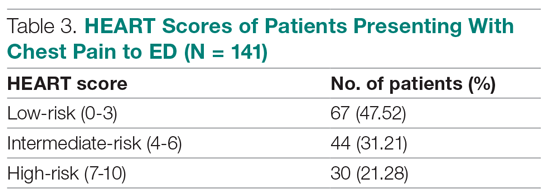
The distribution of the HEART score’s 5 elements in the groups with or without MACE endpoints is shown in Table 5. Notice the significant differences between the groups. A follow-up phone call was made within 6 weeks after the presentation to the ED to assess the patient’s progress. The 6-week follow-up call data are included in Table 6.
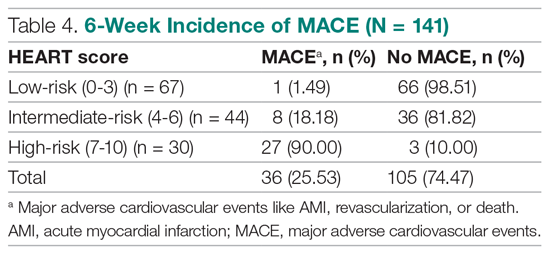
Of 141 patients, 36 patients (25.53%) were diagnosed with MACE within 6 weeks of presentation.
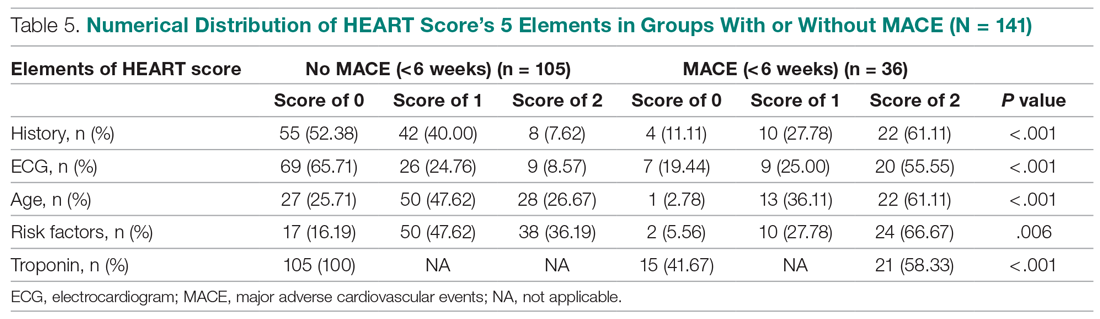
Myocardial infarction—An AMI was diagnosed in 24 of the 141 patients (17.02%). Twenty-one of those already had positive markers on admission (apparently, these AMI had started before their arrival to the emergency room). One AMI occurred 2 days after admission in a 66-year-old male, and another occurred 10 days after discharge. A further AMI occurred 2 weeks after discharge. All 3 patients belonged to the intermediate-risk group.
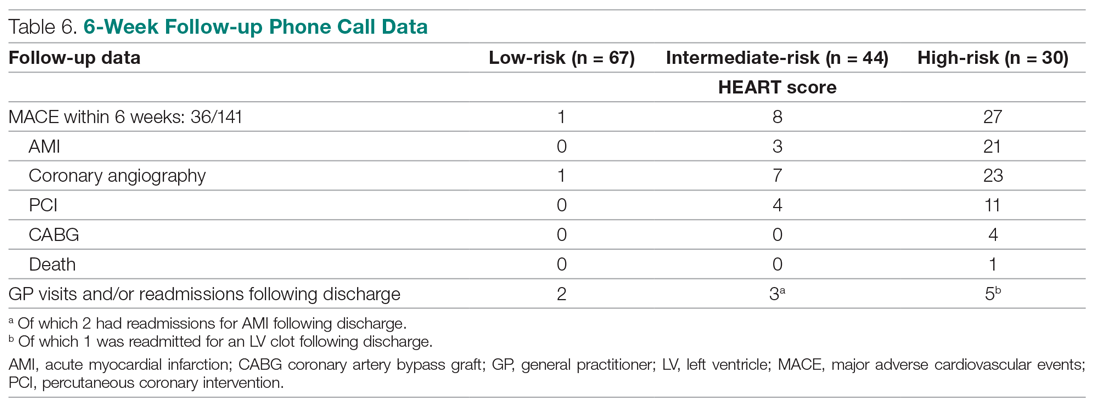
Revascularization—Coronary angiography was performed in 31 of 141 patients (21.99%). Revascularization was performed in 19 patients (13.48%), of which 15 were PCIs (10.64%) and 4 were CABGs (2.84%).
Mortality—One patient died from the study population. He was a 72-year-old male who died 14 days after admission. He had a HEART score of 8.
Among the 67 low-risk patients:
- MACE: Coronary angiography was performed in 1 patient (1.49%). Among the 67 patients in the low-risk category, there was no cases of AMI or deaths. The remaining 66 patients (98.51%) had an uneventful recovery following discharge.
- General practitioner (GP) visits/readmissions following discharge: Two of 67 patients (2.99%) had GP visits following discharge, of which 1 was uneventful. The other patient, a 64-year-old male, was readmitted due to a recurrent history of chest pain and underwent coronary angiography.
Among the 44 intermediate-risk patients:
- MACE: Of the 7 of 44 patients (15.91%) who had coronary angiography, 3 patients (6.82%) had AMI, of which 1 occurred 2 days after admission in a 66-year-old male. Two patients had AMI following discharge. There were no deaths. Overall, 42 of 44 patients (95.55%) had an uneventful recovery following discharge.
- GP visits/readmissions following discharge: Three of 44 patients (6.82%) had repeated visits following discharge. One was a GP visit that was uneventful. The remaining 2 patients were diagnosed with AMI and readmitted following discharge. One AMI occurred 10 days after discharge in a patient with a HEART score of 6; another occurred 2 weeks after discharge in a patient with a HEART score of 5.
Among the 30 high-risk patients:
- MACE: Twenty-three of 30 patients (76.67%) underwent coronary angiography. One patient died 5 days after discharge. The patient had a HEART score of 8. Most patients however, had an uneventful recovery following discharge (28, 93.33%).
- GP visits/readmissions following discharge: Five of 30 patients (16.67%) had repeated visits following discharge. Two were uneventful. Two patients had a history of recurrent chest pain that resolved on Sorbitrate. One patient was readmitted 2 weeks following discharge due to a complication: a left ventricular clot was found. The patient had a HEART score of 10.
Secondary outcome—Overall, 140 of 141 patients were discharged. One patient died: a 72-year-old male with a HEART score of 8.
Feasibility—To determine the ease and feasibility of performing a HEART score in chest pain patients presenting to the ED, a survey was distributed to the internal medicine physicians in the ED. In the survey, the Likert scale was used to rate the ease of utilizing the HEART score and whether the physicians found it feasible to use it for risk stratification of their chest pain patients. A total of 12 of 15 respondents (80%) found it “easy” to use. Of the remaining 3 respondents, 2 (13.33%) rated the HEART score “very easy” to use, while 1 (6.66%) considered it “difficult” to work with. None of the respondents said that it was not feasible to perform a HEART score in the ED.
Risk factors for reaching an endpoint:
We compared risk profiles between the patient groups with and without an endpoint. The group of patients with MACE were older and had a higher proportion of males than the group of patients without MACE. Moreover, they also had a higher prevalence of hypertension, type 2 diabetes mellitus, smoking, hypercholesterolemia, prior history of PCI/CABG, and history of stroke. These also showed a significant association with MACE. Obesity was not included in our risk factors as we did not have data collected to measure body mass index. Results are represented in Table 7.
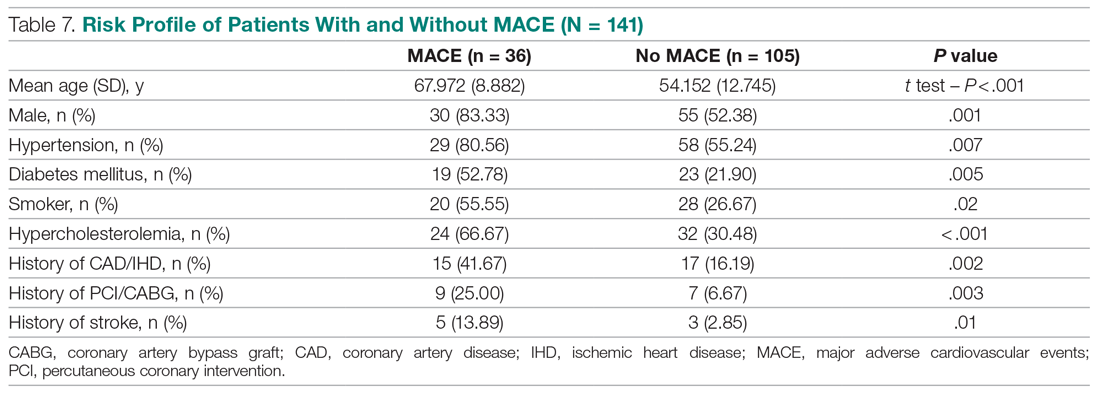
Discussion
Our study described a patient population presenting to an ED with chest pain as their primary complaint. The results of this prospective study confirm that the HEART score is an excellent system to triage chest pain patients. It provides the clinician with a reliable predictor of the outcome (MACE) after the patient’s arrival, based on available clinical data and in a resource-limited setting like ours.
Cardiovascular epidemiology studies indicate that this has become a significant public health problem in India.1 Several risk scores for ACS have been published in European and American guidelines. However, in the Indian population, minimal data are available on utilization of such a triage score (HEART score) in chest pain patients in the ED in a resource-limited setting, to the best of our knowledge. In India, only 1 such study is reported,15 at the Sundaram Medical Foundation, a 170-bed community hospital in Chennai. In this study, 13 of 14 patients (92.86%) with a high HEART score had MACE, indicating a sensitivity of 92.86%; in the 44 patients with a low HEART score, 1 patient (2.22%) had MACE, indicating a specificity of 97.78%; and in the 28 patients with a moderate HEART score, 12 patients (42.86%) had MACE.
In looking for the optimal risk-stratifying system for chest pain patients, we analyzed the HEART score. The first study on the HEART score was done Backus et al, proving that the HEART score is an easy, quick, and reliable predictor of outcomes in chest pain patients.10 The HEART score had good discriminatory power, too. The C statistic for the HEART score for ACS occurrence shows a value of 0.83. This signifies a good-to-excellent ability to stratify all-cause chest pain patients in the ED for their risk of MACE. The application of the HEART score to our patient population demonstrated that the majority of the patients belonged to the low-risk category, as reported in the first cohort study that applied the HEART score.8 The relationship between the HEART score category and occurrence of MACE within 6 weeks showed a curve with 3 different patterns, corresponding to the 3 risk categories defined in the literature.11,12 The risk stratification of chest pain patients using the 3 categories (0-3, 4-6, 7-10) identified MACE with an incidence similar to the multicenter study of Backus et al,10,11 but with a greater risk of MACE in the high-risk category (Figure).
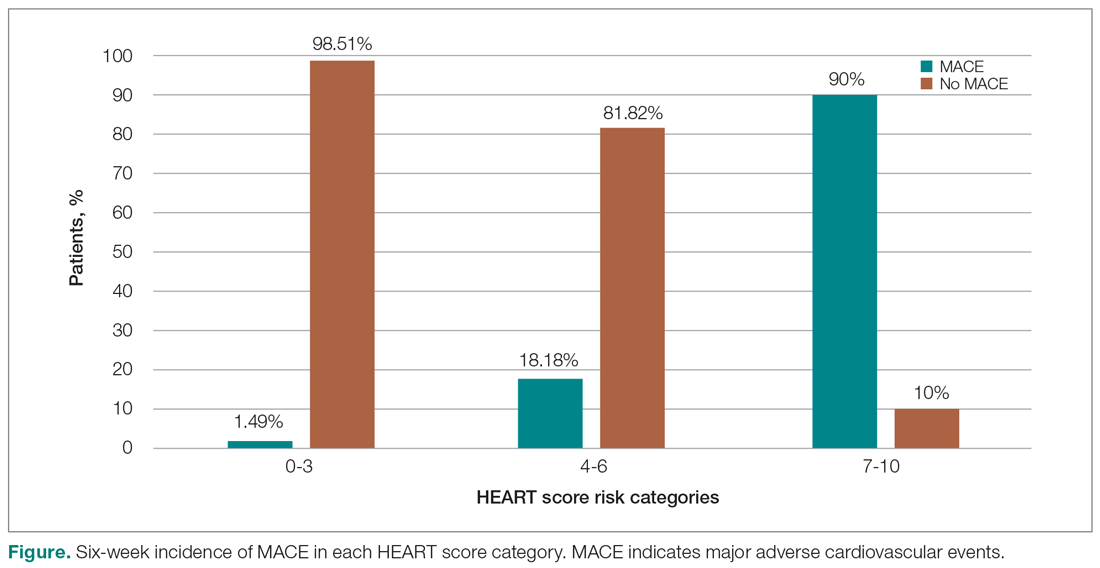
Thus, our study confirmed the utility of the HEART score categories to predict the 6-week incidence of MACE. The sensitivity, specificity, and positive and negative predictive values for the established cut-off scores of 4 and 7 are shown in Table 8. The patients in the low-risk category, corresponding to a score < 4, had a very high negative predictive value, thus identifying a small-risk population. The patients in the high-risk category (score ≥ 7) showed a high positive predictive value, allowing the identification of a high-risk population, even in patients with more atypical presentations. Therefore, the HEART score may help clinicians to make accurate management choices by being a strong predictor of both event-free survival and potentially life-threatening cardiac events.11,12
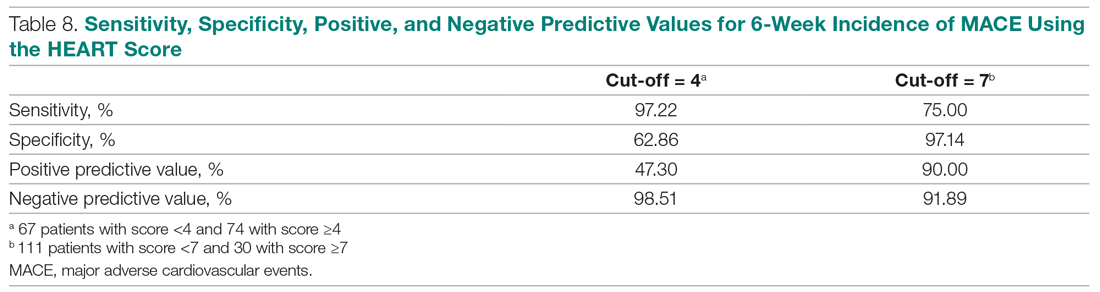
Our study tested the efficacy of the HEART score pathway in helping clinicians make smart diagnostic and therapeutic choices. It confirmed that the HEART score was accurate in predicting the short-term incidence of MACE, thus stratifying patients according to their risk severity. In our study, 67 of 141 patients (47.52%) had low-risk HEART scores, and we found the 6-week incidence of MACE to be 1.49%. We omitted the diagnostic and treatment evaluation for patients in the low-risk category and moved onto discharge. Overall, 66 of 67 patients (98.51%) in the low-risk category had an uneventful recovery following discharge. Only 2 of 67 these patients (2.99%) of patients had health care utilization following discharge. Therefore, extrapolation based on results demonstrates reduced health care utilization. Previous studies have shown similar results.9,12,14,16 For instance, in a prospective study conducted in the Netherlands, low-risk patients representing 36.4% of the total were found to have a low MACE rate (1.7%).9 These low-risk patients were categorized as appropriate and safe for ED discharge without additional cardiac evaluation or inpatient admission.9 Another retrospective study in Portugal,12 and one in Chennai, India,15 found the 6-week incidence of MACE to be 2.00% and 2.22%, respectively. The results of the first HEART Pathway Randomized Control Trial14 showed that the HEART score pathway reduces health care utilization (cardiac testing, hospitalization, and hospital length of stay). The study also showed that these gains occurred without any of the patients that were identified for early discharge, suffering from MACE at 30 days, or secondary increase in cardiac-related hospitalizations. Similar results were obtained by a randomized trial conducted in North Carolina17 that also demonstrated a reduction in objective cardiac testing, a doubling of the rate of early discharge from the ED, and a reduced length of stay by half a day. Another study using a modified HEART score also demonstrated that when low-risk patients are evaluated with cardiac testing, the likelihood for false positives is high.16 Hoffman et al also reported that patients randomized to coronary computed tomographic angiography (CCTA) received > 2.5 times more radiation exposure.16 Thus, low-risk patients may be safely discharged without the need for stress testing or CCTA.
In our study, 30 out of 141 patients (21.28%) had high-risk HEART scores (7-10), and we found the 6-week incidence of MACE to be 90%. Based on the pathway leading to inpatient admission and intensive treatment, 23 of 30 patients (76.67%) patients in our study underwent coronary angiography and further therapeutic treatment. In the high-risk category, 28 of 30 patients (93.33%) patients had an uneventful recovery following discharge. Previous studies have shown similar results. A retrospective study in Portugal showed that 76.9% of the high-risk patients had a 6-week incidence of MACE.12 In a study in the Netherlands,9 72.7% of high-risk patients had a 6-week incidence of MACE. Therefore, a HEART score of ≥ 7 in patients implies early aggressive treatment, including invasive strategies, when necessary, without noninvasive treatment preceding it.8
In terms of intermediate risk, in our study 44 of 141 patients (31.21%) patients had an intermediate-risk HEART score (4-6), and we found the 6-week incidence of MACE to be 18.18%. Based on the pathway, they were kept in the observation ward on admission. In our study, 7 of 44 patients (15.91%) underwent coronary angiography and further treatment; 42 of 44 patients (95.55%) had an uneventful recovery following discharge. In a prospective study in the Netherlands, 46.1% of patients with an intermediate score had a 6-week MACE incidence of 16.6%.10 Similarly, in another retrospective study in Portugal, the incidence of 6-week MACE in intermediate-risk patients (36.7%) was found to be 15.6%.12 Therefore, in patients with a HEART score of 4-6 points, immediate discharge is not an option, as this figure indicates a risk of 18.18% for an adverse outcome. These patients should be admitted for clinical observation, treated as an ACS awaiting final diagnosis, and subjected to noninvasive investigations, such as repeated troponin. Using the HEART score as guidance in the treatment of chest pain patients will benefit patients on both sides of the spectrum.11,12
Our sample presented a male predominance, a wide range of age, and a mean age similar to that of previous studies.12.16 Some risk factors, we found, can increase significantly the odds of chest pain being of cardiovascular origin, such as male gender, smoking, hypertension, type 2 diabetes mellitus, and hypercholesterolemia. Other studies also reported similar findings.8,12,16 Risk factors for premature CHD have been quantified in the case-control INTERHEART study.1 In the INTERHEART study, 8 common risk factors explained > 90% of AMIs in South Asian and Indian patients. The risk factors include dyslipidemia, smoking or tobacco use, known hypertension, known diabetes, abdominal obesity, physical inactivity, low fruit and vegetable intake, and psychosocial stress.1 Regarding the feasibility of treating physicians using the HEART score in the ED, we observed that, based on the Likert scale, 80% of survey respondents found it easy to use, and 100% found it feasible in the ED.
However, there were certain limitations to our study. It involved a single academic medical center and a small sample size, which limit generalizability of the findings. In addition, troponin levels are not calculated at our institution, as it is a resource-limited setting; therefore, we used a positive and negative as +2 and 0, respectively.
Conclusion
The HEART score provides the clinician with a quick and reliable predictor of outcome of patients with chest pain after arrival to the ED and can be used for triage. For patients with low HEART scores (0-3), short-term MACE can be excluded with greater than 98% certainty. In these patients, one may consider reserved treatment and discharge policies that may also reduce health care utilization. In patients with high HEART scores (7-10), the high risk of MACE (90%) may indicate early aggressive treatment, including invasive strategies, when necessary. Therefore, the HEART score may help clinicians make accurate management choices by being a strong predictor of both event-free survival and potentially life-threatening cardiac events. Age, gender, and cardiovascular risk factors may also be considered in the assessment of patients. This study confirmed the utility of the HEART score categories to predict the 6-week incidence of MACE.
Corresponding author: Smrati Bajpai Tiwari, MD, DNB, FAIMER, Department of Medicine, Seth Gordhandas Sunderdas Medical College and King Edward Memorial Hospital, Acharya Donde Marg, Parel, Mumbai 400 012, Maharashtra, India; [email protected].
Financial disclosures: None.
1. Gupta R, Mohan I, Narula J. Trends in coronary heart disease epidemiology in India. Ann Glob Health. 2016;82:307-315.
2. World Health Organization. Global status report on non-communicable diseases 2014. Accessed June 22, 2021. https://apps.who.int/iris/bitstream/handle/10665/148114/9789241564854_eng.pdf
3. Fuster V, Kelly BB, eds. Promoting Cardiovascular Health in the Developing World: A Critical Challenge to Achieve Global Health. Institutes of Medicine; 2010.
4. Krishnan MN. Coronary heart disease and risk factors in India—on the brink of an epidemic. Indian Heart J. 2012;64:364-367.
5. Prabhakaran D, Jeemon P, Roy A. Cardiovascular diseases in India: current epidemiology and future directions. Circulation. 2016;133:1605-1620.
6. Aeri B, Chauhan S. The rising incidence of cardiovascular diseases in India: assessing its economic impact. J Prev Cardiol. 2015;4:735-740.
7. Pednekar M, Gupta R, Gupta PC. Illiteracy, low educational status and cardiovascular mortality in India. BMC Public Health. 2011;11:567.
8. Six AJ, Backus BE, Kelder JC. Chest pain in the emergency room: value of the HEART score. Neth Heart J. 2008;16:191-196.
9. Backus BE, Six AJ, Kelder JC, et al. A prospective validation of the HEART score for chest pain patients at the emergency department. Int J Cardiol. 2013;168;2153-2158.
10. Backus BE, Six AJ, Kelder JC, et al. Chest pain in the emergency room: a multicenter validation of the HEART score. Crit Pathw Cardiol. 2010;9:164-169.
11. Backus BE, Six AJ, Kelder JH, et al. Risk scores for patients with chest pain: evaluation in the emergency department. Curr Cardiol Rev. 2011;7:2-8.
12. Leite L, Baptista R, Leitão J, et al. Chest pain in the emergency department: risk stratification with Manchester triage system and HEART score. BMC Cardiovasc Disord. 2015;15:48.
13. Thygesen K, Alpert JS, Jaffe AS, et al. Fourth Universal Definition of Myocardial Infarction. Circulation. 2018;138:e618-e651.
14. Mahler SA, Riley RF, Hiestand BC, et al. The HEART Pathway randomized trial: identifying emergency department patients with acute chest pain for early discharge. Circ Cardiovasc Qual Outcomes. 2015;8:195-203.
15. Natarajan B, Mallick P, Thangalvadi TA, Rajavelu P. Validation of the HEART score in Indian population. Int J Emerg Med. 2015,8(suppl 1):P5.
16. McCord J, Cabrera R, Lindahl B, et al. Prognostic utility of a modified HEART score in chest pain patients in the emergency department. Circ Cardiovasc Qual Outcomes. 2017;10:e003101.
17. Mahler SA, Miller CD, Hollander JE, et al. Identifying patients for early discharge: performance of decision rules among patients with acute chest pain. Int J Cardiol. 2012;168:795-802.
From the Department of Internal Medicine, Mount Sinai Health System, Icahn School of Medicine at Mount Sinai, New York, NY (Dr. Gandhi), and the School of Medicine, Seth Gordhandas Sunderdas Medical College, and King Edward Memorial Hospital, Mumbai, India (Drs. Gandhi and Tiwari).
Objective: Calculation of HEART score to (1) stratify patients as low-risk, intermediate-risk, high-risk, and to predict the short-term incidence of major adverse cardiovascular events (MACE), and (2) demonstrate feasibility of HEART score in our local settings.
Design: A prospective cohort study of patients with a chief complaint of chest pain concerning for acute coronary syndrome.
Setting: Participants were recruited from the emergency department (ED) of King Edward Memorial Hospital, a tertiary care academic medical center and a resource-limited setting in Mumbai, India.
Participants: We evaluated 141 patients aged 18 years and older presenting to the ED and stratified them using the HEART score. To assess patients’ progress, a follow-up phone call was made within 6 weeks after presentation to the ED.
Measurements: The primary outcomes were a risk stratification, 6-week occurrence of MACE, and performance of unscheduled revascularization or stress testing. The secondary outcomes were discharge or death.
Results: The 141 participants were stratified into low-risk, intermediate-risk, and high-risk groups: 67 (47.52%), 44 (31.21%), and 30 (21.28%), respectively. The 6-week incidence of MACE in each category was 1.49%, 18.18%, and 90%, respectively. An acute myocardial infarction was diagnosed in 24 patients (17.02%), 15 patients (10.64%) underwent percutaneous coronary intervention (PCI), and 4 patients (2.84%) underwent coronary artery bypass graft (CABG). Overall, 98.5% of low-risk patients and 93.33% of high-risk patients had an uneventful recovery following discharge; therefore, extrapolation based on results demonstrated reduced health care utilization. All the survey respondents found the HEART score to be feasible. The patient characteristics and risk profile of the patients with and without MACE demonstrated that: patients with MACE were older and had a higher proportion of males, hypertension, type 2 diabetes mellitus, smoking, hypercholesterolemia, prior history of PCI/CABG, and history of stroke.
Conclusion: The HEART score seems to be a useful tool for risk stratification and a reliable predictor of outcomes in chest pain patients and can therefore be used for triage.
Keywords: chest pain; emergency department; HEART score; acute coronary syndrome; major adverse cardiac events; myocardial infarction; revascularization.
Cardiovascular diseases (CVDs), especially coronary heart disease (CHD), have epidemic proportions worldwide. Globally, in 2012, CVD led to 17.5 million deaths,1,2 with more than 75% of them occurring in developing countries. In contrast to developed countries, where mortality from CHD is rapidly declining, it is increasing in developing countries.1,3 Current estimates from epidemiologic studies from various parts of India indicate the prevalence of CHD in India to be between 7% and 13% in urban populations and 2% and 7% in rural populations.4
Premature mortality in terms of years of life lost because of CVD in India increased by 59% over a 20-year span, from 23.2 million in 1990 to 37 million in 2010.5 Studies conducted in Mumbai (Mumbai Cohort Study) reported very high CVD mortality rates, approaching 500 per 100 000 for men and 250 per 100 000 for women.6,7 However, to the best of our knowledge, in the Indian population, there are minimal data on utilization of a triage score, such as the HEART score, in chest pain patients in the emergency department (ED) in a resource-limited setting.
The most common reason for admitting patients to the ED is chest pain.8 There are various cardiac and noncardiac etiologies of chest pain presentation. Acute coronary syndrome (ACS) needs to be ruled out first in every patient presenting with chest pain. However, 80% of patients with ACS have no clear diagnostic features on presentation.9 The timely diagnosis and treatment of patients with ACS improves their prognosis. Therefore, clinicians tend to start each patient on ACS treatment to reduce the risk, which often leads to increased costs due to unnecessary, time-consuming diagnostic procedures that may place burdens on both the health care system and the patient.10
Several risk-stratifying tools have been developed in the last few years. Both the GRACE and TIMI risk scores have been designed for risk stratification of patients with proven ACS and not for the chest pain population at the ED.11 Some of these tools are applicable to patients with all types of chest pain presenting to the ED, such as the Manchester Triage System. Other, more selective systems are devoted to the risk stratification of suspected ACS in the ED. One is the HEART score.12
The first study on the HEART score—an acronym that stands for History, Electrocardiogram, Age, Risk factors, and Troponin—was done by Backus et al, who proved that the HEART score is an easy, quick, and reliable predictor of outcomes in chest pain patients.10 The HEART score predicts the short-term incidence of major adverse cardiac events (MACE), which allows clinicians to stratify patients as low-risk, intermediate-risk, and high-risk and to guide their clinical decision-making accordingly. It was developed to provide clinicians with a simple, reliable predictor of cardiac risk on the basis of the lowest score of 0 (very low-risk) up to a score of 10 (very high-risk).
We studied the clinical performance of the HEART score in patients with chest pain, focusing on the efficacy and safety of rapidly identifying patients at risk of MACE. We aimed to determine (1) whether the HEART score is a reliable predictor of outcomes of chest pain patients presenting to the ED; (2) whether the score is feasible in our local settings; and (3) whether it describes the risk profile of patients with and without MACE.
Methods
Setting
Participants were recruited from the ED of King Edward Memorial Hospital, a municipal teaching hospital in Mumbai. The study institute is a tertiary care academic medical center located in Parel, Mumbai, Maharashtra, and is a resource-limited setting serving urban, suburban, and rural populations. Participants requiring urgent attention are first seen by a casualty officer and then referred to the emergency ward. Here, the physician on duty evaluates them and decides on admission to the various wards, like the general ward, medical intensive care unit (ICU), coronary care unit (CCU), etc. The specialist’s opinion may also be obtained before admission. Critically ill patients are initially admitted to the emergency ward and stabilized before being shifted to other areas of the hospital.
Participants
Patients aged 18 years and older presenting with symptoms of acute chest pain or suspected ACS were stratified by priority using the chest pain scoring system—the HEART score. Only patients presenting to the ED were eligible for the study. Informed consent from the patient or next of kin was mandatory for participation in the study.
Patients were determined ineligible for the following reasons: a clear cause for chest pain other than ACS (eg, trauma, diagnosed aortic dissection), persisting or recurrent chest pain caused by rheumatic diseases or cancer (a terminal illness), pregnancy, unable or unwilling to provide informed consent, or incomplete data.
Study design
We conducted a
We conducted our study to determine the importance of calculating the HEART score in each patient, which will help to correctly place them into low-, intermediate-, and high-risk groups for clinically important, irreversible adverse cardiac events and guide the clinical decision-making. Patients with low risk will avoid costly tests and hospital admissions, thus decreasing the cost of treatment and ensuring timely discharge from the ED. Patients with high risk will be treated immediately, to possibly prevent a life-threatening, ACS-related incident. Thus, the HEART score will serve as a quick and reliable predictor of outcomes in chest pain patients and help clinicians to make accurate diagnostic and therapeutic choices in uncertain situations.
HEART score
The total number of points for History, Electrocardiogram (ECG), Age, Risk factors, and Troponin was noted as the HEART score (Table 1).
For this study, the patient’s history and ECGs were interpreted by internal medicine attending physicians in the ED. The ECG taken in the emergency room was reviewed and classified, and a copy of the admission ECG was added to the file. The recommendation for patients with a HEART score in a particular range was evaluated. Notably, those with a score of 3 or lower led to a recommendation of reassurance and early discharge. Those with a HEART score in the intermediate range (4-6) were admitted to the hospital for further clinical observation and testing, whereas a high HEART score (7-10) led to admission for intensive monitoring and early intervention. In the analysis of HEART score data, we only used those patients having records for all 5 parameters, excluding patients without an ECG or troponin test.
Results
Myocardial infarction (MI) was defined based on Universal Definition of Myocardial Infarction.13 Coronary revascularization was defined as angioplasty with or without stent placement or coronary artery bypass surgery.14 Percutaneous coronary intervention (PCI) was defined as any therapeutic catheter intervention in the coronary arteries. Coronary artery bypass graft (CABG) surgery was defined as any cardiac surgery in which coronary arteries were operated on.
The primary outcomes in this study were the (1) risk stratification of chest pain patients into low-risk, intermediate-risk, and high-risk categories; (2) incidence of a MACE within 6 weeks of initial presentation. MACE consists of acute myocardial infarction (AMI), PCI, CABG, coronary angiography revealing procedurally correctable stenosis managed conservatively, and death due to any cause.
Our secondary outcomes were discharge or death due to any cause within 6 weeks after presentation.
Follow-up
Within 6 weeks after presentation to the ED, a follow-up phone call was placed to assess the patient’s progress. The follow-up focused on the endpoint of MACE, comprising all-cause death, MI, and revascularization. No patient was lost to follow-up.
Statistical analysis
We aimed to find a difference in the 6-week MACE between low-, intermediate-, and high-risk categories of the HEART score. The prevalence of CHD in India is 10%,4 and assuming an α of 0.05, we needed a sample of 141 patients from the ED patient population. Continuous variables were presented by mean (SD), and categorical variables as percentages. We used t test and the Mann-Whitney U test for comparison of means for continuous variables, χ2 for categorical variables, and Fisher’s exact test for comparison of the categorical variables. Results with P < .05 were considered statistically significant.
We evaluated 141 patients presenting to the ED with chest pain concerning for ACS during the study period, from July 2019 to October 2019.
Primary outcomes
The risk stratification of the HEART score in chest pain patients and the incidence of 6-week MACE are outlined in Table 3
The distribution of the HEART score’s 5 elements in the groups with or without MACE endpoints is shown in Table 5. Notice the significant differences between the groups. A follow-up phone call was made within 6 weeks after the presentation to the ED to assess the patient’s progress. The 6-week follow-up call data are included in Table 6.
Of 141 patients, 36 patients (25.53%) were diagnosed with MACE within 6 weeks of presentation.
Myocardial infarction—An AMI was diagnosed in 24 of the 141 patients (17.02%). Twenty-one of those already had positive markers on admission (apparently, these AMI had started before their arrival to the emergency room). One AMI occurred 2 days after admission in a 66-year-old male, and another occurred 10 days after discharge. A further AMI occurred 2 weeks after discharge. All 3 patients belonged to the intermediate-risk group.
Revascularization—Coronary angiography was performed in 31 of 141 patients (21.99%). Revascularization was performed in 19 patients (13.48%), of which 15 were PCIs (10.64%) and 4 were CABGs (2.84%).
Mortality—One patient died from the study population. He was a 72-year-old male who died 14 days after admission. He had a HEART score of 8.
Among the 67 low-risk patients:
- MACE: Coronary angiography was performed in 1 patient (1.49%). Among the 67 patients in the low-risk category, there was no cases of AMI or deaths. The remaining 66 patients (98.51%) had an uneventful recovery following discharge.
- General practitioner (GP) visits/readmissions following discharge: Two of 67 patients (2.99%) had GP visits following discharge, of which 1 was uneventful. The other patient, a 64-year-old male, was readmitted due to a recurrent history of chest pain and underwent coronary angiography.
Among the 44 intermediate-risk patients:
- MACE: Of the 7 of 44 patients (15.91%) who had coronary angiography, 3 patients (6.82%) had AMI, of which 1 occurred 2 days after admission in a 66-year-old male. Two patients had AMI following discharge. There were no deaths. Overall, 42 of 44 patients (95.55%) had an uneventful recovery following discharge.
- GP visits/readmissions following discharge: Three of 44 patients (6.82%) had repeated visits following discharge. One was a GP visit that was uneventful. The remaining 2 patients were diagnosed with AMI and readmitted following discharge. One AMI occurred 10 days after discharge in a patient with a HEART score of 6; another occurred 2 weeks after discharge in a patient with a HEART score of 5.
Among the 30 high-risk patients:
- MACE: Twenty-three of 30 patients (76.67%) underwent coronary angiography. One patient died 5 days after discharge. The patient had a HEART score of 8. Most patients however, had an uneventful recovery following discharge (28, 93.33%).
- GP visits/readmissions following discharge: Five of 30 patients (16.67%) had repeated visits following discharge. Two were uneventful. Two patients had a history of recurrent chest pain that resolved on Sorbitrate. One patient was readmitted 2 weeks following discharge due to a complication: a left ventricular clot was found. The patient had a HEART score of 10.
Secondary outcome—Overall, 140 of 141 patients were discharged. One patient died: a 72-year-old male with a HEART score of 8.
Feasibility—To determine the ease and feasibility of performing a HEART score in chest pain patients presenting to the ED, a survey was distributed to the internal medicine physicians in the ED. In the survey, the Likert scale was used to rate the ease of utilizing the HEART score and whether the physicians found it feasible to use it for risk stratification of their chest pain patients. A total of 12 of 15 respondents (80%) found it “easy” to use. Of the remaining 3 respondents, 2 (13.33%) rated the HEART score “very easy” to use, while 1 (6.66%) considered it “difficult” to work with. None of the respondents said that it was not feasible to perform a HEART score in the ED.
Risk factors for reaching an endpoint:
We compared risk profiles between the patient groups with and without an endpoint. The group of patients with MACE were older and had a higher proportion of males than the group of patients without MACE. Moreover, they also had a higher prevalence of hypertension, type 2 diabetes mellitus, smoking, hypercholesterolemia, prior history of PCI/CABG, and history of stroke. These also showed a significant association with MACE. Obesity was not included in our risk factors as we did not have data collected to measure body mass index. Results are represented in Table 7.
Discussion
Our study described a patient population presenting to an ED with chest pain as their primary complaint. The results of this prospective study confirm that the HEART score is an excellent system to triage chest pain patients. It provides the clinician with a reliable predictor of the outcome (MACE) after the patient’s arrival, based on available clinical data and in a resource-limited setting like ours.
Cardiovascular epidemiology studies indicate that this has become a significant public health problem in India.1 Several risk scores for ACS have been published in European and American guidelines. However, in the Indian population, minimal data are available on utilization of such a triage score (HEART score) in chest pain patients in the ED in a resource-limited setting, to the best of our knowledge. In India, only 1 such study is reported,15 at the Sundaram Medical Foundation, a 170-bed community hospital in Chennai. In this study, 13 of 14 patients (92.86%) with a high HEART score had MACE, indicating a sensitivity of 92.86%; in the 44 patients with a low HEART score, 1 patient (2.22%) had MACE, indicating a specificity of 97.78%; and in the 28 patients with a moderate HEART score, 12 patients (42.86%) had MACE.
In looking for the optimal risk-stratifying system for chest pain patients, we analyzed the HEART score. The first study on the HEART score was done Backus et al, proving that the HEART score is an easy, quick, and reliable predictor of outcomes in chest pain patients.10 The HEART score had good discriminatory power, too. The C statistic for the HEART score for ACS occurrence shows a value of 0.83. This signifies a good-to-excellent ability to stratify all-cause chest pain patients in the ED for their risk of MACE. The application of the HEART score to our patient population demonstrated that the majority of the patients belonged to the low-risk category, as reported in the first cohort study that applied the HEART score.8 The relationship between the HEART score category and occurrence of MACE within 6 weeks showed a curve with 3 different patterns, corresponding to the 3 risk categories defined in the literature.11,12 The risk stratification of chest pain patients using the 3 categories (0-3, 4-6, 7-10) identified MACE with an incidence similar to the multicenter study of Backus et al,10,11 but with a greater risk of MACE in the high-risk category (Figure).
Thus, our study confirmed the utility of the HEART score categories to predict the 6-week incidence of MACE. The sensitivity, specificity, and positive and negative predictive values for the established cut-off scores of 4 and 7 are shown in Table 8. The patients in the low-risk category, corresponding to a score < 4, had a very high negative predictive value, thus identifying a small-risk population. The patients in the high-risk category (score ≥ 7) showed a high positive predictive value, allowing the identification of a high-risk population, even in patients with more atypical presentations. Therefore, the HEART score may help clinicians to make accurate management choices by being a strong predictor of both event-free survival and potentially life-threatening cardiac events.11,12
Our study tested the efficacy of the HEART score pathway in helping clinicians make smart diagnostic and therapeutic choices. It confirmed that the HEART score was accurate in predicting the short-term incidence of MACE, thus stratifying patients according to their risk severity. In our study, 67 of 141 patients (47.52%) had low-risk HEART scores, and we found the 6-week incidence of MACE to be 1.49%. We omitted the diagnostic and treatment evaluation for patients in the low-risk category and moved onto discharge. Overall, 66 of 67 patients (98.51%) in the low-risk category had an uneventful recovery following discharge. Only 2 of 67 these patients (2.99%) of patients had health care utilization following discharge. Therefore, extrapolation based on results demonstrates reduced health care utilization. Previous studies have shown similar results.9,12,14,16 For instance, in a prospective study conducted in the Netherlands, low-risk patients representing 36.4% of the total were found to have a low MACE rate (1.7%).9 These low-risk patients were categorized as appropriate and safe for ED discharge without additional cardiac evaluation or inpatient admission.9 Another retrospective study in Portugal,12 and one in Chennai, India,15 found the 6-week incidence of MACE to be 2.00% and 2.22%, respectively. The results of the first HEART Pathway Randomized Control Trial14 showed that the HEART score pathway reduces health care utilization (cardiac testing, hospitalization, and hospital length of stay). The study also showed that these gains occurred without any of the patients that were identified for early discharge, suffering from MACE at 30 days, or secondary increase in cardiac-related hospitalizations. Similar results were obtained by a randomized trial conducted in North Carolina17 that also demonstrated a reduction in objective cardiac testing, a doubling of the rate of early discharge from the ED, and a reduced length of stay by half a day. Another study using a modified HEART score also demonstrated that when low-risk patients are evaluated with cardiac testing, the likelihood for false positives is high.16 Hoffman et al also reported that patients randomized to coronary computed tomographic angiography (CCTA) received > 2.5 times more radiation exposure.16 Thus, low-risk patients may be safely discharged without the need for stress testing or CCTA.
In our study, 30 out of 141 patients (21.28%) had high-risk HEART scores (7-10), and we found the 6-week incidence of MACE to be 90%. Based on the pathway leading to inpatient admission and intensive treatment, 23 of 30 patients (76.67%) patients in our study underwent coronary angiography and further therapeutic treatment. In the high-risk category, 28 of 30 patients (93.33%) patients had an uneventful recovery following discharge. Previous studies have shown similar results. A retrospective study in Portugal showed that 76.9% of the high-risk patients had a 6-week incidence of MACE.12 In a study in the Netherlands,9 72.7% of high-risk patients had a 6-week incidence of MACE. Therefore, a HEART score of ≥ 7 in patients implies early aggressive treatment, including invasive strategies, when necessary, without noninvasive treatment preceding it.8
In terms of intermediate risk, in our study 44 of 141 patients (31.21%) patients had an intermediate-risk HEART score (4-6), and we found the 6-week incidence of MACE to be 18.18%. Based on the pathway, they were kept in the observation ward on admission. In our study, 7 of 44 patients (15.91%) underwent coronary angiography and further treatment; 42 of 44 patients (95.55%) had an uneventful recovery following discharge. In a prospective study in the Netherlands, 46.1% of patients with an intermediate score had a 6-week MACE incidence of 16.6%.10 Similarly, in another retrospective study in Portugal, the incidence of 6-week MACE in intermediate-risk patients (36.7%) was found to be 15.6%.12 Therefore, in patients with a HEART score of 4-6 points, immediate discharge is not an option, as this figure indicates a risk of 18.18% for an adverse outcome. These patients should be admitted for clinical observation, treated as an ACS awaiting final diagnosis, and subjected to noninvasive investigations, such as repeated troponin. Using the HEART score as guidance in the treatment of chest pain patients will benefit patients on both sides of the spectrum.11,12
Our sample presented a male predominance, a wide range of age, and a mean age similar to that of previous studies.12.16 Some risk factors, we found, can increase significantly the odds of chest pain being of cardiovascular origin, such as male gender, smoking, hypertension, type 2 diabetes mellitus, and hypercholesterolemia. Other studies also reported similar findings.8,12,16 Risk factors for premature CHD have been quantified in the case-control INTERHEART study.1 In the INTERHEART study, 8 common risk factors explained > 90% of AMIs in South Asian and Indian patients. The risk factors include dyslipidemia, smoking or tobacco use, known hypertension, known diabetes, abdominal obesity, physical inactivity, low fruit and vegetable intake, and psychosocial stress.1 Regarding the feasibility of treating physicians using the HEART score in the ED, we observed that, based on the Likert scale, 80% of survey respondents found it easy to use, and 100% found it feasible in the ED.
However, there were certain limitations to our study. It involved a single academic medical center and a small sample size, which limit generalizability of the findings. In addition, troponin levels are not calculated at our institution, as it is a resource-limited setting; therefore, we used a positive and negative as +2 and 0, respectively.
Conclusion
The HEART score provides the clinician with a quick and reliable predictor of outcome of patients with chest pain after arrival to the ED and can be used for triage. For patients with low HEART scores (0-3), short-term MACE can be excluded with greater than 98% certainty. In these patients, one may consider reserved treatment and discharge policies that may also reduce health care utilization. In patients with high HEART scores (7-10), the high risk of MACE (90%) may indicate early aggressive treatment, including invasive strategies, when necessary. Therefore, the HEART score may help clinicians make accurate management choices by being a strong predictor of both event-free survival and potentially life-threatening cardiac events. Age, gender, and cardiovascular risk factors may also be considered in the assessment of patients. This study confirmed the utility of the HEART score categories to predict the 6-week incidence of MACE.
Corresponding author: Smrati Bajpai Tiwari, MD, DNB, FAIMER, Department of Medicine, Seth Gordhandas Sunderdas Medical College and King Edward Memorial Hospital, Acharya Donde Marg, Parel, Mumbai 400 012, Maharashtra, India; [email protected].
Financial disclosures: None.
1. Gupta R, Mohan I, Narula J. Trends in coronary heart disease epidemiology in India. Ann Glob Health. 2016;82:307-315.
2. World Health Organization. Global status report on non-communicable diseases 2014. Accessed June 22, 2021. https://apps.who.int/iris/bitstream/handle/10665/148114/9789241564854_eng.pdf
3. Fuster V, Kelly BB, eds. Promoting Cardiovascular Health in the Developing World: A Critical Challenge to Achieve Global Health. Institutes of Medicine; 2010.
4. Krishnan MN. Coronary heart disease and risk factors in India—on the brink of an epidemic. Indian Heart J. 2012;64:364-367.
5. Prabhakaran D, Jeemon P, Roy A. Cardiovascular diseases in India: current epidemiology and future directions. Circulation. 2016;133:1605-1620.
6. Aeri B, Chauhan S. The rising incidence of cardiovascular diseases in India: assessing its economic impact. J Prev Cardiol. 2015;4:735-740.
7. Pednekar M, Gupta R, Gupta PC. Illiteracy, low educational status and cardiovascular mortality in India. BMC Public Health. 2011;11:567.
8. Six AJ, Backus BE, Kelder JC. Chest pain in the emergency room: value of the HEART score. Neth Heart J. 2008;16:191-196.
9. Backus BE, Six AJ, Kelder JC, et al. A prospective validation of the HEART score for chest pain patients at the emergency department. Int J Cardiol. 2013;168;2153-2158.
10. Backus BE, Six AJ, Kelder JC, et al. Chest pain in the emergency room: a multicenter validation of the HEART score. Crit Pathw Cardiol. 2010;9:164-169.
11. Backus BE, Six AJ, Kelder JH, et al. Risk scores for patients with chest pain: evaluation in the emergency department. Curr Cardiol Rev. 2011;7:2-8.
12. Leite L, Baptista R, Leitão J, et al. Chest pain in the emergency department: risk stratification with Manchester triage system and HEART score. BMC Cardiovasc Disord. 2015;15:48.
13. Thygesen K, Alpert JS, Jaffe AS, et al. Fourth Universal Definition of Myocardial Infarction. Circulation. 2018;138:e618-e651.
14. Mahler SA, Riley RF, Hiestand BC, et al. The HEART Pathway randomized trial: identifying emergency department patients with acute chest pain for early discharge. Circ Cardiovasc Qual Outcomes. 2015;8:195-203.
15. Natarajan B, Mallick P, Thangalvadi TA, Rajavelu P. Validation of the HEART score in Indian population. Int J Emerg Med. 2015,8(suppl 1):P5.
16. McCord J, Cabrera R, Lindahl B, et al. Prognostic utility of a modified HEART score in chest pain patients in the emergency department. Circ Cardiovasc Qual Outcomes. 2017;10:e003101.
17. Mahler SA, Miller CD, Hollander JE, et al. Identifying patients for early discharge: performance of decision rules among patients with acute chest pain. Int J Cardiol. 2012;168:795-802.
Anything You Can Do, I Can Do… Better? Evaluating Hospital Medicine Procedure Services
Hospital medicine procedure services have proliferated in recent years, driven by multiple synergistic factors, including an interest in improving hospital throughput, bolstering resident education, and ensuring full-spectrum practice for hospitalists. These services have become established and have demonstrated their capabilities, further catalyzed by emerging interest—and expertise—in point-of-care ultrasonography by hospitalists.
Most hospital medicine procedure services (HMPSs) focus on performing ultrasound-assisted procedures at bedside, providing purported advantages in convenience, cost, and potentially timing when compared to services performed by interventional radiology. The scope of procedures performed by HPMSs reflects the populations cared for by hospitalists, including paracentesis, thoracentesis, central venous catheter placement, lumbar puncture and, more recently, pigtail chest tube placement.1,2 Fitting with the early development of HMPSs, initial reports regarding these services centered on optimal development of services and emphasized the question, “Are hospital medicine procedure services able to do [procedure x] as safely as radiology or the primary team?”2
Ensuring safety and quality is fundamental to implementing new workflows; however, it is now clear that HMPSs provide high-quality, safe, patient-centered bedside procedures; these services are no longer novel.3 As HMPSs mature, so too must their evaluation, research, and scholarship. It is no longer enough to document that a HMPS can perform procedures as well as interventional radiology or a standard hospital medicine care team—instead, we must identify how these services affect patient outcomes, improve education, add value, and influence the overall process of care in the hospital.
In this issue of the Journal of Hospital Medicine, Ritter and colleagues4 describe an important first step in this maturing field by evaluating how a HMPS affects process outcomes in the context of paracentesis. The faster time from admission to paracentesis observed in the HMPS population compared with radiology services has important implications for patient satisfaction (symptom relief) and morbidity and mortality (time to peritonitis diagnosis). Ritter et al also demonstrated shorter length of stay (LOS) among patients who had paracenteses performed by the HMPS compared with the radiology service; this finding is consistent with previous studies that, while not evaluating a HMPS per se, demonstrated shorter LOS with bedside paracentesis. While there were some limitations, such as the findings representing a single-site experience and group differences that necessitated assessment of multiple confounders (some of which may remain unknown), the authors’ efforts to shift focus toward patient and high-value care outcomes should be applauded.
The evaluation of HMPSs has reached an inflection point. The field must now focus on assessing outcomes. Does the appropriateness of procedures improve when those with internal medicine training are performing the procedures rather than radiologists, who have more focused procedural knowledge but less general medical training? What procedures are not or should not be performed by HMPSs? What does the shift of procedures to HMPSs do to the flow of patients and procedures in interventional radiology, and do other patients indirectly benefit? How should hospital medicine groups and hospitals account for lower work relative value unit productivity of HMPSs compared with other traditional rounding services? In what ways do HMPSs provide cost-effective care compared with alternatives? There has been limited evaluation of cost-savings realized when performing paracentesis at the bedside as opposed to in the interventional radiology suite.5
Additionally, most HMPSs are staffed by a small number of hospitalists within a group. It is unclear how a HMPS will affect general hospitalist procedural competence, and whether that even matters. Should we still expect every hospitalist to be able to perform procedures, or are HMPSs a step in the evolution of subspecialties in hospital medicine? Such subspecialties exist already, including perioperative medicine and transitional care specialists.
Now that more HMPSs have been established, the next step in their evolution must go beyond feasibility and safety assessments and toward evaluation of their effectiveness. It has become clear that HMPSs can perform procedures safely, but what can they do better?
1. Puetz J, Segon A, Umpierrez A. Two-year experience of 14 French pigtail catheters placed by procedure-focused hospitalists. J Hosp Med. 2020;15(9):526-30. https://doi.org/10.12788/jhm.3383
2. Hayat MH, Meyers MH, Ziogas IA, et al. Medical procedure services in internal medicine residencies in the us: a systematic review and meta-analysis. J Gen Intern Med. Published online February 5, 2021. https://doi.org/10.1007/s11606-020-06526-2
3. Mourad M, Auerbach AD, Maselli J, Sliwka D. Patient satisfaction with a hospitalist procedure service: is bedside procedure teaching reassuring to patients? J Hosp Med. 2011;6(4):219-224. https://doi.org/10.1002/jhm.856
4. Ritter E, Malik M, Qayyum R. Impact of a hospitalist-run procedure service on time to paracentesis and length of stay. J Hosp Med. 2021;16(8):476-479. https://doi.org/10.12788/jhm.3582
5. Barsuk JH, Cohen ER, Feinglass J, et al. Cost savings of performing paracentesis procedures at the bedside after simulation-based education. Simul Healthc. 2014;9(5):312-318. https://doi.org/10.1097/SIH.0000000000000040
Hospital medicine procedure services have proliferated in recent years, driven by multiple synergistic factors, including an interest in improving hospital throughput, bolstering resident education, and ensuring full-spectrum practice for hospitalists. These services have become established and have demonstrated their capabilities, further catalyzed by emerging interest—and expertise—in point-of-care ultrasonography by hospitalists.
Most hospital medicine procedure services (HMPSs) focus on performing ultrasound-assisted procedures at bedside, providing purported advantages in convenience, cost, and potentially timing when compared to services performed by interventional radiology. The scope of procedures performed by HPMSs reflects the populations cared for by hospitalists, including paracentesis, thoracentesis, central venous catheter placement, lumbar puncture and, more recently, pigtail chest tube placement.1,2 Fitting with the early development of HMPSs, initial reports regarding these services centered on optimal development of services and emphasized the question, “Are hospital medicine procedure services able to do [procedure x] as safely as radiology or the primary team?”2
Ensuring safety and quality is fundamental to implementing new workflows; however, it is now clear that HMPSs provide high-quality, safe, patient-centered bedside procedures; these services are no longer novel.3 As HMPSs mature, so too must their evaluation, research, and scholarship. It is no longer enough to document that a HMPS can perform procedures as well as interventional radiology or a standard hospital medicine care team—instead, we must identify how these services affect patient outcomes, improve education, add value, and influence the overall process of care in the hospital.
In this issue of the Journal of Hospital Medicine, Ritter and colleagues4 describe an important first step in this maturing field by evaluating how a HMPS affects process outcomes in the context of paracentesis. The faster time from admission to paracentesis observed in the HMPS population compared with radiology services has important implications for patient satisfaction (symptom relief) and morbidity and mortality (time to peritonitis diagnosis). Ritter et al also demonstrated shorter length of stay (LOS) among patients who had paracenteses performed by the HMPS compared with the radiology service; this finding is consistent with previous studies that, while not evaluating a HMPS per se, demonstrated shorter LOS with bedside paracentesis. While there were some limitations, such as the findings representing a single-site experience and group differences that necessitated assessment of multiple confounders (some of which may remain unknown), the authors’ efforts to shift focus toward patient and high-value care outcomes should be applauded.
The evaluation of HMPSs has reached an inflection point. The field must now focus on assessing outcomes. Does the appropriateness of procedures improve when those with internal medicine training are performing the procedures rather than radiologists, who have more focused procedural knowledge but less general medical training? What procedures are not or should not be performed by HMPSs? What does the shift of procedures to HMPSs do to the flow of patients and procedures in interventional radiology, and do other patients indirectly benefit? How should hospital medicine groups and hospitals account for lower work relative value unit productivity of HMPSs compared with other traditional rounding services? In what ways do HMPSs provide cost-effective care compared with alternatives? There has been limited evaluation of cost-savings realized when performing paracentesis at the bedside as opposed to in the interventional radiology suite.5
Additionally, most HMPSs are staffed by a small number of hospitalists within a group. It is unclear how a HMPS will affect general hospitalist procedural competence, and whether that even matters. Should we still expect every hospitalist to be able to perform procedures, or are HMPSs a step in the evolution of subspecialties in hospital medicine? Such subspecialties exist already, including perioperative medicine and transitional care specialists.
Now that more HMPSs have been established, the next step in their evolution must go beyond feasibility and safety assessments and toward evaluation of their effectiveness. It has become clear that HMPSs can perform procedures safely, but what can they do better?
1. Puetz J, Segon A, Umpierrez A. Two-year experience of 14 French pigtail catheters placed by procedure-focused hospitalists. J Hosp Med. 2020;15(9):526-30. https://doi.org/10.12788/jhm.3383
2. Hayat MH, Meyers MH, Ziogas IA, et al. Medical procedure services in internal medicine residencies in the us: a systematic review and meta-analysis. J Gen Intern Med. Published online February 5, 2021. https://doi.org/10.1007/s11606-020-06526-2
3. Mourad M, Auerbach AD, Maselli J, Sliwka D. Patient satisfaction with a hospitalist procedure service: is bedside procedure teaching reassuring to patients? J Hosp Med. 2011;6(4):219-224. https://doi.org/10.1002/jhm.856
4. Ritter E, Malik M, Qayyum R. Impact of a hospitalist-run procedure service on time to paracentesis and length of stay. J Hosp Med. 2021;16(8):476-479. https://doi.org/10.12788/jhm.3582
5. Barsuk JH, Cohen ER, Feinglass J, et al. Cost savings of performing paracentesis procedures at the bedside after simulation-based education. Simul Healthc. 2014;9(5):312-318. https://doi.org/10.1097/SIH.0000000000000040
© 2021 Society of Hospital Medicine
The Importance of Understanding COVID-19–Related Hospitalizations
Throughout North America, hospitalizations and deaths due to SARS-CoV-2 have fallen substantially due to the rapid roll-out of COVID-19 vaccines. Despite this monumental success, however, transmission of the virus will unfortunately persist for the foreseeable future due to a variety of factors, including incomplete population vaccination, emergence of variants, and increased exposures as social and economic activity return to normal.1 Therefore, it is of critical importance to continue to track the burden of COVID-19 by region. Specifically, the incidence of hospitalizations due to COVID-19 will be a key metric, as highlighted by Tsai et al2 in this issue of the Journal of Hospital Medicine.
Tsai et al2 explored the challenge of accurately determining the burden of hospitalization due to COVID-19, focusing on the potential for misclassification leading to overestimations. They rigorously evaluated the proportion of overall COVID-19–associated hospitalizations reported to Los Angeles County Department of Public Health that were potentially misclassified as caused by COVID-19 because of incidentally detected virus in patients who were hospitalized for unrelated reasons. In their study, they reviewed medical records from a randomly selected subset of hospital discharges with a clinical diagnosis of COVID-19 to determine whether a clinical diagnosis of COVID-19 was warranted. Among 618 patients, COVID-19 was deemed incidental to the reason for hospitalization in 12% (95% CI, 9%-16%) of admissions.
Incidental viral detection is more common during periods of high case prevalence and when case presentations overlap with nonclassic COVID symptoms.3 Incidental viral detection also occurs when broad testing of asymptomatic patients is instituted prior to admission, procedures, or high-risk medical therapies. Residual postinfectious shedding and false-positive results may further falsely increase case counts. The clinical and infection control implications of detectable virus is further complicated by vaccination, which leads to milder forms of the infection with less capacity for transmission.4
Why is establishing an overestimation COVID-19 hospitalization important? First, if misclassification leads to an overestimate of the number of hospitalizations caused by COVID-19, public health restrictions might be increased to protect overloading acute care sites when such measures are unnecessary, resulting in unintended social and economic fallouts.5 Second, healthcare resource allocation depends on accurate estimates of disease burden—overestimation of COVID-19–related hospitalization can lead to misallocation of scarce resources, including personnel, equipment, and medication to units or hospitals.6 Relatedly, cancelling of “nonurgent” tests, procedures, and clinic visits to reallocate resources to COVID-19–related care delays diagnosis and treatment of potentially serious illnesses. Last, overattributing hospitalizations due to COVID-19, particularly in patients who are now fully vaccinated, may lead researchers to underestimate the efficacy of vaccination efforts on the individual and population level, especially in the era of evolving variant strains.
How could this research change future practice? As the authors astutely state, the purpose of the investigation is not to alter practice on the individual patient level, but rather to help public health officials to make better decisions. One solution (similar to census adjustment) based on future research would be to potentially apply a corrective factor to “adjust” COVID-19 hospitalizations downward to explicitly account for the recognition that some proportion of patients hospitalized with COVID-19 were not actually hospitalized because of COVID-19.
Although vaccination continues to be highly successful at curbing the pandemic, transmission of COVID-19 persists due to gaps in vaccination and emergence of variants. Therefore, continued ongoing vigilance for disease burden, specifically focused on the most vulnerable aspects of the health care system—acute care centers—is critical to informing optimal public health restrictions and resource allocation.
1. Skegg D, Gluckman P, Boulton G, et al. Future scenarios for the COVID-19 pandemic. Lancet. 2021;397(10276):777-778. https://doi.org/10.1016/S0140-6736(21)00424-4
2. Tsai J, Traub E, Aoki K, et al. Incidentally detected SARS-COV-2 among hospitalized patients—Los Angeles County, August–October 2020. J Hosp Med. 2021;16(8):480-483. https://doi.org/ 10.12788/jhm.3641
3. Watson J, Whiting PF, Brush JE. Interpreting a covid-19 test result. BMJ. 2020;369:m1808. https://doi.org/10.1136/bmj.m1808
4. Hacisuleyman E, Hale C, Saito Y, et al. Vaccine breakthrough infections with SARS-CoV-2 variants. N Engl J Med. 2021;384(23):2212-2218. https://doi.org/10.1056/NEJMoa2105000
5. Hunter DJ. Trying to “Protect the NHS” in the United Kingdom. N Engl J Med. 2020;383(25):e136. https://doi.org/doi:10.1056/NEJMp2032508
6. Emanuel EJ, Persad G, Upshur R, et al. Fair allocation of scarce medical resources in the time of Covid-19. N Engl J Med. 2020;382(21):2049-2055. https://doi.org/10.1056/NEJMsb2005114
Throughout North America, hospitalizations and deaths due to SARS-CoV-2 have fallen substantially due to the rapid roll-out of COVID-19 vaccines. Despite this monumental success, however, transmission of the virus will unfortunately persist for the foreseeable future due to a variety of factors, including incomplete population vaccination, emergence of variants, and increased exposures as social and economic activity return to normal.1 Therefore, it is of critical importance to continue to track the burden of COVID-19 by region. Specifically, the incidence of hospitalizations due to COVID-19 will be a key metric, as highlighted by Tsai et al2 in this issue of the Journal of Hospital Medicine.
Tsai et al2 explored the challenge of accurately determining the burden of hospitalization due to COVID-19, focusing on the potential for misclassification leading to overestimations. They rigorously evaluated the proportion of overall COVID-19–associated hospitalizations reported to Los Angeles County Department of Public Health that were potentially misclassified as caused by COVID-19 because of incidentally detected virus in patients who were hospitalized for unrelated reasons. In their study, they reviewed medical records from a randomly selected subset of hospital discharges with a clinical diagnosis of COVID-19 to determine whether a clinical diagnosis of COVID-19 was warranted. Among 618 patients, COVID-19 was deemed incidental to the reason for hospitalization in 12% (95% CI, 9%-16%) of admissions.
Incidental viral detection is more common during periods of high case prevalence and when case presentations overlap with nonclassic COVID symptoms.3 Incidental viral detection also occurs when broad testing of asymptomatic patients is instituted prior to admission, procedures, or high-risk medical therapies. Residual postinfectious shedding and false-positive results may further falsely increase case counts. The clinical and infection control implications of detectable virus is further complicated by vaccination, which leads to milder forms of the infection with less capacity for transmission.4
Why is establishing an overestimation COVID-19 hospitalization important? First, if misclassification leads to an overestimate of the number of hospitalizations caused by COVID-19, public health restrictions might be increased to protect overloading acute care sites when such measures are unnecessary, resulting in unintended social and economic fallouts.5 Second, healthcare resource allocation depends on accurate estimates of disease burden—overestimation of COVID-19–related hospitalization can lead to misallocation of scarce resources, including personnel, equipment, and medication to units or hospitals.6 Relatedly, cancelling of “nonurgent” tests, procedures, and clinic visits to reallocate resources to COVID-19–related care delays diagnosis and treatment of potentially serious illnesses. Last, overattributing hospitalizations due to COVID-19, particularly in patients who are now fully vaccinated, may lead researchers to underestimate the efficacy of vaccination efforts on the individual and population level, especially in the era of evolving variant strains.
How could this research change future practice? As the authors astutely state, the purpose of the investigation is not to alter practice on the individual patient level, but rather to help public health officials to make better decisions. One solution (similar to census adjustment) based on future research would be to potentially apply a corrective factor to “adjust” COVID-19 hospitalizations downward to explicitly account for the recognition that some proportion of patients hospitalized with COVID-19 were not actually hospitalized because of COVID-19.
Although vaccination continues to be highly successful at curbing the pandemic, transmission of COVID-19 persists due to gaps in vaccination and emergence of variants. Therefore, continued ongoing vigilance for disease burden, specifically focused on the most vulnerable aspects of the health care system—acute care centers—is critical to informing optimal public health restrictions and resource allocation.
1. Skegg D, Gluckman P, Boulton G, et al. Future scenarios for the COVID-19 pandemic. Lancet. 2021;397(10276):777-778. https://doi.org/10.1016/S0140-6736(21)00424-4
2. Tsai J, Traub E, Aoki K, et al. Incidentally detected SARS-COV-2 among hospitalized patients—Los Angeles County, August–October 2020. J Hosp Med. 2021;16(8):480-483. https://doi.org/ 10.12788/jhm.3641
3. Watson J, Whiting PF, Brush JE. Interpreting a covid-19 test result. BMJ. 2020;369:m1808. https://doi.org/10.1136/bmj.m1808
4. Hacisuleyman E, Hale C, Saito Y, et al. Vaccine breakthrough infections with SARS-CoV-2 variants. N Engl J Med. 2021;384(23):2212-2218. https://doi.org/10.1056/NEJMoa2105000
5. Hunter DJ. Trying to “Protect the NHS” in the United Kingdom. N Engl J Med. 2020;383(25):e136. https://doi.org/doi:10.1056/NEJMp2032508
6. Emanuel EJ, Persad G, Upshur R, et al. Fair allocation of scarce medical resources in the time of Covid-19. N Engl J Med. 2020;382(21):2049-2055. https://doi.org/10.1056/NEJMsb2005114
© 2021 Society of Hospital Medicine
Leadership & Professional Development: We Are Being Watched
“Being a role model is the most powerful form of educating.”
—John Wooden
The typical approach to faculty development in education often emphasizes specific teaching skills, such as rounding and teaching styles, providing expectations, and giving feedback. Before these strategies can be applied, however, we must first take note that memorable and influential physicians share common practices of compassionate, person-centered care. Role models are important in professional, character, and career development.1 Role modeling compassionate patient care gains learners’ respect and engagement, and, ideally, inspires them to grow as people and physicians. An often-overlooked foundation of improving as a medical educator is working to improve our bedside interactions and role modeling compassionate care.
As new roles and promotions draw us away from clinical commitments and toward administrative work, it is easy to become disconnected from the value of clinical medicine. We risk unintentionally perpetuating a hidden curriculum that undervalues humanistic care when we do not explicitly endorse empathic values and behaviors. Exemplary teaching physicians respect patients, care for their well-being, and consider the big picture.2 Next time you are rounding, remember the importance of bedside patient interactions.
With that in mind, here are three key strategies to consider for effective physician-patient interactions.
1. Start strong: It is crucial to get off to a good start by leading with respect and kindness. Knocking and pausing before entering the patient’s hospital room shows you remember that they are in vulnerable positions, with little privacy. Smiling warmly when greeting patients shows you are happy to see them. Greet them using their preferred honorific and introduce yourself and your team each day. Ask whether it’s okay to mute the television, but remember to turn the volume back up when leaving. Convey warmth with appropriate touch, consider small acts to make the patient more comfortable, and, when possible, sit at a patient’s eye level.
2. Show empathy: Be patient and remind yourself that hospitalized patients and their families are often in the most difficult times of their lives. In addition to being in vulnerable positions, patients are often lonely and anxious. Humanistic physicians get to know patients as people and beyond their medical illness by talking about nonmedical topics.3 Ask about their family, their pets, memorable moments in their lives, sports teams, favorite shows, and how they pass the time while hospitalized. Are there any photos they would like to share with you? Ask, too, before you leave the room whether they need you to reach something for them. Use humor thoughtfully, and always with kindness. Demonstrate humility about your own abilities, and what you know and do not know about the patient’s diagnoses, and their lived experience.
3. Strive for trustworthiness: Advocate for the patient and show them and your learners that you care. Make shared decisions when straying from guideline-directed care. Aim for trustworthiness; patients’ distrust is an adaptive response to how they have experienced healthcare, so while you do not have to take distrust personally, you should take addressing it as a personal obligation. Be aware of your own privilege, and that how patients perceive you is a reflection of how they have experienced the world, including other clinicians. Model vulnerability, including showing appropriate sadness when there is bad news to report and acknowledging grief.
Being a better clinical teacher starts with being a better doctor. Role modeling compassionate and person-centered care is a cornerstone of being an exceptional clinical teacher.
Acknowledgment
We gratefully acknowledge SHM’s Physician-in-Training Committee, whose support made this collaboration possible.
1. Passi V, Johnson N. The impact of positive doctor role modeling. Med Teach. 2016;38(11):1139-1145. https://doi.org/10.3109/0142159X.2016.1170780
2. Saint S, Harrod M, Fowler KE, Houchens N. How exemplary teaching physicians interact with hospitalized patients. J Hosp Med. 2017;12(12):974-978. https://doi.org/10.12788/jhm.2844
3. Chou CM, Kellom K, Shea JA. Attitudes and habits of highly humanistic physicians. Acad Med. 2014;89(9):1252-1258. https://doi.org/10.1097/ACM.0000000000000405
“Being a role model is the most powerful form of educating.”
—John Wooden
The typical approach to faculty development in education often emphasizes specific teaching skills, such as rounding and teaching styles, providing expectations, and giving feedback. Before these strategies can be applied, however, we must first take note that memorable and influential physicians share common practices of compassionate, person-centered care. Role models are important in professional, character, and career development.1 Role modeling compassionate patient care gains learners’ respect and engagement, and, ideally, inspires them to grow as people and physicians. An often-overlooked foundation of improving as a medical educator is working to improve our bedside interactions and role modeling compassionate care.
As new roles and promotions draw us away from clinical commitments and toward administrative work, it is easy to become disconnected from the value of clinical medicine. We risk unintentionally perpetuating a hidden curriculum that undervalues humanistic care when we do not explicitly endorse empathic values and behaviors. Exemplary teaching physicians respect patients, care for their well-being, and consider the big picture.2 Next time you are rounding, remember the importance of bedside patient interactions.
With that in mind, here are three key strategies to consider for effective physician-patient interactions.
1. Start strong: It is crucial to get off to a good start by leading with respect and kindness. Knocking and pausing before entering the patient’s hospital room shows you remember that they are in vulnerable positions, with little privacy. Smiling warmly when greeting patients shows you are happy to see them. Greet them using their preferred honorific and introduce yourself and your team each day. Ask whether it’s okay to mute the television, but remember to turn the volume back up when leaving. Convey warmth with appropriate touch, consider small acts to make the patient more comfortable, and, when possible, sit at a patient’s eye level.
2. Show empathy: Be patient and remind yourself that hospitalized patients and their families are often in the most difficult times of their lives. In addition to being in vulnerable positions, patients are often lonely and anxious. Humanistic physicians get to know patients as people and beyond their medical illness by talking about nonmedical topics.3 Ask about their family, their pets, memorable moments in their lives, sports teams, favorite shows, and how they pass the time while hospitalized. Are there any photos they would like to share with you? Ask, too, before you leave the room whether they need you to reach something for them. Use humor thoughtfully, and always with kindness. Demonstrate humility about your own abilities, and what you know and do not know about the patient’s diagnoses, and their lived experience.
3. Strive for trustworthiness: Advocate for the patient and show them and your learners that you care. Make shared decisions when straying from guideline-directed care. Aim for trustworthiness; patients’ distrust is an adaptive response to how they have experienced healthcare, so while you do not have to take distrust personally, you should take addressing it as a personal obligation. Be aware of your own privilege, and that how patients perceive you is a reflection of how they have experienced the world, including other clinicians. Model vulnerability, including showing appropriate sadness when there is bad news to report and acknowledging grief.
Being a better clinical teacher starts with being a better doctor. Role modeling compassionate and person-centered care is a cornerstone of being an exceptional clinical teacher.
Acknowledgment
We gratefully acknowledge SHM’s Physician-in-Training Committee, whose support made this collaboration possible.
1. Passi V, Johnson N. The impact of positive doctor role modeling. Med Teach. 2016;38(11):1139-1145. https://doi.org/10.3109/0142159X.2016.1170780
2. Saint S, Harrod M, Fowler KE, Houchens N. How exemplary teaching physicians interact with hospitalized patients. J Hosp Med. 2017;12(12):974-978. https://doi.org/10.12788/jhm.2844
3. Chou CM, Kellom K, Shea JA. Attitudes and habits of highly humanistic physicians. Acad Med. 2014;89(9):1252-1258. https://doi.org/10.1097/ACM.0000000000000405
© 2021 Society of Hospital Medicine
Traumatic Fractures Should Trigger Osteoporosis Assessment in Postmenopausal Women
Study Overview
Objective. To compare the risk of subsequent fractures after an initial traumatic or nontraumatic fracture in postmenopausal women.
Design. A prospective observational study utilizing data from the Women’s Health Initiative (WHI) Study, WHI Clinical Trials (WHI-CT), and WHI Bone Density Substudy to evaluate rates at which patients who suffered a traumatic fracture vs nontraumatic fracture develop a subsequent fracture.
Setting and participants. The WHI study, implemented at 40 United States clinical sites, enrolled 161 808 postmenopausal women aged 50 to 79 years at baseline between 1993 and 1998. The study cohort consisted of 75 335 patients who had self-reported fractures from September 1994 to December 1998 that were confirmed by the WHI Bone Density Substudy and WHI-CT. Of these participants, 253 (0.3%) were excluded because of a lack of follow-up information regarding incident fractures, and 8208 (10.9%) were excluded due to incomplete information on covariates, thus resulting in an analytic sample of 66 874 (88.8%) participants. Prospective fracture ascertainment with participants was conducted at least annually and the mechanism of fracture was assessed to differentiate traumatic vs nontraumatic incident fractures. Traumatic fractures were defined as fractures caused by motor vehicle collisions, falls from a height, falls downstairs, or sports injury. Nontraumatic fractures were defined as fractures caused by a trip and fall.
Main outcome measures. The primary outcome was an incident fracture at an anatomically distinct body part. Fractures were classified as upper extremity (carpal, elbow, lower or upper end of humerus, shaft of humerus, upper radius/ulna, or radius/ulna), lower extremity (ankle, hip, patella, pelvis, shaft of femur, tibia/fibula, or tibial plateau), or spine (lumbar and/or thoracic spine). Self-reported fractures were verified via medical chart review by WHI study physicians; hip fractures were confirmed by review of written reports of radiographic studies; and nonhip fractures were confirmed by review of radiography reports or clinical documentations.
Main results. In total, 66 874 women in the study (mean [SD] age) 63.1 (7.0) years without clinical fracture and 65.3 (7.2) years with clinical fracture at baseline were followed for 8.1 (1.6) years. Of these participants, 7142 (10.7%) experienced incident fracture during the study follow-up period (13.9 per 1000 person-years), and 721 (10.1%) of whom had a subsequent fracture. The adjusted hazard ratio (aHR) of subsequent fracture after an initial fracture was 1.49 (95% CI, 1.38-1.61, P < .001). Covariates adjusted were age, race, ethnicity, body mass index, treated diabetes, frequency of falls in the previous year, and physical function and activity. In women with initial traumatic fracture, the association between initial and subsequent fracture was increased (aHR, 1.25; 95% CI, 1.06-1.48, P = .01). Among women with initial nontraumatic fracture, the association between initial and subsequent fracture was also increased (aHR, 1.52; 95% CI, 1.37-1.68, P < .001). The confidence intervals for the 2 preceding associations for traumatic and nontraumatic initial fracture strata were overlapping.
Conclusion. Fractures, regardless of mechanism of injury, are similarly associated with an increased risk of subsequent fractures in postmenopausal women aged 50 years and older. Findings from this study provide evidence to support reevaluation of current clinical guidelines to include traumatic fracture as a trigger for osteoporosis screening.
Commentary
Osteoporosis is one of the most common age-associated disease that affects 1 in 4 women and 1 in 20 men over the age of 65.1 It increases the risk of fracture, and its clinical sequelae include reduced mobility, health decline, and increased all-cause mortality. The high prevalence of osteoporosis poses a clinical challenge as the global population continues to age. Pharmacological treatments such as bisphosphonates are highly effective in preventing or slowing bone mineral density (BMD) loss and reducing risk of fragility fractures (eg, nontraumatic fractures of the vertebra, hip, and femur) and are commonly used to mitigate adverse effects of degenerative bone changes secondary to osteoporosis.1
The high prevalence of osteoporosis and effectiveness of bisphosphonates raises the question of how to optimally identify adults at risk for osteoporosis so that pharmacologic therapy can be promptly initiated to prevent disease progression. Multiple osteoporosis screening guidelines, including those from the United States Preventive Services Task Force (USPSTF), American Association of Family Physicians, and National Osteoporosis Foundation, are widely used in the clinical setting to address this important clinical question. In general, the prevailing wisdom is to screen osteoporosis in postmenopausal women over the age of 65, women under the age of 65 who have a significant 10-year fracture risk, or women over the age of 50 who have experienced a fragility fracture.1 In the study reported by Crandall et al, it was shown that the risks of having subsequent fractures were similar after an initial traumatic or nontraumatic (fragility) fracture in postmenopausal women aged 50 years and older.2 This finding brings into question whether traumatic fractures should be viewed any differently than nontraumatic fractures in women over the age of 50 in light of evaluation for osteoporosis. Furthermore, these results suggest that most fractures in postmenopausal women may indicate decreased bone integrity, thus adding to the rationale that osteoporosis screening needs to be considered and expanded to include postmenopausal women under the age of 65 who endured a traumatic fracture.
Per current guidelines, a woman under the age of 65 is recommended for osteoporosis screening only if she has an increased 10-year fracture risk compared to women aged 65 years and older. This risk is calculated based on the World Health Organization fracture-risk algorithm (WHO FRAX) tool which uses multiple factors such as age, weight, and history of fragility fractures to predict whether an individual is at risk of developing a fracture in the next 10 years. The WHO FRAX tool does not include traumatic fractures in its risk calculation and current clinical guidelines do not account for traumatic fractures as a red flag to initiate osteoporosis screening. Therefore, postmenopausal women under the age of 65 are less likely to be screened for osteoporosis when they experience a traumatic fracture compared to a fragility fracture, despite being at a demonstrably higher risk for subsequent fracture. As an unintended consequence, this may lead to the under diagnosis of osteoporosis in postmenopausal women under the age of 65. Thus, Crandall et al conclude that a fracture due to any cause warrants follow up evaluation for osteoporosis including BMD testing in women older than 50 years of age.
Older men constitute another population who are commonly under screened for osteoporosis. The current USPSTF guidelines indicate that there is an insufficient body of evidence to screen men for osteoporosis given its lower prevalence.1 However, it is important to note that men have significantly increased mortality after a hip fracture, are less likely to be on pharmacological treatment for osteoporosis, and are under diagnosed for osteoporosis.3 Consistent with findings from the current study, Leslie et al showed that high-trauma and low-trauma fractures have similarly elevated subsequent fracture risk in both men and women over the age of 40 in a Canadian study.4 Moreover, in the same study, BMD was decreased in both men and women who suffered a fracture regardless of the injury mechanism. This finding further underscores a need to consider traumatic fractures as a risk factor for osteoporosis. Taken together, given that men are under screened and treated for osteoporosis but have increased mortality post-fracture, considerations to initiate osteoporosis evaluation should be similarly given to men who endured a traumatic fracture.
The study conducted by Crandall et al has several strengths. It is noteworthy for the large size of the WHI cohort with participants from across the United States which enables the capture of a wider range of age groups as women under the age of 65 are not common participants of osteoporosis studies. Additionally, data ascertainment and outcome adjudication utilizing medical records and physician review assure data quality. A limitation of the study is that the study cohort consists exclusively of women and therefore the findings are not generalizable to men. However, findings from this study echo those from other studies that investigate the relationship between fracture mechanisms and subsequent fracture risk in men and women.3,4 Collectively, these comparable findings highlight the need for additional research to validate traumatic fracture as a risk factor for osteoporosis and to incorporate it into clinical guidelines for osteoporosis screening.
Applications for Clinical Practice
The findings from the current study indicate that traumatic and fragility fractures may be more alike than previously recognized in regards to bone health and subsequent fracture prevention in postmenopausal women. If validated, these results may lead to changes in clinical practice whereby all fractures in postmenopausal women could trigger osteoporosis screening, assessment, and treatment if indicated for the secondary prevention of fractures.
1. US Preventive Services Task Force, Curry SJ, Krist Ah, et al. Screening for Osteoporosis to Prevent Fractures: US Preventive Services Task Force Recommendation Statement. JAMA. 2018;319(24):2521–2531. doi:10.1001/jama.2018.7498
2. Crandall CJ, Larson JC, LaCroix AZ, et al. Risk of Subsequent Fractures in Postmenopausal Women After Nontraumatic vs Traumatic Fractures. JAMA Intern Med. Published online June 7, 2021. doi:10.1001/jamainternmed.2021.2617
3. Mackey DC, Lui L, Cawthon PM, et al. High-Trauma Fractures and Low Bone Mineral Density in Older Women and Men. JAMA. 2007;298(20):2381–2388. doi:10.1001/jama.298.20.2381
4. Leslie WD, Schousboe JT, Morin SN, et al. Fracture risk following high-trauma versus low-trauma fracture: a registry-based cohort study. Osteoporos Int. 2020;31(6):1059–1067. doi:10.1007/s00198-019-05274-2
Study Overview
Objective. To compare the risk of subsequent fractures after an initial traumatic or nontraumatic fracture in postmenopausal women.
Design. A prospective observational study utilizing data from the Women’s Health Initiative (WHI) Study, WHI Clinical Trials (WHI-CT), and WHI Bone Density Substudy to evaluate rates at which patients who suffered a traumatic fracture vs nontraumatic fracture develop a subsequent fracture.
Setting and participants. The WHI study, implemented at 40 United States clinical sites, enrolled 161 808 postmenopausal women aged 50 to 79 years at baseline between 1993 and 1998. The study cohort consisted of 75 335 patients who had self-reported fractures from September 1994 to December 1998 that were confirmed by the WHI Bone Density Substudy and WHI-CT. Of these participants, 253 (0.3%) were excluded because of a lack of follow-up information regarding incident fractures, and 8208 (10.9%) were excluded due to incomplete information on covariates, thus resulting in an analytic sample of 66 874 (88.8%) participants. Prospective fracture ascertainment with participants was conducted at least annually and the mechanism of fracture was assessed to differentiate traumatic vs nontraumatic incident fractures. Traumatic fractures were defined as fractures caused by motor vehicle collisions, falls from a height, falls downstairs, or sports injury. Nontraumatic fractures were defined as fractures caused by a trip and fall.
Main outcome measures. The primary outcome was an incident fracture at an anatomically distinct body part. Fractures were classified as upper extremity (carpal, elbow, lower or upper end of humerus, shaft of humerus, upper radius/ulna, or radius/ulna), lower extremity (ankle, hip, patella, pelvis, shaft of femur, tibia/fibula, or tibial plateau), or spine (lumbar and/or thoracic spine). Self-reported fractures were verified via medical chart review by WHI study physicians; hip fractures were confirmed by review of written reports of radiographic studies; and nonhip fractures were confirmed by review of radiography reports or clinical documentations.
Main results. In total, 66 874 women in the study (mean [SD] age) 63.1 (7.0) years without clinical fracture and 65.3 (7.2) years with clinical fracture at baseline were followed for 8.1 (1.6) years. Of these participants, 7142 (10.7%) experienced incident fracture during the study follow-up period (13.9 per 1000 person-years), and 721 (10.1%) of whom had a subsequent fracture. The adjusted hazard ratio (aHR) of subsequent fracture after an initial fracture was 1.49 (95% CI, 1.38-1.61, P < .001). Covariates adjusted were age, race, ethnicity, body mass index, treated diabetes, frequency of falls in the previous year, and physical function and activity. In women with initial traumatic fracture, the association between initial and subsequent fracture was increased (aHR, 1.25; 95% CI, 1.06-1.48, P = .01). Among women with initial nontraumatic fracture, the association between initial and subsequent fracture was also increased (aHR, 1.52; 95% CI, 1.37-1.68, P < .001). The confidence intervals for the 2 preceding associations for traumatic and nontraumatic initial fracture strata were overlapping.
Conclusion. Fractures, regardless of mechanism of injury, are similarly associated with an increased risk of subsequent fractures in postmenopausal women aged 50 years and older. Findings from this study provide evidence to support reevaluation of current clinical guidelines to include traumatic fracture as a trigger for osteoporosis screening.
Commentary
Osteoporosis is one of the most common age-associated disease that affects 1 in 4 women and 1 in 20 men over the age of 65.1 It increases the risk of fracture, and its clinical sequelae include reduced mobility, health decline, and increased all-cause mortality. The high prevalence of osteoporosis poses a clinical challenge as the global population continues to age. Pharmacological treatments such as bisphosphonates are highly effective in preventing or slowing bone mineral density (BMD) loss and reducing risk of fragility fractures (eg, nontraumatic fractures of the vertebra, hip, and femur) and are commonly used to mitigate adverse effects of degenerative bone changes secondary to osteoporosis.1
The high prevalence of osteoporosis and effectiveness of bisphosphonates raises the question of how to optimally identify adults at risk for osteoporosis so that pharmacologic therapy can be promptly initiated to prevent disease progression. Multiple osteoporosis screening guidelines, including those from the United States Preventive Services Task Force (USPSTF), American Association of Family Physicians, and National Osteoporosis Foundation, are widely used in the clinical setting to address this important clinical question. In general, the prevailing wisdom is to screen osteoporosis in postmenopausal women over the age of 65, women under the age of 65 who have a significant 10-year fracture risk, or women over the age of 50 who have experienced a fragility fracture.1 In the study reported by Crandall et al, it was shown that the risks of having subsequent fractures were similar after an initial traumatic or nontraumatic (fragility) fracture in postmenopausal women aged 50 years and older.2 This finding brings into question whether traumatic fractures should be viewed any differently than nontraumatic fractures in women over the age of 50 in light of evaluation for osteoporosis. Furthermore, these results suggest that most fractures in postmenopausal women may indicate decreased bone integrity, thus adding to the rationale that osteoporosis screening needs to be considered and expanded to include postmenopausal women under the age of 65 who endured a traumatic fracture.
Per current guidelines, a woman under the age of 65 is recommended for osteoporosis screening only if she has an increased 10-year fracture risk compared to women aged 65 years and older. This risk is calculated based on the World Health Organization fracture-risk algorithm (WHO FRAX) tool which uses multiple factors such as age, weight, and history of fragility fractures to predict whether an individual is at risk of developing a fracture in the next 10 years. The WHO FRAX tool does not include traumatic fractures in its risk calculation and current clinical guidelines do not account for traumatic fractures as a red flag to initiate osteoporosis screening. Therefore, postmenopausal women under the age of 65 are less likely to be screened for osteoporosis when they experience a traumatic fracture compared to a fragility fracture, despite being at a demonstrably higher risk for subsequent fracture. As an unintended consequence, this may lead to the under diagnosis of osteoporosis in postmenopausal women under the age of 65. Thus, Crandall et al conclude that a fracture due to any cause warrants follow up evaluation for osteoporosis including BMD testing in women older than 50 years of age.
Older men constitute another population who are commonly under screened for osteoporosis. The current USPSTF guidelines indicate that there is an insufficient body of evidence to screen men for osteoporosis given its lower prevalence.1 However, it is important to note that men have significantly increased mortality after a hip fracture, are less likely to be on pharmacological treatment for osteoporosis, and are under diagnosed for osteoporosis.3 Consistent with findings from the current study, Leslie et al showed that high-trauma and low-trauma fractures have similarly elevated subsequent fracture risk in both men and women over the age of 40 in a Canadian study.4 Moreover, in the same study, BMD was decreased in both men and women who suffered a fracture regardless of the injury mechanism. This finding further underscores a need to consider traumatic fractures as a risk factor for osteoporosis. Taken together, given that men are under screened and treated for osteoporosis but have increased mortality post-fracture, considerations to initiate osteoporosis evaluation should be similarly given to men who endured a traumatic fracture.
The study conducted by Crandall et al has several strengths. It is noteworthy for the large size of the WHI cohort with participants from across the United States which enables the capture of a wider range of age groups as women under the age of 65 are not common participants of osteoporosis studies. Additionally, data ascertainment and outcome adjudication utilizing medical records and physician review assure data quality. A limitation of the study is that the study cohort consists exclusively of women and therefore the findings are not generalizable to men. However, findings from this study echo those from other studies that investigate the relationship between fracture mechanisms and subsequent fracture risk in men and women.3,4 Collectively, these comparable findings highlight the need for additional research to validate traumatic fracture as a risk factor for osteoporosis and to incorporate it into clinical guidelines for osteoporosis screening.
Applications for Clinical Practice
The findings from the current study indicate that traumatic and fragility fractures may be more alike than previously recognized in regards to bone health and subsequent fracture prevention in postmenopausal women. If validated, these results may lead to changes in clinical practice whereby all fractures in postmenopausal women could trigger osteoporosis screening, assessment, and treatment if indicated for the secondary prevention of fractures.
1. US Preventive Services Task Force, Curry SJ, Krist Ah, et al. Screening for Osteoporosis to Prevent Fractures: US Preventive Services Task Force Recommendation Statement. JAMA. 2018;319(24):2521–2531. doi:10.1001/jama.2018.7498
2. Crandall CJ, Larson JC, LaCroix AZ, et al. Risk of Subsequent Fractures in Postmenopausal Women After Nontraumatic vs Traumatic Fractures. JAMA Intern Med. Published online June 7, 2021. doi:10.1001/jamainternmed.2021.2617
3. Mackey DC, Lui L, Cawthon PM, et al. High-Trauma Fractures and Low Bone Mineral Density in Older Women and Men. JAMA. 2007;298(20):2381–2388. doi:10.1001/jama.298.20.2381
4. Leslie WD, Schousboe JT, Morin SN, et al. Fracture risk following high-trauma versus low-trauma fracture: a registry-based cohort study. Osteoporos Int. 2020;31(6):1059–1067. doi:10.1007/s00198-019-05274-2
Nivolumab Plus Cabozantinib Improves Outcomes Compared With Sunitinib for Advanced Renal Cell Carcinoma
Study Overview
Objective. To evaluate the efficacy and safety of the combination of nivolumab plus cabozantinib as compared with sunitinib monotherapy in the treatment of previously untreated advanced renal cell carcinoma (RCC).
Design. Multicenter, international, open-label, randomized, phase 3 trial.
Intervention. Patients were randomized in a 1:1 fashion to 1 of 2 treatment arms:
- Arm A: Nivolumab intravenously 240 mg every 2 weeks plus cabozantinib orally 40 mg once daily.
- Arm B: Sunitinib orally 50 mg daily for 4 weeks, followed by 2 weeks off therapy (6-week cycle).
Randomization was stratified by the International Metastatic RCC Database Consortium prognostic risk score (low-, intermediate-, and high-risk). Treatment was continued until disease progression or development of unacceptable toxic side effects with a maximum of 2-year duration of Nivolumab therapy.
Settings and participants. Adults with previously untreated advanced RCC with a clear cell component were eligible for enrollment. Subjects were excluded if they had active central nervous system metastases or active autoimmune disease.
Main outcome measures. The primary outcome of this study was progression-free survival (PFS) as assessed by an independent review committee. Secondary endpoints included overall survival, objective response rate, safety, and PFS as assessed by investigators. All subgroup analyses were prespecified. Efficacy was assessed in the intention-to-treat population, including all patients who underwent randomization.
Main results. A total of 651 patients underwent randomization: 323 to the nivolumab plus cabozantinib group, and 328 to the sunitinib group. Baseline demographics were balanced. The median follow-up period for overall survival (OS) was 18.1 months. The primary reason for treatment discontinuation in any group was disease progression. PFS as indicated by an independent review committee was significantly longer in the nivolumab plus cabozantinib group compared to the sunitinib group (median 16.6 months vs 8.2 months; hazard ratio [HR] 0.51, P < .001). The median OS was not reached for any group. Overall survival was longer in the nivolumab plus cabozantinib group compared to the sunitinib group (HR 0.60, 95% CI: 0.40-0.89; P = .001). The objective response rate was 55.7% with the nivolumab plus cabozantinib group versus 27.1% with sunitinib (P < .001). The complete response rate was 8% in the nivolumab plus cabozantinib group compared to 4.6% in the sunitinib group. The median time to response was 2.8 months with nivolumab plus cabozantinib and 4.2 months in the sunitinib group, while the median duration of response was 20.2 months and 11.5 months, respectively.
Nearly all patients (about 99% in each group) had an adverse event (AE). Hypertension was the most common side effect, with grade 3 or higher seen in 12.5% in the nivolumab plus cabzantinib group and 13.1% in the sunitinib group. Other grade 3 or higher side effects occurring in at least 10% of patients in any group were hyponatremia, diarrhea, palmar-plantar erythrodysesthesia, hypothyroidism, and fatigue. AEs of any cause leading to discontinuation of the therapy occurred in 19.7% in the nivolumab plus cabzantinib group vs 16.9% of the sunitinib group. One death was considered to be treatment-related (small intestinal perforation) in the nivolumab plus cabozantinib group vs 2 treatment-related deaths with sunitinib (pneumonia and respiratory distress). In the nivolumab plus cabozantinib group, 57% of the patients had a dose reduction of cabozantinib and 52% had a reduction in sunitinib dosage.
Using the Functional Assessment of Cancer Therapy-Kidney Symptoms Index, patients in the nivolumab plus cabozantinib group reported better health-related quality of life and less disease-related symptoms compared to the sunitinib group.
Commentary
The treatment landscape for frontline therapy for patients with advanced RCC has rapidly expanded over the last several years and has revolutionized cancer care. Ushered in by the results from the CheckMate 214 study highlighting the efficacy of dual checkpoint inhibition with nivolumab and ipilimumab in intermediate and poor risk patients, several subsequent trials have demonstrated improved outcomes with combination therapy with immune checkpoint inhibitors and tyrosine-kinase inhibitors (TKI). To date, data from Keynote-426 (pembrolizumab plus axitinib vs sunitinib), Javelin Renal 101 (avelumab plus axitinib vs sunitinib) and the CLEAR trial (lenvatinib plus pembrolizumab vs levatinib plus everolimus vs sunitinib) have demonstrated superiority of immune checkpoint inhibitor/TKI combinations over sunitinb in the first-line setting.1-5
The current phase 3, CheckMate 9ER trial adds yet another dynamic option for patients with advanced clear cell RCC. While cross-trial comparisons are fraught with important caveats, the median PFS of almost 16.6 months and complete response rate of 8% the nivolumab plus cabozantinib group compares favorably with other combinations. Data from the CLEAR study with the combination of lenvatinib and pembrolizumab showed a complete response rate approaching 16%. Importantly, the current study highlights improved quality of life with the combination of cabozantinib and nivolumab compared to sunitinib alone adding to the efficacy and benefits of this combination treatment.
The selection of first line therapy for patients with advanced RCC should be always guided by individual patient characteristics, and any single immune checkpoint inhibitor/TKI combination is not “superior” to any other. Perhaps more importantly is developing an understanding of the overlapping toxicity profiles of checkpoint inhibitors and TKIs. Again, this trial results are consistent with prior studies in terms of the adverse event profile which were not trivial, and almost all patients (99%) experienced AEs. It is important for oncologists to understand the management of the toxicities with these combinations and dose reductions as appropriate. It is worth noting that 19% of patients with nivolumab plus cabozantinib received glucocorticoids for management of immune-related AEs.
While long-term follow-up data will be needed to further understand the durability of response to this combination, nivolumab-cabozantinib represents an exciting new option for patients with advanced clear cell RCC. As we continue to see improvement in outcomes in clear cell histology, further work must focus on optimization of therapy in non-clear cell RCC as this is a population that is not represented in these data sets. Furthermore, future efforts should begin to explore triplet combinations and biomarker driven patient selection for upfront therapy in ordercontinue to improve outcomes in patients with advanced RCC.
Applications for Clinical Practice
The combination of nivolumab plus cabozantinib adds to the growing list of highly active checkpoint inhibitor/TKI combinations for first-line treatment of advanced RCC. With significant higher response rates, improved outcomes, and improvement in the quality of life, this combination will add another standard treatment option for patients with previously untreated advanced RCC.
1. Motzer RJ, Tannir NM, McDermott DF, et al. Nivolumab plus Ipilimumab Versus Sunitinib in Advanced Renal-Cell Carcinoma. N Engl J Med. 2018;378(14)1277-1290. doi:10.1056/NEJMoa1712126
2. Rini BI, Plimack ER, Stus V, et al. Pembrolizumab plus Axitinib versus Sunitinib for Advanced Renal-Cell Carcinoma. N Engl J Med. 2019;380(12):1116-1127. doi:10.1056/NEJMoa1816714
3. Powles T, Plimack ER, Soulières D, et al. Pembrolizumab plus axitinib versus sunitinib monotherapy as first-line treatment of advanced renal cell carcinoma (KEYNOTE-426): extended follow-up from a randomised, open-label, phase 3 trial. Lancet Oncol. 2020;21(12):1563-1573. doi:10.1016/S1470-2045(20)30436-8
4. Choueiri TK, Motzer RJ, Rini BI, et al. Updated efficacy results from the JAVELIN Renal 101 trial: first-line avelumab plus axitinib versus sunitinib in patients with advanced renal cell carcinoma. Ann Oncol. 2020;31:1030-1039. doi:10.1016/j.annonc.2020.04.010
5, Motzer R, Alekseev B, Rha SY, et al. CLEAR Trial Investigators. Lenvatinib plus Pembrolizumab or Everolimus for Advanced Renal Cell Carcinoma. N Engl J Med. 2021;384(14):1289-1300. doi:10.1056/NEJMoa2035716
Study Overview
Objective. To evaluate the efficacy and safety of the combination of nivolumab plus cabozantinib as compared with sunitinib monotherapy in the treatment of previously untreated advanced renal cell carcinoma (RCC).
Design. Multicenter, international, open-label, randomized, phase 3 trial.
Intervention. Patients were randomized in a 1:1 fashion to 1 of 2 treatment arms:
- Arm A: Nivolumab intravenously 240 mg every 2 weeks plus cabozantinib orally 40 mg once daily.
- Arm B: Sunitinib orally 50 mg daily for 4 weeks, followed by 2 weeks off therapy (6-week cycle).
Randomization was stratified by the International Metastatic RCC Database Consortium prognostic risk score (low-, intermediate-, and high-risk). Treatment was continued until disease progression or development of unacceptable toxic side effects with a maximum of 2-year duration of Nivolumab therapy.
Settings and participants. Adults with previously untreated advanced RCC with a clear cell component were eligible for enrollment. Subjects were excluded if they had active central nervous system metastases or active autoimmune disease.
Main outcome measures. The primary outcome of this study was progression-free survival (PFS) as assessed by an independent review committee. Secondary endpoints included overall survival, objective response rate, safety, and PFS as assessed by investigators. All subgroup analyses were prespecified. Efficacy was assessed in the intention-to-treat population, including all patients who underwent randomization.
Main results. A total of 651 patients underwent randomization: 323 to the nivolumab plus cabozantinib group, and 328 to the sunitinib group. Baseline demographics were balanced. The median follow-up period for overall survival (OS) was 18.1 months. The primary reason for treatment discontinuation in any group was disease progression. PFS as indicated by an independent review committee was significantly longer in the nivolumab plus cabozantinib group compared to the sunitinib group (median 16.6 months vs 8.2 months; hazard ratio [HR] 0.51, P < .001). The median OS was not reached for any group. Overall survival was longer in the nivolumab plus cabozantinib group compared to the sunitinib group (HR 0.60, 95% CI: 0.40-0.89; P = .001). The objective response rate was 55.7% with the nivolumab plus cabozantinib group versus 27.1% with sunitinib (P < .001). The complete response rate was 8% in the nivolumab plus cabozantinib group compared to 4.6% in the sunitinib group. The median time to response was 2.8 months with nivolumab plus cabozantinib and 4.2 months in the sunitinib group, while the median duration of response was 20.2 months and 11.5 months, respectively.
Nearly all patients (about 99% in each group) had an adverse event (AE). Hypertension was the most common side effect, with grade 3 or higher seen in 12.5% in the nivolumab plus cabzantinib group and 13.1% in the sunitinib group. Other grade 3 or higher side effects occurring in at least 10% of patients in any group were hyponatremia, diarrhea, palmar-plantar erythrodysesthesia, hypothyroidism, and fatigue. AEs of any cause leading to discontinuation of the therapy occurred in 19.7% in the nivolumab plus cabzantinib group vs 16.9% of the sunitinib group. One death was considered to be treatment-related (small intestinal perforation) in the nivolumab plus cabozantinib group vs 2 treatment-related deaths with sunitinib (pneumonia and respiratory distress). In the nivolumab plus cabozantinib group, 57% of the patients had a dose reduction of cabozantinib and 52% had a reduction in sunitinib dosage.
Using the Functional Assessment of Cancer Therapy-Kidney Symptoms Index, patients in the nivolumab plus cabozantinib group reported better health-related quality of life and less disease-related symptoms compared to the sunitinib group.
Commentary
The treatment landscape for frontline therapy for patients with advanced RCC has rapidly expanded over the last several years and has revolutionized cancer care. Ushered in by the results from the CheckMate 214 study highlighting the efficacy of dual checkpoint inhibition with nivolumab and ipilimumab in intermediate and poor risk patients, several subsequent trials have demonstrated improved outcomes with combination therapy with immune checkpoint inhibitors and tyrosine-kinase inhibitors (TKI). To date, data from Keynote-426 (pembrolizumab plus axitinib vs sunitinib), Javelin Renal 101 (avelumab plus axitinib vs sunitinib) and the CLEAR trial (lenvatinib plus pembrolizumab vs levatinib plus everolimus vs sunitinib) have demonstrated superiority of immune checkpoint inhibitor/TKI combinations over sunitinb in the first-line setting.1-5
The current phase 3, CheckMate 9ER trial adds yet another dynamic option for patients with advanced clear cell RCC. While cross-trial comparisons are fraught with important caveats, the median PFS of almost 16.6 months and complete response rate of 8% the nivolumab plus cabozantinib group compares favorably with other combinations. Data from the CLEAR study with the combination of lenvatinib and pembrolizumab showed a complete response rate approaching 16%. Importantly, the current study highlights improved quality of life with the combination of cabozantinib and nivolumab compared to sunitinib alone adding to the efficacy and benefits of this combination treatment.
The selection of first line therapy for patients with advanced RCC should be always guided by individual patient characteristics, and any single immune checkpoint inhibitor/TKI combination is not “superior” to any other. Perhaps more importantly is developing an understanding of the overlapping toxicity profiles of checkpoint inhibitors and TKIs. Again, this trial results are consistent with prior studies in terms of the adverse event profile which were not trivial, and almost all patients (99%) experienced AEs. It is important for oncologists to understand the management of the toxicities with these combinations and dose reductions as appropriate. It is worth noting that 19% of patients with nivolumab plus cabozantinib received glucocorticoids for management of immune-related AEs.
While long-term follow-up data will be needed to further understand the durability of response to this combination, nivolumab-cabozantinib represents an exciting new option for patients with advanced clear cell RCC. As we continue to see improvement in outcomes in clear cell histology, further work must focus on optimization of therapy in non-clear cell RCC as this is a population that is not represented in these data sets. Furthermore, future efforts should begin to explore triplet combinations and biomarker driven patient selection for upfront therapy in ordercontinue to improve outcomes in patients with advanced RCC.
Applications for Clinical Practice
The combination of nivolumab plus cabozantinib adds to the growing list of highly active checkpoint inhibitor/TKI combinations for first-line treatment of advanced RCC. With significant higher response rates, improved outcomes, and improvement in the quality of life, this combination will add another standard treatment option for patients with previously untreated advanced RCC.
1. Motzer RJ, Tannir NM, McDermott DF, et al. Nivolumab plus Ipilimumab Versus Sunitinib in Advanced Renal-Cell Carcinoma. N Engl J Med. 2018;378(14)1277-1290. doi:10.1056/NEJMoa1712126
2. Rini BI, Plimack ER, Stus V, et al. Pembrolizumab plus Axitinib versus Sunitinib for Advanced Renal-Cell Carcinoma. N Engl J Med. 2019;380(12):1116-1127. doi:10.1056/NEJMoa1816714
3. Powles T, Plimack ER, Soulières D, et al. Pembrolizumab plus axitinib versus sunitinib monotherapy as first-line treatment of advanced renal cell carcinoma (KEYNOTE-426): extended follow-up from a randomised, open-label, phase 3 trial. Lancet Oncol. 2020;21(12):1563-1573. doi:10.1016/S1470-2045(20)30436-8
4. Choueiri TK, Motzer RJ, Rini BI, et al. Updated efficacy results from the JAVELIN Renal 101 trial: first-line avelumab plus axitinib versus sunitinib in patients with advanced renal cell carcinoma. Ann Oncol. 2020;31:1030-1039. doi:10.1016/j.annonc.2020.04.010
5, Motzer R, Alekseev B, Rha SY, et al. CLEAR Trial Investigators. Lenvatinib plus Pembrolizumab or Everolimus for Advanced Renal Cell Carcinoma. N Engl J Med. 2021;384(14):1289-1300. doi:10.1056/NEJMoa2035716
I Never Wanted To Be a Hero
I have been in the business of medicine for more than 15 years and I will never forget the initial surge of the COVID-19 pandemic in Massachusetts.
As a hospitalist, I admitted patients infected with COVID-19, followed them on the floor, and, since I had some experience working in an intensive care unit (ICU), was assigned to cover a “COVID ICU.” This wing of the hospital used to be a fancy orthopedic floor that our institution was lucky enough to have. So began the most life-changing experience in my career as a physician.
In this role, we witness death more than any of us would care to discuss. It comes with the territory, and we never expected this to change once COVID hit. However, so many patients succumbed to this disease, especially during the first surge, which made it difficult to handle emotionally. Patients that fell ill initially stayed isolated at home, optimistic they would turn the corner only to enter the hospital a week later after their conditioned worsened. After requiring a couple of liters of supplemental oxygen in the emergency room, they eventually ended up on a high flow nasal cannula in just a matter of hours.
Patients slowly got sicker and felt more helpless as the days passed, leading us to prescribe drugs that eventually proved to have no benefit. We checked countless inflammatory markers, most of which we were not even sure what to do with. Many times, we hosted a family meeting via FaceTime, holding a patient’s hand in one hand and an iPad in the other to discuss goals of care. Too often, a dark cloud hung over these discussions, a realization that there was not much else we could do.
I have always felt that helping someone have a decent and peaceful death is important, especially when the prognosis is grim, and that patient is suffering. But the sheer number of times this happened during the initial surge of the pandemic was difficult to handle. It felt like I had more of those discussions in 3 months than I did during my entire career as a hospitalist.
We helped plenty of people get better, with some heading home in a week. They thanked us, painted rocks and the sidewalks in front of the hospital displaying messages of gratitude, and sent lunches. Others, though, left the hospital 2 months later with a tube in their stomach so they could receive some form of nutrition and another in their neck to help them breathe.
These struggles were by no means special to me; other hospitalists around the world faced similar situations at one point or another during the pandemic. Working overtime, coming home late, exhausted, undressing in the garage, trying to be there for my 3 kids who were full of energy after a whole day of Zoom and doing the usual kid stuff. My house used to have strict rules about screen time. No more.
The summer months provided a bit of a COVID break, with only 1 or 2 infected patients entering my care. We went to outdoor restaurants and tried to get our lives back to “normal.” As the weather turned cold, however, things went south again. This time no more hydroxychloroquine, a drug used to fight malaria but also treat other autoimmune diseases, as it was proven eventually over many studies that it is not helpful and was potentially harmful. We instead shifted our focus to remdesivir—an antiviral drug that displayed some benefits—tocilizumab, and dexamethasone, anti-inflammatory drugs with the latter providing some positive outcomes on mortality.
Patient survival rates improved slightly, likely due to a combination of factors. We were more experienced at fighting the disease, which led to things in the hospital not being as chaotic and more time available to spend with the patients. Personal protective equipment (PPE) and tests were more readily available, and the population getting hit by the disease changed slightly with fewer elderly people from nursing homes falling ill because of social distancing, other safety measures, or having already fought the disease. Our attention turned instead to more young people that had returned to work and their social lives.
The arrival of the vaccines brought considerable relief. I remember a few decades ago debating and sometimes fighting with friends and family over who was better: Iron Man or Spider-Man. Now I found myself having the same conversation about the Pfizer and Moderna COVID vaccines.
Summer 2021 holds significantly more promise. Most of the adult population is getting vaccinated, and I am very hopeful that we are approaching the end of this nightmare. In June, our office received word that we could remove our masks if we were fully vaccinated. It felt weird, but represented another sign that things are improving. I took my kids to the mall and removed my mask. It felt odd considering how that little blue thing became part of me during the pandemic. It also felt strange to not prescribe a single dose of remdesivir for an entire month.
It feels good—and normal—to care for the patients that we neglected for a year. It has been a needed boost to see patients return to their health care providers for their colonoscopy screenings, mammograms, and managing chronic problems like coronary artery disease, congestive heart failure, or receiving chemotherapy.
I learned plenty from this pandemic and hope I am not alone. I learned to be humble. We started with a drug that was harmful, moved on to a drug that is probably neutral and eventually were able to come up with a drug that seems to decrease mortality at least in some COVID patients. I learned it is fine to try new therapies based on the best data in the hope they result in positive clinical outcomes. However, it is critical that we all keep an eye on the rapidly evolving literature and adjust our behavior accordingly.
I also learned, or relearned, that if people are desperate enough, they will drink bleach to see if it works. Others are convinced that the purpose of vaccination is to inject a microchip allowing ourselves to be tracked by some higher power. I learned that we must take the first step to prepare for the next pandemic by having a decent reserve of PPE.
It is clear synthetic messenger RNA (mRNA) technology is here to stay, and I believe it has a huge potential to change many areas of medicine. mRNA vaccines proved to be much faster to develop and probably much easier to change as the pathogen, in this case coronavirus, changes.
The technology could be used against a variety of infectious diseases to make vaccines against malaria, tuberculosis, HIV, or hepatitis. It can also be very useful for faster vaccine development needed in future possible pandemics such as influenza, Ebola, or severe acute respiratory syndrome. It may also be used for cancer treatment.
As John P. Cooke, MD, PhD, the medical director for the Center of RNA Therapeutics Program at the Houston Methodist Research Institute, said, “Most vaccines today are still viral vaccines – they are inactivated virus, so it’s potentially infectious and you have to have virus on hand. With mRNA, you’re just writing code which is going to tell the cell to make a viral protein – one part of a viral protein to stimulate an immune response. And, here’s the wonderful thing, you don’t even need the virus in hand, just its DNA code.”1
Corresponding author: Dragos Vesbianu, MD, Attending Hospitalist, Newton-Wellesley Hospital, 2014 Washington St, Newton, MA 02462; [email protected].
Financial dislosures: None.
1. Houston Methodist. Messenger RNA – the Therapy of the Future. Newswise. November 16, 2020. Accessed June 25, 2021. https://www.newswise.com/coronavirus/messenger-rna-the-therapy-of-the-future/
I have been in the business of medicine for more than 15 years and I will never forget the initial surge of the COVID-19 pandemic in Massachusetts.
As a hospitalist, I admitted patients infected with COVID-19, followed them on the floor, and, since I had some experience working in an intensive care unit (ICU), was assigned to cover a “COVID ICU.” This wing of the hospital used to be a fancy orthopedic floor that our institution was lucky enough to have. So began the most life-changing experience in my career as a physician.
In this role, we witness death more than any of us would care to discuss. It comes with the territory, and we never expected this to change once COVID hit. However, so many patients succumbed to this disease, especially during the first surge, which made it difficult to handle emotionally. Patients that fell ill initially stayed isolated at home, optimistic they would turn the corner only to enter the hospital a week later after their conditioned worsened. After requiring a couple of liters of supplemental oxygen in the emergency room, they eventually ended up on a high flow nasal cannula in just a matter of hours.
Patients slowly got sicker and felt more helpless as the days passed, leading us to prescribe drugs that eventually proved to have no benefit. We checked countless inflammatory markers, most of which we were not even sure what to do with. Many times, we hosted a family meeting via FaceTime, holding a patient’s hand in one hand and an iPad in the other to discuss goals of care. Too often, a dark cloud hung over these discussions, a realization that there was not much else we could do.
I have always felt that helping someone have a decent and peaceful death is important, especially when the prognosis is grim, and that patient is suffering. But the sheer number of times this happened during the initial surge of the pandemic was difficult to handle. It felt like I had more of those discussions in 3 months than I did during my entire career as a hospitalist.
We helped plenty of people get better, with some heading home in a week. They thanked us, painted rocks and the sidewalks in front of the hospital displaying messages of gratitude, and sent lunches. Others, though, left the hospital 2 months later with a tube in their stomach so they could receive some form of nutrition and another in their neck to help them breathe.
These struggles were by no means special to me; other hospitalists around the world faced similar situations at one point or another during the pandemic. Working overtime, coming home late, exhausted, undressing in the garage, trying to be there for my 3 kids who were full of energy after a whole day of Zoom and doing the usual kid stuff. My house used to have strict rules about screen time. No more.
The summer months provided a bit of a COVID break, with only 1 or 2 infected patients entering my care. We went to outdoor restaurants and tried to get our lives back to “normal.” As the weather turned cold, however, things went south again. This time no more hydroxychloroquine, a drug used to fight malaria but also treat other autoimmune diseases, as it was proven eventually over many studies that it is not helpful and was potentially harmful. We instead shifted our focus to remdesivir—an antiviral drug that displayed some benefits—tocilizumab, and dexamethasone, anti-inflammatory drugs with the latter providing some positive outcomes on mortality.
Patient survival rates improved slightly, likely due to a combination of factors. We were more experienced at fighting the disease, which led to things in the hospital not being as chaotic and more time available to spend with the patients. Personal protective equipment (PPE) and tests were more readily available, and the population getting hit by the disease changed slightly with fewer elderly people from nursing homes falling ill because of social distancing, other safety measures, or having already fought the disease. Our attention turned instead to more young people that had returned to work and their social lives.
The arrival of the vaccines brought considerable relief. I remember a few decades ago debating and sometimes fighting with friends and family over who was better: Iron Man or Spider-Man. Now I found myself having the same conversation about the Pfizer and Moderna COVID vaccines.
Summer 2021 holds significantly more promise. Most of the adult population is getting vaccinated, and I am very hopeful that we are approaching the end of this nightmare. In June, our office received word that we could remove our masks if we were fully vaccinated. It felt weird, but represented another sign that things are improving. I took my kids to the mall and removed my mask. It felt odd considering how that little blue thing became part of me during the pandemic. It also felt strange to not prescribe a single dose of remdesivir for an entire month.
It feels good—and normal—to care for the patients that we neglected for a year. It has been a needed boost to see patients return to their health care providers for their colonoscopy screenings, mammograms, and managing chronic problems like coronary artery disease, congestive heart failure, or receiving chemotherapy.
I learned plenty from this pandemic and hope I am not alone. I learned to be humble. We started with a drug that was harmful, moved on to a drug that is probably neutral and eventually were able to come up with a drug that seems to decrease mortality at least in some COVID patients. I learned it is fine to try new therapies based on the best data in the hope they result in positive clinical outcomes. However, it is critical that we all keep an eye on the rapidly evolving literature and adjust our behavior accordingly.
I also learned, or relearned, that if people are desperate enough, they will drink bleach to see if it works. Others are convinced that the purpose of vaccination is to inject a microchip allowing ourselves to be tracked by some higher power. I learned that we must take the first step to prepare for the next pandemic by having a decent reserve of PPE.
It is clear synthetic messenger RNA (mRNA) technology is here to stay, and I believe it has a huge potential to change many areas of medicine. mRNA vaccines proved to be much faster to develop and probably much easier to change as the pathogen, in this case coronavirus, changes.
The technology could be used against a variety of infectious diseases to make vaccines against malaria, tuberculosis, HIV, or hepatitis. It can also be very useful for faster vaccine development needed in future possible pandemics such as influenza, Ebola, or severe acute respiratory syndrome. It may also be used for cancer treatment.
As John P. Cooke, MD, PhD, the medical director for the Center of RNA Therapeutics Program at the Houston Methodist Research Institute, said, “Most vaccines today are still viral vaccines – they are inactivated virus, so it’s potentially infectious and you have to have virus on hand. With mRNA, you’re just writing code which is going to tell the cell to make a viral protein – one part of a viral protein to stimulate an immune response. And, here’s the wonderful thing, you don’t even need the virus in hand, just its DNA code.”1
Corresponding author: Dragos Vesbianu, MD, Attending Hospitalist, Newton-Wellesley Hospital, 2014 Washington St, Newton, MA 02462; [email protected].
Financial dislosures: None.
1. Houston Methodist. Messenger RNA – the Therapy of the Future. Newswise. November 16, 2020. Accessed June 25, 2021. https://www.newswise.com/coronavirus/messenger-rna-the-therapy-of-the-future/
1. Houston Methodist. Messenger RNA – the Therapy of the Future. Newswise. November 16, 2020. Accessed June 25, 2021. https://www.newswise.com/coronavirus/messenger-rna-the-therapy-of-the-future/
Impact of Diagnostic Testing on Pediatric Patients With Pharyngitis: Evidence From a Large Health Plan
From the Department of Pharmaceutical and Health Economics, University of Southern California, Los Angeles, CA, (Drs. Sangha and McCombs), Department of Pediatrics, Keck School of Medicine, and Department of Clinical Pharmacy, School of Pharmacy, University of Southern California, Los Angeles, CA, (Dr. Steinberg), and Leonard Schaeffer Center for Health Policy and Economics, University of Southern California, Los Angeles, CA (Dr. McCombs).
Objective: The recommended treatment for children and adolescents under 18 years of age who have a positive test for group A Streptococcus (GAS) are antibiotics using the “test and treat” strategy to detect and treat GAS for pediatric pharyngitis. This study used paid claims data to document the extent to which real-world treatment patterns are consistent with these recommendations. We document the factors correlated with testing and treatment, then examine the effects of receiving a GAS test and being treated with an antibiotic impact the likelihood of a revisit for an acute respiratory tract infection within 28 days.
Methods: This retrospective cohort study used Optum Insight Clinformatics data for medical and pharmacy claims from 2011-2013 to identify episodes of care for children and adolescents with pharyngitis around their index visit (± 6 months). The sample population included children and adolescents under 18 years of age with a diagnosis of pharyngitis. Multivariable logistic regression analyses were used to document factors associated with receipt of GAS test and antibiotic treatment. Next, we used logistic regression models to estimate the impact of test and treat recommendation on revisit risk.
Results: There were 24 685 treatment episodes for children and adolescents diagnosed with pharyngitis. Nearly 47% of these episodes included a GAS test and 48% of tested patients were prescribed an antibiotic prescription. Failing to perform a GAS test increased the risk of a revisit within 28 days by 44%. The use of antibiotics by tested and untested patients had no impact on revisit risk.
Conclusion: While the judicious use of antibiotics is important in managing pharyngitis infections and managing complications, the use of rapid diagnostic tools was found to be the determining factor in reducing revisits for pediatric patients with pharyngitis.
Keywords: pediatrics; pharyngitis; respiratory infections; acute infections; diagnostic tests; group A Streptococcus; antibiotics; revisits.
Acute pharyngitis is a common acute respiratory tract infection (ARTI) in children. Group A β-hemolytic streptococci (GABHS) is the most common bacterial etiology for pediatric pharyngitis, accounting for 15% to 30% of cases.1
Beyond clinical assessment, laboratory diagnostic testing generally plays a limited role in guiding appropriate antibiotic prescribing for patients with an ARTI.2,3 Most diagnostic tests require 2 or 3 days to result, incur additional costs, and may delay treatment.4 While these tests do not provide clear and timely guidance on which specific antibiotic is appropriate for ARTI patients, this is not the case for patients with pharyngitis.5,6,7 A rapid diagnostic test exists to identify pharyngitis patients with GABHS which accounts for 1 in 4 children with acute sore throat.1,4,6 Both the American Academy of Pediatrics and the Infectious Diseases Society of America recommend antibiotic treatment for children and adolescents under 18 years of age who have a positive test for group A Streptococcus (GAS).8,9 This “test and treat” protocol has been consistently included in the Healthcare Effectiveness Data and Information Set (HEDIS) standards over time for pediatric pharyngitis patients aged 3 to 18 years before dispensing an antibiotic.10
Sinusitis, pneumonia, and acute otitis media are considered ARTIs where antibiotic treatment is justified. Therefore, pharyngitis of unclear etiology seen with these comorbid infections may not always undergo GAS testing but move directly to the patient being prescribed antibiotics. This analysis enumerates ARTI-related comorbidities present together with the initial coded pharyngitis diagnosis to evaluate their impact on the provider’s decision to test and treat, and on revisit risk.
Antibiotic treatment for GAS patients is likely to eradicate the acute GABHS infection within 10 days. Penicillin and amoxicillin are commonly recommended because of their narrow spectrum of activity, few adverse effects, established efficacy, and modest cost. Alternative antibiotics for patients with penicillin allergy, or with polymicrobial infection seen on culture results, include a first-generation cephalosporin, clindamycin, clarithromycin (Biaxin), or azithromycin (Zithromax).1,8,11 However, while compliance with these HEDIS guidelines has been evaluated, the outcome effects of following the HEDIS “test and treat” recommendations for children with pharyngitis have not been adequately evaluated.
These outcome evaluations have increasing importance as the latest HEDIS survey has shown testing rates in commercial Preferred Provider Organizations (PPO) falling from 86.4% in 2018 to 75.9% in 2019, the lowest rate of testing since 2009, with similar reductions under 80% for Health Maintenance Organizations (HMO).10 While health plans may execute cost-benefit analyses and algorithms to forge best practices for GAS testing in children and adolescents presenting with symptoms of pharyngitis, it is important to regard the wasteful resource utilization and additional cost of revisits that may offset any gains accrued by more focused GAS testing outside the existing clinical guidelines and HEDIS measures. This may be of particular importance in documenting infection and sparing antibiotic therapy in toddlers and younger.
The objective of this study was to investigate the correlation between testing and antibiotic use on the likelihood of a revisit for an acute respiratory tract infection within 28 days. To achieve this objective, this investigation consists of 3 sequential analyses. First, we document the factors associated with the decision to test the patient for a GABHS infection using the GAS test. Next, we document the factors associated with the decision to use an antibiotic to treat the patient as a function of having tested the patient. Finally, we investigate the impact of the testing and treatment decisions on the likelihood of a revisit within 28 days.
Methods
Study design
This was a retrospective cohort study of episodes of treatment for pediatric patients with pharyngitis. Episodes were identified using data derived from the Optum Insight Clinformatics claims database provided to the University of Southern California to facilitate the training of graduate students. These data cover commercially insured patients with both medical and pharmacy benefits. Data were retrieved from the 3-year period spanning 2011-2013. An episode of care was identified based on date of the first (index) outpatient visit for a pharyngitis diagnosis (International Classification of Diseases, Ninth Revision [ICD-9]: 462, 463, 034.0). Outpatient visits were defined by visit setting: ambulatory clinics, physician offices, emergency rooms, and urgent care facilities. Each pharyngitis treatment episode was then screened for at least a 6-month enrollment in a health insurance plan prior and subsequent to the index visit using Optum enrollment data. Finally, eligible treatment episodes were restricted to children and adolescents under 18 years of age, who had an index outpatient visit for a primary diagnosis of acute pharyngitis.
A diagnostic profile was created for each episode using the diagnoses recorded for the index visit. Up to 3 diagnoses may be recorded for any outpatient visit and the first recorded diagnosis was assumed to be the primary diagnosis for that episode. Any secondary diagnoses recorded on the index visit were used to define comorbidities present at the index visit. ARTI-related comorbidities included: acute otitis media (AOM), bronchitis, sinusitis, pneumonia, and upper respiratory infection (URI). Other comorbid medical diagnoses were documented using diagnostic data from the pre-index period. Dichotomous variables for the following categories were created: mental disorders, nervous system disorders, respiratory symptoms, fever, injury and poisoning, other, or no diseases.
Prior visits for other respiratory infections in the previous 90 days were also identified for patients based on their index visit for pharyngitis. Similarly, any subsequent visits, within 28 days of the index visit, were also recorded to measure the health outcome for analysis. Practice settings include physician offices and federally qualified health centers, state and local health clinics, outpatient hospitals facilities, emergency departments, and other outpatient settings such as walk-in retail health clinic or ambulatory centers. Providers include primary care physicians (family practice, pediatricians, internal medicine), specialty care physicians (emergency medicine, preventive medicine), nonphysician providers (nurse practitioners, physician assistants) and other providers (urgent care, acute outpatient care, ambulatory care centers). Seasons of the year were determined based on the index date of the episode to account for possible seasonality in pharyngitis treatment. Lastly, a previous visits variable was created to identify whether the child had nonpharyngitis ARTI visits in the 3 months prior to the index visit.
Demographic variables were created based on enrollment and the socioeconomic data available in the Optum socioeconomic status file. These variables include patient age, race, sex, household income, geographic location, practice setting type, provider specialty, and type of insurance. An estimate of patient household income was based on algorithms using census block groups. Income categories were informed by the federal guidelines for a family of 4. A low-income family was defined as earning less than $50 000; a middle-income family earned between $50 000 and $75 000, and a high-income family earned $75 000 and above.12 Patient insurance type was categorized as HMO, Exclusive Provider Organization (EPO), Point of Service (POS), and PPO. Race was identified as White, Black, Hispanic, and Asian. Patient location was defined according to national census regions.
Outcomes
GAS test
The HEDIS measures for pharyngitis recommend using the GAS test to identify the bacterial etiology of the pharyngitis infection. Patients who received the test were identified based on Current Procedural Terminology (CPT) codes 87070-71, 87081, 87430, 87650-52, and 87880.10
Antibiotic treatment
The pharmacy administrative claims dataset was used to identify study patients who filled a prescription for an antibiotic during their pharyngitis treatment episode. Optum pharmacy data identify the medications received, specifies the date of prescription filling, National Drug Codes, and American Hospital Formulary Service (AHFS) Classification System codes for each medication. We used the AHFS Pharmacologic-Therapeutic classification of antibiotics to create dichotomous variables documenting the antibacterial used by each patient.13 These are categorized under antibacterial including penicillins, cephalosporins (first, second, third, fourth generation cephalosporins), macrolides (first generation and others), tetracyclines, sulfonamides, fluoroquinolones (ciprofloxacin, levofloxacin, moxifloxacin), cephamycin, carbapenems, and β-lactam antibiotics (amoxicillin, amoxicillin/clavulanate, cephalexin, cefuroxime, cefdinir).
Revisits to physician or other provider
Revisits within 28 days were used as the measure of patient outcomes related to testing and filling of an antibiotic prescription for acute pharyngitis. Revisits may also be due to a patient returning for a follow-up, alternative treatment, worsening pharyngitis, or for another ARTI. An ARTI-related revisit also increases total resources used to treat pediatric pharyngitis patients.
Statistical analysis
Logistic regression was used for all 3 analyses conducted in this study. First, we determined the patient and treating physician characteristics that impact the decision to use GAS testing for pharyngitis. Second, we identified those factors that impact the decision to use antibiotic prescriptions among children who were diagnosed with pharyngitis adding in the dichotomous variable indicating if the patient had received a GAS test. Third, we used a logit regression analysis to document if receiving a GAS test and/or an antibiotic impacted the likelihood of a revisit by comparing revisit risk. To estimate the effect of testing and/or antibiotic use, we divided patients into 4 groups based on whether the patient received a GAS test and/or an antibiotic prescription. This specification of the analysis of revisits as an outcome focuses on adherence to HEDIS “test and treat” guidelines10:
- Patients who were not tested yet filled an antibiotic prescription. This decision was likely based on the clinician’s judgment of the patient’s signs and symptoms, and confirmational testing not performed.
- Patients who were not tested and did not fill an antibiotic prescription. Apparently, in the clinician’s judgment the patient’s signs and symptoms were such that the infection did not warrant treatment and the clinical presentation did not necessitate the GAS test to confirm the recorded diagnosis of pharyngitis.
- Patients who were tested and received antibiotic prescription, likely because the test was positive for GABHS.
- Patients who were tested and did not receive antibiotic prescription.
We tested for statistically significant differences in baseline characteristics across these 4 patient groups using t tests for continuous variables and χ2 tests for categorical variables. Odds ratios (OR) and CI were computed for the influential variables included the regression analyses.
We conducted a sensitivity analysis using a model specification which included the dichotomous variables for testing and for treatment, and the interaction term between these variables to assess if treatment effects varied in tested and untested patients. We also estimated this model of revisit risk using revisits within 7 days as the outcome variable.
All analyses were completed using STATA/IC 13 (StataCorp, College Station, TX).
Results
There were 24 685 treatment episodes for children diagnosed with pharyngitis. Nearly 47% of these episodes included GAS testing and 47% of the tested patients filled an antibiotic prescription. Similarly, 53% of patients were not tested and 49% of untested patients filled an antibiotic prescription. As a result, the 4 groups identified for analysis were evenly distributed: untested and no prescription (26.9%), untested and prescription (26.3%), tested and prescription (21.9%), and tested and no prescription (24.9%) (Figure).
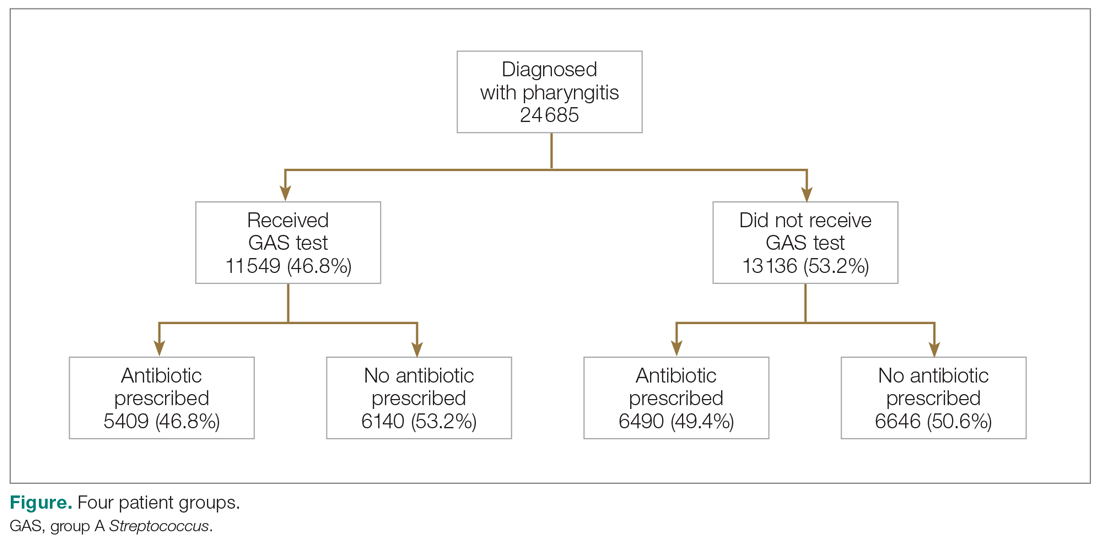
Table 1 presents the descriptive statistics for these 4 patient groups. Note first that the rate of revisits within 28 days is under 5% across all groups. Second, the 2 tested groups have a lower revisit rate than the untested groups: the tested and treated have a revisit rate of 3.3%, and the tested and untreated have a revisit rate of 2.4%, while both the untested groups have a revisit rate of nearly 5%. These small absolute differences in revisit rates across groups were statistically significant.
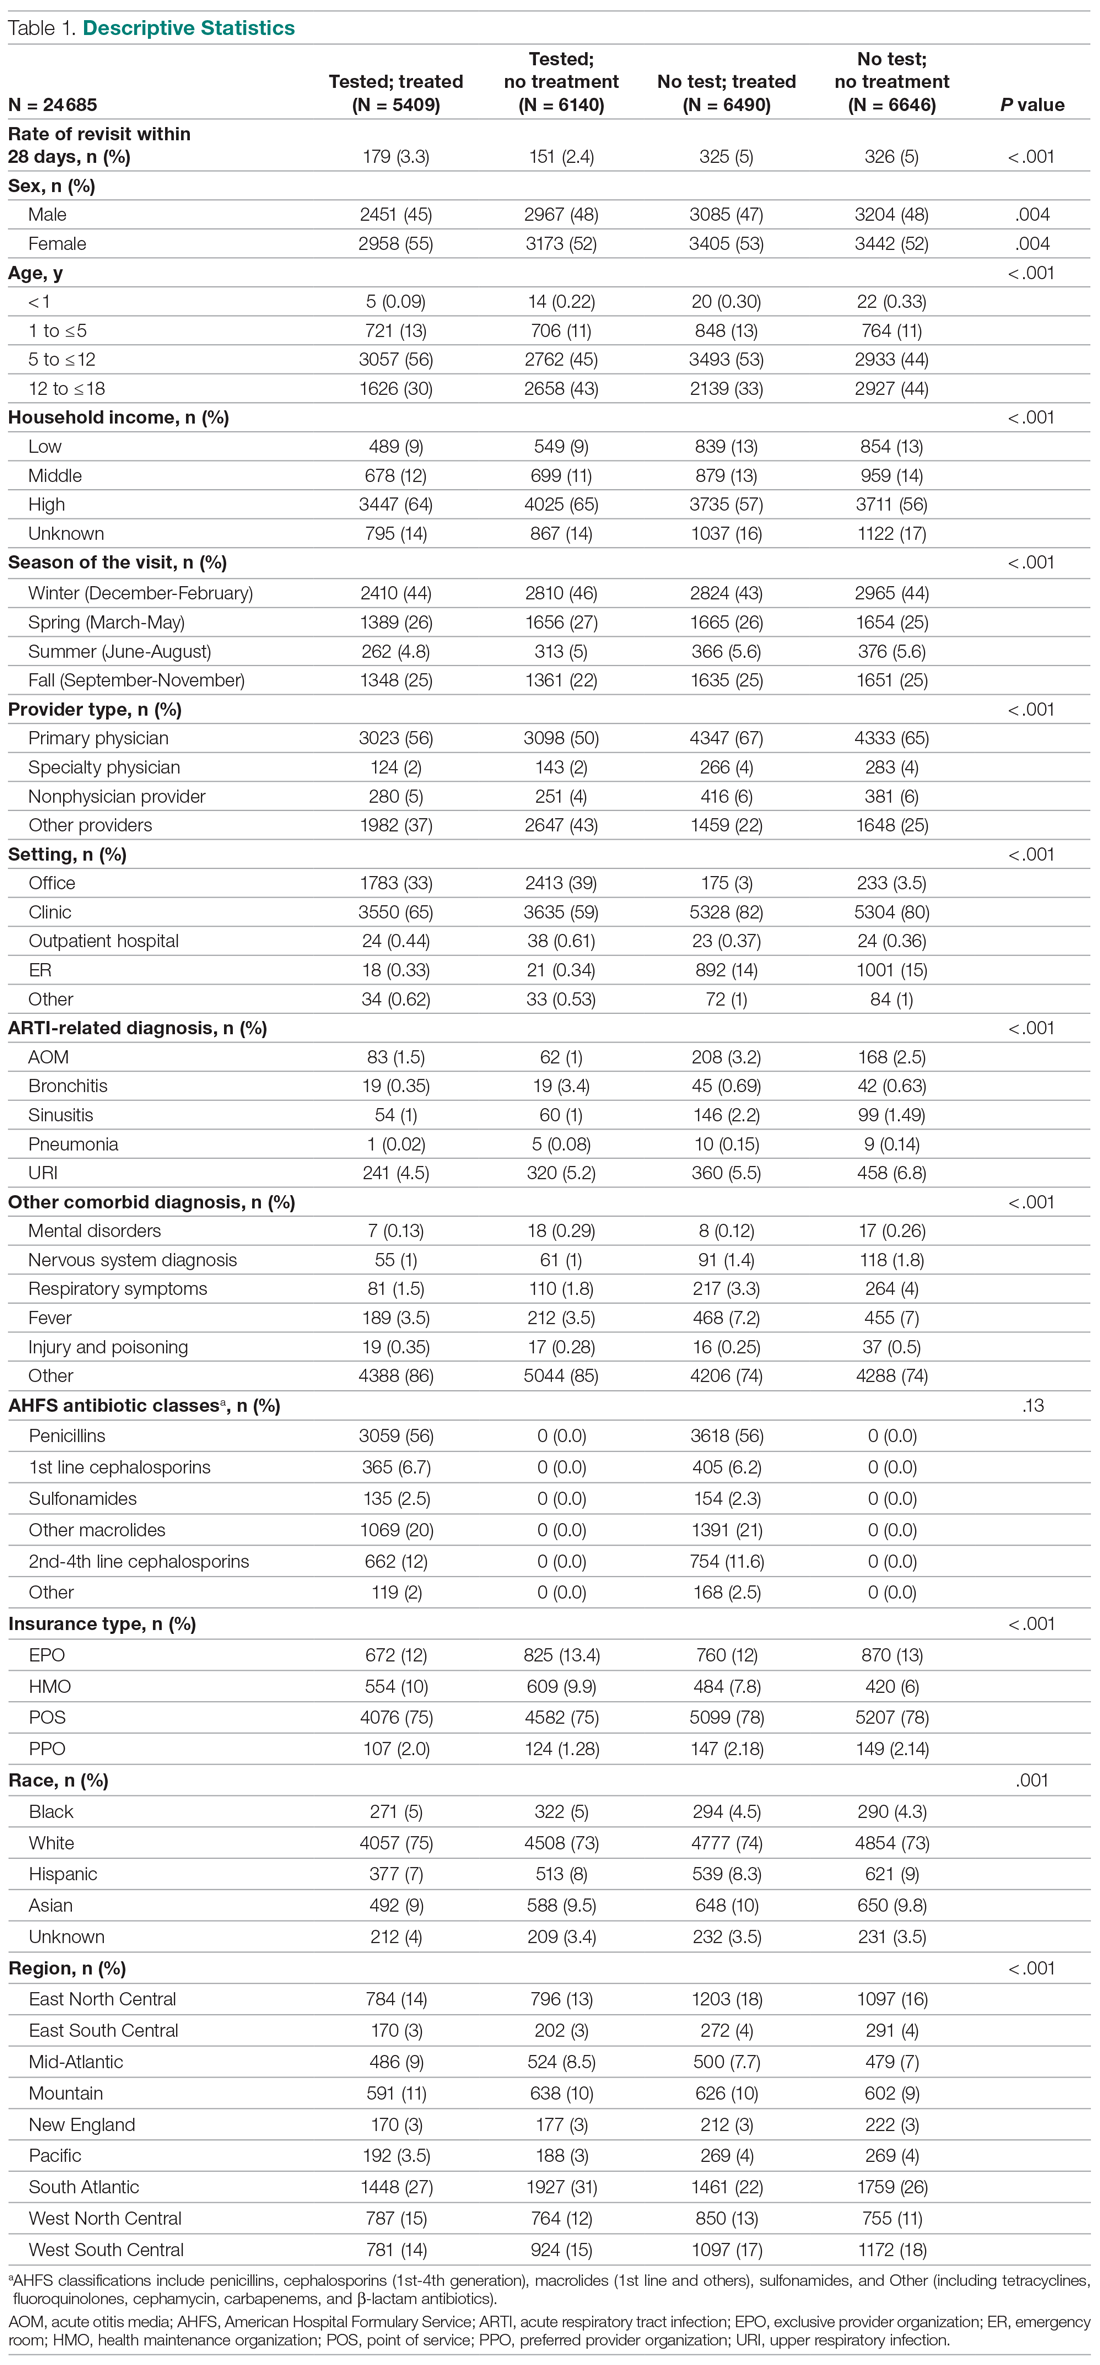
Factors associated with receiving GAS test
Several factors were found to impact the decision to test (Table 2). Only 9.7% of children were reported to have any ARTI coinfection. As expected, these comorbidities resulted in a significantly lower likelihood of receiving the GAS test: AOM, bronchitis, sinusitis, pneumonia, and URI as comorbid infections had a 48%, 41%, 37%, 63%, and 13% lower likelihood of receiving the GAS test, respectively, than those with no comorbidities. Similarly, children with fever and respiratory symptoms were 35% and 45% less likely to receiving the GAS test, respectively. This is consistent with our expectation that comorbid ARTI infections will lead many providers to forgo testing.
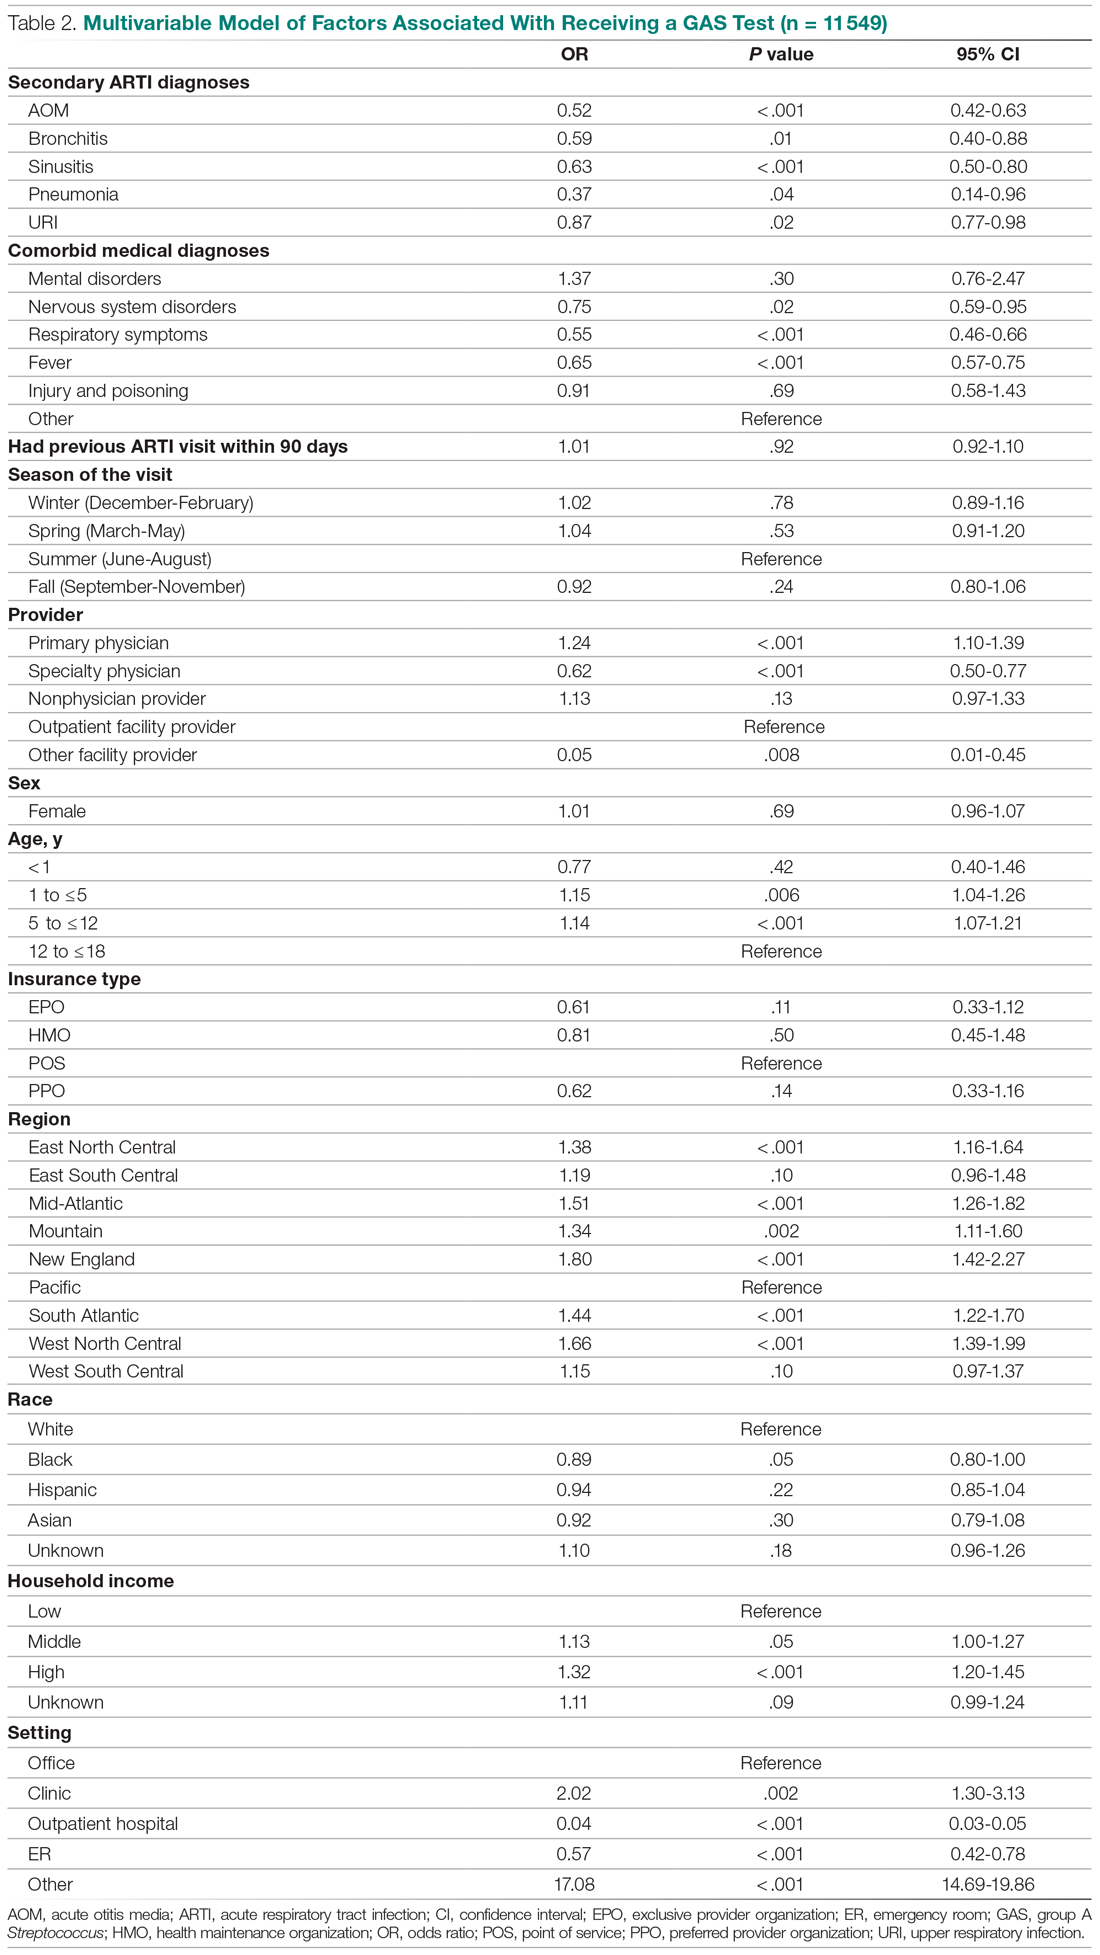
Provider type and patient age also plays a role in receipt of the GAS test. Relative to outpatient facility providers, primary care physicians were 24% more likely and specialty physicians were 38% less likely of employing the GAS test. The child’s age played a significant role in receipt of the GAS test. Children aged 1 to 5 years and 5 to 12 years were 15% and 14% more likely to receive the test compared to children older than 12 years.
Pharyngitis patients have disproportionately higher odds of receiving a GAS test in most regions of the country compared to the Pacific region. For instance, children in the Mid-Atlantic region have 51% higher odds of receiving a GAS test while children in New England have 80% higher odds of receiving the same test.
Black children have 11% lower odds of receiving the GAS test compared to White children. Both middle-income and high-income children have 12% and 32% higher odds of receiving the test compared to low-income children. Compared to office-based visits, children visiting a clinic were twice as likely to receive a GAS test while those seen in the emergency room have 43% lower odds of receiving a GAS test. Hospital outpatient departments, which account for less than 1% of all visits, rarely used a GAS test which could be a statistical artifact due to small sample size. Lastly, insurance and season of the year had no significant impact of receipt of a GAS test.
Factors associated with receiving antibiotic prescription
Surprisingly, receiving the GAS test has a small but insignificant impact on the likelihood that the patient will receive an antibiotic prescription (Table 3) (Adjusted OR = 1.055, P = .07). After controlling for receipt of a GAS test, children with AOM and sinusitis comorbidities have an increased likelihood of being prescribed an antibiotic. Children with URI have a lower likelihood of being prescribed an antibiotic. Additionally, relative to primary care physicians, children visiting nonphysician providers for pharyngitis were more likely to be prescribed an antibiotic.
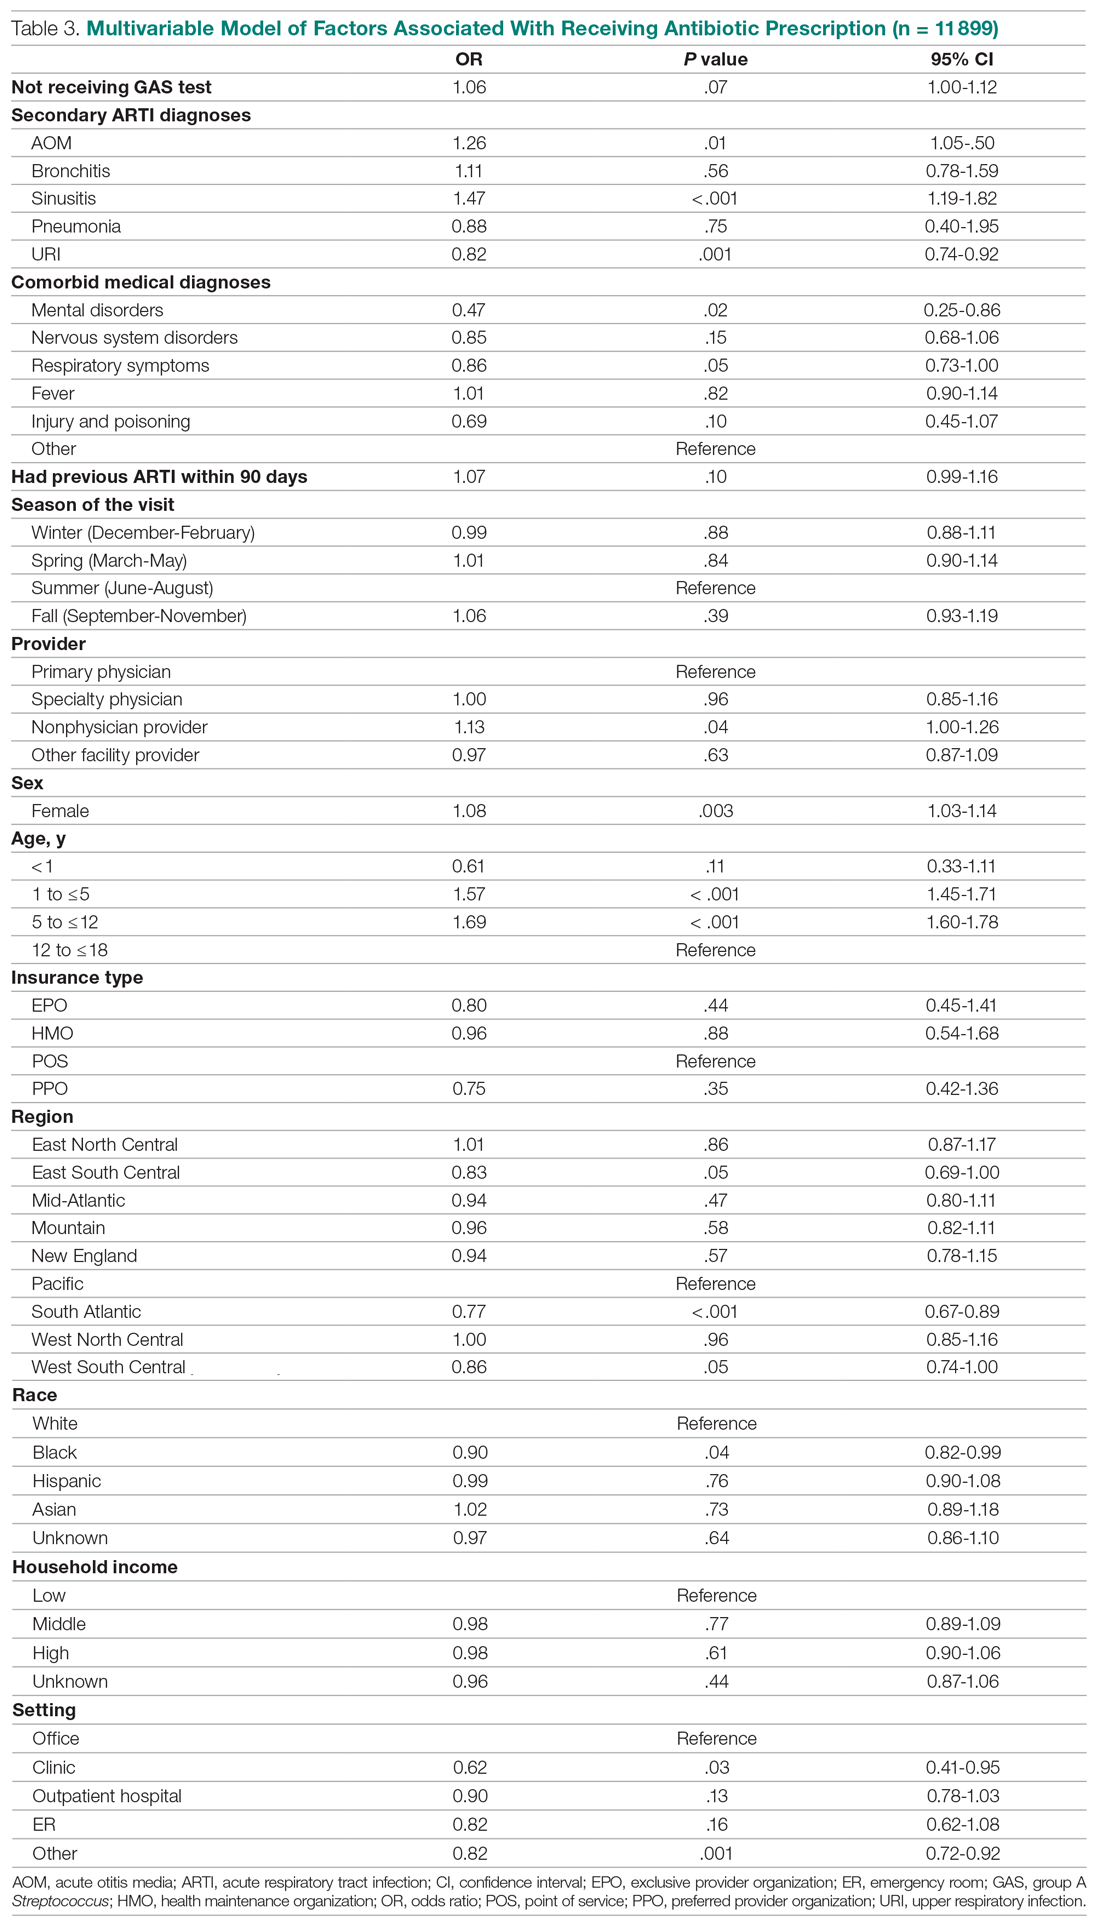
Children under 12 years of age were more likely to use an antibiotic compared to children 12 years and older. Geographically, there is some evidence of regional variation in antibiotic use as well. Children in the south Atlantic, west-south central, and southeast central regions had a significantly lower odds of being prescribed an antibiotic respectively than pharyngitis patients in the Pacific region. Black children had a 10% lower likelihood of being prescribed an antibiotic compared to White children, possibly related to their lower rate of GAS testing. Compared to office-based visits, children visiting a clinic were less likely to use an antibiotic. Household income, insurance type, and season had no significant impact on revisit risk.
Effects of GAS test and antibiotic prescriptions on likelihood of revisits
The multivariate analysis of the risk of a revisit within 28 days is presented in Table 4. Children with pharyngitis who tested and did not receive an antibiotic serve as the reference comparison group for this analysis to illustrate the impact of using the GAS test and treatment with an antibiotic. The results in Table 4 are quite clear: patients who receive the GAS test were significantly less likely to have a revisit within 28 days. Moreover, within the group of patients who were tested, those not receiving an antibiotic, presumedly because their GAS test was negative, experienced the lowest risk of a revisit. This result is consistent with the data in Table 1. Moreover, using an antibiotic had no impact on the likelihood of a revisit in patients not receiving the GAS test. This result is also consistent with Table 1.
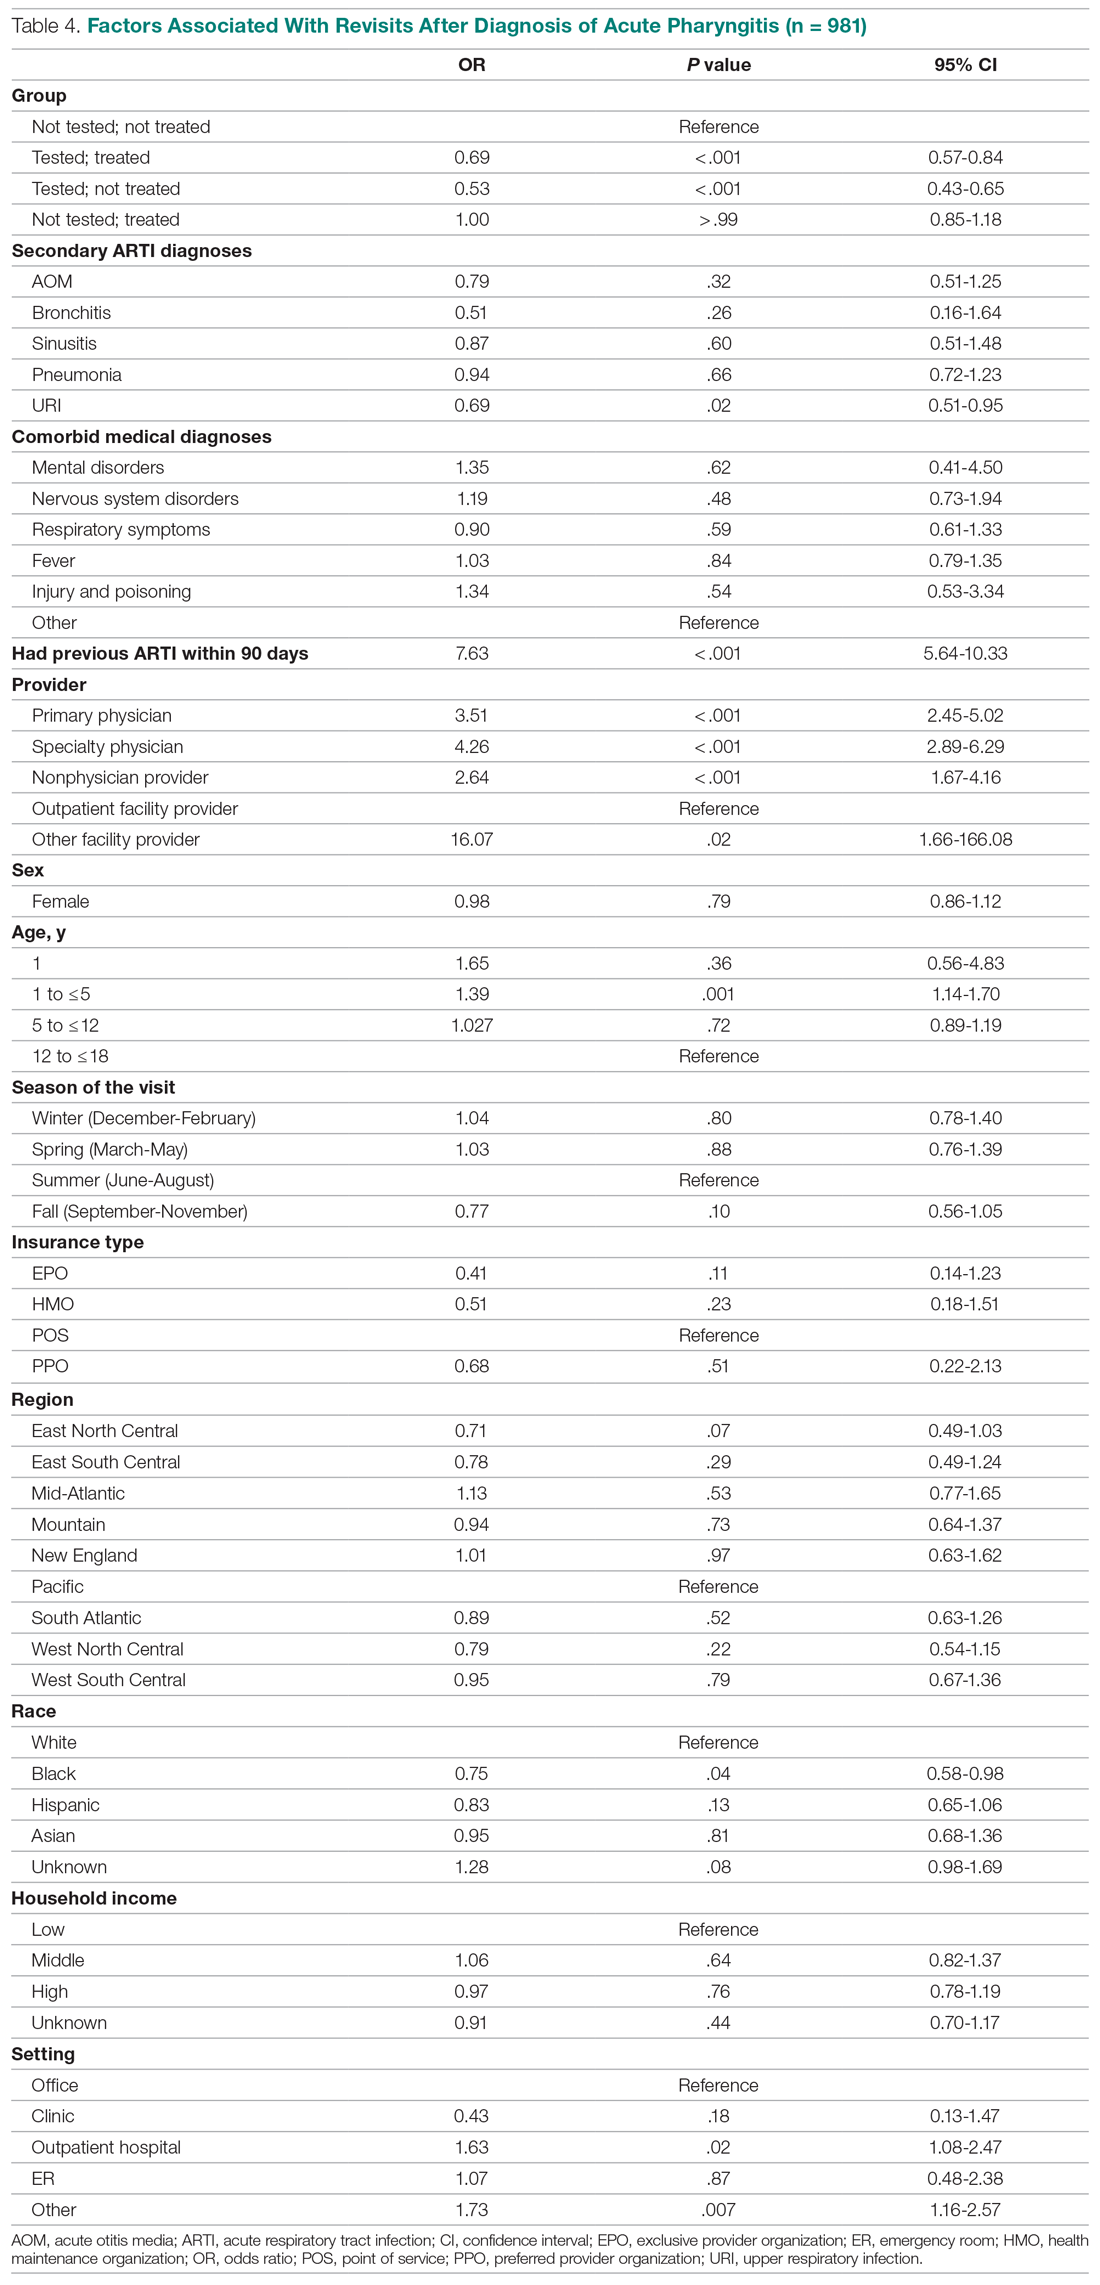
Other results from the analysis of revisit risk may be of interest to clinicians. Pharyngitis patients with a prior episode of treatment within 90 days for an acute respiratory tract infection were more than 7 times more likely to experience a revisit within 28 days of the pharyngitis diagnosis than patients without a history of recent ARTI infections. Age is also a risk factor in likelihood of initiating a revisit. Children under 1 year and children aged 1 to 5 years were more likely to have a revisit than children aged more than 12 years. Compared to White children, Black children were 25% (P = .04) less likely to have a revisit. The care setting also has a significant impact on revisit risk. Children visiting outpatient hospital and other care settings had a significantly higher revisit risk than those visiting a physician’s office. Lastly, household income, geographic region, season, medical comorbidities, gender, and insurance type have no significant impact on revisit risk.
Sensitivity analysis
The results from the analysis of 7-day and 28-day revisit risk are summarized in Table 5. These results indicate that patients who were tested had a more significant decrease in revisit risk at 7 days (72%) than was evident at 28 days (47% reduction). Receiving an antibiotic, with or without the test, had no impact on revisit risk.
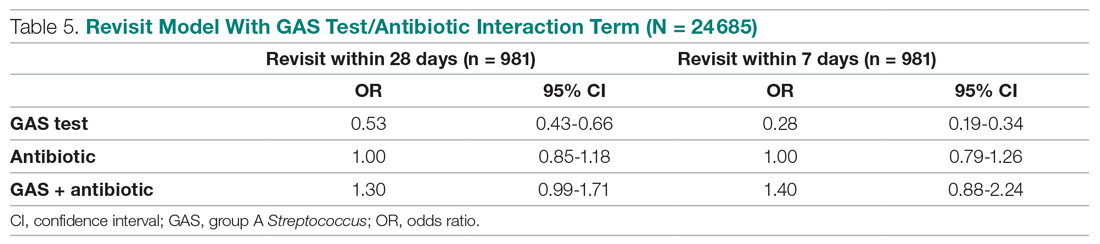
Discussion
Published data on revisits for pharyngitis are lacking with the concentration of prior research focused more on systemic complications of undertreated GABHS disease or on identifying carrier status. Our study results suggest that GAS testing is the most important factor in reducing revisit risk. Being prescribed an antibiotic, on its own, does not have a significant impact on the risk of a revisit. However, once the GAS test is used, the decision not to use an antibiotic was correlated with the lowest revisit rate, likely because the source of the pharyngitis infection was viral and more likely to resolve without a revisit. Prior studies have reported variable rates of testing among children with pharyngitis prescribed an antibiotic, ranging from 23% to 91%,14,15 with testing important toward more appropriate antibiotic use.16 More recently, among more than 67 000 patients aged 3 to 21 years presenting with sore throat and receiving a GAS test, 32.6% were positive.17
Our analysis found that more than 46% of pediatric pharyngitis patients were given the rapid GAS test. While this testing rate is substantially lower than HEDIS recommendations and lower than testing rates achieved by several health maintenance organizations,10 it is similar to the 53% of children receiving such testing in a recent National Ambulatory Medical Care Survey.18 Furthermore, we found that when antibiotics are prescribed following a GAS test, the revisit risk is not significantly reduced, possibly because antibiotics lower revisit risk when informed by diagnostic testing tools that determine the infectious organism. This is supported by a similar population analysis in which we observed reduced revisit rates in children with AOM managed with antibiotics within 3 days of index diagnosis.19
Several other factors also affect the likelihood of a child receiving the GAS test. Children aged 1 to 12 years were significantly more likely to receive the GAS test than children over the age of 12. This included children in the 1 to 5 years old bracket who had a 15% higher likelihood of undergoing a GAS test, despite children less than 3 years of age as not recommended targets for GAS testing.20 As expected, children with reported ARTI-associated comorbidities were also less likely to receive a GAS test. Additionally, specialty care physicians were less inclined to implement the GAS test, possibly because of diagnostic confidence without testing or referral after GAS was ruled out. Black and low-income children had statistically lower odds of receiving the test, even after controlling for other factors, and yet were less likely to consume a revisit. As the overall data suggested more revisits in those not tested, further study is needed to examine if race or income discrepancies are equity based. Finally, children in the Pacific region, compared to the rest of the nation, were the least likely to receive a GAS test and yet there were no significant differences in revisit rates by region. Regional differences in antibiotic use were also observed in our study, as has been seen by others.21
After statistically controlling for having received the diagnostic GAS test and filled a prescription for an antibiotic, there are multitude of factors that independently affect the revisit risk, the most important of which if which was a history of an ARTI infection in the prior 90 days. While prior visit history had no impact on the likelihood of being tested or filling an antibiotic, patients with prior visits were more than 7 times more likely to consume a revisit. This was not reflected in nor related to comorbid ARTIs as these patients did not have statistically higher revisits than those with pharyngitis as the sole-coded diagnosis. Moreover, speculation for bacterial etiology of primary or superinfection based on a recent history of ARTI accounting for revisits seems unlikely as it did not yield greater antibiotic use in that group. Further analysis is required to determine the clinical and behavioral factors that promote for prior ARTI history as a major factor in revisit risk after an index visit for pharyngitis.
Children aged between 1 and 5 years, though 15% more likely to be tested than those aged 12 through 17 years, were also 39% more likely to initiate a revisit compared to older children when statistically controlling for other covariates. This perhaps suggests longer illness, wrong diagnosis, delay in appropriate treatment, or more caution by parents and providers in this age group. Justification for testing children less than 3 years of age who are outside of the HEDIS suggested age group, when clinical judgement does not point to another infection source, can result in positivity rates between 22% and 30% as previously observed.22,23 Patients visiting nonphysician providers and outpatient facility providers were less likely to have a revisit than those visiting primary and specialty care physicians, though slightly higher propensity for antibiotic prescriptions was seen for nonphysician providers. Pediatricians have been noted to be less likely to prescribe antibiotics without GAS testing than nonpediatric providers, and more guidelines-compliant in prescribing.24
Recommendations to not test children under 3 years of age are based on the lack of acute rheumatic fever and other complications in this age group together with more frequent viral syndromes. Selectivity in applying clinical criteria to testing can be attempted to separate bacterial from viral illness. Postnasal drainage/rhinorrhea, hoarse voice, and cough have been used successfully to identify those with viral illness and less need for testing, with greater certainty of low risk for GABHS in those over 11 years of age without tonsillar exudates, cervical adenopathy, or fever.17 However, the marginal benefits of those who have all 3 features of viral illness versus none in identifying GAS positivity was 23.3% vs 37.6% - helpful, but certainly not diminishing the need for testing. These constitutional findings of viral URI also do not exclude the GAS carrier state that features these symptoms.25 Others have reinforced the doubt of pharyngeal exudates as the premier diagnostic finding for test-positive GAS.26
This study had several limitations. The Optum claims dataset only contains ICD-9 codes for diagnoses. It does not include data on infection severity and clinical findings related to symptoms, thus empiric treatment warranted based in clinical severity is not assessed. Antibiotics are commonly available as generics and very inexpensive. Patients may fill and pay for these prescriptions directly, in which case, a claim for payment may not be filed with Optum. This could result in an undercount of treated patients in our study.
There is no corresponding problem of missing medical claims for GAS testing which were obtained from the CPT codes within the Optum claims data set. However, we elected not to verify the test results due to these data being missing for 75% of the study population. Nevertheless, this study’s focus was less about justifying antibiotic treatment, but dealt with the outcomes generated by testing and treatment. Toward that end, we used CPT codes to identify a revisit, and while those can at times be affected by financial reimbursement incentives, differences related to revisits in the 4 patient groups should not be subject to bias.
Conclusion
This study used data from real world practices to document the patterns of GAS testing and antibiotic use in pediatric pharyngitis patients. Revisit rates were under 5% for all patient groups and the use of rapid diagnostic tools were found to be the determining factor in further reducing the risk of revisits. This supports the need for compliance with the HEDIS quality metric for pharyngitis to the recommended levels of rapid testing which have been falling in recent years. Use of more accurate antigen and newer molecular detection testing methods may help further delineate important factors in determining pediatric pharyngitis treatment and need for revisits.27
Corresponding author: Jeffrey McCombs, MD, University of Southern California School of Pharmacy, Department of Pharmaceutical and Health Economics, Leonard D. Schaeffer Center for Health Policy & Economics, 635 Downey Way, Verna & Peter Dauterive Hall 310, Los Angeles, CA 90089-3333; [email protected].
Financial disclosures: None.
1. Choby BA. Diagnosis and treatment of streptococcal pharyngitis. Am Fam Physician. 2009;79(5):383-390.
2. Briel M, Schuetz P, Mueller B, et al. Procalcitonin-guided antibiotic use vs a standard approach for acute respiratory tract infections in primary care. Arch of Intern Med. 2008;168(18):2000-2008. doi: 10.1001/archinte.168.18.2000
3. Maltezou HC, Tsagris V, Antoniadou A, et al. Evaluation of a rapid antigen detection test in the diagnosis of streptococcal pharyngitis in children and its impact on antibiotic prescription. J Antimicrob Chemother. 2008;62(6):1407-1412. doi: 10.1093/jac/dkn376
4. Neuner JM, Hamel MB, Phillips RS, et al. Diagnosis and management of adults with pharyngitis: a cost-effectiveness analysis. Ann Intern Med. 2003;139(2):113-122. doi:10.7326/0003-4819-139-2-200307150-00011
5. Gerber MA, Baltimore RS, Eaton CB, et al. Prevention of rheumatic fever and diagnosis and treatment of acute Streptococcal pharyngitis: a scientific statement from the American Heart Association Rheumatic Fever, Endocarditis, and Kawasaki Disease Committee of the Council on Cardiovascular Disease in the Young, the Interdisciplinary Council on Functional Genomics and Translational Biology, and the Interdisciplinary Council on Quality of Care and Outcomes Research: endorsed by the American Academy of Pediatrics. Circulation. 2009;119(11):1541-1551. doi: 10.1161/CIRCULATIONAHA.109.191959
6. Gieseker KE, Roe MH, MacKenzie T, Todd JK. Evaluating the American Academy of Pediatrics diagnostic standard for Streptococcus pyogenes pharyngitis: backup culture versus repeat rapid antigen testing. Pediatrics. 2003;111(6):e666-e670. doi: 10.1542/peds.111.6.e666
7. Shapiro DJ, Lindgren CE, Neuman MI, Fine AM. Viral features and testing for Streptococcal pharyngitis. Pediatrics. 2017;139(5):e20163403. doi: 10.1542/peds.2016-3403
8. Shulman ST, Bisno AL, Clegg H, et al. Clinical practice guideline for the diagnosis and management of group A Streptococcal pharyngitis: 2012 update by the Infectious Diseases Society of America. Clin Infect Dis. 2012;55(10):e86–e102. doi: 10.1093/cid/cis629
9. Mangione-Smith R, McGlynn EA, Elliott MN, et al. Parent expectations for antibiotics, physician-parent communication, and satisfaction. Arch Pediatr Adolesc Med. 2001;155(7):800–806. doi: 10.1001/archpedi.155.7.800
10. Appropriate Testing for Children with Pharyngitis. HEDIS Measures and Technical Resources. National Committee for Quality Assurance. Accessed February 12, 2021. https://www.ncqa.org/hedis/measures/appropriate-testing-for-children-with-pharyngitis/
11. Linder JA, Bates DW, Lee GM, Finkelstein JA. Antibiotic treatment of children with sore throat. JAMA. 2005;294(18):2315-2322. doi: 10.1001/jama.294.18.2315
12. Crimmel BL. Health Insurance Coverage and Income Levels for the US Noninstitutionalized Population Under Age 65, 2001. Medical Expenditure Panel Survey, Agency for Healthcare Research and Quality. 2004. https://meps.ahrq.gov/data_files/publications/st40/stat40.pd
13. AHFS/ASHP. American Hospital Formulary Service Drug Information. 2012. AHFS drug information. 00--. Accessed January 4, 2021.
14. Mainous AG 3rd, Zoorob, RJ, Kohrs FP, Hagen MD. Streptococcal diagnostic testing and antibiotics prescribed for pediatric tonsillopharyngitis. Pediatr Infect Dis J. 1996;15(9):806-810. doi: 10.1097/00006454-199609000-00014
15. Benin AL, Vitkauskas G, Thornquist E, et al. Improving diagnostic testing and reducing overuse of antibiotics for children with pharyngitis: a useful role for the electronic medical record. Pediatr Infect Dis J. 2003;22(12):1043-1047. doi: 10.1097/01.inf.0000100577.76542.af
16. Luo R, Sickler J, Vahidnia F, et al. Diagnosis and Management of Group a Streptococcal Pharyngitis in the United States, 2011-2015. BMC Infect Dis. 2019;19(1):193-201. doi: 10.1186/s12879-019-3835-4
17. Shapiro DJ, Barak-Corren Y, Neuman MI, et al. Identifying Patients at Lowest Risk for Streptococcal Pharyngitis: A National Validation Study. J Pediatr. 2020;220:132-138.e2. doi: 10.1016/j.jpeds.2020.01.030. Epub 2020 Feb 14
18. Shapiro DJ, King LM, Fleming-Dutra KE, et al. Association between use of diagnostic tests and antibiotic prescribing for pharyngitis in the United States. Infect Control Hosp Epidemiol. 2020;41(4):479-481. doi: 10.1017/ice.2020.29
19. Sangha K, Steinberg I, McCombs JS. The impact of antibiotic treatment time and class of antibiotic for acute otitis media infections on the risk of revisits. Abs PDG4. Value in Health. 2019; 22:S163.
20. Ahluwalia T, Jain S, Norton L, Meade J, et al. Reducing Streptococcal Testing in Patients < 3 Years Old in an Emergency Department. Pediatrics. 2019;144(4):e20190174. doi: 10.1542/peds.2019-0174
21. McKay R, Mah A, Law MR, et al. Systematic Review of Factors Associated with Antibiotic Prescribing for Respiratory Tract Infections. Antimicrob Agents Chemother. 2016;60(7):4106-4118. doi: 10.1128/AAC.00209-16
22. Woods WA, Carter CT, Schlager TA. Detection of group A streptococci in children under 3 years of age with pharyngitis. Pediatr Emerg Care. 1999;15(5):338-340. doi: 10.1097/00006565-199910000-00011
23. Mendes N, Miguéis C, Lindo J, et al. Retrospective study of group A Streptococcus oropharyngeal infection diagnosis using a rapid antigenic detection test in a paediatric population from the central region of Portugal. Eur J Clin Microbiol Infect Dis. 2021;40(6):1235-1243. doi: 10.1007/s10096-021-04157-x
24. Frost HM, McLean HQ, Chow BDW. Variability in Antibiotic Prescribing for Upper Respiratory Illnesses by Provider Specialty. J Pediatr. 2018;203:76-85.e8. doi: 10.1016/j.jpeds.2018.07.044.
25. Rick AM, Zaheer HA, Martin JM. Clinical Features of Group A Streptococcus in Children With Pharyngitis: Carriers versus Acute Infection. Pediatr Infect Dis J. 2020;39(6):483-488. doi: 10.1097/INF.0000000000002602
26. Nadeau NL, Fine AM, Kimia A. Improving the prediction of streptococcal pharyngitis; time to move past exudate alone [published online ahead of print, 2020 Aug 16]. Am J Emerg Med. 2020;S0735-6757(20)30709-9. doi: 10.1016/j.ajem.2020.08.023
27. Mustafa Z, Ghaffari M. Diagnostic Methods, Clinical Guidelines, and Antibiotic Treatment for Group A Streptococcal Pharyngitis: A Narrative Review. Front Cell Infect Microbiol. 2020;10:563627. doi: 10.3389/fcimb.2020.563627
From the Department of Pharmaceutical and Health Economics, University of Southern California, Los Angeles, CA, (Drs. Sangha and McCombs), Department of Pediatrics, Keck School of Medicine, and Department of Clinical Pharmacy, School of Pharmacy, University of Southern California, Los Angeles, CA, (Dr. Steinberg), and Leonard Schaeffer Center for Health Policy and Economics, University of Southern California, Los Angeles, CA (Dr. McCombs).
Objective: The recommended treatment for children and adolescents under 18 years of age who have a positive test for group A Streptococcus (GAS) are antibiotics using the “test and treat” strategy to detect and treat GAS for pediatric pharyngitis. This study used paid claims data to document the extent to which real-world treatment patterns are consistent with these recommendations. We document the factors correlated with testing and treatment, then examine the effects of receiving a GAS test and being treated with an antibiotic impact the likelihood of a revisit for an acute respiratory tract infection within 28 days.
Methods: This retrospective cohort study used Optum Insight Clinformatics data for medical and pharmacy claims from 2011-2013 to identify episodes of care for children and adolescents with pharyngitis around their index visit (± 6 months). The sample population included children and adolescents under 18 years of age with a diagnosis of pharyngitis. Multivariable logistic regression analyses were used to document factors associated with receipt of GAS test and antibiotic treatment. Next, we used logistic regression models to estimate the impact of test and treat recommendation on revisit risk.
Results: There were 24 685 treatment episodes for children and adolescents diagnosed with pharyngitis. Nearly 47% of these episodes included a GAS test and 48% of tested patients were prescribed an antibiotic prescription. Failing to perform a GAS test increased the risk of a revisit within 28 days by 44%. The use of antibiotics by tested and untested patients had no impact on revisit risk.
Conclusion: While the judicious use of antibiotics is important in managing pharyngitis infections and managing complications, the use of rapid diagnostic tools was found to be the determining factor in reducing revisits for pediatric patients with pharyngitis.
Keywords: pediatrics; pharyngitis; respiratory infections; acute infections; diagnostic tests; group A Streptococcus; antibiotics; revisits.
Acute pharyngitis is a common acute respiratory tract infection (ARTI) in children. Group A β-hemolytic streptococci (GABHS) is the most common bacterial etiology for pediatric pharyngitis, accounting for 15% to 30% of cases.1
Beyond clinical assessment, laboratory diagnostic testing generally plays a limited role in guiding appropriate antibiotic prescribing for patients with an ARTI.2,3 Most diagnostic tests require 2 or 3 days to result, incur additional costs, and may delay treatment.4 While these tests do not provide clear and timely guidance on which specific antibiotic is appropriate for ARTI patients, this is not the case for patients with pharyngitis.5,6,7 A rapid diagnostic test exists to identify pharyngitis patients with GABHS which accounts for 1 in 4 children with acute sore throat.1,4,6 Both the American Academy of Pediatrics and the Infectious Diseases Society of America recommend antibiotic treatment for children and adolescents under 18 years of age who have a positive test for group A Streptococcus (GAS).8,9 This “test and treat” protocol has been consistently included in the Healthcare Effectiveness Data and Information Set (HEDIS) standards over time for pediatric pharyngitis patients aged 3 to 18 years before dispensing an antibiotic.10
Sinusitis, pneumonia, and acute otitis media are considered ARTIs where antibiotic treatment is justified. Therefore, pharyngitis of unclear etiology seen with these comorbid infections may not always undergo GAS testing but move directly to the patient being prescribed antibiotics. This analysis enumerates ARTI-related comorbidities present together with the initial coded pharyngitis diagnosis to evaluate their impact on the provider’s decision to test and treat, and on revisit risk.
Antibiotic treatment for GAS patients is likely to eradicate the acute GABHS infection within 10 days. Penicillin and amoxicillin are commonly recommended because of their narrow spectrum of activity, few adverse effects, established efficacy, and modest cost. Alternative antibiotics for patients with penicillin allergy, or with polymicrobial infection seen on culture results, include a first-generation cephalosporin, clindamycin, clarithromycin (Biaxin), or azithromycin (Zithromax).1,8,11 However, while compliance with these HEDIS guidelines has been evaluated, the outcome effects of following the HEDIS “test and treat” recommendations for children with pharyngitis have not been adequately evaluated.
These outcome evaluations have increasing importance as the latest HEDIS survey has shown testing rates in commercial Preferred Provider Organizations (PPO) falling from 86.4% in 2018 to 75.9% in 2019, the lowest rate of testing since 2009, with similar reductions under 80% for Health Maintenance Organizations (HMO).10 While health plans may execute cost-benefit analyses and algorithms to forge best practices for GAS testing in children and adolescents presenting with symptoms of pharyngitis, it is important to regard the wasteful resource utilization and additional cost of revisits that may offset any gains accrued by more focused GAS testing outside the existing clinical guidelines and HEDIS measures. This may be of particular importance in documenting infection and sparing antibiotic therapy in toddlers and younger.
The objective of this study was to investigate the correlation between testing and antibiotic use on the likelihood of a revisit for an acute respiratory tract infection within 28 days. To achieve this objective, this investigation consists of 3 sequential analyses. First, we document the factors associated with the decision to test the patient for a GABHS infection using the GAS test. Next, we document the factors associated with the decision to use an antibiotic to treat the patient as a function of having tested the patient. Finally, we investigate the impact of the testing and treatment decisions on the likelihood of a revisit within 28 days.
Methods
Study design
This was a retrospective cohort study of episodes of treatment for pediatric patients with pharyngitis. Episodes were identified using data derived from the Optum Insight Clinformatics claims database provided to the University of Southern California to facilitate the training of graduate students. These data cover commercially insured patients with both medical and pharmacy benefits. Data were retrieved from the 3-year period spanning 2011-2013. An episode of care was identified based on date of the first (index) outpatient visit for a pharyngitis diagnosis (International Classification of Diseases, Ninth Revision [ICD-9]: 462, 463, 034.0). Outpatient visits were defined by visit setting: ambulatory clinics, physician offices, emergency rooms, and urgent care facilities. Each pharyngitis treatment episode was then screened for at least a 6-month enrollment in a health insurance plan prior and subsequent to the index visit using Optum enrollment data. Finally, eligible treatment episodes were restricted to children and adolescents under 18 years of age, who had an index outpatient visit for a primary diagnosis of acute pharyngitis.
A diagnostic profile was created for each episode using the diagnoses recorded for the index visit. Up to 3 diagnoses may be recorded for any outpatient visit and the first recorded diagnosis was assumed to be the primary diagnosis for that episode. Any secondary diagnoses recorded on the index visit were used to define comorbidities present at the index visit. ARTI-related comorbidities included: acute otitis media (AOM), bronchitis, sinusitis, pneumonia, and upper respiratory infection (URI). Other comorbid medical diagnoses were documented using diagnostic data from the pre-index period. Dichotomous variables for the following categories were created: mental disorders, nervous system disorders, respiratory symptoms, fever, injury and poisoning, other, or no diseases.
Prior visits for other respiratory infections in the previous 90 days were also identified for patients based on their index visit for pharyngitis. Similarly, any subsequent visits, within 28 days of the index visit, were also recorded to measure the health outcome for analysis. Practice settings include physician offices and federally qualified health centers, state and local health clinics, outpatient hospitals facilities, emergency departments, and other outpatient settings such as walk-in retail health clinic or ambulatory centers. Providers include primary care physicians (family practice, pediatricians, internal medicine), specialty care physicians (emergency medicine, preventive medicine), nonphysician providers (nurse practitioners, physician assistants) and other providers (urgent care, acute outpatient care, ambulatory care centers). Seasons of the year were determined based on the index date of the episode to account for possible seasonality in pharyngitis treatment. Lastly, a previous visits variable was created to identify whether the child had nonpharyngitis ARTI visits in the 3 months prior to the index visit.
Demographic variables were created based on enrollment and the socioeconomic data available in the Optum socioeconomic status file. These variables include patient age, race, sex, household income, geographic location, practice setting type, provider specialty, and type of insurance. An estimate of patient household income was based on algorithms using census block groups. Income categories were informed by the federal guidelines for a family of 4. A low-income family was defined as earning less than $50 000; a middle-income family earned between $50 000 and $75 000, and a high-income family earned $75 000 and above.12 Patient insurance type was categorized as HMO, Exclusive Provider Organization (EPO), Point of Service (POS), and PPO. Race was identified as White, Black, Hispanic, and Asian. Patient location was defined according to national census regions.
Outcomes
GAS test
The HEDIS measures for pharyngitis recommend using the GAS test to identify the bacterial etiology of the pharyngitis infection. Patients who received the test were identified based on Current Procedural Terminology (CPT) codes 87070-71, 87081, 87430, 87650-52, and 87880.10
Antibiotic treatment
The pharmacy administrative claims dataset was used to identify study patients who filled a prescription for an antibiotic during their pharyngitis treatment episode. Optum pharmacy data identify the medications received, specifies the date of prescription filling, National Drug Codes, and American Hospital Formulary Service (AHFS) Classification System codes for each medication. We used the AHFS Pharmacologic-Therapeutic classification of antibiotics to create dichotomous variables documenting the antibacterial used by each patient.13 These are categorized under antibacterial including penicillins, cephalosporins (first, second, third, fourth generation cephalosporins), macrolides (first generation and others), tetracyclines, sulfonamides, fluoroquinolones (ciprofloxacin, levofloxacin, moxifloxacin), cephamycin, carbapenems, and β-lactam antibiotics (amoxicillin, amoxicillin/clavulanate, cephalexin, cefuroxime, cefdinir).
Revisits to physician or other provider
Revisits within 28 days were used as the measure of patient outcomes related to testing and filling of an antibiotic prescription for acute pharyngitis. Revisits may also be due to a patient returning for a follow-up, alternative treatment, worsening pharyngitis, or for another ARTI. An ARTI-related revisit also increases total resources used to treat pediatric pharyngitis patients.
Statistical analysis
Logistic regression was used for all 3 analyses conducted in this study. First, we determined the patient and treating physician characteristics that impact the decision to use GAS testing for pharyngitis. Second, we identified those factors that impact the decision to use antibiotic prescriptions among children who were diagnosed with pharyngitis adding in the dichotomous variable indicating if the patient had received a GAS test. Third, we used a logit regression analysis to document if receiving a GAS test and/or an antibiotic impacted the likelihood of a revisit by comparing revisit risk. To estimate the effect of testing and/or antibiotic use, we divided patients into 4 groups based on whether the patient received a GAS test and/or an antibiotic prescription. This specification of the analysis of revisits as an outcome focuses on adherence to HEDIS “test and treat” guidelines10:
- Patients who were not tested yet filled an antibiotic prescription. This decision was likely based on the clinician’s judgment of the patient’s signs and symptoms, and confirmational testing not performed.
- Patients who were not tested and did not fill an antibiotic prescription. Apparently, in the clinician’s judgment the patient’s signs and symptoms were such that the infection did not warrant treatment and the clinical presentation did not necessitate the GAS test to confirm the recorded diagnosis of pharyngitis.
- Patients who were tested and received antibiotic prescription, likely because the test was positive for GABHS.
- Patients who were tested and did not receive antibiotic prescription.
We tested for statistically significant differences in baseline characteristics across these 4 patient groups using t tests for continuous variables and χ2 tests for categorical variables. Odds ratios (OR) and CI were computed for the influential variables included the regression analyses.
We conducted a sensitivity analysis using a model specification which included the dichotomous variables for testing and for treatment, and the interaction term between these variables to assess if treatment effects varied in tested and untested patients. We also estimated this model of revisit risk using revisits within 7 days as the outcome variable.
All analyses were completed using STATA/IC 13 (StataCorp, College Station, TX).
Results
There were 24 685 treatment episodes for children diagnosed with pharyngitis. Nearly 47% of these episodes included GAS testing and 47% of the tested patients filled an antibiotic prescription. Similarly, 53% of patients were not tested and 49% of untested patients filled an antibiotic prescription. As a result, the 4 groups identified for analysis were evenly distributed: untested and no prescription (26.9%), untested and prescription (26.3%), tested and prescription (21.9%), and tested and no prescription (24.9%) (Figure).
Table 1 presents the descriptive statistics for these 4 patient groups. Note first that the rate of revisits within 28 days is under 5% across all groups. Second, the 2 tested groups have a lower revisit rate than the untested groups: the tested and treated have a revisit rate of 3.3%, and the tested and untreated have a revisit rate of 2.4%, while both the untested groups have a revisit rate of nearly 5%. These small absolute differences in revisit rates across groups were statistically significant.
Factors associated with receiving GAS test
Several factors were found to impact the decision to test (Table 2). Only 9.7% of children were reported to have any ARTI coinfection. As expected, these comorbidities resulted in a significantly lower likelihood of receiving the GAS test: AOM, bronchitis, sinusitis, pneumonia, and URI as comorbid infections had a 48%, 41%, 37%, 63%, and 13% lower likelihood of receiving the GAS test, respectively, than those with no comorbidities. Similarly, children with fever and respiratory symptoms were 35% and 45% less likely to receiving the GAS test, respectively. This is consistent with our expectation that comorbid ARTI infections will lead many providers to forgo testing.
Provider type and patient age also plays a role in receipt of the GAS test. Relative to outpatient facility providers, primary care physicians were 24% more likely and specialty physicians were 38% less likely of employing the GAS test. The child’s age played a significant role in receipt of the GAS test. Children aged 1 to 5 years and 5 to 12 years were 15% and 14% more likely to receive the test compared to children older than 12 years.
Pharyngitis patients have disproportionately higher odds of receiving a GAS test in most regions of the country compared to the Pacific region. For instance, children in the Mid-Atlantic region have 51% higher odds of receiving a GAS test while children in New England have 80% higher odds of receiving the same test.
Black children have 11% lower odds of receiving the GAS test compared to White children. Both middle-income and high-income children have 12% and 32% higher odds of receiving the test compared to low-income children. Compared to office-based visits, children visiting a clinic were twice as likely to receive a GAS test while those seen in the emergency room have 43% lower odds of receiving a GAS test. Hospital outpatient departments, which account for less than 1% of all visits, rarely used a GAS test which could be a statistical artifact due to small sample size. Lastly, insurance and season of the year had no significant impact of receipt of a GAS test.
Factors associated with receiving antibiotic prescription
Surprisingly, receiving the GAS test has a small but insignificant impact on the likelihood that the patient will receive an antibiotic prescription (Table 3) (Adjusted OR = 1.055, P = .07). After controlling for receipt of a GAS test, children with AOM and sinusitis comorbidities have an increased likelihood of being prescribed an antibiotic. Children with URI have a lower likelihood of being prescribed an antibiotic. Additionally, relative to primary care physicians, children visiting nonphysician providers for pharyngitis were more likely to be prescribed an antibiotic.
Children under 12 years of age were more likely to use an antibiotic compared to children 12 years and older. Geographically, there is some evidence of regional variation in antibiotic use as well. Children in the south Atlantic, west-south central, and southeast central regions had a significantly lower odds of being prescribed an antibiotic respectively than pharyngitis patients in the Pacific region. Black children had a 10% lower likelihood of being prescribed an antibiotic compared to White children, possibly related to their lower rate of GAS testing. Compared to office-based visits, children visiting a clinic were less likely to use an antibiotic. Household income, insurance type, and season had no significant impact on revisit risk.
Effects of GAS test and antibiotic prescriptions on likelihood of revisits
The multivariate analysis of the risk of a revisit within 28 days is presented in Table 4. Children with pharyngitis who tested and did not receive an antibiotic serve as the reference comparison group for this analysis to illustrate the impact of using the GAS test and treatment with an antibiotic. The results in Table 4 are quite clear: patients who receive the GAS test were significantly less likely to have a revisit within 28 days. Moreover, within the group of patients who were tested, those not receiving an antibiotic, presumedly because their GAS test was negative, experienced the lowest risk of a revisit. This result is consistent with the data in Table 1. Moreover, using an antibiotic had no impact on the likelihood of a revisit in patients not receiving the GAS test. This result is also consistent with Table 1.
Other results from the analysis of revisit risk may be of interest to clinicians. Pharyngitis patients with a prior episode of treatment within 90 days for an acute respiratory tract infection were more than 7 times more likely to experience a revisit within 28 days of the pharyngitis diagnosis than patients without a history of recent ARTI infections. Age is also a risk factor in likelihood of initiating a revisit. Children under 1 year and children aged 1 to 5 years were more likely to have a revisit than children aged more than 12 years. Compared to White children, Black children were 25% (P = .04) less likely to have a revisit. The care setting also has a significant impact on revisit risk. Children visiting outpatient hospital and other care settings had a significantly higher revisit risk than those visiting a physician’s office. Lastly, household income, geographic region, season, medical comorbidities, gender, and insurance type have no significant impact on revisit risk.
Sensitivity analysis
The results from the analysis of 7-day and 28-day revisit risk are summarized in Table 5. These results indicate that patients who were tested had a more significant decrease in revisit risk at 7 days (72%) than was evident at 28 days (47% reduction). Receiving an antibiotic, with or without the test, had no impact on revisit risk.
Discussion
Published data on revisits for pharyngitis are lacking with the concentration of prior research focused more on systemic complications of undertreated GABHS disease or on identifying carrier status. Our study results suggest that GAS testing is the most important factor in reducing revisit risk. Being prescribed an antibiotic, on its own, does not have a significant impact on the risk of a revisit. However, once the GAS test is used, the decision not to use an antibiotic was correlated with the lowest revisit rate, likely because the source of the pharyngitis infection was viral and more likely to resolve without a revisit. Prior studies have reported variable rates of testing among children with pharyngitis prescribed an antibiotic, ranging from 23% to 91%,14,15 with testing important toward more appropriate antibiotic use.16 More recently, among more than 67 000 patients aged 3 to 21 years presenting with sore throat and receiving a GAS test, 32.6% were positive.17
Our analysis found that more than 46% of pediatric pharyngitis patients were given the rapid GAS test. While this testing rate is substantially lower than HEDIS recommendations and lower than testing rates achieved by several health maintenance organizations,10 it is similar to the 53% of children receiving such testing in a recent National Ambulatory Medical Care Survey.18 Furthermore, we found that when antibiotics are prescribed following a GAS test, the revisit risk is not significantly reduced, possibly because antibiotics lower revisit risk when informed by diagnostic testing tools that determine the infectious organism. This is supported by a similar population analysis in which we observed reduced revisit rates in children with AOM managed with antibiotics within 3 days of index diagnosis.19
Several other factors also affect the likelihood of a child receiving the GAS test. Children aged 1 to 12 years were significantly more likely to receive the GAS test than children over the age of 12. This included children in the 1 to 5 years old bracket who had a 15% higher likelihood of undergoing a GAS test, despite children less than 3 years of age as not recommended targets for GAS testing.20 As expected, children with reported ARTI-associated comorbidities were also less likely to receive a GAS test. Additionally, specialty care physicians were less inclined to implement the GAS test, possibly because of diagnostic confidence without testing or referral after GAS was ruled out. Black and low-income children had statistically lower odds of receiving the test, even after controlling for other factors, and yet were less likely to consume a revisit. As the overall data suggested more revisits in those not tested, further study is needed to examine if race or income discrepancies are equity based. Finally, children in the Pacific region, compared to the rest of the nation, were the least likely to receive a GAS test and yet there were no significant differences in revisit rates by region. Regional differences in antibiotic use were also observed in our study, as has been seen by others.21
After statistically controlling for having received the diagnostic GAS test and filled a prescription for an antibiotic, there are multitude of factors that independently affect the revisit risk, the most important of which if which was a history of an ARTI infection in the prior 90 days. While prior visit history had no impact on the likelihood of being tested or filling an antibiotic, patients with prior visits were more than 7 times more likely to consume a revisit. This was not reflected in nor related to comorbid ARTIs as these patients did not have statistically higher revisits than those with pharyngitis as the sole-coded diagnosis. Moreover, speculation for bacterial etiology of primary or superinfection based on a recent history of ARTI accounting for revisits seems unlikely as it did not yield greater antibiotic use in that group. Further analysis is required to determine the clinical and behavioral factors that promote for prior ARTI history as a major factor in revisit risk after an index visit for pharyngitis.
Children aged between 1 and 5 years, though 15% more likely to be tested than those aged 12 through 17 years, were also 39% more likely to initiate a revisit compared to older children when statistically controlling for other covariates. This perhaps suggests longer illness, wrong diagnosis, delay in appropriate treatment, or more caution by parents and providers in this age group. Justification for testing children less than 3 years of age who are outside of the HEDIS suggested age group, when clinical judgement does not point to another infection source, can result in positivity rates between 22% and 30% as previously observed.22,23 Patients visiting nonphysician providers and outpatient facility providers were less likely to have a revisit than those visiting primary and specialty care physicians, though slightly higher propensity for antibiotic prescriptions was seen for nonphysician providers. Pediatricians have been noted to be less likely to prescribe antibiotics without GAS testing than nonpediatric providers, and more guidelines-compliant in prescribing.24
Recommendations to not test children under 3 years of age are based on the lack of acute rheumatic fever and other complications in this age group together with more frequent viral syndromes. Selectivity in applying clinical criteria to testing can be attempted to separate bacterial from viral illness. Postnasal drainage/rhinorrhea, hoarse voice, and cough have been used successfully to identify those with viral illness and less need for testing, with greater certainty of low risk for GABHS in those over 11 years of age without tonsillar exudates, cervical adenopathy, or fever.17 However, the marginal benefits of those who have all 3 features of viral illness versus none in identifying GAS positivity was 23.3% vs 37.6% - helpful, but certainly not diminishing the need for testing. These constitutional findings of viral URI also do not exclude the GAS carrier state that features these symptoms.25 Others have reinforced the doubt of pharyngeal exudates as the premier diagnostic finding for test-positive GAS.26
This study had several limitations. The Optum claims dataset only contains ICD-9 codes for diagnoses. It does not include data on infection severity and clinical findings related to symptoms, thus empiric treatment warranted based in clinical severity is not assessed. Antibiotics are commonly available as generics and very inexpensive. Patients may fill and pay for these prescriptions directly, in which case, a claim for payment may not be filed with Optum. This could result in an undercount of treated patients in our study.
There is no corresponding problem of missing medical claims for GAS testing which were obtained from the CPT codes within the Optum claims data set. However, we elected not to verify the test results due to these data being missing for 75% of the study population. Nevertheless, this study’s focus was less about justifying antibiotic treatment, but dealt with the outcomes generated by testing and treatment. Toward that end, we used CPT codes to identify a revisit, and while those can at times be affected by financial reimbursement incentives, differences related to revisits in the 4 patient groups should not be subject to bias.
Conclusion
This study used data from real world practices to document the patterns of GAS testing and antibiotic use in pediatric pharyngitis patients. Revisit rates were under 5% for all patient groups and the use of rapid diagnostic tools were found to be the determining factor in further reducing the risk of revisits. This supports the need for compliance with the HEDIS quality metric for pharyngitis to the recommended levels of rapid testing which have been falling in recent years. Use of more accurate antigen and newer molecular detection testing methods may help further delineate important factors in determining pediatric pharyngitis treatment and need for revisits.27
Corresponding author: Jeffrey McCombs, MD, University of Southern California School of Pharmacy, Department of Pharmaceutical and Health Economics, Leonard D. Schaeffer Center for Health Policy & Economics, 635 Downey Way, Verna & Peter Dauterive Hall 310, Los Angeles, CA 90089-3333; [email protected].
Financial disclosures: None.
1. Choby BA. Diagnosis and treatment of streptococcal pharyngitis. Am Fam Physician. 2009;79(5):383-390.
2. Briel M, Schuetz P, Mueller B, et al. Procalcitonin-guided antibiotic use vs a standard approach for acute respiratory tract infections in primary care. Arch of Intern Med. 2008;168(18):2000-2008. doi: 10.1001/archinte.168.18.2000
3. Maltezou HC, Tsagris V, Antoniadou A, et al. Evaluation of a rapid antigen detection test in the diagnosis of streptococcal pharyngitis in children and its impact on antibiotic prescription. J Antimicrob Chemother. 2008;62(6):1407-1412. doi: 10.1093/jac/dkn376
4. Neuner JM, Hamel MB, Phillips RS, et al. Diagnosis and management of adults with pharyngitis: a cost-effectiveness analysis. Ann Intern Med. 2003;139(2):113-122. doi:10.7326/0003-4819-139-2-200307150-00011
5. Gerber MA, Baltimore RS, Eaton CB, et al. Prevention of rheumatic fever and diagnosis and treatment of acute Streptococcal pharyngitis: a scientific statement from the American Heart Association Rheumatic Fever, Endocarditis, and Kawasaki Disease Committee of the Council on Cardiovascular Disease in the Young, the Interdisciplinary Council on Functional Genomics and Translational Biology, and the Interdisciplinary Council on Quality of Care and Outcomes Research: endorsed by the American Academy of Pediatrics. Circulation. 2009;119(11):1541-1551. doi: 10.1161/CIRCULATIONAHA.109.191959
6. Gieseker KE, Roe MH, MacKenzie T, Todd JK. Evaluating the American Academy of Pediatrics diagnostic standard for Streptococcus pyogenes pharyngitis: backup culture versus repeat rapid antigen testing. Pediatrics. 2003;111(6):e666-e670. doi: 10.1542/peds.111.6.e666
7. Shapiro DJ, Lindgren CE, Neuman MI, Fine AM. Viral features and testing for Streptococcal pharyngitis. Pediatrics. 2017;139(5):e20163403. doi: 10.1542/peds.2016-3403
8. Shulman ST, Bisno AL, Clegg H, et al. Clinical practice guideline for the diagnosis and management of group A Streptococcal pharyngitis: 2012 update by the Infectious Diseases Society of America. Clin Infect Dis. 2012;55(10):e86–e102. doi: 10.1093/cid/cis629
9. Mangione-Smith R, McGlynn EA, Elliott MN, et al. Parent expectations for antibiotics, physician-parent communication, and satisfaction. Arch Pediatr Adolesc Med. 2001;155(7):800–806. doi: 10.1001/archpedi.155.7.800
10. Appropriate Testing for Children with Pharyngitis. HEDIS Measures and Technical Resources. National Committee for Quality Assurance. Accessed February 12, 2021. https://www.ncqa.org/hedis/measures/appropriate-testing-for-children-with-pharyngitis/
11. Linder JA, Bates DW, Lee GM, Finkelstein JA. Antibiotic treatment of children with sore throat. JAMA. 2005;294(18):2315-2322. doi: 10.1001/jama.294.18.2315
12. Crimmel BL. Health Insurance Coverage and Income Levels for the US Noninstitutionalized Population Under Age 65, 2001. Medical Expenditure Panel Survey, Agency for Healthcare Research and Quality. 2004. https://meps.ahrq.gov/data_files/publications/st40/stat40.pd
13. AHFS/ASHP. American Hospital Formulary Service Drug Information. 2012. AHFS drug information. 00--. Accessed January 4, 2021.
14. Mainous AG 3rd, Zoorob, RJ, Kohrs FP, Hagen MD. Streptococcal diagnostic testing and antibiotics prescribed for pediatric tonsillopharyngitis. Pediatr Infect Dis J. 1996;15(9):806-810. doi: 10.1097/00006454-199609000-00014
15. Benin AL, Vitkauskas G, Thornquist E, et al. Improving diagnostic testing and reducing overuse of antibiotics for children with pharyngitis: a useful role for the electronic medical record. Pediatr Infect Dis J. 2003;22(12):1043-1047. doi: 10.1097/01.inf.0000100577.76542.af
16. Luo R, Sickler J, Vahidnia F, et al. Diagnosis and Management of Group a Streptococcal Pharyngitis in the United States, 2011-2015. BMC Infect Dis. 2019;19(1):193-201. doi: 10.1186/s12879-019-3835-4
17. Shapiro DJ, Barak-Corren Y, Neuman MI, et al. Identifying Patients at Lowest Risk for Streptococcal Pharyngitis: A National Validation Study. J Pediatr. 2020;220:132-138.e2. doi: 10.1016/j.jpeds.2020.01.030. Epub 2020 Feb 14
18. Shapiro DJ, King LM, Fleming-Dutra KE, et al. Association between use of diagnostic tests and antibiotic prescribing for pharyngitis in the United States. Infect Control Hosp Epidemiol. 2020;41(4):479-481. doi: 10.1017/ice.2020.29
19. Sangha K, Steinberg I, McCombs JS. The impact of antibiotic treatment time and class of antibiotic for acute otitis media infections on the risk of revisits. Abs PDG4. Value in Health. 2019; 22:S163.
20. Ahluwalia T, Jain S, Norton L, Meade J, et al. Reducing Streptococcal Testing in Patients < 3 Years Old in an Emergency Department. Pediatrics. 2019;144(4):e20190174. doi: 10.1542/peds.2019-0174
21. McKay R, Mah A, Law MR, et al. Systematic Review of Factors Associated with Antibiotic Prescribing for Respiratory Tract Infections. Antimicrob Agents Chemother. 2016;60(7):4106-4118. doi: 10.1128/AAC.00209-16
22. Woods WA, Carter CT, Schlager TA. Detection of group A streptococci in children under 3 years of age with pharyngitis. Pediatr Emerg Care. 1999;15(5):338-340. doi: 10.1097/00006565-199910000-00011
23. Mendes N, Miguéis C, Lindo J, et al. Retrospective study of group A Streptococcus oropharyngeal infection diagnosis using a rapid antigenic detection test in a paediatric population from the central region of Portugal. Eur J Clin Microbiol Infect Dis. 2021;40(6):1235-1243. doi: 10.1007/s10096-021-04157-x
24. Frost HM, McLean HQ, Chow BDW. Variability in Antibiotic Prescribing for Upper Respiratory Illnesses by Provider Specialty. J Pediatr. 2018;203:76-85.e8. doi: 10.1016/j.jpeds.2018.07.044.
25. Rick AM, Zaheer HA, Martin JM. Clinical Features of Group A Streptococcus in Children With Pharyngitis: Carriers versus Acute Infection. Pediatr Infect Dis J. 2020;39(6):483-488. doi: 10.1097/INF.0000000000002602
26. Nadeau NL, Fine AM, Kimia A. Improving the prediction of streptococcal pharyngitis; time to move past exudate alone [published online ahead of print, 2020 Aug 16]. Am J Emerg Med. 2020;S0735-6757(20)30709-9. doi: 10.1016/j.ajem.2020.08.023
27. Mustafa Z, Ghaffari M. Diagnostic Methods, Clinical Guidelines, and Antibiotic Treatment for Group A Streptococcal Pharyngitis: A Narrative Review. Front Cell Infect Microbiol. 2020;10:563627. doi: 10.3389/fcimb.2020.563627