User login
When patients on target-specific oral anticoagulants need surgery
More then 2.5 million patients in the United States are on long-term anticoagulation therapy for atrial fibrillation, venous thromboembolic disease, or mechanical heart valves,1 and the number is expected to rise as the population ages. Each year, about 10% of these patients undergo an invasive procedure or surgery that requires temporary interruption of anticoagulation.2
Most physicians are familiar with the perioperative management of warfarin, a vitamin K antagonist, since for decades it has been the sole oral anticoagulant available. However, many physicians lack experience with the three target-specific oral anticoagulants (TSOACs; also known as “novel” oral anticoagulants) approved so far: the direct thrombin inhibitor dabigatran (Pradaxa) and the direct factor Xa inhibitors rivaroxaban (Xarelto) and apixaban (Eliquis).
With their rapid onset of action, predictable pharmacokinetics, relatively short half-lives, and fewer drug-drug interactions than warfarin, TSOACs overcome many of the limitations of the older oral anticoagulant warfarin. In many ways, these qualities simplify the perioperative management of anticoagulation. At the same time, these new drugs also bring new challenges: caution is needed in patients with renal impairment; the level of anticoagulation is difficult to assess; and there is no specific antidote or standardized procedure to reverse their anticoagulant effect. While various periprocedural protocols for TSOAC therapy have been proposed, evidence-based guidelines are still to come.
This article first discusses the pharmacology of dabigatran, rivaroxaban, and apixaban that is pertinent to the perioperative period. It then briefly reviews the general principles of perioperative management of anticoagulation. The final section provides specific recommendations for the perioperative management of TSOACs.
PHARMACOLOGY OF TARGET-SPECIFIC ORAL ANTICOAGULANTS
Dabigatran, a factor IIa inhibitor
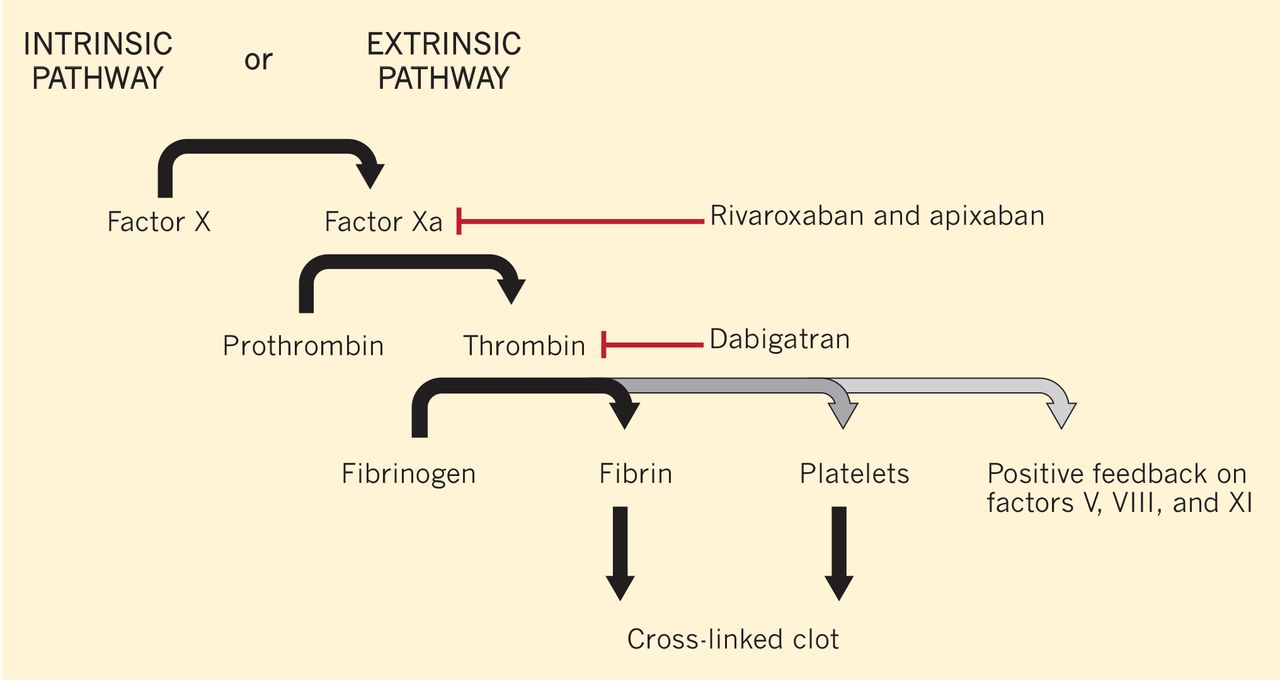
Dabigatran is an oral direct thrombin (factor IIa) inhibitor. It exerts its anticoagulant effect by blocking the generation of fibrin, inhibiting platelet aggregation, and dampening the activity of factors V, VIII, and XI (Figure 1).3,4 From its introduction in October 2010 through August 2012, nearly 3.7 million prescriptions were dispensed to 725,000 patients in the United States.5
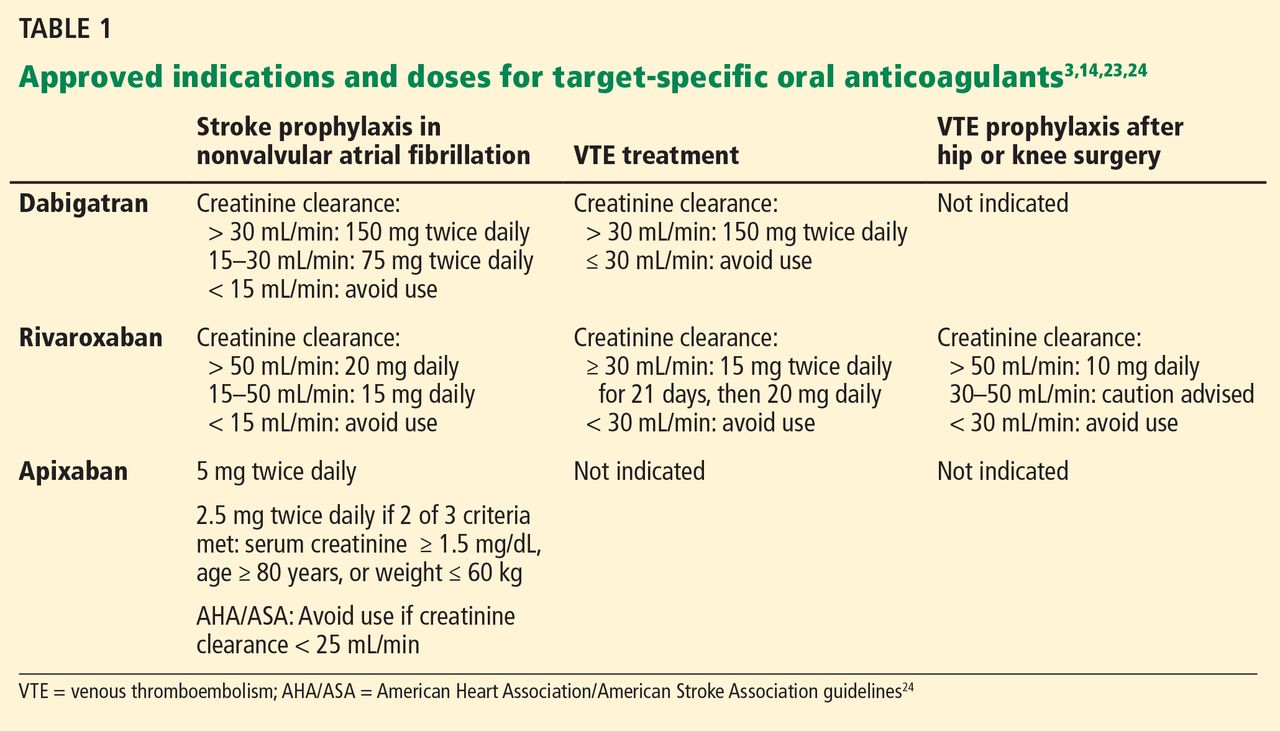
Indications for dabigatran. Dabigatran is approved in the United States and Canada for preventing stroke in nonvalvular atrial fibrillation (Table 1).6 More recently, it received US approval for treating deep vein thrombosis or pulmonary embolism after 5 to 10 days of a parenteral anticoagulant.7,8 It is also approved in Europe and Canada for preventing venous thromboembolism (VTE) after total hip replacement and knee arthroplasty.9,10
Dabigatran is contraindicated in patients with a mechanical heart valve, based on a phase 2 study in which it conferred a higher risk of thromboembolism and bleeding than warfarin.3,11
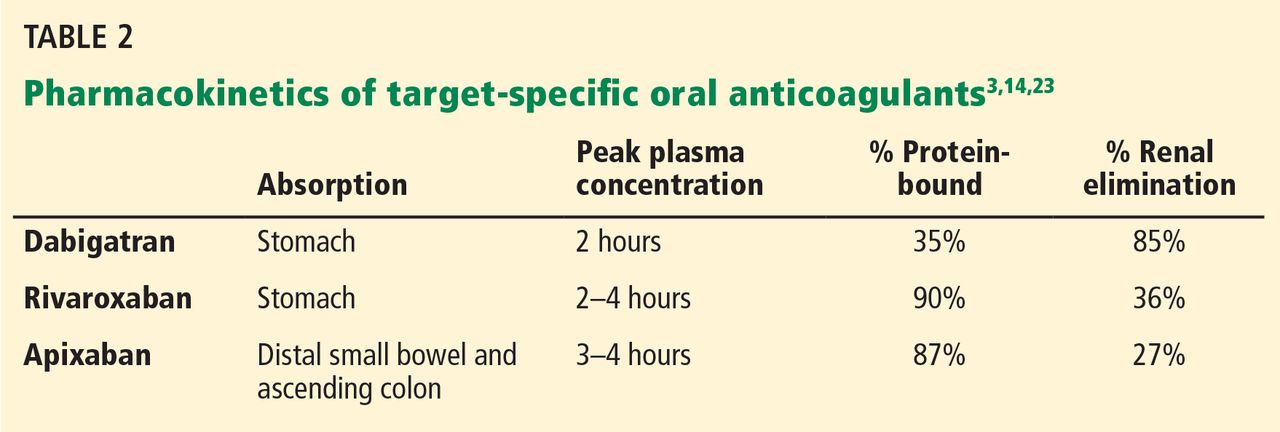
Pharmacokinetics of dabigatran. Dabigatran is formulated as a prodrug, dabigatran etexilate, in a capsule containing multiple small pellets.12 The capsules should not be crushed, as this significantly increases oral bioavailability. The prodrug is absorbed across the gastric mucosa and is then rapidly converted to the active form (Table 2).
Plasma concentrations peak within 2 hours of ingestion, which means that therapeutic anticoagulation is achieved shortly after taking the drug.
Only 35% of dabigatran is protein-bound, which allows it to be removed by hemodialysis. Nearly 85% of the drug is eliminated in the urine. It has a half-life of 13 to 15 hours in patients with normal renal function.3 However, its half-life increases to about 27 hours in patients whose creatinine clearance is less than 30 mL/min. As a result, the dose must be reduced in patients with renal impairment (Table 1).
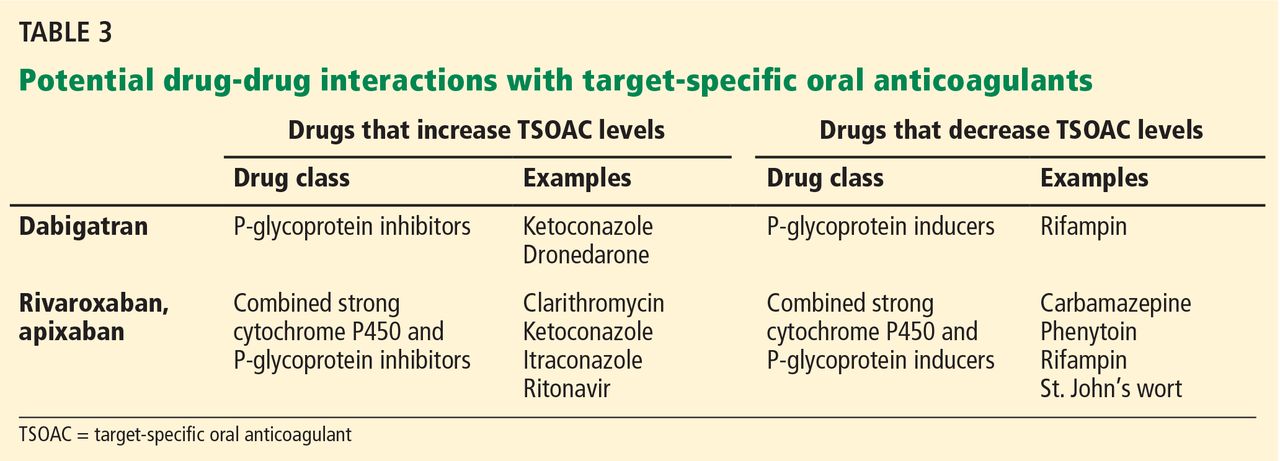
Dabigatran is not metabolized by the cytochrome P450 enzymes, but it is a substrate for P-glycoprotein, so it still has the potential for drug-drug interactions.3 Practitioners should be familiar with these potential interactions (Table 3), as they can result in higher- or lower-than-expected plasma concentrations of dabigatran in the perioperative period.13
Rivaroxaban, a factor Xa inhibitor
Rivaroxaban is an oral direct factor Xa inhibitor. It has been approved by the US Food and Drug Administration (FDA) for the prevention of stroke in nonvalvular atrial fibrillation, for VTE treatment, and for VTE prophylaxis after hip replacement or knee replacement (Table 1).14–20 It has not yet been studied in patients with hip fracture.
Pharmacokinetics of rivaroxaban. Rivaroxaban is manufactured as a tablet that is best absorbed in the stomach (Table 2).14 In contrast to dabigatran, it can be crushed and, for example, mixed with applesauce for patients who have trouble swallowing. It can also be mixed with water and given via nasogastric tube; however, postpyloric administration should be avoided.
Plasma concentrations peak within a few hours after ingestion. Rivaroxaban is highly protein-bound, so it cannot be eliminated by hemodialysis.
The drug relies on renal elimination to a smaller degree than dabigatran, with one-third of the dose eliminated unchanged in the urine, one-third eliminated in the urine as inactive metabolite, and the remaining one-third eliminated in the feces. However, enough parent compound is cleared through the kidneys that the half-life of rivaroxaban increases from 8.3 hours in healthy individuals to 9.5 hours in patients whose creatinine clearance is less than 30 mL/min.21 As with dabigatran, the dose must be adjusted for renal impairment (Table 1).
Rivaroxaban has significant liver metabolism, specifically through the cytochrome P450 3A4 enzyme, and it is also a substrate of P-glycoprotein. Therefore, potential drug-drug interactions must be taken into account, as they may lead to important alterations in plasma concentrations (Table 3).
Apixaban, a factor Xa inhibitor
Apixaban is also an oral direct factor Xa inhibitor. It is the newest of the oral anticoagulants to be approved in the United States, specifically for preventing stroke in nonvalvular atrial fibrillation (Table 1).22
Pharmacokinetics of apixaban. Apixaban is produced as a tablet that is absorbed slowly through the gastrointestinal tract, mainly the distal small bowel and ascending colon (Table 2).23
Peak plasma concentrations are reached a few hours after ingestion. Like rivaroxaban, apixaban is highly protein-bound, so it cannot be removed by hemodialysis.
Apixaban is similar to rivaroxaban in that 27% of the parent compound is cleared through the kidneys, it undergoes significant hepatic metabolism through cytochrome P450 3A4, and it is a substrate for P-glycoprotein.
Drug-drug interactions must be considered as a potential source of altered drug exposure and clearance (Table 3).
Unlike dabigatran and rivaroxaban, dose reduction is not based on the calculated creatinine clearance. Instead, a reduced dose is required if the patient meets two of the following three criteria:
- Serum creatinine level ≥ 1.5 mg/dL
- Age ≥ 80
- Weight ≤ 60 kg (Table 1).
The American Heart Association/American Stroke Association guidelines further recommend against using apixaban in patients with a creatinine clearance less than 25 mL/min.24
Edoxaban, a factor Xa inhibitor in development
Edoxaban (Savaysa), another factor Xa inhibitor, is available in Japan and has been submitted for approval in the United States for treating VTE and for preventing stroke in patients with
PERIOPERATIVE CONSIDERATIONS IN ANTICOAGULATION
Before addressing the perioperative management of TSOACs, let us review the evidence guiding the perioperative management of any chronic anticoagulant.
In fact, no large prospective randomized trial has clearly defined the risks and benefits of using or withholding a bridging anticoagulation strategy around surgery and other procedures, though the PERIOP 2 and BRIDGE trials are currently ongoing.25,26 There are some data regarding continuing anticoagulation without interruption, but they have mainly been derived from specific groups (eg, patients on warfarin undergoing cardiac pacemaker or defibrillator placement) and in procedures that pose a very low risk of bleeding complications (eg, minor dental extractions, cataract surgery, dermatologic procedures).2,27 Recommendations are, therefore, necessarily based on small perioperative trials and data gleaned from cohort review and from studies that did not involve surgical patients.
Ultimately, the decisions whether to discontinue oral anticoagulants and whether to employ bridging anticoagulation are based on assumptions about the risks of bleeding and the risk of thrombotic events, with similar assumptions regarding the effects of anticoagulants on both outcomes. In addition, the relative acceptance of bleeding vs thrombotic risks implicitly guides these complex decisions.
Perioperative bleeding risk
Many risk factors specific to the patient and to the type of surgery affect the rates and severity of perioperative bleeding.28
As for patient-specific risk factors, a small retrospective cohort analysis revealed that a HAS-BLED score of 3 or higher was highly discriminating in predicting perioperative bleeding in atrial fibrillation patients receiving anticoagulation.29 (The HAS-BLED score is based on hypertension, abnormal renal or liver function, stroke, bleeding, labile international normalized ratio [INR], elderly [age > 65] and drug therapy.30) However, there are no widely validated tools that incorporate patient-specific factors to accurately predict bleeding risk in an individual patient.
Therefore, the American College of Chest Physicians (ACCP) guidelines suggest coarsely categorizing bleeding risk as either low or high solely on the basis of the type of procedure.2 Procedures considered “high-risk” have a risk greater than 1.5% to 2% and include urologic surgery involving the prostate or kidney, colonic polyp resections, surgeries involving highly vascular organs such as the liver or spleen, joint replacements, cancer surgeries, and cardiac or neurosurgical procedures.
Perioperative thrombotic risk
The ACCP guidelines2 place patients with atrial fibrillation, VTE, or mechanical heart valves in three risk groups for perioperative thromboembolism without anticoagulation, based on their annual risk of a thrombotic event:
- High risk—annual risk of a thrombotic event > 10%
- Moderate risk—5% to 10%
- Low risk—< 5%.
Comparing the risks calculated by these methods with the real-world risk of perioperative thrombosis highlights the problem of applying nonperioperative risk calculations: the perioperative period exposes patients to a higher risk than these models would predict.31 Nonetheless, these risk categorizations likely have some validity in stratifying patients into risk groups, even if the absolute risks are inaccurate.
Perioperative bridging for patients taking warfarin
Many patients with atrial fibrillation, VTE, or a mechanical heart valve need to interrupt their warfarin therapy because of the bleeding risk of an upcoming procedure.
The perioperative management of warfarin and other vitamin K antagonists is challenging because of the pharmacokinetics and pharmacodynamics of these drugs. Because it has a long half-life, warfarin usually must be stopped 4 to 5 days before a procedure in order to allow not only adequate clearance of the drug itself, but also restoration of functional clotting factors to normal or near-normal levels.12 Warfarin can generally be resumed 12 to 24 hours after surgery, assuming adequate hemostasis has been achieved, and it will again take several days for the INR to reach the therapeutic range.
The ACCP guidelines recommend using the perioperative risk of thromboembolism to make decisions about the need for bridging anticoagulation during warfarin interruption.2 They suggest that patients at high risk of thrombosis receive bridging with an alternative anticoagulant such as low-molecular-weight heparin or unfractionated heparin, because of the prolonged duration of subtherapeutic anticoagulation.
There has been clinical interest in using a TSOAC instead of low-molecular-weight or unfractionated heparin for bridging in the perioperative setting. Although this approach may be attractive from a cost and convenience perspective, it cannot be endorsed as yet because of the lack of information on the pros and cons of such an approach.
Patients at low thrombotic risk do not require bridging. In patients at moderate risk, the decision to bridge or not to bridge is based on careful consideration of patient-specific and surgery-specific factors.
PERIOPERATIVE MANAGEMENT OF TARGET-SPECIFIC ORAL ANTICOAGULANTS
As summarized above, the perioperative management strategy for chronic anticoagulation is based on limited evidence, even for drugs as well established as warfarin.
The most recent ACCP guidelines on the perioperative management of antithrombotic therapy do not mention TSOACs.2 For now, the management strategy must be based on the pharmacokinetics of the drugs, package inserts from the manufacturers, and expert recommendations.3,14,23,32–34 Fortunately, because TSOACs have a more favorable pharmacokinetic profile than that of warfarin, their perioperative uses should be more streamlined. As always, the goal is to minimize the risk of both periprocedural bleeding and thromboembolism.
Timing of cessation of anticoagulation
The timing of cessation of TSOACs before an elective procedure depends primarily on two factors: the bleeding risk of the procedure and the patient’s renal function. Complete clearance of the medication is not necessary in all circumstances.
TSOACs should be stopped four to five half-lives before a procedure with a high bleeding risk, so that there is no or only minimal residual anticoagulant effect. The drug can be stopped two to three half-lives before a procedure with a low bleeding risk. Remember: the half-life increases as creatinine clearance decreases.
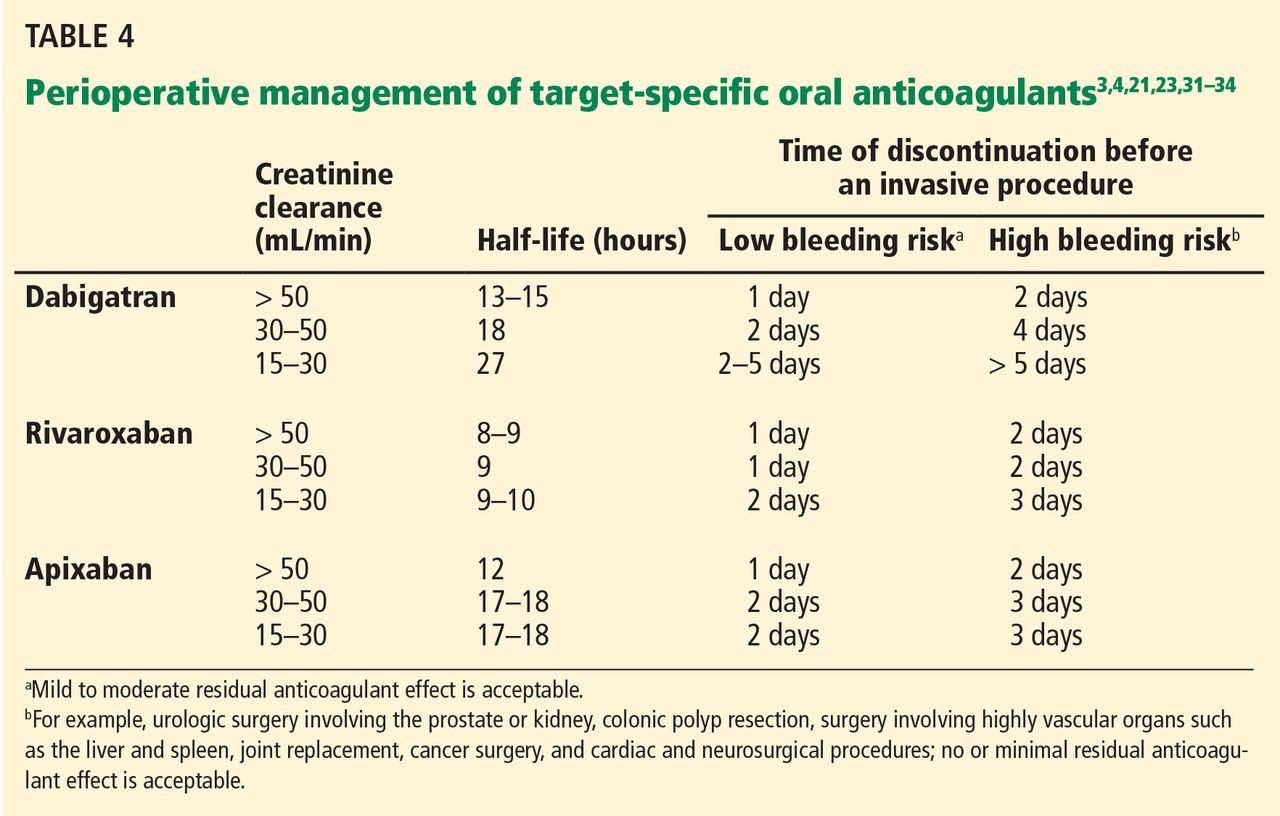
Specific recommendations may vary across institutions, but a suggested strategy is shown in Table 4.3,4,21,23,32–35 For the small subset of patients on P-glycoprotein or cytochrome P450 inhibitors or inducers, further adjustment in the time of discontinuation may be required.
Therapy does not need to be interrupted for procedures with a very low bleeding risk, as defined above.33,34 There is also preliminary evidence that TSOACs, similar to warfarin, may be continued during cardiac pacemaker or defibrillator placement.36
Evidence from clinical trials of perioperative TSOAC management
While the above recommendations are logical, studies are needed to prospectively evaluate perioperative management strategies.
The RE-LY trial (Randomized Evaluation of Long-Term Anticoagulation Therapy), which compared the effects of dabigatran and warfarin in preventing stroke in patients with atrial fibrillation, is one of the few clinical trials that also looked at periprocedural bleeding.37 About a quarter of the RE-LY participants required interruption of anticoagulation for a procedure.
Warfarin was managed according to local practices. For most of the study, the protocol required that dabigatran be discontinued 24 hours before a procedure, regardless of renal function or procedure type. The protocol was later amended and closely mirrored the management plan outlined in Table 4.
With either protocol, there was no statistically significant difference between dabigatran and warfarin in the rates of bleeding and thrombotic complications in the 7 days before or 30 days after the procedure.
A major limitation of the study was that most patients underwent a procedure with a low bleeding risk, so the analysis was likely underpowered to evaluate rates of bleeding in higher-risk procedures.
The ROCKET-AF trial (Rivaroxaban Once-daily Oral Direct Factor Xa Inhibition Compared With Vitamin K Antagonism for Prevention of Stroke and Embolism Trial in Atrial Fibrillation) also shed light on periprocedural bleeding.15 About 15% of the participants required temporary interruption of anticoagulation for a surgical or invasive procedure.38
The study protocol called for discontinuing rivaroxaban 2 days before any procedure. Warfarin was to be held for 4 days to achieve a goal INR of 1.5 or less.15
Rates of major and nonmajor clinically significant bleeding at 30 days were similar with rivaroxaban and with warfarin.38 As with the RE-LY trial, the retrospective analysis was probably underpowered for assessing rates of bleeding in procedures with higher risk.
Perioperative bridging
While stopping a TSOAC in the perioperative period decreases the risk of bleeding, it naturally increases the risk of thromboembolism. However, patients on TSOACs should not routinely require perioperative bridging with an alternative anticoagulant, regardless of thrombotic risk.
Of note, dabigatran, rivaroxaban, and apixaban carry black-box warnings that discontinuation places patients at higher risk of thrombotic events.3,14,23 These warnings further state that coverage with an alternative anticoagulant should be strongly considered during interruption of therapy for reasons other than pathologic bleeding.
However, it does not necessarily follow that perioperative bridging is required. For example, the warning for rivaroxaban is based on the finding in the ROCKET-AF trial that patients in the rivaroxaban group had higher rates of stroke than those in the warfarin group after the study drugs were stopped at the end of the trial.39 While there was initial concern that this could represent a prothrombotic rebound effect, the authors subsequently showed that patients in the rivaroxaban group were more likely to have had a subtherapeutic INR when transitioning to open-label vitamin-K-antagonist therapy.39,40 There was no difference in the rate of stroke or systemic embolism between the rivaroxaban and warfarin groups when anticoagulation was temporarily interrupted for a procedure.38
The risks and benefits of perioperative bridging with TSOACs are difficult to evaluate, given the dearth of trial data. In the RE-LY trial, only 17% of patients on dabigatran and 28% of patients on warfarin underwent periprocedural bridging.37 The selection criteria and protocol for bridging were not reported. In the ROCKET-AF trial, only 9% of patients received bridging therapy despite a mean CHADS2 score of 3.4.38 (The CHADS2 score is calculated as 1 point each for congestive heart failure, hypertension, age ≥ 75, and diabetes; 2 points for stroke or transient ischemic attack.) The decision to bridge or not was left to the individual investigator. As a result, the literature offers diverse opinions about the appropriateness of transitioning to an alternative anticoagulant.41–43
Bridging does not make sense in most instances, since anticoagulants such as low-molecular-weight heparin have pharmacokinetics similar to those of the available TSOACs and also depend on renal clearance.41 However, there may be situations in which patients must be switched to a parenteral anticoagulant such as unfractionated or low-molecular-weight heparin. For example, if a TSOAC has to be held, the patient has acute renal failure, and a needed procedure is still several days away, it would be reasonable to start a heparin drip for an inpatient at increased thrombotic risk.
In patients with normal renal function, these alternative anticoagulants should be started at the time the next TSOAC dose would have been due.3,14,23 In patients with reduced renal function, initiation of an alternative anticoagulant may need to be delayed 12 to 48 hours depending on which TSOAC is being used, as well as on the degree of renal dysfunction. This delay would help ensure that the onset of anticoagulation with the alternative anticoagulant is timed with the offset of therapeutic anticoagulation with the TSOAC.
Although limited, information from available coagulation assays may assist with the timing of initiation of an alternative anticoagulant (see the following section on laboratory monitoring). Serial testing with appropriate coagulation assays may help identify when most of a TSOAC has been cleared from a patient.
Laboratory monitoring
Inevitably, some patients on TSOACs require urgent or emergency surgery. In certain situations, such as before an orthopedic spine procedure, in which the complications of bleeding could be devastating, it may be necessary to know if any residual anticoagulant effect is present.
Monitoring dabigatran. As one might expect, direct thrombin inhibitors such as dabigatran can prolong the prothrombin time and activated partial thromboplastin time (aPTT).44–47 However, the prothrombin time is not recommended for assessing the level of anticoagulation from dabigatran. Many institutions may be using a normal aPTT to rule out therapeutic concentrations of dabigatran, based on results from early in vitro and ex vivo studies.46 While appealing from a practical standpoint, practitioners should exercise caution when relying on the aPTT to assess the risk of perioperative bleeding. A more recent investigation in patients treated with dabigatran found that up to 35% of patients with a normal aPTT still had a plasma concentration in the therapeutic range.48
The thrombin time and ecarin clotting time are more sensitive tests for dabigatran. A normal thrombin time or ecarin clotting time indicates that no or only minimal dabigatran is present.48 Unfortunately, these two tests often are either unavailable or are associated with long turnaround times, which limits their usefulness in the perioperative setting.
Monitoring rivaroxaban and apixaban. Factor Xa inhibitors such as rivaroxaban and apixaban can also influence the prothrombin time and aPTT (Figure 1).44–47,49,50 The aPTT is relatively insensitive to these drugs at low concentrations. It has been suggested that a normal prothrombin time can reasonably exclude therapeutic concentrations of rivaroxaban.45,46 However, the effects on the prothrombin time are highly variable, changing with the reagent used.49,50 In addition, apixaban appears to have less impact on the prothrombin time overall. The INR is not recommended for monitoring the effect of factor Xa inhibitors.
Anti-factor Xa assays likely represent the best option to provide true quantitative information on the level of anticoagulation with either rivaroxaban or apixaban. However, the assays must be specifically calibrated for each drug for results to be useful. (Anti-factor Xa assays cannot be used for heparin or low-molecular-weight heparin.) Further, most institutions do not yet have this capability. When appropriately calibrated, normal anti-factor Xa levels would exclude any effect of rivaroxaban or apixaban.
Reversal of anticoagulation
If patients on TSOACs require emergency surgery or present with significant bleeding in the setting of persistent anticoagulation, it may be necessary to try to reverse the anticoagulation.
Unlike warfarin or heparin, TSOACS do not have specific reversal agents, though specific antidotes are being developed. For example, researchers are evaluating antibodies capable of neutralizing dabigatran, as well as recombinant thrombin and factor Xa molecules that could antagonize dabigatran and rivaroxaban, respectively.51–53
Reversal can be attempted by neutralizing or removing the offending drug. Activated charcoal may be able to reduce absorption of TSOACs that were recently ingested,44 and dabigatran can be removed by hemodialysis.
However, certain practical considerations may limit the use of dialysis in the perioperative period. Insertion of a temporary dialysis line in an anticoagulated patient poses additional bleeding risks. A standard 4-hour hemodialysis session may remove only about 70% of dabigatran from the plasma, which may not be enough to prevent perioperative bleeding.54 Dabigatran also tends to redistribute from adipose tissue back into plasma after each dialysis session.55 Serial sessions of high-flux intermittent hemodialysis or continuous renal replacement therapy may therefore be needed to counteract rebound elevations in the dabigatran concentration.
Reversal can also be attempted through activation of the coagulation cascade via other mechanisms. Fresh-frozen plasma is unlikely to be a practical solution for reversal.44 Although it can readily replace the clotting factors depleted by vitamin K antagonists, large volumes of fresh-frozen plasma would be needed to overwhelm thrombin or factor Xa inhibition by TSOACs.
There are limited data on the use of prothrombin complex concentrates or recombinant activated factor VIIa in patients on TSOACs, though their use can be considered.56 In a trial in 12 healthy participants, a nonactivated four-factor prothrombin complex concentrate containing factors II, VII, IX, and X immediately and completely reversed the anticoagulant effect of rivaroxaban but had no effect on dabigatran.57 Before 2013, there were no nonactivated four-factor prothrombin complex concentrates available in the United States. The FDA has since approved Kcentra for the urgent reversal of vitamin K antagonists, meaning that the reversal of TSOACs in major bleeding events would still be off-label.58 Giving any of the clotting factors carries a risk of thromboembolism.
Resumption of anticoagulation
TSOACs have a rapid onset of action, and therapeutic levels are reached within a few hours of administration.
Extrapolating from the ACCP guidelines, TSOACs can generally be restarted at therapeutic doses 24 hours after low-bleeding-risk procedures.2 Therapeutic dosing should be delayed 48 to 72 hours after a procedure with a high bleeding risk, assuming adequate hemostasis has been achieved. Prophylactic unfractionated heparin or low-molecular-weight heparin therapy can be given in the interim if deemed safe. Alternatively, for orthopedic patients ultimately transitioning back to therapeutic rivaroxaban after hip or knee arthroplasty, prophylactic rivaroxaban doses can be started 6 to 10 hours after surgery.14
There are numerous reasons why the resumption of TSOACs may have to be delayed after surgery, including nothing-by-mouth status, postoperative nausea and vomiting, ileus, gastric or bowel resection, and the anticipated need for future procedures. Since dabigatran capsules cannot be crushed, they cannot be given via nasogastric tube in patients with postoperative dysphagia. Parenteral anticoagulants should be used until these issues resolve.
Unfractionated heparin is still the preferred anticoagulant in unstable or potentially unstable patients, given its ease of monitoring, quick offset of action, and reversibility. When patients have stabilized, TSOACs can be resumed when the next dose of low-molecular-weight heparin would have been due or when the unfractionated heparin drip is discontinued.3,14,23
UNTIL EVIDENCE-BASED GUIDELINES ARE DEVELOPED
The development of TSOACs has ushered in an exciting new era for anticoagulant therapy. Providers involved in perioperative medicine will increasingly encounter patients on dabigatran, rivaroxaban, and apixaban. However, until evidence-based guidelines are developed for these new anticoagulants, clinicians will have to apply their knowledge of pharmacology and critically evaluate expert recommendations in order to manage patients safely throughout the perioperative period.
- Douketis JD, Berger PB, Dunn AS, et al; American College of Chest Physicians. The perioperative management of antithrombotic therapy: American College of Chest Physicians Evidence-Based Clinical Practice Guidelines (8th Edition). Chest 2008; 133(suppl 6):299S–339S.
- Douketis JD, Spyropoulos AC, Spencer FA, et al; American College of Chest Physicians. Perioperative management of antithrombotic therapy: Antithrombotic Therapy and Prevention of Thrombosis, 9th ed: American College of Chest Physicians Evidence-Based Clinical Practice Guidelines. Chest 2012; 141(suppl 2):e326S–e350S.
- Boehringer Ingelheim Pharmaceuticals, Inc. PRADAXA (dabigatran) package insert. http://bidocs.boehringer-ingelheim.com/BIWebAc-cess/ViewServlet.ser?docBase=renetnt&folderPath=/Prescribing%20Information/PIs/Pradaxa/Pradaxa.pdf. Accessed August 6, 2014.
- Levy JH, Faraoni D, Spring JL, Douketis JD, Samama CM. Managing new oral anticoagulants in the perioperative and intensive care unit setting. Anesthesiology 2013; 118:1466–1474.
- US Food and Drug Administration (FDA). FDA drug safety communication: update on the risk for serious bleeding events with the anticoagulant Pradaxa (dabigatran). www.fda.gov/drugs/drugsafety/ucm326580.htm. Accessed August 6, 2014.
- Connolly SJ, Ezekowitz MD, Yusuf S, et al; RE-LY Steering Committee and Investigators. Dabigatran versus warfarin in patients with atrial fibrillation. N Engl J Med 2009; 361:1139–1151.
- Schulman S, Kearon C, Kakkar AK, et al; RE-COVER Study Group. Dabigatran versus warfarin in the treatment of acute venous thromboembolism. N Engl J Med 2009; 361:2342–2352.
- Schulman S, Kearon C, Kakkar AK, et al; RE-MEDY Trial Investigators. Extended use of dabigatran, warfarin, or placebo in venous thromboembolism. N Engl J Med 2013; 368:709–718.
- Eriksson BI, Dahl OE, Rosencher N, Büller HR, et al; RE-NOVATE Study Group. Dabigatran etexilate versus enoxaparin for prevention of venous thromboembolism after total hip replacement: a randomised, double-blind, non-inferiority trial. Lancet 2007; 370:949–956.
- Eriksson BI, Dahl OE, Rosencher N, et al; RE-MODEL Study Group. Oral dabigatran etexilate vs subcutaneous enoxaparin for the prevention of venous thromboembolism after total knee replacement: the RE-MODEL randomized trial. J Thromb Haemost 2007; 5:2178–2185.
- Eikelboom JW, Connolly SJ, Brueckmann M, et al; RE-ALIGN Investigators. Dabigatran versus warfarin in patients with mechanical heart valves. N Engl J Med 2013; 369:1206–1214.
- Ageno W, Gallus AS, Wittkowsky A, Crowther M, Hylek EM, Palareti G; American College of Chest Physicians. Oral anticoagulant therapy: Antithrombotic Therapy and Prevention of Thrombosis, 9th ed: American College of Chest Physicians Evidence-Based Clinical Practice Guidelines. Chest 2012; 141(suppl 2):e44S–e88S.
- Blech S, Ebner T, Ludwig-Schwellinger E, Stangier J, Roth W. The metabolism and disposition of the oral direct thrombin inhibitor, dabigatran, in humans. Drug Metab Dispos 2008; 36:386–399.
- Janssen Pharmaceuticals, Inc. XARELTO (rivaroxaban) package insert. www.xareltohcp.com/about-xarelto/about-xarelto.html?utm_source=google&utm_medium=cpc&utm_campaign=Branded+-+Broad&utm_term=xarelto%20rivaroxaban&utm_content=Xarelto+Rivaroxaban|mkwid|sxSDxPb4m_dc|pcrid|34667840494. Accessed August 6, 2014.
- Patel MR, Mahaffey KW, Garg J, et al; ROCKET AF Investigators. Rivaroxaban versus warfarin in nonvalvular atrial fibrillation. N Engl J Med 2011; 365:883–391.
- EINSTEIN Investigators; Bauersachs R, Berkowitz SD, Brenner B, et al. Oral rivaroxaban for symptomatic venous thromboembolism. N Engl J Med 2010; 363:2499–2510.
- EINSTEIN–PE Investigators; Büller HR, Prins MH, Lensin AW, et al. Oral rivaroxaban for the treatment of symptomatic pulmonary embolism. N Engl J Med 2012; 366:1287–1297.
- Eriksson BI, Borris LC, Friedman RJ, et al; RECORD1 Study Group. Rivaroxaban versus enoxaparin for thromboprophylaxis after hip arthroplasty. N Engl J Med 2008; 358:2765–2775.
- Kakkar AK, Brenner B, Dahl OE, et al; RECORD2 Investigators. Extended duration rivaroxaban versus short-term enoxaparin for the prevention of venous thromboembolism after total hip arthroplasty: a double-blind, randomised controlled trial. Lancet 2008; 372:31–39.
- Lassen MR, Ageno W, Borris LC, et al; RECORD3 Investigators. Rivaroxaban versus enoxaparin for thromboprophylaxis after total knee arthroplasty. N Engl J Med 2008; 358:2776–2786.
- Kubitza D, Becka M, Mueck W, et al. Effects of renal impairment on the pharmacokinetics, pharmacodynamics and safety of rivaroxaban, an oral, direct factor Xa inhibitor. Br J Clin Pharmacol 2010; 70:703–712.
- Granger CB, Alexander JH, McMurray JJ, et al; ARISTOTLE Committees and Investigators. Apixaban versus warfarin in patients with atrial fibrillation. N Engl J Med 2011; 365:981–992.
- Bristol-Myers Squibb Company. ELIQUIS (apixaban) package insert. www.eliquis.com/index.aspx. Accessed August 6, 2014.
- Furie KL, Goldstein LB, Albers GW, et al; American Heart Association Stroke Council. Oral antithrombotic agents for the prevention of stroke in nonvalvular atrial fibrillation: a science advisory for healthcare professionals from the American Heart Association/American Stroke Association. Stroke 2012; 43:3442–3453.
- ClinicalTrials.gov, US National Institutes of Health. PERIOP 2 - A Safety and Effectiveness Study of LMWH Bridging Therapy Versus Placebo Bridging Therapy for Patients on Long Term Warfarin and Require Temporary Interruption of Their Warfarin. http://clinicaltri-als.gov/show/NCT00432796. Accessed August 6, 2014.
- ClinicalTrials.gov, US National Institutes of Health. Effectiveness of Bridging Anticoagulation for Surgery (The BRIDGE Study). http://clinicaltrials.gov/ct2/show/NCT00786474. Accessed August 6, 2014.
- Birnie DH, Healey JS, Wells GA, et al; BRUISE CONTROL Investigators. Pacemaker or defibrillator surgery without interruption of anticoagulation. N Engl J Med 2013; 368:2084–2093.
- Oberweis BS, Nukala S, Rosenberg A, et al. Thrombotic and bleeding complications after orthopedic surgery. Am Heart J 2013; 165:427.e1–433.e1.
- Omran H, Bauersachs R, Rübenacker S, Goss F, Hammerstingl C. The HAS-BLED score predicts bleedings during bridging of chronic oral anticoagulation. Results from the national multicentre BNK Online bRiDging REgistRy (BORDER). Thromb Haemost 2012; 108:65–73.
- Pisters R, Lane DA, Nieuwlaaat R, de Vos CB, Crijns HJGM, Lip GYH. A novel user-friendly score (HAS-BLED) to assess 1-year risk of major bleeding in patients with atrial fibrillation. The Euro Heart Survey. Chest 2010; 138:1093–1100.
- Kaatz S, Douketis JD, Zhou H, Gage BF, White RH. Risk of stroke after surgery in patients with and without chronic atrial fibrillation. J Thromb Haemost 2010; 8:884–890.
- van Ryn J, Stangier J, Haertter S, et al. Dabigatran etexilate—a novel, reversible, oral direct thrombin inhibitor: interpretation of coagulation assays and reversal of anticoagulant activity. Thromb Haemost 2010; 103:1116–1127.
- Connolly G, Spyropoulos AC. Practical issues, limitations, and periprocedural management of the NOAC’s. J Thromb Thrombolysis 2013; 36:212–222.
- Spyropoulos AC, Douketis JD. How I treat anticoagulated patients undergoing an elective procedure or surgery. Blood 2012; 120:2954–2962.
- Kaatz S, Kouides PA, Garcia DA, et al. Guidance on the emergent reversal of oral thrombin and factor Xa inhibitors. Am J Hematol 2012; 87(suppl 1):S141–S145.
- Rowley CP, Bernard ML, Brabham WW, et al. Safety of continuous anticoagulation with dabigatran during implantation of cardiac rhythm devices. Am J Cardiol 2013; 111:1165–1168.
- Healey JS, Eikelboom J, Douketis J, et al; RE-LY Investigators. Periprocedural bleeding and thromboembolic events with dabigatran compared with warfarin: results from the Randomized Evaluation of Long-Term Anticoagulation Therapy (RE-LY) randomized trial. Circulation 2012; 126:343–348.
- Sherwood MW, Douketis JD, Patel MR, et al; on behalf of the ROCKET AF Investigators. Outcomes of temporary interruption of rivaroxaban compared with warfarin in patients with nonvalvular atrial fibrillation: results from the Rivaroxaban Once Daily, Oral, Direct Factor Xa Inhibition Compared with Vitamin K Antagonism for Prevention of Stroke and Embolism Trial in Atrial Fibrillation (ROCKET AF). Circulation 2014; 129:1850–1859.
- Patel MR, Hellkamp AS, Lokhnygina Y, et al. Outcomes of discontinuing rivaroxaban compared with warfarin in patients with nonvalvular atrial fibrillation: analysis from the ROCKET AF trial (Rivaroxaban Once-Daily, Oral, Direct Factor Xa Inhibition Compared With Vitamin K Antagonism for Prevention of Stroke and Embolism Trial in Atrial Fibrillation). J Am Coll Cardiol 2013; 61:651–658.
- Reynolds MR. Discontinuation of rivaroxaban: filling in the gaps. J Am Coll Cardiol 2013; 61:659–660.
- Turpie AG, Kreutz R, Llau J, Norrving B, Haas S. Management consensus guidance for the use of rivaroxaban—an oral, direct factor Xa inhibitor. Thromb Haemost 2012; 108:876–886.
- Gallego P, Apostolakis S, Lip GY. Bridging evidence-based practice and practice-based evidence in periprocedural anticoagulation. Circulation 2012; 126:1573–1576.
- Sié P, Samama CM, Godier A, et al; Working Group on Perioperative Haemostasis. Surgery and invasive procedures in patients on long-term treatment with direct oral anticoagulants: thrombin or factor-Xa inhibitors. Recommendations of the Working Group on Perioperative Haemostasis and the French Study Group on Thrombosis and Haemostasis. Arch Cardiovasc Dis 2011; 104:669–676.
- King CS, Holley AB, Moores LK. Moving toward a more ideal anticoagulant: the oral direct thrombin and factor Xa inhibitors. Chest 2013; 143:1106–1116.
- Baglin T, Hillarp A, Tripodi A, Elalamy I, Buller H, Ageno W. Measuring oral direct inhibitors (ODIs) of thrombin and factor Xa: a recommendation from the Subcommittee on Control of Anticoagulation of the Scientific and Standardisation Committee of the International Society on Thrombosis and Haemostasis. J Thromb Haemost 2013; 11:756–760.
- Baglin T, Keeling D, Kitchen S; British Committee for Standards in Haematology. Effects on routine coagulation screens and assessment of anticoagulant intensity in patients taking oral dabigatran or rivaroxaban: guidance from the British Committee for Standards in Haematology. Br J Haematol 2012; 159:427–429.
- Mani H, Kasper A, Lindhoff-Last E. Measuring the anticoagulant effects of target specific oral anticoagulants—reasons, methods and current limitations. J Thromb Thrombolysis 2013; 36:187–194.
- Hawes EM, Deal AM, Funk-Adcock D, et al. Performance of coagulation tests in patients on therapeutic doses of dabigatran: a cross-sectional pharmacodynamic study based on peak and trough plasma levels. J Thromb Haemost 2013; 11:1493–1502.
- Barrett YC, Wang Z, Frost C, Shenker A. Clinical laboratory measurement of direct factor Xa inhibitors: anti-Xa assay is preferable to prothrombin time assay. Thromb Haemost 2010; 104:1263–1271.
- Smythe MA, Fanikos J, Gulseth MP, et al. Rivaroxaban: practical considerations for ensuring safety and efficacy. Pharmacotherapy 2013; 33:1223–1245.
- Van Ryn J, Litzenburger T, Waterman A, et al. Dabigatran anticoagulant activity is neutralized by an antibody selective to dabigatran in in vitro and in vivo models. J Am Coll Cardiol 2011; 57:E1130.
- Sheffield W, Lambourne M, Bhakta V, Eltringham-Smith L, Arnold D, Crowther M. Active site-mutated thrombin S195A but not active site-blocked thrombin counteracts the anticoagulant activity of dabigatran in plasma. Abstract presented at the International Society of Thrombosis and Haemostasis 2013 Congress. http://onlinelibrary.wiley.com/doi/10.1111/jth.2013.11.issue-s2/issuetoc. Accessed August 6, 2014.
- Lu G, Luan P, Hollenbach SJ, et al. Reconstructed recombinant factor Xa as an antidote to reverse anticoagulation by factor Xa inhibitors (abstract). J Thromb Haemost 2009; 7(suppl 2):abstract OC-TH-107.
- Stangier J, Rathgen K, Stähle H, Mazur D. Influence of renal impairment on the pharmacokinetics and pharmacodynamics of oral dabigatran etexilate: an open-label, parallel-group, single-centre study. Clin Pharmacokinet 2010; 49:259–268.
- Singh T, Maw TT, Henry BL, et al. Extracorporeal therapy for dabigatran removal in the treatment of acute bleeding: a single center experience. Clin J Am Soc Nephrol 2013; 8:1533–1539.
- Kaatz S, Crowther M. Reversal of target-specific oral anticoagulants. J Thromb Thrombolysis 2013; 36:195–202.
- Eerenberg ES, Kamphuisen PW, Sijpkens MK, Meijers JC, Buller HR, Levi M. Reversal of rivaroxaban and dabigatran by prothrombin complex concentrate: a randomized, placebo-controlled, crossover study in healthy subjects. Circulation 2011; 124:1573–1579.
- Sarode R, Milling TJ, Refaai MA, et al. Efficacy and safety of a 4-factor prothrombin complex concentrate in patients on vitamin K antagonists presenting with major bleeding: a randomized, plasma-controlled, phase IIIb study. Circulation 2013; 128:1234–1243.
More then 2.5 million patients in the United States are on long-term anticoagulation therapy for atrial fibrillation, venous thromboembolic disease, or mechanical heart valves,1 and the number is expected to rise as the population ages. Each year, about 10% of these patients undergo an invasive procedure or surgery that requires temporary interruption of anticoagulation.2
Most physicians are familiar with the perioperative management of warfarin, a vitamin K antagonist, since for decades it has been the sole oral anticoagulant available. However, many physicians lack experience with the three target-specific oral anticoagulants (TSOACs; also known as “novel” oral anticoagulants) approved so far: the direct thrombin inhibitor dabigatran (Pradaxa) and the direct factor Xa inhibitors rivaroxaban (Xarelto) and apixaban (Eliquis).
With their rapid onset of action, predictable pharmacokinetics, relatively short half-lives, and fewer drug-drug interactions than warfarin, TSOACs overcome many of the limitations of the older oral anticoagulant warfarin. In many ways, these qualities simplify the perioperative management of anticoagulation. At the same time, these new drugs also bring new challenges: caution is needed in patients with renal impairment; the level of anticoagulation is difficult to assess; and there is no specific antidote or standardized procedure to reverse their anticoagulant effect. While various periprocedural protocols for TSOAC therapy have been proposed, evidence-based guidelines are still to come.
This article first discusses the pharmacology of dabigatran, rivaroxaban, and apixaban that is pertinent to the perioperative period. It then briefly reviews the general principles of perioperative management of anticoagulation. The final section provides specific recommendations for the perioperative management of TSOACs.
PHARMACOLOGY OF TARGET-SPECIFIC ORAL ANTICOAGULANTS
Dabigatran, a factor IIa inhibitor
Dabigatran is an oral direct thrombin (factor IIa) inhibitor. It exerts its anticoagulant effect by blocking the generation of fibrin, inhibiting platelet aggregation, and dampening the activity of factors V, VIII, and XI (Figure 1).3,4 From its introduction in October 2010 through August 2012, nearly 3.7 million prescriptions were dispensed to 725,000 patients in the United States.5
Indications for dabigatran. Dabigatran is approved in the United States and Canada for preventing stroke in nonvalvular atrial fibrillation (Table 1).6 More recently, it received US approval for treating deep vein thrombosis or pulmonary embolism after 5 to 10 days of a parenteral anticoagulant.7,8 It is also approved in Europe and Canada for preventing venous thromboembolism (VTE) after total hip replacement and knee arthroplasty.9,10
Dabigatran is contraindicated in patients with a mechanical heart valve, based on a phase 2 study in which it conferred a higher risk of thromboembolism and bleeding than warfarin.3,11
Pharmacokinetics of dabigatran. Dabigatran is formulated as a prodrug, dabigatran etexilate, in a capsule containing multiple small pellets.12 The capsules should not be crushed, as this significantly increases oral bioavailability. The prodrug is absorbed across the gastric mucosa and is then rapidly converted to the active form (Table 2).
Plasma concentrations peak within 2 hours of ingestion, which means that therapeutic anticoagulation is achieved shortly after taking the drug.
Only 35% of dabigatran is protein-bound, which allows it to be removed by hemodialysis. Nearly 85% of the drug is eliminated in the urine. It has a half-life of 13 to 15 hours in patients with normal renal function.3 However, its half-life increases to about 27 hours in patients whose creatinine clearance is less than 30 mL/min. As a result, the dose must be reduced in patients with renal impairment (Table 1).
Dabigatran is not metabolized by the cytochrome P450 enzymes, but it is a substrate for P-glycoprotein, so it still has the potential for drug-drug interactions.3 Practitioners should be familiar with these potential interactions (Table 3), as they can result in higher- or lower-than-expected plasma concentrations of dabigatran in the perioperative period.13
Rivaroxaban, a factor Xa inhibitor
Rivaroxaban is an oral direct factor Xa inhibitor. It has been approved by the US Food and Drug Administration (FDA) for the prevention of stroke in nonvalvular atrial fibrillation, for VTE treatment, and for VTE prophylaxis after hip replacement or knee replacement (Table 1).14–20 It has not yet been studied in patients with hip fracture.
Pharmacokinetics of rivaroxaban. Rivaroxaban is manufactured as a tablet that is best absorbed in the stomach (Table 2).14 In contrast to dabigatran, it can be crushed and, for example, mixed with applesauce for patients who have trouble swallowing. It can also be mixed with water and given via nasogastric tube; however, postpyloric administration should be avoided.
Plasma concentrations peak within a few hours after ingestion. Rivaroxaban is highly protein-bound, so it cannot be eliminated by hemodialysis.
The drug relies on renal elimination to a smaller degree than dabigatran, with one-third of the dose eliminated unchanged in the urine, one-third eliminated in the urine as inactive metabolite, and the remaining one-third eliminated in the feces. However, enough parent compound is cleared through the kidneys that the half-life of rivaroxaban increases from 8.3 hours in healthy individuals to 9.5 hours in patients whose creatinine clearance is less than 30 mL/min.21 As with dabigatran, the dose must be adjusted for renal impairment (Table 1).
Rivaroxaban has significant liver metabolism, specifically through the cytochrome P450 3A4 enzyme, and it is also a substrate of P-glycoprotein. Therefore, potential drug-drug interactions must be taken into account, as they may lead to important alterations in plasma concentrations (Table 3).
Apixaban, a factor Xa inhibitor
Apixaban is also an oral direct factor Xa inhibitor. It is the newest of the oral anticoagulants to be approved in the United States, specifically for preventing stroke in nonvalvular atrial fibrillation (Table 1).22
Pharmacokinetics of apixaban. Apixaban is produced as a tablet that is absorbed slowly through the gastrointestinal tract, mainly the distal small bowel and ascending colon (Table 2).23
Peak plasma concentrations are reached a few hours after ingestion. Like rivaroxaban, apixaban is highly protein-bound, so it cannot be removed by hemodialysis.
Apixaban is similar to rivaroxaban in that 27% of the parent compound is cleared through the kidneys, it undergoes significant hepatic metabolism through cytochrome P450 3A4, and it is a substrate for P-glycoprotein.
Drug-drug interactions must be considered as a potential source of altered drug exposure and clearance (Table 3).
Unlike dabigatran and rivaroxaban, dose reduction is not based on the calculated creatinine clearance. Instead, a reduced dose is required if the patient meets two of the following three criteria:
- Serum creatinine level ≥ 1.5 mg/dL
- Age ≥ 80
- Weight ≤ 60 kg (Table 1).
The American Heart Association/American Stroke Association guidelines further recommend against using apixaban in patients with a creatinine clearance less than 25 mL/min.24
Edoxaban, a factor Xa inhibitor in development
Edoxaban (Savaysa), another factor Xa inhibitor, is available in Japan and has been submitted for approval in the United States for treating VTE and for preventing stroke in patients with
PERIOPERATIVE CONSIDERATIONS IN ANTICOAGULATION
Before addressing the perioperative management of TSOACs, let us review the evidence guiding the perioperative management of any chronic anticoagulant.
In fact, no large prospective randomized trial has clearly defined the risks and benefits of using or withholding a bridging anticoagulation strategy around surgery and other procedures, though the PERIOP 2 and BRIDGE trials are currently ongoing.25,26 There are some data regarding continuing anticoagulation without interruption, but they have mainly been derived from specific groups (eg, patients on warfarin undergoing cardiac pacemaker or defibrillator placement) and in procedures that pose a very low risk of bleeding complications (eg, minor dental extractions, cataract surgery, dermatologic procedures).2,27 Recommendations are, therefore, necessarily based on small perioperative trials and data gleaned from cohort review and from studies that did not involve surgical patients.
Ultimately, the decisions whether to discontinue oral anticoagulants and whether to employ bridging anticoagulation are based on assumptions about the risks of bleeding and the risk of thrombotic events, with similar assumptions regarding the effects of anticoagulants on both outcomes. In addition, the relative acceptance of bleeding vs thrombotic risks implicitly guides these complex decisions.
Perioperative bleeding risk
Many risk factors specific to the patient and to the type of surgery affect the rates and severity of perioperative bleeding.28
As for patient-specific risk factors, a small retrospective cohort analysis revealed that a HAS-BLED score of 3 or higher was highly discriminating in predicting perioperative bleeding in atrial fibrillation patients receiving anticoagulation.29 (The HAS-BLED score is based on hypertension, abnormal renal or liver function, stroke, bleeding, labile international normalized ratio [INR], elderly [age > 65] and drug therapy.30) However, there are no widely validated tools that incorporate patient-specific factors to accurately predict bleeding risk in an individual patient.
Therefore, the American College of Chest Physicians (ACCP) guidelines suggest coarsely categorizing bleeding risk as either low or high solely on the basis of the type of procedure.2 Procedures considered “high-risk” have a risk greater than 1.5% to 2% and include urologic surgery involving the prostate or kidney, colonic polyp resections, surgeries involving highly vascular organs such as the liver or spleen, joint replacements, cancer surgeries, and cardiac or neurosurgical procedures.
Perioperative thrombotic risk
The ACCP guidelines2 place patients with atrial fibrillation, VTE, or mechanical heart valves in three risk groups for perioperative thromboembolism without anticoagulation, based on their annual risk of a thrombotic event:
- High risk—annual risk of a thrombotic event > 10%
- Moderate risk—5% to 10%
- Low risk—< 5%.
Comparing the risks calculated by these methods with the real-world risk of perioperative thrombosis highlights the problem of applying nonperioperative risk calculations: the perioperative period exposes patients to a higher risk than these models would predict.31 Nonetheless, these risk categorizations likely have some validity in stratifying patients into risk groups, even if the absolute risks are inaccurate.
Perioperative bridging for patients taking warfarin
Many patients with atrial fibrillation, VTE, or a mechanical heart valve need to interrupt their warfarin therapy because of the bleeding risk of an upcoming procedure.
The perioperative management of warfarin and other vitamin K antagonists is challenging because of the pharmacokinetics and pharmacodynamics of these drugs. Because it has a long half-life, warfarin usually must be stopped 4 to 5 days before a procedure in order to allow not only adequate clearance of the drug itself, but also restoration of functional clotting factors to normal or near-normal levels.12 Warfarin can generally be resumed 12 to 24 hours after surgery, assuming adequate hemostasis has been achieved, and it will again take several days for the INR to reach the therapeutic range.
The ACCP guidelines recommend using the perioperative risk of thromboembolism to make decisions about the need for bridging anticoagulation during warfarin interruption.2 They suggest that patients at high risk of thrombosis receive bridging with an alternative anticoagulant such as low-molecular-weight heparin or unfractionated heparin, because of the prolonged duration of subtherapeutic anticoagulation.
There has been clinical interest in using a TSOAC instead of low-molecular-weight or unfractionated heparin for bridging in the perioperative setting. Although this approach may be attractive from a cost and convenience perspective, it cannot be endorsed as yet because of the lack of information on the pros and cons of such an approach.
Patients at low thrombotic risk do not require bridging. In patients at moderate risk, the decision to bridge or not to bridge is based on careful consideration of patient-specific and surgery-specific factors.
PERIOPERATIVE MANAGEMENT OF TARGET-SPECIFIC ORAL ANTICOAGULANTS
As summarized above, the perioperative management strategy for chronic anticoagulation is based on limited evidence, even for drugs as well established as warfarin.
The most recent ACCP guidelines on the perioperative management of antithrombotic therapy do not mention TSOACs.2 For now, the management strategy must be based on the pharmacokinetics of the drugs, package inserts from the manufacturers, and expert recommendations.3,14,23,32–34 Fortunately, because TSOACs have a more favorable pharmacokinetic profile than that of warfarin, their perioperative uses should be more streamlined. As always, the goal is to minimize the risk of both periprocedural bleeding and thromboembolism.
Timing of cessation of anticoagulation
The timing of cessation of TSOACs before an elective procedure depends primarily on two factors: the bleeding risk of the procedure and the patient’s renal function. Complete clearance of the medication is not necessary in all circumstances.
TSOACs should be stopped four to five half-lives before a procedure with a high bleeding risk, so that there is no or only minimal residual anticoagulant effect. The drug can be stopped two to three half-lives before a procedure with a low bleeding risk. Remember: the half-life increases as creatinine clearance decreases.
Specific recommendations may vary across institutions, but a suggested strategy is shown in Table 4.3,4,21,23,32–35 For the small subset of patients on P-glycoprotein or cytochrome P450 inhibitors or inducers, further adjustment in the time of discontinuation may be required.
Therapy does not need to be interrupted for procedures with a very low bleeding risk, as defined above.33,34 There is also preliminary evidence that TSOACs, similar to warfarin, may be continued during cardiac pacemaker or defibrillator placement.36
Evidence from clinical trials of perioperative TSOAC management
While the above recommendations are logical, studies are needed to prospectively evaluate perioperative management strategies.
The RE-LY trial (Randomized Evaluation of Long-Term Anticoagulation Therapy), which compared the effects of dabigatran and warfarin in preventing stroke in patients with atrial fibrillation, is one of the few clinical trials that also looked at periprocedural bleeding.37 About a quarter of the RE-LY participants required interruption of anticoagulation for a procedure.
Warfarin was managed according to local practices. For most of the study, the protocol required that dabigatran be discontinued 24 hours before a procedure, regardless of renal function or procedure type. The protocol was later amended and closely mirrored the management plan outlined in Table 4.
With either protocol, there was no statistically significant difference between dabigatran and warfarin in the rates of bleeding and thrombotic complications in the 7 days before or 30 days after the procedure.
A major limitation of the study was that most patients underwent a procedure with a low bleeding risk, so the analysis was likely underpowered to evaluate rates of bleeding in higher-risk procedures.
The ROCKET-AF trial (Rivaroxaban Once-daily Oral Direct Factor Xa Inhibition Compared With Vitamin K Antagonism for Prevention of Stroke and Embolism Trial in Atrial Fibrillation) also shed light on periprocedural bleeding.15 About 15% of the participants required temporary interruption of anticoagulation for a surgical or invasive procedure.38
The study protocol called for discontinuing rivaroxaban 2 days before any procedure. Warfarin was to be held for 4 days to achieve a goal INR of 1.5 or less.15
Rates of major and nonmajor clinically significant bleeding at 30 days were similar with rivaroxaban and with warfarin.38 As with the RE-LY trial, the retrospective analysis was probably underpowered for assessing rates of bleeding in procedures with higher risk.
Perioperative bridging
While stopping a TSOAC in the perioperative period decreases the risk of bleeding, it naturally increases the risk of thromboembolism. However, patients on TSOACs should not routinely require perioperative bridging with an alternative anticoagulant, regardless of thrombotic risk.
Of note, dabigatran, rivaroxaban, and apixaban carry black-box warnings that discontinuation places patients at higher risk of thrombotic events.3,14,23 These warnings further state that coverage with an alternative anticoagulant should be strongly considered during interruption of therapy for reasons other than pathologic bleeding.
However, it does not necessarily follow that perioperative bridging is required. For example, the warning for rivaroxaban is based on the finding in the ROCKET-AF trial that patients in the rivaroxaban group had higher rates of stroke than those in the warfarin group after the study drugs were stopped at the end of the trial.39 While there was initial concern that this could represent a prothrombotic rebound effect, the authors subsequently showed that patients in the rivaroxaban group were more likely to have had a subtherapeutic INR when transitioning to open-label vitamin-K-antagonist therapy.39,40 There was no difference in the rate of stroke or systemic embolism between the rivaroxaban and warfarin groups when anticoagulation was temporarily interrupted for a procedure.38
The risks and benefits of perioperative bridging with TSOACs are difficult to evaluate, given the dearth of trial data. In the RE-LY trial, only 17% of patients on dabigatran and 28% of patients on warfarin underwent periprocedural bridging.37 The selection criteria and protocol for bridging were not reported. In the ROCKET-AF trial, only 9% of patients received bridging therapy despite a mean CHADS2 score of 3.4.38 (The CHADS2 score is calculated as 1 point each for congestive heart failure, hypertension, age ≥ 75, and diabetes; 2 points for stroke or transient ischemic attack.) The decision to bridge or not was left to the individual investigator. As a result, the literature offers diverse opinions about the appropriateness of transitioning to an alternative anticoagulant.41–43
Bridging does not make sense in most instances, since anticoagulants such as low-molecular-weight heparin have pharmacokinetics similar to those of the available TSOACs and also depend on renal clearance.41 However, there may be situations in which patients must be switched to a parenteral anticoagulant such as unfractionated or low-molecular-weight heparin. For example, if a TSOAC has to be held, the patient has acute renal failure, and a needed procedure is still several days away, it would be reasonable to start a heparin drip for an inpatient at increased thrombotic risk.
In patients with normal renal function, these alternative anticoagulants should be started at the time the next TSOAC dose would have been due.3,14,23 In patients with reduced renal function, initiation of an alternative anticoagulant may need to be delayed 12 to 48 hours depending on which TSOAC is being used, as well as on the degree of renal dysfunction. This delay would help ensure that the onset of anticoagulation with the alternative anticoagulant is timed with the offset of therapeutic anticoagulation with the TSOAC.
Although limited, information from available coagulation assays may assist with the timing of initiation of an alternative anticoagulant (see the following section on laboratory monitoring). Serial testing with appropriate coagulation assays may help identify when most of a TSOAC has been cleared from a patient.
Laboratory monitoring
Inevitably, some patients on TSOACs require urgent or emergency surgery. In certain situations, such as before an orthopedic spine procedure, in which the complications of bleeding could be devastating, it may be necessary to know if any residual anticoagulant effect is present.
Monitoring dabigatran. As one might expect, direct thrombin inhibitors such as dabigatran can prolong the prothrombin time and activated partial thromboplastin time (aPTT).44–47 However, the prothrombin time is not recommended for assessing the level of anticoagulation from dabigatran. Many institutions may be using a normal aPTT to rule out therapeutic concentrations of dabigatran, based on results from early in vitro and ex vivo studies.46 While appealing from a practical standpoint, practitioners should exercise caution when relying on the aPTT to assess the risk of perioperative bleeding. A more recent investigation in patients treated with dabigatran found that up to 35% of patients with a normal aPTT still had a plasma concentration in the therapeutic range.48
The thrombin time and ecarin clotting time are more sensitive tests for dabigatran. A normal thrombin time or ecarin clotting time indicates that no or only minimal dabigatran is present.48 Unfortunately, these two tests often are either unavailable or are associated with long turnaround times, which limits their usefulness in the perioperative setting.
Monitoring rivaroxaban and apixaban. Factor Xa inhibitors such as rivaroxaban and apixaban can also influence the prothrombin time and aPTT (Figure 1).44–47,49,50 The aPTT is relatively insensitive to these drugs at low concentrations. It has been suggested that a normal prothrombin time can reasonably exclude therapeutic concentrations of rivaroxaban.45,46 However, the effects on the prothrombin time are highly variable, changing with the reagent used.49,50 In addition, apixaban appears to have less impact on the prothrombin time overall. The INR is not recommended for monitoring the effect of factor Xa inhibitors.
Anti-factor Xa assays likely represent the best option to provide true quantitative information on the level of anticoagulation with either rivaroxaban or apixaban. However, the assays must be specifically calibrated for each drug for results to be useful. (Anti-factor Xa assays cannot be used for heparin or low-molecular-weight heparin.) Further, most institutions do not yet have this capability. When appropriately calibrated, normal anti-factor Xa levels would exclude any effect of rivaroxaban or apixaban.
Reversal of anticoagulation
If patients on TSOACs require emergency surgery or present with significant bleeding in the setting of persistent anticoagulation, it may be necessary to try to reverse the anticoagulation.
Unlike warfarin or heparin, TSOACS do not have specific reversal agents, though specific antidotes are being developed. For example, researchers are evaluating antibodies capable of neutralizing dabigatran, as well as recombinant thrombin and factor Xa molecules that could antagonize dabigatran and rivaroxaban, respectively.51–53
Reversal can be attempted by neutralizing or removing the offending drug. Activated charcoal may be able to reduce absorption of TSOACs that were recently ingested,44 and dabigatran can be removed by hemodialysis.
However, certain practical considerations may limit the use of dialysis in the perioperative period. Insertion of a temporary dialysis line in an anticoagulated patient poses additional bleeding risks. A standard 4-hour hemodialysis session may remove only about 70% of dabigatran from the plasma, which may not be enough to prevent perioperative bleeding.54 Dabigatran also tends to redistribute from adipose tissue back into plasma after each dialysis session.55 Serial sessions of high-flux intermittent hemodialysis or continuous renal replacement therapy may therefore be needed to counteract rebound elevations in the dabigatran concentration.
Reversal can also be attempted through activation of the coagulation cascade via other mechanisms. Fresh-frozen plasma is unlikely to be a practical solution for reversal.44 Although it can readily replace the clotting factors depleted by vitamin K antagonists, large volumes of fresh-frozen plasma would be needed to overwhelm thrombin or factor Xa inhibition by TSOACs.
There are limited data on the use of prothrombin complex concentrates or recombinant activated factor VIIa in patients on TSOACs, though their use can be considered.56 In a trial in 12 healthy participants, a nonactivated four-factor prothrombin complex concentrate containing factors II, VII, IX, and X immediately and completely reversed the anticoagulant effect of rivaroxaban but had no effect on dabigatran.57 Before 2013, there were no nonactivated four-factor prothrombin complex concentrates available in the United States. The FDA has since approved Kcentra for the urgent reversal of vitamin K antagonists, meaning that the reversal of TSOACs in major bleeding events would still be off-label.58 Giving any of the clotting factors carries a risk of thromboembolism.
Resumption of anticoagulation
TSOACs have a rapid onset of action, and therapeutic levels are reached within a few hours of administration.
Extrapolating from the ACCP guidelines, TSOACs can generally be restarted at therapeutic doses 24 hours after low-bleeding-risk procedures.2 Therapeutic dosing should be delayed 48 to 72 hours after a procedure with a high bleeding risk, assuming adequate hemostasis has been achieved. Prophylactic unfractionated heparin or low-molecular-weight heparin therapy can be given in the interim if deemed safe. Alternatively, for orthopedic patients ultimately transitioning back to therapeutic rivaroxaban after hip or knee arthroplasty, prophylactic rivaroxaban doses can be started 6 to 10 hours after surgery.14
There are numerous reasons why the resumption of TSOACs may have to be delayed after surgery, including nothing-by-mouth status, postoperative nausea and vomiting, ileus, gastric or bowel resection, and the anticipated need for future procedures. Since dabigatran capsules cannot be crushed, they cannot be given via nasogastric tube in patients with postoperative dysphagia. Parenteral anticoagulants should be used until these issues resolve.
Unfractionated heparin is still the preferred anticoagulant in unstable or potentially unstable patients, given its ease of monitoring, quick offset of action, and reversibility. When patients have stabilized, TSOACs can be resumed when the next dose of low-molecular-weight heparin would have been due or when the unfractionated heparin drip is discontinued.3,14,23
UNTIL EVIDENCE-BASED GUIDELINES ARE DEVELOPED
The development of TSOACs has ushered in an exciting new era for anticoagulant therapy. Providers involved in perioperative medicine will increasingly encounter patients on dabigatran, rivaroxaban, and apixaban. However, until evidence-based guidelines are developed for these new anticoagulants, clinicians will have to apply their knowledge of pharmacology and critically evaluate expert recommendations in order to manage patients safely throughout the perioperative period.
- Douketis JD, Berger PB, Dunn AS, et al; American College of Chest Physicians. The perioperative management of antithrombotic therapy: American College of Chest Physicians Evidence-Based Clinical Practice Guidelines (8th Edition). Chest 2008; 133(suppl 6):299S–339S.
- Douketis JD, Spyropoulos AC, Spencer FA, et al; American College of Chest Physicians. Perioperative management of antithrombotic therapy: Antithrombotic Therapy and Prevention of Thrombosis, 9th ed: American College of Chest Physicians Evidence-Based Clinical Practice Guidelines. Chest 2012; 141(suppl 2):e326S–e350S.
- Boehringer Ingelheim Pharmaceuticals, Inc. PRADAXA (dabigatran) package insert. http://bidocs.boehringer-ingelheim.com/BIWebAc-cess/ViewServlet.ser?docBase=renetnt&folderPath=/Prescribing%20Information/PIs/Pradaxa/Pradaxa.pdf. Accessed August 6, 2014.
- Levy JH, Faraoni D, Spring JL, Douketis JD, Samama CM. Managing new oral anticoagulants in the perioperative and intensive care unit setting. Anesthesiology 2013; 118:1466–1474.
- US Food and Drug Administration (FDA). FDA drug safety communication: update on the risk for serious bleeding events with the anticoagulant Pradaxa (dabigatran). www.fda.gov/drugs/drugsafety/ucm326580.htm. Accessed August 6, 2014.
- Connolly SJ, Ezekowitz MD, Yusuf S, et al; RE-LY Steering Committee and Investigators. Dabigatran versus warfarin in patients with atrial fibrillation. N Engl J Med 2009; 361:1139–1151.
- Schulman S, Kearon C, Kakkar AK, et al; RE-COVER Study Group. Dabigatran versus warfarin in the treatment of acute venous thromboembolism. N Engl J Med 2009; 361:2342–2352.
- Schulman S, Kearon C, Kakkar AK, et al; RE-MEDY Trial Investigators. Extended use of dabigatran, warfarin, or placebo in venous thromboembolism. N Engl J Med 2013; 368:709–718.
- Eriksson BI, Dahl OE, Rosencher N, Büller HR, et al; RE-NOVATE Study Group. Dabigatran etexilate versus enoxaparin for prevention of venous thromboembolism after total hip replacement: a randomised, double-blind, non-inferiority trial. Lancet 2007; 370:949–956.
- Eriksson BI, Dahl OE, Rosencher N, et al; RE-MODEL Study Group. Oral dabigatran etexilate vs subcutaneous enoxaparin for the prevention of venous thromboembolism after total knee replacement: the RE-MODEL randomized trial. J Thromb Haemost 2007; 5:2178–2185.
- Eikelboom JW, Connolly SJ, Brueckmann M, et al; RE-ALIGN Investigators. Dabigatran versus warfarin in patients with mechanical heart valves. N Engl J Med 2013; 369:1206–1214.
- Ageno W, Gallus AS, Wittkowsky A, Crowther M, Hylek EM, Palareti G; American College of Chest Physicians. Oral anticoagulant therapy: Antithrombotic Therapy and Prevention of Thrombosis, 9th ed: American College of Chest Physicians Evidence-Based Clinical Practice Guidelines. Chest 2012; 141(suppl 2):e44S–e88S.
- Blech S, Ebner T, Ludwig-Schwellinger E, Stangier J, Roth W. The metabolism and disposition of the oral direct thrombin inhibitor, dabigatran, in humans. Drug Metab Dispos 2008; 36:386–399.
- Janssen Pharmaceuticals, Inc. XARELTO (rivaroxaban) package insert. www.xareltohcp.com/about-xarelto/about-xarelto.html?utm_source=google&utm_medium=cpc&utm_campaign=Branded+-+Broad&utm_term=xarelto%20rivaroxaban&utm_content=Xarelto+Rivaroxaban|mkwid|sxSDxPb4m_dc|pcrid|34667840494. Accessed August 6, 2014.
- Patel MR, Mahaffey KW, Garg J, et al; ROCKET AF Investigators. Rivaroxaban versus warfarin in nonvalvular atrial fibrillation. N Engl J Med 2011; 365:883–391.
- EINSTEIN Investigators; Bauersachs R, Berkowitz SD, Brenner B, et al. Oral rivaroxaban for symptomatic venous thromboembolism. N Engl J Med 2010; 363:2499–2510.
- EINSTEIN–PE Investigators; Büller HR, Prins MH, Lensin AW, et al. Oral rivaroxaban for the treatment of symptomatic pulmonary embolism. N Engl J Med 2012; 366:1287–1297.
- Eriksson BI, Borris LC, Friedman RJ, et al; RECORD1 Study Group. Rivaroxaban versus enoxaparin for thromboprophylaxis after hip arthroplasty. N Engl J Med 2008; 358:2765–2775.
- Kakkar AK, Brenner B, Dahl OE, et al; RECORD2 Investigators. Extended duration rivaroxaban versus short-term enoxaparin for the prevention of venous thromboembolism after total hip arthroplasty: a double-blind, randomised controlled trial. Lancet 2008; 372:31–39.
- Lassen MR, Ageno W, Borris LC, et al; RECORD3 Investigators. Rivaroxaban versus enoxaparin for thromboprophylaxis after total knee arthroplasty. N Engl J Med 2008; 358:2776–2786.
- Kubitza D, Becka M, Mueck W, et al. Effects of renal impairment on the pharmacokinetics, pharmacodynamics and safety of rivaroxaban, an oral, direct factor Xa inhibitor. Br J Clin Pharmacol 2010; 70:703–712.
- Granger CB, Alexander JH, McMurray JJ, et al; ARISTOTLE Committees and Investigators. Apixaban versus warfarin in patients with atrial fibrillation. N Engl J Med 2011; 365:981–992.
- Bristol-Myers Squibb Company. ELIQUIS (apixaban) package insert. www.eliquis.com/index.aspx. Accessed August 6, 2014.
- Furie KL, Goldstein LB, Albers GW, et al; American Heart Association Stroke Council. Oral antithrombotic agents for the prevention of stroke in nonvalvular atrial fibrillation: a science advisory for healthcare professionals from the American Heart Association/American Stroke Association. Stroke 2012; 43:3442–3453.
- ClinicalTrials.gov, US National Institutes of Health. PERIOP 2 - A Safety and Effectiveness Study of LMWH Bridging Therapy Versus Placebo Bridging Therapy for Patients on Long Term Warfarin and Require Temporary Interruption of Their Warfarin. http://clinicaltri-als.gov/show/NCT00432796. Accessed August 6, 2014.
- ClinicalTrials.gov, US National Institutes of Health. Effectiveness of Bridging Anticoagulation for Surgery (The BRIDGE Study). http://clinicaltrials.gov/ct2/show/NCT00786474. Accessed August 6, 2014.
- Birnie DH, Healey JS, Wells GA, et al; BRUISE CONTROL Investigators. Pacemaker or defibrillator surgery without interruption of anticoagulation. N Engl J Med 2013; 368:2084–2093.
- Oberweis BS, Nukala S, Rosenberg A, et al. Thrombotic and bleeding complications after orthopedic surgery. Am Heart J 2013; 165:427.e1–433.e1.
- Omran H, Bauersachs R, Rübenacker S, Goss F, Hammerstingl C. The HAS-BLED score predicts bleedings during bridging of chronic oral anticoagulation. Results from the national multicentre BNK Online bRiDging REgistRy (BORDER). Thromb Haemost 2012; 108:65–73.
- Pisters R, Lane DA, Nieuwlaaat R, de Vos CB, Crijns HJGM, Lip GYH. A novel user-friendly score (HAS-BLED) to assess 1-year risk of major bleeding in patients with atrial fibrillation. The Euro Heart Survey. Chest 2010; 138:1093–1100.
- Kaatz S, Douketis JD, Zhou H, Gage BF, White RH. Risk of stroke after surgery in patients with and without chronic atrial fibrillation. J Thromb Haemost 2010; 8:884–890.
- van Ryn J, Stangier J, Haertter S, et al. Dabigatran etexilate—a novel, reversible, oral direct thrombin inhibitor: interpretation of coagulation assays and reversal of anticoagulant activity. Thromb Haemost 2010; 103:1116–1127.
- Connolly G, Spyropoulos AC. Practical issues, limitations, and periprocedural management of the NOAC’s. J Thromb Thrombolysis 2013; 36:212–222.
- Spyropoulos AC, Douketis JD. How I treat anticoagulated patients undergoing an elective procedure or surgery. Blood 2012; 120:2954–2962.
- Kaatz S, Kouides PA, Garcia DA, et al. Guidance on the emergent reversal of oral thrombin and factor Xa inhibitors. Am J Hematol 2012; 87(suppl 1):S141–S145.
- Rowley CP, Bernard ML, Brabham WW, et al. Safety of continuous anticoagulation with dabigatran during implantation of cardiac rhythm devices. Am J Cardiol 2013; 111:1165–1168.
- Healey JS, Eikelboom J, Douketis J, et al; RE-LY Investigators. Periprocedural bleeding and thromboembolic events with dabigatran compared with warfarin: results from the Randomized Evaluation of Long-Term Anticoagulation Therapy (RE-LY) randomized trial. Circulation 2012; 126:343–348.
- Sherwood MW, Douketis JD, Patel MR, et al; on behalf of the ROCKET AF Investigators. Outcomes of temporary interruption of rivaroxaban compared with warfarin in patients with nonvalvular atrial fibrillation: results from the Rivaroxaban Once Daily, Oral, Direct Factor Xa Inhibition Compared with Vitamin K Antagonism for Prevention of Stroke and Embolism Trial in Atrial Fibrillation (ROCKET AF). Circulation 2014; 129:1850–1859.
- Patel MR, Hellkamp AS, Lokhnygina Y, et al. Outcomes of discontinuing rivaroxaban compared with warfarin in patients with nonvalvular atrial fibrillation: analysis from the ROCKET AF trial (Rivaroxaban Once-Daily, Oral, Direct Factor Xa Inhibition Compared With Vitamin K Antagonism for Prevention of Stroke and Embolism Trial in Atrial Fibrillation). J Am Coll Cardiol 2013; 61:651–658.
- Reynolds MR. Discontinuation of rivaroxaban: filling in the gaps. J Am Coll Cardiol 2013; 61:659–660.
- Turpie AG, Kreutz R, Llau J, Norrving B, Haas S. Management consensus guidance for the use of rivaroxaban—an oral, direct factor Xa inhibitor. Thromb Haemost 2012; 108:876–886.
- Gallego P, Apostolakis S, Lip GY. Bridging evidence-based practice and practice-based evidence in periprocedural anticoagulation. Circulation 2012; 126:1573–1576.
- Sié P, Samama CM, Godier A, et al; Working Group on Perioperative Haemostasis. Surgery and invasive procedures in patients on long-term treatment with direct oral anticoagulants: thrombin or factor-Xa inhibitors. Recommendations of the Working Group on Perioperative Haemostasis and the French Study Group on Thrombosis and Haemostasis. Arch Cardiovasc Dis 2011; 104:669–676.
- King CS, Holley AB, Moores LK. Moving toward a more ideal anticoagulant: the oral direct thrombin and factor Xa inhibitors. Chest 2013; 143:1106–1116.
- Baglin T, Hillarp A, Tripodi A, Elalamy I, Buller H, Ageno W. Measuring oral direct inhibitors (ODIs) of thrombin and factor Xa: a recommendation from the Subcommittee on Control of Anticoagulation of the Scientific and Standardisation Committee of the International Society on Thrombosis and Haemostasis. J Thromb Haemost 2013; 11:756–760.
- Baglin T, Keeling D, Kitchen S; British Committee for Standards in Haematology. Effects on routine coagulation screens and assessment of anticoagulant intensity in patients taking oral dabigatran or rivaroxaban: guidance from the British Committee for Standards in Haematology. Br J Haematol 2012; 159:427–429.
- Mani H, Kasper A, Lindhoff-Last E. Measuring the anticoagulant effects of target specific oral anticoagulants—reasons, methods and current limitations. J Thromb Thrombolysis 2013; 36:187–194.
- Hawes EM, Deal AM, Funk-Adcock D, et al. Performance of coagulation tests in patients on therapeutic doses of dabigatran: a cross-sectional pharmacodynamic study based on peak and trough plasma levels. J Thromb Haemost 2013; 11:1493–1502.
- Barrett YC, Wang Z, Frost C, Shenker A. Clinical laboratory measurement of direct factor Xa inhibitors: anti-Xa assay is preferable to prothrombin time assay. Thromb Haemost 2010; 104:1263–1271.
- Smythe MA, Fanikos J, Gulseth MP, et al. Rivaroxaban: practical considerations for ensuring safety and efficacy. Pharmacotherapy 2013; 33:1223–1245.
- Van Ryn J, Litzenburger T, Waterman A, et al. Dabigatran anticoagulant activity is neutralized by an antibody selective to dabigatran in in vitro and in vivo models. J Am Coll Cardiol 2011; 57:E1130.
- Sheffield W, Lambourne M, Bhakta V, Eltringham-Smith L, Arnold D, Crowther M. Active site-mutated thrombin S195A but not active site-blocked thrombin counteracts the anticoagulant activity of dabigatran in plasma. Abstract presented at the International Society of Thrombosis and Haemostasis 2013 Congress. http://onlinelibrary.wiley.com/doi/10.1111/jth.2013.11.issue-s2/issuetoc. Accessed August 6, 2014.
- Lu G, Luan P, Hollenbach SJ, et al. Reconstructed recombinant factor Xa as an antidote to reverse anticoagulation by factor Xa inhibitors (abstract). J Thromb Haemost 2009; 7(suppl 2):abstract OC-TH-107.
- Stangier J, Rathgen K, Stähle H, Mazur D. Influence of renal impairment on the pharmacokinetics and pharmacodynamics of oral dabigatran etexilate: an open-label, parallel-group, single-centre study. Clin Pharmacokinet 2010; 49:259–268.
- Singh T, Maw TT, Henry BL, et al. Extracorporeal therapy for dabigatran removal in the treatment of acute bleeding: a single center experience. Clin J Am Soc Nephrol 2013; 8:1533–1539.
- Kaatz S, Crowther M. Reversal of target-specific oral anticoagulants. J Thromb Thrombolysis 2013; 36:195–202.
- Eerenberg ES, Kamphuisen PW, Sijpkens MK, Meijers JC, Buller HR, Levi M. Reversal of rivaroxaban and dabigatran by prothrombin complex concentrate: a randomized, placebo-controlled, crossover study in healthy subjects. Circulation 2011; 124:1573–1579.
- Sarode R, Milling TJ, Refaai MA, et al. Efficacy and safety of a 4-factor prothrombin complex concentrate in patients on vitamin K antagonists presenting with major bleeding: a randomized, plasma-controlled, phase IIIb study. Circulation 2013; 128:1234–1243.
KEY POINTS
- How long before surgery to stop a TSOAC depends on the bleeding risk of the procedure and the patient’s renal function.
- Perioperative bridging is generally unnecessary for patients on TSOACs.
- Routine coagulation assays such as the prothrombin time and activated partial thromboplastin time do not reliably reflect the degree of anticoagulation with TSOACs.
- There are no specific antidotes or standardized reversal strategies for TSOACs.
- TSOACs have a rapid onset of action and should only be restarted postoperatively once hemostasis has been confirmed.
Can we reduce the risk of readmission for a patient with an exacerbation of COPD?
We think so. Some strategies to reduce readmission rates, such as coordinating care and managing comorbidities, apply to chronic diseases in general, while others are disease-specific. To reduce the need for hospital readmission for chronic obstructive pulmonary disease (COPD), coordinated efforts involving both inpatient and outpatient care are necessary. This can be achieved by using a checklist before discharge (Table 1) and by implementing outpatient COPD programs that continue patient education and provide rapid access to medical support if needed.
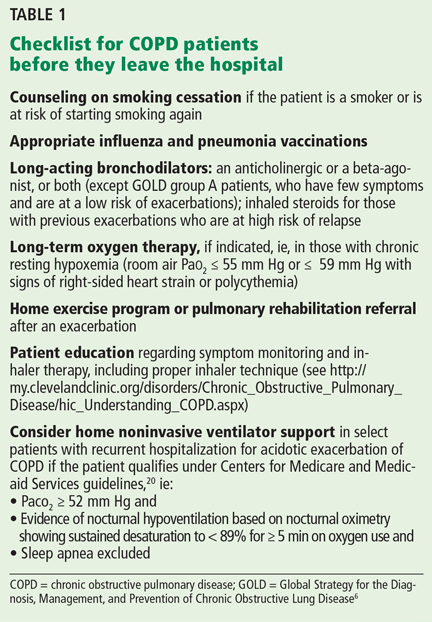
There is room for improvement. COPD is common and expensive, with high rates of hospital readmission,1 and up to 70% of the money we spend on it goes for hospital care.2 No wonder then that the Centers for Medicare and Medicaid Services has now expanded its Readmissions Reduction Program to include acute COPD exacerbations.3 Yet in a retrospective study, Yip et al4 found that fewer than half of patients hospitalized with acute exacerbation of COPD received appropriate vaccinations, counseling on smoking cessation, and long-acting inhalers—all of which are on our checklist.4
The following interventions have been demonstrated to be useful in reducing COPD hospital admissions and the risk of death.
SMOKING CESSATION
Cigarette smoking is the most common and easily identifiable risk factor for COPD exacerbation.5
Au et al5 found that quitting smoking reduces the risk of COPD exacerbation (adjusted hazard ratio 0.78, 95% confidence interval [CI] 0.75–0.87), and the risk keeps decreasing the longer the patient stays off tobacco.5
Whether counseling hospitalized patients on smoking cessation reduces the COPD readmission rate has not been well studied. However, a meta-analysis of nine randomized controlled trials, two of which were done in the hospital, revealed higher abstinence rates in COPD patients who received extensive counseling on smoking cessation.7 For these reasons, hospitalized COPD patients who smoke should be strongly encouraged to quit.6
PNEUMOCOCCAL AND INFLUENZA VACCINATIONS
In a large retrospective study,8 pneumococcal vaccination was associated with a significantly lower risk of hospitalization for pneumonia in patients with chronic lung disease, including those with COPD (relative risk [RR] 0.57, 95% CI 0.38–0.84). The benefit was even greater with pneumococcal and influenza vaccinations during the influenza season (RR 0.28, 95% CI 0.14–0.58).
Randomized controlled trials indicate that influenza vaccination may reduce the rate of COPD exacerbations, especially in epidemic years when the proportion of exacerbations due to influenza is higher.9
Wongsurakiat et al10 found a significant reduction in the incidence of influenza-related acute respiratory illness in COPD patients in a well-designed randomized, placebo-controlled trial (RR 0.24, P = .005).10
Similarly, in another randomized controlled trial, pneumococcal vaccination was effective in preventing community-acquired pneumonia in COPD patients under age 65 and in those with severe airflow obstruction, although no statistically significant differences were found among other groups of patients with COPD.11
Therefore, influenza and pneumococcal vaccinations are recommended by major COPD guidelines, such as GOLD (Global Strategy for the Diagnosis, Management, and Prevention of Chronic Obstructive Lung Disease).6
INHALERS
Inhaler therapy is recommended based on COPD severity according to GOLD classification, and appropriate inhaler therapy with proper inhaler technique reduces the number of COPD exacerbations and hospitalizations.6
Long-acting beta-agonists and anticholinergics reduce the risk of COPD exacerbation and hospitalization and so are preferred over short-acting formulations except for patients in GOLD group A, ie, those who have few symptoms and are at low risk of exacerbations.6
Long-term treatment with inhaled corticosteroids with long-acting bronchodilators is recommended for patients at high risk of exacerbations (ie, those with two or more exacerbations in the previous year or a forced expiratory volume in 1 second [FEV1] less than 50% of predicted).6
OXYGEN THERAPY
Two older randomized controlled trials, the Nocturnal Oxygen Therapy Trial and the Medical Research Council study, reviewed by Stoller et al,12 provided clear evidence that oxygen therapy reduces the death rate and improves quality of life in COPD patients who have chronic resting hypoxemia (room air Pao2 ≤ 55 mm Hg, or ≤ 59 mm Hg with signs of right-sided heart strain or polycythemia).
PULMONARY REHABILITATION
Pulmonary rehabilitation likely reduces hospital admissions by improving exercise capacity.13 A systematic review of six trials in 230 patients found that respiratory rehabilitation after an acute COPD exacerbation reduced the risk of COPD hospital admission (RR 0.26, 95% CI 0.12–0.54) and the risk of death (RR 0.45, 95% CI 0.22–0.91).13
OTHER INTERVENTIONS
Home noninvasive ventilator support reduced hospital and intensive care unit readmissions in select patients recurrently hospitalized for acidotic exacerbations of COPD in one small study.14
Long-term antibiotic therapy. Although there is evidence that azithromycin, taken daily for 1 year, decreases the frequency of COPD exacerbations,15 concern persists that this approach promotes antibiotic resistance, and the GOLD guidelines do not recommend routinely using antibiotics in patients with clinically stable COPD.6
Roflumilast. According to the GOLD guidelines, the phosphodiesterase-4 inhibitor roflumilast (Daliresp) may be useful in reducing exacerbations in patients who have an FEV1 less than 50% of predicted, chronic bronchitis, and frequent exacerbations.6
Referral. Patients who have severe recurrent COPD exacerbations despite appropriate therapy will likely benefit from referral to a pulmonary specialist for other options such as theophylline, lung-reduction surgery, and lung transplantation.
PATIENT EDUCATION AND OUTPATIENT COPD PROGRAMS
There is growing evidence that outpatient programs that provide education and medical support significantly reduce the rate of hospitalizations for COPD.16–18 Patient education includes symptom monitoring, early recognition of an exacerbation, appropriate use of inhalers and nebulizers, and advice on smoking cessation.16
On the other hand, a Veterans Administration randomized controlled trial was stopped early because of a higher rate of death in the group that underwent a comprehensive care-management program of COPD education, an action plan for identification and treatment of exacerbations, and scheduled proactive telephone calls for case management.19
Further study is needed to investigate the cost-effectiveness and safety of COPD management programs and whether to adopt such programs on a systematic level.
In conclusion, COPD patients require a comprehensive approach based on studied interventions. This may be achieved through systematic methods that allow each patient to benefit from all possible interventions appropriate for him or her. Hospitalization of COPD patients provides an excellent opportunity to implement this comprehensive approach.
- Westert GP, Lagoe RJ, Keskimäki I, Leyland A, Murphy M. An international study of hospital readmissions and related utilization in Europe and the USA. Health Policy 2002; 61:269–278.
- Halpern MT, Stanford RH, Borker R. The burden of COPD in the USA: results from the Confronting COPD survey. Respir Med 2003; 97(suppl C):S81–S89.
- Centers for Medicare and Medicaid Services. Readmissions reduction program. www.cms.gov/Medicare/Medicare-Fee-for-Service-Payment/AcuteInpatientPPS/Readmissions-Reduction-Program.html. Accessed August 9, 2014.
- Yip NH, Yuen G, Lazar EJ, et al. Analysis of hospitalizations for COPD exacerbation: opportunities for improving care. COPD 2010; 7:85–92.
- Au DH, Bryson CL, Chien JW, et al. The effects of smoking cessation on the risk of chronic obstructive pulmonary disease exacerbations. J Gen Intern Med 2009; 24:457–463.
- Vestbo J, Hurd SS, Agustí AG, et al. Global strategy for the diagnosis, management, and prevention of chronic obstructive pulmonary disease: GOLD executive summary. Am J Respir Crit Care Med 2013; 187:347–365.
- Thabane MCOPD Working Group. Smoking cessation for patients with chronic obstructive pulmonary disease (COPD): an evidence-based analysis. Ont Health Technol Assess Ser 2012; 12:1–50.
- Nichol KL, Baken L, Wuorenma J, Nelson A. The health and economic benefits associated with pneumococcal vaccination of elderly persons with chronic lung disease. Arch Intern Med 1999; 159:2437–2442.
- Poole PJ, Chacko E, Wood-Baker RW, Cates CJ. Influenza vaccine for patients with chronic obstructive pulmonary disease. Cochrane Database Syst Rev 2006; 1:CD002733.
- Wongsurakiat P, Maranetra KN, Wasi C, Kositanont U, Dejsomritrutai W, Charoenratanakul S. Acute respiratory illness in patients with COPD and the effectiveness of influenza vaccination: a randomized controlled study. Chest 2004; 125:2011–2020.
- Alfageme I, Vazquez R, Reyes N, et al. Clinical efficacy of anti-pneumococcal vaccination in patients with COPD. Thorax 2006; 61:189–195.
- Stoller JK, Panos RJ, Krachman S, Doherty DE, Make B; Long-term Oxygen Treatment Trial Research Group. Oxygen therapy for patients with COPD: current evidence and the long-term oxygen treatment trial. Chest 2010; 138:179–187.
- Puhan MA, Scharplatz M, Troosters T, Steurer J. Respiratory rehabilitation after acute exacerbation of COPD may reduce risk for readmission and mortality—a systematic review. Respir Res 2005; 6:54.
- Tuggey JM, Plant PK, Elliott MW. Domiciliary non-invasive ventilation for recurrent acidotic exacerbations of COPD: an economic analysis. Thorax 2003; 58:867–871.
- Albert RK, Connett J, Bailey WC, et al; COPD Clinical Research Network. Azithromycin for prevention of exacerbations of COPD. N Engl J Med 2011; 365:689–698.
- Lawlor M, Kealy S, Agnew M, et al. Early discharge care with ongoing follow-up support may reduce hospital readmissions in COPD. Int J Chron Obstruct Pulmon Dis 2009; 4:55–60.
- Gadoury MA, Schwartzman K, Rouleau M, et al; Chronic Obstructive Pulmonary Disease axis of the Respiratory Health Network, Fonds de la Recherche en Santé du Québec (FRSQ). Self-management reduces both short- and long-term hospitalisation in COPD. Eur Respir J 2005; 26:853–857.
- Rice KL, Dewan N, Bloomfield HE, et al. Disease management program for chronic obstructive pulmonary disease: a randomized controlled trial. Am J Respir Crit Care Med 2010; 182:890–896.
- Fan VS, Gaziano JM, Lew R, et al. A comprehensive care management program to prevent chronic obstructive pulmonary disease hospitalizations: a randomized, controlled trial. Ann Intern Med 2012; 156:673–683.
- COPD Working Group. Noninvasive positive pressure ventilation for chronic respiratory failure patients with stable chronic obstructive pulmonary disease (COPD): an evidence-based analysis. Ont Health Technol Assess Ser 2012; 12( 9):1–51.
We think so. Some strategies to reduce readmission rates, such as coordinating care and managing comorbidities, apply to chronic diseases in general, while others are disease-specific. To reduce the need for hospital readmission for chronic obstructive pulmonary disease (COPD), coordinated efforts involving both inpatient and outpatient care are necessary. This can be achieved by using a checklist before discharge (Table 1) and by implementing outpatient COPD programs that continue patient education and provide rapid access to medical support if needed.
There is room for improvement. COPD is common and expensive, with high rates of hospital readmission,1 and up to 70% of the money we spend on it goes for hospital care.2 No wonder then that the Centers for Medicare and Medicaid Services has now expanded its Readmissions Reduction Program to include acute COPD exacerbations.3 Yet in a retrospective study, Yip et al4 found that fewer than half of patients hospitalized with acute exacerbation of COPD received appropriate vaccinations, counseling on smoking cessation, and long-acting inhalers—all of which are on our checklist.4
The following interventions have been demonstrated to be useful in reducing COPD hospital admissions and the risk of death.
SMOKING CESSATION
Cigarette smoking is the most common and easily identifiable risk factor for COPD exacerbation.5
Au et al5 found that quitting smoking reduces the risk of COPD exacerbation (adjusted hazard ratio 0.78, 95% confidence interval [CI] 0.75–0.87), and the risk keeps decreasing the longer the patient stays off tobacco.5
Whether counseling hospitalized patients on smoking cessation reduces the COPD readmission rate has not been well studied. However, a meta-analysis of nine randomized controlled trials, two of which were done in the hospital, revealed higher abstinence rates in COPD patients who received extensive counseling on smoking cessation.7 For these reasons, hospitalized COPD patients who smoke should be strongly encouraged to quit.6
PNEUMOCOCCAL AND INFLUENZA VACCINATIONS
In a large retrospective study,8 pneumococcal vaccination was associated with a significantly lower risk of hospitalization for pneumonia in patients with chronic lung disease, including those with COPD (relative risk [RR] 0.57, 95% CI 0.38–0.84). The benefit was even greater with pneumococcal and influenza vaccinations during the influenza season (RR 0.28, 95% CI 0.14–0.58).
Randomized controlled trials indicate that influenza vaccination may reduce the rate of COPD exacerbations, especially in epidemic years when the proportion of exacerbations due to influenza is higher.9
Wongsurakiat et al10 found a significant reduction in the incidence of influenza-related acute respiratory illness in COPD patients in a well-designed randomized, placebo-controlled trial (RR 0.24, P = .005).10
Similarly, in another randomized controlled trial, pneumococcal vaccination was effective in preventing community-acquired pneumonia in COPD patients under age 65 and in those with severe airflow obstruction, although no statistically significant differences were found among other groups of patients with COPD.11
Therefore, influenza and pneumococcal vaccinations are recommended by major COPD guidelines, such as GOLD (Global Strategy for the Diagnosis, Management, and Prevention of Chronic Obstructive Lung Disease).6
INHALERS
Inhaler therapy is recommended based on COPD severity according to GOLD classification, and appropriate inhaler therapy with proper inhaler technique reduces the number of COPD exacerbations and hospitalizations.6
Long-acting beta-agonists and anticholinergics reduce the risk of COPD exacerbation and hospitalization and so are preferred over short-acting formulations except for patients in GOLD group A, ie, those who have few symptoms and are at low risk of exacerbations.6
Long-term treatment with inhaled corticosteroids with long-acting bronchodilators is recommended for patients at high risk of exacerbations (ie, those with two or more exacerbations in the previous year or a forced expiratory volume in 1 second [FEV1] less than 50% of predicted).6
OXYGEN THERAPY
Two older randomized controlled trials, the Nocturnal Oxygen Therapy Trial and the Medical Research Council study, reviewed by Stoller et al,12 provided clear evidence that oxygen therapy reduces the death rate and improves quality of life in COPD patients who have chronic resting hypoxemia (room air Pao2 ≤ 55 mm Hg, or ≤ 59 mm Hg with signs of right-sided heart strain or polycythemia).
PULMONARY REHABILITATION
Pulmonary rehabilitation likely reduces hospital admissions by improving exercise capacity.13 A systematic review of six trials in 230 patients found that respiratory rehabilitation after an acute COPD exacerbation reduced the risk of COPD hospital admission (RR 0.26, 95% CI 0.12–0.54) and the risk of death (RR 0.45, 95% CI 0.22–0.91).13
OTHER INTERVENTIONS
Home noninvasive ventilator support reduced hospital and intensive care unit readmissions in select patients recurrently hospitalized for acidotic exacerbations of COPD in one small study.14
Long-term antibiotic therapy. Although there is evidence that azithromycin, taken daily for 1 year, decreases the frequency of COPD exacerbations,15 concern persists that this approach promotes antibiotic resistance, and the GOLD guidelines do not recommend routinely using antibiotics in patients with clinically stable COPD.6
Roflumilast. According to the GOLD guidelines, the phosphodiesterase-4 inhibitor roflumilast (Daliresp) may be useful in reducing exacerbations in patients who have an FEV1 less than 50% of predicted, chronic bronchitis, and frequent exacerbations.6
Referral. Patients who have severe recurrent COPD exacerbations despite appropriate therapy will likely benefit from referral to a pulmonary specialist for other options such as theophylline, lung-reduction surgery, and lung transplantation.
PATIENT EDUCATION AND OUTPATIENT COPD PROGRAMS
There is growing evidence that outpatient programs that provide education and medical support significantly reduce the rate of hospitalizations for COPD.16–18 Patient education includes symptom monitoring, early recognition of an exacerbation, appropriate use of inhalers and nebulizers, and advice on smoking cessation.16
On the other hand, a Veterans Administration randomized controlled trial was stopped early because of a higher rate of death in the group that underwent a comprehensive care-management program of COPD education, an action plan for identification and treatment of exacerbations, and scheduled proactive telephone calls for case management.19
Further study is needed to investigate the cost-effectiveness and safety of COPD management programs and whether to adopt such programs on a systematic level.
In conclusion, COPD patients require a comprehensive approach based on studied interventions. This may be achieved through systematic methods that allow each patient to benefit from all possible interventions appropriate for him or her. Hospitalization of COPD patients provides an excellent opportunity to implement this comprehensive approach.
- Westert GP, Lagoe RJ, Keskimäki I, Leyland A, Murphy M. An international study of hospital readmissions and related utilization in Europe and the USA. Health Policy 2002; 61:269–278.
- Halpern MT, Stanford RH, Borker R. The burden of COPD in the USA: results from the Confronting COPD survey. Respir Med 2003; 97(suppl C):S81–S89.
- Centers for Medicare and Medicaid Services. Readmissions reduction program. www.cms.gov/Medicare/Medicare-Fee-for-Service-Payment/AcuteInpatientPPS/Readmissions-Reduction-Program.html. Accessed August 9, 2014.
- Yip NH, Yuen G, Lazar EJ, et al. Analysis of hospitalizations for COPD exacerbation: opportunities for improving care. COPD 2010; 7:85–92.
- Au DH, Bryson CL, Chien JW, et al. The effects of smoking cessation on the risk of chronic obstructive pulmonary disease exacerbations. J Gen Intern Med 2009; 24:457–463.
- Vestbo J, Hurd SS, Agustí AG, et al. Global strategy for the diagnosis, management, and prevention of chronic obstructive pulmonary disease: GOLD executive summary. Am J Respir Crit Care Med 2013; 187:347–365.
- Thabane MCOPD Working Group. Smoking cessation for patients with chronic obstructive pulmonary disease (COPD): an evidence-based analysis. Ont Health Technol Assess Ser 2012; 12:1–50.
- Nichol KL, Baken L, Wuorenma J, Nelson A. The health and economic benefits associated with pneumococcal vaccination of elderly persons with chronic lung disease. Arch Intern Med 1999; 159:2437–2442.
- Poole PJ, Chacko E, Wood-Baker RW, Cates CJ. Influenza vaccine for patients with chronic obstructive pulmonary disease. Cochrane Database Syst Rev 2006; 1:CD002733.
- Wongsurakiat P, Maranetra KN, Wasi C, Kositanont U, Dejsomritrutai W, Charoenratanakul S. Acute respiratory illness in patients with COPD and the effectiveness of influenza vaccination: a randomized controlled study. Chest 2004; 125:2011–2020.
- Alfageme I, Vazquez R, Reyes N, et al. Clinical efficacy of anti-pneumococcal vaccination in patients with COPD. Thorax 2006; 61:189–195.
- Stoller JK, Panos RJ, Krachman S, Doherty DE, Make B; Long-term Oxygen Treatment Trial Research Group. Oxygen therapy for patients with COPD: current evidence and the long-term oxygen treatment trial. Chest 2010; 138:179–187.
- Puhan MA, Scharplatz M, Troosters T, Steurer J. Respiratory rehabilitation after acute exacerbation of COPD may reduce risk for readmission and mortality—a systematic review. Respir Res 2005; 6:54.
- Tuggey JM, Plant PK, Elliott MW. Domiciliary non-invasive ventilation for recurrent acidotic exacerbations of COPD: an economic analysis. Thorax 2003; 58:867–871.
- Albert RK, Connett J, Bailey WC, et al; COPD Clinical Research Network. Azithromycin for prevention of exacerbations of COPD. N Engl J Med 2011; 365:689–698.
- Lawlor M, Kealy S, Agnew M, et al. Early discharge care with ongoing follow-up support may reduce hospital readmissions in COPD. Int J Chron Obstruct Pulmon Dis 2009; 4:55–60.
- Gadoury MA, Schwartzman K, Rouleau M, et al; Chronic Obstructive Pulmonary Disease axis of the Respiratory Health Network, Fonds de la Recherche en Santé du Québec (FRSQ). Self-management reduces both short- and long-term hospitalisation in COPD. Eur Respir J 2005; 26:853–857.
- Rice KL, Dewan N, Bloomfield HE, et al. Disease management program for chronic obstructive pulmonary disease: a randomized controlled trial. Am J Respir Crit Care Med 2010; 182:890–896.
- Fan VS, Gaziano JM, Lew R, et al. A comprehensive care management program to prevent chronic obstructive pulmonary disease hospitalizations: a randomized, controlled trial. Ann Intern Med 2012; 156:673–683.
- COPD Working Group. Noninvasive positive pressure ventilation for chronic respiratory failure patients with stable chronic obstructive pulmonary disease (COPD): an evidence-based analysis. Ont Health Technol Assess Ser 2012; 12( 9):1–51.
To improve our patients’ health, look beyond reducing readmissions
In this issue of the Cleveland Clinic Journal of Medicine, Drs. Ayache, Boyaji, and Pile share evidence-based strategies for reducing the risk of readmission for patients with acute exacerbations of chronic obstructive pulmonary disease (COPD).1 They emphasize standardizing practice by combining effective clinical management with appropriate patient education, communication, and postdischarge follow-up.
Reducing the rate of preventable hospital readmissions (as well as avoiding admissions in the first place) is the right thing to do for the patient. Moreover, broader adoption of the strategies that they outline in their article will be critical to the success of health care organizations in improving patient outcomes and navigating a rapidly evolving landscape of reimbursement and reporting changes associated with the Centers for Medicare and Medicaid Services (CMS) Readmissions Reduction Program. Hospital readmission rates, while imperfect measures of the quality of care, demonstrate opportunities to optimize transitions of care. Success in our efforts to improve the health of our patients will likely be aligned with reductions in preventable admissions and improved attention to care coordination.
HOSPITALS ARE PENALIZED FOR EXCESSIVE READMISSION RATES
With nearly 20% of Medicare beneficiaries being rehospitalized within 30 days of discharge, at a cost of $17 billion annually,2 Congress enacted the Hospital Readmissions Reduction Program3 as part of the Affordable Care Act (ACA) in 2012. The Centers for Medicare and Medicaid Services (CMS) had already been reporting the readmission rates for heart failure, acute myocardial infarction, and pneumonia since 2009 (www.medicare.gov/hospitalcompare). Building on this work, the Affordable Care Act implemented financial penalties against hospitals that had excessive rates of readmissions for these conditions.
The Affordable Care Act put 1% of a hospital’s Medicare base payment at risk for all inpatient diagnoses in 2013—not just the three listed here. The risk is 2% in 2014 and will rise to 3% in 2015. In its first year, more than 2,200 United States hospitals were penalized a total of approximately $280 million because of readmission rates above the national mean. Nearly 10% of hospitals incurred the maximum 1% penalty, and about 30% paid no penalty.
The Secretary of the Department of Health and Human Services has the authority to extend the Readmissions Reduction Program to additional high-volume or high-expenditure conditions, and the department has announced it will expand the program in October 2014 (fiscal year 2015) to include two additional conditions: elective hip or knee replacement and COPD.4 In both cases, CMS began by publicly reporting these rates before including them in the program. Additional readmission measures, including those for stroke and hospital-wide all-cause readmissions, are also publicly reported and receive increased attention but are not yet included in the Readmissions Reduction Program.
UNFAIRLY PENALIZING THOSE THAT SERVE THE POOR
Avoidable causes of readmissions include hospital-acquired infections and complications, inadequate medication reconciliation and management, poor communication and coordination of care among the members of the health care team, and suboptimal care transitions.5 But other important drivers of readmissions are outside of a hospital’s direct control. These include mental illness, lack of social support, and poverty.6
A criticism of the Readmissions Reduction Program is that it disproportionately penalizes hospitals that serve the poorest patients.7 Currently, CMS readmission risk models do not adjust for socioeconomic factors. Further, CMS responds to these concerns by noting that it does not want different outcome standards for poor patients, and that adjusting for these factors may conceal potential health care disparities in disadvantaged populations.
NEW MISSION FOR HOSPITALS: MITIGATE SOCIOECONOMIC BARRIERS
Effective programs to reduce hospital readmissions must address the clinical interventions and patient education needs in the COPD discharge checklist discussed by Ayache et al, but must also attempt to mitigate social disadvantages that drive up readmissions for patients at highest risk.
Are hospitals in a position to do this? Too often, it is assumed that patients have access to medications, transportation to follow-up appointments, and social support. Early identification of patients at highest risk of being affected by lack of these factors and innovative solutions for mitigating these risks are important considerations in our efforts to reduce hospital readmissions.
HOW MANY READMISSIONS ARE TRULY PREVENTABLE?
Experts disagree on how many readmissions are truly preventable. Readmission rates for the sickest patients treated at tertiary or academic medical centers may reflect high-quality care in well-managed patients who otherwise would have died during the index admission.8
In early studies, the Medicare Payment Advisory Commission estimated that up to three-quarters of readmissions are preventable.9 In contrast, studies that used clinical instead of administrative data suggest preventable readmissions make up as little as 12% of total readmissions.10
Regardless of the actual percentage, Medicare’s risk-adjustment model relies exclusively on administrative data that do not fully account for nonpreventable factors and do not completely address unrelated or planned rehospitalizations. CMS is attempting to address these issues with an expanded readmission algorithm that excludes more planned and unrelated readmissions from the penalty calculation.
Ironically, the current structure of the Readmissions Reduction Program does little to address its intended goal of eliminating the perverse financial incentives for hospitals and physicians to readmit patients. Payments are still episode-based and reward readmissions. The $280 million that CMS expects to receive from the program this year covers less than 5% of the nearly $12 billion attributed to preventable rehospitalizations.11
WHAT PATIENTS NEED, NOT WHAT SUITS PROVIDERS
Hospital readmission rates are publicly reported, but it is shortsighted to think about readmissions outside of the broader context of the “medical home.” One must consider the role of primary care providers before and after an index admission in addition to the role of postacute care providers for some patients after discharge. Neither is directly affected by the current penalty program, but both are critical to effective solutions and optimizing value-oriented care.
Readmission rates are suboptimal measures, as they address presumed failures of hospital transitions rather than measuring care coordination and providing meaningful incentives to coordinate care. Yes, there is much to do to ensure effective transitions from the hospital to home or postacute settings. But to truly transform health care and deliver value, shouldn’t we strive to redesign the work flow around what patients need rather than what suits providers?
This effort should focus on managing the conditions that bring patients to the hospital. Medical homes and optimizing chronic disease care can play pivotal roles in improving quality and reducing costs. Coordination of care and disease-management programs have led to cost reductions of 30% or more12 and have reduced admission rates by more than 10%.13 While the nation waits for health care reimbursement models to better reward patient quality outcomes and population health while reducing costs, we can use measures such as the Agency for Healthcare Research and Quality’s Prevention Quality Indicators to identify early interventions in the ambulatory care setting that can prevent admissions, complications, and exacerbation of disease.
Payers should also experiment with and promote innovative bundled-payment models such as Geisinger Health System’s ProvenCare program, which sets a fixed price for surgical procedures and up to 90 days of posthospital care, including readmission. These warranty-like programs overcome financial incentives to readmit patients in Medicare’s volume-based diagnosis-related group payment system.5
Re-engineering the delivery of care requires realigning resources to improve efficiency and effectiveness. In the short term, hospitals that successfully reduce readmission rates can expect reduced net reimbursements, as the penalties currently do not exceed the lost revenue of readmissions.
Reducing preventable readmissions is the right thing to do, but not all hospitalizations and rehospitalizations are avoidable. Many readmissions reflect appropriate and necessary care. The relentless focus on the readmission rate diverts attention and resources from more proactive solutions and innovative approaches for increasing health care safety, quality outcomes, and value.
Hospitals are caught between the volume and value paradigms. Payment programs that reward proactive disease management and care coordination will do the most to reduce health care costs and improve the quality of care. Hospitals have a responsibility to efficiently and effectively manage acute care and optimize handoffs to the next provider. Medicare’s payment policies do not do enough today to align the financial and quality-of-care incentives.
- Ayache MB, Boyaji S, Pile J. Can we reduce the risk of readmission for a patient with an exacerbation of COPD? Cleve Clin J Med 2014; 81:525–527.
- Jencks SF, Williams MV, Coleman EA. Rehospitalizations among patients in the Medicare fee-for-service program. N Engl J Med 2009; 360:1418–1428.
- Department of Health and Human Services. Medicare Program; Hospital Inpatient Prospective Payment Systems for Acute Care Hospitals and the Long-Term Care Hospital Prospective Payment System and FY 2012 Rates; Hospitals’ FTE Resident Caps for Graduate Medical Education Payment; Final Rule. Federal Register 2011; 76:51475–51846. www.gpo.gov/fdsys/pkg/FR-2011-08-18/pdf/2011-19719.pdf. Accessed August 5, 2014.
- Department of Health and Human Services. Medicare program; hospital inpatient prospective payment systems for acute care hospitals and the long term care; hospital prospective payment system and fiscal year 2014 rates; quality reporting requirements for specific providers; hospital conditions of participation; payment policies related to patient status; final rule. Federal Register 2013; 78:50495–51040. www.gpo.gov/fdsys/pkg/FR-2013-08-19/pdf/2013-18956.pdf. Accessed August 5, 2014.
- Berenson RA, Paulus RA, Kalman NS. Medicare’s readmissions-reduction program—a positive alternative. N Engl J Med 2012; 366:1364–1366.
- Joynt KE, Jha AK. Thirty-day readmissions—truth and consequences. N Engl J Med 2012; 366:1366–1369.
- Rau J. Medicare to penalize 2,217 hospitals for excess readmissions. Kaiser Health News 2012. www.kaiserhealthnews.org/stories/2012/august/13/medicare-hospitals-readmissions-penalties.aspx. Accessed August 5, 2014.
- Gorodeski EZ, Starling RC, Blackstone EH. Are all readmissions bad readmissions? N Engl J Med 2010; 363:297–298.
- Medicare Payment Advisory Commission. Report to the Congress: Promoting Greater Efficiency in Medicare, June 2007. www.medpac.gov/documents/jun07_entirereport.pdf. Accessed August 5, 2014.
- van Walraven C, Bennett C, Jennings A, Austin PC, Forster AJ. Proportion of hospital readmissions deemed avoidable: a systematic review. CMAJ 2011; 183:E391–E402.
- CMS Fee For Service IPPS Payment File, Fiscal Year 2014. cms.gov/Medicare/Medicare-Fee-for-Service-Payment/AcuteInpatientPPS/Downloads/FY_14_FR_Impact_File.zip. Accessed August 5, 2014.
- Dartmouth Medical School Center for the Evaluative Clinical Sciences. The Dartmouth Atlas of Health Care, 2006. www.dartmouthat-las.org/downloads/atlases/2006_Chronic_Care_Atlas.pdf. Accessed August 5, 2014.
- Gold W, Kongstvedt P. How broadening DM’s focus helped shrink one plan’s costs. Managed Care 2003. www.managedcaremag.com/archives/0311/0311.minnesota.html. Accessed August 5, 2014.
In this issue of the Cleveland Clinic Journal of Medicine, Drs. Ayache, Boyaji, and Pile share evidence-based strategies for reducing the risk of readmission for patients with acute exacerbations of chronic obstructive pulmonary disease (COPD).1 They emphasize standardizing practice by combining effective clinical management with appropriate patient education, communication, and postdischarge follow-up.
Reducing the rate of preventable hospital readmissions (as well as avoiding admissions in the first place) is the right thing to do for the patient. Moreover, broader adoption of the strategies that they outline in their article will be critical to the success of health care organizations in improving patient outcomes and navigating a rapidly evolving landscape of reimbursement and reporting changes associated with the Centers for Medicare and Medicaid Services (CMS) Readmissions Reduction Program. Hospital readmission rates, while imperfect measures of the quality of care, demonstrate opportunities to optimize transitions of care. Success in our efforts to improve the health of our patients will likely be aligned with reductions in preventable admissions and improved attention to care coordination.
HOSPITALS ARE PENALIZED FOR EXCESSIVE READMISSION RATES
With nearly 20% of Medicare beneficiaries being rehospitalized within 30 days of discharge, at a cost of $17 billion annually,2 Congress enacted the Hospital Readmissions Reduction Program3 as part of the Affordable Care Act (ACA) in 2012. The Centers for Medicare and Medicaid Services (CMS) had already been reporting the readmission rates for heart failure, acute myocardial infarction, and pneumonia since 2009 (www.medicare.gov/hospitalcompare). Building on this work, the Affordable Care Act implemented financial penalties against hospitals that had excessive rates of readmissions for these conditions.
The Affordable Care Act put 1% of a hospital’s Medicare base payment at risk for all inpatient diagnoses in 2013—not just the three listed here. The risk is 2% in 2014 and will rise to 3% in 2015. In its first year, more than 2,200 United States hospitals were penalized a total of approximately $280 million because of readmission rates above the national mean. Nearly 10% of hospitals incurred the maximum 1% penalty, and about 30% paid no penalty.
The Secretary of the Department of Health and Human Services has the authority to extend the Readmissions Reduction Program to additional high-volume or high-expenditure conditions, and the department has announced it will expand the program in October 2014 (fiscal year 2015) to include two additional conditions: elective hip or knee replacement and COPD.4 In both cases, CMS began by publicly reporting these rates before including them in the program. Additional readmission measures, including those for stroke and hospital-wide all-cause readmissions, are also publicly reported and receive increased attention but are not yet included in the Readmissions Reduction Program.
UNFAIRLY PENALIZING THOSE THAT SERVE THE POOR
Avoidable causes of readmissions include hospital-acquired infections and complications, inadequate medication reconciliation and management, poor communication and coordination of care among the members of the health care team, and suboptimal care transitions.5 But other important drivers of readmissions are outside of a hospital’s direct control. These include mental illness, lack of social support, and poverty.6
A criticism of the Readmissions Reduction Program is that it disproportionately penalizes hospitals that serve the poorest patients.7 Currently, CMS readmission risk models do not adjust for socioeconomic factors. Further, CMS responds to these concerns by noting that it does not want different outcome standards for poor patients, and that adjusting for these factors may conceal potential health care disparities in disadvantaged populations.
NEW MISSION FOR HOSPITALS: MITIGATE SOCIOECONOMIC BARRIERS
Effective programs to reduce hospital readmissions must address the clinical interventions and patient education needs in the COPD discharge checklist discussed by Ayache et al, but must also attempt to mitigate social disadvantages that drive up readmissions for patients at highest risk.
Are hospitals in a position to do this? Too often, it is assumed that patients have access to medications, transportation to follow-up appointments, and social support. Early identification of patients at highest risk of being affected by lack of these factors and innovative solutions for mitigating these risks are important considerations in our efforts to reduce hospital readmissions.
HOW MANY READMISSIONS ARE TRULY PREVENTABLE?
Experts disagree on how many readmissions are truly preventable. Readmission rates for the sickest patients treated at tertiary or academic medical centers may reflect high-quality care in well-managed patients who otherwise would have died during the index admission.8
In early studies, the Medicare Payment Advisory Commission estimated that up to three-quarters of readmissions are preventable.9 In contrast, studies that used clinical instead of administrative data suggest preventable readmissions make up as little as 12% of total readmissions.10
Regardless of the actual percentage, Medicare’s risk-adjustment model relies exclusively on administrative data that do not fully account for nonpreventable factors and do not completely address unrelated or planned rehospitalizations. CMS is attempting to address these issues with an expanded readmission algorithm that excludes more planned and unrelated readmissions from the penalty calculation.
Ironically, the current structure of the Readmissions Reduction Program does little to address its intended goal of eliminating the perverse financial incentives for hospitals and physicians to readmit patients. Payments are still episode-based and reward readmissions. The $280 million that CMS expects to receive from the program this year covers less than 5% of the nearly $12 billion attributed to preventable rehospitalizations.11
WHAT PATIENTS NEED, NOT WHAT SUITS PROVIDERS
Hospital readmission rates are publicly reported, but it is shortsighted to think about readmissions outside of the broader context of the “medical home.” One must consider the role of primary care providers before and after an index admission in addition to the role of postacute care providers for some patients after discharge. Neither is directly affected by the current penalty program, but both are critical to effective solutions and optimizing value-oriented care.
Readmission rates are suboptimal measures, as they address presumed failures of hospital transitions rather than measuring care coordination and providing meaningful incentives to coordinate care. Yes, there is much to do to ensure effective transitions from the hospital to home or postacute settings. But to truly transform health care and deliver value, shouldn’t we strive to redesign the work flow around what patients need rather than what suits providers?
This effort should focus on managing the conditions that bring patients to the hospital. Medical homes and optimizing chronic disease care can play pivotal roles in improving quality and reducing costs. Coordination of care and disease-management programs have led to cost reductions of 30% or more12 and have reduced admission rates by more than 10%.13 While the nation waits for health care reimbursement models to better reward patient quality outcomes and population health while reducing costs, we can use measures such as the Agency for Healthcare Research and Quality’s Prevention Quality Indicators to identify early interventions in the ambulatory care setting that can prevent admissions, complications, and exacerbation of disease.
Payers should also experiment with and promote innovative bundled-payment models such as Geisinger Health System’s ProvenCare program, which sets a fixed price for surgical procedures and up to 90 days of posthospital care, including readmission. These warranty-like programs overcome financial incentives to readmit patients in Medicare’s volume-based diagnosis-related group payment system.5
Re-engineering the delivery of care requires realigning resources to improve efficiency and effectiveness. In the short term, hospitals that successfully reduce readmission rates can expect reduced net reimbursements, as the penalties currently do not exceed the lost revenue of readmissions.
Reducing preventable readmissions is the right thing to do, but not all hospitalizations and rehospitalizations are avoidable. Many readmissions reflect appropriate and necessary care. The relentless focus on the readmission rate diverts attention and resources from more proactive solutions and innovative approaches for increasing health care safety, quality outcomes, and value.
Hospitals are caught between the volume and value paradigms. Payment programs that reward proactive disease management and care coordination will do the most to reduce health care costs and improve the quality of care. Hospitals have a responsibility to efficiently and effectively manage acute care and optimize handoffs to the next provider. Medicare’s payment policies do not do enough today to align the financial and quality-of-care incentives.
- Ayache MB, Boyaji S, Pile J. Can we reduce the risk of readmission for a patient with an exacerbation of COPD? Cleve Clin J Med 2014; 81:525–527.
- Jencks SF, Williams MV, Coleman EA. Rehospitalizations among patients in the Medicare fee-for-service program. N Engl J Med 2009; 360:1418–1428.
- Department of Health and Human Services. Medicare Program; Hospital Inpatient Prospective Payment Systems for Acute Care Hospitals and the Long-Term Care Hospital Prospective Payment System and FY 2012 Rates; Hospitals’ FTE Resident Caps for Graduate Medical Education Payment; Final Rule. Federal Register 2011; 76:51475–51846. www.gpo.gov/fdsys/pkg/FR-2011-08-18/pdf/2011-19719.pdf. Accessed August 5, 2014.
- Department of Health and Human Services. Medicare program; hospital inpatient prospective payment systems for acute care hospitals and the long term care; hospital prospective payment system and fiscal year 2014 rates; quality reporting requirements for specific providers; hospital conditions of participation; payment policies related to patient status; final rule. Federal Register 2013; 78:50495–51040. www.gpo.gov/fdsys/pkg/FR-2013-08-19/pdf/2013-18956.pdf. Accessed August 5, 2014.
- Berenson RA, Paulus RA, Kalman NS. Medicare’s readmissions-reduction program—a positive alternative. N Engl J Med 2012; 366:1364–1366.
- Joynt KE, Jha AK. Thirty-day readmissions—truth and consequences. N Engl J Med 2012; 366:1366–1369.
- Rau J. Medicare to penalize 2,217 hospitals for excess readmissions. Kaiser Health News 2012. www.kaiserhealthnews.org/stories/2012/august/13/medicare-hospitals-readmissions-penalties.aspx. Accessed August 5, 2014.
- Gorodeski EZ, Starling RC, Blackstone EH. Are all readmissions bad readmissions? N Engl J Med 2010; 363:297–298.
- Medicare Payment Advisory Commission. Report to the Congress: Promoting Greater Efficiency in Medicare, June 2007. www.medpac.gov/documents/jun07_entirereport.pdf. Accessed August 5, 2014.
- van Walraven C, Bennett C, Jennings A, Austin PC, Forster AJ. Proportion of hospital readmissions deemed avoidable: a systematic review. CMAJ 2011; 183:E391–E402.
- CMS Fee For Service IPPS Payment File, Fiscal Year 2014. cms.gov/Medicare/Medicare-Fee-for-Service-Payment/AcuteInpatientPPS/Downloads/FY_14_FR_Impact_File.zip. Accessed August 5, 2014.
- Dartmouth Medical School Center for the Evaluative Clinical Sciences. The Dartmouth Atlas of Health Care, 2006. www.dartmouthat-las.org/downloads/atlases/2006_Chronic_Care_Atlas.pdf. Accessed August 5, 2014.
- Gold W, Kongstvedt P. How broadening DM’s focus helped shrink one plan’s costs. Managed Care 2003. www.managedcaremag.com/archives/0311/0311.minnesota.html. Accessed August 5, 2014.
Perioperative beta-blockers in noncardiac surgery: The evidence continues to evolve
Prophylactic use of beta-blockers in the perioperative period is highly controversial. Initial studies in the 1990s were favorable, but evidence has been conflicting since then.
The pendulum swung away from routinely recommending beta-blockers after the publication of negative results from several studies, including the Perioperative Ischemic Evaluation (POISE) trial in 2008.1 Highlighting this change in practice, a Canadian study2 found that the use of perioperative beta-blockade increased between 1999 and 2005 but subsequently declined from 2005 to 2010. However, there was no appreciable change in this pattern after the POISE trial or after changes in the American College of Cardiology guidelines in 2002 and 2006.3
In 2008, Harte and Jaffer reviewed the perioperative use of beta-blockers in noncardiac surgery in this journal.4 Since then, a number of meta-analyses and retrospective observational studies have reported variable findings related to specific beta-blockers and specific complications.
In this paper, we review the rationale and recent evidence for and against the perioperative use of beta-blockers as guidance for internists and hospitalists.
POTENTIAL CARDIOPROTECTIVE EFFECTS OF BETA-BLOCKERS
Myocardial infarction and unstable angina are the leading cardiovascular causes of death after surgery.5 These events are multifactorial. Some are caused by the stress of surgery, which precipitates physiologic changes related to inflammatory mediators, sympathetic tone, and oxygen supply and demand; others are caused by acute plaque rupture, thrombosis, and occlusion.6 Most perioperative infarcts are non-Q-wave events7 and occur within the first 2 days after the procedure, when the effects of anesthetics, pain, fluid shifts, and physiologic changes are greatest. Because multiple causes may contribute to perioperative myocardial infarction, a single preventive strategy may not be sufficient.8,9
Beta-blockers do several things that may be beneficial in the perioperative setting. They reduce myocardial oxygen demand by decreasing the force of contraction and by slowing the heart rate, and slowing the heart rate increases diastolic perfusion time.10 They suppress arrhythmias; they limit leukocyte recruitment, the production of free radicals, metalloproteinase activity, monocyte activation, release of growth factors, and inflammatory cytokine response; and they stabilize plaque.11 Their long-term use may also alter intracellular signaling processes, thus improving cell survival by decreasing the expression of receptors for substances that induce apoptosis.12
INITIAL POSITIVE TRIALS
Mangano et al13 began the beta-blocker trend in 1996 with a study in 200 patients known to have coronary artery disease or risk factors for it who were undergoing noncardiac surgery. Patients were randomized to receive either atenolol orally and intravenously, titrated to control the heart rate, or placebo in the immediate perioperative period.
The atenolol group had less perioperative ischemia but no difference in short-term rates of myocardial infarction and death. However, the death rate was lower in the atenolol group at 6 months after discharge and at 2 years, although patients who died in the immediate postoperative period were excluded from the analysis.
Although this finding did not appear to make sense physiologically, we now know that patients may experience myocardial injury without infarction after noncardiac surgery, a phenomenon associated with an increased risk of death in the short term and the long term.14 Preventing these episodes may be the explanation for the improved outcome.
The DECREASE trial15 (Dutch Echocardiographic Cardiac Risk Evaluation Applying Stress Echocardiography) provided additional support for beta-blocker use. The patients were at high risk, had abnormal dobutamine stress echocardiograms, and were undergoing vascular surgery; 112 patients were randomized to receive either oral bisoprolol (started 1 month before surgery, titrated to control the heart rate, and continued for 1 month after surgery) or placebo.
The study was stopped early because the bisoprolol group reportedly had a 90% lower rate of myocardial infarction and cardiac death 1 month after surgery. However, the study was criticized because the total number of patients enrolled was small and the benefit was much greater than usual for any pharmacologic intervention, thus calling the results into question.
In a follow-up study,16 survivors continued to be followed while receiving bisoprolol or usual care. The incidence of myocardial infarction or cardiac death at 2 years was significantly lower in the group receiving bisoprolol (12% vs 32%, odds ratio [OR] 0.30, P = .025).
Boersma et al,17 in an observational study, analyzed data from all 1,351 patients scheduled for major vascular surgery being considered for enrollment in the DECREASE trial. The DECREASE protocol required patients to undergo dobutamine stress echocardiography if they had one or more risk factors (age 70 or older, angina, prior myocardial infarction, congestive heart failure, treatment for ventricular arrhythmia, treatment for diabetes mellitus, or limited exercise capacity) or if their physician requested it. Twenty-seven percent received beta-blockers.
In multivariate analysis, clinical predictors of adverse outcome were age 70 or older; current or prior history of angina; and prior myocardial infarction, heart failure, or cerebrovascular accident.
In patients who had fewer than three clinical risk factors, beta-blocker use was associated with a lower rate of complications (0.8% vs 2.3%). Dobutamine stress echocardiography had minimal predictive value in this lower-risk group, suggesting that stress testing may not be necessary in this group if beta-blockers are used appropriately. However, in patients who had three or more risk factors, this test did provide additional prognostic information; those without stress-induced ischemia had lower event rates than those with ischemia, and beta-blocker use further reduced those rates, except in patients with extensive ischemia (more than five left ventricular segments involved).
The Revised Cardiac Risk Index. Lee et al18 devised an index to assist in preoperative cardiac risk stratification that was subsequently incorporated into the 2007 American College of Cardiology/American Heart Association preoperative risk guidelines. (It does not, however, address the beta-blocker issue.) It consists of six independent risk-predictors of major cardiac complications derived from 4,315 patients over age 50 undergoing non-cardiac surgery. The risk factors, each of which is given 1 point, are:
- Congestive heart failure based on history or examination
- Renal insufficiency (serum creatinine level > 2 mg/dL)
- Myocardial infarction, symptomatic ischemic heart disease, or a positive stress test
- History of transient ischemic attack or stroke
- Diabetes requiring insulin
- High-risk surgery (defined as intrathoracic, intra-abdominal, or suprainguinal vascular surgery).
Patients with 3 or more points are considered to be at high risk, and those with 1 or 2 points are considered to be at intermediate risk. The American College of Cardiology/American Heart Association preoperative cardiac risk algorithm subsequently included five of these six risk factors (the type of surgery was considered separately) and made recommendations concerning noninvasive stress testing and heart rate control.
On the basis of these studies, specialty societies, guideline committees, and hospitals enthusiastically recommended the prophylactic use of beta-blockers to decrease postoperative cardiac complications.
THREE NEGATIVE TRIALS OF METOPROLOL
In 2005 and 2006, two studies in vascular surgery patients and another in patients with diabetes cast doubt on the role of beta-blockers when the results failed to show a benefit. The trials used metoprolol, started shortly before surgery, and with no titration to control the heart rate.
The MaVS study19 (Metoprolol After Vascular Surgery) randomized 496 patients to receive metoprolol or placebo 2 hours before surgery and until hospital discharge or a maximum of 5 days after surgery. The metoprolol dose varied by weight: patients weighing 75 kg or more got 100 mg, those weighing between 40 and 75 kg got 50 mg, and those weighing less than 40 kg got 25 mg. Overall effects at 6 months were not significantly different, but intraoperative bradycardia and hypotension requiring intervention were more frequent in the metoprolol group.
The POBBLE study20 (Perioperative Beta Blockade) randomized 103 patients who had no history of myocardial infarction to receive either metoprolol 50 mg twice daily or placebo from admission to 7 days after surgery. Myocardial ischemia was present in one-third of the patients after surgery. Metoprolol did not reduce the 30-day cardiac mortality rate, but it was associated with a shorter length of stay.
The DIPOM trial21 (Diabetic Postoperative Mortality and Morbidity) randomized 921 diabetic patients to receive long-acting metoprolol succinate controlled-release/extended release (CR/XL) or placebo. Patients in the metoprolol group received a test dose of 50 mg the evening before surgery, another dose 2 hours before surgery (100 mg if the heart rate was more than 65 bpm, or 50 mg if between 55 and 65 bpm), and daily thereafter until discharge or a maximum of 8 days. The dose was not titrated to heart-rate control.
Metoprolol had no statistically significant effect on the composite primary outcome measures of time to death from any cause, acute myocardial infarction, unstable angina, or congestive heart failure or on the secondary outcome measures of time to death from any cause, death from a cardiac cause, and nonfatal cardiac morbidity.
ADDITIONAL POSITIVE STUDIES
Lindenauer et al22 retrospectively evaluated the use of beta-blockers in the first 2 days after surgery in 782,969 patients undergoing non-cardiac surgery. Using propensity score matching and Revised Cardiac Risk Index scores, they found a lower rate of postoperative mortality in patients with three or more risk factors who received a beta-blocker. There was no significant difference in the group with two risk factors, but in the lowest-risk group (with a score of 0 to 1), beta-blockers were not beneficial and may have been associated with harm as evidenced by a higher odds ratio for death, although this was probably artifactual and reflecting database limitations.
Feringa et al,23 in an observational cohort study of 272 patients undergoing vascular surgery, reported that higher doses of beta-blockers and tight heart-rate control were associated with less perioperative myocardial ischemia, lower troponin T levels, and better long-term outcome.
THE POISE TRIAL: MIXED RESULTS
The randomized POISE trial,1 published in 2008, compared the effects of extended-release metoprolol succinate vs placebo on the 30-day risk of major cardiovascular events in 8,351 patients with or at risk of atherosclerotic disease who were undergoing noncardiac surgery. The metoprolol regimen was 100 mg 2 to 4 hours before surgery, another 100 mg by 6 hours after surgery, and then 200 mg 12 hours later and once daily for 30 days.
The incidence of the composite primary end point of cardiovascular death, nonfatal myocardial infarction, and nonfatal cardiac arrest at 30 days was lower in the metoprolol group than in the placebo group (5.8% vs 6.9%; P = .04), primarily because of fewer nonfatal myocardial infarctions. However, more patients in the metoprolol group died of any cause (3.1% vs 2.3% P = .03) or had a stroke (1.0% vs 0.5% P = .005) than in the placebo group.
The metoprolol group had a higher incidence of clinically significant hypotension, bradycardia, and stroke, which could account for much of the increase in the mortality rate. Sepsis was the major cause of death in this group; hypotension may have increased the risk of infection, and beta-blockers may have potentiated hypotension in patients who were already septic. Also, the bradycardic and negative inotropic effects of the beta-blocker could have masked the physiologic response to systemic infection, thereby delaying recognition and treatment or impeding the normal immune response.
One of the major criticisms of the POISE trial was its aggressive dosing regimen (200 to 400 mg within a 36-hour period) in patients who had not been on beta-blockers before then. Also, the drug was started only a few hours before surgery. In addition, these patients were at higher risk of death and stroke than those in other trials based on a high baseline rate of cerebrovascular disease, and inclusion of urgent and emergency surgical procedures.
STUDIES SINCE POISE
The POISE trial results1 prompted further questioning of the prophylactic perioperative use of beta-blockers. However, proponents of beta-blockers voiced serious criticisms of the trial, particularly the dosing regimen, and continued to believe that these drugs were beneficial if used appropriately.
The DECREASE IV trial. Dunkelgrun et al,24 in a study using bisoprolol started approximately 1 month before surgery and titrated to control the heart rate, reported beneficial results in intermediate-risk patients. In their randomized open-label study with a 2 × 2 factorial design, 1,066 patients at intermediate cardiac risk were assigned to receive bisoprolol, fluvastatin, combination treatment, or control therapy at least 34 days before surgery. Bisoprolol was started at 2.5 mg orally daily and slowly titrated up to a maximum dose of 10 mg to keep the heart rate between 50 and 70 beats per minute. The group of 533 patients randomized to receive bisoprolol had a lower incidence rate of cardiac death and nonfatal myocardial infarction than the control group (2.1% vs 6.0%, HR 0.34, P = .002). A potential limitation of this study was its open-label design, which might have led to treatment bias.
Updated guidelines. Based on the results from POISE and DECREASE IV, the American College of Cardiology Foundation/American Heart Association Task Force on Practice Guidelines25 published a focused update on beta-blockers in 2009 as an amendment to their 2007 guidelines on perioperative evaluation and care for noncardiac surgery. The European Society of Cardiology26 released similar but somewhat more liberal guidelines (Table 1).
London et al,27 in an observational study published in 2013, found a lower 30-day overall mortality rate with beta-blockers (relative risk [RR] 0.73, 95% confidence interval [CI] 0.65–0.83, P < .001, number needed to treat [NNT] 241), as well as a lower rate of cardiac morbidity (nonfatal myocardial infarction and cardiac death), but only in nonvascular surgery patients who were on beta-blockers within 7 days of scheduled surgery. Moreover, similar to the findings of Lindenauer et al,22 only patients with a Revised Cardiac Risk Index score of 2 or more benefited from beta-blocker use in terms of a lower risk of death, whereas the lower-risk patients did not:
- Risk score of 0 or 1—no association
- Score of 2—RR 0.63, 95% CI 0.50–0.80, P < .001, NNT 105
- Score of 3—RR 0.54, 95% CI 0.39–0.73, P < .001, NNT 41
- Score of 4 or more—RR 0.40, 95% CI 0.24–0.73, P < .001, NNT 18).
Beta-blocker exposure was associated with a significantly lower rate of cardiac complications (RR 0.67, 95% CI 0.57–0.79, P < .001, NNT 339), also limited to nonvascular surgery patients with a risk score of 2 or 3.
The Danish Nationwide Cohort Study28 examined the effect of beta-blockers on major adverse cardiac events (MACE, ie, myocardial infarction, cerebrovascular accident, and death) in 28,263 patients with ischemic heart disease undergoing noncardiac surgery; 7,990 with heart failure and 20,273 without. Beta-blockers were used in 53% of patients with heart failure and 36% of those without heart failure. Outcomes for all of the beta-blocker recipients:
- MACE—HR 0.90, 95% CI 0.79–1.02
- All-cause mortality—HR 0.95, 95% CI 0.85–1.06.
Outcomes for patients with heart failure if they received beta-blockers:
- MACE—HR 0.75, 95% CI 0.70–0.87
- All-cause mortality—HR 0.80, 95% CI 0.70–0.92.
There was no significant benefit from beta-blockers in patients without heart failure. Outcomes for those patients if they received beta-blockers:
- MACE—HR 1.11, 95% CI 0.92–1.33
- All-cause mortality—HR 1.15, 95% CI 0.98–1.35.
However, in patients without heart failure but with a history of myocardial infarction within the past 2 years, beta-blockers were associated with a lower risk of MACE and all-cause mortality. In patients with neither heart failure nor a recent myocardial infarction, beta-blockers were associated with an increased risk of MACE and all-cause mortality.
This difference in efficacy depending on the presence and timing of a prior myocardial infarction is consistent with the 2012 American College of Cardiology/American Heart Association guidelines for secondary prevention, in which beta-blockers are given a class I recommendation only for patients with a myocardial infarction within the past 3 years.
Meta-analyses and outcomes
A number of meta-analyses have been published over the past 10 years, with conflicting results (Table 2). The divergent findings are primarily due to the different studies included in the analyses as well as the strong influence of the POISE trial.1 The studies varied in terms of the specific beta-blocker used, dose titration and heart rate control, time of initiation of beta-blocker use before surgery, type of surgery, patient characteristics, comorbidities, biomarkers and diagnosis of myocardial infarction, and clinical end points.
In general, these meta-analyses have found that prophylactic perioperative use of beta-blockers decreases ischemia and tends to reduce the risk of nonfatal myocardial infarction. They vary on whether the overall mortality risk is decreased. The meta-analyses that included POISE1 found an increased incidence of stroke, whereas those that excluded POISE found no significant difference, although there appeared to be slightly more strokes in the beta-blocker groups.
The beta-blocker controversy increased even further when Dr. Don Poldermans was fired by Erasmus Medical Center in November 2011 for violations of academic integrity involving his research, including the DECREASE trials. The most recent meta-analysis, by Bouri et al,29 included nine “secure trials” and excluded the DECREASE trials in view of the controversy about their authenticity. The analysis showed an increase in overall mortality as well as stroke, primarily because it was heavily influenced by POISE.1 In contrast, the DECREASE trials had reported a decreased risk of myocardial infarction and death, with no significant increase in stroke. The authors concluded that guideline bodies should “retract their recommendations based on the fictitious data without further delay.”29
Although the design of the DECREASE trials (in which beta-blockers were started well in advance of surgery and doses were titrated to achieve heart rate control) is physiologically more compelling than those of the negative trials, the results have been questioned in light of the integrity issue. However, to date, none of the published DECREASE trials have been retracted.
Two other meta-analyses,30,31 published in 2013, also found a decreased risk of myocardial infarction and increased risk of stroke but no significant difference in short-term all-cause mortality.
ARE ALL BETA-BLOCKERS EQUIVALENT?
In various studies evaluating specific beta-blockers, the more cardioselective agents bisoprolol and atenolol were associated with better outcomes than metoprolol. The affinity ratios for beta-1/beta-2 receptors range from 13.5 for bisoprolol to 4.7 for atenolol and 2.3 for metoprolol.32 Blocking beta-1 receptors blunts tachycardia, whereas blocking beta-2 receptors may block systemic or cerebral vasodilation.
In patients with anemia, beta-blockade in general may be harmful, but beta-2 blockade may be even worse. Beta-blockers were associated with an increased risk of MACE (6.5% vs 3.0%)33 in patients with acute surgical anemia if the hemoglobin concentration decreased to less than 35% of baseline, and increased risks of hospital death (OR 6.65) and multiorgan dysfunction syndrome (OR 4.18) with severe bleeding during aortic surgery.34
In addition, the pathway by which the beta-blocker is metabolized may also affect outcome, with less benefit from beta-blockers metabolized by the CYP2D6 isoenzyme of the cytochrome P450 system. Individual variations in CYP2D6 activity related to genetics or drug interactions may result in insufficient or excessive beta-blockade. Because metoprolol is the most dependent on this system, patients using it may be more susceptible to bradycardia.35
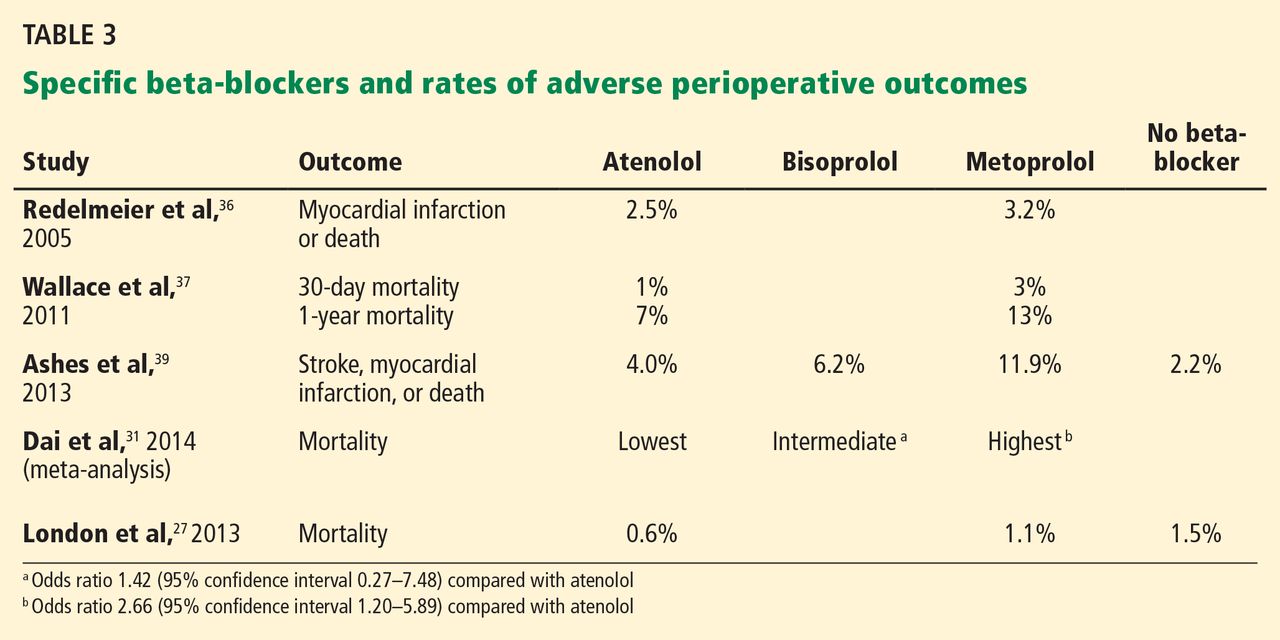
Studies comparing atenolol and metoprolol found that the atenolol groups had fewer myocardial infarctions and deaths36 and lower 30-day and 1-year mortality rates37 than the groups on metoprolol. Studies comparing the three beta-blockers found better outcomes with atenolol and bisoprolol than with metoprolol—fewer strokes,38,39 a lower mortality rate,31 and a better composite outcome39 (Table 3 and Table 4).
START THE BETA-BLOCKER EARLY, TITRATE TO CONTROL THE HEART RATE
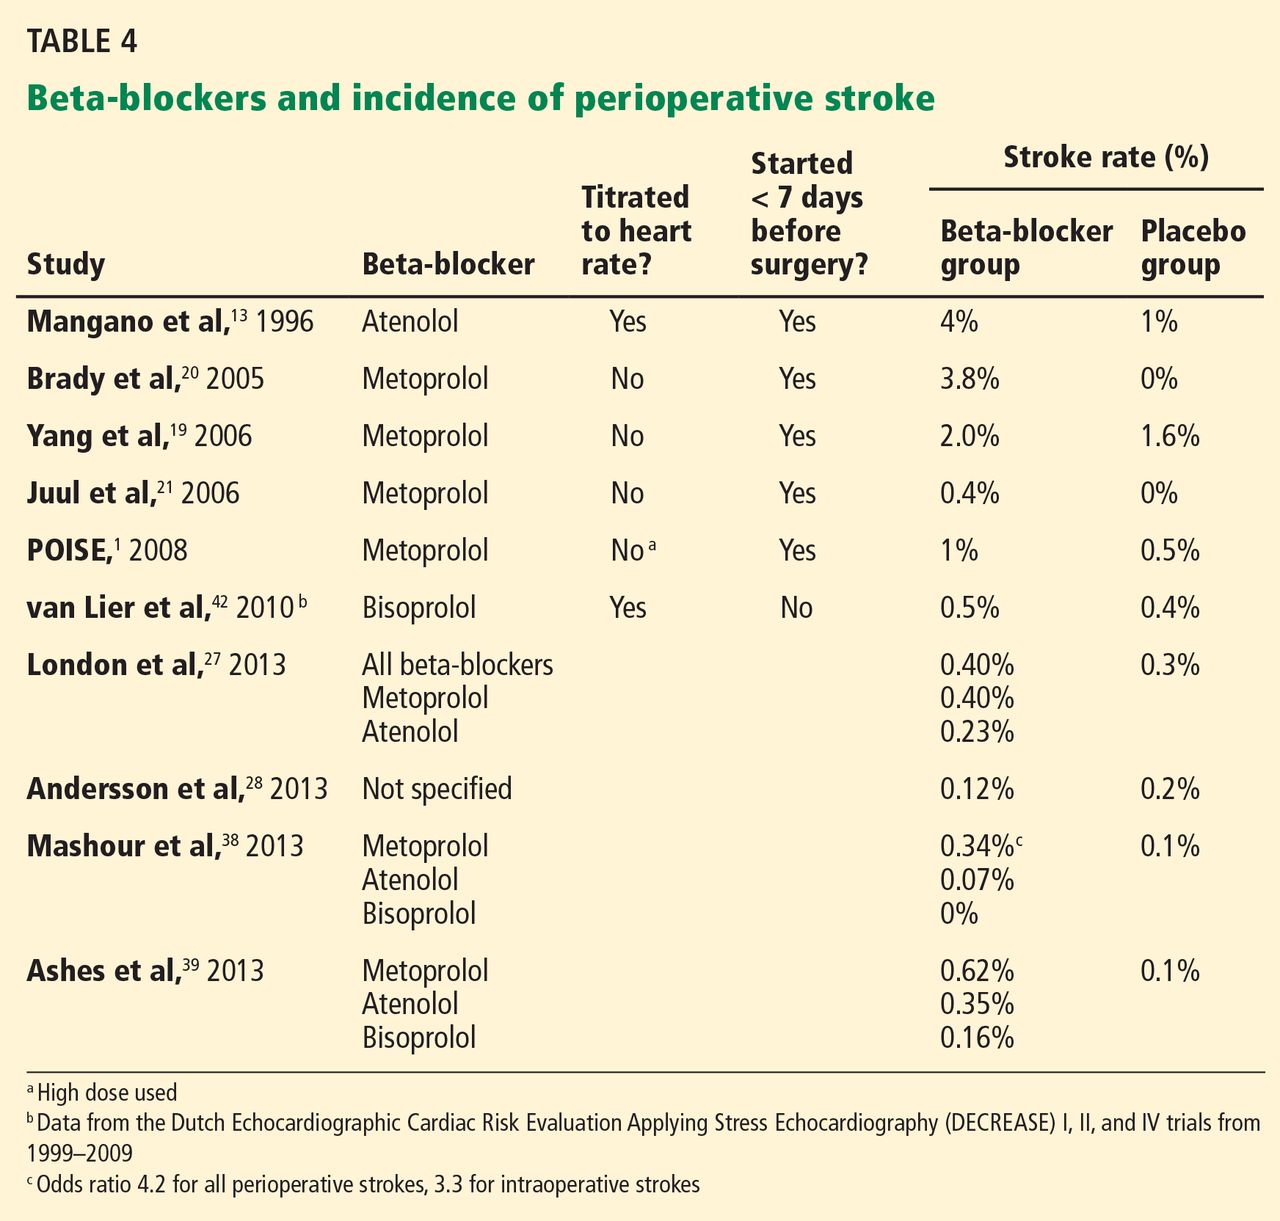
A number of studies suggest that how long the beta-blocker is given before surgery may influence the outcome (Table 5). The best results were achieved when beta-blockers were started approximately 1 month before surgery and titrated to control the heart rate.
Because this long lead-in time is not always practical, it is important to determine the shortest time before surgery in which starting beta-blockers may be beneficial and yet safe. Some evidence suggests that results are better when the beta-blocker is started more than 1 week preoperatively compared with less than 1 week, but it is unknown what the minimum or optimal time period should be.
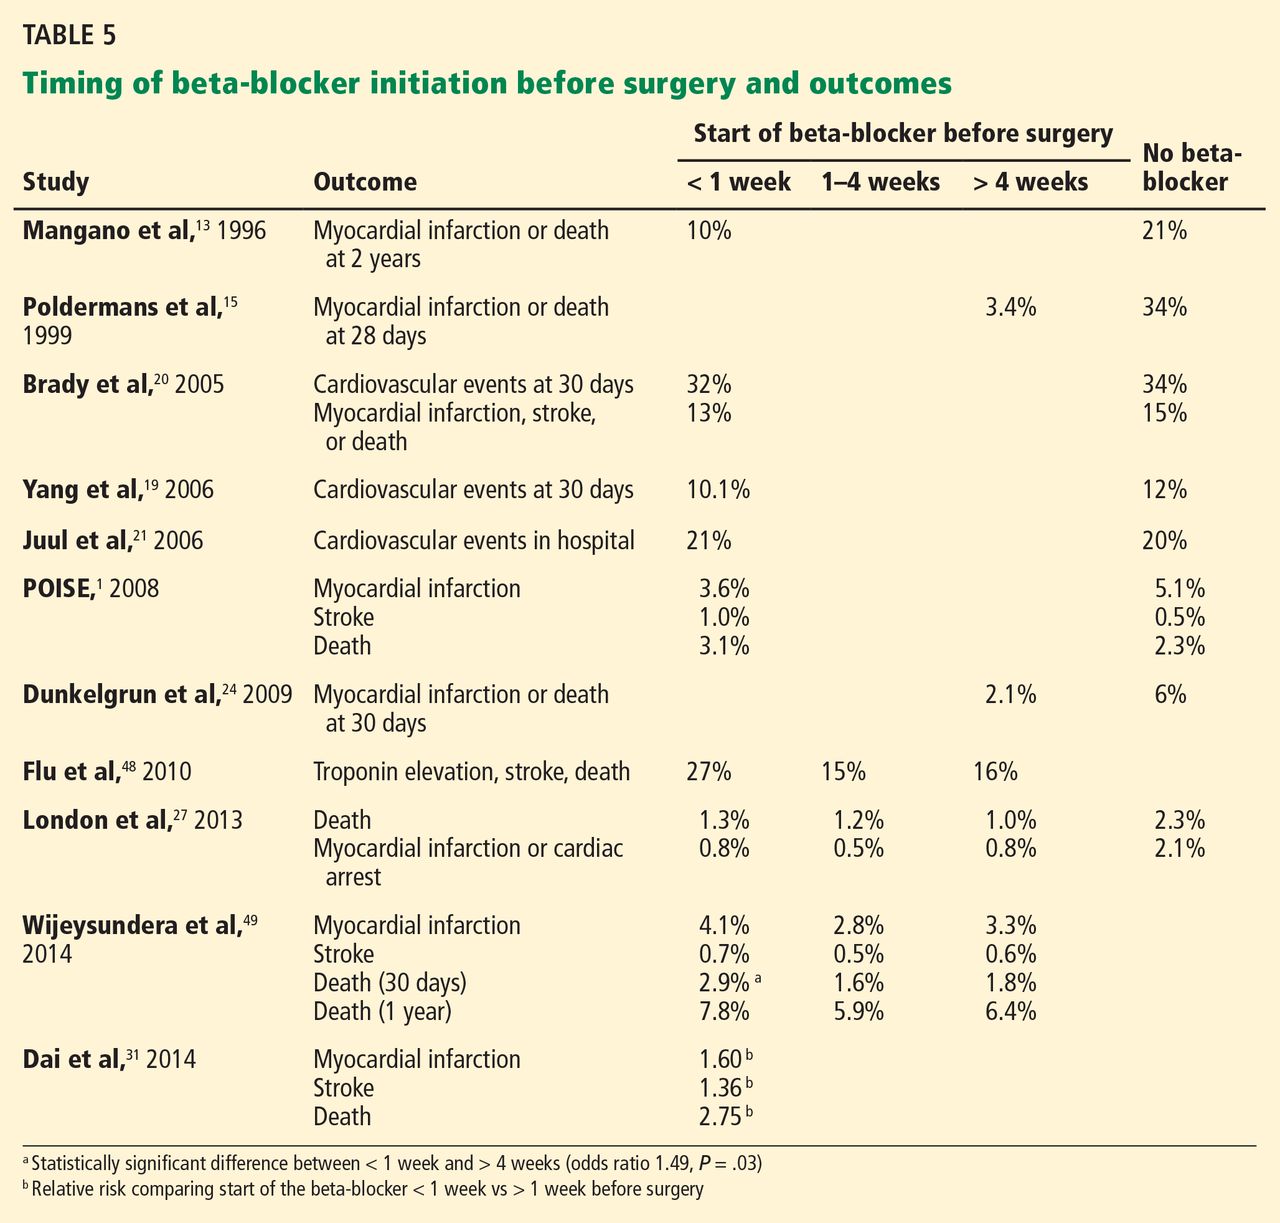
If a beta-blocker is started well in advance of the scheduled surgery, there is adequate time for dose titration and tighter heart rate control. Most of the studies demonstrating beneficial effects of perioperative beta-blockers used dose titration and achieved lower heart rates in the treatment group than in the control group. A criticism of the MaVs,19 POBBLE,20 and DIPOM21 trials was that the patients did not receive adequate beta-blockade. The POISE trial1 used a much higher dose of metoprolol in an attempt to assure beta-blockade without dose titration, and although the regimen decreased nonfatal myocardial infarctions, it increased strokes and the overall mortality rate, probably related to excess bradycardia and hypotension. The target heart rate should probably be between 55 and 70 beats per minute.
RISK OF STROKE
POISE1 was the first trial to note a clinically and statistically significant increase in strokes with perioperative beta-blocker use. Although no other study has shown a similar increased risk, almost all reported a higher number of strokes in the beta-blocker groups, although the absolute numbers and differences were small and not statistically significant. This risk may also vary from one beta-blocker to another (Table 4).
The usual incidence rate of postoperative stroke after noncardiac, noncarotid surgery is well under 1% in patients with no prior history of stroke but increases to approximately 3% in patients with a previous stroke.40 An observational study from the Dutch group reported a very low incidence of stroke overall (0.02%) in 186,779 patients undergoing noncardiac surgery with no significant difference in those on chronic beta-blocker therapy.41 The DECREASE trials, with a total of 3,884 patients, also found no statistically significant increase in stroke with beta-blocker use (0.46% overall vs 0.5% with a beta-blocker),42 which in this case was bisoprolol started well in advance of surgery and titrated to control the heart rate. Although the DECREASE data are under suspicion, they seem reasonable and consistent with those of observational studies.
Proposed mechanisms by which beta-blockers may increase stroke risk include the side effects of hypotension and bradycardia, particularly in the setting of anemia. They may also cause cerebral ischemia by blocking cerebral vasodilation. This effect on cerebral blood flow may be more pronounced with the less cardioselective beta-blockers, which may explain the apparent increased stroke risk associated with metoprolol.
WHAT SHOULD WE DO NOW?
The evidence for the safety and efficacy of beta-blockers in the perioperative setting continues to evolve, and new clinical trials are needed to clarify the ongoing controversy, particularly regarding the risk of stroke.
If patients have other indications for beta-blocker therapy, such as history of heart failure, myocardial infarction in the past 3 years, or atrial fibrillation for rate control, they should be receiving them if time permits.
If prophylactic beta-blockers are to be effective in minimizing perioperative complications, it appears that they may need to be more cardioselective, started at least 1 week before surgery, titrated to control heart rate, and used in high-risk patients (Revised Cardiac Risk Index score > 2 or 3) undergoing high-risk surgery.
Ideally, a large randomized controlled trial using a cardioselective beta-blocker started in advance of surgery in patients with a Revised Cardiac Risk Index score greater than 2, undergoing intermediate or high-risk procedures, is needed to fully answer the questions raised by the current data.
- POISE Study Group; Devereaux PJ, Yang H, Yusuf S, et al. Effects of extended-release metoprolol succinate in patients undergoing non-cardiac surgery (POISE trial): a randomised controlled trial. Lancet 2008; 371:1839–1847.
- Wijeysundera DN, Mamdani M, Laupacis A, et al. Clinical evidence, practice guidelines, and ß-blocker utilization before major noncardiac surgery. Circ Cardiovasc Qual Outcomes 2012; 5:558–565.
- American College of Cardiology; American Heart Association Task Force on Practice Guidelines (Writing Committee to Update the 2002 Guidelines on Perioperative Cardiovascular Evaluation for Noncardiac Surgery); American Society of Echocardiography; American Society of Nuclear Cardiology; Heart Rhythm Society; Society of Cardiovascular Anesthesiologists; Society for Cardiovascular Angiography and Interventions; Society for Vascular Medicine and Biology; Fleisher LA, Beckman JA, Brown KA, et al. ACC/AHA 2006 guideline update on perioperative cardiovascular evaluation for noncardiac surgery: focused update on perioperative beta-blocker therapy: a report of the American College of Cardiology/American Heart Association Task Force on Practice Guidelines (Writing Committee to Update the 2002 Guidelines on Perioperative Cardiovascular Evaluation for Noncardiac Surgery) developed in collaboration with the American Society of Echocardiography, American Society of Nuclear Cardiology, Heart Rhythm Society, Society of Cardiovascular Anesthesiologists, Society for Cardiovascular Angiography and Interventions, and Society for Vascular Medicine and Biology. J Am Coll Cardiol 2006; 47:2343–2355.
- Harte B, Jaffer AK. Perioperative beta-blockers in noncardiac surgery: evolution of the evidence. Cleve Clin J Med 2008; 75:513–519.
- Mangano DT. Perioperative cardiac morbidity. Anesthesiology 1990; 72:153–184.
- London MJ, Zaugg M, Schaub MC, Spahn DR. Perioperative beta-adrenergic receptor blockade: physiologic foundations and clinical controversies. Anesthesiology 2004; 100:170–175.
- Badner NH, Knill RL, Brown JE, Novick TV, Gelb AW. Myocardial infarction after noncardiac surgery. Anesthesiology 1998; 88:572–578.
- Priebe HJ. Triggers of perioperative myocardial ischaemia and infarction. Br J Anaesth 2004; 93:9–20.
- Zaugg M, Schaub MC, Foëx P. Myocardial injury and its prevention in the perioperative setting. Br J Anaesth 2004; 93:21–33.
- Zaugg M, Schaub MC, Pasch T, Spahn DR. Modulation of beta-adrenergic receptor subtype activities in perioperative medicine: mechanisms and sites of action. Br J Anaesth 2002; 88:101–123.
- Landesberg G. The pathophysiology of perioperative myocardial infarction: facts and perspectives. J Cardiothorac Vasc Anesth 2003; 17:90–100.
- Yeager MP, Fillinger MP, Hettleman BD, Hartman GS. Perioperative beta-blockade and late cardiac outcomes: a complementary hypothesis. J Cardiothorac Vasc Anesth 2005; 19:237–241.
- Mangano DT, Layug EL, Wallace A, Tateo I. Effect of atenolol on mortality and cardiovascular morbidity after noncardiac surgery. Multicenter Study of Perioperative Ischemia Research Group. N Engl J Med 1996; 335:1713–1720.
- Botto F, Alonso-Coello P, Chan MT, et al. Myocardial injury after noncardiac surgery: a large, international, prospective cohort study establishing diagnostic criteria, characteristics, predictors, and 30-day outcomes. Anesthesiology 2014; 120:564–578.
- Poldermans D, Boersma E, Bax JJ, et al. The effect of bisoprolol on perioperative mortality and myocardial infarction in high-risk patients undergoing vascular surgery. Dutch Echocardiographic Cardiac Risk Evaluation Applying Stress Echocardiography Study Group. N Engl J Med 1999; 341:1789–1794.
- Poldermans D, Boersma E, Bax JJ, et al; Dutch Echocardiographic Cardiac Risk Evaluation Applying Stress Echocardiography Study Group. Bisoprolol reduces cardiac death and myocardial infarction in high-risk patients as long as 2 years after successful major vascular surgery. Eur Heart J 2001; 22:1353–1358.
- Boersma E, Poldermans D, Bax JJ, et al; DECREASE Study Group (Dutch Echocardiographic Cardiac Risk Evaluation Applying Stress Echocardiogrpahy). Predictors of cardiac events after major vascular surgery: role of clinical characteristics, dobutamine echocardiography, and beta-blocker therapy. JAMA 2001; 285:1865–1873.
- Lee TH, Marcantonio ER, Mangione CM, et al. Derivation and prospective validation of a simple index for prediction of cardiac risk of major noncardiac surgery. Circulation 1999; 100:1043–1049.
- Yang H, Raymer K, Butler R, Parlow J, Roberts R. The effects of perioperative beta-blockade: results of the Metoprolol after Vascular Surgery (MaVS) study, a randomized controlled trial. Am Heart J 2006; 152:983–990.
- Brady AR, Gibbs JS, Greenhalgh RM, Powell JT, Sydes MR; POBBLE trial investigators. Perioperative beta-blockade (POBBLE) for patients undergoing infrarenal vascular surgery: results of a randomized double-blind controlled trial. J Vasc Surg 2005; 41:602–609.
- Juul AB, Wetterslev J, Gluud C, et al; DIPOM Trial Group. Effect of perioperative beta blockade in patients with diabetes undergoing major non-cardiac surgery: randomised placebo controlled, blinded multicentre trial. BMJ 2006; 332:1482.
- Lindenauer PK, Pekow P, Wang K, Mamidi DK, Gutierrez B, Benjamin EM. Perioperative beta-blocker therapy and mortality after major non-cardiac surgery. N Engl J Med 2005; 353:349–361.
- Feringa HH, Bax JJ, Boersma E, et al. High-dose beta-blockers and tight heart rate control reduce myocardial ischemia and troponin T release in vascular surgery patients. Circulation 2006; 114(suppl 1):1344–1349.
- Dunkelgrun M, Boersma E, Schouten O, et al; Dutch Echocardiographic Cardiac Risk Evaluation Applying Stress Echocardiography Study Group. Bisoprolol and fluvastatin for the reduction of perioperative cardiac mortality and myocardial infarction in intermediate-risk patients undergoing noncardiovascular surgery: a randomized controlled trial (DECREASE-IV). Ann Surg 2009; 249:921–926.
- American College of Cardiology Foundation/American Heart Association Task Force on Practice Guidelines; American Society of Echocardiography; American Society of Nuclear Cardiology; Heart Rhythm Society; Society of Cardiovascular Anesthesiologists; Society for Cardiovascular Angiography and Interventions; Society for Vascular Medicine; Society for Vascular Surgery; Fleisher LA, Beckman JA, Brown KA, et al. 2009 ACCF/AHA focused update on perioperative beta blockade incorporated into the ACC/AHA 2007 guidelines on perioperative cardiovascular evaluation and care for noncardiac surgery. J Am Coll Cardiol 2009; 54:e13–e118.
- Task Force for Preoperative Cardiac Risk Assessment and Perioperative Cardiac Management in Non-cardiac Surgery; European Society of Cardiology (ESC); Poldermans D, Bax JJ, Boersma E, et al. Guidelines for preoperative cardiac risk assessment and perioperative cardiac management in non-cardiac surgery. Eur Heart J 2009; 30:2769–2812.
- London MJ, Hur K, Schwartz GG, Henderson WG. Association of perioperative beta-blockade with mortality and cardiovascular morbidity following major noncardiac surgery. JAMA 2013; 309:1704–1713.
- Andersson C, Mérie C, Jørgensen M, et al. Association of beta-blocker therapy with risks of adverse cardiovascular events and deaths in patients with ischemic heart disease undergoing noncardiac surgery: a Danish nationwide cohort study. JAMA Intern Med 2014; 174:336–344.
- Bouri S, Shun-Shin MJ, Cole GD, Mayet J, Francis DP. Meta-analysis of secure randomised controlled trials of beta-blockade to prevent perioperative death in non-cardiac surgery. Heart 2014; 100:456–464.
- Guay J, Ochroch EA. Beta-blocking agents for surgery: influence on mortality and major outcomes. A meta-analysis. J Cardiothorac Vasc Anesth 2013; 27:834–844.
- Dai N, Xu D, Zhang J, et al. Different beta-blockers and initiation time in patients undergoing noncardiac surgery: a meta-analysis. Am J Med Sci 2014; 347:235–244.
- Baker JG. The selectivity of beta-adrenoceptor antagonists at the human beta1, beta2 and beta3 adrenoceptors. Br J Pharmacol 2005; 144:317–322.
- Beattie WS, Wijeysundera DN, Karkouti K, et al. Acute surgical anemia influences the cardioprotective effects of beta-blockade: a single-center, propensity-matched cohort study. Anesthesiology 2010; 112:25–33.
- Le Manach Y, Collins GS, Ibanez C, et al. Impact of perioperative bleeding on the protective effect of beta-blockers during infrarenal aortic reconstruction. Anesthesiology 2012; 117:1203–1211.
- Badgett RG, Lawrence VA, Cohn SL. Variations in pharmacology of beta-blockers may contribute to heterogeneous results in trials of perioperative beta-blockade. Anesthesiology 2010; 113:585–592.
- Redelmeier D, Scales D, Kopp A. Beta blockers for elective surgery in elderly patients: population based, retrospective cohort study. BMJ 2005; 331:932.
- Wallace AW, Au S, Cason BA. Perioperative beta-blockade: atenolol is associated with reduced mortality when compared to metoprolol. Anesthesiology 2011; 114:824–836.
- Mashour GA, Sharifpour M, Freundlich RE, et al. Perioperative metoprolol and risk of stroke after noncardiac surgery. Anesthesiology 2013; 119:1340–1346.
- Ashes C, Judelman S, Wijeysundera DN, et al. Selective beta1-antagonism with bisoprolol is associated with fewer postoperative strokes than atenolol or metoprolol: a single-center cohort study of 44,092 consecutive patients. Anesthesiology 2013; 119:777–787.
- Selim M. Perioperative stroke. N Engl J Med 2007; 356:706–713.
- van Lier F, Schouten O, van Domburg RT, et al. Effect of chronic beta-blocker use on stroke after noncardiac surgery. Am J Cardiol 2009; 104:429–433.
- van Lier F, Schouten O, Hoeks SE, et al. Impact of prophylactic beta-blocker therapy to prevent stroke after noncardiac surgery. Am J Cardiol 2010; 105:43–47.
- Devereaux PJ, Beattie WS, Choi PT, et al. How strong is the evidence for the use of perioperative beta blockers in non-cardiac surgery? Systematic review and meta-analysis of randomised controlled trials. BMJ 2005; 331:313–321.
- McGory ML, Maggard MA, Ko CY. A meta-analysis of perioperative beta blockade: what is the actual risk reduction? Surgery 2005; 138:171–179.
- Schouten O, Shaw LJ, Boersma E, et al. A meta-analysis of safety and effectiveness of perioperative beta-blocker use for the prevention of cardiac events in different types of noncardiac surgery. Coron Artery Dis 2006; 17:173–179.
- Wiesbauer F, Schlager O, Domanovits H, et al. Perioperative beta-blockers for preventing surgery-related mortality and morbidity: a systematic review and meta-analysis. Anesth Analg 2007; 104:27–41.
- Bangalore S, Wetterslev J, Pranesh S, Sawhney S, Gluud C, Messerli FH. Perioperative beta blockers in patients having non-cardiac surgery: a meta-analysis. Lancet 2008; 372:1962–1976.
- Flu WJ, van Kuijk JP, Chonchol M, et al. Timing of preoperative beta-blocker treatment in vascular surgery patients: influence on postoperative outcome. J Am Coll Cardiol 2010; 56:1922–1929.
- Wijeysundera DN, Beattie WS, Wijeysundera HC, Yun L, Austin PC, Ko DT. Duration of preoperative beta-blockade and outcomes after major elective noncardiac surgery. Can J Cardiol 2014; 30:217–223.
Prophylactic use of beta-blockers in the perioperative period is highly controversial. Initial studies in the 1990s were favorable, but evidence has been conflicting since then.
The pendulum swung away from routinely recommending beta-blockers after the publication of negative results from several studies, including the Perioperative Ischemic Evaluation (POISE) trial in 2008.1 Highlighting this change in practice, a Canadian study2 found that the use of perioperative beta-blockade increased between 1999 and 2005 but subsequently declined from 2005 to 2010. However, there was no appreciable change in this pattern after the POISE trial or after changes in the American College of Cardiology guidelines in 2002 and 2006.3
In 2008, Harte and Jaffer reviewed the perioperative use of beta-blockers in noncardiac surgery in this journal.4 Since then, a number of meta-analyses and retrospective observational studies have reported variable findings related to specific beta-blockers and specific complications.
In this paper, we review the rationale and recent evidence for and against the perioperative use of beta-blockers as guidance for internists and hospitalists.
POTENTIAL CARDIOPROTECTIVE EFFECTS OF BETA-BLOCKERS
Myocardial infarction and unstable angina are the leading cardiovascular causes of death after surgery.5 These events are multifactorial. Some are caused by the stress of surgery, which precipitates physiologic changes related to inflammatory mediators, sympathetic tone, and oxygen supply and demand; others are caused by acute plaque rupture, thrombosis, and occlusion.6 Most perioperative infarcts are non-Q-wave events7 and occur within the first 2 days after the procedure, when the effects of anesthetics, pain, fluid shifts, and physiologic changes are greatest. Because multiple causes may contribute to perioperative myocardial infarction, a single preventive strategy may not be sufficient.8,9
Beta-blockers do several things that may be beneficial in the perioperative setting. They reduce myocardial oxygen demand by decreasing the force of contraction and by slowing the heart rate, and slowing the heart rate increases diastolic perfusion time.10 They suppress arrhythmias; they limit leukocyte recruitment, the production of free radicals, metalloproteinase activity, monocyte activation, release of growth factors, and inflammatory cytokine response; and they stabilize plaque.11 Their long-term use may also alter intracellular signaling processes, thus improving cell survival by decreasing the expression of receptors for substances that induce apoptosis.12
INITIAL POSITIVE TRIALS
Mangano et al13 began the beta-blocker trend in 1996 with a study in 200 patients known to have coronary artery disease or risk factors for it who were undergoing noncardiac surgery. Patients were randomized to receive either atenolol orally and intravenously, titrated to control the heart rate, or placebo in the immediate perioperative period.
The atenolol group had less perioperative ischemia but no difference in short-term rates of myocardial infarction and death. However, the death rate was lower in the atenolol group at 6 months after discharge and at 2 years, although patients who died in the immediate postoperative period were excluded from the analysis.
Although this finding did not appear to make sense physiologically, we now know that patients may experience myocardial injury without infarction after noncardiac surgery, a phenomenon associated with an increased risk of death in the short term and the long term.14 Preventing these episodes may be the explanation for the improved outcome.
The DECREASE trial15 (Dutch Echocardiographic Cardiac Risk Evaluation Applying Stress Echocardiography) provided additional support for beta-blocker use. The patients were at high risk, had abnormal dobutamine stress echocardiograms, and were undergoing vascular surgery; 112 patients were randomized to receive either oral bisoprolol (started 1 month before surgery, titrated to control the heart rate, and continued for 1 month after surgery) or placebo.
The study was stopped early because the bisoprolol group reportedly had a 90% lower rate of myocardial infarction and cardiac death 1 month after surgery. However, the study was criticized because the total number of patients enrolled was small and the benefit was much greater than usual for any pharmacologic intervention, thus calling the results into question.
In a follow-up study,16 survivors continued to be followed while receiving bisoprolol or usual care. The incidence of myocardial infarction or cardiac death at 2 years was significantly lower in the group receiving bisoprolol (12% vs 32%, odds ratio [OR] 0.30, P = .025).
Boersma et al,17 in an observational study, analyzed data from all 1,351 patients scheduled for major vascular surgery being considered for enrollment in the DECREASE trial. The DECREASE protocol required patients to undergo dobutamine stress echocardiography if they had one or more risk factors (age 70 or older, angina, prior myocardial infarction, congestive heart failure, treatment for ventricular arrhythmia, treatment for diabetes mellitus, or limited exercise capacity) or if their physician requested it. Twenty-seven percent received beta-blockers.
In multivariate analysis, clinical predictors of adverse outcome were age 70 or older; current or prior history of angina; and prior myocardial infarction, heart failure, or cerebrovascular accident.
In patients who had fewer than three clinical risk factors, beta-blocker use was associated with a lower rate of complications (0.8% vs 2.3%). Dobutamine stress echocardiography had minimal predictive value in this lower-risk group, suggesting that stress testing may not be necessary in this group if beta-blockers are used appropriately. However, in patients who had three or more risk factors, this test did provide additional prognostic information; those without stress-induced ischemia had lower event rates than those with ischemia, and beta-blocker use further reduced those rates, except in patients with extensive ischemia (more than five left ventricular segments involved).
The Revised Cardiac Risk Index. Lee et al18 devised an index to assist in preoperative cardiac risk stratification that was subsequently incorporated into the 2007 American College of Cardiology/American Heart Association preoperative risk guidelines. (It does not, however, address the beta-blocker issue.) It consists of six independent risk-predictors of major cardiac complications derived from 4,315 patients over age 50 undergoing non-cardiac surgery. The risk factors, each of which is given 1 point, are:
- Congestive heart failure based on history or examination
- Renal insufficiency (serum creatinine level > 2 mg/dL)
- Myocardial infarction, symptomatic ischemic heart disease, or a positive stress test
- History of transient ischemic attack or stroke
- Diabetes requiring insulin
- High-risk surgery (defined as intrathoracic, intra-abdominal, or suprainguinal vascular surgery).
Patients with 3 or more points are considered to be at high risk, and those with 1 or 2 points are considered to be at intermediate risk. The American College of Cardiology/American Heart Association preoperative cardiac risk algorithm subsequently included five of these six risk factors (the type of surgery was considered separately) and made recommendations concerning noninvasive stress testing and heart rate control.
On the basis of these studies, specialty societies, guideline committees, and hospitals enthusiastically recommended the prophylactic use of beta-blockers to decrease postoperative cardiac complications.
THREE NEGATIVE TRIALS OF METOPROLOL
In 2005 and 2006, two studies in vascular surgery patients and another in patients with diabetes cast doubt on the role of beta-blockers when the results failed to show a benefit. The trials used metoprolol, started shortly before surgery, and with no titration to control the heart rate.
The MaVS study19 (Metoprolol After Vascular Surgery) randomized 496 patients to receive metoprolol or placebo 2 hours before surgery and until hospital discharge or a maximum of 5 days after surgery. The metoprolol dose varied by weight: patients weighing 75 kg or more got 100 mg, those weighing between 40 and 75 kg got 50 mg, and those weighing less than 40 kg got 25 mg. Overall effects at 6 months were not significantly different, but intraoperative bradycardia and hypotension requiring intervention were more frequent in the metoprolol group.
The POBBLE study20 (Perioperative Beta Blockade) randomized 103 patients who had no history of myocardial infarction to receive either metoprolol 50 mg twice daily or placebo from admission to 7 days after surgery. Myocardial ischemia was present in one-third of the patients after surgery. Metoprolol did not reduce the 30-day cardiac mortality rate, but it was associated with a shorter length of stay.
The DIPOM trial21 (Diabetic Postoperative Mortality and Morbidity) randomized 921 diabetic patients to receive long-acting metoprolol succinate controlled-release/extended release (CR/XL) or placebo. Patients in the metoprolol group received a test dose of 50 mg the evening before surgery, another dose 2 hours before surgery (100 mg if the heart rate was more than 65 bpm, or 50 mg if between 55 and 65 bpm), and daily thereafter until discharge or a maximum of 8 days. The dose was not titrated to heart-rate control.
Metoprolol had no statistically significant effect on the composite primary outcome measures of time to death from any cause, acute myocardial infarction, unstable angina, or congestive heart failure or on the secondary outcome measures of time to death from any cause, death from a cardiac cause, and nonfatal cardiac morbidity.
ADDITIONAL POSITIVE STUDIES
Lindenauer et al22 retrospectively evaluated the use of beta-blockers in the first 2 days after surgery in 782,969 patients undergoing non-cardiac surgery. Using propensity score matching and Revised Cardiac Risk Index scores, they found a lower rate of postoperative mortality in patients with three or more risk factors who received a beta-blocker. There was no significant difference in the group with two risk factors, but in the lowest-risk group (with a score of 0 to 1), beta-blockers were not beneficial and may have been associated with harm as evidenced by a higher odds ratio for death, although this was probably artifactual and reflecting database limitations.
Feringa et al,23 in an observational cohort study of 272 patients undergoing vascular surgery, reported that higher doses of beta-blockers and tight heart-rate control were associated with less perioperative myocardial ischemia, lower troponin T levels, and better long-term outcome.
THE POISE TRIAL: MIXED RESULTS
The randomized POISE trial,1 published in 2008, compared the effects of extended-release metoprolol succinate vs placebo on the 30-day risk of major cardiovascular events in 8,351 patients with or at risk of atherosclerotic disease who were undergoing noncardiac surgery. The metoprolol regimen was 100 mg 2 to 4 hours before surgery, another 100 mg by 6 hours after surgery, and then 200 mg 12 hours later and once daily for 30 days.
The incidence of the composite primary end point of cardiovascular death, nonfatal myocardial infarction, and nonfatal cardiac arrest at 30 days was lower in the metoprolol group than in the placebo group (5.8% vs 6.9%; P = .04), primarily because of fewer nonfatal myocardial infarctions. However, more patients in the metoprolol group died of any cause (3.1% vs 2.3% P = .03) or had a stroke (1.0% vs 0.5% P = .005) than in the placebo group.
The metoprolol group had a higher incidence of clinically significant hypotension, bradycardia, and stroke, which could account for much of the increase in the mortality rate. Sepsis was the major cause of death in this group; hypotension may have increased the risk of infection, and beta-blockers may have potentiated hypotension in patients who were already septic. Also, the bradycardic and negative inotropic effects of the beta-blocker could have masked the physiologic response to systemic infection, thereby delaying recognition and treatment or impeding the normal immune response.
One of the major criticisms of the POISE trial was its aggressive dosing regimen (200 to 400 mg within a 36-hour period) in patients who had not been on beta-blockers before then. Also, the drug was started only a few hours before surgery. In addition, these patients were at higher risk of death and stroke than those in other trials based on a high baseline rate of cerebrovascular disease, and inclusion of urgent and emergency surgical procedures.
STUDIES SINCE POISE
The POISE trial results1 prompted further questioning of the prophylactic perioperative use of beta-blockers. However, proponents of beta-blockers voiced serious criticisms of the trial, particularly the dosing regimen, and continued to believe that these drugs were beneficial if used appropriately.
The DECREASE IV trial. Dunkelgrun et al,24 in a study using bisoprolol started approximately 1 month before surgery and titrated to control the heart rate, reported beneficial results in intermediate-risk patients. In their randomized open-label study with a 2 × 2 factorial design, 1,066 patients at intermediate cardiac risk were assigned to receive bisoprolol, fluvastatin, combination treatment, or control therapy at least 34 days before surgery. Bisoprolol was started at 2.5 mg orally daily and slowly titrated up to a maximum dose of 10 mg to keep the heart rate between 50 and 70 beats per minute. The group of 533 patients randomized to receive bisoprolol had a lower incidence rate of cardiac death and nonfatal myocardial infarction than the control group (2.1% vs 6.0%, HR 0.34, P = .002). A potential limitation of this study was its open-label design, which might have led to treatment bias.
Updated guidelines. Based on the results from POISE and DECREASE IV, the American College of Cardiology Foundation/American Heart Association Task Force on Practice Guidelines25 published a focused update on beta-blockers in 2009 as an amendment to their 2007 guidelines on perioperative evaluation and care for noncardiac surgery. The European Society of Cardiology26 released similar but somewhat more liberal guidelines (Table 1).
London et al,27 in an observational study published in 2013, found a lower 30-day overall mortality rate with beta-blockers (relative risk [RR] 0.73, 95% confidence interval [CI] 0.65–0.83, P < .001, number needed to treat [NNT] 241), as well as a lower rate of cardiac morbidity (nonfatal myocardial infarction and cardiac death), but only in nonvascular surgery patients who were on beta-blockers within 7 days of scheduled surgery. Moreover, similar to the findings of Lindenauer et al,22 only patients with a Revised Cardiac Risk Index score of 2 or more benefited from beta-blocker use in terms of a lower risk of death, whereas the lower-risk patients did not:
- Risk score of 0 or 1—no association
- Score of 2—RR 0.63, 95% CI 0.50–0.80, P < .001, NNT 105
- Score of 3—RR 0.54, 95% CI 0.39–0.73, P < .001, NNT 41
- Score of 4 or more—RR 0.40, 95% CI 0.24–0.73, P < .001, NNT 18).
Beta-blocker exposure was associated with a significantly lower rate of cardiac complications (RR 0.67, 95% CI 0.57–0.79, P < .001, NNT 339), also limited to nonvascular surgery patients with a risk score of 2 or 3.
The Danish Nationwide Cohort Study28 examined the effect of beta-blockers on major adverse cardiac events (MACE, ie, myocardial infarction, cerebrovascular accident, and death) in 28,263 patients with ischemic heart disease undergoing noncardiac surgery; 7,990 with heart failure and 20,273 without. Beta-blockers were used in 53% of patients with heart failure and 36% of those without heart failure. Outcomes for all of the beta-blocker recipients:
- MACE—HR 0.90, 95% CI 0.79–1.02
- All-cause mortality—HR 0.95, 95% CI 0.85–1.06.
Outcomes for patients with heart failure if they received beta-blockers:
- MACE—HR 0.75, 95% CI 0.70–0.87
- All-cause mortality—HR 0.80, 95% CI 0.70–0.92.
There was no significant benefit from beta-blockers in patients without heart failure. Outcomes for those patients if they received beta-blockers:
- MACE—HR 1.11, 95% CI 0.92–1.33
- All-cause mortality—HR 1.15, 95% CI 0.98–1.35.
However, in patients without heart failure but with a history of myocardial infarction within the past 2 years, beta-blockers were associated with a lower risk of MACE and all-cause mortality. In patients with neither heart failure nor a recent myocardial infarction, beta-blockers were associated with an increased risk of MACE and all-cause mortality.
This difference in efficacy depending on the presence and timing of a prior myocardial infarction is consistent with the 2012 American College of Cardiology/American Heart Association guidelines for secondary prevention, in which beta-blockers are given a class I recommendation only for patients with a myocardial infarction within the past 3 years.
Meta-analyses and outcomes
A number of meta-analyses have been published over the past 10 years, with conflicting results (Table 2). The divergent findings are primarily due to the different studies included in the analyses as well as the strong influence of the POISE trial.1 The studies varied in terms of the specific beta-blocker used, dose titration and heart rate control, time of initiation of beta-blocker use before surgery, type of surgery, patient characteristics, comorbidities, biomarkers and diagnosis of myocardial infarction, and clinical end points.
In general, these meta-analyses have found that prophylactic perioperative use of beta-blockers decreases ischemia and tends to reduce the risk of nonfatal myocardial infarction. They vary on whether the overall mortality risk is decreased. The meta-analyses that included POISE1 found an increased incidence of stroke, whereas those that excluded POISE found no significant difference, although there appeared to be slightly more strokes in the beta-blocker groups.
The beta-blocker controversy increased even further when Dr. Don Poldermans was fired by Erasmus Medical Center in November 2011 for violations of academic integrity involving his research, including the DECREASE trials. The most recent meta-analysis, by Bouri et al,29 included nine “secure trials” and excluded the DECREASE trials in view of the controversy about their authenticity. The analysis showed an increase in overall mortality as well as stroke, primarily because it was heavily influenced by POISE.1 In contrast, the DECREASE trials had reported a decreased risk of myocardial infarction and death, with no significant increase in stroke. The authors concluded that guideline bodies should “retract their recommendations based on the fictitious data without further delay.”29
Although the design of the DECREASE trials (in which beta-blockers were started well in advance of surgery and doses were titrated to achieve heart rate control) is physiologically more compelling than those of the negative trials, the results have been questioned in light of the integrity issue. However, to date, none of the published DECREASE trials have been retracted.
Two other meta-analyses,30,31 published in 2013, also found a decreased risk of myocardial infarction and increased risk of stroke but no significant difference in short-term all-cause mortality.
ARE ALL BETA-BLOCKERS EQUIVALENT?
In various studies evaluating specific beta-blockers, the more cardioselective agents bisoprolol and atenolol were associated with better outcomes than metoprolol. The affinity ratios for beta-1/beta-2 receptors range from 13.5 for bisoprolol to 4.7 for atenolol and 2.3 for metoprolol.32 Blocking beta-1 receptors blunts tachycardia, whereas blocking beta-2 receptors may block systemic or cerebral vasodilation.
In patients with anemia, beta-blockade in general may be harmful, but beta-2 blockade may be even worse. Beta-blockers were associated with an increased risk of MACE (6.5% vs 3.0%)33 in patients with acute surgical anemia if the hemoglobin concentration decreased to less than 35% of baseline, and increased risks of hospital death (OR 6.65) and multiorgan dysfunction syndrome (OR 4.18) with severe bleeding during aortic surgery.34
In addition, the pathway by which the beta-blocker is metabolized may also affect outcome, with less benefit from beta-blockers metabolized by the CYP2D6 isoenzyme of the cytochrome P450 system. Individual variations in CYP2D6 activity related to genetics or drug interactions may result in insufficient or excessive beta-blockade. Because metoprolol is the most dependent on this system, patients using it may be more susceptible to bradycardia.35
Studies comparing atenolol and metoprolol found that the atenolol groups had fewer myocardial infarctions and deaths36 and lower 30-day and 1-year mortality rates37 than the groups on metoprolol. Studies comparing the three beta-blockers found better outcomes with atenolol and bisoprolol than with metoprolol—fewer strokes,38,39 a lower mortality rate,31 and a better composite outcome39 (Table 3 and Table 4).
START THE BETA-BLOCKER EARLY, TITRATE TO CONTROL THE HEART RATE
A number of studies suggest that how long the beta-blocker is given before surgery may influence the outcome (Table 5). The best results were achieved when beta-blockers were started approximately 1 month before surgery and titrated to control the heart rate.
Because this long lead-in time is not always practical, it is important to determine the shortest time before surgery in which starting beta-blockers may be beneficial and yet safe. Some evidence suggests that results are better when the beta-blocker is started more than 1 week preoperatively compared with less than 1 week, but it is unknown what the minimum or optimal time period should be.
If a beta-blocker is started well in advance of the scheduled surgery, there is adequate time for dose titration and tighter heart rate control. Most of the studies demonstrating beneficial effects of perioperative beta-blockers used dose titration and achieved lower heart rates in the treatment group than in the control group. A criticism of the MaVs,19 POBBLE,20 and DIPOM21 trials was that the patients did not receive adequate beta-blockade. The POISE trial1 used a much higher dose of metoprolol in an attempt to assure beta-blockade without dose titration, and although the regimen decreased nonfatal myocardial infarctions, it increased strokes and the overall mortality rate, probably related to excess bradycardia and hypotension. The target heart rate should probably be between 55 and 70 beats per minute.
RISK OF STROKE
POISE1 was the first trial to note a clinically and statistically significant increase in strokes with perioperative beta-blocker use. Although no other study has shown a similar increased risk, almost all reported a higher number of strokes in the beta-blocker groups, although the absolute numbers and differences were small and not statistically significant. This risk may also vary from one beta-blocker to another (Table 4).
The usual incidence rate of postoperative stroke after noncardiac, noncarotid surgery is well under 1% in patients with no prior history of stroke but increases to approximately 3% in patients with a previous stroke.40 An observational study from the Dutch group reported a very low incidence of stroke overall (0.02%) in 186,779 patients undergoing noncardiac surgery with no significant difference in those on chronic beta-blocker therapy.41 The DECREASE trials, with a total of 3,884 patients, also found no statistically significant increase in stroke with beta-blocker use (0.46% overall vs 0.5% with a beta-blocker),42 which in this case was bisoprolol started well in advance of surgery and titrated to control the heart rate. Although the DECREASE data are under suspicion, they seem reasonable and consistent with those of observational studies.
Proposed mechanisms by which beta-blockers may increase stroke risk include the side effects of hypotension and bradycardia, particularly in the setting of anemia. They may also cause cerebral ischemia by blocking cerebral vasodilation. This effect on cerebral blood flow may be more pronounced with the less cardioselective beta-blockers, which may explain the apparent increased stroke risk associated with metoprolol.
WHAT SHOULD WE DO NOW?
The evidence for the safety and efficacy of beta-blockers in the perioperative setting continues to evolve, and new clinical trials are needed to clarify the ongoing controversy, particularly regarding the risk of stroke.
If patients have other indications for beta-blocker therapy, such as history of heart failure, myocardial infarction in the past 3 years, or atrial fibrillation for rate control, they should be receiving them if time permits.
If prophylactic beta-blockers are to be effective in minimizing perioperative complications, it appears that they may need to be more cardioselective, started at least 1 week before surgery, titrated to control heart rate, and used in high-risk patients (Revised Cardiac Risk Index score > 2 or 3) undergoing high-risk surgery.
Ideally, a large randomized controlled trial using a cardioselective beta-blocker started in advance of surgery in patients with a Revised Cardiac Risk Index score greater than 2, undergoing intermediate or high-risk procedures, is needed to fully answer the questions raised by the current data.
- POISE Study Group; Devereaux PJ, Yang H, Yusuf S, et al. Effects of extended-release metoprolol succinate in patients undergoing non-cardiac surgery (POISE trial): a randomised controlled trial. Lancet 2008; 371:1839–1847.
- Wijeysundera DN, Mamdani M, Laupacis A, et al. Clinical evidence, practice guidelines, and ß-blocker utilization before major noncardiac surgery. Circ Cardiovasc Qual Outcomes 2012; 5:558–565.
- American College of Cardiology; American Heart Association Task Force on Practice Guidelines (Writing Committee to Update the 2002 Guidelines on Perioperative Cardiovascular Evaluation for Noncardiac Surgery); American Society of Echocardiography; American Society of Nuclear Cardiology; Heart Rhythm Society; Society of Cardiovascular Anesthesiologists; Society for Cardiovascular Angiography and Interventions; Society for Vascular Medicine and Biology; Fleisher LA, Beckman JA, Brown KA, et al. ACC/AHA 2006 guideline update on perioperative cardiovascular evaluation for noncardiac surgery: focused update on perioperative beta-blocker therapy: a report of the American College of Cardiology/American Heart Association Task Force on Practice Guidelines (Writing Committee to Update the 2002 Guidelines on Perioperative Cardiovascular Evaluation for Noncardiac Surgery) developed in collaboration with the American Society of Echocardiography, American Society of Nuclear Cardiology, Heart Rhythm Society, Society of Cardiovascular Anesthesiologists, Society for Cardiovascular Angiography and Interventions, and Society for Vascular Medicine and Biology. J Am Coll Cardiol 2006; 47:2343–2355.
- Harte B, Jaffer AK. Perioperative beta-blockers in noncardiac surgery: evolution of the evidence. Cleve Clin J Med 2008; 75:513–519.
- Mangano DT. Perioperative cardiac morbidity. Anesthesiology 1990; 72:153–184.
- London MJ, Zaugg M, Schaub MC, Spahn DR. Perioperative beta-adrenergic receptor blockade: physiologic foundations and clinical controversies. Anesthesiology 2004; 100:170–175.
- Badner NH, Knill RL, Brown JE, Novick TV, Gelb AW. Myocardial infarction after noncardiac surgery. Anesthesiology 1998; 88:572–578.
- Priebe HJ. Triggers of perioperative myocardial ischaemia and infarction. Br J Anaesth 2004; 93:9–20.
- Zaugg M, Schaub MC, Foëx P. Myocardial injury and its prevention in the perioperative setting. Br J Anaesth 2004; 93:21–33.
- Zaugg M, Schaub MC, Pasch T, Spahn DR. Modulation of beta-adrenergic receptor subtype activities in perioperative medicine: mechanisms and sites of action. Br J Anaesth 2002; 88:101–123.
- Landesberg G. The pathophysiology of perioperative myocardial infarction: facts and perspectives. J Cardiothorac Vasc Anesth 2003; 17:90–100.
- Yeager MP, Fillinger MP, Hettleman BD, Hartman GS. Perioperative beta-blockade and late cardiac outcomes: a complementary hypothesis. J Cardiothorac Vasc Anesth 2005; 19:237–241.
- Mangano DT, Layug EL, Wallace A, Tateo I. Effect of atenolol on mortality and cardiovascular morbidity after noncardiac surgery. Multicenter Study of Perioperative Ischemia Research Group. N Engl J Med 1996; 335:1713–1720.
- Botto F, Alonso-Coello P, Chan MT, et al. Myocardial injury after noncardiac surgery: a large, international, prospective cohort study establishing diagnostic criteria, characteristics, predictors, and 30-day outcomes. Anesthesiology 2014; 120:564–578.
- Poldermans D, Boersma E, Bax JJ, et al. The effect of bisoprolol on perioperative mortality and myocardial infarction in high-risk patients undergoing vascular surgery. Dutch Echocardiographic Cardiac Risk Evaluation Applying Stress Echocardiography Study Group. N Engl J Med 1999; 341:1789–1794.
- Poldermans D, Boersma E, Bax JJ, et al; Dutch Echocardiographic Cardiac Risk Evaluation Applying Stress Echocardiography Study Group. Bisoprolol reduces cardiac death and myocardial infarction in high-risk patients as long as 2 years after successful major vascular surgery. Eur Heart J 2001; 22:1353–1358.
- Boersma E, Poldermans D, Bax JJ, et al; DECREASE Study Group (Dutch Echocardiographic Cardiac Risk Evaluation Applying Stress Echocardiogrpahy). Predictors of cardiac events after major vascular surgery: role of clinical characteristics, dobutamine echocardiography, and beta-blocker therapy. JAMA 2001; 285:1865–1873.
- Lee TH, Marcantonio ER, Mangione CM, et al. Derivation and prospective validation of a simple index for prediction of cardiac risk of major noncardiac surgery. Circulation 1999; 100:1043–1049.
- Yang H, Raymer K, Butler R, Parlow J, Roberts R. The effects of perioperative beta-blockade: results of the Metoprolol after Vascular Surgery (MaVS) study, a randomized controlled trial. Am Heart J 2006; 152:983–990.
- Brady AR, Gibbs JS, Greenhalgh RM, Powell JT, Sydes MR; POBBLE trial investigators. Perioperative beta-blockade (POBBLE) for patients undergoing infrarenal vascular surgery: results of a randomized double-blind controlled trial. J Vasc Surg 2005; 41:602–609.
- Juul AB, Wetterslev J, Gluud C, et al; DIPOM Trial Group. Effect of perioperative beta blockade in patients with diabetes undergoing major non-cardiac surgery: randomised placebo controlled, blinded multicentre trial. BMJ 2006; 332:1482.
- Lindenauer PK, Pekow P, Wang K, Mamidi DK, Gutierrez B, Benjamin EM. Perioperative beta-blocker therapy and mortality after major non-cardiac surgery. N Engl J Med 2005; 353:349–361.
- Feringa HH, Bax JJ, Boersma E, et al. High-dose beta-blockers and tight heart rate control reduce myocardial ischemia and troponin T release in vascular surgery patients. Circulation 2006; 114(suppl 1):1344–1349.
- Dunkelgrun M, Boersma E, Schouten O, et al; Dutch Echocardiographic Cardiac Risk Evaluation Applying Stress Echocardiography Study Group. Bisoprolol and fluvastatin for the reduction of perioperative cardiac mortality and myocardial infarction in intermediate-risk patients undergoing noncardiovascular surgery: a randomized controlled trial (DECREASE-IV). Ann Surg 2009; 249:921–926.
- American College of Cardiology Foundation/American Heart Association Task Force on Practice Guidelines; American Society of Echocardiography; American Society of Nuclear Cardiology; Heart Rhythm Society; Society of Cardiovascular Anesthesiologists; Society for Cardiovascular Angiography and Interventions; Society for Vascular Medicine; Society for Vascular Surgery; Fleisher LA, Beckman JA, Brown KA, et al. 2009 ACCF/AHA focused update on perioperative beta blockade incorporated into the ACC/AHA 2007 guidelines on perioperative cardiovascular evaluation and care for noncardiac surgery. J Am Coll Cardiol 2009; 54:e13–e118.
- Task Force for Preoperative Cardiac Risk Assessment and Perioperative Cardiac Management in Non-cardiac Surgery; European Society of Cardiology (ESC); Poldermans D, Bax JJ, Boersma E, et al. Guidelines for preoperative cardiac risk assessment and perioperative cardiac management in non-cardiac surgery. Eur Heart J 2009; 30:2769–2812.
- London MJ, Hur K, Schwartz GG, Henderson WG. Association of perioperative beta-blockade with mortality and cardiovascular morbidity following major noncardiac surgery. JAMA 2013; 309:1704–1713.
- Andersson C, Mérie C, Jørgensen M, et al. Association of beta-blocker therapy with risks of adverse cardiovascular events and deaths in patients with ischemic heart disease undergoing noncardiac surgery: a Danish nationwide cohort study. JAMA Intern Med 2014; 174:336–344.
- Bouri S, Shun-Shin MJ, Cole GD, Mayet J, Francis DP. Meta-analysis of secure randomised controlled trials of beta-blockade to prevent perioperative death in non-cardiac surgery. Heart 2014; 100:456–464.
- Guay J, Ochroch EA. Beta-blocking agents for surgery: influence on mortality and major outcomes. A meta-analysis. J Cardiothorac Vasc Anesth 2013; 27:834–844.
- Dai N, Xu D, Zhang J, et al. Different beta-blockers and initiation time in patients undergoing noncardiac surgery: a meta-analysis. Am J Med Sci 2014; 347:235–244.
- Baker JG. The selectivity of beta-adrenoceptor antagonists at the human beta1, beta2 and beta3 adrenoceptors. Br J Pharmacol 2005; 144:317–322.
- Beattie WS, Wijeysundera DN, Karkouti K, et al. Acute surgical anemia influences the cardioprotective effects of beta-blockade: a single-center, propensity-matched cohort study. Anesthesiology 2010; 112:25–33.
- Le Manach Y, Collins GS, Ibanez C, et al. Impact of perioperative bleeding on the protective effect of beta-blockers during infrarenal aortic reconstruction. Anesthesiology 2012; 117:1203–1211.
- Badgett RG, Lawrence VA, Cohn SL. Variations in pharmacology of beta-blockers may contribute to heterogeneous results in trials of perioperative beta-blockade. Anesthesiology 2010; 113:585–592.
- Redelmeier D, Scales D, Kopp A. Beta blockers for elective surgery in elderly patients: population based, retrospective cohort study. BMJ 2005; 331:932.
- Wallace AW, Au S, Cason BA. Perioperative beta-blockade: atenolol is associated with reduced mortality when compared to metoprolol. Anesthesiology 2011; 114:824–836.
- Mashour GA, Sharifpour M, Freundlich RE, et al. Perioperative metoprolol and risk of stroke after noncardiac surgery. Anesthesiology 2013; 119:1340–1346.
- Ashes C, Judelman S, Wijeysundera DN, et al. Selective beta1-antagonism with bisoprolol is associated with fewer postoperative strokes than atenolol or metoprolol: a single-center cohort study of 44,092 consecutive patients. Anesthesiology 2013; 119:777–787.
- Selim M. Perioperative stroke. N Engl J Med 2007; 356:706–713.
- van Lier F, Schouten O, van Domburg RT, et al. Effect of chronic beta-blocker use on stroke after noncardiac surgery. Am J Cardiol 2009; 104:429–433.
- van Lier F, Schouten O, Hoeks SE, et al. Impact of prophylactic beta-blocker therapy to prevent stroke after noncardiac surgery. Am J Cardiol 2010; 105:43–47.
- Devereaux PJ, Beattie WS, Choi PT, et al. How strong is the evidence for the use of perioperative beta blockers in non-cardiac surgery? Systematic review and meta-analysis of randomised controlled trials. BMJ 2005; 331:313–321.
- McGory ML, Maggard MA, Ko CY. A meta-analysis of perioperative beta blockade: what is the actual risk reduction? Surgery 2005; 138:171–179.
- Schouten O, Shaw LJ, Boersma E, et al. A meta-analysis of safety and effectiveness of perioperative beta-blocker use for the prevention of cardiac events in different types of noncardiac surgery. Coron Artery Dis 2006; 17:173–179.
- Wiesbauer F, Schlager O, Domanovits H, et al. Perioperative beta-blockers for preventing surgery-related mortality and morbidity: a systematic review and meta-analysis. Anesth Analg 2007; 104:27–41.
- Bangalore S, Wetterslev J, Pranesh S, Sawhney S, Gluud C, Messerli FH. Perioperative beta blockers in patients having non-cardiac surgery: a meta-analysis. Lancet 2008; 372:1962–1976.
- Flu WJ, van Kuijk JP, Chonchol M, et al. Timing of preoperative beta-blocker treatment in vascular surgery patients: influence on postoperative outcome. J Am Coll Cardiol 2010; 56:1922–1929.
- Wijeysundera DN, Beattie WS, Wijeysundera HC, Yun L, Austin PC, Ko DT. Duration of preoperative beta-blockade and outcomes after major elective noncardiac surgery. Can J Cardiol 2014; 30:217–223.
KEY POINTS
- If patients have other indications for beta-blocker therapy, such as a history of heart failure, myocardial infarction in the past 3 years, or atrial fibrillation, they should be started on a beta-blocker before surgery if time permits.
- Of the various beta-blockers, the cardioselective ones appear to be preferable in the perioperative setting.
- Beta-blockers may need to be started at least 1 week before surgery, titrated to control the heart rate, and used only in patients at high risk (Revised Cardiac Risk Index score > 2 or 3) undergoing high-risk surgery.
- Further clinical trials are necessary to clarify the ongoing controversy, particularly regarding the risk of stroke, which was increased in the large Perioperative Ischemic Evaluation (POISE) trial.
Double trouble: Simultaneous complications of therapeutic thoracentesis
A 51-year-old man with end-stage liver disease from alcohol abuse presented with worsening dyspnea on exertion. He had a history of ascites requiring diuretic therapy and intermittent paracentesis, as well as symptomatic hepatic hydrothorax requiring thoracentesis. Chest radiography showed a large right hydrothorax (Figure 1).
The patient underwent high-volume thoracentesis, and 3.2 L of clear fluid was removed. Chest radiography after the procedure revealed a right-sided pneumothorax (Figure 2, arrow). The patient was mildly short of breath and was treated with high-flow oxygen. Later the same day, his shortness of breath worsened, and repeat chest radiography showed an unchanged pneumothorax that was now complicated by reexpansion pulmonary edema after thoracentesis (Figure 3, star). The reexpansion pulmonary edema resolved by the following day, and the pneumothorax resolved after placement of a pig-tail catheter into the pleural space (Figure 4).
Iatrogenic pneumothorax after thoracentesis occurs in 6% of cases.1 Iatrogenic reexpansion pulmonary edema after thoracentesis occurs in fewer than 1% of cases.2,3 Simultaneous pneumothorax and reexpansion pulmonary edema arising from the same procedure appears to be extremely rare.
- Gordon CE, Feller-Kopman D, Balk EM, Smetana GW. Pneumothorax following thoracentesis: a systematic review and meta-analysis. Arch Intern Med 2010; 170:332–339.
- Ragozzino MW, Greene R. Bilateral reexpansion pulmonary edema following unilateral pleurocentesis. Chest 1991; 99:506–508.
- Dias OM, Teixeira LR, Vargas FS. Reexpansion pulmonary edema after therapeutic thoracentesis. Clinics (Sao Paulo) 2010; 65:1387–1389.
A 51-year-old man with end-stage liver disease from alcohol abuse presented with worsening dyspnea on exertion. He had a history of ascites requiring diuretic therapy and intermittent paracentesis, as well as symptomatic hepatic hydrothorax requiring thoracentesis. Chest radiography showed a large right hydrothorax (Figure 1).
The patient underwent high-volume thoracentesis, and 3.2 L of clear fluid was removed. Chest radiography after the procedure revealed a right-sided pneumothorax (Figure 2, arrow). The patient was mildly short of breath and was treated with high-flow oxygen. Later the same day, his shortness of breath worsened, and repeat chest radiography showed an unchanged pneumothorax that was now complicated by reexpansion pulmonary edema after thoracentesis (Figure 3, star). The reexpansion pulmonary edema resolved by the following day, and the pneumothorax resolved after placement of a pig-tail catheter into the pleural space (Figure 4).
Iatrogenic pneumothorax after thoracentesis occurs in 6% of cases.1 Iatrogenic reexpansion pulmonary edema after thoracentesis occurs in fewer than 1% of cases.2,3 Simultaneous pneumothorax and reexpansion pulmonary edema arising from the same procedure appears to be extremely rare.
- Gordon CE, Feller-Kopman D, Balk EM, Smetana GW. Pneumothorax following thoracentesis: a systematic review and meta-analysis. Arch Intern Med 2010; 170:332–339.
- Ragozzino MW, Greene R. Bilateral reexpansion pulmonary edema following unilateral pleurocentesis. Chest 1991; 99:506–508.
- Dias OM, Teixeira LR, Vargas FS. Reexpansion pulmonary edema after therapeutic thoracentesis. Clinics (Sao Paulo) 2010; 65:1387–1389.
Changes to practice may help avoid ‘double trouble’
Large-volume thoracentesis is defined as the drainage of more than 1 L of fluid. Inherent in this procedure is the removal of a large amount of fluid from a cavity with a rigid wall, which leads to changes in pleural pressure and to expansion of the lung. Two specific complications occur, pneumothorax and reexpansion pulmonary edema. The images submitted for the Clinical Picture article by Drs. Apter and Aronowitz in this issue of the Journal highlight these complications.
Retrospective studies have found an association between the amount of fluid drained and the incidence of pneumothorax.1,2 Although technical issues may account for it (eg, needle injury to the lung that leads to postprocedural pneumothorax), the available evidence suggests that it has more to do with the drainage of larger volumes than the lung can expand to fill.3,4 That is, the patient’s lung cannot expand,5 so drainage creates a vacuum, and air enters the pleural space3 through the lung parenchyma, or perhaps from around the drainage catheter.
In a series of patients who underwent therapeutic thoracentesis,3 23 (8.7%) of 265 patients had pneumothorax. Interestingly, some patients had only symptoms, some had only excessively negative pressures (< 25 cm H2O), some had both, and some had neither. Thus, there does not seem to be a reliable sign or symptom of an unexpanding lung, but pleural manometry may help increase its detection.6 This technique, however, is rarely used in clinical practice.
Another consequence of therapeutic thoracentesis is reexpansion pulmonary edema. This rare condition occurs only after large-volume thoracentesis or evacuation of a moderate to large pneumothorax.7 The pathophysiology behind this is controversial.8 As with pneumothorax, a large case series did not find a correlation between volume removed or pleural pressures and reexpansion pulmonary edema.7 Experimental data and analysis of case series8–10 suggest that the duration of lung collapse and the speed of drainage and negative pressure applied contribute to the development of edema. Vacuum bottles are often used to speed drainage and to contain the large amount of fluid drained. These bottles have an initial negative pressure of about −723 mm Hg (personal communication with Baxter Healthcare Product information line), which may lead to rapid changes in lung volume and perhaps to higher negative pleural pressures.
Given the risks discussed above, we believe it is appropriate to avoid vacuum bottles and instead to use the syringe and one-way valve supplied in most thoracentesis kits. Further, pleural manometry to detect changes in pressure that suggest an unexpandable lung may lead to the appropriate early termination of a planned large-volume thoracentesis.3 The complications reported by Drs. Apter and Aronowitz are relatively rare and, at this point, unpredictable; therefore, generating high-quality evidence for prediction or management will be difficult. In the meantime, understanding the physiologic changes in the lung and the pleural space when draining large effusions from the chest may help avoid double trouble.
- Josephson T, Nordenskjold CA, Larsson J, Rosenberg LU, Kaijser M. Amount drained at ultrasound-guided thoracentesis and risk of pneumothorax. Acta Radiol 2009; 50:42–47.
- Gordon CE, Feller-Kopman D, Balk EM, Smetana GW. Pneumothorax following thoracentesis: a systematic review and meta-analysis. Arch Intern Med 2010; 170:332–339.
- Heidecker J, Huggins JT, Sahn SA, Doelken P. Pathophysiology of pneumothorax following ultrasound-guided thoracentesis. Chest 2006; 130:1173–1184.
- Huggins JT, Sahn SA, Heidecker J, Ravenel JG, Doelken P. Characteristics of trapped lung: pleural fluid analysis, manometry, and air-contrast chest CT. Chest 2007; 131:206–213.
- Woodring JH, Baker MD, Stark P. Pneumothorax ex vacuo. Chest 1996; 110:1102–1105.
- Feller-Kopman D. Therapeutic thoracentesis: the role of ultrasound and pleural manometry. Curr Opin Pulmon Med 2007; 13:312–318.
- Feller-Kopman D, Berkowitz D, Boiselle P, Ernst A. Large-volume thoracentesis and the risk of reexpansion pulmonary edema. Ann Thorac Surg 2007; 84:1656–1661.
- Tarver RD, Broderick LS, Conces DJ, Jr. Reexpansion pulmonary edema. J Thorac Imag 1996; 11:198–209.
- Murphy K, Tomlanovich MC. Unilateral pulmonary edema after drainage of a spontaneous pneumothorax: case report and review of the world literature. J Emerg Med 1983; 1:29–36.
- Pavlin J, Cheney FW Unilateral pulmonary edema in rabbits after reexpansion of collapsed lung. J Appl Physiol Respir Environ Exerc Physiol 1979; 46:31–35.
Large-volume thoracentesis is defined as the drainage of more than 1 L of fluid. Inherent in this procedure is the removal of a large amount of fluid from a cavity with a rigid wall, which leads to changes in pleural pressure and to expansion of the lung. Two specific complications occur, pneumothorax and reexpansion pulmonary edema. The images submitted for the Clinical Picture article by Drs. Apter and Aronowitz in this issue of the Journal highlight these complications.
Retrospective studies have found an association between the amount of fluid drained and the incidence of pneumothorax.1,2 Although technical issues may account for it (eg, needle injury to the lung that leads to postprocedural pneumothorax), the available evidence suggests that it has more to do with the drainage of larger volumes than the lung can expand to fill.3,4 That is, the patient’s lung cannot expand,5 so drainage creates a vacuum, and air enters the pleural space3 through the lung parenchyma, or perhaps from around the drainage catheter.
In a series of patients who underwent therapeutic thoracentesis,3 23 (8.7%) of 265 patients had pneumothorax. Interestingly, some patients had only symptoms, some had only excessively negative pressures (< 25 cm H2O), some had both, and some had neither. Thus, there does not seem to be a reliable sign or symptom of an unexpanding lung, but pleural manometry may help increase its detection.6 This technique, however, is rarely used in clinical practice.
Another consequence of therapeutic thoracentesis is reexpansion pulmonary edema. This rare condition occurs only after large-volume thoracentesis or evacuation of a moderate to large pneumothorax.7 The pathophysiology behind this is controversial.8 As with pneumothorax, a large case series did not find a correlation between volume removed or pleural pressures and reexpansion pulmonary edema.7 Experimental data and analysis of case series8–10 suggest that the duration of lung collapse and the speed of drainage and negative pressure applied contribute to the development of edema. Vacuum bottles are often used to speed drainage and to contain the large amount of fluid drained. These bottles have an initial negative pressure of about −723 mm Hg (personal communication with Baxter Healthcare Product information line), which may lead to rapid changes in lung volume and perhaps to higher negative pleural pressures.
Given the risks discussed above, we believe it is appropriate to avoid vacuum bottles and instead to use the syringe and one-way valve supplied in most thoracentesis kits. Further, pleural manometry to detect changes in pressure that suggest an unexpandable lung may lead to the appropriate early termination of a planned large-volume thoracentesis.3 The complications reported by Drs. Apter and Aronowitz are relatively rare and, at this point, unpredictable; therefore, generating high-quality evidence for prediction or management will be difficult. In the meantime, understanding the physiologic changes in the lung and the pleural space when draining large effusions from the chest may help avoid double trouble.
- Josephson T, Nordenskjold CA, Larsson J, Rosenberg LU, Kaijser M. Amount drained at ultrasound-guided thoracentesis and risk of pneumothorax. Acta Radiol 2009; 50:42–47.
- Gordon CE, Feller-Kopman D, Balk EM, Smetana GW. Pneumothorax following thoracentesis: a systematic review and meta-analysis. Arch Intern Med 2010; 170:332–339.
- Heidecker J, Huggins JT, Sahn SA, Doelken P. Pathophysiology of pneumothorax following ultrasound-guided thoracentesis. Chest 2006; 130:1173–1184.
- Huggins JT, Sahn SA, Heidecker J, Ravenel JG, Doelken P. Characteristics of trapped lung: pleural fluid analysis, manometry, and air-contrast chest CT. Chest 2007; 131:206–213.
- Woodring JH, Baker MD, Stark P. Pneumothorax ex vacuo. Chest 1996; 110:1102–1105.
- Feller-Kopman D. Therapeutic thoracentesis: the role of ultrasound and pleural manometry. Curr Opin Pulmon Med 2007; 13:312–318.
- Feller-Kopman D, Berkowitz D, Boiselle P, Ernst A. Large-volume thoracentesis and the risk of reexpansion pulmonary edema. Ann Thorac Surg 2007; 84:1656–1661.
- Tarver RD, Broderick LS, Conces DJ, Jr. Reexpansion pulmonary edema. J Thorac Imag 1996; 11:198–209.
- Murphy K, Tomlanovich MC. Unilateral pulmonary edema after drainage of a spontaneous pneumothorax: case report and review of the world literature. J Emerg Med 1983; 1:29–36.
- Pavlin J, Cheney FW Unilateral pulmonary edema in rabbits after reexpansion of collapsed lung. J Appl Physiol Respir Environ Exerc Physiol 1979; 46:31–35.
Insulin before surgery
To the Editor: We appreciated the thoughtful 1-Minute Consult by Drs. Dobri and Lansang, “How should we manage insulin therapy before surgery?”1 We agree with them in regard to the benefits of perioperative control of blood glucose levels. However, we disagree in general with their assertion that the full dose of the patient’s home dose of basal insulin be administered while the patient is nil per os (NPO) before surgery, with a reduction to 75% of the home dose only if the patient has a history of hypoglycemia, a recommendation that did not differentiate between patients with type 1 and type 2 diabetes mellitus.
The RABBIT 2 Surgery trial,2 which showed superiority of basal-bolus insulin over sliding scale insulin in surgical patients with type 2 diabetes mellitus, also showed a surprisingly high rate of hypoglycemia—24 (23.1%) of 104 patients had blood glucose levels lower than 70 mg/dL, compared with a similar trial in nonsurgical patients in which 2 (3.1%) of 65 patients had a blood glucose level less than 60 mg/dL.3 The authors of the two studies explained2 that “differences in hypoglycemic events between the two trials could be in part explained by reduced nutritional intake in surgical patients…”
Although patients with well-controlled type 1 diabetes mellitus may tolerate their full dose of basal insulin while NPO, we contend that patients with type 2 diabetes mellitus should be prescribed a reduced dose of basal insulin while NPO, regardless of the dose distribution or the patient’s overall glycemic control. It is routine practice on our consult service to reduce the basal insulin dose in such patients by roughly half.
- Dobri GA, Lansang MC. How should we manage insulin therapy before surgery? Cleve Clin J Med 2013; 80:702–704.
- Umpierrez GE, Smiley D, Jacobs S, et al. Randomized study of basal-bolus insulin therapy in the inpatient management of patients with type 2 diabetes undergoing general surgery (RABBIT 2 surgery). Diabetes Care 2011; 34:256–261.
- Umpierrez GE, Smiley D, Zisman A, et al. Randomized study of basal-bolus insulin therapy in the inpatient management of patients with type 2 diabetes (RABBIT 2 trial). Diabetes Care 2007; 30:2181–2186.
To the Editor: We appreciated the thoughtful 1-Minute Consult by Drs. Dobri and Lansang, “How should we manage insulin therapy before surgery?”1 We agree with them in regard to the benefits of perioperative control of blood glucose levels. However, we disagree in general with their assertion that the full dose of the patient’s home dose of basal insulin be administered while the patient is nil per os (NPO) before surgery, with a reduction to 75% of the home dose only if the patient has a history of hypoglycemia, a recommendation that did not differentiate between patients with type 1 and type 2 diabetes mellitus.
The RABBIT 2 Surgery trial,2 which showed superiority of basal-bolus insulin over sliding scale insulin in surgical patients with type 2 diabetes mellitus, also showed a surprisingly high rate of hypoglycemia—24 (23.1%) of 104 patients had blood glucose levels lower than 70 mg/dL, compared with a similar trial in nonsurgical patients in which 2 (3.1%) of 65 patients had a blood glucose level less than 60 mg/dL.3 The authors of the two studies explained2 that “differences in hypoglycemic events between the two trials could be in part explained by reduced nutritional intake in surgical patients…”
Although patients with well-controlled type 1 diabetes mellitus may tolerate their full dose of basal insulin while NPO, we contend that patients with type 2 diabetes mellitus should be prescribed a reduced dose of basal insulin while NPO, regardless of the dose distribution or the patient’s overall glycemic control. It is routine practice on our consult service to reduce the basal insulin dose in such patients by roughly half.
- Dobri GA, Lansang MC. How should we manage insulin therapy before surgery? Cleve Clin J Med 2013; 80:702–704.
- Umpierrez GE, Smiley D, Jacobs S, et al. Randomized study of basal-bolus insulin therapy in the inpatient management of patients with type 2 diabetes undergoing general surgery (RABBIT 2 surgery). Diabetes Care 2011; 34:256–261.
- Umpierrez GE, Smiley D, Zisman A, et al. Randomized study of basal-bolus insulin therapy in the inpatient management of patients with type 2 diabetes (RABBIT 2 trial). Diabetes Care 2007; 30:2181–2186.
In reply: Insulin before surgery
In Reply: We appreciate the kind words of Drs. Ditch and Moore, as well as their opinion.
Our article was intentionally brief—a 1-Minute Consult—and so could not cover all specific situations we encounter in clinical practice. We meant only to provide a general approach in this matter.
Quite often before surgery, patients receive less basal insulin than needed, or none at all, rather than too much. It has to be borne in mind that perioperative hyperglycemia—not just hypoglycemia—is linked with poor outcomes in cardiac1 and noncardiac surgery.2,3
Through our scenarios and suggestions, we have taken steps to err on the side of preventing hypoglycemia while averting hyperglycemia, at the same time making it easy to calculate the dose. In a scenario in which the basal insulin dose is about the same as the total of the prandial boluses, we have not yet seen evidence that raises concern for hypoglycemia, maybe because many of the patients with type 2 diabetes seen in our institution for surgery take, in addition to insulin, oral agents or noninsulin injections (which are appropriately withheld before surgery), and have suboptimal glycemic control on their home regimen. But if a physician has concerns for hypoglycemia, a dose reduction should be made.
There were some differences between the RABBIT 2 trial in medical patients4 and the RABBIT 2 Surgery trial5 that would make the results not completely comparable. In RABBIT 2, the medical patients included were on diet alone or any combination of oral antidiabetic agents (not on insulin), and they were started on a total daily dose of insulin of either 0.4 or 0.5 U/kg/day, depending on the glucose level. In RABBIT 2 Surgery, patients who were on insulin at home with a total daily dose of 0.4 U/kg or less were also included, and the starting daily dose of insulin was 0.5 U/kg (unless they were older or had a high serum creatinine).
In view of all the above, we agree with Drs. Ditch and Moore that if there is concern for hypoglycemia, the clinician should reduce the insulin dose in the manner that evidence from the local practice suggests, without causing undue hyperglycemia and postsurgical complications.
- Furnary AP, Gao G, Grunkemeier GL, et al. Continuous insulin infusion reduces mortality in patients with diabetes undergoing coronary artery bypass grafting. J Thorac Cardiovasc Surg 2003; 125:1007–1021.
- King JT, Goulet JL, Perkal MF, Rosenthal RA. Glycemic control and infections in patients with diabetes undergoing noncardiac surgery. Ann Surg 2011; 253:158–165.
- Frisch A, Chandra P, Smiley D, et al. Prevalence and clinical outcome of hyperglycemia in the perioperative period in noncardiac surgery. Diabetes Care 2010; 33:1783–1788.
- Umpierrez GE, Smiley D, Zisman A, et al. Randomized study of basal-bolus insulin therapy in the inpatient management of patients with type 2 diabetes (RABBIT 2 trial). Diabetes Care 2007; 30:2181–2186.
- Umpierrez GE, Smiley D, Jacobs S, Peng L, et al. Randomized study of basal-bolus insulin therapy in the inpatient management of patients with type 2 diabetes undergoing general surgery (RABBIT 2 surgery). Diabetes Care 2011; 34:256–261.
In Reply: We appreciate the kind words of Drs. Ditch and Moore, as well as their opinion.
Our article was intentionally brief—a 1-Minute Consult—and so could not cover all specific situations we encounter in clinical practice. We meant only to provide a general approach in this matter.
Quite often before surgery, patients receive less basal insulin than needed, or none at all, rather than too much. It has to be borne in mind that perioperative hyperglycemia—not just hypoglycemia—is linked with poor outcomes in cardiac1 and noncardiac surgery.2,3
Through our scenarios and suggestions, we have taken steps to err on the side of preventing hypoglycemia while averting hyperglycemia, at the same time making it easy to calculate the dose. In a scenario in which the basal insulin dose is about the same as the total of the prandial boluses, we have not yet seen evidence that raises concern for hypoglycemia, maybe because many of the patients with type 2 diabetes seen in our institution for surgery take, in addition to insulin, oral agents or noninsulin injections (which are appropriately withheld before surgery), and have suboptimal glycemic control on their home regimen. But if a physician has concerns for hypoglycemia, a dose reduction should be made.
There were some differences between the RABBIT 2 trial in medical patients4 and the RABBIT 2 Surgery trial5 that would make the results not completely comparable. In RABBIT 2, the medical patients included were on diet alone or any combination of oral antidiabetic agents (not on insulin), and they were started on a total daily dose of insulin of either 0.4 or 0.5 U/kg/day, depending on the glucose level. In RABBIT 2 Surgery, patients who were on insulin at home with a total daily dose of 0.4 U/kg or less were also included, and the starting daily dose of insulin was 0.5 U/kg (unless they were older or had a high serum creatinine).
In view of all the above, we agree with Drs. Ditch and Moore that if there is concern for hypoglycemia, the clinician should reduce the insulin dose in the manner that evidence from the local practice suggests, without causing undue hyperglycemia and postsurgical complications.
- Furnary AP, Gao G, Grunkemeier GL, et al. Continuous insulin infusion reduces mortality in patients with diabetes undergoing coronary artery bypass grafting. J Thorac Cardiovasc Surg 2003; 125:1007–1021.
- King JT, Goulet JL, Perkal MF, Rosenthal RA. Glycemic control and infections in patients with diabetes undergoing noncardiac surgery. Ann Surg 2011; 253:158–165.
- Frisch A, Chandra P, Smiley D, et al. Prevalence and clinical outcome of hyperglycemia in the perioperative period in noncardiac surgery. Diabetes Care 2010; 33:1783–1788.
- Umpierrez GE, Smiley D, Zisman A, et al. Randomized study of basal-bolus insulin therapy in the inpatient management of patients with type 2 diabetes (RABBIT 2 trial). Diabetes Care 2007; 30:2181–2186.
- Umpierrez GE, Smiley D, Jacobs S, Peng L, et al. Randomized study of basal-bolus insulin therapy in the inpatient management of patients with type 2 diabetes undergoing general surgery (RABBIT 2 surgery). Diabetes Care 2011; 34:256–261.
Stress ulcer prophylaxis
To the Editor: In the January 2014 issue, Eisa et al1 suggested that patients who require prolonged mechanical ventilatory support, ie, for more than 48 hours, should receive stress ulcer prophylaxis. This recommendation came from a study by Cook et al2 in 1994, which found a significant increase in the risk of gastrointestinal blood loss in this group of patients. Other studies have shown a different result. Zandstra et al3 found an extremely low rate of stress ulcer-related bleeding in this group in the absence of stress ulcer prophylaxis. Another study4 in critically ill patients also found no relationship between stress ulcer incidence and prolonged mechanical ventilatory support. Interestingly, that study found that prolonged use of a nasogastric tube is the major risk factor for developing a stress ulcer.4 The explanation for why newer studies did not demonstrate the relationship between mechanical ventilation and stress ulcer development may lie in the result of a meta-analysis by Marik et al,5 which showed that stress ulcer prophylaxis may not be required in a patient who receives early enteral nutrition. That practice was not common in the past, including at the time the original study was conducted.
According to current evidence, mechanical ventilation for more than 48 hours does not seem to increase the risk of stress ulcer. The medical community should start questioning the routine practice of stress ulcer prophylaxis in this group of patients. In addition, more studies have identified the adverse effects of acid-suppression therapy in this group of patients, and these effects likely make the harms outweigh the benefits. This notion was confirmed in the most recent meta-analysis by Krag et al.6 In summary, the practice of routine stress ulcer prophylaxis in all mechanically ventilated patients will likely change in the future, with more focus on patients who are at higher risk.
- Eisa N, Bazerbachi F, Alraiyes AH, Alraies MC. Do all hospitalized patients need stress ulcer prophylaxis? Cleve Clin J Med 2014; 81:23–25.
- Cook DJ, Fuller HD, Guyatt GH, et al. Risk factors for gastrointestinal bleeding in critically ill patients. Canadian Critical Care Trials Group. N Engl J Med 1994; 330:377–381.
- Zandstra DF, Stoutenbeek CP. The virtual absence of stress-ulceration related bleeding in ICU patients receiving prolonged mechanical ventilation without any prophylaxis. A prospective cohort study. Intensive Care Med 1994; 20:335–340.
- Ellison RT, Perez-Perez G, Welsh CH, et al. Risk factors for upper gastrointestinal bleeding in intensive care unit patients: role of Helicobacter pylori. Federal Hyperimmune Immunoglobulin Therapy Study Group. Crit Care Med 1996; 24:1974–1981.
- Marik PE, Vasu T, Hirani A, Pachinburavan M. Stress ulcer prophylaxis in the new millennium: a systematic review and meta-analysis. Crit Care Med 2010; 38:2222–2228.
- Krag M, Perner A, Wetterslev J, Wise MP, Hylander Møller M. Stress ulcer prophylaxis versus placebo or no prophylaxis in critically ill patients. A systematic review of randomised clinical trials with meta-analysis and trial sequential analysis. Intensive Care Med 2014; 40:11–22.
To the Editor: In the January 2014 issue, Eisa et al1 suggested that patients who require prolonged mechanical ventilatory support, ie, for more than 48 hours, should receive stress ulcer prophylaxis. This recommendation came from a study by Cook et al2 in 1994, which found a significant increase in the risk of gastrointestinal blood loss in this group of patients. Other studies have shown a different result. Zandstra et al3 found an extremely low rate of stress ulcer-related bleeding in this group in the absence of stress ulcer prophylaxis. Another study4 in critically ill patients also found no relationship between stress ulcer incidence and prolonged mechanical ventilatory support. Interestingly, that study found that prolonged use of a nasogastric tube is the major risk factor for developing a stress ulcer.4 The explanation for why newer studies did not demonstrate the relationship between mechanical ventilation and stress ulcer development may lie in the result of a meta-analysis by Marik et al,5 which showed that stress ulcer prophylaxis may not be required in a patient who receives early enteral nutrition. That practice was not common in the past, including at the time the original study was conducted.
According to current evidence, mechanical ventilation for more than 48 hours does not seem to increase the risk of stress ulcer. The medical community should start questioning the routine practice of stress ulcer prophylaxis in this group of patients. In addition, more studies have identified the adverse effects of acid-suppression therapy in this group of patients, and these effects likely make the harms outweigh the benefits. This notion was confirmed in the most recent meta-analysis by Krag et al.6 In summary, the practice of routine stress ulcer prophylaxis in all mechanically ventilated patients will likely change in the future, with more focus on patients who are at higher risk.
- Eisa N, Bazerbachi F, Alraiyes AH, Alraies MC. Do all hospitalized patients need stress ulcer prophylaxis? Cleve Clin J Med 2014; 81:23–25.
- Cook DJ, Fuller HD, Guyatt GH, et al. Risk factors for gastrointestinal bleeding in critically ill patients. Canadian Critical Care Trials Group. N Engl J Med 1994; 330:377–381.
- Zandstra DF, Stoutenbeek CP. The virtual absence of stress-ulceration related bleeding in ICU patients receiving prolonged mechanical ventilation without any prophylaxis. A prospective cohort study. Intensive Care Med 1994; 20:335–340.
- Ellison RT, Perez-Perez G, Welsh CH, et al. Risk factors for upper gastrointestinal bleeding in intensive care unit patients: role of Helicobacter pylori. Federal Hyperimmune Immunoglobulin Therapy Study Group. Crit Care Med 1996; 24:1974–1981.
- Marik PE, Vasu T, Hirani A, Pachinburavan M. Stress ulcer prophylaxis in the new millennium: a systematic review and meta-analysis. Crit Care Med 2010; 38:2222–2228.
- Krag M, Perner A, Wetterslev J, Wise MP, Hylander Møller M. Stress ulcer prophylaxis versus placebo or no prophylaxis in critically ill patients. A systematic review of randomised clinical trials with meta-analysis and trial sequential analysis. Intensive Care Med 2014; 40:11–22.
In reply: Stress ulcer prophylaxis
In Reply: We welcome the comments from Dr. Chongnarungsin on our article and the opportunity to further discuss our opinions.
In our paper, we discussed current recommendations for prophylaxis of stress ulcer-related bleeding in hospitalized patients and advocated against the blind administration of drugs without risk stratification.
The landmark trial that provides the most-cited definitions and the risk factors for clinically significant stress ulcer-related bleeding in critically ill patients was published in 1994 by Cook et al.1 In their multicenter prospective cohort study of 2,252 patients, the authors reported that prolonged mechanical ventilation is an important risk factor for clinically significant stress ulcer-related bleeding.
Another major prospective cohort study observed an incidence rate of clinically significant stress ulcer-related bleeding of 3.5%.2
Dr. Chongnarungsin cites another prospective cohort study of 183 patients from the same era,3 wherein the authors defined stress ulcer-related bleeding as bleeding requiring transfusion of packed red blood cells, found on endoscopy or on postmortem evaluation. This was in contrast to the 1994 study of Cook et al,1 who had a more rigorous and comprehensive definition for overt and clinically significant stress ulcer-related bleeding, applied by up to three independent adjudicators not involved in the patients’ care. Their definition not only entailed a more accurate transfusion-dependent bleeding criterion, but also included hemodynamic and laboratory criteria. As such, the “very low rate” of stress ulcer-related bleeding reported by Zandstra et al3 should be critically appraised. Of note, the authors in that study did not report the rates of patients who received early enteral feeding, and their patients received cefotaxime for digestive tract decontamination, an important confounder to the interpretation of the study results.
Indeed, the remarkable variation in estimates of the incidence of stress ulcer-related bleeding is probably related to the lack of a uniform definition. Even when rates of endoscopic and occult bleeding are set aside, agreement is lacking as to which category of bleeding is clinically significant.
Dr. Chongnarungsin also cites the study by Ellison et al4 of a cohort of 874 patients who had no previous gastrointestinal bleeding or peptic ulcer disease and who were enrolled in a multicenter randomized controlled trial of prophylactic intravenous immune globulin to prevent infections associated with an intensive care unit. In a secondary objective, the authors did not identify coagulopathy or prolonged mechanical ventilation as a principal risk factor for bleeding. The authors ascribed this discrepancy with previously published literature to their unique study population, which consisted predominantly of elderly men and rarely included trauma patients. In light of these unique peculiarities of their population, the lack of an association between prolonged mechanical ventilation and stress ulcer-related bleeding cannot be determined. Moreover, that study showed that prolonged nasogastric tube insertion was one of the risk factors for increased risk of gastrointestinal bleeding, and not the risk factor for development of stress ulcer as stated by Dr. Chongnarungsin.
The decrease in the incidence of stress ulcer-related bleeding in critically ill patients over the years could be attributed to an era effect, from advances in critical care medicine and prophylactic methods.5 We agree with Dr. Chongnarungsin that the increased introduction of early enteral feeding may have also contributed to the reduced incidence of stress ulcer-related bleeding.6 However, we think the conclusion that “mechanical ventilation for more than 48 hours does not seem to increase the risk of stress ulcer” is overelaborated, and we believe that strong evidence demonstrates this association.1,2
Alternatively, we recognize the lack of mortality-benefit evidence for stress ulcer prophylaxis. This notwithstanding, according to recent Surviving Sepsis Campaign guidelines, the use of stress ulcer prophylaxis is listed as a 1B recommendation (strong recommendation) for severely septic patients who require prolonged mechanical ventilation. In addition, the updated 2014 guidelines of the American Society of Health-System Pharmacists7 continue to recommend stress ulcer prophylaxis in the context of mechanical ventilation, with H2 receptor antagonists being the preferred first-line agents.8
It is important to acknowledge that these recommendations were endorsed despite the lack of obvious mortality benefit, and it is our opinion that large randomized controlled studies are needed to evaluate the risks and mortality benefit of these prophylaxis methods.
- Cook DJ, Fuller HD, Guyatt GH, et al. Risk factors for gastrointestinal bleeding in critically ill patients. Canadian Critical Care Trials Group. N Engl J Med 1994; 330:377–381.
- Cook DJ, Griffith LE, Walter SD, et al. The attributable mortality and length of intensive care unit stay of clinically important gastrointestinal bleeding in critically ill patients. Crit Care 2001; 5:368–375.
- Zandstra DF, Stoutenbeek CP. The virtual absence of stress-ulceration related bleeding in ICU patients receiving prolonged mechanical ventilation without any prophylaxis. A prospective cohort study. Intensive Care Med 1994; 20:335–340.
- Ellison RT, Perez-Perez G, Welsh CH, et al. Risk factors for upper gastrointestinal bleeding in intensive care unit patients: role of Helicobacter pylori. Federal Hyperimmune Immunoglobulin Therapy Study Group. Crit Care Med 1996; 24:1974–1981.
- Duerksen DR. Stress-related mucosal disease in critically ill patients. Best Pract Res Clin Gastroenterol 2003; 17:327–344.
- Marik PE, Vasu T, Hirani A, Pachinburavan M. Stress ulcer prophylaxis in the new millennium: a systematic review and meta-analysis. Crit Care Med 2010; 38:2222–2228.
- Cohen H, editor. Stop stressing out: the new stress ulcer prophylaxis (SUP) guidelines are finally here! ASHP Midyear Clinical Meeting; 2013 11 Dec 2013; Orlando, FL.
In Reply: We welcome the comments from Dr. Chongnarungsin on our article and the opportunity to further discuss our opinions.
In our paper, we discussed current recommendations for prophylaxis of stress ulcer-related bleeding in hospitalized patients and advocated against the blind administration of drugs without risk stratification.
The landmark trial that provides the most-cited definitions and the risk factors for clinically significant stress ulcer-related bleeding in critically ill patients was published in 1994 by Cook et al.1 In their multicenter prospective cohort study of 2,252 patients, the authors reported that prolonged mechanical ventilation is an important risk factor for clinically significant stress ulcer-related bleeding.
Another major prospective cohort study observed an incidence rate of clinically significant stress ulcer-related bleeding of 3.5%.2
Dr. Chongnarungsin cites another prospective cohort study of 183 patients from the same era,3 wherein the authors defined stress ulcer-related bleeding as bleeding requiring transfusion of packed red blood cells, found on endoscopy or on postmortem evaluation. This was in contrast to the 1994 study of Cook et al,1 who had a more rigorous and comprehensive definition for overt and clinically significant stress ulcer-related bleeding, applied by up to three independent adjudicators not involved in the patients’ care. Their definition not only entailed a more accurate transfusion-dependent bleeding criterion, but also included hemodynamic and laboratory criteria. As such, the “very low rate” of stress ulcer-related bleeding reported by Zandstra et al3 should be critically appraised. Of note, the authors in that study did not report the rates of patients who received early enteral feeding, and their patients received cefotaxime for digestive tract decontamination, an important confounder to the interpretation of the study results.
Indeed, the remarkable variation in estimates of the incidence of stress ulcer-related bleeding is probably related to the lack of a uniform definition. Even when rates of endoscopic and occult bleeding are set aside, agreement is lacking as to which category of bleeding is clinically significant.
Dr. Chongnarungsin also cites the study by Ellison et al4 of a cohort of 874 patients who had no previous gastrointestinal bleeding or peptic ulcer disease and who were enrolled in a multicenter randomized controlled trial of prophylactic intravenous immune globulin to prevent infections associated with an intensive care unit. In a secondary objective, the authors did not identify coagulopathy or prolonged mechanical ventilation as a principal risk factor for bleeding. The authors ascribed this discrepancy with previously published literature to their unique study population, which consisted predominantly of elderly men and rarely included trauma patients. In light of these unique peculiarities of their population, the lack of an association between prolonged mechanical ventilation and stress ulcer-related bleeding cannot be determined. Moreover, that study showed that prolonged nasogastric tube insertion was one of the risk factors for increased risk of gastrointestinal bleeding, and not the risk factor for development of stress ulcer as stated by Dr. Chongnarungsin.
The decrease in the incidence of stress ulcer-related bleeding in critically ill patients over the years could be attributed to an era effect, from advances in critical care medicine and prophylactic methods.5 We agree with Dr. Chongnarungsin that the increased introduction of early enteral feeding may have also contributed to the reduced incidence of stress ulcer-related bleeding.6 However, we think the conclusion that “mechanical ventilation for more than 48 hours does not seem to increase the risk of stress ulcer” is overelaborated, and we believe that strong evidence demonstrates this association.1,2
Alternatively, we recognize the lack of mortality-benefit evidence for stress ulcer prophylaxis. This notwithstanding, according to recent Surviving Sepsis Campaign guidelines, the use of stress ulcer prophylaxis is listed as a 1B recommendation (strong recommendation) for severely septic patients who require prolonged mechanical ventilation. In addition, the updated 2014 guidelines of the American Society of Health-System Pharmacists7 continue to recommend stress ulcer prophylaxis in the context of mechanical ventilation, with H2 receptor antagonists being the preferred first-line agents.8
It is important to acknowledge that these recommendations were endorsed despite the lack of obvious mortality benefit, and it is our opinion that large randomized controlled studies are needed to evaluate the risks and mortality benefit of these prophylaxis methods.
- Cook DJ, Fuller HD, Guyatt GH, et al. Risk factors for gastrointestinal bleeding in critically ill patients. Canadian Critical Care Trials Group. N Engl J Med 1994; 330:377–381.
- Cook DJ, Griffith LE, Walter SD, et al. The attributable mortality and length of intensive care unit stay of clinically important gastrointestinal bleeding in critically ill patients. Crit Care 2001; 5:368–375.
- Zandstra DF, Stoutenbeek CP. The virtual absence of stress-ulceration related bleeding in ICU patients receiving prolonged mechanical ventilation without any prophylaxis. A prospective cohort study. Intensive Care Med 1994; 20:335–340.
- Ellison RT, Perez-Perez G, Welsh CH, et al. Risk factors for upper gastrointestinal bleeding in intensive care unit patients: role of Helicobacter pylori. Federal Hyperimmune Immunoglobulin Therapy Study Group. Crit Care Med 1996; 24:1974–1981.
- Duerksen DR. Stress-related mucosal disease in critically ill patients. Best Pract Res Clin Gastroenterol 2003; 17:327–344.
- Marik PE, Vasu T, Hirani A, Pachinburavan M. Stress ulcer prophylaxis in the new millennium: a systematic review and meta-analysis. Crit Care Med 2010; 38:2222–2228.
- Cohen H, editor. Stop stressing out: the new stress ulcer prophylaxis (SUP) guidelines are finally here! ASHP Midyear Clinical Meeting; 2013 11 Dec 2013; Orlando, FL.