User login
EMR notes should communicate and educate
To the Editor: Dr. Venkat1 was spot on when he identified the need for electronic medical records to communicate and educate, rather than document. Short and actionable notes are best. But with the focus on billing and compliance, annotated, informative assessments are actually discouraged. Our billing and coding department performs periodic chart audits and considers the note “out of compliance” if there is a difference between the list of free text assessments and the International Classification of Diseases, Ninth Revision (ICD-9) codes chosen. Therefore, many physicians just use the billing codes as their assessment and skip the free text assessment section of a SOAP (subjective-objective-assessment-plan) note, which means the notes convey even less of what the physician is thinking. A classic example is the note of a patient whom I knew had pernio, yet the assessment blandly reported “circulatory disorder.” The plan likewise is often reduced to the imported structured text of the tests and medications ordered rather than a rich discussion of the differential diagnosis and medical reasoning.
Imagine the notes we might write if their primary purpose was communication to ourselves and the others involved in our patients’ care. Imagine if the notes made us more knowledgeable about the uniqueness of this particular patient and also contributed to a continuous learning environment. More meaning, less filler. The notes would be shorter and sweeter, as Dr. Venkat suggested.
- Venkat KK. Short and sweet: writing better consult notes in the era of the electronic medical record. Cleve Clin J Med 2015; 82:13–17.
To the Editor: Dr. Venkat1 was spot on when he identified the need for electronic medical records to communicate and educate, rather than document. Short and actionable notes are best. But with the focus on billing and compliance, annotated, informative assessments are actually discouraged. Our billing and coding department performs periodic chart audits and considers the note “out of compliance” if there is a difference between the list of free text assessments and the International Classification of Diseases, Ninth Revision (ICD-9) codes chosen. Therefore, many physicians just use the billing codes as their assessment and skip the free text assessment section of a SOAP (subjective-objective-assessment-plan) note, which means the notes convey even less of what the physician is thinking. A classic example is the note of a patient whom I knew had pernio, yet the assessment blandly reported “circulatory disorder.” The plan likewise is often reduced to the imported structured text of the tests and medications ordered rather than a rich discussion of the differential diagnosis and medical reasoning.
Imagine the notes we might write if their primary purpose was communication to ourselves and the others involved in our patients’ care. Imagine if the notes made us more knowledgeable about the uniqueness of this particular patient and also contributed to a continuous learning environment. More meaning, less filler. The notes would be shorter and sweeter, as Dr. Venkat suggested.
- Venkat KK. Short and sweet: writing better consult notes in the era of the electronic medical record. Cleve Clin J Med 2015; 82:13–17.
- Venkat KK. Short and sweet: writing better consult notes in the era of the electronic medical record. Cleve Clin J Med 2015; 82:13–17.
Lactic acidosis: Clinical implications and management strategies
Physicians are paying more attention to serum lactate levels in hospitalized patients than in the past, especially with the advent of point-of-care testing. Elevated lactate levels are associated with tissue hypoxia and hypoperfusion but can also be found in a number of other conditions. Therefore, confusion can arise as to how to interpret elevated levels and subsequently manage these patients in a variety of settings.
In this review, we discuss the mechanisms underlying lactic acidosis, its prognostic implications, and its use as a therapeutic target in treating patients in septic shock and other serious disorders.
LACTATE IS A PRODUCT OF ANAEROBIC RESPIRATION
Lactate, or lactic acid, is produced from pyruvate as an end product of glycolysis under anaerobic conditions (Figure 1). It is produced in most tissues in the body, but primarily in skeletal muscle, brain, intestine, and red blood cells. During times of stress, lactate is also produced in the lungs, white blood cells, and splanchnic organs.
Most lactate in the blood is cleared by the liver, where it is the substrate for gluconeogenesis, and a small amount is cleared by the kidneys.1,2 The entire pathway by which lactate is produced and converted back to glucose is called the Cori cycle.
NORMAL LEVELS ARE LESS THAN ABOUT 2.0 MMOL/L
In this review, we will present lactate levels in the SI units of mmol/L (1 mmol/L = 9 mg/dL).
Basal lactate production is approximately 0.8 mmol/kg body weight/hour. The average normal arterial blood lactate level is approximately 0.620 mmol/L and the venous level is slightly higher at 0.997 mmol/L,3 but overall, arterial and venous lactate levels correlate well.
Normal lactate levels are less than 2 mmol/L,4 intermediate levels range from 2 to less than 4 mmol/L, and high levels are 4 mmol/L or higher.5
To minimize variations in measurement, blood samples should be drawn without a tourniquet into tubes containing fluoride, placed on ice, and processed quickly (ideally within 15 minutes).
INCREASED PRODUCTION, DECREASED CLEARANCE, OR BOTH
An elevated lactate level can be the result of increased production, decreased clearance, or both (as in liver dysfunction).
Type A lactic acidosis—due to hypoperfusion and hypoxia—occurs when there is a mismatch between oxygen delivery and consumption, with resultant anaerobic glycolysis.
The guidelines from the Surviving Sepsis Campaign6 emphasize using lactate levels to diagnose patients with sepsis-induced hypoperfusion. However, hyperlactatemia can indicate inadequate oxygen delivery due to any type of shock (Table 1).
Type B lactic acidosis—not due to hypoperfusion—occurs in a variety of conditions (Table 1), including liver disease, malignancy, use of certain medications (eg, metformin, epinephrine), total parenteral nutrition, human immunodeficiency virus infection, thiamine deficiency, mitochondrial myopathies, and congenital lactic acidosis.1–3,7 Yet other causes include trauma, excessive exercise, diabetic ketoacidosis, ethanol intoxication, dysfunction of the enzyme pyruvate dehydrogenase, and increased muscle degradation leading to increased production of pyruvate. In these latter scenarios, glucose metabolism exceeds the oxidation capacity of the mitochondria, and the rise in pyruvate concentration drives lactate production.8,9 Mitochondrial dysfunction and subsequent deficits in cellular oxygen use can also result in persistently high lactate levels.10
In some situations, patients with mildly elevated lactic acid levels in type B lactic acidosis can be monitored to ensure stability, rather than be treated aggressively.
HIGHER LEVELS AND LOWER CLEARANCE PREDICT DEATH
The higher the lactate level and the slower the rate of normalization (lactate clearance), the higher the risk of death.
Lactate levels and mortality rate
Shapiro et al11 showed that increases in lactate level are associated with proportional increases in the mortality rate. Mikkelsen et al12 showed that intermediate levels (2.0–3.9 mmol/L) and high levels (≥ 4 mmol/L) of serum lactate are associated with increased risk of death independent of organ failure and shock. Patients with mildly elevated and intermediate lactate levels and sepsis have higher rates of in-hospital and 30-day mortality, which correlate with the baseline lactate level.13
In a post hoc analysis of a randomized controlled trial, patients with septic shock who presented to the emergency department with hypotension and a lactate level higher than 2 mmol/L had a significantly higher in-hospital mortality rate than those who presented with hypotension and a lactate level of 2 mmol/L or less (26% vs 9%, P < .0001).14 These data suggest that elevated lactate levels may have a significant prognostic role, independent of blood pressure.
Slower clearance
The prognostic implications of lactate clearance (reductions in lactate levels over time, as opposed to a single value in time), have also been evaluated.
Lactate clearance of at least 10% at 6 hours after presentation has been associated with a lower mortality rate than nonclearance (19% vs 60%) in patients with sepsis or septic shock with elevated levels.15–17 Similar findings have been reported in a general intensive care unit population,18 as well as a surgical intensive care population.sup>19
Puskarich et al20 have also shown that lactate normalization to less than 2 mmol/L during early sepsis resuscitation is the strongest predictor of survival (odds ratio [OR] 5.2), followed by lactate clearance of 50% (OR 4.0) within the first 6 hours of presentation. Not only is lactate clearance associated with improved outcomes, but a faster rate of clearance after initial presentation is also beneficial.15,16,18
Lactate clearance over a longer period (> 6 hours) has not been studied in patients with septic shock. However, in the general intensive care unit population, therapy guided by lactate clearance for the first 8 hours after presentation has shown a reduction in mortality rate.18 There are no data available on outcomes of lactate-directed therapy beyond 8 hours, but lactate concentration and lactate clearance at 24 hours correlate with the 28-day mortality rate.21
Cryptic shock
Cryptic shock describes a state in a subgroup of patients who have elevated lactate levels and global tissue hypoxia despite being normotensive or even hypertensive. These patients have a higher mortality rate independent of blood pressure. Jansen et al18 found that patients with a lactate level higher than 4 mmol/L and preserved blood pressure had a mortality rate of 15%, while those without shock or hyperlactatemia had a mortality rate of 2.5%. In addition, patients with an elevated lactate level in the absence of hypotension have mortality rates similar to those in patients with high lactate levels and hypotension refractory to fluid boluses, suggesting the presence of tissue hypoxia even in these normotensive patients.6
HOW TO APPROACH AN ELEVATED LACTATE LEVEL
An elevated lactate level should prompt an evaluation for causes of decreased oxygen delivery, due either to a systemic low-flow state (as a result of decreased cardiac output) or severe anemia, or to regionally decreased perfusion, (eg, limb or mesenteric ischemia). If tissue hypoxia is ruled out after an exhaustive workup, consideration should be given to causes of hyperlactatemia without concomitant tissue hypoxia (type B acidosis).
Treatment differs depending on the underlying mechanism of the lactate elevation; nevertheless, treatment is mostly related to optimizing oxygen delivery by giving fluids, packed red blood cells, and vasopressors or inotropic agents, or both (Figure 2). The specific treatment differs based on the shock state, but there are similarities that can guide the clinician.
FLUID SUPPORT
Giving fluids, with a goal of improving cardiac output, remains a cornerstone of initial therapy for most shock states.22,23
How much fluid?
Fluids should be given until the patient is no longer preload-dependent, although there is much debate about which assessment strategy should be used to determine if cardiac output will improve with more fluid (ie, fluid-responsiveness).24 In many cases, fluid resuscitation alone may be enough to restore hemodynamic stability, improve tissue perfusion, and reduce elevated lactate concentrations.25
The decision to give more fluids should not be made lightly, though, as a more positive fluid balance early in the course of septic shock and over 4 days has been associated with a higher mortality rate.26 Additionally, pushing fluids in patients with cardiogenic shock due to impaired left ventricular systolic function may lead to or worsen pulmonary edema. Therefore, the indiscriminate use of fluids should be avoided.
Which fluids?
Despite years of research, controversy persists about whether crystalloids or colloids are better for resuscitation. Randomized trials in heterogeneous intensive care unit patients have not detected differences in 28-day mortality rates between those allocated to crystalloids or 4% albumin27 and those allocated to crystalloids or hydroxyethyl starch.28
Hydroxyethyl starch may not be best. In a study of patients with severe sepsis, those randomized to receive hydroxyethyl starch had a higher 90-day mortality rate than patients randomized to crystalloids (51% vs 43%, P = .03).29 A sequential prospective before-and-after study did not detect a difference in the time to normalization (< 2.2 mmol/L) of lactate (P = .68) or cessation of vasopressors (P = .11) in patients with severe sepsis who received fluid resuscitation with crystalloids, gelatin, or hydroxyethyl starch. More patients who received hydroxyethyl starch in these studies developed acute kidney injury than those receiving crystalloids.28–30
Taken together, these data strongly suggest hydroxyethyl starch should not be used for fluid resuscitation in the intensive care unit.
Normal saline or albumin? Although some data suggest that albumin may be preferable to 0.9% sodium chloride in patients with severe sepsis,31,32 these analyses should be viewed as hypothesis-generating. There do not seem to be differences between fluid types in terms of subsequent serum lactate concentrations or achievement of lactate clearance goals.28–30 Until further studies are completed, both albumin and crystalloids are reasonable for resuscitation.
Caironi et al33 performed an open-label study comparing albumin replacement (with a goal serum albumin concentration of 3 g/dL) plus a crystalloid solution vs a crystalloid solution alone in patients with severe sepsis or septic shock. They detected no difference between the albumin and crystalloid groups in mortality rates at 28 days (31.8% vs 32.0%, P = .94) or 90 days (41.1% vs 43.6%, P = .29). However, patients in the albumin group had a shorter time to cessation of vasoactive agents (median 3 vs 4 days, P = .007) and lower cardiovascular Sequential Organ Failure Assessment subscores (median 1.20 vs 1.42, P = .03), and more frequently achieved a mean arterial pressure of at least 65 mm Hg within 6 hours of randomization (86.0% vs 82.5%, P = .04).
Although serum lactate levels were lower in the albumin group at baseline (1.7 mmol/L vs 1.8 mmol/L, P = .05), inspection of the data appears to show a similar daily lactate clearance rate between groups over the first 7 study days (although these data were not analyzed by the authors). Achievement of a lactate level lower than 2 mmol/L on the first day of therapy was not significantly different between groups (73.4% vs 72.5%, P = .11).33
In a post hoc subgroup analysis, patients with septic shock at baseline randomized to albumin had a lower 90-day mortality rate than patients randomized to crystalloid solutions (RR 0.87, 95% CI 0.77–0.99). There was no difference in the 90-day mortality rate in patients without septic shock (RR 1.13, 95% CI 0.92–1.39, P = .03 for heterogeneity).33
These data suggest that albumin replacement may not improve outcomes in patients with severe sepsis, but may have advantages in terms of hemodynamic variables (and potentially mortality) in patients with septic shock. The role of albumin replacement in patients with septic shock warrants further study.
VASOPRESSORS
Vasopressors, inotropes, or both should be given to patients who have signs of hypoperfusion (including elevated lactate levels) despite preload optimization or ongoing fluid administration. The most appropriate drug depends on the goal: vasopressors are used to increase systemic vascular resistance, while inotropes are used to improve cardiac output and oxygen delivery.
Blood pressure target
The Surviving Sepsis Campaign guidelines recommend a mean arterial blood pressure target of at least 65 mm Hg during initial resuscitation and when vasopressors are applied for patients with septic shock.22 This recommendation is based on small studies that did not show differences in serum lactate levels or regional blood flow when the mean arterial pressure was elevated above 65 mm Hg with norepinephrine.34,35 However, the campaign guidelines note that the mean arterial pressure goal must be individualized in order to achieve optimal perfusion.
A large, open-label trial36 detected no difference in 28-day mortality rates in patients with septic shock between those allocated to a mean arterial pressure goal of 80 to 85 mm Hg or 65 to 70 mm Hg (36.6% vs 34.0%, P = .57). Although lactate levels did not differ between groups, the incidence of new-onset atrial fibrillation was higher in the higher-target group (6.7% vs 2.8%, P = .02). Fewer patients with chronic hypertension needed renal replacement therapy in the higher pressure group, further emphasizing the need to individualize the mean arterial pressure goal for patients in shock.36
Which vasopressor agent?
Dopamine and norepinephrine have traditionally been the preferred initial vasopressors for patients with shock. Until recently there were few data to guide selection between the two, but this is changing.
In a 2010 study of 1,679 patients with shock requiring vasopressors, there was no difference in the 28-day mortality rate between patients randomized to dopamine or norepinephrine (53% vs 49%, P = .10).37 Patients allocated to dopamine, though, had a higher incidence of arrhythmias (24% vs 12%, P < .001) and more frequently required open-label norepinephrine (26% vs 20%, P < .001). Although lactate levels and the time to achievement of a mean arterial pressure of 65 mm Hg were similar between groups, patients allocated to norepinephrine had more vasopressor-free days through day 28.
An a priori-planned subgroup analysis evaluated the influence of the type of shock on patient outcome. Patients with cardiogenic shock randomized to dopamine had a higher mortality rate than those randomized to norepinephrine (P = .03). However, the overall effect of treatment did not differ among the shock subgroups (interaction P = .87), suggesting that the reported differences in mortality according to subgroup may be spurious.
In a 2012 meta-analysis of patients with septic shock, dopamine use was associated with a higher mortality rate than norepinephrine use.38
In light of these data, norepinephrine should be preferred over dopamine as the initial vasopressor in most types of shock.
Epinephrine does not offer an outcome advantage over norepinephrine and may be associated with a higher incidence of adverse events.39–42 Indeed, in a study of patients with septic shock, lactate concentrations on the first day after randomization were significantly higher in patients allocated to epinephrine than in patients allocated to norepinephrine plus dobutamine.39 Similar effects on lactate concentrations with epinephrine were seen in patients with various types of shock40 and in those with cardiogenic shock.42
These differences in lactate concentrations may be directly attributable to epinephrine. Epinephrine can increase lactate concentrations through glycolysis and pyruvate dehydrogenase activation by stimulation of sodium-potassium ATPase activity via beta-2 adrenergic receptors in skeletal muscles,43 as well as decrease splanchnic perfusion.42,44,45 These effects may preclude using lactate clearance as a resuscitation goal in patients receiving epinephrine. Epinephrine is likely best reserved for patients with refractory shock,22 particularly those in whom cardiac output is known to be low.
Phenylephrine, essentially a pure vasoconstrictor, should be avoided in low cardiac output states and is best reserved for patients who develop a tachyarrhythmia on norepinephrine.22
Vasopressin, also a pure vasoconstrictor that should be avoided in low cardiac output states, has been best studied in patients with vasodilatory shock. Although controversy exists on the mortality benefits of vasopressin in vasodilatory shock, it is a relatively safe drug with consistent norepinephrine-sparing effects when added to existing norepinephrine therapy.46,47 In patients with less severe septic shock, including those with low lactate concentrations, adding vasopressin to norepinephrine instead of continuing norepinephrine alone may confer a mortality advantage.48
OTHER MEASURES TO OPTIMIZE OXYGEN DELIVERY
In circulatory shock from any cause, tissue oxygen demand exceeds oxygen delivery. Once arterial oxygenation and hemoglobin levels (by packed red blood cell transfusion) have been optimized, cardiac output is the critical determinant of oxygen delivery. Cardiac output may be augmented by ensuring adequate preload (by fluid resuscitation) or by giving inotropes or vasodilators.
The optimal cardiac output is difficult to define, and the exact marker for determining when cardiac output should be augmented is unclear. A strategy of increasing cardiac output to predefined “supranormal” levels was not associated with a lower mortality rate.49 Therefore, the decision to augment cardiac output must be individualized and will likely vary in the same patient over time.23
A reasonable approach to determining when augmentation of cardiac output is necessary was proposed in a study by Rivers et al.50 In that study, in patients randomized to early goal-directed therapy, inotropes were recommended when the central venous oxygenation saturation (Scvo2) was below 70% despite adequate fluid resuscitation (central venous pressure ≥ 8 mm Hg) and hematocrits were higher than 30%.
When an inotrope is indicated to improve cardiac output, dobutamine is usually the preferred agent. Dobutamine has a shorter half-life (allowing for easier titration) and causes less hypotension (assuming preload has been optimized) than phosphodiesterase type III inhibitors such as milrinone.
Mechanical support devices, such as intra-aortic balloon counterpulsation, and vasodilators can also be used to improve tissue perfusion in selected patients with low cardiac output syndromes.
USING LACTATE LEVELS TO GUIDE THERAPY
Lactate levels above 4.0 mmol/L
Lactate may be a useful marker for determining whether organ dysfunction is present and, hence, what course of therapy should be given, especially in sepsis. A serum lactate level higher than 4.0 mmol/L has been used as the trigger to start aggressive resuscitation in patients with sepsis.50,51
Traditionally, as delineated by Rivers et al50 in their landmark study of early goal-directed therapy, this entailed placing an arterial line and a central line for hemodynamic monitoring, with specific interventions directed at increasing the central venous pressure, mean arterial pressure, and central venous oxygen saturation.50 However, a recent study in a similar population of patients with sepsis with elevated lactate found no significant advantage of protocol-based resuscitation over care provided according to physician judgment, and no significant benefit in central venous catheterization and hemodynamic monitoring in all patients.51
Lactate clearance: 10% or above at 8 hours?
Regardless of the approach chosen, decreasing lactate levels can be interpreted as an adequate response to the interventions provided. As a matter of fact, several groups of investigators have also demonstrated the merits of lactate clearance alone as a prognostic indicator in patients requiring hemodynamic support.
McNelis et al52 retrospectively evaluated 95 postsurgical patients who required hemodynamic monitoring.52,53 The authors found that the slower the lactate clearance, the higher the mortality rate.
Given the prognostic implications of lactate clearance, investigators have evaluated whether lactate clearance could be used as a surrogate resuscitation goal for optimizing oxygen delivery. Using lactate clearance may have significant practical advantages over using central venous oxygen saturation, since it does not require a central venous catheter or continuous oximetric monitoring.
In a study comparing these two resuscitation end points, patients were randomized to a goal of either central venous oxygen saturation of 70% or more or lactate clearance of 10% or more within the first 6 hours after presentation as a marker of oxygen delivery.53 Mortality rates were similar with either strategy. Of note, only 10% of the patients actually required therapies to improve their oxygen delivery. Furthermore, there were no differences in the treatments given (including fluids, vasopressors, inotropes, packed red blood cells) throughout the treatment period.
These findings provide several insights. First, few patients admitted to the emergency department with severe sepsis and treated with an initial quantitative resuscitation protocol require additional therapy for augmenting oxygen delivery. Second, lactate clearance, in a setting where initial resuscitation with fluids and vasopressors restores adequate oxygen delivery for the majority of patients, is likely as good a target for resuscitation as central venous oxygen saturation.
This study, however, does not address the question of whether lactate clearance is useful as an additional marker of oxygen delivery (in conjunction with central venous oxygen saturation). Indeed, caution should be taken to target central venous oxygen saturation goals alone, as patients with septic shock presenting with venous hyperoxia (central venous oxygen saturation > 89%) have been shown to have a higher mortality rate than patients with normoxia (central venous oxygen saturation 71%–89%).54
This was further demonstrated by Arnold et al in a study of patients presenting to the emergency department with severe sepsis.15 In this study, significant discordance between central venous oxygen saturation and lactate clearance was seen, where 79% of patients with less than 10% lactate clearance had concomitant central venous oxygen saturation of 70% or greater.
Jansen et al18 evaluated the role of targeting lactate clearance in conjunction with central venous oxygen saturation monitoring. In this study, critically ill patients with elevated lactate and inadequate lactate clearance were randomized to usual care or to resuscitation to adequate lactate clearance (20% or more). The therapies to optimize oxygen delivery were given according to the central venous oxygen saturation. Overall, after adjustment for predefined risk factors, the in-hospital mortality rate was lower in the lactate clearance group. This may signify that patients with sepsis and central venous oxygen saturation of 70% or more may continue to have poor lactate clearance, warranting further treatment.
Taken together, serum lactate may be helpful for prognostication, determination of course of therapy, and quantification for tissue hypoperfusion for targeted therapies. Figure 2 presents our approach to an elevated lactate level. As performed in the study by Jansen et al,18 it seems reasonable to measure lactate levels every 2 hours for the first 8 hours of resuscitation in patients with type A lactic acidosis. These levels should be interpreted in the context of lactate clearance (at least 10%, but preferably 20%) and normalization, and should be treated with an approach similar to the one outlined in Figure 2.
TREATING TYPE B LACTIC ACIDOSIS (NORMAL PERFUSION AND OXYGENATION)
Treating type B lactic acidosis is quite different because the goal is not to correct mismatches in oxygen consumption and delivery. Since most cases are due to underlying conditions such as malignancy or medications, treatment should be centered around eliminating the cause (eg, treat the malignancy, discontinue the offending medication). The main reason for treatment is to alleviate the harmful effects of acidosis. For example, acidosis can result in a negative inotropic effect.
Sodium bicarbonate, dichloroacetate, carbicarb, and tromethamine have all been studied in the management of type B lactic acidosis, with little success.55,56
Renal replacement therapy has had some success in drug-induced lactic acidosis.57,58
l-carnitine has had promising results in treating patients with human immunodeficiency virus infection, since these patients are carnitine-deficient and carnitine plays an important role in mitochondrial function.59
Thiamine and biotin deficiencies can occur in patients receiving total parenteral nutrition without vitamins and in patients who drink alcohol heavily and can cause lactic acidosis. These nutrients should be supplemented accordingly.
Treatment of mitochondrial disorders includes antioxidants (coenzyme Q10, vitamin C, vitamin E) and amino acids (l-arginine).60
- Andersen LW, Mackenhauer J, Roberts JC, Berg KM, Cocchi MN, Donnino MW. Etiology and therapeutic approach to elevated lactate levels. Mayo Clin Proc 2013; 88:1127–1140.
- Fuller BM, Dellinger RP. Lactate as a hemodynamic marker in the critically ill. Curr Opin Crit Care 2012; 18:267–272.
- Fall PJ, Szerlip HM. Lactic acidosis: from sour milk to septic shock. J Intensive Care Med 2005; 20:255–271.
- Kruse O, Grunnet N, Barfod C. Blood lactate as a predictor for in-hospital mortality in patients admitted acutely to hospital: a systematic review. Scand J Trauma Resusc Emerg Med 2011;19:74.
- Howell MD, Donnino M, Clardy P, Talmor D, Shapiro NI. Occult hypoperfusion and mortality in patients with suspected infection. Intensive Care Med 2007; 33:1892–1899.
- Puskarich MA, Trzeciak S, Shapiro NI, et al. Outcomes of patients undergoing early sepsis resuscitation for cryptic shock compared with overt shock. Resuscitation 2011; 82:1289–1293.
- Bakker J, Nijsten MW, Jansen TC. Clinical use of lactate monitoring in critically ill patients. Ann Intensive Care 2013; 3:12.
- Levy B, Gibot S, Franck P, Cravoisy A, Bollaert PE. Relation between muscle Na+K+ ATPase activity and raised lactate concentrations in septic shock: a prospective study. Lancet 2005; 365:871–875.
- Vary TC. Sepsis-induced alterations in pyruvate dehydrogenase complex activity in rat skeletal muscle: effects on plasma lactate. Shock 1996; 6:89–94.
- Brealey D, Brand M, Hargreaves I, et al. Association between mitochondrial dysfunction and severity and outcome of septic shock. Lancet 2002; 360:219–223.
- Shapiro NI, Howell MD, Talmor D, et al. Serum lactate as a predictor of mortality in emergency department patients with infection. Ann Emerg Med 2005; 45:524–528.
- Mikkelsen ME, Miltiades AN, Gaieski DF, et al. Serum lactate is associated with mortality in severe sepsis independent of organ failure and shock. Crit Care Med 2009; 37:1670–1677.
- Liu V, Morehouse JW, Soule J, Whippy A, Escobar GJ. Fluid volume, lactate values, and mortality in sepsis patients with intermediate lactate values. Ann Am Thorac Soc 2013; 10:466–473.
- Sterling SA, Puskarich MA, Shapiro NI, et al; Emergency Medicine Shock Research Network (EMShockNET). Characteristics and outcomes of patients with vasoplegic versus tissue dysoxic septic shock. Shock 2013; 40:11–14.
- Arnold RC, Shapiro NI, Jones AE, et al; Emergency Medicine Shock Research Network (EMShockNet) Investigators. Multicenter study of early lactate clearance as a determinant of survival in patients with presumed sepsis. Shock 2009; 32:35–39.
- Jones AE. Lactate clearance for assessing response to resuscitation in severe sepsis. Acad Emerg Med 2013; 20:844–847.
- Nguyen HB, Rivers EP, Knoblich BP, et al. Early lactate clearance is associated with improved outcome in severe sepsis and septic shock. Crit Care Med 2004; 32:1637–1642.
- Jansen TC, van Bommel J, Schoonderbeek FJ, et al; LACTATE study group. Early lactate-guided therapy in intensive care unit patients: a multicenter, open-label, randomized controlled trial. Am J Respir Crit Care Med 2010; 182:752–761.
- Husain FA, Martin MJ, Mullenix PS, Steele SR, Elliott DC. Serum lactate and base deficit as predictors of mortality and morbidity. Am J Surg 2003; 185:485–491.
- Puskarich MA, Trzeciak S, Shapiro NI, et al. Whole blood lactate kinetics in patients undergoing quantitative resuscitation for severe sepsis and septic shock. Chest 2013; 143:1548–1553.
- Marty P, Roquilly A, Vallee F, et al. Lactate clearance for death prediction in severe sepsis or septic shock patients during the first 24 hours in intensive care unit: an observational study. Ann Intensive Care 2013; 3:3.
- Dellinger RP, Levy MM, Rhodes A, et al; Surviving Sepsis Campaign Guidelines Committee including the Pediatric Subgroup. Surviving sepsis campaign: International guidelines for management of severe sepsis and septic shock: 2012. Crit Care Med 2013; 41:580–637.
- Vincent JL, De Backer D. Circulatory shock. N Engl J Med 2013; 369:1726–1734.
- Durairaj L, Schmidt GA. Fluid therapy in resuscitated sepsis: less is more. Chest 2008; 133:252–263.
- Vincent JL, Dufaye P, Berré J, Leeman M, Degaute JP, Kahn RJ. Serial lactate determinations during circulatory shock. Crit Care Med 1983; 11:449–451.
- Boyd JH, Forbes J, Nakada TA, Walley KR, Russell JA. Fluid resuscitation in septic shock: a positive fluid balance and elevated central venous pressure are associated with increased mortality. Crit Care Med 2011; 39:259–265.
- Finfer S, Bellomo R, Boyce N, French J, Myburgh J, Norton R; SAFE Study Investigators. A comparison of albumin and saline for fluid resuscitation in the intensive care unit. N Engl J Med 2004; 350:2247–2256.
- Myburgh JA, Finfer S, Bellomo R, et al; CHEST Investigators; Australian and New Zealand Intensive Care Society Clinical Trials Group. Hydroxyethyl starch or saline for fluid resuscitation in intensive care. N Engl J Med 2012; 367:1901–1911.
- Perner A, Haase N, Guttormsen AB, et al; 6S Trial Group; Scandinavian Critical Care Trials Group. Hydroxyethyl starch 130/0.42 versus Ringer’s acetate in severe sepsis. N Engl J Med 2012; 367:124–134.
- Bayer O, Reinhart K, Kohl M, et al. Effects of fluid resuscitation with synthetic colloids or crystalloids alone on shock reversal, fluid balance, and patient outcomes in patients with severe sepsis: a prospective sequential analysis. Crit Care Med 2012; 40:2543–2551.
- Delaney AP, Dan A, McCaffrey J, Finfer S. The role of albumin as a resuscitation fluid for patients with sepsis: a systematic review and meta-analysis. Crit Care Med 2011; 39:386–391.
- SAFE Study Investigators; Finfer S, McEvoy S, Bellomo R, McArthur C, Myburgh J, Norton R. Impact of albumin compared to saline on organ function and mortality of patients with severe sepsis. Intensive Care Med 2011; 37:86–96.
- Caironi P, Tognoni G, Masson S, et al; ALBIOS Study Investigators. Albumin replacement in patients with severe sepsis or septic shock. N Engl J Med 2014; 370:1412–1421.
- Bourgoin A, Leone M, Delmas A, Garnier F, Albanèse J, Martin C. Increasing mean arterial pressure in patients with septic shock: effects on oxygen variables and renal function. Crit Care Med 2005; 33:780–786.
- LeDoux D, Astiz ME, Carpati CM, Rackow EC. Effects of perfusion pressure on tissue perfusion in septic shock. Crit Care Med 2000; 28:2729–2732.
- Asfar P, Meziani F, Hamel JF, et al; SEPSISPAM Investigators. High versus low blood-pressure target in patients with septic shock. N Engl J Med 2014; 370:1583–1593.
- De Backer D, Biston P, Devriendt J, et al; SOAP II Investigators. Comparison of dopamine and norepinephrine in the treatment of shock. N Engl J Med 2010; 362:779–789.
- De Backer D, Aldecoa C, Njimi H, Vincent JL. Dopamine versus norepinephrine in the treatment of septic shock: a meta-analysis. Crit Care Med 2012; 40:725–730.
- Annane D, Vignon P, Renault A, et al: CATS Study Group. Norepinephrine plus dobutamine versus epinephrine alone for management of septic shock: a randomised trial. Lancet 2007; 370:676–684.
- Myburgh JA, Higgins A, Jovanovska A, Lipman J, Ramakrishnan N, Santamaria J; CAT Study investigators. A comparison of epinephrine and norepinephrine in critically ill patients. Intensive Care Med 2008; 34:2226–2234.
- Schmittinger CA, Torgersen C, Luckner G, Schröder DC, Lorenz I, Dünser MW. Adverse cardiac events during catecholamine vasopressor therapy: a prospective observational study. Intensive Care Med 2012; 38:950–958.
- Levy B, Perez P, Perny J, Thivilier C, Gerard A. Comparison of norepinephrine-dobutamine to epinephrine for hemodynamics, lactate metabolism, and organ function variables in cardiogenic shock. A prospective, randomized pilot study. Crit Care Med 2011; 39:450–455.
- Watt MJ, Howlett KF, Febbraio MA, Spriet LL, Hargreaves M. Adrenaline increases skeletal muscle glycogenolysis, pyruvate dehydrogenase activation and carbohydrate oxidation during moderate exercise in humans. J Physiol 2001; 534:269–278.
- De Backer D, Creteur J, Silva E, Vincent JL. Effects of dopamine, norepinephrine, and epinephrine on the splanchnic circulation in septic shock: which is best? Crit Care Med 2003; 31:1659–1667.
- Levy B, Bollaert PE, Charpentier C, et al. Comparison of norepinephrine and dobutamine to epinephrine for hemodynamics, lactate metabolism, and gastric tonometric variables in septic shock: a prospective, randomized study. Intensive Care Med 1997; 23:282–287.
- Polito A, Parisini E, Ricci Z, Picardo S, Annane D. Vasopressin for treatment of vasodilatory shock: an ESICM systematic review and meta-analysis. Intensive Care Med 2012; 38:9–19.
- Serpa Neto A, Nassar APJ, Cardoso SO, et al. Vasopressin and terlipressin in adult vasodilatory shock: a systematic review and meta-analysis of nine randomized controlled trials. Crit Care 2012; 16:R154.
- Russell JA, Walley KR, Singer J, et al; VASST Investigators. Vasopressin versus norepinephrine infusion in patients with septic shock. N Engl J Med 2008; 358:877–887.
- Gattinoni L, Brazzi L, Pelosi P, et al; for the SvO2 Collaborative Group. A trial of goal-oriented hemodynamic therapy in critically ill patients. N Engl J Med 1995; 333:1025–1032.
- Rivers E, Nguyen B, Havstad S, et al; Early Goal-Directed Therapy Collaborative Group. Early goal-directed therapy in the treatment of severe sepsis and septic shock. N Engl J Med 2001; 345:1368–1377.
- ProCESS Investigators; Yealy DM, Kellum JA, Huang DT, et al. A randomized trial of protocol-based care for early septic shock. N Engl J Med 2014; 370:1683–1693.
- McNelis J, Marini CP, Jurkiewicz A, et al. Prolonged lactate clearance is associated with increased mortality in the surgical intensive care unit. Am J Surg 2001; 182:481–485.
- Jones AE, Shapiro NI, Trzeciak S, Arnold RC, Claremont HA, Kline JA; Emergency Medicine Shock Research Network (EMShockNet) Investigators. Lactate clearance vs central venous oxygen saturation as goals of early sepsis therapy: a randomized clinical trial. JAMA 2010; 303:739–746.
- Pope JV, Jones AE, Gaieski DF, Arnold RC, Trzeciak S, Shapiro NI; Emergency Medicine Shock Research Network (EMShockNet) Investigators. Multicenter study of central venous oxygen saturation (ScvO2) as a predictor of mortality in patients with sepsis. Ann Emerg Med 2010; 55:40–46.e1
- Kraut JA, Kurtz I. Use of base in the treatment of severe acidemic states. Am J Kidney Dis 2001; 38:703–727.
- Levraut J, Grimaud D. Treatment of metabolic acidosis. Curr Opin Crit Care 2003; 9:260–265.
- Orija AA, Jenks CL. Nucleoside analog reverse transcriptase inhibitor induced lactic acidosis treated with continuous renal replacement in the medical intensive care unit. Crit Care & Shock 2012; 15:9–11.
- Friesecke S, Abel P, Kraft M, Gerner A, Runge S. Combined renal replacement therapy for severe metformin-induced lactic acidosis. Nephrol Dial Transplant 2006; 21:2038–2039.
- Claessens YE, Cariou A, Monchi M, et al. Detecting life-threatening lactic acidosis related to nucleoside-analog treatment of human immunodeficiency virus-infected patients, and treatment with l-carnitine. Crit Care Med 2003; 31:1042–1047.
- Parikh S, Saneto R, Falk MJ, Anselm I, Cohen BH, Haas R; Medicine Society TM. A modern approach to the treatment of mitochondrial disease. Curr Treat Options Neurol 2009; 11:414–430.
Physicians are paying more attention to serum lactate levels in hospitalized patients than in the past, especially with the advent of point-of-care testing. Elevated lactate levels are associated with tissue hypoxia and hypoperfusion but can also be found in a number of other conditions. Therefore, confusion can arise as to how to interpret elevated levels and subsequently manage these patients in a variety of settings.
In this review, we discuss the mechanisms underlying lactic acidosis, its prognostic implications, and its use as a therapeutic target in treating patients in septic shock and other serious disorders.
LACTATE IS A PRODUCT OF ANAEROBIC RESPIRATION
Lactate, or lactic acid, is produced from pyruvate as an end product of glycolysis under anaerobic conditions (Figure 1). It is produced in most tissues in the body, but primarily in skeletal muscle, brain, intestine, and red blood cells. During times of stress, lactate is also produced in the lungs, white blood cells, and splanchnic organs.
Most lactate in the blood is cleared by the liver, where it is the substrate for gluconeogenesis, and a small amount is cleared by the kidneys.1,2 The entire pathway by which lactate is produced and converted back to glucose is called the Cori cycle.
NORMAL LEVELS ARE LESS THAN ABOUT 2.0 MMOL/L
In this review, we will present lactate levels in the SI units of mmol/L (1 mmol/L = 9 mg/dL).
Basal lactate production is approximately 0.8 mmol/kg body weight/hour. The average normal arterial blood lactate level is approximately 0.620 mmol/L and the venous level is slightly higher at 0.997 mmol/L,3 but overall, arterial and venous lactate levels correlate well.
Normal lactate levels are less than 2 mmol/L,4 intermediate levels range from 2 to less than 4 mmol/L, and high levels are 4 mmol/L or higher.5
To minimize variations in measurement, blood samples should be drawn without a tourniquet into tubes containing fluoride, placed on ice, and processed quickly (ideally within 15 minutes).
INCREASED PRODUCTION, DECREASED CLEARANCE, OR BOTH
An elevated lactate level can be the result of increased production, decreased clearance, or both (as in liver dysfunction).
Type A lactic acidosis—due to hypoperfusion and hypoxia—occurs when there is a mismatch between oxygen delivery and consumption, with resultant anaerobic glycolysis.
The guidelines from the Surviving Sepsis Campaign6 emphasize using lactate levels to diagnose patients with sepsis-induced hypoperfusion. However, hyperlactatemia can indicate inadequate oxygen delivery due to any type of shock (Table 1).
Type B lactic acidosis—not due to hypoperfusion—occurs in a variety of conditions (Table 1), including liver disease, malignancy, use of certain medications (eg, metformin, epinephrine), total parenteral nutrition, human immunodeficiency virus infection, thiamine deficiency, mitochondrial myopathies, and congenital lactic acidosis.1–3,7 Yet other causes include trauma, excessive exercise, diabetic ketoacidosis, ethanol intoxication, dysfunction of the enzyme pyruvate dehydrogenase, and increased muscle degradation leading to increased production of pyruvate. In these latter scenarios, glucose metabolism exceeds the oxidation capacity of the mitochondria, and the rise in pyruvate concentration drives lactate production.8,9 Mitochondrial dysfunction and subsequent deficits in cellular oxygen use can also result in persistently high lactate levels.10
In some situations, patients with mildly elevated lactic acid levels in type B lactic acidosis can be monitored to ensure stability, rather than be treated aggressively.
HIGHER LEVELS AND LOWER CLEARANCE PREDICT DEATH
The higher the lactate level and the slower the rate of normalization (lactate clearance), the higher the risk of death.
Lactate levels and mortality rate
Shapiro et al11 showed that increases in lactate level are associated with proportional increases in the mortality rate. Mikkelsen et al12 showed that intermediate levels (2.0–3.9 mmol/L) and high levels (≥ 4 mmol/L) of serum lactate are associated with increased risk of death independent of organ failure and shock. Patients with mildly elevated and intermediate lactate levels and sepsis have higher rates of in-hospital and 30-day mortality, which correlate with the baseline lactate level.13
In a post hoc analysis of a randomized controlled trial, patients with septic shock who presented to the emergency department with hypotension and a lactate level higher than 2 mmol/L had a significantly higher in-hospital mortality rate than those who presented with hypotension and a lactate level of 2 mmol/L or less (26% vs 9%, P < .0001).14 These data suggest that elevated lactate levels may have a significant prognostic role, independent of blood pressure.
Slower clearance
The prognostic implications of lactate clearance (reductions in lactate levels over time, as opposed to a single value in time), have also been evaluated.
Lactate clearance of at least 10% at 6 hours after presentation has been associated with a lower mortality rate than nonclearance (19% vs 60%) in patients with sepsis or septic shock with elevated levels.15–17 Similar findings have been reported in a general intensive care unit population,18 as well as a surgical intensive care population.sup>19
Puskarich et al20 have also shown that lactate normalization to less than 2 mmol/L during early sepsis resuscitation is the strongest predictor of survival (odds ratio [OR] 5.2), followed by lactate clearance of 50% (OR 4.0) within the first 6 hours of presentation. Not only is lactate clearance associated with improved outcomes, but a faster rate of clearance after initial presentation is also beneficial.15,16,18
Lactate clearance over a longer period (> 6 hours) has not been studied in patients with septic shock. However, in the general intensive care unit population, therapy guided by lactate clearance for the first 8 hours after presentation has shown a reduction in mortality rate.18 There are no data available on outcomes of lactate-directed therapy beyond 8 hours, but lactate concentration and lactate clearance at 24 hours correlate with the 28-day mortality rate.21
Cryptic shock
Cryptic shock describes a state in a subgroup of patients who have elevated lactate levels and global tissue hypoxia despite being normotensive or even hypertensive. These patients have a higher mortality rate independent of blood pressure. Jansen et al18 found that patients with a lactate level higher than 4 mmol/L and preserved blood pressure had a mortality rate of 15%, while those without shock or hyperlactatemia had a mortality rate of 2.5%. In addition, patients with an elevated lactate level in the absence of hypotension have mortality rates similar to those in patients with high lactate levels and hypotension refractory to fluid boluses, suggesting the presence of tissue hypoxia even in these normotensive patients.6
HOW TO APPROACH AN ELEVATED LACTATE LEVEL
An elevated lactate level should prompt an evaluation for causes of decreased oxygen delivery, due either to a systemic low-flow state (as a result of decreased cardiac output) or severe anemia, or to regionally decreased perfusion, (eg, limb or mesenteric ischemia). If tissue hypoxia is ruled out after an exhaustive workup, consideration should be given to causes of hyperlactatemia without concomitant tissue hypoxia (type B acidosis).
Treatment differs depending on the underlying mechanism of the lactate elevation; nevertheless, treatment is mostly related to optimizing oxygen delivery by giving fluids, packed red blood cells, and vasopressors or inotropic agents, or both (Figure 2). The specific treatment differs based on the shock state, but there are similarities that can guide the clinician.
FLUID SUPPORT
Giving fluids, with a goal of improving cardiac output, remains a cornerstone of initial therapy for most shock states.22,23
How much fluid?
Fluids should be given until the patient is no longer preload-dependent, although there is much debate about which assessment strategy should be used to determine if cardiac output will improve with more fluid (ie, fluid-responsiveness).24 In many cases, fluid resuscitation alone may be enough to restore hemodynamic stability, improve tissue perfusion, and reduce elevated lactate concentrations.25
The decision to give more fluids should not be made lightly, though, as a more positive fluid balance early in the course of septic shock and over 4 days has been associated with a higher mortality rate.26 Additionally, pushing fluids in patients with cardiogenic shock due to impaired left ventricular systolic function may lead to or worsen pulmonary edema. Therefore, the indiscriminate use of fluids should be avoided.
Which fluids?
Despite years of research, controversy persists about whether crystalloids or colloids are better for resuscitation. Randomized trials in heterogeneous intensive care unit patients have not detected differences in 28-day mortality rates between those allocated to crystalloids or 4% albumin27 and those allocated to crystalloids or hydroxyethyl starch.28
Hydroxyethyl starch may not be best. In a study of patients with severe sepsis, those randomized to receive hydroxyethyl starch had a higher 90-day mortality rate than patients randomized to crystalloids (51% vs 43%, P = .03).29 A sequential prospective before-and-after study did not detect a difference in the time to normalization (< 2.2 mmol/L) of lactate (P = .68) or cessation of vasopressors (P = .11) in patients with severe sepsis who received fluid resuscitation with crystalloids, gelatin, or hydroxyethyl starch. More patients who received hydroxyethyl starch in these studies developed acute kidney injury than those receiving crystalloids.28–30
Taken together, these data strongly suggest hydroxyethyl starch should not be used for fluid resuscitation in the intensive care unit.
Normal saline or albumin? Although some data suggest that albumin may be preferable to 0.9% sodium chloride in patients with severe sepsis,31,32 these analyses should be viewed as hypothesis-generating. There do not seem to be differences between fluid types in terms of subsequent serum lactate concentrations or achievement of lactate clearance goals.28–30 Until further studies are completed, both albumin and crystalloids are reasonable for resuscitation.
Caironi et al33 performed an open-label study comparing albumin replacement (with a goal serum albumin concentration of 3 g/dL) plus a crystalloid solution vs a crystalloid solution alone in patients with severe sepsis or septic shock. They detected no difference between the albumin and crystalloid groups in mortality rates at 28 days (31.8% vs 32.0%, P = .94) or 90 days (41.1% vs 43.6%, P = .29). However, patients in the albumin group had a shorter time to cessation of vasoactive agents (median 3 vs 4 days, P = .007) and lower cardiovascular Sequential Organ Failure Assessment subscores (median 1.20 vs 1.42, P = .03), and more frequently achieved a mean arterial pressure of at least 65 mm Hg within 6 hours of randomization (86.0% vs 82.5%, P = .04).
Although serum lactate levels were lower in the albumin group at baseline (1.7 mmol/L vs 1.8 mmol/L, P = .05), inspection of the data appears to show a similar daily lactate clearance rate between groups over the first 7 study days (although these data were not analyzed by the authors). Achievement of a lactate level lower than 2 mmol/L on the first day of therapy was not significantly different between groups (73.4% vs 72.5%, P = .11).33
In a post hoc subgroup analysis, patients with septic shock at baseline randomized to albumin had a lower 90-day mortality rate than patients randomized to crystalloid solutions (RR 0.87, 95% CI 0.77–0.99). There was no difference in the 90-day mortality rate in patients without septic shock (RR 1.13, 95% CI 0.92–1.39, P = .03 for heterogeneity).33
These data suggest that albumin replacement may not improve outcomes in patients with severe sepsis, but may have advantages in terms of hemodynamic variables (and potentially mortality) in patients with septic shock. The role of albumin replacement in patients with septic shock warrants further study.
VASOPRESSORS
Vasopressors, inotropes, or both should be given to patients who have signs of hypoperfusion (including elevated lactate levels) despite preload optimization or ongoing fluid administration. The most appropriate drug depends on the goal: vasopressors are used to increase systemic vascular resistance, while inotropes are used to improve cardiac output and oxygen delivery.
Blood pressure target
The Surviving Sepsis Campaign guidelines recommend a mean arterial blood pressure target of at least 65 mm Hg during initial resuscitation and when vasopressors are applied for patients with septic shock.22 This recommendation is based on small studies that did not show differences in serum lactate levels or regional blood flow when the mean arterial pressure was elevated above 65 mm Hg with norepinephrine.34,35 However, the campaign guidelines note that the mean arterial pressure goal must be individualized in order to achieve optimal perfusion.
A large, open-label trial36 detected no difference in 28-day mortality rates in patients with septic shock between those allocated to a mean arterial pressure goal of 80 to 85 mm Hg or 65 to 70 mm Hg (36.6% vs 34.0%, P = .57). Although lactate levels did not differ between groups, the incidence of new-onset atrial fibrillation was higher in the higher-target group (6.7% vs 2.8%, P = .02). Fewer patients with chronic hypertension needed renal replacement therapy in the higher pressure group, further emphasizing the need to individualize the mean arterial pressure goal for patients in shock.36
Which vasopressor agent?
Dopamine and norepinephrine have traditionally been the preferred initial vasopressors for patients with shock. Until recently there were few data to guide selection between the two, but this is changing.
In a 2010 study of 1,679 patients with shock requiring vasopressors, there was no difference in the 28-day mortality rate between patients randomized to dopamine or norepinephrine (53% vs 49%, P = .10).37 Patients allocated to dopamine, though, had a higher incidence of arrhythmias (24% vs 12%, P < .001) and more frequently required open-label norepinephrine (26% vs 20%, P < .001). Although lactate levels and the time to achievement of a mean arterial pressure of 65 mm Hg were similar between groups, patients allocated to norepinephrine had more vasopressor-free days through day 28.
An a priori-planned subgroup analysis evaluated the influence of the type of shock on patient outcome. Patients with cardiogenic shock randomized to dopamine had a higher mortality rate than those randomized to norepinephrine (P = .03). However, the overall effect of treatment did not differ among the shock subgroups (interaction P = .87), suggesting that the reported differences in mortality according to subgroup may be spurious.
In a 2012 meta-analysis of patients with septic shock, dopamine use was associated with a higher mortality rate than norepinephrine use.38
In light of these data, norepinephrine should be preferred over dopamine as the initial vasopressor in most types of shock.
Epinephrine does not offer an outcome advantage over norepinephrine and may be associated with a higher incidence of adverse events.39–42 Indeed, in a study of patients with septic shock, lactate concentrations on the first day after randomization were significantly higher in patients allocated to epinephrine than in patients allocated to norepinephrine plus dobutamine.39 Similar effects on lactate concentrations with epinephrine were seen in patients with various types of shock40 and in those with cardiogenic shock.42
These differences in lactate concentrations may be directly attributable to epinephrine. Epinephrine can increase lactate concentrations through glycolysis and pyruvate dehydrogenase activation by stimulation of sodium-potassium ATPase activity via beta-2 adrenergic receptors in skeletal muscles,43 as well as decrease splanchnic perfusion.42,44,45 These effects may preclude using lactate clearance as a resuscitation goal in patients receiving epinephrine. Epinephrine is likely best reserved for patients with refractory shock,22 particularly those in whom cardiac output is known to be low.
Phenylephrine, essentially a pure vasoconstrictor, should be avoided in low cardiac output states and is best reserved for patients who develop a tachyarrhythmia on norepinephrine.22
Vasopressin, also a pure vasoconstrictor that should be avoided in low cardiac output states, has been best studied in patients with vasodilatory shock. Although controversy exists on the mortality benefits of vasopressin in vasodilatory shock, it is a relatively safe drug with consistent norepinephrine-sparing effects when added to existing norepinephrine therapy.46,47 In patients with less severe septic shock, including those with low lactate concentrations, adding vasopressin to norepinephrine instead of continuing norepinephrine alone may confer a mortality advantage.48
OTHER MEASURES TO OPTIMIZE OXYGEN DELIVERY
In circulatory shock from any cause, tissue oxygen demand exceeds oxygen delivery. Once arterial oxygenation and hemoglobin levels (by packed red blood cell transfusion) have been optimized, cardiac output is the critical determinant of oxygen delivery. Cardiac output may be augmented by ensuring adequate preload (by fluid resuscitation) or by giving inotropes or vasodilators.
The optimal cardiac output is difficult to define, and the exact marker for determining when cardiac output should be augmented is unclear. A strategy of increasing cardiac output to predefined “supranormal” levels was not associated with a lower mortality rate.49 Therefore, the decision to augment cardiac output must be individualized and will likely vary in the same patient over time.23
A reasonable approach to determining when augmentation of cardiac output is necessary was proposed in a study by Rivers et al.50 In that study, in patients randomized to early goal-directed therapy, inotropes were recommended when the central venous oxygenation saturation (Scvo2) was below 70% despite adequate fluid resuscitation (central venous pressure ≥ 8 mm Hg) and hematocrits were higher than 30%.
When an inotrope is indicated to improve cardiac output, dobutamine is usually the preferred agent. Dobutamine has a shorter half-life (allowing for easier titration) and causes less hypotension (assuming preload has been optimized) than phosphodiesterase type III inhibitors such as milrinone.
Mechanical support devices, such as intra-aortic balloon counterpulsation, and vasodilators can also be used to improve tissue perfusion in selected patients with low cardiac output syndromes.
USING LACTATE LEVELS TO GUIDE THERAPY
Lactate levels above 4.0 mmol/L
Lactate may be a useful marker for determining whether organ dysfunction is present and, hence, what course of therapy should be given, especially in sepsis. A serum lactate level higher than 4.0 mmol/L has been used as the trigger to start aggressive resuscitation in patients with sepsis.50,51
Traditionally, as delineated by Rivers et al50 in their landmark study of early goal-directed therapy, this entailed placing an arterial line and a central line for hemodynamic monitoring, with specific interventions directed at increasing the central venous pressure, mean arterial pressure, and central venous oxygen saturation.50 However, a recent study in a similar population of patients with sepsis with elevated lactate found no significant advantage of protocol-based resuscitation over care provided according to physician judgment, and no significant benefit in central venous catheterization and hemodynamic monitoring in all patients.51
Lactate clearance: 10% or above at 8 hours?
Regardless of the approach chosen, decreasing lactate levels can be interpreted as an adequate response to the interventions provided. As a matter of fact, several groups of investigators have also demonstrated the merits of lactate clearance alone as a prognostic indicator in patients requiring hemodynamic support.
McNelis et al52 retrospectively evaluated 95 postsurgical patients who required hemodynamic monitoring.52,53 The authors found that the slower the lactate clearance, the higher the mortality rate.
Given the prognostic implications of lactate clearance, investigators have evaluated whether lactate clearance could be used as a surrogate resuscitation goal for optimizing oxygen delivery. Using lactate clearance may have significant practical advantages over using central venous oxygen saturation, since it does not require a central venous catheter or continuous oximetric monitoring.
In a study comparing these two resuscitation end points, patients were randomized to a goal of either central venous oxygen saturation of 70% or more or lactate clearance of 10% or more within the first 6 hours after presentation as a marker of oxygen delivery.53 Mortality rates were similar with either strategy. Of note, only 10% of the patients actually required therapies to improve their oxygen delivery. Furthermore, there were no differences in the treatments given (including fluids, vasopressors, inotropes, packed red blood cells) throughout the treatment period.
These findings provide several insights. First, few patients admitted to the emergency department with severe sepsis and treated with an initial quantitative resuscitation protocol require additional therapy for augmenting oxygen delivery. Second, lactate clearance, in a setting where initial resuscitation with fluids and vasopressors restores adequate oxygen delivery for the majority of patients, is likely as good a target for resuscitation as central venous oxygen saturation.
This study, however, does not address the question of whether lactate clearance is useful as an additional marker of oxygen delivery (in conjunction with central venous oxygen saturation). Indeed, caution should be taken to target central venous oxygen saturation goals alone, as patients with septic shock presenting with venous hyperoxia (central venous oxygen saturation > 89%) have been shown to have a higher mortality rate than patients with normoxia (central venous oxygen saturation 71%–89%).54
This was further demonstrated by Arnold et al in a study of patients presenting to the emergency department with severe sepsis.15 In this study, significant discordance between central venous oxygen saturation and lactate clearance was seen, where 79% of patients with less than 10% lactate clearance had concomitant central venous oxygen saturation of 70% or greater.
Jansen et al18 evaluated the role of targeting lactate clearance in conjunction with central venous oxygen saturation monitoring. In this study, critically ill patients with elevated lactate and inadequate lactate clearance were randomized to usual care or to resuscitation to adequate lactate clearance (20% or more). The therapies to optimize oxygen delivery were given according to the central venous oxygen saturation. Overall, after adjustment for predefined risk factors, the in-hospital mortality rate was lower in the lactate clearance group. This may signify that patients with sepsis and central venous oxygen saturation of 70% or more may continue to have poor lactate clearance, warranting further treatment.
Taken together, serum lactate may be helpful for prognostication, determination of course of therapy, and quantification for tissue hypoperfusion for targeted therapies. Figure 2 presents our approach to an elevated lactate level. As performed in the study by Jansen et al,18 it seems reasonable to measure lactate levels every 2 hours for the first 8 hours of resuscitation in patients with type A lactic acidosis. These levels should be interpreted in the context of lactate clearance (at least 10%, but preferably 20%) and normalization, and should be treated with an approach similar to the one outlined in Figure 2.
TREATING TYPE B LACTIC ACIDOSIS (NORMAL PERFUSION AND OXYGENATION)
Treating type B lactic acidosis is quite different because the goal is not to correct mismatches in oxygen consumption and delivery. Since most cases are due to underlying conditions such as malignancy or medications, treatment should be centered around eliminating the cause (eg, treat the malignancy, discontinue the offending medication). The main reason for treatment is to alleviate the harmful effects of acidosis. For example, acidosis can result in a negative inotropic effect.
Sodium bicarbonate, dichloroacetate, carbicarb, and tromethamine have all been studied in the management of type B lactic acidosis, with little success.55,56
Renal replacement therapy has had some success in drug-induced lactic acidosis.57,58
l-carnitine has had promising results in treating patients with human immunodeficiency virus infection, since these patients are carnitine-deficient and carnitine plays an important role in mitochondrial function.59
Thiamine and biotin deficiencies can occur in patients receiving total parenteral nutrition without vitamins and in patients who drink alcohol heavily and can cause lactic acidosis. These nutrients should be supplemented accordingly.
Treatment of mitochondrial disorders includes antioxidants (coenzyme Q10, vitamin C, vitamin E) and amino acids (l-arginine).60
- Andersen LW, Mackenhauer J, Roberts JC, Berg KM, Cocchi MN, Donnino MW. Etiology and therapeutic approach to elevated lactate levels. Mayo Clin Proc 2013; 88:1127–1140.
- Fuller BM, Dellinger RP. Lactate as a hemodynamic marker in the critically ill. Curr Opin Crit Care 2012; 18:267–272.
- Fall PJ, Szerlip HM. Lactic acidosis: from sour milk to septic shock. J Intensive Care Med 2005; 20:255–271.
- Kruse O, Grunnet N, Barfod C. Blood lactate as a predictor for in-hospital mortality in patients admitted acutely to hospital: a systematic review. Scand J Trauma Resusc Emerg Med 2011;19:74.
- Howell MD, Donnino M, Clardy P, Talmor D, Shapiro NI. Occult hypoperfusion and mortality in patients with suspected infection. Intensive Care Med 2007; 33:1892–1899.
- Puskarich MA, Trzeciak S, Shapiro NI, et al. Outcomes of patients undergoing early sepsis resuscitation for cryptic shock compared with overt shock. Resuscitation 2011; 82:1289–1293.
- Bakker J, Nijsten MW, Jansen TC. Clinical use of lactate monitoring in critically ill patients. Ann Intensive Care 2013; 3:12.
- Levy B, Gibot S, Franck P, Cravoisy A, Bollaert PE. Relation between muscle Na+K+ ATPase activity and raised lactate concentrations in septic shock: a prospective study. Lancet 2005; 365:871–875.
- Vary TC. Sepsis-induced alterations in pyruvate dehydrogenase complex activity in rat skeletal muscle: effects on plasma lactate. Shock 1996; 6:89–94.
- Brealey D, Brand M, Hargreaves I, et al. Association between mitochondrial dysfunction and severity and outcome of septic shock. Lancet 2002; 360:219–223.
- Shapiro NI, Howell MD, Talmor D, et al. Serum lactate as a predictor of mortality in emergency department patients with infection. Ann Emerg Med 2005; 45:524–528.
- Mikkelsen ME, Miltiades AN, Gaieski DF, et al. Serum lactate is associated with mortality in severe sepsis independent of organ failure and shock. Crit Care Med 2009; 37:1670–1677.
- Liu V, Morehouse JW, Soule J, Whippy A, Escobar GJ. Fluid volume, lactate values, and mortality in sepsis patients with intermediate lactate values. Ann Am Thorac Soc 2013; 10:466–473.
- Sterling SA, Puskarich MA, Shapiro NI, et al; Emergency Medicine Shock Research Network (EMShockNET). Characteristics and outcomes of patients with vasoplegic versus tissue dysoxic septic shock. Shock 2013; 40:11–14.
- Arnold RC, Shapiro NI, Jones AE, et al; Emergency Medicine Shock Research Network (EMShockNet) Investigators. Multicenter study of early lactate clearance as a determinant of survival in patients with presumed sepsis. Shock 2009; 32:35–39.
- Jones AE. Lactate clearance for assessing response to resuscitation in severe sepsis. Acad Emerg Med 2013; 20:844–847.
- Nguyen HB, Rivers EP, Knoblich BP, et al. Early lactate clearance is associated with improved outcome in severe sepsis and septic shock. Crit Care Med 2004; 32:1637–1642.
- Jansen TC, van Bommel J, Schoonderbeek FJ, et al; LACTATE study group. Early lactate-guided therapy in intensive care unit patients: a multicenter, open-label, randomized controlled trial. Am J Respir Crit Care Med 2010; 182:752–761.
- Husain FA, Martin MJ, Mullenix PS, Steele SR, Elliott DC. Serum lactate and base deficit as predictors of mortality and morbidity. Am J Surg 2003; 185:485–491.
- Puskarich MA, Trzeciak S, Shapiro NI, et al. Whole blood lactate kinetics in patients undergoing quantitative resuscitation for severe sepsis and septic shock. Chest 2013; 143:1548–1553.
- Marty P, Roquilly A, Vallee F, et al. Lactate clearance for death prediction in severe sepsis or septic shock patients during the first 24 hours in intensive care unit: an observational study. Ann Intensive Care 2013; 3:3.
- Dellinger RP, Levy MM, Rhodes A, et al; Surviving Sepsis Campaign Guidelines Committee including the Pediatric Subgroup. Surviving sepsis campaign: International guidelines for management of severe sepsis and septic shock: 2012. Crit Care Med 2013; 41:580–637.
- Vincent JL, De Backer D. Circulatory shock. N Engl J Med 2013; 369:1726–1734.
- Durairaj L, Schmidt GA. Fluid therapy in resuscitated sepsis: less is more. Chest 2008; 133:252–263.
- Vincent JL, Dufaye P, Berré J, Leeman M, Degaute JP, Kahn RJ. Serial lactate determinations during circulatory shock. Crit Care Med 1983; 11:449–451.
- Boyd JH, Forbes J, Nakada TA, Walley KR, Russell JA. Fluid resuscitation in septic shock: a positive fluid balance and elevated central venous pressure are associated with increased mortality. Crit Care Med 2011; 39:259–265.
- Finfer S, Bellomo R, Boyce N, French J, Myburgh J, Norton R; SAFE Study Investigators. A comparison of albumin and saline for fluid resuscitation in the intensive care unit. N Engl J Med 2004; 350:2247–2256.
- Myburgh JA, Finfer S, Bellomo R, et al; CHEST Investigators; Australian and New Zealand Intensive Care Society Clinical Trials Group. Hydroxyethyl starch or saline for fluid resuscitation in intensive care. N Engl J Med 2012; 367:1901–1911.
- Perner A, Haase N, Guttormsen AB, et al; 6S Trial Group; Scandinavian Critical Care Trials Group. Hydroxyethyl starch 130/0.42 versus Ringer’s acetate in severe sepsis. N Engl J Med 2012; 367:124–134.
- Bayer O, Reinhart K, Kohl M, et al. Effects of fluid resuscitation with synthetic colloids or crystalloids alone on shock reversal, fluid balance, and patient outcomes in patients with severe sepsis: a prospective sequential analysis. Crit Care Med 2012; 40:2543–2551.
- Delaney AP, Dan A, McCaffrey J, Finfer S. The role of albumin as a resuscitation fluid for patients with sepsis: a systematic review and meta-analysis. Crit Care Med 2011; 39:386–391.
- SAFE Study Investigators; Finfer S, McEvoy S, Bellomo R, McArthur C, Myburgh J, Norton R. Impact of albumin compared to saline on organ function and mortality of patients with severe sepsis. Intensive Care Med 2011; 37:86–96.
- Caironi P, Tognoni G, Masson S, et al; ALBIOS Study Investigators. Albumin replacement in patients with severe sepsis or septic shock. N Engl J Med 2014; 370:1412–1421.
- Bourgoin A, Leone M, Delmas A, Garnier F, Albanèse J, Martin C. Increasing mean arterial pressure in patients with septic shock: effects on oxygen variables and renal function. Crit Care Med 2005; 33:780–786.
- LeDoux D, Astiz ME, Carpati CM, Rackow EC. Effects of perfusion pressure on tissue perfusion in septic shock. Crit Care Med 2000; 28:2729–2732.
- Asfar P, Meziani F, Hamel JF, et al; SEPSISPAM Investigators. High versus low blood-pressure target in patients with septic shock. N Engl J Med 2014; 370:1583–1593.
- De Backer D, Biston P, Devriendt J, et al; SOAP II Investigators. Comparison of dopamine and norepinephrine in the treatment of shock. N Engl J Med 2010; 362:779–789.
- De Backer D, Aldecoa C, Njimi H, Vincent JL. Dopamine versus norepinephrine in the treatment of septic shock: a meta-analysis. Crit Care Med 2012; 40:725–730.
- Annane D, Vignon P, Renault A, et al: CATS Study Group. Norepinephrine plus dobutamine versus epinephrine alone for management of septic shock: a randomised trial. Lancet 2007; 370:676–684.
- Myburgh JA, Higgins A, Jovanovska A, Lipman J, Ramakrishnan N, Santamaria J; CAT Study investigators. A comparison of epinephrine and norepinephrine in critically ill patients. Intensive Care Med 2008; 34:2226–2234.
- Schmittinger CA, Torgersen C, Luckner G, Schröder DC, Lorenz I, Dünser MW. Adverse cardiac events during catecholamine vasopressor therapy: a prospective observational study. Intensive Care Med 2012; 38:950–958.
- Levy B, Perez P, Perny J, Thivilier C, Gerard A. Comparison of norepinephrine-dobutamine to epinephrine for hemodynamics, lactate metabolism, and organ function variables in cardiogenic shock. A prospective, randomized pilot study. Crit Care Med 2011; 39:450–455.
- Watt MJ, Howlett KF, Febbraio MA, Spriet LL, Hargreaves M. Adrenaline increases skeletal muscle glycogenolysis, pyruvate dehydrogenase activation and carbohydrate oxidation during moderate exercise in humans. J Physiol 2001; 534:269–278.
- De Backer D, Creteur J, Silva E, Vincent JL. Effects of dopamine, norepinephrine, and epinephrine on the splanchnic circulation in septic shock: which is best? Crit Care Med 2003; 31:1659–1667.
- Levy B, Bollaert PE, Charpentier C, et al. Comparison of norepinephrine and dobutamine to epinephrine for hemodynamics, lactate metabolism, and gastric tonometric variables in septic shock: a prospective, randomized study. Intensive Care Med 1997; 23:282–287.
- Polito A, Parisini E, Ricci Z, Picardo S, Annane D. Vasopressin for treatment of vasodilatory shock: an ESICM systematic review and meta-analysis. Intensive Care Med 2012; 38:9–19.
- Serpa Neto A, Nassar APJ, Cardoso SO, et al. Vasopressin and terlipressin in adult vasodilatory shock: a systematic review and meta-analysis of nine randomized controlled trials. Crit Care 2012; 16:R154.
- Russell JA, Walley KR, Singer J, et al; VASST Investigators. Vasopressin versus norepinephrine infusion in patients with septic shock. N Engl J Med 2008; 358:877–887.
- Gattinoni L, Brazzi L, Pelosi P, et al; for the SvO2 Collaborative Group. A trial of goal-oriented hemodynamic therapy in critically ill patients. N Engl J Med 1995; 333:1025–1032.
- Rivers E, Nguyen B, Havstad S, et al; Early Goal-Directed Therapy Collaborative Group. Early goal-directed therapy in the treatment of severe sepsis and septic shock. N Engl J Med 2001; 345:1368–1377.
- ProCESS Investigators; Yealy DM, Kellum JA, Huang DT, et al. A randomized trial of protocol-based care for early septic shock. N Engl J Med 2014; 370:1683–1693.
- McNelis J, Marini CP, Jurkiewicz A, et al. Prolonged lactate clearance is associated with increased mortality in the surgical intensive care unit. Am J Surg 2001; 182:481–485.
- Jones AE, Shapiro NI, Trzeciak S, Arnold RC, Claremont HA, Kline JA; Emergency Medicine Shock Research Network (EMShockNet) Investigators. Lactate clearance vs central venous oxygen saturation as goals of early sepsis therapy: a randomized clinical trial. JAMA 2010; 303:739–746.
- Pope JV, Jones AE, Gaieski DF, Arnold RC, Trzeciak S, Shapiro NI; Emergency Medicine Shock Research Network (EMShockNet) Investigators. Multicenter study of central venous oxygen saturation (ScvO2) as a predictor of mortality in patients with sepsis. Ann Emerg Med 2010; 55:40–46.e1
- Kraut JA, Kurtz I. Use of base in the treatment of severe acidemic states. Am J Kidney Dis 2001; 38:703–727.
- Levraut J, Grimaud D. Treatment of metabolic acidosis. Curr Opin Crit Care 2003; 9:260–265.
- Orija AA, Jenks CL. Nucleoside analog reverse transcriptase inhibitor induced lactic acidosis treated with continuous renal replacement in the medical intensive care unit. Crit Care & Shock 2012; 15:9–11.
- Friesecke S, Abel P, Kraft M, Gerner A, Runge S. Combined renal replacement therapy for severe metformin-induced lactic acidosis. Nephrol Dial Transplant 2006; 21:2038–2039.
- Claessens YE, Cariou A, Monchi M, et al. Detecting life-threatening lactic acidosis related to nucleoside-analog treatment of human immunodeficiency virus-infected patients, and treatment with l-carnitine. Crit Care Med 2003; 31:1042–1047.
- Parikh S, Saneto R, Falk MJ, Anselm I, Cohen BH, Haas R; Medicine Society TM. A modern approach to the treatment of mitochondrial disease. Curr Treat Options Neurol 2009; 11:414–430.
KEY POINTS
- Serum lactate levels can become elevated by a variety of underlying processes, categorized as increased production in conditions of hypoperfusion and hypoxia (type A lactic acidosis), or as increased production or decreased clearance not due to hypoperfusion and hypoxia (type B).
- The higher the lactate level and the slower the rate of normalization (lactate clearance), the higher the risk of death.
- Treatments differ depending on the underlying mechanism of the lactate elevation. Thus, identifying the reason for hyperlactatemia and differentiating between type A and B lactic acidosis are of the utmost importance.
- Treatment of type A lactic acidosis aims to improve perfusion and match oxygen consumption with oxygen delivery by giving fluids, packed red blood cells, and vasopressors or inotropic agents, or both.
- Treatment of type B involves more specific management, such as discontinuing offending medications or supplementing key cofactors for anaerobic metabolism.
Middle East respiratory syndrome: SARS redux?
Middle East respiratory syndrome (MERS) is a potentially lethal illness caused by the Middle East respiratory syndrome coronavirus (MERS-CoV). The virus was first reported in 2012, when it was isolated from the sputum of a previously healthy man in Saudi Arabia who presented with acute pneumonia and subsequent renal failure with a fatal outcome.1 Retrospective studies subsequently identified an earlier outbreak that year involving 13 patients in Jordan, and since then cases have been reported in 25 countries across the Arabian Peninsula and in Asia, Europe, Africa, and the United States, with over 1,000 confirmed cases and 450 related deaths.2,3
At the time of this writing, two cases of MERS have been reported in the United States, both in May 2014. Both reported cases involved patients who had traveled from Saudi Arabia, and which did not result in secondary cases.4 Beginning in May 2015, the Republic of Korea had experienced the largest known outbreak of MERS outside the Arabian Peninsula, with over 100 cases.5
THE VIRUS
MERS-CoV is classified as a coronavirus, which is a family of single-stranded RNA viruses. In 2003, a previously unknown coronavirus (SARS-CoV) caused a global outbreak of pneumonia that resulted in approximately 800 deaths.6 The MERS-CoV virus attaches to dipeptidyl peptidase 4 to enter cells, and this receptor is believed to be critical for pathogenesis, as infection does not occur in its absence.7
The source and mode of transmission to humans is not completely defined. Early reports suggested that MERS-CoV originated in bats, as RNA sequences related to MERS-CoV have been found in several bat species, but the virus itself has not been isolated from bats.8 Camels have been found to have a high rate of anti-MERS-CoV antibodies and to have the virus in nose swabs, and evidence for camel-to-human transmission has been presented.9–11 However, the precise role of camels and other animals as reservoirs or vectors of infection is still under investigation.
The incubation period from exposure to the development of clinical disease is estimated at 5 to 14 days.
For MERS-CoV, the basic reproduction ratio (R0), which measures the average number of secondary cases from each infected person, is estimated12 to be less than 0.7. In diseases in which the R0 is less than 1.0, infections occur in isolated clusters as limited chains of transmission, and thus the sustained transmission of MERS-CoV resulting in a large epidemic is thought to be unlikely. As a comparison, the median R0 value for seasonal influenza is estimated13 at 1.28. “Superspreading” may result in limited outbreaks of secondary cases; however, the continued epidemic spread of infection is thought to be unlikely.14 Nevertheless, viral adaptation with increased transmissibility remains a concern and a potential threat.
CLINICAL PRESENTATION
MERS most commonly presents as a respiratory illness, although asymptomatic infection occurs. The percentage of patients who experience asymptomatic infection is unknown. A recent survey of 255 patients with laboratory-confirmed MERS-CoV found that 64 (25.1%) were reported as asymptomatic at time of specimen collection. However, when 33 (52%) of those patients were interviewed, 26 (79%) reported at least one symptom that was consistent with a viral respiratory illness.15
For symptomatic patients, the initial complaints are nonspecific, beginning with fever, cough, sore throat, chills, and myalgia. Patients experiencing severe infection progress to dyspnea and pneumonia, with requirements for ventilatory support, vasopressors, and renal replacement therapy.16 Gastrointestinal symptoms such as vomiting and diarrhea have been reported in about one-third of patients.17
In a study of 47 patients with MERS-CoV, most of whom had underlying medical illnesses, 42 (89%) required intensive care and 34 (72%) required mechanical ventilation.17 The case-fatality rate in this study was 60%, but other studies have reported rates closer to 30%.15
Laboratory findings in patients with MERS-CoV infection usually include leukopenia and thrombocytopenia. Severely ill patients may have evidence of acute kidney injury.
Radiographic findings of MERS are those of viral pneumonitis and acute respiratory distress syndrome. Computed tomographic findings include ground-glass opacities, with peripheral lower-lobe preference.18
DIAGNOSIS
As MERS is a respiratory illness, sampling of respiratory secretions provides the highest yield for diagnosis. A study of 112 patients with MERS-CoV reported that polymerase chain reaction (PCR) testing of tracheal aspirates and bronchoalveolar lavage samples yielded significantly higher MERS-CoV loads than nasopharyngeal swab samples and sputum samples.19 However, upper respiratory tract testing is less invasive, and a positive nasopharyngeal swab result may obviate the need for further testing.
The US Centers for Disease Control and Prevention (CDC) recommends collecting multiple specimens from different sites at different times after the onset of symptoms in order to increase the diagnostic yield. Specifically, it recommends testing a lower respiratory specimen (eg, sputum, bronchoalveolar lavage fluid, tracheal aspirate), a nasopharyngeal and oropharyngeal swab, and serum, using the CDC MERS-CoV rRT-PCR assay. In addition, for patients whose symptoms began more than 14 days earlier, the CDC also recommends testing a serum specimen with the CDC MERS-CoV serologic assay. As these guidelines are updated frequently, clinicians are advised to check the CDC website for the most up-to-date information (www.cdc.gov/coronavirus/mers/guidelines-clinical-specimens.html).20 The identification of MERS-CoV by virus isolation in cell culture is not recommended and, if pursued, must be performed in a biosafety level 3 facility. (Level 3 is the second-highest level of biosafety. The highest, level 4, is reserved for extremely dangerous agents such as Ebola virus).20
Given the nonspecific clinical presentation of MERS-CoV, clinicians may consider testing for other respiratory pathogens. A recent review of 54 travelers to California from MERS-CoV-affected areas found that while none tested positive for MERS-CoV, 32 (62%) of 52 travelers had other respiratory viruses.21 When testing for alternative pathogens, clinicians should order molecular or antigen-based detection methods.
TREATMENT
Unfortunately, treatment for MERS is primarily supportive.
Ribavirin and interferon alfa-2b demonstrated activity in an animal model, but the regimen was ineffective when given a median of 19 (range 10–22) days after admission in 5 critically ill patients who subsequently died.22 A retrospective analysis comparing 20 patients with severe MERS-CoV who received ribavirin and interferon alfa-2a with 24 patients who did not reported that while survival was improved at 14 days, the mortality rates were similar at 28 days.23
A systematic review of treatments used for severe acute respiratory syndrome (SARS) reported that most studies investigating steroid use were inconclusive and some showed possible harm, suggesting that systemic steroids should be avoided in coronavirus infections.24
PREVENTION
Healthcare-associated outbreaks of MERS are well described, and thus recognition of potential cases and prompt institution of appropriate infection control measures are critical.15,25
Healthcare providers should ask patients about recent travel history and ascertain if they meet the CDC criteria for a “patient under investigation” (PUI), ie, if they have both clinical features and an epidemiologic risk of MERS (Table 1). However, these recommendations for identification will assuredly change as the outbreak matures, and healthcare providers should refer to the CDC website for the most up-to-date information.
Once a PUI is identified, standard, contact, and airborne precautions are advised. These measures include performing hand hygiene and donning personal protective equipment, including gloves, gowns, eye protection, and respiratory protection (ie, a respirator) that is at least as protective as a fit-tested National Institute for Occupational Safety and Health-certified N95 filtering face-piece respirator. In addition, a patient with possible MERS should be placed in an airborne infection isolation room.
Traveler’s advice
The CDC does not currently recommend that Americans change their travel plans because of MERS. Clinicians performing pretravel evaluations should advise patients of current information on MERS. Patients at risk for MERS who develop a respiratory illness within 14 days of return should seek medical attention and inform healthcare providers of their travel history.
SUMMARY
Recent experience with SARS, Ebola virus disease, and now MERS-CoV highlights the impact of global air travel as a vector for the rapid worldwide dissemination of communicable diseases. Healthcare providers should elicit a travel history in all patients presenting with a febrile illness, as an infection acquired in one continent may not become manifest until the patient presents in another.
The scope of the current MERS-CoV outbreak is still evolving, with concerns that viral evolution could result in a SARS-like outbreak, as experienced almost a decade ago.
Healthcare providers are advised to screen patients at risk for MERS-CoV for respiratory symptoms, and to institute appropriate infection control measures. Through recognition and isolation, healthcare providers are at the front line in limiting the spread of this potentially lethal virus.
- Zaki AM, van Boheemen S, Bestebroer TM, Osterhaus ADME, Fouchier RAM. Isolation of a novel coronavirus from a man with pneumonia in Saudi Arabia. N Engl J Med 2012; 367:1814–1820.
- Al-Abdallat MM, Payne DC, Alqasrawi S, et al. Hospital-associated outbreak of Middle East respiratory syndrome coronavirus: a serologic, epidemiologic, and clinical description. Clin Infect Dis 2014; 59:1225–1233.
- World Health Organization. Frequently asked questions on Middle East respiratory syndrome coronavirus (MERS-CoV). www.who.int/csr/disease/coronavirus_infections/faq/en/. Accessed July 29, 2015.
- Bialek SR, Allen D, Alvarado-Ramy F, et al; Centers for Disease Control and Prevention (CDC). First confirmed cases of Middle East respiratory syndrome coronavirus (MERS-CoV) infection in the United States, updated information on the epidemiology of MERS-CoV infection, and guidance for the public, clinicians, and public health authorities—May 2014. MMWR Morb Mortal Wkly Rep 2014; 63:431–436.
- World Health Organization. Middle East respiratory syndrome coronavirus (MERS-CoV) – Republic of Korea. www.who.int/csr/don/12-june-2015-mers-korea/en/. Accessed July 29, 2015.
- Peiris JSM, Guan Y, Yuen KY. Severe acute respiratory syndrome. Nat Med 2004; 10:S88–S97.
- van Doremalen N, Miazqowicz KL, Milne-Price S, et al. Host species restriction of Middle East respiratory syndrome coronavirus through its receptor, dipeptidyl peptidase 4. J Virol 2014; 88:9220–9232.
- Zumla A, Hui DS, Perlman S. Middle East respiratory syndrome. Lancet 2015; S0140-6736(15)60454-604548 (Epub ahead of print).
- Meyer B, Muller MA, Corman WM, et al. Antibodies against MERS coronavirus in dromedary camels, United Arab Emirates, 2003 and 2013. Emerg Infect Dis 2014; 20:552–559.
- Haagmans BL, Al Dhahiry SH, Reusken CB, et al. Middle East respiratory syndrome coronavirus in dromedary camels: an outbreak investigation. Lancet Infect Dis 2014; 14:140–145.
- Azhar EI, El-Kafrawy SA, Farraj SA, et al. Evidence for camel-to-human transmission of MERS coronavirus. N Engl J Med 2014; 370:2499–2505.
- Chowell G, Blumberg S, Simonsen L, Miller MA, Viboud C. Synthesizing data and models for the spread of MERS-CoV, 2013: key role of index cases and hospital transmission. Epidemics 2014; 9:40–51.
- Biggerstaff M, Chauchemez S, Reed C, Gambhir M, Finelli L. Estimates of the reproduction number for seasonal, pandemic, and zoonotic influenza: a systematic review of the literature. BMC Infect Dis 2014: 14:480.
- Kucharski AJ, Althaus CL. The role of superspreading in Middle East respiratory syndrome coronavirus (MERS-CoV) transmission. Euro Surveill 2015; 20.
- Oboho I, Tomczyk S, Al-Asmari A, et al. 2014 MERS-CoV outbreak in Jeddah—a link to health care facilities. N Engl J Med 2015; 372:846–854.
- Arabi YM, Arifi AA, Balkhy HH, et al. Clinical course and outcomes of critically ill patients with Middle East respiratory syndrome coronavirus infection. Ann Intern Med 2014; 160:389–397.
- Assiri A, Al-Tawfig JA, Al-Rabeeah AA, et al. Epidemiological, demographic, and clinical characteristics of 47 cases of Middle East respiratory syndrome coronavirus disease from Saudi Arabia: a descriptive study. Lancet Infect Dis 2013; 13:752–761.
- Das KM, Lee EY, Enani MA, et al. CT correlation with outcomes in 15 patients with acute Middle East respiratory syndrome coronavirus. AJR Am J Roentgenol 2015; 204:736–742.
- Memish ZA, Al-Tawfiq JA, Makhdoom HQ, et al. Respiratory tract samples, viral load, and genome fraction yield in patients with Middle East respiratory syndrome. J Infect Dis 2014; 210:1590–1594.
- Centers for Disease Control and Prevention. Middle East respiratory syndrome (MERS). Interim guidelines for collecting, handling, and testing clinical specimens from patients under investigation (PUIs) for Middle East respiratory syndrome coronavirus (MERS-CoV)—version 2.1. www.cdc.gov/coronavirus/mers/guidelines-clinical-specimens.html. Accessed July 29, 2015.
- Shakhkarami M, Yen C, Glaser CA, Xia D, Watt J, Wadford DA. Laboratory testing for Middle East respiratory syndrome coronavirus, California, USA, 2013–2014. Emerg Infect Dis 2015; 21: E-pub ahead of print. wwwnc.cdc.gov/eid/article/21/9/15-0476_article. Accessed July 29, 2015.
- Al-Tawfiq JA, Momattin H, Dib J, Memish ZA. Ribavirin and interferon therapy in patients infected with the Middle East respiratory syndrome coronavirus: an observational study. Int J Infect Dis 2014; 20:42–46.
- Omrani AS, Saad MM, Baig K, et al. Ribavirin and interferon alfa-2a for severe Middle East respiratory syndrome coronavirus infection: a retrospective cohort study. Lancet Infect Dis 2014; 14:1090–1095.
- Stockman LJ, Bellamy R, Garner, P. SARS: systematic review of treatment effects. PLoS Med 2006; 3:e343.
- Assiri A, McGeer A, Perl TM, et al; KSA MERS-CoV Investigation Team. Hospital outbreak of Middle East respiratory syndrome coronavirus. N Engl J Med 2013; 369:407–416.
Middle East respiratory syndrome (MERS) is a potentially lethal illness caused by the Middle East respiratory syndrome coronavirus (MERS-CoV). The virus was first reported in 2012, when it was isolated from the sputum of a previously healthy man in Saudi Arabia who presented with acute pneumonia and subsequent renal failure with a fatal outcome.1 Retrospective studies subsequently identified an earlier outbreak that year involving 13 patients in Jordan, and since then cases have been reported in 25 countries across the Arabian Peninsula and in Asia, Europe, Africa, and the United States, with over 1,000 confirmed cases and 450 related deaths.2,3
At the time of this writing, two cases of MERS have been reported in the United States, both in May 2014. Both reported cases involved patients who had traveled from Saudi Arabia, and which did not result in secondary cases.4 Beginning in May 2015, the Republic of Korea had experienced the largest known outbreak of MERS outside the Arabian Peninsula, with over 100 cases.5
THE VIRUS
MERS-CoV is classified as a coronavirus, which is a family of single-stranded RNA viruses. In 2003, a previously unknown coronavirus (SARS-CoV) caused a global outbreak of pneumonia that resulted in approximately 800 deaths.6 The MERS-CoV virus attaches to dipeptidyl peptidase 4 to enter cells, and this receptor is believed to be critical for pathogenesis, as infection does not occur in its absence.7
The source and mode of transmission to humans is not completely defined. Early reports suggested that MERS-CoV originated in bats, as RNA sequences related to MERS-CoV have been found in several bat species, but the virus itself has not been isolated from bats.8 Camels have been found to have a high rate of anti-MERS-CoV antibodies and to have the virus in nose swabs, and evidence for camel-to-human transmission has been presented.9–11 However, the precise role of camels and other animals as reservoirs or vectors of infection is still under investigation.
The incubation period from exposure to the development of clinical disease is estimated at 5 to 14 days.
For MERS-CoV, the basic reproduction ratio (R0), which measures the average number of secondary cases from each infected person, is estimated12 to be less than 0.7. In diseases in which the R0 is less than 1.0, infections occur in isolated clusters as limited chains of transmission, and thus the sustained transmission of MERS-CoV resulting in a large epidemic is thought to be unlikely. As a comparison, the median R0 value for seasonal influenza is estimated13 at 1.28. “Superspreading” may result in limited outbreaks of secondary cases; however, the continued epidemic spread of infection is thought to be unlikely.14 Nevertheless, viral adaptation with increased transmissibility remains a concern and a potential threat.
CLINICAL PRESENTATION
MERS most commonly presents as a respiratory illness, although asymptomatic infection occurs. The percentage of patients who experience asymptomatic infection is unknown. A recent survey of 255 patients with laboratory-confirmed MERS-CoV found that 64 (25.1%) were reported as asymptomatic at time of specimen collection. However, when 33 (52%) of those patients were interviewed, 26 (79%) reported at least one symptom that was consistent with a viral respiratory illness.15
For symptomatic patients, the initial complaints are nonspecific, beginning with fever, cough, sore throat, chills, and myalgia. Patients experiencing severe infection progress to dyspnea and pneumonia, with requirements for ventilatory support, vasopressors, and renal replacement therapy.16 Gastrointestinal symptoms such as vomiting and diarrhea have been reported in about one-third of patients.17
In a study of 47 patients with MERS-CoV, most of whom had underlying medical illnesses, 42 (89%) required intensive care and 34 (72%) required mechanical ventilation.17 The case-fatality rate in this study was 60%, but other studies have reported rates closer to 30%.15
Laboratory findings in patients with MERS-CoV infection usually include leukopenia and thrombocytopenia. Severely ill patients may have evidence of acute kidney injury.
Radiographic findings of MERS are those of viral pneumonitis and acute respiratory distress syndrome. Computed tomographic findings include ground-glass opacities, with peripheral lower-lobe preference.18
DIAGNOSIS
As MERS is a respiratory illness, sampling of respiratory secretions provides the highest yield for diagnosis. A study of 112 patients with MERS-CoV reported that polymerase chain reaction (PCR) testing of tracheal aspirates and bronchoalveolar lavage samples yielded significantly higher MERS-CoV loads than nasopharyngeal swab samples and sputum samples.19 However, upper respiratory tract testing is less invasive, and a positive nasopharyngeal swab result may obviate the need for further testing.
The US Centers for Disease Control and Prevention (CDC) recommends collecting multiple specimens from different sites at different times after the onset of symptoms in order to increase the diagnostic yield. Specifically, it recommends testing a lower respiratory specimen (eg, sputum, bronchoalveolar lavage fluid, tracheal aspirate), a nasopharyngeal and oropharyngeal swab, and serum, using the CDC MERS-CoV rRT-PCR assay. In addition, for patients whose symptoms began more than 14 days earlier, the CDC also recommends testing a serum specimen with the CDC MERS-CoV serologic assay. As these guidelines are updated frequently, clinicians are advised to check the CDC website for the most up-to-date information (www.cdc.gov/coronavirus/mers/guidelines-clinical-specimens.html).20 The identification of MERS-CoV by virus isolation in cell culture is not recommended and, if pursued, must be performed in a biosafety level 3 facility. (Level 3 is the second-highest level of biosafety. The highest, level 4, is reserved for extremely dangerous agents such as Ebola virus).20
Given the nonspecific clinical presentation of MERS-CoV, clinicians may consider testing for other respiratory pathogens. A recent review of 54 travelers to California from MERS-CoV-affected areas found that while none tested positive for MERS-CoV, 32 (62%) of 52 travelers had other respiratory viruses.21 When testing for alternative pathogens, clinicians should order molecular or antigen-based detection methods.
TREATMENT
Unfortunately, treatment for MERS is primarily supportive.
Ribavirin and interferon alfa-2b demonstrated activity in an animal model, but the regimen was ineffective when given a median of 19 (range 10–22) days after admission in 5 critically ill patients who subsequently died.22 A retrospective analysis comparing 20 patients with severe MERS-CoV who received ribavirin and interferon alfa-2a with 24 patients who did not reported that while survival was improved at 14 days, the mortality rates were similar at 28 days.23
A systematic review of treatments used for severe acute respiratory syndrome (SARS) reported that most studies investigating steroid use were inconclusive and some showed possible harm, suggesting that systemic steroids should be avoided in coronavirus infections.24
PREVENTION
Healthcare-associated outbreaks of MERS are well described, and thus recognition of potential cases and prompt institution of appropriate infection control measures are critical.15,25
Healthcare providers should ask patients about recent travel history and ascertain if they meet the CDC criteria for a “patient under investigation” (PUI), ie, if they have both clinical features and an epidemiologic risk of MERS (Table 1). However, these recommendations for identification will assuredly change as the outbreak matures, and healthcare providers should refer to the CDC website for the most up-to-date information.
Once a PUI is identified, standard, contact, and airborne precautions are advised. These measures include performing hand hygiene and donning personal protective equipment, including gloves, gowns, eye protection, and respiratory protection (ie, a respirator) that is at least as protective as a fit-tested National Institute for Occupational Safety and Health-certified N95 filtering face-piece respirator. In addition, a patient with possible MERS should be placed in an airborne infection isolation room.
Traveler’s advice
The CDC does not currently recommend that Americans change their travel plans because of MERS. Clinicians performing pretravel evaluations should advise patients of current information on MERS. Patients at risk for MERS who develop a respiratory illness within 14 days of return should seek medical attention and inform healthcare providers of their travel history.
SUMMARY
Recent experience with SARS, Ebola virus disease, and now MERS-CoV highlights the impact of global air travel as a vector for the rapid worldwide dissemination of communicable diseases. Healthcare providers should elicit a travel history in all patients presenting with a febrile illness, as an infection acquired in one continent may not become manifest until the patient presents in another.
The scope of the current MERS-CoV outbreak is still evolving, with concerns that viral evolution could result in a SARS-like outbreak, as experienced almost a decade ago.
Healthcare providers are advised to screen patients at risk for MERS-CoV for respiratory symptoms, and to institute appropriate infection control measures. Through recognition and isolation, healthcare providers are at the front line in limiting the spread of this potentially lethal virus.
- Zaki AM, van Boheemen S, Bestebroer TM, Osterhaus ADME, Fouchier RAM. Isolation of a novel coronavirus from a man with pneumonia in Saudi Arabia. N Engl J Med 2012; 367:1814–1820.
- Al-Abdallat MM, Payne DC, Alqasrawi S, et al. Hospital-associated outbreak of Middle East respiratory syndrome coronavirus: a serologic, epidemiologic, and clinical description. Clin Infect Dis 2014; 59:1225–1233.
- World Health Organization. Frequently asked questions on Middle East respiratory syndrome coronavirus (MERS-CoV). www.who.int/csr/disease/coronavirus_infections/faq/en/. Accessed July 29, 2015.
- Bialek SR, Allen D, Alvarado-Ramy F, et al; Centers for Disease Control and Prevention (CDC). First confirmed cases of Middle East respiratory syndrome coronavirus (MERS-CoV) infection in the United States, updated information on the epidemiology of MERS-CoV infection, and guidance for the public, clinicians, and public health authorities—May 2014. MMWR Morb Mortal Wkly Rep 2014; 63:431–436.
- World Health Organization. Middle East respiratory syndrome coronavirus (MERS-CoV) – Republic of Korea. www.who.int/csr/don/12-june-2015-mers-korea/en/. Accessed July 29, 2015.
- Peiris JSM, Guan Y, Yuen KY. Severe acute respiratory syndrome. Nat Med 2004; 10:S88–S97.
- van Doremalen N, Miazqowicz KL, Milne-Price S, et al. Host species restriction of Middle East respiratory syndrome coronavirus through its receptor, dipeptidyl peptidase 4. J Virol 2014; 88:9220–9232.
- Zumla A, Hui DS, Perlman S. Middle East respiratory syndrome. Lancet 2015; S0140-6736(15)60454-604548 (Epub ahead of print).
- Meyer B, Muller MA, Corman WM, et al. Antibodies against MERS coronavirus in dromedary camels, United Arab Emirates, 2003 and 2013. Emerg Infect Dis 2014; 20:552–559.
- Haagmans BL, Al Dhahiry SH, Reusken CB, et al. Middle East respiratory syndrome coronavirus in dromedary camels: an outbreak investigation. Lancet Infect Dis 2014; 14:140–145.
- Azhar EI, El-Kafrawy SA, Farraj SA, et al. Evidence for camel-to-human transmission of MERS coronavirus. N Engl J Med 2014; 370:2499–2505.
- Chowell G, Blumberg S, Simonsen L, Miller MA, Viboud C. Synthesizing data and models for the spread of MERS-CoV, 2013: key role of index cases and hospital transmission. Epidemics 2014; 9:40–51.
- Biggerstaff M, Chauchemez S, Reed C, Gambhir M, Finelli L. Estimates of the reproduction number for seasonal, pandemic, and zoonotic influenza: a systematic review of the literature. BMC Infect Dis 2014: 14:480.
- Kucharski AJ, Althaus CL. The role of superspreading in Middle East respiratory syndrome coronavirus (MERS-CoV) transmission. Euro Surveill 2015; 20.
- Oboho I, Tomczyk S, Al-Asmari A, et al. 2014 MERS-CoV outbreak in Jeddah—a link to health care facilities. N Engl J Med 2015; 372:846–854.
- Arabi YM, Arifi AA, Balkhy HH, et al. Clinical course and outcomes of critically ill patients with Middle East respiratory syndrome coronavirus infection. Ann Intern Med 2014; 160:389–397.
- Assiri A, Al-Tawfig JA, Al-Rabeeah AA, et al. Epidemiological, demographic, and clinical characteristics of 47 cases of Middle East respiratory syndrome coronavirus disease from Saudi Arabia: a descriptive study. Lancet Infect Dis 2013; 13:752–761.
- Das KM, Lee EY, Enani MA, et al. CT correlation with outcomes in 15 patients with acute Middle East respiratory syndrome coronavirus. AJR Am J Roentgenol 2015; 204:736–742.
- Memish ZA, Al-Tawfiq JA, Makhdoom HQ, et al. Respiratory tract samples, viral load, and genome fraction yield in patients with Middle East respiratory syndrome. J Infect Dis 2014; 210:1590–1594.
- Centers for Disease Control and Prevention. Middle East respiratory syndrome (MERS). Interim guidelines for collecting, handling, and testing clinical specimens from patients under investigation (PUIs) for Middle East respiratory syndrome coronavirus (MERS-CoV)—version 2.1. www.cdc.gov/coronavirus/mers/guidelines-clinical-specimens.html. Accessed July 29, 2015.
- Shakhkarami M, Yen C, Glaser CA, Xia D, Watt J, Wadford DA. Laboratory testing for Middle East respiratory syndrome coronavirus, California, USA, 2013–2014. Emerg Infect Dis 2015; 21: E-pub ahead of print. wwwnc.cdc.gov/eid/article/21/9/15-0476_article. Accessed July 29, 2015.
- Al-Tawfiq JA, Momattin H, Dib J, Memish ZA. Ribavirin and interferon therapy in patients infected with the Middle East respiratory syndrome coronavirus: an observational study. Int J Infect Dis 2014; 20:42–46.
- Omrani AS, Saad MM, Baig K, et al. Ribavirin and interferon alfa-2a for severe Middle East respiratory syndrome coronavirus infection: a retrospective cohort study. Lancet Infect Dis 2014; 14:1090–1095.
- Stockman LJ, Bellamy R, Garner, P. SARS: systematic review of treatment effects. PLoS Med 2006; 3:e343.
- Assiri A, McGeer A, Perl TM, et al; KSA MERS-CoV Investigation Team. Hospital outbreak of Middle East respiratory syndrome coronavirus. N Engl J Med 2013; 369:407–416.
KEY POINTS
- In MERS, initial complaints are of fever, cough, chills and myalgia. In a subset of patients, usually those with underlying illnesses, the disease can progress to fulminant sepsis with respiratory and renal failure and death.
- Healthcare providers should regularly visit the US Centers for Disease Control and Prevention website for current information on countries experiencing a MERS outbreak, and for advice on how to identify a potentially infected patient.
- MERS-CoV has caused several healthcare-related outbreaks, so prompt identification and isolation of infected patients is critical to limiting the spread of infection. A “patient under identification” (ie, a person who has both clinical features and an epidemiologic risk) should be cared for under standard, contact, and airborne precautions.
Perioperative MI: Data, practice, and questions

Except in emergency or specific high-risk surgery, or for extremely fragile high-risk patients, we anticipate a successful outcome from noncardiac surgery. The skills and tools of our anesthesiology colleagues have advanced to the point that severe intraoperative and immediate postoperative complications are rare.
Preoperative risk assessment and perioperative medical management in large medical centers are now largely done by hospital-based physicians with interest and expertise in this subspecialty, and are integrated into the care of the surgical patient. This has likely contributed to improved patient outcomes. Yet postoperative cardiovascular events still cause significant morbidity (although they generally occur in less than 10% of patients).
The entity of perioperative myocardial infarction (MI) has an interesting history. We have recognized for several decades that its presentation is often different than the usually diagnosed MI: perioperative MI is often painless and may manifest as unexplained sinus tachycardia, subtle changes in mental status, or mild dyspnea. These symptoms, if they occurred while the patient was at home, would often be mild enough that the patient would not seek immediate medical attention. Autopsy studies suggested that many of these MIs result from a different pathophysiology than the garden variety MI; plaque rupture with or without secondary thrombosis may be less common than myocardial injury resulting from an imbalance between cardiac demand and blood flow. Studies initially suggested that postoperative MI occurred many days after the surgery. But as tests to diagnose myocyte injury became more sensitive (electrocardiography, creatine kinase, creatine kinase MB, and now troponin), it was recognized that cardiac injury actually occurred very soon after or even during surgery.
With the advent of highly sensitive and fairly specific troponin assays, it seems that perioperative cardiac injury is extremely common, perhaps occurring in up to 20% of patients (if we include patients at high risk based on traditional criteria). This has led to the newly described entity of “myocardial injury after noncardiac surgery” (MINS). MINS patients, diagnosed by troponin elevations, usually are asymptomatic, and many do not meet criteria for any type of MI. But strikingly, as discussed in this issue of the Journal by Horr et al, simply having a postoperative troponin elevation predicts an increased risk of clinical cardiovascular events and a decreased 30-day survival rate.
Adding postoperative troponin measurement to the usual preoperative screening protocol significantly increases our ability to predict delayed cardiovascular events and mortality. As pointed out by Cohn in his accompanying editorial, the benefit, if any, of screening low-risk patients remains to be defined. But an even more important issue, as commented upon in both papers, is what to do when an elevated troponin is detected in a postoperative patient who is otherwise doing perfectly well. Given our current knowledge of the pathophysiology of postoperative MI and the still overall low mortality, it seems unreasonable to immediately take all of these patients to the catheterization suite. Yet with current knowledge of the prognostic significance of troponin elevation, this can’t be ignored. Should all patients receive immediate high-intensity statin therapy, antiplatelet therapy if safe in the specific perioperative setting, and postdischarge physiologic stress studies, or should we “just” take it as a potential high-impact teaching moment and advise patients of their increased cardiovascular risk and offer our usual heart-healthy admonitions?
The confirmed observation that postoperative troponin elevation predicts morbidity and mortality over the subsequent 30 days, and perhaps even longer, has triggered the start of several interventional trials. The results of these will, hopefully, help us to further improve perioperative outcomes.
Postoperative troponin surveillance: A diagnostic dilemma
A major goal of perioperative medicine is to prevent, detect, and treat postoperative complications—in particular, cardiovascular complications. In the Perioperative Ischemic Evaluation (POISE) study,1 the 30-day mortality rate was four times higher in patients who had a perioperative myocardial infarction (MI) than in those who did not.1 Yet fewer than half of patients who have a postoperative MI have ischemic symptoms, suggesting that routine monitoring of cardiac biomarkers could detect these events and allow early intervention.
From 10% to 20% of patients have troponin elevations after noncardiac surgery.2 But until recently, many of these elevations were thought to be of minor importance and were ignored unless the patient met diagnostic criteria for MI. A new entity called MINS (myocardial injury after noncardiac surgery)3 was defined as a troponin level exceeding the upper limit of normal with or without ischemic symptoms or electrocardiographic changes and excluding noncardiac causes such as stroke, sepsis, and pulmonary embolism. Because elevations of troponin at any level have been associated with increased 30-day mortality rates, the question of the value of routine screening of asymptomatic postoperative patients for troponin elevation has been raised.
In this issue of Cleveland Clinic Journal of Medicine, Horr et al4 review the controversy of postoperative screening using troponin measurement and propose an algorithm for management.
QUESTIONS TO CONSIDER
Before recommending screening asymptomatic patients for troponin elevation, we need to consider a number of questions:
- Which patients should be screened?
- How should troponin elevations be treated?
- Would casting a wider net improve outcomes?
- What are the possible harms of troponin screening?
The bottom line is, will postoperative troponin screening change management and result in improved outcomes?
WHICH PATIENTS SHOULD BE SCREENED?
Why routine screening may be indicated
Elevated or even just detectable troponin levels are associated with adverse outcomes. A systematic review and meta-analysis of 3,318 patients2 demonstrated that high troponin levels after noncardiac surgery were independently associated with a risk of death three times higher than in patients with normal troponin levels.
In the Vascular Events in Noncardiac Surgery Patients Cohort Evaluation (VISION) study,5 troponin T was measured in 15,133 patients after surgery. The overall mortality rate was 1.9%, and the higher the peak troponin T level the higher the risk of death.
In a single-center Canadian retrospective cohort analysis of 51,701 consecutive patients by Beattie et al,6 the peak postoperative level of troponin I improved the ability of a multivariable model to predict the risk of death. As in the VISION study, the mortality rate rose with the troponin level.6
In a study by van Waes et al7 in 2,232 consecutive noncardiac surgery patients over age 60 at intermediate to high risk, the all-cause mortality rate was 3%, and troponin I was elevated in 19% of patients. As in VISION and the Canadian retrospective study, the mortality rate increased with the troponin level.
Why routine screening may not help
In VISION,5 the probability of detecting myocardial injury was three times higher if patients were screened for 3 days after surgery than if they were tested only if clinical signs or symptoms indicated it.
However, in deciding whether to screen troponin levels in postoperative patients, we must take into account the patient’s clinical risk as well as the risk of the surgical procedure. Troponin elevation in low-risk patients is associated with a low mortality rate, and troponin elevations often are secondary to causes other than myocardial ischemia. In the study by van Waes et al,7 the association was stronger with all-cause mortality than with myocardial infarction, and in VISION5 there were more nonvascular deaths than vascular deaths, suggesting that troponin elevation is a nonspecific marker of adverse events.
Beattie et al6 found that the probability that a patient’s postoperative troponin level would be elevated increased as the patient’s clinical risk increased, but the yield was very low and the mortality rate was less than 1% in patients in risk classes 1 through 3 (of a possible 5 classes). In risk class 4, troponin I was elevated in 21.8%, and the mortality rate was 2.5%; in risk class 5 troponin I was elevated in 18.6%, and the mortality rate was 11.9%. Analyzing the data according to the type of surgery, mortality rates were highest in patients undergoing vascular surgery, neurosurgery, general surgery, and thoracic procedures, with all-cause mortality rates ranging from 2.6% to 5.2%.6
Screening should depend on risk
If postoperative troponin screening is to be recommended, it should not be routine for all patients but should be restricted to those with high clinical risk and those undergoing high-risk surgical procedures.
Rodseth and Devereaux8 recommended routine postoperative troponin measurement not only after vascular surgery, but also after high-risk surgery (general, neurosurgery, emergency surgery), as well as in patients over age 65 and patients with established atherosclerotic disease or risk factors for it. However, I believe this latter group may not be at high enough risk to justify routine screening.
Beattie et al6 advocated limiting postoperative troponin screening to patients with at least a moderate risk of MI and also suggested an international consensus conference to define criteria for postoperative MI, populations who should have routine postoperative screening, and consensus on treatment of patients with troponin elevations but not meeting the criteria for MI. Without this consensus on treatment, it is unclear if protocols for universal postoperative screening would improve outcomes.
For these reasons, the 2014 joint guidelines of the American College of Cardiology and American Heart Association9 (ACC/AHA) stated that the benefit of postoperative screening of troponin levels in patients with a high perioperative risk of MI but no signs or symptoms of myocardial ischemia or MI is “uncertain in the absence of established risks and benefits of a defined management strategy.” This recommendation was given a class IIb rating (may be considered) and level of evidence B (usefulness or efficacy less well established). On the other hand, the guidelines recommend measuring troponin levels if signs or symptoms suggest myocardial ischemia or MI (class I recommendation, level of evidence A) but state there is no benefit in routine screening of unselected patients without signs or symptoms of ischemia (class III recommendation, level of evidence B).
HOW SHOULD ELEVATIONS BE TREATED?
Because a troponin elevation in a patient without signs or symptoms of ischemia does not predict a specific type of death, physicians need to treat patients individually. Perioperative ischemia and inflammation could lead to injury of other organs, and death could result from multiorgan injury rather than from myocardial injury. Treating these troponin elevations in the same way we treat MI—ie, with antiplatelet therapy and anticoagulation—may result in increased bleeding or unnecessary cardiac catheterization, and starting beta-blockers in the perioperative period may be harmful. Because it is unclear how to manage these patients, cardiac medications have not routinely been given in previous studies.
POISE provided some evidence that patients with postoperative MI who were given aspirin and a statin did better.1 And the results of a smaller study10 suggested that intensification of drug therapy (aspirin, statin, beta-blocker, angiotensin-converting enzyme inhibitor) in patients with postoperative troponin I elevations was associated with improved outcomes at 1 year. If the bleeding risk is low, I believe that there is potential benefit in prescribing aspirin and statins for these patients.
CASTING A WIDER NET
Further complicating matters in the near future is the issue of using fifth-generation high-sensitivity troponin T assays. The European Society of Cardiology guidelines11 are somewhat more liberal than the ACC/AHA guidelines, stating that measuring high-sensitivity troponin after surgery “may be considered in high-risk patients to improve risk stratification.” This is a class IIB recommendation, level of evidence B.
With fifth-generation high-sensitivity troponin assays, troponin may be elevated in as many as 20% of patients preoperatively and 40% postoperatively, significantly increasing the number of patients said to have a complication. Besides potentially subjecting these patients to unproven treatments, such results would give the false impression that hospitals and surgeons using the screening tools actually had higher complication rates than those that did not screen.
POSSIBLE HARMS OF SCREENING
Elevated postoperative troponin may identify patients at higher risk of any adverse event but not specifically of cardiac-specific events. In an editorial, Beckman12 stated that routine measurement of troponin “is more likely to cause harm than to provide benefit and should not be used as a screening modality” because of the lack of a proven beneficial treatment strategy, because of the possible harm from applying the standard treatment for type 1 MI, and because it could divert attention from a true cause of an adverse event to a false one—ie, from a nonvascular condition to MI.11
There is clearly a need for clinical trials to determine which treatment, if any, can improve outcomes in these patients, and several trials have been started. But until we have evidence, we can only speculate as to whether screening postoperative patients for troponin elevation is beneficial or detrimental.
- Devereaux PJ, Xavier D, Pogue J, et al. Characteristics and short-term prognosis of perioperative myocardial infarction in patients undergoing noncardiac surgery: a cohort study. Ann Intern Med 2011; 154:523–528.
- Levy M, Heels-Ansdell D, Hiralal R, et al. Prognostic value of troponin and creatine kinase muscle and brain isoenzyme measurement after noncardiac surgery: a systematic review and meta-analysis. Anesthesiology 2011; 114:796–806.
- Botto F, Alonso-Coello P, Chan MT, et al. Myocardial injury after noncardiac surgery: a large, international, prospective cohort study establishing diagnostic criteria, characteristics, predictors, and 30-day outcomes. Anesthesiology 2014; 120:564–578.
- Horr S, Reed G, Menon V. Troponin elevation after noncardiac surgery: significance and management. Cleve Clin J Med 2015; 82:595–602.
- Vascular Events In Noncardiac Surgery Patients Cohort Evaluation Study I, Devereaux PJ, Chan MT, Alonso-Coello P, et al. Association between postoperative troponin levels and 30-day mortality among patients undergoing noncardiac surgery. JAMA 2012; 307:2295–2304.
- Beattie WS, Karkouti K, Tait G, et al. Use of clinically based troponin underestimates the cardiac injury in non-cardiac surgery: a single-centre cohort study in 51,701 consecutive patients. Can J Anaesth 2012; 59:1013–1022.
- van Waes JA, Nathoe HM, de Graaff JC, et al. Myocardial injury after noncardiac surgery and its association with short-term mortality. Circulation 2013; 127:2264–2271.
- Rodseth R, Devereaux PJ. Should we measure troponin routinely in patients after vascular surgery? American College of Cardiology. www.acc.org/latest-in-cardiology/articles/2014/07/18/14/46/should-we-measure-troponin-routinely-in-patients-after-vascular-surgery?w_nav=LC. Accessed August 5, 2015.
- Fleisher LA, Fleischmann KE, Auerbach AD, et al. 2014 ACC/AHA guideline on perioperative cardiovascular evaluation and management of patients undergoing noncardiac surgery: a report of the American College of Cardiology/American Heart Association Task Force on Practice Guidelines. J Am Coll Cardiol 2014; 64:e77–e137.
- Foucrier A, Rodseth R, Aissaoui M, et al. The long-term impact of early cardiovascular therapy intensification for postoperative troponin elevation after major vascular surgery. Anesth Analg 2014; 119:1053–1063.
- Kristensen SD, Knuuti J, Saraste A, et al. 2014 ESC/ESA Guidelines on non-cardiac surgery: cardiovascular assessment and management: The Joint Task Force on non-cardiac surgery: cardiovascular assessment and management of the European Society of Cardiology (ESC) and the European Society of Anaesthesiology (ESA). Eur Heart J 2014; 35:2383–2431.
- Beckman JA. Postoperative troponin screening: a cardiac Cassandra? Circulation 2013; 127:2253–2266.
A major goal of perioperative medicine is to prevent, detect, and treat postoperative complications—in particular, cardiovascular complications. In the Perioperative Ischemic Evaluation (POISE) study,1 the 30-day mortality rate was four times higher in patients who had a perioperative myocardial infarction (MI) than in those who did not.1 Yet fewer than half of patients who have a postoperative MI have ischemic symptoms, suggesting that routine monitoring of cardiac biomarkers could detect these events and allow early intervention.
From 10% to 20% of patients have troponin elevations after noncardiac surgery.2 But until recently, many of these elevations were thought to be of minor importance and were ignored unless the patient met diagnostic criteria for MI. A new entity called MINS (myocardial injury after noncardiac surgery)3 was defined as a troponin level exceeding the upper limit of normal with or without ischemic symptoms or electrocardiographic changes and excluding noncardiac causes such as stroke, sepsis, and pulmonary embolism. Because elevations of troponin at any level have been associated with increased 30-day mortality rates, the question of the value of routine screening of asymptomatic postoperative patients for troponin elevation has been raised.
In this issue of Cleveland Clinic Journal of Medicine, Horr et al4 review the controversy of postoperative screening using troponin measurement and propose an algorithm for management.
QUESTIONS TO CONSIDER
Before recommending screening asymptomatic patients for troponin elevation, we need to consider a number of questions:
- Which patients should be screened?
- How should troponin elevations be treated?
- Would casting a wider net improve outcomes?
- What are the possible harms of troponin screening?
The bottom line is, will postoperative troponin screening change management and result in improved outcomes?
WHICH PATIENTS SHOULD BE SCREENED?
Why routine screening may be indicated
Elevated or even just detectable troponin levels are associated with adverse outcomes. A systematic review and meta-analysis of 3,318 patients2 demonstrated that high troponin levels after noncardiac surgery were independently associated with a risk of death three times higher than in patients with normal troponin levels.
In the Vascular Events in Noncardiac Surgery Patients Cohort Evaluation (VISION) study,5 troponin T was measured in 15,133 patients after surgery. The overall mortality rate was 1.9%, and the higher the peak troponin T level the higher the risk of death.
In a single-center Canadian retrospective cohort analysis of 51,701 consecutive patients by Beattie et al,6 the peak postoperative level of troponin I improved the ability of a multivariable model to predict the risk of death. As in the VISION study, the mortality rate rose with the troponin level.6
In a study by van Waes et al7 in 2,232 consecutive noncardiac surgery patients over age 60 at intermediate to high risk, the all-cause mortality rate was 3%, and troponin I was elevated in 19% of patients. As in VISION and the Canadian retrospective study, the mortality rate increased with the troponin level.
Why routine screening may not help
In VISION,5 the probability of detecting myocardial injury was three times higher if patients were screened for 3 days after surgery than if they were tested only if clinical signs or symptoms indicated it.
However, in deciding whether to screen troponin levels in postoperative patients, we must take into account the patient’s clinical risk as well as the risk of the surgical procedure. Troponin elevation in low-risk patients is associated with a low mortality rate, and troponin elevations often are secondary to causes other than myocardial ischemia. In the study by van Waes et al,7 the association was stronger with all-cause mortality than with myocardial infarction, and in VISION5 there were more nonvascular deaths than vascular deaths, suggesting that troponin elevation is a nonspecific marker of adverse events.
Beattie et al6 found that the probability that a patient’s postoperative troponin level would be elevated increased as the patient’s clinical risk increased, but the yield was very low and the mortality rate was less than 1% in patients in risk classes 1 through 3 (of a possible 5 classes). In risk class 4, troponin I was elevated in 21.8%, and the mortality rate was 2.5%; in risk class 5 troponin I was elevated in 18.6%, and the mortality rate was 11.9%. Analyzing the data according to the type of surgery, mortality rates were highest in patients undergoing vascular surgery, neurosurgery, general surgery, and thoracic procedures, with all-cause mortality rates ranging from 2.6% to 5.2%.6
Screening should depend on risk
If postoperative troponin screening is to be recommended, it should not be routine for all patients but should be restricted to those with high clinical risk and those undergoing high-risk surgical procedures.
Rodseth and Devereaux8 recommended routine postoperative troponin measurement not only after vascular surgery, but also after high-risk surgery (general, neurosurgery, emergency surgery), as well as in patients over age 65 and patients with established atherosclerotic disease or risk factors for it. However, I believe this latter group may not be at high enough risk to justify routine screening.
Beattie et al6 advocated limiting postoperative troponin screening to patients with at least a moderate risk of MI and also suggested an international consensus conference to define criteria for postoperative MI, populations who should have routine postoperative screening, and consensus on treatment of patients with troponin elevations but not meeting the criteria for MI. Without this consensus on treatment, it is unclear if protocols for universal postoperative screening would improve outcomes.
For these reasons, the 2014 joint guidelines of the American College of Cardiology and American Heart Association9 (ACC/AHA) stated that the benefit of postoperative screening of troponin levels in patients with a high perioperative risk of MI but no signs or symptoms of myocardial ischemia or MI is “uncertain in the absence of established risks and benefits of a defined management strategy.” This recommendation was given a class IIb rating (may be considered) and level of evidence B (usefulness or efficacy less well established). On the other hand, the guidelines recommend measuring troponin levels if signs or symptoms suggest myocardial ischemia or MI (class I recommendation, level of evidence A) but state there is no benefit in routine screening of unselected patients without signs or symptoms of ischemia (class III recommendation, level of evidence B).
HOW SHOULD ELEVATIONS BE TREATED?
Because a troponin elevation in a patient without signs or symptoms of ischemia does not predict a specific type of death, physicians need to treat patients individually. Perioperative ischemia and inflammation could lead to injury of other organs, and death could result from multiorgan injury rather than from myocardial injury. Treating these troponin elevations in the same way we treat MI—ie, with antiplatelet therapy and anticoagulation—may result in increased bleeding or unnecessary cardiac catheterization, and starting beta-blockers in the perioperative period may be harmful. Because it is unclear how to manage these patients, cardiac medications have not routinely been given in previous studies.
POISE provided some evidence that patients with postoperative MI who were given aspirin and a statin did better.1 And the results of a smaller study10 suggested that intensification of drug therapy (aspirin, statin, beta-blocker, angiotensin-converting enzyme inhibitor) in patients with postoperative troponin I elevations was associated with improved outcomes at 1 year. If the bleeding risk is low, I believe that there is potential benefit in prescribing aspirin and statins for these patients.
CASTING A WIDER NET
Further complicating matters in the near future is the issue of using fifth-generation high-sensitivity troponin T assays. The European Society of Cardiology guidelines11 are somewhat more liberal than the ACC/AHA guidelines, stating that measuring high-sensitivity troponin after surgery “may be considered in high-risk patients to improve risk stratification.” This is a class IIB recommendation, level of evidence B.
With fifth-generation high-sensitivity troponin assays, troponin may be elevated in as many as 20% of patients preoperatively and 40% postoperatively, significantly increasing the number of patients said to have a complication. Besides potentially subjecting these patients to unproven treatments, such results would give the false impression that hospitals and surgeons using the screening tools actually had higher complication rates than those that did not screen.
POSSIBLE HARMS OF SCREENING
Elevated postoperative troponin may identify patients at higher risk of any adverse event but not specifically of cardiac-specific events. In an editorial, Beckman12 stated that routine measurement of troponin “is more likely to cause harm than to provide benefit and should not be used as a screening modality” because of the lack of a proven beneficial treatment strategy, because of the possible harm from applying the standard treatment for type 1 MI, and because it could divert attention from a true cause of an adverse event to a false one—ie, from a nonvascular condition to MI.11
There is clearly a need for clinical trials to determine which treatment, if any, can improve outcomes in these patients, and several trials have been started. But until we have evidence, we can only speculate as to whether screening postoperative patients for troponin elevation is beneficial or detrimental.
- Devereaux PJ, Xavier D, Pogue J, et al. Characteristics and short-term prognosis of perioperative myocardial infarction in patients undergoing noncardiac surgery: a cohort study. Ann Intern Med 2011; 154:523–528.
- Levy M, Heels-Ansdell D, Hiralal R, et al. Prognostic value of troponin and creatine kinase muscle and brain isoenzyme measurement after noncardiac surgery: a systematic review and meta-analysis. Anesthesiology 2011; 114:796–806.
- Botto F, Alonso-Coello P, Chan MT, et al. Myocardial injury after noncardiac surgery: a large, international, prospective cohort study establishing diagnostic criteria, characteristics, predictors, and 30-day outcomes. Anesthesiology 2014; 120:564–578.
- Horr S, Reed G, Menon V. Troponin elevation after noncardiac surgery: significance and management. Cleve Clin J Med 2015; 82:595–602.
- Vascular Events In Noncardiac Surgery Patients Cohort Evaluation Study I, Devereaux PJ, Chan MT, Alonso-Coello P, et al. Association between postoperative troponin levels and 30-day mortality among patients undergoing noncardiac surgery. JAMA 2012; 307:2295–2304.
- Beattie WS, Karkouti K, Tait G, et al. Use of clinically based troponin underestimates the cardiac injury in non-cardiac surgery: a single-centre cohort study in 51,701 consecutive patients. Can J Anaesth 2012; 59:1013–1022.
- van Waes JA, Nathoe HM, de Graaff JC, et al. Myocardial injury after noncardiac surgery and its association with short-term mortality. Circulation 2013; 127:2264–2271.
- Rodseth R, Devereaux PJ. Should we measure troponin routinely in patients after vascular surgery? American College of Cardiology. www.acc.org/latest-in-cardiology/articles/2014/07/18/14/46/should-we-measure-troponin-routinely-in-patients-after-vascular-surgery?w_nav=LC. Accessed August 5, 2015.
- Fleisher LA, Fleischmann KE, Auerbach AD, et al. 2014 ACC/AHA guideline on perioperative cardiovascular evaluation and management of patients undergoing noncardiac surgery: a report of the American College of Cardiology/American Heart Association Task Force on Practice Guidelines. J Am Coll Cardiol 2014; 64:e77–e137.
- Foucrier A, Rodseth R, Aissaoui M, et al. The long-term impact of early cardiovascular therapy intensification for postoperative troponin elevation after major vascular surgery. Anesth Analg 2014; 119:1053–1063.
- Kristensen SD, Knuuti J, Saraste A, et al. 2014 ESC/ESA Guidelines on non-cardiac surgery: cardiovascular assessment and management: The Joint Task Force on non-cardiac surgery: cardiovascular assessment and management of the European Society of Cardiology (ESC) and the European Society of Anaesthesiology (ESA). Eur Heart J 2014; 35:2383–2431.
- Beckman JA. Postoperative troponin screening: a cardiac Cassandra? Circulation 2013; 127:2253–2266.

Troponin elevation after noncardiac surgery: Significance and management
More than 200 million patients undergo noncardiac surgery each year, and the volume is increasing.1 Cardiovascular complications are a major cause of morbidity and mortality in the perioperative period.
Before the advent of modern cardiac biomarkers, an estimated 2% to 3% of all patients undergoing noncardiac surgery had a major adverse cardiac event.2 However, more recent studies suggest that 5% to 25% of patients have troponin elevations after noncardiac surgery, depending on the patient population,3–6 and many are asymptomatic, suggesting that many patients are sustaining undetected myocardial injury. Those who suffer a myocardial infarction or myocardial injury have elevated morbidity and mortality rates, not only perioperatively, but also at 30 days and even at up to 1 year.3–5,7–11
Yet there are almost no data on how best to manage these patients; the available guidelines, therefore, do not provide sufficient recommendations for clinical practice.
To address the lack of guidelines, we examine the incidence and proposed mechanisms of myocardial injury after noncardiac surgery, suggest an approach to identifying patients at risk, recommend treatment strategies, and consider future directions.
CARDIAC BIOMARKERS
When cardiac cellular injury from ischemia, direct trauma, or other cause disrupts the cell membrane, intracellular contents enter the extracellular space, including the blood stream. If the myocyte damage is extensive enough, biochemical assays can detect these substances.

Troponin, creatine kinase, myoglobin, and lactate dehydrogenase are common biomarkers of necrosis that, when detected in the plasma, may indicate cardiac injury. Each can be detected at varying times after cardiac injury (Figure 1).12
Cardiac troponins I and T
Of the biomarkers, cardiac troponin I and cardiac troponin T are now the most widely used and are the most specific for myocyte injury.
Troponins are proteins that regulate the calcium-induced interaction between myosin and actin that results in muscle contraction. Troponin is a complex consisting of three subunits: troponin C, troponin I, and troponin T. The cardiac troponin I and T isoforms are distinct from those found in skeletal muscle, making them specific for myocyte injury, and they are currently the recommended markers for diagnosing acute myocardial infarction.13
The troponin immunoassays currently available are not standardized among laboratories and point-of-care methods, and thus, levels cannot be compared across testing centers.14 Each assay has unique performance characteristics, but guidelines recommend using the 99th percentile value from a normal reference population for a given assay to define whether myocardial injury is present.13
Troponin elevation has prognostic value in patients presenting with acute coronary syndromes,15–18 and the degree of elevation correlates with infarct size.19–21
Controversy exists as to whether troponin and other biomarkers are released only after myocardial necrosis or after reversible injury as well. Using newer, highly sensitive assays, troponin elevations have been detected after short periods of ischemia during stress testing22,23 and in patients with stable angina,24 suggesting that reversible cardiac stress and injury can lead to troponin release. This mechanism may play an important role during the myocardial injury that can occur in patients undergoing noncardiac surgery.
MYOCARDIAL INFARCTION vs MYOCARDIAL INJURY
In 2000, the Joint Task Force of the European Society of Cardiology, American College of Cardiology Foundation, American Heart Association, and World Heart Federation revised the criteria for the diagnosis of myocardial infarction created by the World Health Organization in 1979. The definition was revised again in 2007 and once more in 2012 to create the third universal definition of myocardial infarction.
Acute myocardial infarction
Acute myocardial infarction is defined as evidence of myocardial necrosis in a setting of myocardial ischemia, not related to causes such as trauma or pulmonary embolism, with a rise or a fall (or a rise and a fall) of cardiac biomarkers (at least one value being above the 99th percentile in the reference population) and any of the following:
- Symptoms of ischemia
- New ST-segment changes or new left bundle branch block
- Pathologic Q waves
- Imaging evidence of new loss of viable myocardium or new regional wall-motion abnormality
- Intracoronary thrombus by angiography or autopsy.13
Myocardial injury after noncardiac surgery
Studies10,11 have shown that many patients undergoing noncardiac surgery have evidence of cardiac biomarker release but do not meet the universal definition of myocardial infarction.
The Perioperative Ischemic Evaluation (POISE) trial10 reported that 415 (5%) of its patients met the definition of myocardial infarction, of whom only about 35% had symptoms of ischemia. Another 697 patients (8.3%) had isolated elevations in biomarkers without meeting the definition of myocardial infarction.
The VISION study11 (Vascular Events in Noncardiac Surgery Patients Cohort Evaluation) prospectively screened more than 15,000 patients in several countries for troponin elevation during the first 3 postoperative days and for ischemic symptoms and features. Of the patients screened, approximately 1,200 (8%) had troponin elevations, with fewer than half fulfilling the criteria for myocardial infarction.
In another study, van Waes et al6 prospectively screened 2,232 patients ages 60 and older undergoing intermediate- to high-risk noncardiac surgery. Troponin levels were elevated in 19% of the patients, but only 10 of these patients met the universal definition of myocardial infarction.
In all of these studies, patients with isolated elevation in myocardial biomarkers had worse short-term and long-term outcomes than those without. These observations led to a proposed definition of “myocardial injury after noncardiac surgery” that is broader than that of myocardial infarction and requires only elevation of cardiac biomarkers judged to be due to myocardial ischemia (ie, not from another obvious cause such as pulmonary embolism or myocarditis).3
FIVE TYPES OF MYOCARDIAL INFARCTION
The Joint Task Force13 categorizes myocardial infarction into five distinct types:
- Type 1—due to plaque rupture
- Type 2—due to imbalance between oxygen supply and demand
- Type 3—sudden cardiac death
- Type 4a—associated with percutaneous coronary intervention
- Type 4b—associated with stent thrombosis
- Type 5—associated with coronary artery bypass surgery.
Types 1 and 2 have both been implicated in perioperative myocardial infarction and injury. Patient characteristics and the physiologic response to surgical and anesthetic stressors likely contribute to the development of myocardial infarction and injury after noncardiac surgery.
Plaque rupture as a cause of postoperative myocardial infarction
The mechanism of type 1 myocardial infarction—plaque rupture or erosion leading to thrombosis and infarction—plays a significant role in most cases of acute coronary syndromes. Its role in perioperative and postoperative myocardial infarction or injury, however, is less clear.
In an autopsy study of 26 patients who died of myocardial infarction after noncardiac surgery, plaque rupture was evident in 12 (46%).25 A prospective angiographic study of 120 patients with acute coronary syndromes after noncardiac surgery found that nearly 50% had evidence of plaque rupture.26
Higher levels of catecholamines, cortisol,27,28 platelet reactivity,29 procoagulant factors,30 and coronary artery shear stress31 are all present in the postoperative period and may contribute to an increased propensity for plaque rupture or erosion. Whether plaque rupture is present in patients who have isolated troponin elevation but do not meet the criteria for myocardial infarction has not been investigated.
Oxygen supply-demand imbalance during and after surgery
Oxygen supply-demand imbalance (the mechanism in type 2 myocardial infarction) leading to myocyte stress, ischemia, and subsequent infarction is likely common in the perioperative and postoperative periods. As previously discussed, this imbalance may be present with or without symptoms.
Oxygen demand may increase in this period as a result of tachycardia32 caused by bleeding, pain, and catecholamines or increased wall stress from hypertension due to vasoconstriction or pain.33 Oxygen supply can be decreased secondary to tachycardia, anemia,34 hypotension, hypoxemia, hypercarbia, intravascular fluid shifts (bleeding or volume overload), or coronary vasoconstriction.33,35
These mechanisms of myocardial injury, infarction, or both can occur with or without underlying significant obstructive coronary artery disease. However, severe coronary artery disease is more common in those who have had a perioperative myocardial infarction.36
POSTOPERATIVE TROPONIN ELEVATION CARRIES A WORSE PROGNOSIS
Patients who suffer a myocardial infarction after noncardiac surgery have worse short- and long-term outcomes than their counterparts.4,5,7, 8,10,33 In the POISE trial,10 the 30-day mortality rate was 11.6% in those who had had a perioperative myocardial infarction, compared with 2.2% in those who did not (P < .001). The patients who had had a myocardial infarction were also more likely to have nonfatal cardiac arrest, coronary revascularization, and congestive heart failure.
Myocardial injury not fulfilling the criteria for myocardial infarction after noncardiac surgery is also associated with worse short-term and long-term outcomes.3,6,10,11,37,38 POISE patients with isolated elevations in cardiac biomarkers had a higher 30-day risk of coronary revascularization and nonfatal arrest.10 In the VISION trial, an elevation in troponin was the strongest predictor of death within 30 days after noncardiac surgery. This analysis also showed that the higher the peak troponin value, the greater the risk of death and the shorter the median time until death.11
A meta-analysis of 14 studies in 3,139 patients found that elevated troponin after noncardiac surgery was an independent predictor of death within 1 year (odds ratio [OR] 6.7, 95% confidence interval [CI] 4.1–10.9) and beyond 1 year (OR 1.8, 95% CI 1.4–2.3).37
SHOULD SCREENING BE ROUTINE AFTER NONCARDIAC SURGERY?
Since patients suffering myocardial infarction or injury after noncardiac surgery have a worse prognosis, many experts advocate routinely screening all high-risk patients and those undergoing moderate- to high-risk surgery. Many tools exist to determine which patients undergoing noncardiac surgery are at high risk of cardiac complications.
The revised Goldman Cardiac Risk Index is commonly used and well validated. Variables in this index that predict major cardiac complications are:
- High-risk surgery (vascular surgery, orthopedic surgery, and intraperitoneal or intrathoracic surgery)
- History of ischemic heart disease
- History of congestive heart failure
- History of cerebrovascular disease
- Diabetes requiring insulin therapy
- Chronic kidney disease with a creatinine > 2.0 mg/dL.
The more of these variables that are present, the higher the risk of perioperative cardiac events2,4:
- No risk factors: 0.4% risk (95% CI 0.1–0.8)
- One risk factor: 1.0% risk (95% CI 0.5–1.4)
- Two risk factors: 2.4% risk (95% CI 1.3–3.5)
- Three or more risk factors: 5.4% risk (95% CI 2.7–7.9).
Current guidelines from the American College of Cardiology and the American Heart Association give a class I recommendation (the highest) for measuring troponin levels after noncardiac surgery in patients who have symptoms or signs suggesting myocardial ischemia. They give a class IIb recommendation (usefulness is less well established) for screening those at high risk but without symptoms or signs of ischemia, despite the previously cited evidence that patients with troponin elevation are at increased risk. The IIb recommendation is due to a lack of validated treatment strategies to modify and attenuate the recognized risk with troponin elevation in this setting.39
LITTLE EVIDENCE TO GUIDE TREATMENT
In current practice, internists and cardiologists are often asked to consult on patients with troponin elevations noted after noncardiac surgery. Although published and ongoing studies examine strategies to prevent cardiovascular events during noncardiac surgery, we lack data on managing the cases of myocardial infarction and injury that actually occur after noncardiac surgery.
When managing a patient who has a troponin elevation after surgery, many clinical factors must be weighed, including hemodynamic and clinical stability and risk of bleeding. Confronted with ST-segment elevation myocardial infarction or high-risk non–ST-segment elevation myocardial infarction, most clinicians would favor an early invasive reperfusion strategy in accordance with guidelines on managing acute coronary syndrome. Fibrinolytic drugs for ST-segment elevation myocardial infarction are likely to be contraindicated in the postoperative period because they pose an unacceptable risk of bleeding.
Guideline-directed medical therapies for those suffering perioperative myocardial infarction may lower the risk of future cardiovascular events, as suggested by a retrospective study of 66 patients diagnosed with perioperative myocardial infarction after vascular surgery.40 Those in whom medical therapy for coronary artery disease was not intensified—defined as adding or increasing the dose of antiplatelet agent, statin, beta-blocker, or angiotensin-converting enzyme inhibitor—had higher rates of cardiovascular events at 12 months (hazard ratio [HR] 2.80, 95% CI 1.05–24.2).40
In those with asymptomatic myocardial infarction or isolated elevation in cardiac biomarkers, no treatment strategies have been assessed prospectively or in randomized trials. However, statins and aspirin have been suggested as providing some benefit. In a substudy of the POISE trial, the use of aspirin was associated with a 46% reduction in the 30-day mortality rate in those suffering a perioperative myocardial infarction, and statins were associated with a 76% reduction.10 In a single-center retrospective analysis of 337 patients undergoing moderate- to high-risk vascular surgery, statin therapy was associated with a lower 1-year mortality rate (OR 0.63, 95% CI 0.40–0.98).38
We propose a treatment algorithm for patients identified as having cardiovascular events after noncardiac surgery (Figure 2), based on current evidence and guidelines. Ultimately, treatment decisions should be tailored to the individual patient. Discussion of the risks and benefits of therapeutic options should include the patient and surgeon.
Ongoing and future trials
Ongoing and future trials are aimed at addressing definitive treatment strategies in this patient population.
The MANAGE trial (Management of Myocardial Injury After Non-cardiac Surgery Trial) is randomizing patients suffering myocardial injury after noncardiac surgery to receive either dabigatran and omeprazole or placebo to assess the efficacy of these agents in preventing major adverse cardiac events and the safety of anticoagulation (ClinicalTrials.gov Identifier: NCT01661101).
The INTREPID trial (Study of Ticagrelor Versus Aspirin Treatment in Patients With Myocardial Injury Post Major Non-Cardiac Surgery) will assess the efficacy and safety of ticagrelor treatment compared with aspirin in a similar population (ClinicalTrial.gov Identifier: NCT02291419). The trial will enroll approximately 1,000 patients identified as having a postoperative troponin elevation more than two times the upper limit of normal of the assay during the index hospitalization (Figure 3). Enrollment was to have begun in mid-2015.
- Weiser TG, Regenbogen SE, Thompson KD, et al. An estimation of the global volume of surgery: a modelling strategy based on available data. Lancet 2008; 372:139–144.
- Lee TH, Marcantonio ER, Mangione CM, et al. Derivation and prospective validation of a simple index for prediction of cardiac risk of major noncardiac surgery. Circulation 1999; 100:1043–1049.
- Botto F, Alonso-Coello P, Chan MT, et al. Myocardial injury after noncardiac surgery: a large, international, prospective cohort study establishing diagnostic criteria, characteristics, predictors, and 30-day outcomes. Anesthesiology 2014; 120:564–578.
- Devereaux PJ, Goldman L, Cook DJ, Gilbert K, Leslie K, Guyatt GH. Perioperative cardiac events in patients undergoing noncardiac surgery: a review of the magnitude of the problem, the pathophysiology of the events and methods to estimate and communicate risk. CMAJ 2005; 173:627–634.
- McFalls EO, Ward HB, Moritz TE, et al. Predictors and outcomes of a perioperative myocardial infarction following elective vascular surgery in patients with documented coronary artery disease: results of the CARP trial. Eur Heart J 2008; 29:394–401.
- van Waes JA, Nathoe HM, de Graaff JC, et al. Myocardial injury after noncardiac surgery and its association with short-term mortality. Circulation 2013; 127:2264–2271.
- Badner NH, Knill RL, Brown JE, Novick TV, Gelb AW. Myocardial infarction after noncardiac surgery. Anesthesiology 1998; 88:572–578.
- Kim LJ, Martinez EA, Faraday N, et al. Cardiac troponin I predicts short-term mortality in vascular surgery patients. Circulation 2002; 106:2366–2371.
- Landesberg G, Shatz V, Akopnik I, et al. Association of cardiac troponin, CK-MB, and postoperative myocardial ischemia with long-term survival after major vascular surgery. J Am Coll Cardiol 2003; 42:1547–1554.
- Devereaux PJ, Xavier D, Pogue J, et al. Characteristics and short-term prognosis of perioperative myocardial infarction in patients undergoing noncardiac surgery: a cohort study. Ann Intern Med 2011; 154:523–528.
- Devereaux PJ, Chan MT, Alonso-Coello P, et al. Association between postoperative troponin levels and 30-day mortality among patients undergoing noncardiac surgery. JAMA 2012; 307:2295–2304.
- Kumar A, Cannon CP. Acute coronary syndromes: diagnosis and management, part I. Mayo Clin Proc 2009; 84:917–938.
- Thygesen K, Alpert JS, Jaffe AS, et al. Third universal definition of myocardial infarction. Circulation 2012; 126:2020–2035.
- Apple FS, Quist HE, Doyle PJ, Otto AP, Murakami MM. Plasma 99th percentile reference limits for cardiac troponin and creatine kinase MB mass for use with European Society of Cardiology/American College of Cardiology consensus recommendations. Clin Chem 2003; 49:1331–1336.
- Ottani F, Galvani M, Nicolini FA, et al. Elevated cardiac troponin levels predict the risk of adverse outcome in patients with acute coronary syndromes. Am Heart J 2000; 140:917–927.
- Ohman EM, Armstrong PW, White HD, et al. Risk stratification with a point-of-care cardiac troponin T test in acute myocardial infarction. GUSTO III investigators. Global Use of Strategies to Open Occluded Coronary Arteries. Am J Cardiol 1999; 84:1281–1286.
- deFilippi CR, Tocchi M, Parmar RJ, et al. Cardiac troponin T in chest pain unit patients without ischemic electrocardiographic changes: angiographic correlates and long-term clinical outcomes. J Am Coll Cardiol 2000; 35:1827–1834.
- Heidenreich PA, Alloggiamento T, Melsop K, McDonald KM, Go AS, Hlatky MA. The prognostic value of troponin in patients with non-ST elevation acute coronary syndromes: a meta-analysis. J Am Coll Cardiol 2001; 38:478–485.
- Steen H, Giannitsis E, Futterer S, Merten C, Juenger C, Katus HA. Cardiac troponin T at 96 hours after acute myocardial infarction correlates with infarct size and cardiac function. J Am Coll Cardiol 2006; 48:2192–2194.
- Licka M, Zimmermann R, Zehelein J, Dengler TJ, Katus HA, Kubler W. Troponin T concentrations 72 hours after myocardial infarction as a serological estimate of infarct size. Heart 2002; 87:520–524.
- Vasile VC, Babuin L, Giannitsis E, Katus HA, Jaffe AS. Relationship of MRI-determined infarct size and cTnI measurements in patients with ST-elevation myocardial infarction. Clin Chem 2008; 54:617–619.
- Sabatine MS, Morrow DA, de Lemos JA, Jarolim P, Braunwald E. Detection of acute changes in circulating troponin in the setting of transient stress test-induced myocardial ischaemia using an ultrasensitive assay: results from TIMI 35. Eur Heart J 2009; 30:162–169.
- Siriwardena M, Campbell V, Richards AM, Pemberton CJ. Cardiac biomarker responses to dobutamine stress echocardiography in healthy volunteers and patients with coronary artery disease. Clin Chem 2012; 58:1492–1494.
- Turer AT, Addo TA, Martin JL, et al. Myocardial ischemia induced by rapid atrial pacing causes troponin T release detectable by a highly sensitive assay: insights from a coronary sinus sampling study. J Am Coll Cardiol 2011; 57:2398–2405.
- Cohen MC, Aretz TH. Histological analysis of coronary artery lesions in fatal postoperative myocardial infarction. Cardiovasc Pathol 1999; 8:133–139.
- Gualandro DM, Campos CA, Calderaro D, et al. Coronary plaque rupture in patients with myocardial infarction after noncardiac surgery: frequent and dangerous. Atherosclerosis 2012; 222:191–195.
- Sametz W, Metzler H, Gries M, et al. Perioperative catecholamine changes in cardiac risk patients. Eur J Clin Invest 1999; 29:582–587.
- Frank SM, Higgins MS, Breslow MJ, et al. The catecholamine, cortisol, and hemodynamic responses to mild perioperative hypothermia. A randomized clinical trial. Anesthesiology 1995; 82:83–93.
- Rosenfeld BA, Faraday N, Campbell D, et al. Perioperative platelet reactivity and the effects of clonidine. Anesthesiology 1993; 79:255–261.
- Lison S, Weiss G, Spannagl M, Heindl B. Postoperative changes in procoagulant factors after major surgery. Blood Coagul Fibrinolysis 2011; 22:190–196.
- Fukumoto Y, Hiro T, Fujii T, et al. Localized elevation of shear stress is related to coronary plaque rupture: a 3-dimensional intravascular ultrasound study with in-vivo color mapping of shear stress distribution. J Am Coll Cardiol 2008; 51:645–650.
- Feringa HH, Bax JJ, Boersma E, et al. High-dose beta-blockers and tight heart rate control reduce myocardial ischemia and troponin T release in vascular surgery patients. Circulation 2006; 114:I-344–I-349.
- Landesberg G. The pathophysiology of perioperative myocardial infarction: facts and perspectives. J Cardiothorac Vasc Anesth 2003; 17:90–100.
- Nelson AH, Fleisher LA, Rosenbaum SH. Relationship between postoperative anemia and cardiac morbidity in high-risk vascular patients in the intensive care unit. Crit Care Med 1993; 21:860–866.
- Landesberg G, Beattie WS, Mosseri M, Jaffe AS, Alpert JS. Perioperative myocardial infarction. Circulation 2009; 119:2936–2944.
- Ellis SG, Hertzer NR, Young JR, Brener S. Angiographic correlates of cardiac death and myocardial infarction complicating major nonthoracic vascular surgery. Am J Cardiol 1996; 77:1126–1128.
- Levy M, Heels-Ansdell D, Hiralal R, et al. Prognostic value of troponin and creatine kinase muscle and brain isoenzyme measurement after noncardiac surgery: a systematic review and meta-analysis. Anesthesiology 2011; 114:796–806.
- Garcia S, Marston N, Sandoval Y, et al. Prognostic value of 12-lead electrocardiogram and peak troponin I level after vascular surgery. J Vasc Surg 2013; 57:166–172.
- Fleisher LA, Fleischmann KE, Auerbach AD, et al. 2014 ACC/AHA guideline on perioperative cardiovascular evaluation and management of patients undergoing noncardiac surgery: a report of the American College of Cardiology/American Heart Association task force on practice guidelines. J Am Coll Cardiol 2014; 64:e77–e137.
- Foucrier A, Rodseth R, Aissaoui M, et al. The long-term impact of early cardiovascular therapy intensification for postoperative troponin elevation after major vascular surgery. Anesth Analg 2014; 119:1053–1063.
More than 200 million patients undergo noncardiac surgery each year, and the volume is increasing.1 Cardiovascular complications are a major cause of morbidity and mortality in the perioperative period.
Before the advent of modern cardiac biomarkers, an estimated 2% to 3% of all patients undergoing noncardiac surgery had a major adverse cardiac event.2 However, more recent studies suggest that 5% to 25% of patients have troponin elevations after noncardiac surgery, depending on the patient population,3–6 and many are asymptomatic, suggesting that many patients are sustaining undetected myocardial injury. Those who suffer a myocardial infarction or myocardial injury have elevated morbidity and mortality rates, not only perioperatively, but also at 30 days and even at up to 1 year.3–5,7–11
Yet there are almost no data on how best to manage these patients; the available guidelines, therefore, do not provide sufficient recommendations for clinical practice.
To address the lack of guidelines, we examine the incidence and proposed mechanisms of myocardial injury after noncardiac surgery, suggest an approach to identifying patients at risk, recommend treatment strategies, and consider future directions.
CARDIAC BIOMARKERS
When cardiac cellular injury from ischemia, direct trauma, or other cause disrupts the cell membrane, intracellular contents enter the extracellular space, including the blood stream. If the myocyte damage is extensive enough, biochemical assays can detect these substances.
Troponin, creatine kinase, myoglobin, and lactate dehydrogenase are common biomarkers of necrosis that, when detected in the plasma, may indicate cardiac injury. Each can be detected at varying times after cardiac injury (Figure 1).12
Cardiac troponins I and T
Of the biomarkers, cardiac troponin I and cardiac troponin T are now the most widely used and are the most specific for myocyte injury.
Troponins are proteins that regulate the calcium-induced interaction between myosin and actin that results in muscle contraction. Troponin is a complex consisting of three subunits: troponin C, troponin I, and troponin T. The cardiac troponin I and T isoforms are distinct from those found in skeletal muscle, making them specific for myocyte injury, and they are currently the recommended markers for diagnosing acute myocardial infarction.13
The troponin immunoassays currently available are not standardized among laboratories and point-of-care methods, and thus, levels cannot be compared across testing centers.14 Each assay has unique performance characteristics, but guidelines recommend using the 99th percentile value from a normal reference population for a given assay to define whether myocardial injury is present.13
Troponin elevation has prognostic value in patients presenting with acute coronary syndromes,15–18 and the degree of elevation correlates with infarct size.19–21
Controversy exists as to whether troponin and other biomarkers are released only after myocardial necrosis or after reversible injury as well. Using newer, highly sensitive assays, troponin elevations have been detected after short periods of ischemia during stress testing22,23 and in patients with stable angina,24 suggesting that reversible cardiac stress and injury can lead to troponin release. This mechanism may play an important role during the myocardial injury that can occur in patients undergoing noncardiac surgery.
MYOCARDIAL INFARCTION vs MYOCARDIAL INJURY
In 2000, the Joint Task Force of the European Society of Cardiology, American College of Cardiology Foundation, American Heart Association, and World Heart Federation revised the criteria for the diagnosis of myocardial infarction created by the World Health Organization in 1979. The definition was revised again in 2007 and once more in 2012 to create the third universal definition of myocardial infarction.
Acute myocardial infarction
Acute myocardial infarction is defined as evidence of myocardial necrosis in a setting of myocardial ischemia, not related to causes such as trauma or pulmonary embolism, with a rise or a fall (or a rise and a fall) of cardiac biomarkers (at least one value being above the 99th percentile in the reference population) and any of the following:
- Symptoms of ischemia
- New ST-segment changes or new left bundle branch block
- Pathologic Q waves
- Imaging evidence of new loss of viable myocardium or new regional wall-motion abnormality
- Intracoronary thrombus by angiography or autopsy.13
Myocardial injury after noncardiac surgery
Studies10,11 have shown that many patients undergoing noncardiac surgery have evidence of cardiac biomarker release but do not meet the universal definition of myocardial infarction.
The Perioperative Ischemic Evaluation (POISE) trial10 reported that 415 (5%) of its patients met the definition of myocardial infarction, of whom only about 35% had symptoms of ischemia. Another 697 patients (8.3%) had isolated elevations in biomarkers without meeting the definition of myocardial infarction.
The VISION study11 (Vascular Events in Noncardiac Surgery Patients Cohort Evaluation) prospectively screened more than 15,000 patients in several countries for troponin elevation during the first 3 postoperative days and for ischemic symptoms and features. Of the patients screened, approximately 1,200 (8%) had troponin elevations, with fewer than half fulfilling the criteria for myocardial infarction.
In another study, van Waes et al6 prospectively screened 2,232 patients ages 60 and older undergoing intermediate- to high-risk noncardiac surgery. Troponin levels were elevated in 19% of the patients, but only 10 of these patients met the universal definition of myocardial infarction.
In all of these studies, patients with isolated elevation in myocardial biomarkers had worse short-term and long-term outcomes than those without. These observations led to a proposed definition of “myocardial injury after noncardiac surgery” that is broader than that of myocardial infarction and requires only elevation of cardiac biomarkers judged to be due to myocardial ischemia (ie, not from another obvious cause such as pulmonary embolism or myocarditis).3
FIVE TYPES OF MYOCARDIAL INFARCTION
The Joint Task Force13 categorizes myocardial infarction into five distinct types:
- Type 1—due to plaque rupture
- Type 2—due to imbalance between oxygen supply and demand
- Type 3—sudden cardiac death
- Type 4a—associated with percutaneous coronary intervention
- Type 4b—associated with stent thrombosis
- Type 5—associated with coronary artery bypass surgery.
Types 1 and 2 have both been implicated in perioperative myocardial infarction and injury. Patient characteristics and the physiologic response to surgical and anesthetic stressors likely contribute to the development of myocardial infarction and injury after noncardiac surgery.
Plaque rupture as a cause of postoperative myocardial infarction
The mechanism of type 1 myocardial infarction—plaque rupture or erosion leading to thrombosis and infarction—plays a significant role in most cases of acute coronary syndromes. Its role in perioperative and postoperative myocardial infarction or injury, however, is less clear.
In an autopsy study of 26 patients who died of myocardial infarction after noncardiac surgery, plaque rupture was evident in 12 (46%).25 A prospective angiographic study of 120 patients with acute coronary syndromes after noncardiac surgery found that nearly 50% had evidence of plaque rupture.26
Higher levels of catecholamines, cortisol,27,28 platelet reactivity,29 procoagulant factors,30 and coronary artery shear stress31 are all present in the postoperative period and may contribute to an increased propensity for plaque rupture or erosion. Whether plaque rupture is present in patients who have isolated troponin elevation but do not meet the criteria for myocardial infarction has not been investigated.
Oxygen supply-demand imbalance during and after surgery
Oxygen supply-demand imbalance (the mechanism in type 2 myocardial infarction) leading to myocyte stress, ischemia, and subsequent infarction is likely common in the perioperative and postoperative periods. As previously discussed, this imbalance may be present with or without symptoms.
Oxygen demand may increase in this period as a result of tachycardia32 caused by bleeding, pain, and catecholamines or increased wall stress from hypertension due to vasoconstriction or pain.33 Oxygen supply can be decreased secondary to tachycardia, anemia,34 hypotension, hypoxemia, hypercarbia, intravascular fluid shifts (bleeding or volume overload), or coronary vasoconstriction.33,35
These mechanisms of myocardial injury, infarction, or both can occur with or without underlying significant obstructive coronary artery disease. However, severe coronary artery disease is more common in those who have had a perioperative myocardial infarction.36
POSTOPERATIVE TROPONIN ELEVATION CARRIES A WORSE PROGNOSIS
Patients who suffer a myocardial infarction after noncardiac surgery have worse short- and long-term outcomes than their counterparts.4,5,7, 8,10,33 In the POISE trial,10 the 30-day mortality rate was 11.6% in those who had had a perioperative myocardial infarction, compared with 2.2% in those who did not (P < .001). The patients who had had a myocardial infarction were also more likely to have nonfatal cardiac arrest, coronary revascularization, and congestive heart failure.
Myocardial injury not fulfilling the criteria for myocardial infarction after noncardiac surgery is also associated with worse short-term and long-term outcomes.3,6,10,11,37,38 POISE patients with isolated elevations in cardiac biomarkers had a higher 30-day risk of coronary revascularization and nonfatal arrest.10 In the VISION trial, an elevation in troponin was the strongest predictor of death within 30 days after noncardiac surgery. This analysis also showed that the higher the peak troponin value, the greater the risk of death and the shorter the median time until death.11
A meta-analysis of 14 studies in 3,139 patients found that elevated troponin after noncardiac surgery was an independent predictor of death within 1 year (odds ratio [OR] 6.7, 95% confidence interval [CI] 4.1–10.9) and beyond 1 year (OR 1.8, 95% CI 1.4–2.3).37
SHOULD SCREENING BE ROUTINE AFTER NONCARDIAC SURGERY?
Since patients suffering myocardial infarction or injury after noncardiac surgery have a worse prognosis, many experts advocate routinely screening all high-risk patients and those undergoing moderate- to high-risk surgery. Many tools exist to determine which patients undergoing noncardiac surgery are at high risk of cardiac complications.
The revised Goldman Cardiac Risk Index is commonly used and well validated. Variables in this index that predict major cardiac complications are:
- High-risk surgery (vascular surgery, orthopedic surgery, and intraperitoneal or intrathoracic surgery)
- History of ischemic heart disease
- History of congestive heart failure
- History of cerebrovascular disease
- Diabetes requiring insulin therapy
- Chronic kidney disease with a creatinine > 2.0 mg/dL.
The more of these variables that are present, the higher the risk of perioperative cardiac events2,4:
- No risk factors: 0.4% risk (95% CI 0.1–0.8)
- One risk factor: 1.0% risk (95% CI 0.5–1.4)
- Two risk factors: 2.4% risk (95% CI 1.3–3.5)
- Three or more risk factors: 5.4% risk (95% CI 2.7–7.9).
Current guidelines from the American College of Cardiology and the American Heart Association give a class I recommendation (the highest) for measuring troponin levels after noncardiac surgery in patients who have symptoms or signs suggesting myocardial ischemia. They give a class IIb recommendation (usefulness is less well established) for screening those at high risk but without symptoms or signs of ischemia, despite the previously cited evidence that patients with troponin elevation are at increased risk. The IIb recommendation is due to a lack of validated treatment strategies to modify and attenuate the recognized risk with troponin elevation in this setting.39
LITTLE EVIDENCE TO GUIDE TREATMENT
In current practice, internists and cardiologists are often asked to consult on patients with troponin elevations noted after noncardiac surgery. Although published and ongoing studies examine strategies to prevent cardiovascular events during noncardiac surgery, we lack data on managing the cases of myocardial infarction and injury that actually occur after noncardiac surgery.
When managing a patient who has a troponin elevation after surgery, many clinical factors must be weighed, including hemodynamic and clinical stability and risk of bleeding. Confronted with ST-segment elevation myocardial infarction or high-risk non–ST-segment elevation myocardial infarction, most clinicians would favor an early invasive reperfusion strategy in accordance with guidelines on managing acute coronary syndrome. Fibrinolytic drugs for ST-segment elevation myocardial infarction are likely to be contraindicated in the postoperative period because they pose an unacceptable risk of bleeding.
Guideline-directed medical therapies for those suffering perioperative myocardial infarction may lower the risk of future cardiovascular events, as suggested by a retrospective study of 66 patients diagnosed with perioperative myocardial infarction after vascular surgery.40 Those in whom medical therapy for coronary artery disease was not intensified—defined as adding or increasing the dose of antiplatelet agent, statin, beta-blocker, or angiotensin-converting enzyme inhibitor—had higher rates of cardiovascular events at 12 months (hazard ratio [HR] 2.80, 95% CI 1.05–24.2).40
In those with asymptomatic myocardial infarction or isolated elevation in cardiac biomarkers, no treatment strategies have been assessed prospectively or in randomized trials. However, statins and aspirin have been suggested as providing some benefit. In a substudy of the POISE trial, the use of aspirin was associated with a 46% reduction in the 30-day mortality rate in those suffering a perioperative myocardial infarction, and statins were associated with a 76% reduction.10 In a single-center retrospective analysis of 337 patients undergoing moderate- to high-risk vascular surgery, statin therapy was associated with a lower 1-year mortality rate (OR 0.63, 95% CI 0.40–0.98).38
We propose a treatment algorithm for patients identified as having cardiovascular events after noncardiac surgery (Figure 2), based on current evidence and guidelines. Ultimately, treatment decisions should be tailored to the individual patient. Discussion of the risks and benefits of therapeutic options should include the patient and surgeon.
Ongoing and future trials
Ongoing and future trials are aimed at addressing definitive treatment strategies in this patient population.
The MANAGE trial (Management of Myocardial Injury After Non-cardiac Surgery Trial) is randomizing patients suffering myocardial injury after noncardiac surgery to receive either dabigatran and omeprazole or placebo to assess the efficacy of these agents in preventing major adverse cardiac events and the safety of anticoagulation (ClinicalTrials.gov Identifier: NCT01661101).
The INTREPID trial (Study of Ticagrelor Versus Aspirin Treatment in Patients With Myocardial Injury Post Major Non-Cardiac Surgery) will assess the efficacy and safety of ticagrelor treatment compared with aspirin in a similar population (ClinicalTrial.gov Identifier: NCT02291419). The trial will enroll approximately 1,000 patients identified as having a postoperative troponin elevation more than two times the upper limit of normal of the assay during the index hospitalization (Figure 3). Enrollment was to have begun in mid-2015.
- Weiser TG, Regenbogen SE, Thompson KD, et al. An estimation of the global volume of surgery: a modelling strategy based on available data. Lancet 2008; 372:139–144.
- Lee TH, Marcantonio ER, Mangione CM, et al. Derivation and prospective validation of a simple index for prediction of cardiac risk of major noncardiac surgery. Circulation 1999; 100:1043–1049.
- Botto F, Alonso-Coello P, Chan MT, et al. Myocardial injury after noncardiac surgery: a large, international, prospective cohort study establishing diagnostic criteria, characteristics, predictors, and 30-day outcomes. Anesthesiology 2014; 120:564–578.
- Devereaux PJ, Goldman L, Cook DJ, Gilbert K, Leslie K, Guyatt GH. Perioperative cardiac events in patients undergoing noncardiac surgery: a review of the magnitude of the problem, the pathophysiology of the events and methods to estimate and communicate risk. CMAJ 2005; 173:627–634.
- McFalls EO, Ward HB, Moritz TE, et al. Predictors and outcomes of a perioperative myocardial infarction following elective vascular surgery in patients with documented coronary artery disease: results of the CARP trial. Eur Heart J 2008; 29:394–401.
- van Waes JA, Nathoe HM, de Graaff JC, et al. Myocardial injury after noncardiac surgery and its association with short-term mortality. Circulation 2013; 127:2264–2271.
- Badner NH, Knill RL, Brown JE, Novick TV, Gelb AW. Myocardial infarction after noncardiac surgery. Anesthesiology 1998; 88:572–578.
- Kim LJ, Martinez EA, Faraday N, et al. Cardiac troponin I predicts short-term mortality in vascular surgery patients. Circulation 2002; 106:2366–2371.
- Landesberg G, Shatz V, Akopnik I, et al. Association of cardiac troponin, CK-MB, and postoperative myocardial ischemia with long-term survival after major vascular surgery. J Am Coll Cardiol 2003; 42:1547–1554.
- Devereaux PJ, Xavier D, Pogue J, et al. Characteristics and short-term prognosis of perioperative myocardial infarction in patients undergoing noncardiac surgery: a cohort study. Ann Intern Med 2011; 154:523–528.
- Devereaux PJ, Chan MT, Alonso-Coello P, et al. Association between postoperative troponin levels and 30-day mortality among patients undergoing noncardiac surgery. JAMA 2012; 307:2295–2304.
- Kumar A, Cannon CP. Acute coronary syndromes: diagnosis and management, part I. Mayo Clin Proc 2009; 84:917–938.
- Thygesen K, Alpert JS, Jaffe AS, et al. Third universal definition of myocardial infarction. Circulation 2012; 126:2020–2035.
- Apple FS, Quist HE, Doyle PJ, Otto AP, Murakami MM. Plasma 99th percentile reference limits for cardiac troponin and creatine kinase MB mass for use with European Society of Cardiology/American College of Cardiology consensus recommendations. Clin Chem 2003; 49:1331–1336.
- Ottani F, Galvani M, Nicolini FA, et al. Elevated cardiac troponin levels predict the risk of adverse outcome in patients with acute coronary syndromes. Am Heart J 2000; 140:917–927.
- Ohman EM, Armstrong PW, White HD, et al. Risk stratification with a point-of-care cardiac troponin T test in acute myocardial infarction. GUSTO III investigators. Global Use of Strategies to Open Occluded Coronary Arteries. Am J Cardiol 1999; 84:1281–1286.
- deFilippi CR, Tocchi M, Parmar RJ, et al. Cardiac troponin T in chest pain unit patients without ischemic electrocardiographic changes: angiographic correlates and long-term clinical outcomes. J Am Coll Cardiol 2000; 35:1827–1834.
- Heidenreich PA, Alloggiamento T, Melsop K, McDonald KM, Go AS, Hlatky MA. The prognostic value of troponin in patients with non-ST elevation acute coronary syndromes: a meta-analysis. J Am Coll Cardiol 2001; 38:478–485.
- Steen H, Giannitsis E, Futterer S, Merten C, Juenger C, Katus HA. Cardiac troponin T at 96 hours after acute myocardial infarction correlates with infarct size and cardiac function. J Am Coll Cardiol 2006; 48:2192–2194.
- Licka M, Zimmermann R, Zehelein J, Dengler TJ, Katus HA, Kubler W. Troponin T concentrations 72 hours after myocardial infarction as a serological estimate of infarct size. Heart 2002; 87:520–524.
- Vasile VC, Babuin L, Giannitsis E, Katus HA, Jaffe AS. Relationship of MRI-determined infarct size and cTnI measurements in patients with ST-elevation myocardial infarction. Clin Chem 2008; 54:617–619.
- Sabatine MS, Morrow DA, de Lemos JA, Jarolim P, Braunwald E. Detection of acute changes in circulating troponin in the setting of transient stress test-induced myocardial ischaemia using an ultrasensitive assay: results from TIMI 35. Eur Heart J 2009; 30:162–169.
- Siriwardena M, Campbell V, Richards AM, Pemberton CJ. Cardiac biomarker responses to dobutamine stress echocardiography in healthy volunteers and patients with coronary artery disease. Clin Chem 2012; 58:1492–1494.
- Turer AT, Addo TA, Martin JL, et al. Myocardial ischemia induced by rapid atrial pacing causes troponin T release detectable by a highly sensitive assay: insights from a coronary sinus sampling study. J Am Coll Cardiol 2011; 57:2398–2405.
- Cohen MC, Aretz TH. Histological analysis of coronary artery lesions in fatal postoperative myocardial infarction. Cardiovasc Pathol 1999; 8:133–139.
- Gualandro DM, Campos CA, Calderaro D, et al. Coronary plaque rupture in patients with myocardial infarction after noncardiac surgery: frequent and dangerous. Atherosclerosis 2012; 222:191–195.
- Sametz W, Metzler H, Gries M, et al. Perioperative catecholamine changes in cardiac risk patients. Eur J Clin Invest 1999; 29:582–587.
- Frank SM, Higgins MS, Breslow MJ, et al. The catecholamine, cortisol, and hemodynamic responses to mild perioperative hypothermia. A randomized clinical trial. Anesthesiology 1995; 82:83–93.
- Rosenfeld BA, Faraday N, Campbell D, et al. Perioperative platelet reactivity and the effects of clonidine. Anesthesiology 1993; 79:255–261.
- Lison S, Weiss G, Spannagl M, Heindl B. Postoperative changes in procoagulant factors after major surgery. Blood Coagul Fibrinolysis 2011; 22:190–196.
- Fukumoto Y, Hiro T, Fujii T, et al. Localized elevation of shear stress is related to coronary plaque rupture: a 3-dimensional intravascular ultrasound study with in-vivo color mapping of shear stress distribution. J Am Coll Cardiol 2008; 51:645–650.
- Feringa HH, Bax JJ, Boersma E, et al. High-dose beta-blockers and tight heart rate control reduce myocardial ischemia and troponin T release in vascular surgery patients. Circulation 2006; 114:I-344–I-349.
- Landesberg G. The pathophysiology of perioperative myocardial infarction: facts and perspectives. J Cardiothorac Vasc Anesth 2003; 17:90–100.
- Nelson AH, Fleisher LA, Rosenbaum SH. Relationship between postoperative anemia and cardiac morbidity in high-risk vascular patients in the intensive care unit. Crit Care Med 1993; 21:860–866.
- Landesberg G, Beattie WS, Mosseri M, Jaffe AS, Alpert JS. Perioperative myocardial infarction. Circulation 2009; 119:2936–2944.
- Ellis SG, Hertzer NR, Young JR, Brener S. Angiographic correlates of cardiac death and myocardial infarction complicating major nonthoracic vascular surgery. Am J Cardiol 1996; 77:1126–1128.
- Levy M, Heels-Ansdell D, Hiralal R, et al. Prognostic value of troponin and creatine kinase muscle and brain isoenzyme measurement after noncardiac surgery: a systematic review and meta-analysis. Anesthesiology 2011; 114:796–806.
- Garcia S, Marston N, Sandoval Y, et al. Prognostic value of 12-lead electrocardiogram and peak troponin I level after vascular surgery. J Vasc Surg 2013; 57:166–172.
- Fleisher LA, Fleischmann KE, Auerbach AD, et al. 2014 ACC/AHA guideline on perioperative cardiovascular evaluation and management of patients undergoing noncardiac surgery: a report of the American College of Cardiology/American Heart Association task force on practice guidelines. J Am Coll Cardiol 2014; 64:e77–e137.
- Foucrier A, Rodseth R, Aissaoui M, et al. The long-term impact of early cardiovascular therapy intensification for postoperative troponin elevation after major vascular surgery. Anesth Analg 2014; 119:1053–1063.
KEY POINTS
- Cardiovascular events are a major cause of morbidity and mortality in patients undergoing noncardiac surgery and occur frequently, especially in high-risk patients.
- Myocardial injury or infarction after noncardiac surgery heightens the short- and long-term risk of mortality and major adverse cardiac events.
- The dominant mechanism of myocardial injury after noncardiac surgery remains uncertain.
- In the absence of therapies proven to affect the outcome, the benefit of screening to identify these patients remains uncertain.
- Clinical trials are under way to help clinicians provide optimal care to this at-risk population.
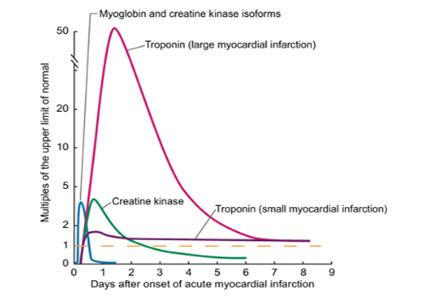
Comprehensive wound malodor management: Win the RACE
Wounds that fail to heal become more than mere skin lesions. Pain, malodor, and the accompanying psychological distress often complicate nonhealing wounds and impair quality of life.1 Management of malodor requires perseverance, sensitivity, and familiarity with tools and procedures that range from surgical debridement to medical-grade honey.
Chronic, nonhealing wounds are defined as persisting for more than 6 months.2 These lesions are incapable of undergoing anatomic and functional repair on their own. Commonly encountered nonhealing wounds include pressure ulcers, venous stasis ulcers, arterial insufficiency ulcers, and malignant cutaneous wounds.
Typically, the patient with a nonhealing wound is frail, debilitated, medically complex, and often faced with one or more life-limiting illnesses. Complete wound healing may therefore be unrealistic, and optimal wound management becomes the goal of care.3,4
Healthcare providers encounter nonhealing wounds in varied settings—acute inpatient, outpatient, long-term, and home care. For instance, in the home care setting, a study of 383 patients enrolled in hospice found that 35% had skin ulcers and wounds.3 Half of those affected had pressure ulcers, 20% had ischemic ulcers, and 30% had other skin disorders such as stasis ulcers, burns, skin tears, and tumors. A larger study, also in hospice patients, found that 26% had pressure ulcers and 10% more developed them within 6 months.5
While pressure ulcers are the most common nonhealing wounds, malignant or fungating wounds are found in 5% to 10% of patients with metastatic disease, usually with cancers of the breast, head, and neck.6
Maximizing wound care provides comfort, relieves suffering, and promotes quality of life.3,7 To achieve these goals, clinicians must be familiar with strategies to manage complications associated with nonhealing wounds such as pain, malodor, and psychosocial adverse effects. Of these complications, malodor has been pointed out by both patients and caregivers as the most distressing.8
This article focuses on wound malodor, discusses the processes that cause wounds to emit an offensive smell, and outlines a comprehensive management approach.
MRS. A., AGE 61, WITH STAGE IV BREAST CANCER
Mrs. A., 61 years old, had a fungating mass in her left breast, which began as a small nodule and progressively enlarged to deform her breast over several months. Her oncologist subsequently staged the extent of her cancer as stage IV after workup revealed lung metastasis. Mrs. A. and her family decided to forgo cancer treatment, including radiotherapy, and to transition to hospice care after discussions with the oncologist.
Mrs. A. lived at home with her husband. Her daughter and three grandchildren all lived nearby.
When her hospice physician arrived at her home to meet her, a strong, pungent, and nauseating smell greeted him as he entered her bedroom. The patient said that for the past few months she had been increasingly distressed by the revolting odor. She rarely left home and had been ashamed to have people visit her, including her family.
On examination, the physician noticed a large fungating mass with yellowish discharge and necrotic tissue in her left breast. In addition to mild pain, she was immensely bothered by the strong odor coming from her breast.
THE IMPACT OF MALODOR
As seen in the case of Mrs. A., malodor has grave effects, both physical and psychological. Patients experience impaired or socially unacceptable body image, social rejection, personal shame, and embarrassment.9,10 Feelings of fear, anxiety, and depression are common. If left uncontrolled, malodor results in social isolation, reluctance to engage in social activities, diminished appetite, and nausea. In addition, malodor is a constant reminder of patients’ pain and cancer, and it results in further suffering.11
Reactions of family members and caregivers can worsen the situation.9,12 Expressions of revulsion limit contact and inhibit intimacy, especially near the end of life. Caregivers are often frustrated and distressed over their inability to control the malodor. The environment becomes uninhabitable, and the malodor can permeate clothing, furniture, and living quarters.
Managing malodor can be emotionally draining, physically daunting, and frustrating for healthcare professionals, as several methods are usually employed, often in a trial-and-error approach, to achieve an acceptable degree of odor control. In addition, clinicians must face the challenge of treating malodorous wounds at very close distance without reacting in a way that offends or alarms patients and family members.13
MALODOR PRODUCTION: WHERE IS THAT SMELL COMING FROM?
All wounds can produce an odor.14 Wounds that are expected to heal typically emit a faint but not unpleasant odor, akin to fresh blood. Wounds colonized by Pseudomonas aeruginosa produce a fruity or grapelike odor that is tolerable. Malodor occurs with wounds infected by other gram-negative organisms or anaerobic bacteria.15 Similarly, wounds covered by necrotic tissue smell like decaying flesh.
Three major causes
The three major causes of wound malodor are slough, infection, and exudate (Figure 1).
Slough is dead or necrotic tissue, usually resulting from vascular compromise. Arterial ulcers, pressure ulcers, and malignant wounds all form slough from capillary occlusion, subsequent ischemia, and tissue necrosis.
Infection. Devitalized tissue, an ideal medium in which bacteria thrive, becomes the source of infection. Anaerobic bacteria are usually implicated in malodor. These include Bacteroides fragilis, Bacteroides prevotella, Clostridium perfringens, and Fusobacterium nucleatum.16,17 Anaerobic organisms produce putrescine and cadaverine, which are largely responsible for the offensive odor.16,18 Volatile fatty acids such as propionic, butyric, isovaleric, and valeric acid are formed from lipid catabolism by anaerobes and add to malodor.17 Aerobic bacteria such as Proteus, Klebsiella, and Pseudomonas species supercolonize necrotic tissue as well and contribute to malodor.17,18
Exudate. Since nonhealing wounds undergo repeated cycles of inflammation, infection, and necrosis, accumulation of exudate becomes inevitable. Exudate typically is a pus-like fluid containing serum, fibrin, and white blood cells, which leak from blood vessels. In addition, bacteria that colonize chronic wounds filled with necrotic tissue activate proteases that degrade and liquefy dead tissue, thereby forming extensive amounts of exudate.19
Apart from slough, infection, and exudate, poor general hygiene and dressings left on for too long may contribute to malodor.16 Moisture-retentive dressings such as hydrocolloids leave an odor after removal. Dressings that liquefy upon contact with the wound surface leave a pus-like, potentially malodorous material.
MALODOR ASSESSMENT: DO YOU SMELL SOMETHING?
Various ways to document wound malodor can prove useful in guiding assessment and treatment. Descriptions such as “foul,” “putrid,” “fishy,” or “filled the room” vividly portray the initial presentation. A 10-point numerical scale similar to a numerical pain scale or a visual analogue scale can be used as a subjective measure.
Other grading methods, which to the authors’ knowledge are not validated, may be helpful. In a study that focused on patients suffering from malodorous gynecologic malignancies, von Gruenigen et al20 used a 0-to-3 scale:
- 0 Absent
- 1 Not offensive
- 2 Offensive but tolerable
- 3 Offensive and intolerable.
A scale often adapted by other authors was devised by Baker and Haig,21 which clearly defines four classes:
- 1 Strong—odor is evident upon entering the room (6 to 10 feet from the patient) with the dressing intact
- 2 Moderate—odor is evident upon entering the room with dressing removed
- 3 Slight—odor is evident at close proximity to the patient when the dressing is removed
- 4 No odor—no odor is evident, even at the patient’s bedside with the dressing removed.
COMPREHENSIVE MANAGEMENT: HOW DO WE WIN THE ‘RACE’?
The acronym RACE outlines an approach to dealing with malodor. It stands for removal of necrotic tissue; antibacterials; odor concealers; and education and support (Table 1).
Remove necrotic tissue
An important step in eliminating malodor is to remove necrotic tissue. This starts with debridement, which decreases the incidence of infection and hastens wound closure.22,23 Table 2 compares the different types of debridement.
Sharp or surgical debridement involves the use of a scalpel or scissors. This type of debridement may increase the risk of bleeding, pain, and malignant cell seeding in fungating wounds.4,24
Enzymatic debridement employs chemicals with proteolytic action (eg, collagenase) to digest extracellular proteins in wounds.18,25
Mechanical debridement involves aggressive therapies such as forceful irrigation and hydrotherapy, which may fail to discriminate between necrotic and viable tissues.18,26
Biological debridement using maggots, which ingest bacteria and devitalized tissue, may cause increased wound bleeding and may be unacceptable for patients and families.24,27
Autolytic debridement is often recommended, particularly if complete healing is not the primary goal.17,24,28,29 Autolysis uses proteolytic enzymes and phagocytic cells present in the wound bed and wound fluid to clear devitalized tissue. It is easy, inexpensive, noninvasive, and painless,4 and it requires less frequent dressing changes relative to standard dressing or wet-to-dry dressing.
Autolytic debridement is commonly accomplished using hydrocolloid and hydrogel dressings.15,29 Hydrocolloids are adhesive, occlusive, and conformable dressings that are suitable for wounds with low to moderate amounts of exudate. Upon contact with the wound surface, the dressing absorbs the exudate, forms a gel layer, and maintains a moist environment. Hydrocolloids are not recommended for infected wounds or for those with copious exudate as they may lead to maceration around the wound. A disadvantage of hydrocolloid dressings is their tendency to generate brown, often malodorous exudate when removed.
On the other hand, hydrogels in amorphous gel, dressing, sheet, or impregnated gauze form are water-based products that create a moist environment similar to hydrocolloids. Aside from causing minimal trauma to the wound bed when removed, the dressing’s cooling effect may bring some pain relief. Hydrogels are appropriate for dry wounds and for those with minimal exudate.
After debridement, the wound is cleansed and irrigated. A number of cleansers and solutions are available, but normal saline is a cheap alternative. To irrigate, experts recommend an 18- or 20-gauge intravenous catheter attached to a 30- or 60-mL syringe.15 This technique provides 8 to 15 psi of pressure, enough to cleanse the wound without causing tissue trauma.
Antibacterials and absorption
Antibacterials. Topical antibiotics have several advantages over systemic antibiotics in treating chronic wounds.30,31 These include a high and sustained concentration of the antimicrobial at the site of infection, limited potential for systemic absorption and toxicity, reduced potential for antibiotic resistance, and drawing of the patient’s and caregiver’s attention to the wound.
Metronidazole is the most widely used topical antibacterial for malodor management. Its efficacy is likely due to the predominant involvement of anaerobic bacteria in foul-smelling wounds. Topical metronidazole is available as a gel and as a cream. A systematic review showed that on average, topical metronidazole was used once daily for 14 consecutive days.19 The layer of topical metronidazole is typically covered with a nonadherent primary dressing followed by an absorbent secondary dressing.
The best clinical evidence for topical metronidazole consists of case reports and series.32–35 The largest of these studies was done by Finlay et al, who treated 47 patients with malodorous benign and malignant cutaneous wounds with 0.75% metronidazole gel daily.32 Forty-five (96%) of the patients reported significantly decreased odor by 14 days, as well as decreased pain, discharge, and surrounding cellulitis.
A randomized, placebo-controlled trial conducted by Bale et al had equivocal findings.9 All 41 patients who received metronidazole gel reported a decrease in malodor within 3 days of starting it. However, 76% of patients who received placebo also reported malodor control; in the final analysis, no significant difference was noted in the success rate between the two groups.
Metronidazole tablets can be crushed and sprinkled over the wound. As with metronidazole gel or cream, the crushed tablets are applied daily and covered by a primary nonadherent dressing and an absorbent secondary dressing. This off-label use of metronidazole serves as a cheaper alternative to commercially available topical preparations. To our knowledge, there has been no head-to-head trial comparing the two topical strategies.
Systemic metronidazole, often given orally, has been recommended if evidence of deep tissue or systemic infection is noted15 and in cases of fungating wounds with fistulas invading either the gastrointestinal or genitourinary tracts.18 Side effects such as nausea, neuropathy, and alcohol intolerance (ie, disulfiram reaction) may occur, which are not seen with topical metronidazole.
Both topical and systemic metronidazole can be used together on a time-limited basis for extensive malodorous wounds, such as fungating malignant wounds or stage IV sacral pressure ulcers.
Other antimicrobial agents used to treat malodor include silver-containing products, iodine-containing topical agents, mupirocin, bacitracin, neomycin, and polymyxin B.
Honey was used for wound care by the ancient Egyptians, and it is still used.36 Its beneficial effects include antimicrobial, debriding, deodorizing, anti-inflammatory, and granulation tissue-stimulating. Honey has even been shown to significantly decrease skin colonization with various kinds of bacteria, including methicillin-resistant Staphylococcus aureus.37 Medical-grade honey is preferred over table honey, as the latter is nonsterile and can contain Clostridium spores, which contaminate the wound.38
Yogurt and buttermilk lower the pH of the wound and control bacterial proliferation to control malodor.39,40 Either is applied for 10 to 15 minutes after the wound is cleansed and is then washed off thoroughly.
Absorbent dressings are used either over a layer of topical metronidazole and a nonadherent primary dressing or as a primary dressing itself. An absorbent dressing containing activated charcoal is used for rapid improvement, although cost may be prohibitive, especially in developing countries.13,19 Another type of absorbent dressing, composed of polyester impregnated with sodium chloride, has been found to be useful in malodor control.41 An important pointer is to maintain a tight seal around the absorbent dressing to prevent leakage of exudate.
Concealers
Aromatics used to conceal malodor include scented candles, incense, fragrant flowers and plants, and air-freshener sprays. When circumstances allow, candles are good options since they conceal malodor by emitting fragrance, and the flame burns off foul-smelling chemicals. Aromatics such as coffee beans, vanilla beans, and cider vinegar can be placed in a pan and left under the patient’s bed or close to it. Drops of peppermint oil or oil of wintergreen can be placed on wound dressings.
Other odor concealers are adsorbent materials that attract and cause ions and molecules to adhere to their surface. Examples are charcoal, baking soda, and cat litter. As with other aromatics, these materials are placed in pans and left under the bed or near the patient.
Aromatics can have disadvantages, as certain scents, especially strong ones, can be nauseating for patients. Some fragrances trigger asthma or skin irritation. Patients and caregivers can be left with an unpleasant association of certain fragrances with malodor by conditioning.15,17,18
Education and support
Concerns of the patient and family members need to be heard, addressed promptly, and reassessed with each visit, since uncontrolled malodor can be a chief source of caregiver fatigue.
Foremost in formulating a patient- and family-centered malodor management strategy is to commit to controlling malodor as much as possible. Regular follow-up appointments should be made, whether in the office or at home, to check on the patient’s progress and address new and ongoing concerns. Symptoms accompanying malodor, such as pain, bleeding, and sleep disturbance, need to be addressed, as they all affect quality of life.1 Audience-appropriate educational materials should be made available.26 Online resources that patients and families can explore include the websites of the Wound Ostomy and Continence Nurses Society (www.wocn.org) and the Association for the Advancement of Wound Care (aawconline.org).
Healthcare professionals need to be prepared to deal with problems and complications involving patients and family members that may arise in the course of treatment.12 Problems include the cost and local unavailability of dressing supplies, insurance coverage for dressings and topical agents, lack of assistance at home, and fear of changing dressings. A cardinal rule for healthcare providers is to avoid expressing distress at odors in front of or within hearing of patients and families.
OTHER STRATEGIES: WHAT ELSE CAN WE DO?
Curcumin, the main biologically active compound in the herb turmeric, applied directly to wounds three times daily as an ointment, has been shown to have odor-controlling properties.42
Sugar paste has been reported to control malodor by drawing out exudative and tissue fluid osmotically, and inhibiting bacterial growth.16,17 Water is mixed with sugar (ie, granulated, caster, or powdered) to form a paste, with additives like glycerin and polyethylene glycol used to alter the consistency. Thick clay-like paste is good for wounds with large cavities, while thin paste is useful for wounds with small or superficial openings. The paste is applied twice daily and is covered by an absorbent dressing.
Pressure relief is vital in managing pressure ulcers.18,43 Repositioning every 2 hours and using special devices, such as mattress overlays, alternating pressure mattresses, and low air loss mattresses, are frequently employed techniques.
If circumstances permit and when congruent with the patient’s goals of care, intra-arterial chemotherapy and radiotherapy can be contemplated for malignant fungating wounds.44,45
Other strategies include opening the windows during dressing changes, increasing the frequency of dressing changes, promptly removing used dressings from the house, and ensuring good general hygiene.
CASE RESOLUTION
After telling her that he was committed to control the malodor or, if possible, eliminate it, Mrs. A.’s doctor prepared two lists of materials—one for himself and one for Mrs. A.’s husband. He returned the next day, brought out his supplies, asked Mrs. A. to lie in bed, and invited her husband to assist him.
He cleansed and irrigated the breast lesion with normal saline, making sure to remove as much dead tissue as he could. He applied a layer of metronidazole cream to the wound cavity, then covered it with a nonadherent dressing. He then covered the wound with gauze, sealed the edges with medical adhesive tape, and applied a few drops of oil of wintergreen to the surface. A pan of charcoal briquettes was put under the bed, and a candle with Mrs. A.’s favorite scent was lit by the bedside. The physician then instructed Mrs. A.’s husband to repeat the procedure once daily for 1 week.
After 2 weeks, Mrs. A. and her husband said the foul odor had greatly decreased. She appeared more cheerful and energetic, especially after her grandchildren visited a few days earlier. The physician then instructed the husband to stop using metronidazole cream and to apply a hydrocolloid dressing every 3 days instead. He advised them to continue the rest of the process of applying a few drops of oil of wintergreen on the dressing surface, placing a pan of charcoal briquettes under the bed, and lighting a scented candle by the bedside.
FINISH THE RACE!
Complex nonhealing wounds are encountered across various healthcare settings. Wound malodor is an important component of nonhealing wounds, which adversely affects patients, families, and healthcare providers. Infection, slough, and exudate are the major causes of wound malodor. The essential steps to reduce malodor are to remove necrotic tissue, use antibacterial and odor-absorbing agents, apply appropriate odor “concealers,” educate families, and formulate a patient- and family-centered strategy (Table 1).
Acknowledgment: The authors would like to thank Sue Reif, CNP, for her assistance in completing the manuscript.
- Lo SF, Hayter M, Hu WY, Tai CY, Hsu MY, Li YF. Symptom burden and quality of life in patients with malignant fungating wounds. J Adv Nurs 2012; 68:1312–1321.
- Lazarus GS, Cooper DM, Knighton DR, et al. Definitions and guidelines for assessment of wounds and evaluation of healing. Arch Dermatol 1994; 130:489–493.
- Tippett AW. Wounds at the end of life. Wounds 2005; 17:91–98.
- Burt T. Palliative care of pressure ulcers in long-term care. Ann Long-Term Care 2013; 21:20–28.
- Reifsnyder J, Magee HS. Development of pressure ulcers in patients receiving home hospice care. Wounds 2005; 17:74–79.
- Haisfield-Wolfe ME, Rund C. Malignant cutaneous wounds: a management protocol. Ostomy Wound Manage 1997; 43:56–66.
- O’Brien C. Malignant wounds: managing odour. Can Fam Physician 2012; 58:272–274.
- Gethin G, Grocott P, Probst S, Clarke E. Current practice in the management of wound odour: an international survey. Int J Nurs Stud 2014; 51:865–874.
- Bale S, Tebble N, Price P. A topical metronidazole gel used to treat malodorous wounds. Br J Nurs 2004; 13:S4–S11.
- Hack A. Malodorous wounds—taking the patient’s perspective into account. J Wound Care 2003; 12:319–321.
- Price E. Wound care. The stigma of smell. Nurs Times 1996; 92:71–72.
- Paul JC, Pieper BA. Topical metronidazole for the treatment of wound odor: a review of the literature. Ostomy Wound Manage 2008; 54:18–27.
- Lee G, Anand SC, Rajendran S, Walker I. Overview of current practice and future trends in the evaluation of dressings for malodorous wounds. J Wound Care 2006; 15:344–346.
- Cutting K, Harding K. Criteria for identifying wound infection. J Wound Care 1994; 3:198–201.
- McDonald A, Lesage P. Palliative management of pressure ulcers and malignant wounds in patients with advanced illness. J Palliat Med 2006; 9:285–295.
- Holloway S. Recognising and treating the causes of chronic malodorous wounds. Prof Nurse 2004; 19:380–384.
- Haughton W, Young T. Common problems in wound care: malodorous wounds. Br J Nurs 1995; 4:959–963.
- Alvarez OM, Kalinski C, Nusbaum J, et al. Incorporating wound healing strategies to improve palliation (symptom management) in patients with chronic wounds. J Palliat Med 2007; 10:1161–1189.
- da Costa Santos CM, de Mattos Pimenta CA, Nobre MR. A systematic review of topical treatments to control the odor of malignant fungating wounds. J Pain Symptom Manage 2010; 39:1065–1076.
- Von Gruenigen VE, Coleman RL, et al. Bacteriology and treatment of malodorous lower reproductive tract in gynecologic cancer patients. Obstet Gynecol 2000; 96:23–27.
- Baker PG, Haig G. Metronidazole in the treatment of chronic pressure sores and ulcers: a comparison with standard treatment in general practice. Practitioner 1981; 225:569–573.
- Whitney J, Phillips L, Aslam R, et al. Guidelines for the treatment of pressure ulcers. Wound Repair Regen 2006; 14:663–679.
- Williams D, Enoch S, Miller D, Harris K, Price P, Harding KG. Effect of sharp debridement using curette on recalcitrant nonhealing venous ulcers: a concurrently controlled, prospective cohort study. Wound Repair Regen 2005; 13:131–137.
- Bergstrom KJ. Assessment and management of fungating wounds. J Wound Ostomy Continence Nurs 2011: 38:31–37.
- Sinclair RD, Ryan TJ. Proteolytic enzymes in wound healing: the role of enzymatic debridement. Australas J Dermatol 1994; 35:35–41.
- Enoch S, Harding KG. Wound bed preparation: the science behind the removal of barriers to healing. Wounds 2003;15:213–229.
- Mumcuoglu KY. Clinical applications for maggots in wound care. Am J Clin Dermatol 2001; 2:219–227.
- Langemo DK, Black J; National Pressure Ulcer Advisory Panel. Pressure ulcers in individuals receiving palliative care: a National Pressure Ulcer Advisory Panel white paper. Adv Skin Wound Care 2010; 23:59–72.
- Fonder MA, Lazarus GS, Cowan DA, Aronson-Cook B, Kohli AR, Mamelak AJ. Treating the chronic wound: a practical approach to the care of nonhealing wounds and wound care dressings. J Am Acad Dermatol 2008; 58:185–206.
- Lio PA, Kaye ET. Topical antibacterial agents. Infect Dis Clin North Am 2004; 18:717–733.
- Gelmetti C. Local antibiotics in dermatology. Dermatol Ther 2008; 21:187–195.
- Finlay IG, Bowszyc J, Ramlau C, Gwiezdzinski Z. The effect of topical 0.75% metronidazole gel on malodorous cutaneous ulcers. J Pain Symptom Manage 1996; 11:158–162.
- Bower M, Stein R, Evans TR, Hedley A, Pert P, Coombes RC. A double-blind study of the efficacy of metronidazole gel in the treatment of malodorous fungating tumours. Eur J Cancer 1992; 28A:888–889.
- Kalinski C, Schnepf M, Laboy D, et al. Effectiveness of a topical formulation containing metronidazole for wound odor and exudate control. Wounds 2005; 17:84–90.
- Kuge S, Tokuda Y, Ohta M, et al. Use of metronidazole gel to control malodor in advanced and recurrent breast cancer. Jpn J Clin Oncol 1996; 26:207–210.
- Belcher J. A review of medical-grade honey in wound care. Br J Nurs 2012: 21:S4–S9.
- Kwakman PH, Van den Akker JP, Güçlü A, et al. Medical-grade honey kills antibiotic-resistant bacteria in vitro and eradicates skin colonization. Clin Infect Dis 2008; 46:1677–1682.
- Cooper RA, Jenkins L. A comparison between medical grade honey and table honeys in relation to antimicrobial efficacy. Wounds 2009; 21:29–36.
- Patel B, Cox-Hayley D. Managing wound odor #218. J Palliat Med 2010; 13:1286–1287.
- Schulte MJ. Yogurt helps to control wound odor. Oncol Nurs Forum 1993; 20:1262.
- Upright CA, Salton C, Roberts F, Murphy J. Evaluation of Mesalt dressings and continuous wet saline dressings in ulcerating metastatic skin lesions. Cancer Nurs 1994; 17:149–155.
- Kuttan R, Sudheeran PC, Josph CD. Turmeric and curcumin as topical agents in cancer therapy. Tumori 1987; 73:29–31.
- Bass MJ, Phillips LG. Pressure sores. Curr Probl Surg 2007; 44:101–143.
- Bufill JA, Grace WR, Neff R. Intra-arterial chemotherapy for palliation of fungating breast cancer: a case report and review of the literature. Am J Clin Oncol 1994; 17:118–124.
- Murakami M, Kuroda Y, Sano A, et al. Validity of local treatment including intraarterial infusion chemotherapy and radiotherapy for fungating adenocarcinoma of the breast: case report of more than 8-year survival. Am J Clin Oncol 2001; 24:388–391.
Wounds that fail to heal become more than mere skin lesions. Pain, malodor, and the accompanying psychological distress often complicate nonhealing wounds and impair quality of life.1 Management of malodor requires perseverance, sensitivity, and familiarity with tools and procedures that range from surgical debridement to medical-grade honey.
Chronic, nonhealing wounds are defined as persisting for more than 6 months.2 These lesions are incapable of undergoing anatomic and functional repair on their own. Commonly encountered nonhealing wounds include pressure ulcers, venous stasis ulcers, arterial insufficiency ulcers, and malignant cutaneous wounds.
Typically, the patient with a nonhealing wound is frail, debilitated, medically complex, and often faced with one or more life-limiting illnesses. Complete wound healing may therefore be unrealistic, and optimal wound management becomes the goal of care.3,4
Healthcare providers encounter nonhealing wounds in varied settings—acute inpatient, outpatient, long-term, and home care. For instance, in the home care setting, a study of 383 patients enrolled in hospice found that 35% had skin ulcers and wounds.3 Half of those affected had pressure ulcers, 20% had ischemic ulcers, and 30% had other skin disorders such as stasis ulcers, burns, skin tears, and tumors. A larger study, also in hospice patients, found that 26% had pressure ulcers and 10% more developed them within 6 months.5
While pressure ulcers are the most common nonhealing wounds, malignant or fungating wounds are found in 5% to 10% of patients with metastatic disease, usually with cancers of the breast, head, and neck.6
Maximizing wound care provides comfort, relieves suffering, and promotes quality of life.3,7 To achieve these goals, clinicians must be familiar with strategies to manage complications associated with nonhealing wounds such as pain, malodor, and psychosocial adverse effects. Of these complications, malodor has been pointed out by both patients and caregivers as the most distressing.8
This article focuses on wound malodor, discusses the processes that cause wounds to emit an offensive smell, and outlines a comprehensive management approach.
MRS. A., AGE 61, WITH STAGE IV BREAST CANCER
Mrs. A., 61 years old, had a fungating mass in her left breast, which began as a small nodule and progressively enlarged to deform her breast over several months. Her oncologist subsequently staged the extent of her cancer as stage IV after workup revealed lung metastasis. Mrs. A. and her family decided to forgo cancer treatment, including radiotherapy, and to transition to hospice care after discussions with the oncologist.
Mrs. A. lived at home with her husband. Her daughter and three grandchildren all lived nearby.
When her hospice physician arrived at her home to meet her, a strong, pungent, and nauseating smell greeted him as he entered her bedroom. The patient said that for the past few months she had been increasingly distressed by the revolting odor. She rarely left home and had been ashamed to have people visit her, including her family.
On examination, the physician noticed a large fungating mass with yellowish discharge and necrotic tissue in her left breast. In addition to mild pain, she was immensely bothered by the strong odor coming from her breast.
THE IMPACT OF MALODOR
As seen in the case of Mrs. A., malodor has grave effects, both physical and psychological. Patients experience impaired or socially unacceptable body image, social rejection, personal shame, and embarrassment.9,10 Feelings of fear, anxiety, and depression are common. If left uncontrolled, malodor results in social isolation, reluctance to engage in social activities, diminished appetite, and nausea. In addition, malodor is a constant reminder of patients’ pain and cancer, and it results in further suffering.11
Reactions of family members and caregivers can worsen the situation.9,12 Expressions of revulsion limit contact and inhibit intimacy, especially near the end of life. Caregivers are often frustrated and distressed over their inability to control the malodor. The environment becomes uninhabitable, and the malodor can permeate clothing, furniture, and living quarters.
Managing malodor can be emotionally draining, physically daunting, and frustrating for healthcare professionals, as several methods are usually employed, often in a trial-and-error approach, to achieve an acceptable degree of odor control. In addition, clinicians must face the challenge of treating malodorous wounds at very close distance without reacting in a way that offends or alarms patients and family members.13
MALODOR PRODUCTION: WHERE IS THAT SMELL COMING FROM?
All wounds can produce an odor.14 Wounds that are expected to heal typically emit a faint but not unpleasant odor, akin to fresh blood. Wounds colonized by Pseudomonas aeruginosa produce a fruity or grapelike odor that is tolerable. Malodor occurs with wounds infected by other gram-negative organisms or anaerobic bacteria.15 Similarly, wounds covered by necrotic tissue smell like decaying flesh.
Three major causes
The three major causes of wound malodor are slough, infection, and exudate (Figure 1).
Slough is dead or necrotic tissue, usually resulting from vascular compromise. Arterial ulcers, pressure ulcers, and malignant wounds all form slough from capillary occlusion, subsequent ischemia, and tissue necrosis.
Infection. Devitalized tissue, an ideal medium in which bacteria thrive, becomes the source of infection. Anaerobic bacteria are usually implicated in malodor. These include Bacteroides fragilis, Bacteroides prevotella, Clostridium perfringens, and Fusobacterium nucleatum.16,17 Anaerobic organisms produce putrescine and cadaverine, which are largely responsible for the offensive odor.16,18 Volatile fatty acids such as propionic, butyric, isovaleric, and valeric acid are formed from lipid catabolism by anaerobes and add to malodor.17 Aerobic bacteria such as Proteus, Klebsiella, and Pseudomonas species supercolonize necrotic tissue as well and contribute to malodor.17,18
Exudate. Since nonhealing wounds undergo repeated cycles of inflammation, infection, and necrosis, accumulation of exudate becomes inevitable. Exudate typically is a pus-like fluid containing serum, fibrin, and white blood cells, which leak from blood vessels. In addition, bacteria that colonize chronic wounds filled with necrotic tissue activate proteases that degrade and liquefy dead tissue, thereby forming extensive amounts of exudate.19
Apart from slough, infection, and exudate, poor general hygiene and dressings left on for too long may contribute to malodor.16 Moisture-retentive dressings such as hydrocolloids leave an odor after removal. Dressings that liquefy upon contact with the wound surface leave a pus-like, potentially malodorous material.
MALODOR ASSESSMENT: DO YOU SMELL SOMETHING?
Various ways to document wound malodor can prove useful in guiding assessment and treatment. Descriptions such as “foul,” “putrid,” “fishy,” or “filled the room” vividly portray the initial presentation. A 10-point numerical scale similar to a numerical pain scale or a visual analogue scale can be used as a subjective measure.
Other grading methods, which to the authors’ knowledge are not validated, may be helpful. In a study that focused on patients suffering from malodorous gynecologic malignancies, von Gruenigen et al20 used a 0-to-3 scale:
- 0 Absent
- 1 Not offensive
- 2 Offensive but tolerable
- 3 Offensive and intolerable.
A scale often adapted by other authors was devised by Baker and Haig,21 which clearly defines four classes:
- 1 Strong—odor is evident upon entering the room (6 to 10 feet from the patient) with the dressing intact
- 2 Moderate—odor is evident upon entering the room with dressing removed
- 3 Slight—odor is evident at close proximity to the patient when the dressing is removed
- 4 No odor—no odor is evident, even at the patient’s bedside with the dressing removed.
COMPREHENSIVE MANAGEMENT: HOW DO WE WIN THE ‘RACE’?
The acronym RACE outlines an approach to dealing with malodor. It stands for removal of necrotic tissue; antibacterials; odor concealers; and education and support (Table 1).
Remove necrotic tissue
An important step in eliminating malodor is to remove necrotic tissue. This starts with debridement, which decreases the incidence of infection and hastens wound closure.22,23 Table 2 compares the different types of debridement.
Sharp or surgical debridement involves the use of a scalpel or scissors. This type of debridement may increase the risk of bleeding, pain, and malignant cell seeding in fungating wounds.4,24
Enzymatic debridement employs chemicals with proteolytic action (eg, collagenase) to digest extracellular proteins in wounds.18,25
Mechanical debridement involves aggressive therapies such as forceful irrigation and hydrotherapy, which may fail to discriminate between necrotic and viable tissues.18,26
Biological debridement using maggots, which ingest bacteria and devitalized tissue, may cause increased wound bleeding and may be unacceptable for patients and families.24,27
Autolytic debridement is often recommended, particularly if complete healing is not the primary goal.17,24,28,29 Autolysis uses proteolytic enzymes and phagocytic cells present in the wound bed and wound fluid to clear devitalized tissue. It is easy, inexpensive, noninvasive, and painless,4 and it requires less frequent dressing changes relative to standard dressing or wet-to-dry dressing.
Autolytic debridement is commonly accomplished using hydrocolloid and hydrogel dressings.15,29 Hydrocolloids are adhesive, occlusive, and conformable dressings that are suitable for wounds with low to moderate amounts of exudate. Upon contact with the wound surface, the dressing absorbs the exudate, forms a gel layer, and maintains a moist environment. Hydrocolloids are not recommended for infected wounds or for those with copious exudate as they may lead to maceration around the wound. A disadvantage of hydrocolloid dressings is their tendency to generate brown, often malodorous exudate when removed.
On the other hand, hydrogels in amorphous gel, dressing, sheet, or impregnated gauze form are water-based products that create a moist environment similar to hydrocolloids. Aside from causing minimal trauma to the wound bed when removed, the dressing’s cooling effect may bring some pain relief. Hydrogels are appropriate for dry wounds and for those with minimal exudate.
After debridement, the wound is cleansed and irrigated. A number of cleansers and solutions are available, but normal saline is a cheap alternative. To irrigate, experts recommend an 18- or 20-gauge intravenous catheter attached to a 30- or 60-mL syringe.15 This technique provides 8 to 15 psi of pressure, enough to cleanse the wound without causing tissue trauma.
Antibacterials and absorption
Antibacterials. Topical antibiotics have several advantages over systemic antibiotics in treating chronic wounds.30,31 These include a high and sustained concentration of the antimicrobial at the site of infection, limited potential for systemic absorption and toxicity, reduced potential for antibiotic resistance, and drawing of the patient’s and caregiver’s attention to the wound.
Metronidazole is the most widely used topical antibacterial for malodor management. Its efficacy is likely due to the predominant involvement of anaerobic bacteria in foul-smelling wounds. Topical metronidazole is available as a gel and as a cream. A systematic review showed that on average, topical metronidazole was used once daily for 14 consecutive days.19 The layer of topical metronidazole is typically covered with a nonadherent primary dressing followed by an absorbent secondary dressing.
The best clinical evidence for topical metronidazole consists of case reports and series.32–35 The largest of these studies was done by Finlay et al, who treated 47 patients with malodorous benign and malignant cutaneous wounds with 0.75% metronidazole gel daily.32 Forty-five (96%) of the patients reported significantly decreased odor by 14 days, as well as decreased pain, discharge, and surrounding cellulitis.
A randomized, placebo-controlled trial conducted by Bale et al had equivocal findings.9 All 41 patients who received metronidazole gel reported a decrease in malodor within 3 days of starting it. However, 76% of patients who received placebo also reported malodor control; in the final analysis, no significant difference was noted in the success rate between the two groups.
Metronidazole tablets can be crushed and sprinkled over the wound. As with metronidazole gel or cream, the crushed tablets are applied daily and covered by a primary nonadherent dressing and an absorbent secondary dressing. This off-label use of metronidazole serves as a cheaper alternative to commercially available topical preparations. To our knowledge, there has been no head-to-head trial comparing the two topical strategies.
Systemic metronidazole, often given orally, has been recommended if evidence of deep tissue or systemic infection is noted15 and in cases of fungating wounds with fistulas invading either the gastrointestinal or genitourinary tracts.18 Side effects such as nausea, neuropathy, and alcohol intolerance (ie, disulfiram reaction) may occur, which are not seen with topical metronidazole.
Both topical and systemic metronidazole can be used together on a time-limited basis for extensive malodorous wounds, such as fungating malignant wounds or stage IV sacral pressure ulcers.
Other antimicrobial agents used to treat malodor include silver-containing products, iodine-containing topical agents, mupirocin, bacitracin, neomycin, and polymyxin B.
Honey was used for wound care by the ancient Egyptians, and it is still used.36 Its beneficial effects include antimicrobial, debriding, deodorizing, anti-inflammatory, and granulation tissue-stimulating. Honey has even been shown to significantly decrease skin colonization with various kinds of bacteria, including methicillin-resistant Staphylococcus aureus.37 Medical-grade honey is preferred over table honey, as the latter is nonsterile and can contain Clostridium spores, which contaminate the wound.38
Yogurt and buttermilk lower the pH of the wound and control bacterial proliferation to control malodor.39,40 Either is applied for 10 to 15 minutes after the wound is cleansed and is then washed off thoroughly.
Absorbent dressings are used either over a layer of topical metronidazole and a nonadherent primary dressing or as a primary dressing itself. An absorbent dressing containing activated charcoal is used for rapid improvement, although cost may be prohibitive, especially in developing countries.13,19 Another type of absorbent dressing, composed of polyester impregnated with sodium chloride, has been found to be useful in malodor control.41 An important pointer is to maintain a tight seal around the absorbent dressing to prevent leakage of exudate.
Concealers
Aromatics used to conceal malodor include scented candles, incense, fragrant flowers and plants, and air-freshener sprays. When circumstances allow, candles are good options since they conceal malodor by emitting fragrance, and the flame burns off foul-smelling chemicals. Aromatics such as coffee beans, vanilla beans, and cider vinegar can be placed in a pan and left under the patient’s bed or close to it. Drops of peppermint oil or oil of wintergreen can be placed on wound dressings.
Other odor concealers are adsorbent materials that attract and cause ions and molecules to adhere to their surface. Examples are charcoal, baking soda, and cat litter. As with other aromatics, these materials are placed in pans and left under the bed or near the patient.
Aromatics can have disadvantages, as certain scents, especially strong ones, can be nauseating for patients. Some fragrances trigger asthma or skin irritation. Patients and caregivers can be left with an unpleasant association of certain fragrances with malodor by conditioning.15,17,18
Education and support
Concerns of the patient and family members need to be heard, addressed promptly, and reassessed with each visit, since uncontrolled malodor can be a chief source of caregiver fatigue.
Foremost in formulating a patient- and family-centered malodor management strategy is to commit to controlling malodor as much as possible. Regular follow-up appointments should be made, whether in the office or at home, to check on the patient’s progress and address new and ongoing concerns. Symptoms accompanying malodor, such as pain, bleeding, and sleep disturbance, need to be addressed, as they all affect quality of life.1 Audience-appropriate educational materials should be made available.26 Online resources that patients and families can explore include the websites of the Wound Ostomy and Continence Nurses Society (www.wocn.org) and the Association for the Advancement of Wound Care (aawconline.org).
Healthcare professionals need to be prepared to deal with problems and complications involving patients and family members that may arise in the course of treatment.12 Problems include the cost and local unavailability of dressing supplies, insurance coverage for dressings and topical agents, lack of assistance at home, and fear of changing dressings. A cardinal rule for healthcare providers is to avoid expressing distress at odors in front of or within hearing of patients and families.
OTHER STRATEGIES: WHAT ELSE CAN WE DO?
Curcumin, the main biologically active compound in the herb turmeric, applied directly to wounds three times daily as an ointment, has been shown to have odor-controlling properties.42
Sugar paste has been reported to control malodor by drawing out exudative and tissue fluid osmotically, and inhibiting bacterial growth.16,17 Water is mixed with sugar (ie, granulated, caster, or powdered) to form a paste, with additives like glycerin and polyethylene glycol used to alter the consistency. Thick clay-like paste is good for wounds with large cavities, while thin paste is useful for wounds with small or superficial openings. The paste is applied twice daily and is covered by an absorbent dressing.
Pressure relief is vital in managing pressure ulcers.18,43 Repositioning every 2 hours and using special devices, such as mattress overlays, alternating pressure mattresses, and low air loss mattresses, are frequently employed techniques.
If circumstances permit and when congruent with the patient’s goals of care, intra-arterial chemotherapy and radiotherapy can be contemplated for malignant fungating wounds.44,45
Other strategies include opening the windows during dressing changes, increasing the frequency of dressing changes, promptly removing used dressings from the house, and ensuring good general hygiene.
CASE RESOLUTION
After telling her that he was committed to control the malodor or, if possible, eliminate it, Mrs. A.’s doctor prepared two lists of materials—one for himself and one for Mrs. A.’s husband. He returned the next day, brought out his supplies, asked Mrs. A. to lie in bed, and invited her husband to assist him.
He cleansed and irrigated the breast lesion with normal saline, making sure to remove as much dead tissue as he could. He applied a layer of metronidazole cream to the wound cavity, then covered it with a nonadherent dressing. He then covered the wound with gauze, sealed the edges with medical adhesive tape, and applied a few drops of oil of wintergreen to the surface. A pan of charcoal briquettes was put under the bed, and a candle with Mrs. A.’s favorite scent was lit by the bedside. The physician then instructed Mrs. A.’s husband to repeat the procedure once daily for 1 week.
After 2 weeks, Mrs. A. and her husband said the foul odor had greatly decreased. She appeared more cheerful and energetic, especially after her grandchildren visited a few days earlier. The physician then instructed the husband to stop using metronidazole cream and to apply a hydrocolloid dressing every 3 days instead. He advised them to continue the rest of the process of applying a few drops of oil of wintergreen on the dressing surface, placing a pan of charcoal briquettes under the bed, and lighting a scented candle by the bedside.
FINISH THE RACE!
Complex nonhealing wounds are encountered across various healthcare settings. Wound malodor is an important component of nonhealing wounds, which adversely affects patients, families, and healthcare providers. Infection, slough, and exudate are the major causes of wound malodor. The essential steps to reduce malodor are to remove necrotic tissue, use antibacterial and odor-absorbing agents, apply appropriate odor “concealers,” educate families, and formulate a patient- and family-centered strategy (Table 1).
Acknowledgment: The authors would like to thank Sue Reif, CNP, for her assistance in completing the manuscript.
- Lo SF, Hayter M, Hu WY, Tai CY, Hsu MY, Li YF. Symptom burden and quality of life in patients with malignant fungating wounds. J Adv Nurs 2012; 68:1312–1321.
- Lazarus GS, Cooper DM, Knighton DR, et al. Definitions and guidelines for assessment of wounds and evaluation of healing. Arch Dermatol 1994; 130:489–493.
- Tippett AW. Wounds at the end of life. Wounds 2005; 17:91–98.
- Burt T. Palliative care of pressure ulcers in long-term care. Ann Long-Term Care 2013; 21:20–28.
- Reifsnyder J, Magee HS. Development of pressure ulcers in patients receiving home hospice care. Wounds 2005; 17:74–79.
- Haisfield-Wolfe ME, Rund C. Malignant cutaneous wounds: a management protocol. Ostomy Wound Manage 1997; 43:56–66.
- O’Brien C. Malignant wounds: managing odour. Can Fam Physician 2012; 58:272–274.
- Gethin G, Grocott P, Probst S, Clarke E. Current practice in the management of wound odour: an international survey. Int J Nurs Stud 2014; 51:865–874.
- Bale S, Tebble N, Price P. A topical metronidazole gel used to treat malodorous wounds. Br J Nurs 2004; 13:S4–S11.
- Hack A. Malodorous wounds—taking the patient’s perspective into account. J Wound Care 2003; 12:319–321.
- Price E. Wound care. The stigma of smell. Nurs Times 1996; 92:71–72.
- Paul JC, Pieper BA. Topical metronidazole for the treatment of wound odor: a review of the literature. Ostomy Wound Manage 2008; 54:18–27.
- Lee G, Anand SC, Rajendran S, Walker I. Overview of current practice and future trends in the evaluation of dressings for malodorous wounds. J Wound Care 2006; 15:344–346.
- Cutting K, Harding K. Criteria for identifying wound infection. J Wound Care 1994; 3:198–201.
- McDonald A, Lesage P. Palliative management of pressure ulcers and malignant wounds in patients with advanced illness. J Palliat Med 2006; 9:285–295.
- Holloway S. Recognising and treating the causes of chronic malodorous wounds. Prof Nurse 2004; 19:380–384.
- Haughton W, Young T. Common problems in wound care: malodorous wounds. Br J Nurs 1995; 4:959–963.
- Alvarez OM, Kalinski C, Nusbaum J, et al. Incorporating wound healing strategies to improve palliation (symptom management) in patients with chronic wounds. J Palliat Med 2007; 10:1161–1189.
- da Costa Santos CM, de Mattos Pimenta CA, Nobre MR. A systematic review of topical treatments to control the odor of malignant fungating wounds. J Pain Symptom Manage 2010; 39:1065–1076.
- Von Gruenigen VE, Coleman RL, et al. Bacteriology and treatment of malodorous lower reproductive tract in gynecologic cancer patients. Obstet Gynecol 2000; 96:23–27.
- Baker PG, Haig G. Metronidazole in the treatment of chronic pressure sores and ulcers: a comparison with standard treatment in general practice. Practitioner 1981; 225:569–573.
- Whitney J, Phillips L, Aslam R, et al. Guidelines for the treatment of pressure ulcers. Wound Repair Regen 2006; 14:663–679.
- Williams D, Enoch S, Miller D, Harris K, Price P, Harding KG. Effect of sharp debridement using curette on recalcitrant nonhealing venous ulcers: a concurrently controlled, prospective cohort study. Wound Repair Regen 2005; 13:131–137.
- Bergstrom KJ. Assessment and management of fungating wounds. J Wound Ostomy Continence Nurs 2011: 38:31–37.
- Sinclair RD, Ryan TJ. Proteolytic enzymes in wound healing: the role of enzymatic debridement. Australas J Dermatol 1994; 35:35–41.
- Enoch S, Harding KG. Wound bed preparation: the science behind the removal of barriers to healing. Wounds 2003;15:213–229.
- Mumcuoglu KY. Clinical applications for maggots in wound care. Am J Clin Dermatol 2001; 2:219–227.
- Langemo DK, Black J; National Pressure Ulcer Advisory Panel. Pressure ulcers in individuals receiving palliative care: a National Pressure Ulcer Advisory Panel white paper. Adv Skin Wound Care 2010; 23:59–72.
- Fonder MA, Lazarus GS, Cowan DA, Aronson-Cook B, Kohli AR, Mamelak AJ. Treating the chronic wound: a practical approach to the care of nonhealing wounds and wound care dressings. J Am Acad Dermatol 2008; 58:185–206.
- Lio PA, Kaye ET. Topical antibacterial agents. Infect Dis Clin North Am 2004; 18:717–733.
- Gelmetti C. Local antibiotics in dermatology. Dermatol Ther 2008; 21:187–195.
- Finlay IG, Bowszyc J, Ramlau C, Gwiezdzinski Z. The effect of topical 0.75% metronidazole gel on malodorous cutaneous ulcers. J Pain Symptom Manage 1996; 11:158–162.
- Bower M, Stein R, Evans TR, Hedley A, Pert P, Coombes RC. A double-blind study of the efficacy of metronidazole gel in the treatment of malodorous fungating tumours. Eur J Cancer 1992; 28A:888–889.
- Kalinski C, Schnepf M, Laboy D, et al. Effectiveness of a topical formulation containing metronidazole for wound odor and exudate control. Wounds 2005; 17:84–90.
- Kuge S, Tokuda Y, Ohta M, et al. Use of metronidazole gel to control malodor in advanced and recurrent breast cancer. Jpn J Clin Oncol 1996; 26:207–210.
- Belcher J. A review of medical-grade honey in wound care. Br J Nurs 2012: 21:S4–S9.
- Kwakman PH, Van den Akker JP, Güçlü A, et al. Medical-grade honey kills antibiotic-resistant bacteria in vitro and eradicates skin colonization. Clin Infect Dis 2008; 46:1677–1682.
- Cooper RA, Jenkins L. A comparison between medical grade honey and table honeys in relation to antimicrobial efficacy. Wounds 2009; 21:29–36.
- Patel B, Cox-Hayley D. Managing wound odor #218. J Palliat Med 2010; 13:1286–1287.
- Schulte MJ. Yogurt helps to control wound odor. Oncol Nurs Forum 1993; 20:1262.
- Upright CA, Salton C, Roberts F, Murphy J. Evaluation of Mesalt dressings and continuous wet saline dressings in ulcerating metastatic skin lesions. Cancer Nurs 1994; 17:149–155.
- Kuttan R, Sudheeran PC, Josph CD. Turmeric and curcumin as topical agents in cancer therapy. Tumori 1987; 73:29–31.
- Bass MJ, Phillips LG. Pressure sores. Curr Probl Surg 2007; 44:101–143.
- Bufill JA, Grace WR, Neff R. Intra-arterial chemotherapy for palliation of fungating breast cancer: a case report and review of the literature. Am J Clin Oncol 1994; 17:118–124.
- Murakami M, Kuroda Y, Sano A, et al. Validity of local treatment including intraarterial infusion chemotherapy and radiotherapy for fungating adenocarcinoma of the breast: case report of more than 8-year survival. Am J Clin Oncol 2001; 24:388–391.
KEY POINTS
- Necrotic tissue is a substrate for bacterial growth and should be debrided. A variety of methods can be used.
- Malodor is most often from infection with anaerobic organisms, which topical metronidazole and other agents can help control.
- An absorbent dressing should be used either as a primary dressing, or over a layer of topical metronidazole and a nonadherent primary dressing.
- Foremost in formulating a patient- and family-centered malodor management strategy is to commit to controlling it as much as possible.
Respiratory artifact: A second vital sign on the electrocardiogram
A 57-year-old man hospitalized for treatment of multilobar pneumonia was noted to have a rapid, irregular heart rate on telemetry. He was hypoxemic and appeared to be in respiratory distress. A 12-lead electrocardiogram (ECG) demonstrated atrial fibrillation with rapid ventricular response, as well as what looked like distinct and regular P waves dissociated from the QRS complexes at a rate of about 44/min (Figure 1). What is the explanation and clinical significance of this curious finding?
What appear to be dissociated P waves actually represent respiratory artifact.1–3 The sharp deflections mimicking P waves signify the tonic initiation of inspiratory effort; the subsequent brief periods of low-amplitude, high-frequency micro-oscillations represent surface electrical activity associated with the increased force of the accessory muscles of respiration.1–3
Surface electromyography noninvasively measures muscle activity using electrodes placed on the skin overlying the muscle.4 Using simultaneously recorded mechanical respiratory waveform tracings, we have previously demonstrated that the repetitive pseudo-P waves followed by micro-oscillations have a close temporal relationship with the inspiratory phase of respiration.3 The presence of respiratory artifact indicates a high-risk state frequently necessitating ventilation support.
In addition, when present, respiratory artifact can be viewed as the “second vital sign” on the ECG, the first vital sign being the heart rate. The respiratory rate can be approximated by counting the number of respiratory artifacts in a 10-second recording and multiplying it by 6. A more accurate rate assessment is achieved by measuring 1 or more respiratory artifact cycles in millimeters and then dividing that number into 1,500 or its multiples.3 Based on these calculations, the respiratory rate in this patient was 44/min.
The presence of two atrial rhythms on the same ECG, one not disturbing the other, is consistent with the diagnosis of atrial dissociation.5 Atrial dissociation is a common finding in cardiac transplant recipients in whom the transplantation was performed using atrio-atrial anastomosis.6 Most other cases of apparent atrial dissociation described in the old cardiology and critical care literature probably represented unrecognized respiratory artifact.7,8
An ECG from a different patient (Figure 2) demonstrates rapid respiratory artifact that raised awareness of severe respiratory failure. The respiratory rate calculated from spacing of the pseudo-P waves is 62/min, confirmed by simultaneous respirography.
A FREQUENT FINDING IN SICK HOSPITALIZED PATIENTS
Respiratory artifact is a frequent finding in sick hospitalized patients.3 Most commonly, it manifests as repetitive micro-oscillations.3 Pseudo-P waves, as in this 57-year-old patient, are less often observed; but if their origin is not recognized, the interpretation of the ECG can become puzzling.1–3,7,8
Respiratory artifact is a marker of increased work of breathing and a strong indicator of significant cardiopulmonary compromise. Improvement in the patient’s cardiac or respiratory condition is typically associated with a decrease in the rate or complete elimination of respiratory artifact.3
Recognition of rapid respiratory artifact is less important in critical care units, where patients’ vital signs and cardiorespiratory status are carefully observed. However, in hospital settings where respiratory rate and oxygen saturation are not continuously monitored, recognizing rapid respiratory artifact can help raise awareness of the possibility of severe respiratory distress.
- Higgins TG, Phillips JH Jr, Sumner RG. Atrial dissociation: an electrocardiographic artifact produced by the accessory muscles of respiration. Am J Cardiol 1966; 18:132–139.
- Cheriex EC, Brugada P, Wellens HJ. Pseudo-atrial dissociation: a respiratory artifact. Eur Heart J 1986; 7:357–359.
- Littmann L, Rennyson SL, Wall BP, Parker JM. Significance of respiratory artifact in the electrocardiogram. Am J Cardiol 2008; 102:1090–1096.
- Pullman SL, Goodin DS, Marquinez AI, Tabbal S, Rubin M. Clinical utility of surface EMG: report of the therapeutics and technology assessment subcommittee of the American Academy of Neurology. Neurology 2000; 55:171–177.
- Chung EK. A reappraisal of atrial dissociation. Am J Cardiol 1971; 28:111–117.
- Stinson EB, Schroeder JS, Griepp RB, Shumway NE, Dong E Jr. Observations on the behavior of recipient atria after cardiac transplantation in man. Am J Cardiol 1972; 30:615–622.
- Cohen J, Scherf D. Complete interatrial and intra-atrial block (atrial dissociation). Am Heart J 1965; 70:23–34.
- Chung KY, Walsh TJ, Massie E. A review of atrial dissociation, with illustrative cases and critical discussion. Am J Med Sci 1965; 250:72–78.
A 57-year-old man hospitalized for treatment of multilobar pneumonia was noted to have a rapid, irregular heart rate on telemetry. He was hypoxemic and appeared to be in respiratory distress. A 12-lead electrocardiogram (ECG) demonstrated atrial fibrillation with rapid ventricular response, as well as what looked like distinct and regular P waves dissociated from the QRS complexes at a rate of about 44/min (Figure 1). What is the explanation and clinical significance of this curious finding?
What appear to be dissociated P waves actually represent respiratory artifact.1–3 The sharp deflections mimicking P waves signify the tonic initiation of inspiratory effort; the subsequent brief periods of low-amplitude, high-frequency micro-oscillations represent surface electrical activity associated with the increased force of the accessory muscles of respiration.1–3
Surface electromyography noninvasively measures muscle activity using electrodes placed on the skin overlying the muscle.4 Using simultaneously recorded mechanical respiratory waveform tracings, we have previously demonstrated that the repetitive pseudo-P waves followed by micro-oscillations have a close temporal relationship with the inspiratory phase of respiration.3 The presence of respiratory artifact indicates a high-risk state frequently necessitating ventilation support.
In addition, when present, respiratory artifact can be viewed as the “second vital sign” on the ECG, the first vital sign being the heart rate. The respiratory rate can be approximated by counting the number of respiratory artifacts in a 10-second recording and multiplying it by 6. A more accurate rate assessment is achieved by measuring 1 or more respiratory artifact cycles in millimeters and then dividing that number into 1,500 or its multiples.3 Based on these calculations, the respiratory rate in this patient was 44/min.
The presence of two atrial rhythms on the same ECG, one not disturbing the other, is consistent with the diagnosis of atrial dissociation.5 Atrial dissociation is a common finding in cardiac transplant recipients in whom the transplantation was performed using atrio-atrial anastomosis.6 Most other cases of apparent atrial dissociation described in the old cardiology and critical care literature probably represented unrecognized respiratory artifact.7,8
An ECG from a different patient (Figure 2) demonstrates rapid respiratory artifact that raised awareness of severe respiratory failure. The respiratory rate calculated from spacing of the pseudo-P waves is 62/min, confirmed by simultaneous respirography.
A FREQUENT FINDING IN SICK HOSPITALIZED PATIENTS
Respiratory artifact is a frequent finding in sick hospitalized patients.3 Most commonly, it manifests as repetitive micro-oscillations.3 Pseudo-P waves, as in this 57-year-old patient, are less often observed; but if their origin is not recognized, the interpretation of the ECG can become puzzling.1–3,7,8
Respiratory artifact is a marker of increased work of breathing and a strong indicator of significant cardiopulmonary compromise. Improvement in the patient’s cardiac or respiratory condition is typically associated with a decrease in the rate or complete elimination of respiratory artifact.3
Recognition of rapid respiratory artifact is less important in critical care units, where patients’ vital signs and cardiorespiratory status are carefully observed. However, in hospital settings where respiratory rate and oxygen saturation are not continuously monitored, recognizing rapid respiratory artifact can help raise awareness of the possibility of severe respiratory distress.
- Higgins TG, Phillips JH Jr, Sumner RG. Atrial dissociation: an electrocardiographic artifact produced by the accessory muscles of respiration. Am J Cardiol 1966; 18:132–139.
- Cheriex EC, Brugada P, Wellens HJ. Pseudo-atrial dissociation: a respiratory artifact. Eur Heart J 1986; 7:357–359.
- Littmann L, Rennyson SL, Wall BP, Parker JM. Significance of respiratory artifact in the electrocardiogram. Am J Cardiol 2008; 102:1090–1096.
- Pullman SL, Goodin DS, Marquinez AI, Tabbal S, Rubin M. Clinical utility of surface EMG: report of the therapeutics and technology assessment subcommittee of the American Academy of Neurology. Neurology 2000; 55:171–177.
- Chung EK. A reappraisal of atrial dissociation. Am J Cardiol 1971; 28:111–117.
- Stinson EB, Schroeder JS, Griepp RB, Shumway NE, Dong E Jr. Observations on the behavior of recipient atria after cardiac transplantation in man. Am J Cardiol 1972; 30:615–622.
- Cohen J, Scherf D. Complete interatrial and intra-atrial block (atrial dissociation). Am Heart J 1965; 70:23–34.
- Chung KY, Walsh TJ, Massie E. A review of atrial dissociation, with illustrative cases and critical discussion. Am J Med Sci 1965; 250:72–78.
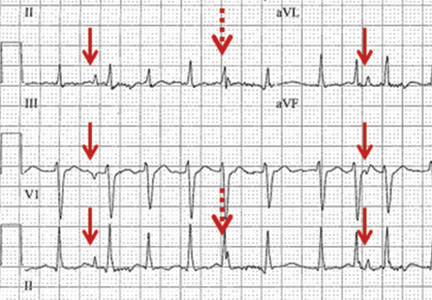
Ceftaroline fosamil: A super-cephalosporin?
Ceftaroline fosamil (Teflaro), introduced to the US market in October 2010, is the first beta-lactam agent with clinically useful activity against methicillin-resistant Staphylococcus aureus (MRSA). Currently, it is approved by the US Food and Drug Administration (FDA) to treat acute bacterial skin and skin-structure infections and community-acquired bacterial pneumonia caused by susceptible microorganisms.
In an era of increasing drug resistance and limited numbers of antimicrobials in the drug-production pipeline, ceftaroline is a step forward in fulfilling the Infectious Diseases Society of America’s “10 × ’20 Initiative” to increase support for drug research and manufacturing, with the goal of producing 10 new antimicrobial drugs by the year 2020.1 Ceftaroline was the first of several antibiotics to receive FDA approval in response to this initiative. It was followed by dalbavancin (May 2014), tedizolid phosphate (June 2014), oritavancin (August 2014), ceftolozane-tazobactam (December 2014), and ceftazidime-avibactam (February 2015). These antibiotic agents are aimed at treating infections caused by drug-resistant gram-positive and gram-negative microorganisms. It is important to understand and optimize the use of these new antibiotic agents in order to decrease the risk of emerging antibiotic resistance and superinfections (eg, Clostridium difficile infection) caused by antibiotic overuse or misuse.
This article provides an overview of ceftaroline’s mechanisms of action and resistance, spectrum of activity, pharmacokinetic properties, adverse effects, and current place in therapy.
AN ERA OF MULTIDRUG-RESISTANT MICROORGANISMS
Increasing rates of antimicrobial resistance threaten the efficacy of antimicrobial drugs in the daily practice of medicine. The World Health Organization has labeled antimicrobial resistance one of the three greatest threats to human health. Global efforts are under way to stimulate development of new antimicrobial agents and to decrease rates of antimicrobial resistance.
Staphylococcus aureus: A threat, even with vancomycin
Between 1998 and 2005, S aureus was one of the most common inpatient and outpatient isolates reported by clinical laboratories throughout the United States.2
Treatment of S aureus infection is complicated by a variety of resistance mechanisms that have evolved over time. In fact, the first resistant isolate of S aureus emerged not long after penicillin’s debut into clinical practice, and now the majority of strains are resistant to penicillin.
Methicillin was designed to overcome this beta-lactamase resistance and became the treatment of choice for penicillin-resistant S aureus isolates. However, MRSA isolates soon emerged because of the organism’s acquisition of penicillin-binding protein PBP2a via the mecA gene, leading to decreased binding affinity of methicillin.3
Since then, several agents active against MRSA (vancomycin, daptomycin, linezolid, tigecycline) have been introduced and continue to be widely used. While vancomycin is considered the first-line option for a variety of MRSA infections, its use has been threatened because of the emergence of vancomycin-intermediate-resistant S aureus (VISA), S aureus strains displaying vancomycin heteroresistance (hVISA), and vancomycin-resistant S aureus (VRSA) strains.4
VISA and hVISA isolates emerged through sequential mutations that lead to autolytic activity and cell-wall thickening. In contrast, the mechanism of resistance in VRSA is by acquisition of the vanA resistance gene, which alters the binding site of vancomycin from d-alanine-d-alanine to d-alanine-d-lactate.5
Streptococcus pneumoniae resistance: A continuing problem
The prevalence of drug resistance in S pneumoniae has risen since the late 1990s. A 2013 report from the SENTRY Antimicrobial Surveillance Program stated that almost 20% of S pneumoniae isolates were resistant to amoxicillin-clavulanate, and similar trends have been observed for penicillin (14.8%) and ceftriaxone (11.7%).6
S pneumoniae resistance is acquired through modifications of the penicillin-binding proteins, namely PBP1a, PBP2b, PBP2x, and, less frequently, PBP2a. These modifications lead to decreased binding affinity for most beta-lactams.7
Clinical impact of multidrug-resistant S aureus and S pneumoniae
In 2011, the US Centers for Disease Control and Prevention reported an estimated 80,000 severe MRSA infections and 11,000 MRSA-related deaths in the United States.8 In the same report, drug-resistant S pneumoniae was estimated to be responsible for almost 1.2 million illnesses and 7,000 deaths per year, leading to upwards of $96 million in related medical costs.
While invasive drug-resistant S pneumoniae infections usually affect patients at the extremes of age (under age 5 and over age 65), they have had a serious impact on patients of all ages.8
In light of the increasing prevalence of multidrug-resistant organisms, newer antimicrobial agents with novel mechanisms of action are needed.
CEFTAROLINE: A BETA-LACTAM WITH ANTI-MRSA ACTIVITY
The cephalosporins, a class of beta-lactam antibiotics, were originally derived from the fungus Cephalosporium (now called Acremonium). There are now many agents in this class, each containing a nucleus consisting of a beta-lactam ring fused to a six-member dihydrothiazine ring, and two side chains that can be modified to affect antibacterial activity and pharmacokinetic properties.
Cephalosporins are typically categorized into “generations.” With some exceptions, the first- and second-generation agents have good activity against gram-positive microorganisms, including methicillin-susceptible S aureus—but not against MRSA. The third- and fourth-generation cephalosporins have better gram-negative activity, with many agents having activity against the gram-negative bacterium Pseudomonas aeruginosa.
Enterococcal isolates are intrinsically resistant to cephalosporins. Additionally, cephalosporins are not active against anaerobic bacteria, except for a subset of structurally unique second-generation cephalosporins, ie, cefotetan and cefoxitin.
Ceftaroline was synthesized with specific manipulations of the side chains to provide enhanced activity against MRSA and multidrug-resistant S pneumoniae isolates, making it the first available beta-lactam with this ability.
Mechanism of action
Ceftaroline binds to penicillin-binding proteins, inhibiting transpeptidation. This interaction blocks the final stage of peptidoglycan synthesis and inhibits bacterial cell wall formation, ultimately leading to cellular autolysis and microorganism death. Ceftaroline binds with high affinity to PBP2a and PBP2x, expanding its activity to encompass MRSA and penicillin-resistant S pneumoniae isolates.9
Spectrum of activity
Ceftaroline has in vitro activity against many gram-positive and gram-negative bacteria,10–13 including (Table 1):
- Methicillin-susceptible and methicillin-resistant staphylococci
- VISA, VRSA, and hVISA
- Daptomycin-nonsusceptible S aureus
- Streptococcal species, including penicillin-resistant S pneumoniae
- Enterobacteriaceae, including Klebsiella pneumoniae, Klebsiella oxytoca, Escherichia coli, Citrobacter koseri, Citrobacter freundii, Enterobacter cloacae, Enterobacter aerogenes, Moraxella catarrhalis, Morganella morganii, and Proteus mirabilis.
Of note, ceftaroline is not active against Pseudomonas species, Enterococcus species, or Bacteroides fragilis. In addition, it is not active against the “atypical” respiratory pathogens Mycoplasma pneumoniae, Chlamydophila pneumoniae, and Legionella pneumophila.
Ceftaroline resistance
Gram-negative organisms appear to develop resistance to ceftaroline at rates similar to those observed with the other oxyimino-cephalosporins (eg, ceftriaxone). Ceftaroline is inactive against gram-negative organisms producing extended-spectrum beta-lactamases, including K pneumoniae carbapenemase and metallo-beta-lactamases.14 In addition, it induces the expression of AmpC beta-lactamases.
Although currently uncommon, resistance to ceftaroline has also been reported in S aureus strains.15 The mechanism of resistance is decreased binding affinity for PBP2a due to amino acid substitutions on the nonpenicillin-binding domains.15
Pharmacokinetic profile
An understanding of pharmacokinetics is key in optimizing the dose of antimicrobials so that the drugs are used most effectively and pathogens do not develop resistance to them.
Ceftaroline fosamil is a prodrug that, upon intravenous administration, is rapidly converted by phosphatase enzymes to its active moiety, ceftaroline. Its pharmacokinetic profile is summarized in Table 2.16,17 Its volume of distribution is similar to that of the fourth-generation cephalosporin cefepime.
Ceftaroline is then hydrolyzed into its inactive metabolite, ceftaroline M-1. It undergoes little hepatic metabolism and lacks properties to make it a substrate, inhibitor, or inducer of the CYP450 enzyme system and therefore is not likely to cause notable CYP450-related drug-drug interactions.
Like most other beta-lactams, ceftaroline is primarily excreted by the kidneys. Furthermore, an estimated 21% of a dose is eliminated with each intermittent hemodialysis session. Therefore, renal and intermittent hemodialysis dose adjustments are necessary. The estimated elimination half-life is 2.6 hours, necessitating dosing two to three times daily, depending on the indication and infectious inoculum.
Ceftaroline dosing
Ceftaroline is available only in a parenteral preparation and is typically given at a dose of 600 mg every 12 hours.10 The intravenous infusion is given over 1 hour.
The current stability data require reconstituted ceftaroline to be used within 6 hours at room temperature and within 24 hours if refrigerated.10
Ceftaroline requires dosing adjustments for patients with renal insufficiency. Per the manufacturer, renal dosing adjustments are based on the creatinine clearance rate, as estimated by the Cockroft-Gault formula:
- Creatinine clearance > 50 mL/min: no dosage adjustment necessary
- Creatinine clearance > 30 to ≤ 50 mL/min: give 400 mg every 12 hours
- Creatinine clearance ≥ 15 to ≤ 30 mL/min: give 300 mg every 12 hours
- Creatinine clearance < 15 mL/min or on intermittent dialysis: give 200 mg every 12 hours.
Ongoing clinical trials are investigating a higher-dosing strategy of 600 mg every 8 hours for patients with community-acquired bacterial pneumonia at risk of MRSA bacteremia.18
CLINICAL TRIALS LEADING TO CEFTAROLINE’S APPROVAL
Ceftaroline was approved for the treatment of community-acquired bacterial pneumonia and acute bacterial skin and skin-structure infections due to susceptible pathogens on the basis of phase 3 comparator trials.
Community-acquired bacterial pneumonia: The FOCUS 1 and 2 trials
The efficacy and safety of ceftaroline in the treatment of community-acquired bacterial pneumonia was studied in two randomized, double-blind, noninferiority trials, known as Ceftaroline Community-acquired Pneumonia vs Ceftriaxone (FOCUS) 1 and FOCUS 2.19,20
Patients were adults and not critically ill, as was reflected by their being in Pneumonia Outcomes Research Team (PORT) risk class III or IV (with class V indicating the highest risk of death). Therefore, the results may not be completely applicable to critically ill patients or those not admitted to the hospital. Of note, patients were excluded from the trials if they had infections known or thought to be due to MRSA or to atypical organisms.21 Baseline characteristics and patient demographics were similar between study groups in both trials.
A bacterial pathogen was identified in 26.1% of the patients included in the modified intent-to-treat analysis of the pooled data of the trials; the most common pathogens were S pneumoniae, methicillin-sensitive S aureus, Haemophilus influenzae, K pneumoniae, and E coli.21
Treatment. Patients received either ceftaroline 600 mg every 12 hours (or a lower dose based on renal function) or ceftriaxone 1 g every 24 hours. In addition, in the FOCUS 1 trial, patients in both treatment groups received clarithromycin 500 mg every 12 hours for the first day.19
Results. In both trials and in the integrated analysis, ceftaroline was noninferior to ceftriaxone (Table 3).22 In the integrated analysis of both trials, compared with the ceftriaxone group, the ceftaroline group had a higher clinical cure rate among patients classified as PORT risk class III (86.8% vs 79.2%, weighted treatment difference 12.6%, 95% confidence interval [CI] 1.3–13.8) and among patients who had not received prior antibiotic treatment (85.5% vs 74.9%, weighted treatment difference 11.2%, 95% CI 4.5–18.0).21
Acute bacterial skin and skin-structure infections: The CANVAS 1 and 2 trials
The efficacy and safety of ceftaroline in the treatment of complicated acute bacterial skin and skin-structure infections was studied in two randomized, double-blind trials: Ceftaroline Versus Vancomycin in Skin and Skin Structure Infections (CANVAS) 1 and CANVAS 2.23,24
Patients. Adult patients with a diagnosis of community-acquired skin and skin-structure infections warranting at least 5 days of intravenous antimicrobial therapy were included in the trials. Important protocol exclusions were patients with diabetic foot ulcers, decubitus ulcers, burns, ulcers associated with peripheral vascular disease accompanied by osteomyelitis, and suspected P aeruginosa infections.25 This limits the external validity of ceftaroline use in the aforementioned excluded patient populations.
Patients in each treatment group of the trials had similar demographic characteristics. The most common infections were cellulitis, major abscess requiring surgical intervention, wound infection, and infected ulcer. Bacteremia was present in 4.2% of patients in the ceftaroline group and in 3.8% of patients in the vancomycin-aztreonam group. The most common pathogen was S aureus. Methicillin resistance was present in 40% of the ceftaroline group and 34% of the control group.
Treatment. Patients received either ceftaroline 600 mg every 12 hours or the combination of vancomycin 1 g plus aztreonam 1 g given 12 hours, for 5 to 14 days.

Results. As assessed at a “test-of-cure” visit 8 to 15 days after the last dose of study medication, the efficacy of ceftaroline was similar to that of vancomycin-aztreonam, meeting the set noninferiority goal (Table 4).25 Moreover, if assessed on day 2 or 3 (a new end point recommended by the FDA), the rate of cessation of erythema spread and absence of fever was higher in the ceftaroline group than in the vancomycin-aztreonam group.26 However, this end point was not in the original trial protocol.
CEFTAROLINE FOR OTHER INDICATIONS
As noted, ceftaroline has been approved for treating community-acquired bacterial pneumonia and acute bacterial skin and skin-structure infections. In addition, it has been used in several studies in animals, and case reports of non-FDA approved indications including endocarditis and osteomyelitis have been published. Clinical trials are evaluating its use in pediatric patients, as well as for community-acquired bacterial pneumonia with risk for MRSA and for MRSA bacteremia.
Endocarditis
Animal studies have demonstrated ceftaroline to have bactericidal activity against MRSA and hVISA in endocarditis.27
A few case series have been published describing ceftaroline’s use as salvage therapy for persistent MRSA bacteremia and endocarditis. For example, Ho et al28 reported using it in three patients who had endocarditis as a source of their persistent bacteremia. All three patients had resolution of their MRSA bloodstream infection following ceftaroline therapy. The dosage was 600 mg every 8 hours, which is higher than in the manufacturer’s prescribing information.
Lin et al29 reported using ceftaroline in five patients with either possible or probable endocarditis. Three of the five patients had clinical cure as defined by resolution or improvement of all signs and symptoms of infection, and not requiring further antimicrobial therapy.29
More data from clinical trials would be beneficial in defining ceftaroline’s role in treating endocarditis caused by susceptible microorganisms.
Osteomyelitis
In animal studies of osteomyelitis, ceftaroline exhibited activity against MRSA in infected bone and joint fluid. Compared with vancomycin and linezolid, ceftaroline was associated with more significant decreases in bacterial load in the infected joint fluid, bone marrow, and bone.30
Lin et al29 gave ceftaroline to two patients with bone and joint infections, both of whom had received other therapies that had failed. The doses of ceftaroline were higher than those recommended in the prescribing information; clinical cure was noted in both cases following the switch.
These data come from case series, and more study of ceftaroline’s role in the treatment of osteomyelitis infections is warranted.
Meningitis
The use of ceftaroline in meningitis has been studied in rabbits. While ceftaroline penetrated into the cerebrospinal fluid in only negligible amounts in healthy rabbits (3% penetration), its penetration improved to 15% in animals with inflamed meninges. Ceftaroline cerebrospinal fluid levels in inflamed meninges were sufficient to provide bactericidal activity against penicillin-sensitive and resistant S pneumoniae strains as well as K pneumoniae and E coli strains.31,32
REPORTED ADVERSE EFFECTS OF CEFTAROLINE
Overall, ceftaroline was well tolerated in clinical trials, and its safety profile was similar to those of the comparator agents (ceftriaxone and vancomycin-aztreonam).
As with the other cephalosporins, hypersensitivity reactions have been reported with ceftaroline. In the clinical trials, 3% of patients developed a rash with ceftaroline.33,34 Patients with a history of beta-lactam allergy were excluded from the trials, so the rate of cross-reactivity with penicillins and with other cephalosporins is unknown.
In the phase 3 clinical trials, gastrointestinal side effects including diarrhea (5%), nausea (4%), and vomiting (2%) were reported with ceftaroline. C difficile-associated diarrhea has also been reported.33
As with other cephalosporins, ceftaroline can cause a false-positive result on the Coombs test. Approximately 11% of ceftaroline-treated patients in phase 3 clinical trials had a positive Coombs test, but hemolytic anemia did not occur in any patients.33,34
Discontinuation of ceftaroline due to an adverse reaction was reported in 2.7% of patients receiving the drug during phase 3 trials, compared with 3.7% with comparator agents.
WHEN SHOULD CEFTAROLINE BE USED IN DAILY PRACTICE?
Ceftaroline has been shown to be at least as effective as ceftriaxone in treating community-acquired bacterial pneumonia, and at least as effective as vancomycin-aztreonam in treating acute bacterial skin and skin-structure infections. The 2014 Infectious Diseases Society of America’s guidelines for the diagnosis and management of skin and soft-tissue infections recommend ceftaroline as an option for empiric therapy for purulent skin and soft-tissue infections.35
The guidelines on community-acquired pneumonia have not been updated since 2007, which was before ceftaroline was approved. However, these guidelines are currently undergoing revision and may provide insight on ceftaroline’s place in the treatment of community-acquired bacterial pneumonia.36
Currently, ceftaroline’s routine use for these indications should be balanced by its higher cost ($150 for a 600-mg dose) compared with ceftriaxone ($5 for a 1-g dose) or vancomycin ($25 for a 1-g dose). The drug’s in vitro activity against drug-resistant pneumococci and S aureus, including MRSA, hVISA, and VISA may help fill an unmet need or provide a safer and more tolerable alternative to currently available therapies.
However, ceftaroline’s lack of activity against P aeruginosa and carbapenem-resistant Enterobacteriaceae does not meet the public health threat needs stemming from these multidrug-resistant microorganisms. Ongoing clinical trials in patients with more serious MRSA infections will provide important information about ceftaroline’s role as an anti-MRSA agent.
While the discovery of antimicrobials has had one of the greatest impacts on medicine, continued antibiotic use is threatened by the emergence of drug-resistant pathogens. Therefore, it is as important as ever to be good stewards of our currently available antimicrobials. Developing usage and dosing criteria for antimicrobials based on available data and literature is a step forward in optimizing the use of antibiotics—a precious medical resource.
- Infectious Diseases Society of America. The 10 x ‘20 Initiative: pursuing a global commitment to develop 10 new antibacterial drugs by 2020. Clin Infect Dis 2010; 50:1081–1083.
- Styers D, Sheehan DJ, Hogan P, Sahm DF. Laboratory-based surveillance of current antimicrobial resistance patterns and trends among Staphylococcus aureus: 2005 status in the United States. Ann Clin Microbiol Antimicrob 2006; 5:2.
- Farrell DJ, Castanheira M, Mendes RE, Sader HS, Jones RN. In vitro activity of ceftaroline against multidrug-resistant Staphylococcus aureus and Streptococcus pneumoniae: a review of published studies and the AWARE Surveillance Program (2008-2010). Clin Infect Dis 2012; 55(suppl 3):S206–S214.
- Holmes NE, Johnson PD, Howden BP. Relationship between vancomycin-resistant Staphylococcus aureus, vancomycin-intermediate S. aureus, high vancomycin MIC, and outcome in serious S. aureus infections. J Clin Microbiol 2012; 50:2548–2552.
- Lowy FD. Antimicrobial resistance: the example of Staphylococcus aureus. J Clin Invest 2003; 111:1265–1273.
- Jones RN, Sader HS, Mendes RE, Flamm RK. Update on antimicrobial susceptibility trends among Streptococcus pneumoniae in the United States: report of ceftaroline activity from the SENTRY Antimicrobial Surveillance Program (1998-2011). Diag Microbiol Infect Dis 2013; 75:107–109.
- Zapun A, Contreras-Martel C, Vernet T. Penicillin-binding proteins and beta-lactam resistance. FEMS Microbiol Rev 2008; 32:361–385.
- Centers for Disease Control and Prevention (CDC). Antibiotic resistance threats in the United States 2013. cdc.gov/drugresistance/threat-report-2013/pdf/ar-threats-2013-508.pdf. Accessed June 1, 2015.
- Moisan H, Pruneau M, Malouin F. Binding of ceftaroline to penicillin-binding proteins of Staphylococcus aureus and Streptococcus pneumoniae. J Antimicrob Chemother 2010; 65:713–716.
- Forest Laboratories, Inc. Teflaro® (ceftaroline fosamil): prescribing information. www.frx.com/pi/teflaro_pi.pdf. Accessed June 1, 2015.
- Richter SS, Heilmann KP, Dohrn CL, et al. Activity of ceftaroline and epidemiologic trends in Staphylococcus aureus isolates collected from 43 medical centers in the United States in 2009. Antimicrob Agents Chemother 2011; 55:4154–4160.
- Ge Y, Biek D, Talbot GH, Sahm DF. In vitro profiling of ceftaroline against a collection of recent bacterial clinical isolates from across the United States. Antimicrob Agents Chemother 2008; 52:3398–3407.
- Saravolatz L, Pawlak J, Johnson L. In vitro activity of ceftaroline against community-associated methicillin-resistant, vancomycin-intermediate, vancomycin-resistant, and daptomycin-nonsusceptible Staphylococcus aureus isolates. Antimicrob Agents Chemother 2010; 54:3027–3030.
- Mushtaq S, Livermore DM. AmpC induction by ceftaroline. J Antimicrob Chemother 2010; 65:586–588.
- Mendes RE, Tsakris A, Sader HS, et al. Characterization of methicillin-resistant Staphylococcus aureus displaying increased MICs of ceftaroline. J Antimicrob Chemother 2012; 67:1321–1324.
- Lodise TP, Low DE. Ceftaroline fosamil in the treatment of community-acquired bacterial pneumonia and acute bacterial skin and skin structure infections. Drugs 2012; 72:1473–1493.
- Riccobene TA, Su SF, Rank D. Single- and multiple-dose study to determine the safety, tolerability, and pharmacokinetics of ceftaroline fosamil in combination with avibactam in healthy subjects. Antimicrob Agents Chemother 2013; 57:1496–1504.
- US National Institutes of Health. ClinicalTrials.gov. Evaluation of ceftaroline fosamil versus a comparator in adult subjects with community-acquired bacterial pneumonia (CABP) with risk for methicillin-resistant Staphylococcus aureus. http://clinicaltrials.gov/ct2/show/NCT01645735. Accessed June 1, 2015.
- File TM Jr, Low DE, Eckburg PB, et al; FOCUS 1 investigators. FOCUS 1: a randomized, double-blinded, multicentre, phase III trial of the efficacy and safety of ceftaroline fosamil versus ceftriaxone in community-acquired pneumonia. J Antimicrob Chemother 2011; 66(suppl 3):iii19–iii32.
- Low DE, File TM Jr, Eckburg PB, et al; FOCUS 2 investigators. FOCUS 2: a randomized, double-blinded, multicentre, phase III trial of the efficacy and safety of ceftaroline fosamil versus ceftriaxone in community-acquired pneumonia. J Antimicrob Chemother 2011; 66(suppl 3):iii33–iii44.
- File TM Jr, Low DE, Eckburg PB, et al. Integrated analysis of FOCUS 1 and FOCUS 2: randomized, doubled-blinded, multicenter phase 3 trials of the efficacy and safety of ceftaroline fosamil versus ceftriaxone in patients with community-acquired pneumonia. Clin Infect Dis 2010; 51:1395–1405.
- Food and Drug Administration (FDA). Ceftaroline fosamil for the treatment of community-acquired bacterial pneumonia and complicated skin and skin structure infections. www.fda.gov/downloads/advisorycommittees/committeesmeetingmaterials/drugs/anti-infectivedrugsadvisorycommittee/ucm224656.pdf. Accessed June 1, 2015.
- Corey GR, Wilcox MH, Talbot GH, Thye D, Friedland D, Baculik T; CANVAS 1 investigators. CANVAS 1: the first phase III, randomized, double-blind study evaluating ceftaroline fosamil for the treatment of patients with complicated skin and skin structure infections. J Antimicrob Chemother 2010; 65(suppl 4):iv41–iv51.
- Wilcox MH, Corey GR, Talbot GH, Thye D, Friedland D, Baculik T; CANVAS 2 investigators. CANVAS 2: the second phase III, randomized, double-blind study evaluating ceftaroline fosamil for the treatment of patients with complicated skin and skin structure infections. J Antimicrob Chemother 2010; 65(suppl 4):iv53-iv65.
- Corey GR, Wilcox M, Talbot GH, et al. Integrated analysis of CANVAS 1 and 2: phase 3, multicenter, randomized, double-blind studies to evaluate the safety and efficacy of ceftaroline versus vancomycin plus aztreonam in complicated skin and skin-structure infection. Clin Infect Dis 2010; 51:641–650.
- Friedland HD, O’Neal T, Biek D, et al. CANVAS 1 and 2: analysis of clinical response at day 3 in two phase 3 trials of ceftaroline fosamil versus vancomycin plus aztreonam in treatment of acute bacterial skin and skin structure infections. Antimicrob Agents Chemother 2012; 56:2231–2236.
- Jacqueline C, Caillon J, Le Mabecque V, et al. In vivo efficacy of ceftaroline (PPI-0903), a new broad-spectrum cephalosporin, compared with linezolid and vancomycin against methicillin-resistant and vancomycin-intermediate Staphylococcus aureus in a rabbit endocarditis model. Antimicrob Agents Chemother 2007; 51:3397–3400.
- Ho TT, Cadena J, Childs LM, Gonzalez-Velez M, Lewis JS 2nd. Methicillin-resistant Staphylococcus aureus bacteraemia and endocarditis treated with ceftaroline salvage therapy. J Antimicrob Chemother 2012; 67:1267–1270.
- Lin JC, Aung G, Thomas A, Jahng M, Johns S, Fierer J. The use of ceftaroline fosamil in methicillin-resistant Staphylococcus aureus endocarditis and deep-seated MRSA infections: a retrospective case series of 10 patients. J Infect Chemother 2013; 19:42–49.
- Jacqueline C, Amador G, Caillon J, et al. Efficacy of the new cephalosporin ceftaroline in the treatment of experimental methicillin-resistant Staphylococcus aureus acute osteomyelitis. J Antimicrob Chemother 2010; 65:1749–1752.
- Stucki A, Acosta F, Cottagnoud M, Cottagnoud P. Efficacy of ceftaroline fosamil against Escherichia coli and Klebsiella pneumoniae strains in a rabbit meningitis model. Antimicrob Agents Chemother 2013; 57:5808–5810.
- Cottagnoud P, Cottagnoud M, Acosta F, Stucki A. Efficacy of ceftaroline fosamil against penicillin-sensitive and -resistant Streptococcus pneumoniae in an experimental rabbit meningitis model. Antimicrob Agents Chemother 2013; 57:4653–4655.
- Corrado ML. Integrated safety summary of CANVAS 1 and 2 trials: phase III, randomized, double-blind studies evaluating ceftaroline fosamil for the treatment of patients with complicated skin and skin structure infections. J Antimicrob Chemother 2010; 65(suppl 4):iv67–iv71.
- Rank DR, Friedland HD, Laudano JB. Integrated safety summary of FOCUS 1 and FOCUS 2 trials: phase III randomized, double-blind studies evaluating ceftaroline fosamil for the treatment of patients with community-acquired pneumonia. J Antimicrob Chemother 2011; 66(suppl 3):iii53–iii59.
- Stevens DL, Bisno AL, Chambers HF, et al. Practice guidelines for the diagnosis and management of skin and soft tissue infections: 2014 update by the Infectious Diseases Society of America. Clin Infect Dis 2014; 59:147–159.
- Mandell LA, Wunderink RG, Anzueto A, et al; Infectious Diseases Society of America; American Thoracic Society. Infectious Diseases Society of America/American Thoracic Society consensus guidelines on the management of community-acquired pneumonia in adults. Clin Infect Dis 2007; 44:S27–S72.
Ceftaroline fosamil (Teflaro), introduced to the US market in October 2010, is the first beta-lactam agent with clinically useful activity against methicillin-resistant Staphylococcus aureus (MRSA). Currently, it is approved by the US Food and Drug Administration (FDA) to treat acute bacterial skin and skin-structure infections and community-acquired bacterial pneumonia caused by susceptible microorganisms.
In an era of increasing drug resistance and limited numbers of antimicrobials in the drug-production pipeline, ceftaroline is a step forward in fulfilling the Infectious Diseases Society of America’s “10 × ’20 Initiative” to increase support for drug research and manufacturing, with the goal of producing 10 new antimicrobial drugs by the year 2020.1 Ceftaroline was the first of several antibiotics to receive FDA approval in response to this initiative. It was followed by dalbavancin (May 2014), tedizolid phosphate (June 2014), oritavancin (August 2014), ceftolozane-tazobactam (December 2014), and ceftazidime-avibactam (February 2015). These antibiotic agents are aimed at treating infections caused by drug-resistant gram-positive and gram-negative microorganisms. It is important to understand and optimize the use of these new antibiotic agents in order to decrease the risk of emerging antibiotic resistance and superinfections (eg, Clostridium difficile infection) caused by antibiotic overuse or misuse.
This article provides an overview of ceftaroline’s mechanisms of action and resistance, spectrum of activity, pharmacokinetic properties, adverse effects, and current place in therapy.
AN ERA OF MULTIDRUG-RESISTANT MICROORGANISMS
Increasing rates of antimicrobial resistance threaten the efficacy of antimicrobial drugs in the daily practice of medicine. The World Health Organization has labeled antimicrobial resistance one of the three greatest threats to human health. Global efforts are under way to stimulate development of new antimicrobial agents and to decrease rates of antimicrobial resistance.
Staphylococcus aureus: A threat, even with vancomycin
Between 1998 and 2005, S aureus was one of the most common inpatient and outpatient isolates reported by clinical laboratories throughout the United States.2
Treatment of S aureus infection is complicated by a variety of resistance mechanisms that have evolved over time. In fact, the first resistant isolate of S aureus emerged not long after penicillin’s debut into clinical practice, and now the majority of strains are resistant to penicillin.
Methicillin was designed to overcome this beta-lactamase resistance and became the treatment of choice for penicillin-resistant S aureus isolates. However, MRSA isolates soon emerged because of the organism’s acquisition of penicillin-binding protein PBP2a via the mecA gene, leading to decreased binding affinity of methicillin.3
Since then, several agents active against MRSA (vancomycin, daptomycin, linezolid, tigecycline) have been introduced and continue to be widely used. While vancomycin is considered the first-line option for a variety of MRSA infections, its use has been threatened because of the emergence of vancomycin-intermediate-resistant S aureus (VISA), S aureus strains displaying vancomycin heteroresistance (hVISA), and vancomycin-resistant S aureus (VRSA) strains.4
VISA and hVISA isolates emerged through sequential mutations that lead to autolytic activity and cell-wall thickening. In contrast, the mechanism of resistance in VRSA is by acquisition of the vanA resistance gene, which alters the binding site of vancomycin from d-alanine-d-alanine to d-alanine-d-lactate.5
Streptococcus pneumoniae resistance: A continuing problem
The prevalence of drug resistance in S pneumoniae has risen since the late 1990s. A 2013 report from the SENTRY Antimicrobial Surveillance Program stated that almost 20% of S pneumoniae isolates were resistant to amoxicillin-clavulanate, and similar trends have been observed for penicillin (14.8%) and ceftriaxone (11.7%).6
S pneumoniae resistance is acquired through modifications of the penicillin-binding proteins, namely PBP1a, PBP2b, PBP2x, and, less frequently, PBP2a. These modifications lead to decreased binding affinity for most beta-lactams.7
Clinical impact of multidrug-resistant S aureus and S pneumoniae
In 2011, the US Centers for Disease Control and Prevention reported an estimated 80,000 severe MRSA infections and 11,000 MRSA-related deaths in the United States.8 In the same report, drug-resistant S pneumoniae was estimated to be responsible for almost 1.2 million illnesses and 7,000 deaths per year, leading to upwards of $96 million in related medical costs.
While invasive drug-resistant S pneumoniae infections usually affect patients at the extremes of age (under age 5 and over age 65), they have had a serious impact on patients of all ages.8
In light of the increasing prevalence of multidrug-resistant organisms, newer antimicrobial agents with novel mechanisms of action are needed.
CEFTAROLINE: A BETA-LACTAM WITH ANTI-MRSA ACTIVITY
The cephalosporins, a class of beta-lactam antibiotics, were originally derived from the fungus Cephalosporium (now called Acremonium). There are now many agents in this class, each containing a nucleus consisting of a beta-lactam ring fused to a six-member dihydrothiazine ring, and two side chains that can be modified to affect antibacterial activity and pharmacokinetic properties.
Cephalosporins are typically categorized into “generations.” With some exceptions, the first- and second-generation agents have good activity against gram-positive microorganisms, including methicillin-susceptible S aureus—but not against MRSA. The third- and fourth-generation cephalosporins have better gram-negative activity, with many agents having activity against the gram-negative bacterium Pseudomonas aeruginosa.
Enterococcal isolates are intrinsically resistant to cephalosporins. Additionally, cephalosporins are not active against anaerobic bacteria, except for a subset of structurally unique second-generation cephalosporins, ie, cefotetan and cefoxitin.
Ceftaroline was synthesized with specific manipulations of the side chains to provide enhanced activity against MRSA and multidrug-resistant S pneumoniae isolates, making it the first available beta-lactam with this ability.
Mechanism of action
Ceftaroline binds to penicillin-binding proteins, inhibiting transpeptidation. This interaction blocks the final stage of peptidoglycan synthesis and inhibits bacterial cell wall formation, ultimately leading to cellular autolysis and microorganism death. Ceftaroline binds with high affinity to PBP2a and PBP2x, expanding its activity to encompass MRSA and penicillin-resistant S pneumoniae isolates.9
Spectrum of activity
Ceftaroline has in vitro activity against many gram-positive and gram-negative bacteria,10–13 including (Table 1):
- Methicillin-susceptible and methicillin-resistant staphylococci
- VISA, VRSA, and hVISA
- Daptomycin-nonsusceptible S aureus
- Streptococcal species, including penicillin-resistant S pneumoniae
- Enterobacteriaceae, including Klebsiella pneumoniae, Klebsiella oxytoca, Escherichia coli, Citrobacter koseri, Citrobacter freundii, Enterobacter cloacae, Enterobacter aerogenes, Moraxella catarrhalis, Morganella morganii, and Proteus mirabilis.
Of note, ceftaroline is not active against Pseudomonas species, Enterococcus species, or Bacteroides fragilis. In addition, it is not active against the “atypical” respiratory pathogens Mycoplasma pneumoniae, Chlamydophila pneumoniae, and Legionella pneumophila.
Ceftaroline resistance
Gram-negative organisms appear to develop resistance to ceftaroline at rates similar to those observed with the other oxyimino-cephalosporins (eg, ceftriaxone). Ceftaroline is inactive against gram-negative organisms producing extended-spectrum beta-lactamases, including K pneumoniae carbapenemase and metallo-beta-lactamases.14 In addition, it induces the expression of AmpC beta-lactamases.
Although currently uncommon, resistance to ceftaroline has also been reported in S aureus strains.15 The mechanism of resistance is decreased binding affinity for PBP2a due to amino acid substitutions on the nonpenicillin-binding domains.15
Pharmacokinetic profile
An understanding of pharmacokinetics is key in optimizing the dose of antimicrobials so that the drugs are used most effectively and pathogens do not develop resistance to them.
Ceftaroline fosamil is a prodrug that, upon intravenous administration, is rapidly converted by phosphatase enzymes to its active moiety, ceftaroline. Its pharmacokinetic profile is summarized in Table 2.16,17 Its volume of distribution is similar to that of the fourth-generation cephalosporin cefepime.
Ceftaroline is then hydrolyzed into its inactive metabolite, ceftaroline M-1. It undergoes little hepatic metabolism and lacks properties to make it a substrate, inhibitor, or inducer of the CYP450 enzyme system and therefore is not likely to cause notable CYP450-related drug-drug interactions.
Like most other beta-lactams, ceftaroline is primarily excreted by the kidneys. Furthermore, an estimated 21% of a dose is eliminated with each intermittent hemodialysis session. Therefore, renal and intermittent hemodialysis dose adjustments are necessary. The estimated elimination half-life is 2.6 hours, necessitating dosing two to three times daily, depending on the indication and infectious inoculum.
Ceftaroline dosing
Ceftaroline is available only in a parenteral preparation and is typically given at a dose of 600 mg every 12 hours.10 The intravenous infusion is given over 1 hour.
The current stability data require reconstituted ceftaroline to be used within 6 hours at room temperature and within 24 hours if refrigerated.10
Ceftaroline requires dosing adjustments for patients with renal insufficiency. Per the manufacturer, renal dosing adjustments are based on the creatinine clearance rate, as estimated by the Cockroft-Gault formula:
- Creatinine clearance > 50 mL/min: no dosage adjustment necessary
- Creatinine clearance > 30 to ≤ 50 mL/min: give 400 mg every 12 hours
- Creatinine clearance ≥ 15 to ≤ 30 mL/min: give 300 mg every 12 hours
- Creatinine clearance < 15 mL/min or on intermittent dialysis: give 200 mg every 12 hours.
Ongoing clinical trials are investigating a higher-dosing strategy of 600 mg every 8 hours for patients with community-acquired bacterial pneumonia at risk of MRSA bacteremia.18
CLINICAL TRIALS LEADING TO CEFTAROLINE’S APPROVAL
Ceftaroline was approved for the treatment of community-acquired bacterial pneumonia and acute bacterial skin and skin-structure infections due to susceptible pathogens on the basis of phase 3 comparator trials.
Community-acquired bacterial pneumonia: The FOCUS 1 and 2 trials
The efficacy and safety of ceftaroline in the treatment of community-acquired bacterial pneumonia was studied in two randomized, double-blind, noninferiority trials, known as Ceftaroline Community-acquired Pneumonia vs Ceftriaxone (FOCUS) 1 and FOCUS 2.19,20
Patients were adults and not critically ill, as was reflected by their being in Pneumonia Outcomes Research Team (PORT) risk class III or IV (with class V indicating the highest risk of death). Therefore, the results may not be completely applicable to critically ill patients or those not admitted to the hospital. Of note, patients were excluded from the trials if they had infections known or thought to be due to MRSA or to atypical organisms.21 Baseline characteristics and patient demographics were similar between study groups in both trials.
A bacterial pathogen was identified in 26.1% of the patients included in the modified intent-to-treat analysis of the pooled data of the trials; the most common pathogens were S pneumoniae, methicillin-sensitive S aureus, Haemophilus influenzae, K pneumoniae, and E coli.21
Treatment. Patients received either ceftaroline 600 mg every 12 hours (or a lower dose based on renal function) or ceftriaxone 1 g every 24 hours. In addition, in the FOCUS 1 trial, patients in both treatment groups received clarithromycin 500 mg every 12 hours for the first day.19
Results. In both trials and in the integrated analysis, ceftaroline was noninferior to ceftriaxone (Table 3).22 In the integrated analysis of both trials, compared with the ceftriaxone group, the ceftaroline group had a higher clinical cure rate among patients classified as PORT risk class III (86.8% vs 79.2%, weighted treatment difference 12.6%, 95% confidence interval [CI] 1.3–13.8) and among patients who had not received prior antibiotic treatment (85.5% vs 74.9%, weighted treatment difference 11.2%, 95% CI 4.5–18.0).21
Acute bacterial skin and skin-structure infections: The CANVAS 1 and 2 trials
The efficacy and safety of ceftaroline in the treatment of complicated acute bacterial skin and skin-structure infections was studied in two randomized, double-blind trials: Ceftaroline Versus Vancomycin in Skin and Skin Structure Infections (CANVAS) 1 and CANVAS 2.23,24
Patients. Adult patients with a diagnosis of community-acquired skin and skin-structure infections warranting at least 5 days of intravenous antimicrobial therapy were included in the trials. Important protocol exclusions were patients with diabetic foot ulcers, decubitus ulcers, burns, ulcers associated with peripheral vascular disease accompanied by osteomyelitis, and suspected P aeruginosa infections.25 This limits the external validity of ceftaroline use in the aforementioned excluded patient populations.
Patients in each treatment group of the trials had similar demographic characteristics. The most common infections were cellulitis, major abscess requiring surgical intervention, wound infection, and infected ulcer. Bacteremia was present in 4.2% of patients in the ceftaroline group and in 3.8% of patients in the vancomycin-aztreonam group. The most common pathogen was S aureus. Methicillin resistance was present in 40% of the ceftaroline group and 34% of the control group.
Treatment. Patients received either ceftaroline 600 mg every 12 hours or the combination of vancomycin 1 g plus aztreonam 1 g given 12 hours, for 5 to 14 days.
Results. As assessed at a “test-of-cure” visit 8 to 15 days after the last dose of study medication, the efficacy of ceftaroline was similar to that of vancomycin-aztreonam, meeting the set noninferiority goal (Table 4).25 Moreover, if assessed on day 2 or 3 (a new end point recommended by the FDA), the rate of cessation of erythema spread and absence of fever was higher in the ceftaroline group than in the vancomycin-aztreonam group.26 However, this end point was not in the original trial protocol.
CEFTAROLINE FOR OTHER INDICATIONS
As noted, ceftaroline has been approved for treating community-acquired bacterial pneumonia and acute bacterial skin and skin-structure infections. In addition, it has been used in several studies in animals, and case reports of non-FDA approved indications including endocarditis and osteomyelitis have been published. Clinical trials are evaluating its use in pediatric patients, as well as for community-acquired bacterial pneumonia with risk for MRSA and for MRSA bacteremia.
Endocarditis
Animal studies have demonstrated ceftaroline to have bactericidal activity against MRSA and hVISA in endocarditis.27
A few case series have been published describing ceftaroline’s use as salvage therapy for persistent MRSA bacteremia and endocarditis. For example, Ho et al28 reported using it in three patients who had endocarditis as a source of their persistent bacteremia. All three patients had resolution of their MRSA bloodstream infection following ceftaroline therapy. The dosage was 600 mg every 8 hours, which is higher than in the manufacturer’s prescribing information.
Lin et al29 reported using ceftaroline in five patients with either possible or probable endocarditis. Three of the five patients had clinical cure as defined by resolution or improvement of all signs and symptoms of infection, and not requiring further antimicrobial therapy.29
More data from clinical trials would be beneficial in defining ceftaroline’s role in treating endocarditis caused by susceptible microorganisms.
Osteomyelitis
In animal studies of osteomyelitis, ceftaroline exhibited activity against MRSA in infected bone and joint fluid. Compared with vancomycin and linezolid, ceftaroline was associated with more significant decreases in bacterial load in the infected joint fluid, bone marrow, and bone.30
Lin et al29 gave ceftaroline to two patients with bone and joint infections, both of whom had received other therapies that had failed. The doses of ceftaroline were higher than those recommended in the prescribing information; clinical cure was noted in both cases following the switch.
These data come from case series, and more study of ceftaroline’s role in the treatment of osteomyelitis infections is warranted.
Meningitis
The use of ceftaroline in meningitis has been studied in rabbits. While ceftaroline penetrated into the cerebrospinal fluid in only negligible amounts in healthy rabbits (3% penetration), its penetration improved to 15% in animals with inflamed meninges. Ceftaroline cerebrospinal fluid levels in inflamed meninges were sufficient to provide bactericidal activity against penicillin-sensitive and resistant S pneumoniae strains as well as K pneumoniae and E coli strains.31,32
REPORTED ADVERSE EFFECTS OF CEFTAROLINE
Overall, ceftaroline was well tolerated in clinical trials, and its safety profile was similar to those of the comparator agents (ceftriaxone and vancomycin-aztreonam).
As with the other cephalosporins, hypersensitivity reactions have been reported with ceftaroline. In the clinical trials, 3% of patients developed a rash with ceftaroline.33,34 Patients with a history of beta-lactam allergy were excluded from the trials, so the rate of cross-reactivity with penicillins and with other cephalosporins is unknown.
In the phase 3 clinical trials, gastrointestinal side effects including diarrhea (5%), nausea (4%), and vomiting (2%) were reported with ceftaroline. C difficile-associated diarrhea has also been reported.33
As with other cephalosporins, ceftaroline can cause a false-positive result on the Coombs test. Approximately 11% of ceftaroline-treated patients in phase 3 clinical trials had a positive Coombs test, but hemolytic anemia did not occur in any patients.33,34
Discontinuation of ceftaroline due to an adverse reaction was reported in 2.7% of patients receiving the drug during phase 3 trials, compared with 3.7% with comparator agents.
WHEN SHOULD CEFTAROLINE BE USED IN DAILY PRACTICE?
Ceftaroline has been shown to be at least as effective as ceftriaxone in treating community-acquired bacterial pneumonia, and at least as effective as vancomycin-aztreonam in treating acute bacterial skin and skin-structure infections. The 2014 Infectious Diseases Society of America’s guidelines for the diagnosis and management of skin and soft-tissue infections recommend ceftaroline as an option for empiric therapy for purulent skin and soft-tissue infections.35
The guidelines on community-acquired pneumonia have not been updated since 2007, which was before ceftaroline was approved. However, these guidelines are currently undergoing revision and may provide insight on ceftaroline’s place in the treatment of community-acquired bacterial pneumonia.36
Currently, ceftaroline’s routine use for these indications should be balanced by its higher cost ($150 for a 600-mg dose) compared with ceftriaxone ($5 for a 1-g dose) or vancomycin ($25 for a 1-g dose). The drug’s in vitro activity against drug-resistant pneumococci and S aureus, including MRSA, hVISA, and VISA may help fill an unmet need or provide a safer and more tolerable alternative to currently available therapies.
However, ceftaroline’s lack of activity against P aeruginosa and carbapenem-resistant Enterobacteriaceae does not meet the public health threat needs stemming from these multidrug-resistant microorganisms. Ongoing clinical trials in patients with more serious MRSA infections will provide important information about ceftaroline’s role as an anti-MRSA agent.
While the discovery of antimicrobials has had one of the greatest impacts on medicine, continued antibiotic use is threatened by the emergence of drug-resistant pathogens. Therefore, it is as important as ever to be good stewards of our currently available antimicrobials. Developing usage and dosing criteria for antimicrobials based on available data and literature is a step forward in optimizing the use of antibiotics—a precious medical resource.
- Infectious Diseases Society of America. The 10 x ‘20 Initiative: pursuing a global commitment to develop 10 new antibacterial drugs by 2020. Clin Infect Dis 2010; 50:1081–1083.
- Styers D, Sheehan DJ, Hogan P, Sahm DF. Laboratory-based surveillance of current antimicrobial resistance patterns and trends among Staphylococcus aureus: 2005 status in the United States. Ann Clin Microbiol Antimicrob 2006; 5:2.
- Farrell DJ, Castanheira M, Mendes RE, Sader HS, Jones RN. In vitro activity of ceftaroline against multidrug-resistant Staphylococcus aureus and Streptococcus pneumoniae: a review of published studies and the AWARE Surveillance Program (2008-2010). Clin Infect Dis 2012; 55(suppl 3):S206–S214.
- Holmes NE, Johnson PD, Howden BP. Relationship between vancomycin-resistant Staphylococcus aureus, vancomycin-intermediate S. aureus, high vancomycin MIC, and outcome in serious S. aureus infections. J Clin Microbiol 2012; 50:2548–2552.
- Lowy FD. Antimicrobial resistance: the example of Staphylococcus aureus. J Clin Invest 2003; 111:1265–1273.
- Jones RN, Sader HS, Mendes RE, Flamm RK. Update on antimicrobial susceptibility trends among Streptococcus pneumoniae in the United States: report of ceftaroline activity from the SENTRY Antimicrobial Surveillance Program (1998-2011). Diag Microbiol Infect Dis 2013; 75:107–109.
- Zapun A, Contreras-Martel C, Vernet T. Penicillin-binding proteins and beta-lactam resistance. FEMS Microbiol Rev 2008; 32:361–385.
- Centers for Disease Control and Prevention (CDC). Antibiotic resistance threats in the United States 2013. cdc.gov/drugresistance/threat-report-2013/pdf/ar-threats-2013-508.pdf. Accessed June 1, 2015.
- Moisan H, Pruneau M, Malouin F. Binding of ceftaroline to penicillin-binding proteins of Staphylococcus aureus and Streptococcus pneumoniae. J Antimicrob Chemother 2010; 65:713–716.
- Forest Laboratories, Inc. Teflaro® (ceftaroline fosamil): prescribing information. www.frx.com/pi/teflaro_pi.pdf. Accessed June 1, 2015.
- Richter SS, Heilmann KP, Dohrn CL, et al. Activity of ceftaroline and epidemiologic trends in Staphylococcus aureus isolates collected from 43 medical centers in the United States in 2009. Antimicrob Agents Chemother 2011; 55:4154–4160.
- Ge Y, Biek D, Talbot GH, Sahm DF. In vitro profiling of ceftaroline against a collection of recent bacterial clinical isolates from across the United States. Antimicrob Agents Chemother 2008; 52:3398–3407.
- Saravolatz L, Pawlak J, Johnson L. In vitro activity of ceftaroline against community-associated methicillin-resistant, vancomycin-intermediate, vancomycin-resistant, and daptomycin-nonsusceptible Staphylococcus aureus isolates. Antimicrob Agents Chemother 2010; 54:3027–3030.
- Mushtaq S, Livermore DM. AmpC induction by ceftaroline. J Antimicrob Chemother 2010; 65:586–588.
- Mendes RE, Tsakris A, Sader HS, et al. Characterization of methicillin-resistant Staphylococcus aureus displaying increased MICs of ceftaroline. J Antimicrob Chemother 2012; 67:1321–1324.
- Lodise TP, Low DE. Ceftaroline fosamil in the treatment of community-acquired bacterial pneumonia and acute bacterial skin and skin structure infections. Drugs 2012; 72:1473–1493.
- Riccobene TA, Su SF, Rank D. Single- and multiple-dose study to determine the safety, tolerability, and pharmacokinetics of ceftaroline fosamil in combination with avibactam in healthy subjects. Antimicrob Agents Chemother 2013; 57:1496–1504.
- US National Institutes of Health. ClinicalTrials.gov. Evaluation of ceftaroline fosamil versus a comparator in adult subjects with community-acquired bacterial pneumonia (CABP) with risk for methicillin-resistant Staphylococcus aureus. http://clinicaltrials.gov/ct2/show/NCT01645735. Accessed June 1, 2015.
- File TM Jr, Low DE, Eckburg PB, et al; FOCUS 1 investigators. FOCUS 1: a randomized, double-blinded, multicentre, phase III trial of the efficacy and safety of ceftaroline fosamil versus ceftriaxone in community-acquired pneumonia. J Antimicrob Chemother 2011; 66(suppl 3):iii19–iii32.
- Low DE, File TM Jr, Eckburg PB, et al; FOCUS 2 investigators. FOCUS 2: a randomized, double-blinded, multicentre, phase III trial of the efficacy and safety of ceftaroline fosamil versus ceftriaxone in community-acquired pneumonia. J Antimicrob Chemother 2011; 66(suppl 3):iii33–iii44.
- File TM Jr, Low DE, Eckburg PB, et al. Integrated analysis of FOCUS 1 and FOCUS 2: randomized, doubled-blinded, multicenter phase 3 trials of the efficacy and safety of ceftaroline fosamil versus ceftriaxone in patients with community-acquired pneumonia. Clin Infect Dis 2010; 51:1395–1405.
- Food and Drug Administration (FDA). Ceftaroline fosamil for the treatment of community-acquired bacterial pneumonia and complicated skin and skin structure infections. www.fda.gov/downloads/advisorycommittees/committeesmeetingmaterials/drugs/anti-infectivedrugsadvisorycommittee/ucm224656.pdf. Accessed June 1, 2015.
- Corey GR, Wilcox MH, Talbot GH, Thye D, Friedland D, Baculik T; CANVAS 1 investigators. CANVAS 1: the first phase III, randomized, double-blind study evaluating ceftaroline fosamil for the treatment of patients with complicated skin and skin structure infections. J Antimicrob Chemother 2010; 65(suppl 4):iv41–iv51.
- Wilcox MH, Corey GR, Talbot GH, Thye D, Friedland D, Baculik T; CANVAS 2 investigators. CANVAS 2: the second phase III, randomized, double-blind study evaluating ceftaroline fosamil for the treatment of patients with complicated skin and skin structure infections. J Antimicrob Chemother 2010; 65(suppl 4):iv53-iv65.
- Corey GR, Wilcox M, Talbot GH, et al. Integrated analysis of CANVAS 1 and 2: phase 3, multicenter, randomized, double-blind studies to evaluate the safety and efficacy of ceftaroline versus vancomycin plus aztreonam in complicated skin and skin-structure infection. Clin Infect Dis 2010; 51:641–650.
- Friedland HD, O’Neal T, Biek D, et al. CANVAS 1 and 2: analysis of clinical response at day 3 in two phase 3 trials of ceftaroline fosamil versus vancomycin plus aztreonam in treatment of acute bacterial skin and skin structure infections. Antimicrob Agents Chemother 2012; 56:2231–2236.
- Jacqueline C, Caillon J, Le Mabecque V, et al. In vivo efficacy of ceftaroline (PPI-0903), a new broad-spectrum cephalosporin, compared with linezolid and vancomycin against methicillin-resistant and vancomycin-intermediate Staphylococcus aureus in a rabbit endocarditis model. Antimicrob Agents Chemother 2007; 51:3397–3400.
- Ho TT, Cadena J, Childs LM, Gonzalez-Velez M, Lewis JS 2nd. Methicillin-resistant Staphylococcus aureus bacteraemia and endocarditis treated with ceftaroline salvage therapy. J Antimicrob Chemother 2012; 67:1267–1270.
- Lin JC, Aung G, Thomas A, Jahng M, Johns S, Fierer J. The use of ceftaroline fosamil in methicillin-resistant Staphylococcus aureus endocarditis and deep-seated MRSA infections: a retrospective case series of 10 patients. J Infect Chemother 2013; 19:42–49.
- Jacqueline C, Amador G, Caillon J, et al. Efficacy of the new cephalosporin ceftaroline in the treatment of experimental methicillin-resistant Staphylococcus aureus acute osteomyelitis. J Antimicrob Chemother 2010; 65:1749–1752.
- Stucki A, Acosta F, Cottagnoud M, Cottagnoud P. Efficacy of ceftaroline fosamil against Escherichia coli and Klebsiella pneumoniae strains in a rabbit meningitis model. Antimicrob Agents Chemother 2013; 57:5808–5810.
- Cottagnoud P, Cottagnoud M, Acosta F, Stucki A. Efficacy of ceftaroline fosamil against penicillin-sensitive and -resistant Streptococcus pneumoniae in an experimental rabbit meningitis model. Antimicrob Agents Chemother 2013; 57:4653–4655.
- Corrado ML. Integrated safety summary of CANVAS 1 and 2 trials: phase III, randomized, double-blind studies evaluating ceftaroline fosamil for the treatment of patients with complicated skin and skin structure infections. J Antimicrob Chemother 2010; 65(suppl 4):iv67–iv71.
- Rank DR, Friedland HD, Laudano JB. Integrated safety summary of FOCUS 1 and FOCUS 2 trials: phase III randomized, double-blind studies evaluating ceftaroline fosamil for the treatment of patients with community-acquired pneumonia. J Antimicrob Chemother 2011; 66(suppl 3):iii53–iii59.
- Stevens DL, Bisno AL, Chambers HF, et al. Practice guidelines for the diagnosis and management of skin and soft tissue infections: 2014 update by the Infectious Diseases Society of America. Clin Infect Dis 2014; 59:147–159.
- Mandell LA, Wunderink RG, Anzueto A, et al; Infectious Diseases Society of America; American Thoracic Society. Infectious Diseases Society of America/American Thoracic Society consensus guidelines on the management of community-acquired pneumonia in adults. Clin Infect Dis 2007; 44:S27–S72.
KEY POINTS
- Resistance of S aureus and S pneumoniae to multiple antimicrobial drugs is on the rise, and new agents are urgently needed.
- Ceftaroline’s molecular structure was designed to provide enhanced activity against MRSA and multidrug-resistant S pneumoniae.
- In clinical trials leading to its approval, ceftaroline was found to be at least as effective as ceftriaxone in treating community-acquired pneumonia and at least as effective as vancomycin plus aztreonam in treating acute bacterial skin and skin-structure infections.
- The routine use of ceftaroline for these indications should be balanced by its higher cost compared with ceftriaxone or vancomycin. Ongoing studies should shed more light on its role in treatment.

Antimicrobial Dosing for Empiric and Documented Pseudomonas
Pseudomonas is a genus of aerobic, Gram-negative bacilli consisting of about 200 species. Pseudomonas aeruginosa (P aeruginosa) is the species most commonly associated with serious hospital-acquired infections and is commonly found in moist environments in hospitals, such as sinks, showers, and machinery/equipment. The symptoms of an infection by this bacterium are variable based on the site of infection and can manifest in various sites, such as the respiratory tract, urinary tract, ears, eyes, heart, skin, and soft tissue.1 General risk factors for infection with P aeruginosa include immunosuppression, history of lung disease, hospitalization lasting at least 5 days, history of repeated antibiotic use within 90 days, and a history of pseudomonal colonization/infection.
Related: Antibiotic Therapy and Bacterial Resistance in Patients With Spinal Cord Injury
Pseudomonas aeruginosa is a challenging organism to manage, as it is inherently resistant to many antibiotics. Furthermore, antibiotics effective against infections caused by P aeruginosa often require specific regimens as a result of the high minimum inhibitory concentration (MIC) of the organism. Two specific strategies that have been analyzed for proper coverage of P aeruginosa include the use of higher than usual doses and extended infusions. Due to significant challenges associated with obtaining patient outcomes data in human clinical trials, researchers often use Monte Carlo simulations, which are computational algorithms that simulate the variables of a study (ie, patient demographics) to be as real as possible to accurately predict therapeutic responses in patients.
Analyzing pharmacokinetic (PK) and pharmacodynamic (PD) indexes is valuable for determining therapeutic efficacy, as these indexes consider both the antibiotic dose/concentration and its effect over time in relation to response to therapy. The free-drug area under the concentration time curve (fAUC/MIC) ratio is a PK/PD value commonly used to describe the free-drug concentration over 24 hours that is above the MIC.2 The fAUC is dependent on creatinine clearance (CrCl) and, therefore, is specific to each patient. A threshold value for the fAUC/MIC is determined for an antibiotic, and a therapeutic regimen is dosed accordingly to assure fAUC/MIC attainment above the minimum threshold. The probability of target attainment (PTA), which is the probability that the threshold value of a PD index is achieved at a certain MIC, and the probability of cure (POC) for a given antibiotic regimen are used to determine the efficacy of an antibiotic in Monte Carlo simulations.2
Related: Bacteremia From an Unlikely Source
A study by Zelenitsky and colleagues evaluated the efficacy of 3 ciprofloxacin dosing regimens using Monte Carlo simulations (400 mg IV every 12 hours [standard dose], 400 mg IV every 8 hours [high dose], and a PD-targeted regimen dosed to attain an fAUC/MIC value > 86).3 An fAUC/MIC value of 86 was previously determined to predict cure rates of at least 90%.4 The Clinical and Laboratory Standards Institute defines a P aeruginosa MIC of ≤ 1 μg/mL to be susceptible and an MIC of ≥ 4 μg/mL to be resistant to ciprofloxacin.5
The researchers determined PTA and POC values for each regimen based on various MICs. The in vitro laboratory simulations revealed the PTA and POC values approached 100% for all 3 regimens when the MIC was 0.125 μg/mL. However, when the MIC was 1 μg/mL, the PTA for the standard and high dose was 0%, and the PD-targeted regimen was 40%. The POC was 27%, 40%, and 72% for the standard dose, high dose, and the PD-targeted regimen, respectively. Although the PD-targeted regimen was the most efficacious, it took doses exceeding 1,300 mg and 1,800 mg daily to achieve similar results. In addition, PD-targeted regimens are not practical for dosing due to patient variability in CrCl. From these simulations, it was concluded that the high dose of ciprofloxacin 400 mg IV every 8 hours should be recommended for treating Pseudomonas infections in patients with normal renal function.
Related: Antimicrobial Stewardship in an Outpatient Parenteral Antibiotic Therapy Program
In another study by Lodise and colleagues, researchers examined the clinical implications of an extended-infusion dosing strategy for piperacillin-tazobactam in the critically ill.6 The 2 piperacillin- tazobactam regimens evaluated were 3.375 g IV over 30 minutes given every 4 or 6 hours and 3.375 g IV over 4 hours given every 8 hours. The 14-day mortality rate in critically ill patients who received the extended- and intermittent-infusion regimens was 12.2% and 31.6%, respectively (P = .04). Additionally, patients receiving the extended-infusion regimen had a decreased in-house length of stay compared with the intermittent-infusion group (21 vs 38 days, P = .02). Despite having a lower drug concentration peak, the extended-infusion regimen maintains steady drug concentrations above the MIC for a greater period, resulting in prolonged therapeutic efficacy. Other antibiotics (cefepime7 and ceftazidime8) have been studied by using the same methodology of comparing intermittent and extended infusions and have had similar results.
Given the management challenges associated with P aeruginosa infections, it is important for clinicians to recognize patients who may have or be at risk of infection with P aeruginosa and use appropriate dosing regimens to effectively manage infections and improve patient outcomes.
Additional Note
An earlier version of this article appeared in the Pharmacy Related Newsletter: The Capsule, of the William S. Middleton Memorial Veterans Hospital.
Author disclosures
The authors report no actual or potential conflicts of interest with regard to this article.
Disclaimer
The opinions expressed herein are those of the authors and do not necessarily reflect those of Federal Practitioner, Frontline Medical Communications Inc., the U.S. Government, or any of its agencies. This article may discuss unlabeled or investigational use of certain drugs. Please review complete prescribing information for specific drugs or drug combinations—including indications, contraindications, warnings, and adverse effects—before administering pharmacologic therapy to patients.
1. Murray PR, Pfaller MA, Rosenthal KS. Medical Microbiology. 7th ed. Philadelphia, PA: Elsevier; 2012.
2. Mouton JW, Dudley MN, Cars O, Derendorf H, Drusano GL. Standardization of pharmacokinetic/pharmacodynamic (PK/PD) terminology for anti-infective drugs: an update. J Antimicrob Chemother. 2005;55(5):601-607.
3. Zelenitsky S, Ariano R, Harding G, Forrest A. Evaluating ciprofloxacin dosing for Pseudomonas aeruginosa infection by using clinical outcome-based Monte Carlo simulations. Antimicrob Agents Chemother. 2005;49(10):4009-4014.
4. Zelenitsky SA, Harding GK, Sun S, Ubhi K, Ariano RE. Treatment and outcome of Pseudomonas aeruginosa bacteraemia: an antibiotic pharmacodynamic analysis. J Antimicrob Chemother. 2003;52(4):668-674.
5. Clinical and Laboratory Standards Institute. Performance Standards for Antimicrobial Susceptibility Testing; Twenty-Third Informational Supplement. CLSI document M100-S23. Wayne, PA: Clinical and Laboratory Standards Institute; 2013:63.
6. Lodise TP Jr, Lomaestro B, Drusano GL. Piperacillin-tazobactam for Pseudomonas aeruginosa infection: clinical implications of an extended-infusion dosing strategy. Clin Infect Dis. 2007;44(3):357-363.
7. Mouton JW, Den Hollander JG. Killing of Pseudomonas aeruginosa during continuous and intermittent infusion of ceftazidime in an in vitro pharmacokinetic model. Antimicrob Agents Chemother. 1994;38(5):931-936
8. Bauer KA, West JE, O’Brien JM, Goff DA. Extended-infusion cefepime reduces mortality in patients with Pseudomonas aeruginosa infections. Antimicrob Agents Chemother. 2013;57(7):2907-2912.
Pseudomonas is a genus of aerobic, Gram-negative bacilli consisting of about 200 species. Pseudomonas aeruginosa (P aeruginosa) is the species most commonly associated with serious hospital-acquired infections and is commonly found in moist environments in hospitals, such as sinks, showers, and machinery/equipment. The symptoms of an infection by this bacterium are variable based on the site of infection and can manifest in various sites, such as the respiratory tract, urinary tract, ears, eyes, heart, skin, and soft tissue.1 General risk factors for infection with P aeruginosa include immunosuppression, history of lung disease, hospitalization lasting at least 5 days, history of repeated antibiotic use within 90 days, and a history of pseudomonal colonization/infection.
Related: Antibiotic Therapy and Bacterial Resistance in Patients With Spinal Cord Injury
Pseudomonas aeruginosa is a challenging organism to manage, as it is inherently resistant to many antibiotics. Furthermore, antibiotics effective against infections caused by P aeruginosa often require specific regimens as a result of the high minimum inhibitory concentration (MIC) of the organism. Two specific strategies that have been analyzed for proper coverage of P aeruginosa include the use of higher than usual doses and extended infusions. Due to significant challenges associated with obtaining patient outcomes data in human clinical trials, researchers often use Monte Carlo simulations, which are computational algorithms that simulate the variables of a study (ie, patient demographics) to be as real as possible to accurately predict therapeutic responses in patients.
Analyzing pharmacokinetic (PK) and pharmacodynamic (PD) indexes is valuable for determining therapeutic efficacy, as these indexes consider both the antibiotic dose/concentration and its effect over time in relation to response to therapy. The free-drug area under the concentration time curve (fAUC/MIC) ratio is a PK/PD value commonly used to describe the free-drug concentration over 24 hours that is above the MIC.2 The fAUC is dependent on creatinine clearance (CrCl) and, therefore, is specific to each patient. A threshold value for the fAUC/MIC is determined for an antibiotic, and a therapeutic regimen is dosed accordingly to assure fAUC/MIC attainment above the minimum threshold. The probability of target attainment (PTA), which is the probability that the threshold value of a PD index is achieved at a certain MIC, and the probability of cure (POC) for a given antibiotic regimen are used to determine the efficacy of an antibiotic in Monte Carlo simulations.2
Related: Bacteremia From an Unlikely Source
A study by Zelenitsky and colleagues evaluated the efficacy of 3 ciprofloxacin dosing regimens using Monte Carlo simulations (400 mg IV every 12 hours [standard dose], 400 mg IV every 8 hours [high dose], and a PD-targeted regimen dosed to attain an fAUC/MIC value > 86).3 An fAUC/MIC value of 86 was previously determined to predict cure rates of at least 90%.4 The Clinical and Laboratory Standards Institute defines a P aeruginosa MIC of ≤ 1 μg/mL to be susceptible and an MIC of ≥ 4 μg/mL to be resistant to ciprofloxacin.5
The researchers determined PTA and POC values for each regimen based on various MICs. The in vitro laboratory simulations revealed the PTA and POC values approached 100% for all 3 regimens when the MIC was 0.125 μg/mL. However, when the MIC was 1 μg/mL, the PTA for the standard and high dose was 0%, and the PD-targeted regimen was 40%. The POC was 27%, 40%, and 72% for the standard dose, high dose, and the PD-targeted regimen, respectively. Although the PD-targeted regimen was the most efficacious, it took doses exceeding 1,300 mg and 1,800 mg daily to achieve similar results. In addition, PD-targeted regimens are not practical for dosing due to patient variability in CrCl. From these simulations, it was concluded that the high dose of ciprofloxacin 400 mg IV every 8 hours should be recommended for treating Pseudomonas infections in patients with normal renal function.
Related: Antimicrobial Stewardship in an Outpatient Parenteral Antibiotic Therapy Program
In another study by Lodise and colleagues, researchers examined the clinical implications of an extended-infusion dosing strategy for piperacillin-tazobactam in the critically ill.6 The 2 piperacillin- tazobactam regimens evaluated were 3.375 g IV over 30 minutes given every 4 or 6 hours and 3.375 g IV over 4 hours given every 8 hours. The 14-day mortality rate in critically ill patients who received the extended- and intermittent-infusion regimens was 12.2% and 31.6%, respectively (P = .04). Additionally, patients receiving the extended-infusion regimen had a decreased in-house length of stay compared with the intermittent-infusion group (21 vs 38 days, P = .02). Despite having a lower drug concentration peak, the extended-infusion regimen maintains steady drug concentrations above the MIC for a greater period, resulting in prolonged therapeutic efficacy. Other antibiotics (cefepime7 and ceftazidime8) have been studied by using the same methodology of comparing intermittent and extended infusions and have had similar results.
Given the management challenges associated with P aeruginosa infections, it is important for clinicians to recognize patients who may have or be at risk of infection with P aeruginosa and use appropriate dosing regimens to effectively manage infections and improve patient outcomes.
Additional Note
An earlier version of this article appeared in the Pharmacy Related Newsletter: The Capsule, of the William S. Middleton Memorial Veterans Hospital.
Author disclosures
The authors report no actual or potential conflicts of interest with regard to this article.
Disclaimer
The opinions expressed herein are those of the authors and do not necessarily reflect those of Federal Practitioner, Frontline Medical Communications Inc., the U.S. Government, or any of its agencies. This article may discuss unlabeled or investigational use of certain drugs. Please review complete prescribing information for specific drugs or drug combinations—including indications, contraindications, warnings, and adverse effects—before administering pharmacologic therapy to patients.
1. Murray PR, Pfaller MA, Rosenthal KS. Medical Microbiology. 7th ed. Philadelphia, PA: Elsevier; 2012.
2. Mouton JW, Dudley MN, Cars O, Derendorf H, Drusano GL. Standardization of pharmacokinetic/pharmacodynamic (PK/PD) terminology for anti-infective drugs: an update. J Antimicrob Chemother. 2005;55(5):601-607.
3. Zelenitsky S, Ariano R, Harding G, Forrest A. Evaluating ciprofloxacin dosing for Pseudomonas aeruginosa infection by using clinical outcome-based Monte Carlo simulations. Antimicrob Agents Chemother. 2005;49(10):4009-4014.
4. Zelenitsky SA, Harding GK, Sun S, Ubhi K, Ariano RE. Treatment and outcome of Pseudomonas aeruginosa bacteraemia: an antibiotic pharmacodynamic analysis. J Antimicrob Chemother. 2003;52(4):668-674.
5. Clinical and Laboratory Standards Institute. Performance Standards for Antimicrobial Susceptibility Testing; Twenty-Third Informational Supplement. CLSI document M100-S23. Wayne, PA: Clinical and Laboratory Standards Institute; 2013:63.
6. Lodise TP Jr, Lomaestro B, Drusano GL. Piperacillin-tazobactam for Pseudomonas aeruginosa infection: clinical implications of an extended-infusion dosing strategy. Clin Infect Dis. 2007;44(3):357-363.
7. Mouton JW, Den Hollander JG. Killing of Pseudomonas aeruginosa during continuous and intermittent infusion of ceftazidime in an in vitro pharmacokinetic model. Antimicrob Agents Chemother. 1994;38(5):931-936
8. Bauer KA, West JE, O’Brien JM, Goff DA. Extended-infusion cefepime reduces mortality in patients with Pseudomonas aeruginosa infections. Antimicrob Agents Chemother. 2013;57(7):2907-2912.