To the Editor: We read the review on enterovirus D681 (EV-D68) with great interest, and we thought it merited comment.
During the current influenza season, we have had several adult cases of EV-D68 presenting as an influenza-like illness. EV-D68 was diagnosed by nasal swab viral film array polymerase chain reaction (PCR) testing. We agree with the authors that the clinical spectrum of enteroviral infection includes a variety of extraintestinal manifestations, eg, acute pancreatitis. As more cases of EV-D68 are described, the range of clinical manifestations will be increased.2–5
We recently saw a 27-year-old woman who presented with an influenza-like illness, but with a main complaint of right-upper-quadrant abdominal pain. She denied recent travel or contacts with sick children or adults. Her past medical history was unremarkable, and she was not taking any medications. The physical examination was unremarkable except for moderately severe tenderness in the right upper quadrant, with no rebound or guarding.
Results of laboratory testing at hospital admission included a white blood cell count of 7.3 × 10⁹/L (49% neutrophils, 41% lymphocytes, 7% monocytes, 3% eosinophils), a normal platelet count, serum lipase 73 U/L (reference range 5.6–51.3 U/L), and serum amylase 211 U/L (37–121 U/L). Serum aminotransferase and alkaline phosphatase levels were normal. Abdominal ultrasonography was unremarkable. Nasal swab for multiplex PCR testing for respiratory viruses was positive for human rhinovirus-enterovirus. Further PCR testing was positive for EV-D68 (New York State Department of Health, Wadsworth Laboratory). Her abdominal pain was treated symptomatically; she gradually improved and was discharged.
This instance of EV-D68 in a healthy 27-year-old woman presenting with influenza-like illness and acute pain in the right upper quadrant is the first we have seen of EV-D68 presenting as acute pancreatitis. Clinicians should be aware that EV-D68, like influenza, may present with gastrointestinal manifestations.
References
Foster CB, Friedman N, Carl J, Piedimonte G. Enterovirus D68: a clinically important respiratory enterovirus. Cleve Clin J Med 2015; 82:26–31.
Tokarz R, Firth C, Madhi SA, et al. Worldwide emergence of multiple clades of enterovirus 68. J Gen Virol 2012; 93:1952–1958.
Oberste MS, Maher K, Schnurr D, et al. Enterovirus 68 is associated with respiratory illness and shares biological features with both the enteroviruses and the rhinoviruses. J Gen Virol 2004; 85:2577–2584.
Rahamat-Langendoen J, Riezebos-Brilman A, Borger R, et al. Upsurge of human enterovirus 68 infections in patients with severe respiratory tract infections. J Clin Virol 2011; 52:103–106.
Midgley CM, Jackson MA, Selvarangan R, et al. Severe respiratory illness associated with enterovirus D68 – Missouri and Illinois, 2014. MMWR 2014; 63:798–799.
Burke A. Cunha, MD Infectious Disease Division, Winthrop-University Hospital, Mineola, NY; State University of New York, School of Medicine, Stony Brook, NY
Gina Wu, MD Infectious Disease Division, Winthrop-University Hospital, Mineola, NY; State University of New York, School of Medicine, Stony Brook, NY
Marie Dumont, CIC Infectious Disease Division, Winthrop-University Hospital, Mineola, NY; State University of New York, School of Medicine, Stony Brook, NY
Eileen Abruzzo, RN, CIC Infectious Disease Division, Winthrop-University Hospital, Mineola, NY; State University of New York, School of Medicine, Stony Brook, NY
Muhammad Raza, MBBS Infectious Disease Division, Winthrop-University Hospital, Mineola, NY; State University of New York, School of Medicine, Stony Brook, NY
Author and Disclosure Information
Burke A. Cunha, MD Infectious Disease Division, Winthrop-University Hospital, Mineola, NY; State University of New York, School of Medicine, Stony Brook, NY
Gina Wu, MD Infectious Disease Division, Winthrop-University Hospital, Mineola, NY; State University of New York, School of Medicine, Stony Brook, NY
Marie Dumont, CIC Infectious Disease Division, Winthrop-University Hospital, Mineola, NY; State University of New York, School of Medicine, Stony Brook, NY
Eileen Abruzzo, RN, CIC Infectious Disease Division, Winthrop-University Hospital, Mineola, NY; State University of New York, School of Medicine, Stony Brook, NY
Muhammad Raza, MBBS Infectious Disease Division, Winthrop-University Hospital, Mineola, NY; State University of New York, School of Medicine, Stony Brook, NY
To the Editor: We read the review on enterovirus D681 (EV-D68) with great interest, and we thought it merited comment.
During the current influenza season, we have had several adult cases of EV-D68 presenting as an influenza-like illness. EV-D68 was diagnosed by nasal swab viral film array polymerase chain reaction (PCR) testing. We agree with the authors that the clinical spectrum of enteroviral infection includes a variety of extraintestinal manifestations, eg, acute pancreatitis. As more cases of EV-D68 are described, the range of clinical manifestations will be increased.2–5
We recently saw a 27-year-old woman who presented with an influenza-like illness, but with a main complaint of right-upper-quadrant abdominal pain. She denied recent travel or contacts with sick children or adults. Her past medical history was unremarkable, and she was not taking any medications. The physical examination was unremarkable except for moderately severe tenderness in the right upper quadrant, with no rebound or guarding.
Results of laboratory testing at hospital admission included a white blood cell count of 7.3 × 10⁹/L (49% neutrophils, 41% lymphocytes, 7% monocytes, 3% eosinophils), a normal platelet count, serum lipase 73 U/L (reference range 5.6–51.3 U/L), and serum amylase 211 U/L (37–121 U/L). Serum aminotransferase and alkaline phosphatase levels were normal. Abdominal ultrasonography was unremarkable. Nasal swab for multiplex PCR testing for respiratory viruses was positive for human rhinovirus-enterovirus. Further PCR testing was positive for EV-D68 (New York State Department of Health, Wadsworth Laboratory). Her abdominal pain was treated symptomatically; she gradually improved and was discharged.
This instance of EV-D68 in a healthy 27-year-old woman presenting with influenza-like illness and acute pain in the right upper quadrant is the first we have seen of EV-D68 presenting as acute pancreatitis. Clinicians should be aware that EV-D68, like influenza, may present with gastrointestinal manifestations.
References
Foster CB, Friedman N, Carl J, Piedimonte G. Enterovirus D68: a clinically important respiratory enterovirus. Cleve Clin J Med 2015; 82:26–31.
Tokarz R, Firth C, Madhi SA, et al. Worldwide emergence of multiple clades of enterovirus 68. J Gen Virol 2012; 93:1952–1958.
Oberste MS, Maher K, Schnurr D, et al. Enterovirus 68 is associated with respiratory illness and shares biological features with both the enteroviruses and the rhinoviruses. J Gen Virol 2004; 85:2577–2584.
Rahamat-Langendoen J, Riezebos-Brilman A, Borger R, et al. Upsurge of human enterovirus 68 infections in patients with severe respiratory tract infections. J Clin Virol 2011; 52:103–106.
Midgley CM, Jackson MA, Selvarangan R, et al. Severe respiratory illness associated with enterovirus D68 – Missouri and Illinois, 2014. MMWR 2014; 63:798–799.
To the Editor: I read with keen interest the high-quality review of the pathogenesis, diagnosis, and management of alcoholic hepatitis by Dugum et al.1 They clearly emphasized the high morbidity and mortality rates associated with this condition.
An important consideration for healthcare practitioners is that the presentation of alcoholic hepatitis can mimic an infectious process, eg, presenting with fever and an elevated white blood cell count. Indeed, clinicians should be vigilant and should routinely evaluate for an underlying infection in patients with suspected alcoholic hepatitis, because patients with liver disease are immunocompromised and several problems can potentially coexist in any given patient.
Therefore, clinicians should focus on the clinical history and examination (vital signs, mental status examination, presence of ascites) and should screen for common coinfections such as urinary tract infection and pneumonia with a white blood cell count with differential and other tests. Of particular importance, patients with ascites should undergo diagnostic abdominal paracentesis,2 and empiric antimicrobial therapy for spontaneous bacterial peritonitis should be considered on a case-by-case basis.3
References
Dugum M, Zein N, McCullough A, Hanouneh I. Alcoholic hepatitis: challenges in diagnosis and management. Cleve Clin J Med 2015; 82:226–236.
Runyon BA. Introduction to the revised American Association for the Study of Liver Diseases Practice Guideline management of adult patients with ascites due to cirrhosis 2012. Hepatology 2013; 57:1651–1653.
Lutz P, Nischalke HD, Strassburg CP, Spengler U. Spontaneous bacterial peritonitis: the clinical challenge of a leaky gut and a cirrhotic liver. World J Hepatol 2015; 7:304–314.
To the Editor: I read with keen interest the high-quality review of the pathogenesis, diagnosis, and management of alcoholic hepatitis by Dugum et al.1 They clearly emphasized the high morbidity and mortality rates associated with this condition.
An important consideration for healthcare practitioners is that the presentation of alcoholic hepatitis can mimic an infectious process, eg, presenting with fever and an elevated white blood cell count. Indeed, clinicians should be vigilant and should routinely evaluate for an underlying infection in patients with suspected alcoholic hepatitis, because patients with liver disease are immunocompromised and several problems can potentially coexist in any given patient.
Therefore, clinicians should focus on the clinical history and examination (vital signs, mental status examination, presence of ascites) and should screen for common coinfections such as urinary tract infection and pneumonia with a white blood cell count with differential and other tests. Of particular importance, patients with ascites should undergo diagnostic abdominal paracentesis,2 and empiric antimicrobial therapy for spontaneous bacterial peritonitis should be considered on a case-by-case basis.3
References
Dugum M, Zein N, McCullough A, Hanouneh I. Alcoholic hepatitis: challenges in diagnosis and management. Cleve Clin J Med 2015; 82:226–236.
Runyon BA. Introduction to the revised American Association for the Study of Liver Diseases Practice Guideline management of adult patients with ascites due to cirrhosis 2012. Hepatology 2013; 57:1651–1653.
Lutz P, Nischalke HD, Strassburg CP, Spengler U. Spontaneous bacterial peritonitis: the clinical challenge of a leaky gut and a cirrhotic liver. World J Hepatol 2015; 7:304–314.
In Reply: We thank Dr. Mirrakhimov for his interest in our article1 and for his comments on the importance of infection evaluation and treatment in patients with alcoholic hepatitis. We agree with the points he has raised and emphasized several of them in our article. We highlighted the need to evaluate for infections in these patients, as about a quarter of them are infected at the time of presentation.2
Importantly, patients with alcoholic hepatitis frequently have systemic inflammatory response syndrome criteria, which can be related to the overall inflammatory state of the disease itself or can reflect an active bacterial infection. Therefore, clinical monitoring for symptoms and signs of infection is crucial, and screening for infections is warranted on admission as well as repeatedly during the hospital stay for patients who experience clinical deterioration.3 Obtaining blood and urine cultures and performing paracentesis in patients with ascites to evaluate for bacterial peritonitis are required. Indeed, infections are a leading cause of death in patients with severe alcoholic hepatitis, both directly and indirectly by predisposing to multiorgan failure.4
Another factor to consider is the increased susceptibility to infection in these patients treated with corticosteroids. A study by Louvet et al2 showed that nonresponse to corticosteroids is the main factor contributing to the development of infection during treatment with corticosteroids, suggesting that infection is likely a consequence of the absence of improvement in liver function. More recently, results of the Steroids or Pentoxifylline for Alcoholic Hepatitis trial (which evaluated the treatment effect of prednisolone and pentoxifylline in the management of severe alcoholic hepatitis) showed that despite the higher rates of infections in patients treated with prednisolone, the mortality rates attributed to infections were similar across the treatment groups, regardless of whether prednisolone was administered.4
Finally, it is important to emphasize that criteria to initiate empiric antibiotics in patients with alcoholic hepatitis are currently lacking, and the decision to start antibiotics empirically in patients without a clear infection is largely based on the clinician’s assessment.
References
Dugum M, Zein N, McCullough A, Hanouneh I. Alcoholic hepatitis: challenges in diagnosis and management. Cleve Clin J Med 2015; 82:226–236.
Louvet A, Wartel F, Castel H, et al. Infection in patients with severe alcoholic hepatitis treated with steroids: early response to therapy is the key factor. Gastroenterology 2009; 137:541–548.
European Association for the Study of Liver. EASL clinical practical guidelines: management of alcoholic liver disease. J Hepatol 2012; 57:399–420.
Thursz MR, Richardson P, Allison M, et al. Prednisolone or pentoxifylline for alcoholic hepatitis. N Engl J Med 2015; 372:1619–1628.
In Reply: We thank Dr. Mirrakhimov for his interest in our article1 and for his comments on the importance of infection evaluation and treatment in patients with alcoholic hepatitis. We agree with the points he has raised and emphasized several of them in our article. We highlighted the need to evaluate for infections in these patients, as about a quarter of them are infected at the time of presentation.2
Importantly, patients with alcoholic hepatitis frequently have systemic inflammatory response syndrome criteria, which can be related to the overall inflammatory state of the disease itself or can reflect an active bacterial infection. Therefore, clinical monitoring for symptoms and signs of infection is crucial, and screening for infections is warranted on admission as well as repeatedly during the hospital stay for patients who experience clinical deterioration.3 Obtaining blood and urine cultures and performing paracentesis in patients with ascites to evaluate for bacterial peritonitis are required. Indeed, infections are a leading cause of death in patients with severe alcoholic hepatitis, both directly and indirectly by predisposing to multiorgan failure.4
Another factor to consider is the increased susceptibility to infection in these patients treated with corticosteroids. A study by Louvet et al2 showed that nonresponse to corticosteroids is the main factor contributing to the development of infection during treatment with corticosteroids, suggesting that infection is likely a consequence of the absence of improvement in liver function. More recently, results of the Steroids or Pentoxifylline for Alcoholic Hepatitis trial (which evaluated the treatment effect of prednisolone and pentoxifylline in the management of severe alcoholic hepatitis) showed that despite the higher rates of infections in patients treated with prednisolone, the mortality rates attributed to infections were similar across the treatment groups, regardless of whether prednisolone was administered.4
Finally, it is important to emphasize that criteria to initiate empiric antibiotics in patients with alcoholic hepatitis are currently lacking, and the decision to start antibiotics empirically in patients without a clear infection is largely based on the clinician’s assessment.
References
Dugum M, Zein N, McCullough A, Hanouneh I. Alcoholic hepatitis: challenges in diagnosis and management. Cleve Clin J Med 2015; 82:226–236.
Louvet A, Wartel F, Castel H, et al. Infection in patients with severe alcoholic hepatitis treated with steroids: early response to therapy is the key factor. Gastroenterology 2009; 137:541–548.
European Association for the Study of Liver. EASL clinical practical guidelines: management of alcoholic liver disease. J Hepatol 2012; 57:399–420.
Thursz MR, Richardson P, Allison M, et al. Prednisolone or pentoxifylline for alcoholic hepatitis. N Engl J Med 2015; 372:1619–1628.
A previously healthy 4-month-old girl was brought into the ED for concerns of alcohol ingestion. Reportedly, the infant’s father reconstituted 4 ounces of powdered formula using what he thought was water from an unmarked bottle in his refrigerator. He later realized that the bottle contained rum, although he still let the child finish the 4 ounces of formula in the hopes that she would vomit—which did not occur.
Upon arrival to the ED, the infant’s vital signs were: blood pressure, 100/61 mm Hg; heart rate, 155 beats/minute; respiratory rate, 36 breaths/minute; and temperature, normal. Oxygen saturation was 98% on room air. A rapid bedside blood glucose test was 89 mg/dL. The infant’s physical examination was unremarkable. She appeared active but hungry, had a strong cry, and had a developmentally appropriate gross neurological examination.
How does ethanol exposure in children typically occur?
Recent reports from the American Association of Poison Control Centers’ National Poison Data System demonstrate that ethanol exposures comprise 1% to 3% of total exposures in children aged ≤5 years.
The most common sources are ethanol-containing beverages, mouthwash, and cologne/perfume.1 Ethanol can also be found as a solvent for certain pediatric liquid medications (eg, ranitidine) or in flavor extracts (eg, vanilla extract, orange extract). Any clear alcohol (eg, vodka, gin, rum) stored in an accessible site, such as a refrigerator, may be mistaken for water. In many reports, a caregiver unintentionally used the alcohol to reconstitute formula; however, intentional provision of alcohol to toddlers, usually as a sedative, is a recurring concern.2
What are the clinical concerns in children with ethanol intoxication?
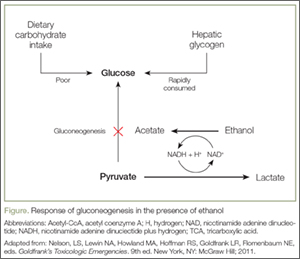
An understanding of the pathways of ethanol metabolism frames the key issues surrounding ethanol exposure in small children. Ethanol is metabolized in the liver primarily through sequential oxidation by alcohol-dehydrogenase (ADH) and aldehyde-dehydrogenase (ALDH), which reduce nicotinamide adenine dinucleotide (NAD+) to NAD plus hydrogen (NADH) in each step. The final product of this pathway, acetate, is then converted to acetyl coenzyme A (acetyl-CoA), which enters into the Krebs cycle for thiamine-dependent metabolism to carbon dioxide and water (Figure). With substantial exposures to ethanol, the accumulation of NADH creates an imbalance in the body’s reducing potential, resulting in metabolic disturbances such as alcoholic ketoacidosis.
Under usual conditions, a normal serum glucose concentration is maintained from ingested carbohydrates and via glycogenolysis of hepatic glycogen stores. Such glycogen reserves can sustain normal blood glucose concentrations for several hours in adults but for a shorter period in children. Once glycogen is depleted, as is common after an overnight fast, glucose can be generated through gluconeogenesis.
However, in the presence of ethanol (Figure), the excessive reducing potential (ie, NADH) that results from ethanol metabolism shunts pyruvate away from the gluconeogenic pathway (toward lactate), inhibiting glucose production. Unlike adults, children and infants, who have relatively low glycogen reserves, are at significant risk for hypoglycemia following ethanol exposure. This represents the largest contributor to morbidity and mortality of children with ethanol intoxication.3 Patients with hypoglycemia can have a highly variable clinical presentation including agitation, seizures, focality, or coma.4
Case Continuation
Intravenous (IV) access was obtained, and the patient was placed on a dextrose-containing fluid at 1.5 times the maintenance flow rate. Pertinent laboratory studies revealed a serum glucose level of 90 mg/dL, normal electrolyte panel, and an initial blood alcohol concentration of 337 mg/dL (approximately 30 minutes postingestion).
How do children with ethanol intoxication present?
While there is some variation in clinical effects among nontolerant adults, acute ethanol intoxication with a serum concentration >250 mg/dL is frequently associated with stupor, respiratory depression, and hypotension. A concentration >400 mg/dL may be associated with coma or apnea. Although similar clinical effects are expected in adolescents and children, infants often have counterintuitive clinical findings.
To date, eight cases of significant infant ethanol exposure exist in the literature (age range, 29 days to 9 months; ethanol concentration, 183-524 mg/dL). Respiratory depression was absent in all cases.5-9 In all but two cases, the neurological examination revealed only subtle decreases in interaction or tone. The remaining two children were described as obtunded and flaccid (ethanol levels, 405 mg/dL and 524 mg/dL, respectively) and were intubated for airway protection despite normal respiratory rates.7,10
The incongruence between the clinical findings (both the neurological examination and respiratory effects) and the ethanol concentration is difficult to explain. It may be due to age-related neurological immaturity or a limited ability to perform the required detailed neurological examinations in children. In particular, the relatively preserved level of consciousness, despite an otherwise coma-inducing ethanol concentration, is unique to infants. Accordingly, there should be a low threshold to check ethanol concentrations in infants presenting with apparent life-threatening events, altered mental status, decreased tone, or unexplained hypoglycemia or hypothermia.
What is the estimated time to sobriety in infants?
Ethanol is eliminated via a hepatic enzymatic oxidation pathway that becomes saturated at low serum levels. In nontolerant adults, this results in a zero-order kinetic elimination pattern with an ethanol elimination rate of approximately 20 mg/dL per hour. Anecdotally, it had been thought that children clear ethanol at roughly double this rate via unclear mechanisms. However, a review of published kinetic data suggests the actual rate of clearance may not differ substantially from adults (range, 19-34 mg/dL per hour).5-7,10,11
Case Conclusion
The patient was transferred to a tertiary care pediatric hospital for continued management, where the markedly elevated serum ethanol concentration was confirmed. She was maintained on a dextrose-containing IV fluid and observed overnight without development of any complications. Serial serum ethanol concentrations were performed and complete clearance was achieved approximately 20 hours postingestion, suggesting a metabolic rate of 16 mg/dL per hour. The infant was discharged home with supervision by child protective services.
Dr Boroughf is a toxicology fellow, department of emergency medicine, Albert Einstein Medical Center, Philadelphia, Pennsylvania. Dr Nelson, editor of “Case Studies in Toxicology,” is a professor in the department of emergency medicine and director of the medical toxicology fellowship program at the New York University School of Medicine and the New York City Poison Control Center. He is also associate editor, toxicology, of the EMERGENCY MEDICINE editorial board. Dr Henretig is an attending toxicologist, department of emergency medicine, Children’s Hospital of Philadelphia, Pennsylvania.
References
Mowry JB, Spyker DA, Cantilena LR Jr, Bailey JE, Ford M. 2012 Annual Report of the American Association of Poison Control Centers’ National Poison Data System (NPDS): 30th Annual Report. Clin Toxicol (Phila). 2013;51(10):949-1229.
Wood JN, Pecker LH, Russo ME, Henretig F, Christian CW. Evaluation and referral for child maltreatment in pediatric poisoning victims. Child Abuse Negl. 2012;36(4):362-369.
Lamminpää A. Alcohol intoxication in childhood and adolescence. Alcohol Alcohol. 1995;30(1):5-12.
Malouf R, Brust JC. Hypoglycemia: causes, neurological manifestations, and outcome. Ann Neurol.1985;17(5):421-430.
Chikava K, Lower DR, Frangiskakis SH, Sepulveda JL, Virji MA, Rao KN. Acute ethanol intoxication in a 7-month old-infant. Pediatr Dev Pathol. 2004;7(4):400-402.
Ford JB, Wayment MT, Albertson TE, Owen KP, Radke JB, Sutter ME. Elimination kinetics of ethanol in a 5-week-old infant and a literature review of infant ethanol pharmacokinetics. Case Rep Med. 2013;2013:250716. doi:10.1155/2013/250716
McCormick T, Levine M, Knox O, Claudius I. Ethanol ingestion in two infants under 2 months old: a previously unreported cause of ALTE. Pediatrics. 2013;131(2);e604-e607.
Fong HF, Muller AA. An unexpected clinical course in a 29-day-old infant with ethanol exposure. Pediatr Emerg Care. 2014;30(2):111-113.
Iyer SS, Haupt A, Henretig FM. Pick your poison: straight from the spring? Ped Emerg Care. 2009;25(3):194-196.
Edmunds SM, Ajizian SJ, Liguori A. Acute obtundation in a 9-month-old patient: ethanol ingestion. Pediatr Emerg Care. 2014;30(10):739-741.
Simon HK, Cox JM, Sucov A, Linakis JG. Serum ethanol clearance in intoxicated children and adolescents presenting to the ED. Acad Emerg Med. 1994;1(6):520-524.
A 4-month-old infant was brought to the ED by her father after a reported unintentional ethanol exposure.
A 4-month-old infant was brought to the ED by her father after a reported unintentional ethanol exposure.
Case
A previously healthy 4-month-old girl was brought into the ED for concerns of alcohol ingestion. Reportedly, the infant’s father reconstituted 4 ounces of powdered formula using what he thought was water from an unmarked bottle in his refrigerator. He later realized that the bottle contained rum, although he still let the child finish the 4 ounces of formula in the hopes that she would vomit—which did not occur.
Upon arrival to the ED, the infant’s vital signs were: blood pressure, 100/61 mm Hg; heart rate, 155 beats/minute; respiratory rate, 36 breaths/minute; and temperature, normal. Oxygen saturation was 98% on room air. A rapid bedside blood glucose test was 89 mg/dL. The infant’s physical examination was unremarkable. She appeared active but hungry, had a strong cry, and had a developmentally appropriate gross neurological examination.
How does ethanol exposure in children typically occur?
Recent reports from the American Association of Poison Control Centers’ National Poison Data System demonstrate that ethanol exposures comprise 1% to 3% of total exposures in children aged ≤5 years.
The most common sources are ethanol-containing beverages, mouthwash, and cologne/perfume.1 Ethanol can also be found as a solvent for certain pediatric liquid medications (eg, ranitidine) or in flavor extracts (eg, vanilla extract, orange extract). Any clear alcohol (eg, vodka, gin, rum) stored in an accessible site, such as a refrigerator, may be mistaken for water. In many reports, a caregiver unintentionally used the alcohol to reconstitute formula; however, intentional provision of alcohol to toddlers, usually as a sedative, is a recurring concern.2
What are the clinical concerns in children with ethanol intoxication?
An understanding of the pathways of ethanol metabolism frames the key issues surrounding ethanol exposure in small children. Ethanol is metabolized in the liver primarily through sequential oxidation by alcohol-dehydrogenase (ADH) and aldehyde-dehydrogenase (ALDH), which reduce nicotinamide adenine dinucleotide (NAD+) to NAD plus hydrogen (NADH) in each step. The final product of this pathway, acetate, is then converted to acetyl coenzyme A (acetyl-CoA), which enters into the Krebs cycle for thiamine-dependent metabolism to carbon dioxide and water (Figure). With substantial exposures to ethanol, the accumulation of NADH creates an imbalance in the body’s reducing potential, resulting in metabolic disturbances such as alcoholic ketoacidosis.
Under usual conditions, a normal serum glucose concentration is maintained from ingested carbohydrates and via glycogenolysis of hepatic glycogen stores. Such glycogen reserves can sustain normal blood glucose concentrations for several hours in adults but for a shorter period in children. Once glycogen is depleted, as is common after an overnight fast, glucose can be generated through gluconeogenesis.
However, in the presence of ethanol (Figure), the excessive reducing potential (ie, NADH) that results from ethanol metabolism shunts pyruvate away from the gluconeogenic pathway (toward lactate), inhibiting glucose production. Unlike adults, children and infants, who have relatively low glycogen reserves, are at significant risk for hypoglycemia following ethanol exposure. This represents the largest contributor to morbidity and mortality of children with ethanol intoxication.3 Patients with hypoglycemia can have a highly variable clinical presentation including agitation, seizures, focality, or coma.4
Case Continuation
Intravenous (IV) access was obtained, and the patient was placed on a dextrose-containing fluid at 1.5 times the maintenance flow rate. Pertinent laboratory studies revealed a serum glucose level of 90 mg/dL, normal electrolyte panel, and an initial blood alcohol concentration of 337 mg/dL (approximately 30 minutes postingestion).
How do children with ethanol intoxication present?
While there is some variation in clinical effects among nontolerant adults, acute ethanol intoxication with a serum concentration >250 mg/dL is frequently associated with stupor, respiratory depression, and hypotension. A concentration >400 mg/dL may be associated with coma or apnea. Although similar clinical effects are expected in adolescents and children, infants often have counterintuitive clinical findings.
To date, eight cases of significant infant ethanol exposure exist in the literature (age range, 29 days to 9 months; ethanol concentration, 183-524 mg/dL). Respiratory depression was absent in all cases.5-9 In all but two cases, the neurological examination revealed only subtle decreases in interaction or tone. The remaining two children were described as obtunded and flaccid (ethanol levels, 405 mg/dL and 524 mg/dL, respectively) and were intubated for airway protection despite normal respiratory rates.7,10
The incongruence between the clinical findings (both the neurological examination and respiratory effects) and the ethanol concentration is difficult to explain. It may be due to age-related neurological immaturity or a limited ability to perform the required detailed neurological examinations in children. In particular, the relatively preserved level of consciousness, despite an otherwise coma-inducing ethanol concentration, is unique to infants. Accordingly, there should be a low threshold to check ethanol concentrations in infants presenting with apparent life-threatening events, altered mental status, decreased tone, or unexplained hypoglycemia or hypothermia.
What is the estimated time to sobriety in infants?
Ethanol is eliminated via a hepatic enzymatic oxidation pathway that becomes saturated at low serum levels. In nontolerant adults, this results in a zero-order kinetic elimination pattern with an ethanol elimination rate of approximately 20 mg/dL per hour. Anecdotally, it had been thought that children clear ethanol at roughly double this rate via unclear mechanisms. However, a review of published kinetic data suggests the actual rate of clearance may not differ substantially from adults (range, 19-34 mg/dL per hour).5-7,10,11
Case Conclusion
The patient was transferred to a tertiary care pediatric hospital for continued management, where the markedly elevated serum ethanol concentration was confirmed. She was maintained on a dextrose-containing IV fluid and observed overnight without development of any complications. Serial serum ethanol concentrations were performed and complete clearance was achieved approximately 20 hours postingestion, suggesting a metabolic rate of 16 mg/dL per hour. The infant was discharged home with supervision by child protective services.
Dr Boroughf is a toxicology fellow, department of emergency medicine, Albert Einstein Medical Center, Philadelphia, Pennsylvania. Dr Nelson, editor of “Case Studies in Toxicology,” is a professor in the department of emergency medicine and director of the medical toxicology fellowship program at the New York University School of Medicine and the New York City Poison Control Center. He is also associate editor, toxicology, of the EMERGENCY MEDICINE editorial board. Dr Henretig is an attending toxicologist, department of emergency medicine, Children’s Hospital of Philadelphia, Pennsylvania.
References
Mowry JB, Spyker DA, Cantilena LR Jr, Bailey JE, Ford M. 2012 Annual Report of the American Association of Poison Control Centers’ National Poison Data System (NPDS): 30th Annual Report. Clin Toxicol (Phila). 2013;51(10):949-1229.
Wood JN, Pecker LH, Russo ME, Henretig F, Christian CW. Evaluation and referral for child maltreatment in pediatric poisoning victims. Child Abuse Negl. 2012;36(4):362-369.
Lamminpää A. Alcohol intoxication in childhood and adolescence. Alcohol Alcohol. 1995;30(1):5-12.
Malouf R, Brust JC. Hypoglycemia: causes, neurological manifestations, and outcome. Ann Neurol.1985;17(5):421-430.
Chikava K, Lower DR, Frangiskakis SH, Sepulveda JL, Virji MA, Rao KN. Acute ethanol intoxication in a 7-month old-infant. Pediatr Dev Pathol. 2004;7(4):400-402.
Ford JB, Wayment MT, Albertson TE, Owen KP, Radke JB, Sutter ME. Elimination kinetics of ethanol in a 5-week-old infant and a literature review of infant ethanol pharmacokinetics. Case Rep Med. 2013;2013:250716. doi:10.1155/2013/250716
McCormick T, Levine M, Knox O, Claudius I. Ethanol ingestion in two infants under 2 months old: a previously unreported cause of ALTE. Pediatrics. 2013;131(2);e604-e607.
Fong HF, Muller AA. An unexpected clinical course in a 29-day-old infant with ethanol exposure. Pediatr Emerg Care. 2014;30(2):111-113.
Iyer SS, Haupt A, Henretig FM. Pick your poison: straight from the spring? Ped Emerg Care. 2009;25(3):194-196.
Edmunds SM, Ajizian SJ, Liguori A. Acute obtundation in a 9-month-old patient: ethanol ingestion. Pediatr Emerg Care. 2014;30(10):739-741.
Simon HK, Cox JM, Sucov A, Linakis JG. Serum ethanol clearance in intoxicated children and adolescents presenting to the ED. Acad Emerg Med. 1994;1(6):520-524.
Figure 1.
When the ST segment is elevated on the electrocardiogram, our first concern is whether the patient is having an ST-segment elevation myocardial infarction (STEMI). However, a number of other conditions can cause ST elevation, and to complicate matters, some of these can coexist with STEMI.
Nevertheless, careful attention to the ST-T and QRS-complex configurations often allows diagnosis of the cause of ST elevation (Figure 1, Table 1). This paper discusses the differential diagnosis of ST elevation.
MEASURED AT THE J POINT OR LATER
ST-segment deviation is usually measured at its junction with the end of the QRS complex, ie, the J point, and is referenced against the TP or PR segment.1 Some authors prefer measuring the magnitude of the ST deviation 40 to 80 msec after the J point, when all myocardial fibers are expected to have reached the same level of membrane potential and to form an isoelectric ST segment.2,3
ST-SEGMENT ELEVATION MYOCARDIAL INFARCTION
A diagnosis of STEMI that mandates emergency reperfusion requires ST elevation equaling or exceeding the following cut-points, in at least two contiguous leads (using the standardization of 1.0 mV = 10 mm)4,5:
1 mm in all standard leads other than V2 and V3
2.5 mm in leads V2 and V3 in men younger than age 40, 2 mm in leads V2 and V3 in men age 40 and older, and 1.5 mm in these leads in women
0.5 mm in the posterior chest leads V7 to V9; ST elevation is attenuated in the posterior leads because of their greater distance from the heart, explaining the lower cut-point.6
While ST elevation that falls below these cut-points may be a normal variant, any ST elevation or depression (≥ 0.5 mm) may be abnormal and may necessitate further evaluation for ischemia, particularly when the clinical setting or the ST morphology suggests ischemia or when other signs of ischemia such as T-wave abnormalities, Q waves, or reciprocal ST-segment changes are also present on the electrocardiogram.
Conversely, ST elevation that exceeds these cut-points may not represent STEMI. In an analysis of patients with chest pain manifesting ST elevation, only 15% were eventually diagnosed with STEMI.7 In addition to size, careful attention to the morphology of the ST segment and the associated features is critical (Figure 1).
Other features of STEMI
Figure 2. Diffuse ST-segment elevation with ST-segment depression in lead aVR. This initially suggests pericarditis. PR depression in leads II, aVF, V5, and V6 further suggests pericarditis. But the presence of features of pericarditis does not necessarily rule out STEMI. The five STEMI features must be ruled out. In this case, the ST-segment morphology and the abnormally wide T wave are features of STEMI. The ST elevation has an upwardly convex shape with a wide and high T wave fused with the ST segment, typical of STEMI (leads V2–V4, arrows). Also, the size of the ST elevation (ie, > 5 mm in V2–V4 and larger than the QRS complex in V4, a feature called “tombstoning”) is more consistent with STEMI than with pericarditis. In this patient, the left anterior descending artery was found to be occluded on coronary arteriography.
In STEMI, the ST elevation is typically a convex or a straight oblique line, blending with a wide T wave to form a dome.8 But ST elevation may be concave in up to 40% of anterior STEMIs, especially in the early stage.3,9,10 The nonconcave morphology is highly specific but not sensitive for the diagnosis of anterior STEMI.3,8,9
Four other features characteristic of STEMI may be present (Figures 2 and 3):
Concomitant T-wave abnormalities (wide, ample, or inverted T waves)
Q waves
ST depression in the reciprocal leads. Reciprocal ST depression is seen in all inferior STEMIs and in 70% of anterior STEMIs.11,12 Diffuse ST elevation mimicking pericarditis may be seen with midvessel occlusion of a left anterior descending artery that wraps around the apex and supplies part of the inferior wall.
Figure 3. In a patient with lung cancer, sinus tachycardia is seen with diffuse ST-segment elevation, along with ST-segment depression in aVR. The QRS voltage is low, particularly when compared with the electrocardio-gram recorded a few days earlier (left lower panel). PR depression is seen in lead II. The combination of these findings may suggest pericarditis with a pericardial effusion. However, the ST-T morphology in lead V2, where the ST and T are blended to form one dome, is characteristic of STEMI (top arrow). Moreover, the ST elevation and T wave in leads V2–V4 are larger than the QRS, the QRS voltage is “shrinking” (arrowhead), and the R wave is pulled up by the ST segment (star); this is called “tombstoning.” All these features are characteristic of STEMI, wherein the R wave and the QRS complex shrink before forming a deep Q wave. In fact, an electrocardiogram recorded 1 hour later (right lower panel) shows a fully developed Q wave in lead V2 (bottom arrow).
ST or T-wave amplitude may approximate or exceed the QRS amplitude in at least one lead.3,13,14 This finding is characteristic of STEMI, in which the QRS “shrinks” as the infarcted area becomes electrically neutral, whereas the ST-T segments become ample.3,13 In fact, early STEMI may be characterized by a small R wave that seems to be “pulled up” by the elevated ST segment. A small or absent R wave along with an ample, convex ST segment that fuses with the T wave and exceeds the height of the remaining R wave is called “tombstoning” (Figure 3). Tombstoning is most commonly seen with anterior infarction and implies more extensive myocardial damage and a worse prognosis than STEMI without tombstoning.15
Note that ST elevation may not be acute STEMI but an old STEMI with a chronically dysfunctional myocardium (dyskinetic or aneurysmal myocardium). In fact, an old STEMI may manifest as a chronic, persistent ST elevation along with Q waves, and T waves may be inverted or upright, but not ample.14 A history of an old MI, old electrocardiograms, if available, and quick bedside echocardiography may allow the diagnosis. In the case of an old dyskinetic infarct, echocardiography shows a thin, bright (scarred), and possibly aneurysmal myocardium, whereas in acute STEMI, the myocardium is neither thin nor scarred yet. If the patient does not report a history of MI, if the T wave is ample (> 75% the size of QRS), or if the patient presents with atypical ongoing angina, presume it is acute STEMI.
EARLY REPOLARIZATION
Early repolarization is a normal variant of ST elevation that equals or exceeds 1 mm (measured at the J point). It is highly prevalent in people under age 40 and remains prevalent in middle-aged people.
Two distinct and sometimes coexistent forms of early repolarization have been described: (1) ST elevation in the anterior leads V1 to V3,16–19 and (2) ST elevation in the lateral leads (V4 to V6, I, aVL) or inferior leads.18–22 The prevalence of the first form—ie, ST elevation of 1 mm or more in any of the leads V1 through V3—is 60% to 90% in men age 45 and younger, 20% to 40% in men over age 45, and about 10% in women of any age.16 Thus, this form of early repolarization is called “normal male pattern.”
Even early repolarization that involves the lateral or inferior leads is common, with a prevalence of about 15% in people ages 30 to 40 and about 5% to 10% in those 40 to 65.20–23 It is two to four times more prevalent in men and three times more prevalent in African Americans. It is also highly prevalent in athletes younger than 25 (about 30% to 40%).22
Figure 4. Early repolarization with ST-segment elevation is seen in the inferior leads and in the anterolateral leads V2 to V6. ST elevation is most prominent in lead V4 and lead II, with a concavely upward ST morphology and a notch at the J point (arrows and left magnified image). In half of early repolarization cases, the J point is smooth but well demarcated (right magnified image). Note the slight PR depression in leads II and V5. Slight PR depression may be seen in normal individuals and corresponds to the normal atrial repolarization.
Either way, early repolarization closely resembles the ST elevation of pericarditis and has the following features (Figure 4):
The ST segment is concave upward, and the J point is well demarcated and may be notched or slurred (Figure 1).
ST elevation is usually no more than 3 mm.
ST elevation may be limited to the anterior leads or, in many instances, may extend to the inferior or lateral leads. Early repolarization is very rarely limited to the limb leads, and involvement of some precordial leads is the rule.18,19 The ST segment is depressed in lead aVR in 50% of patients.18,19
Figure 5. Early repolarization with a normal variant T-wave inversion in a 33-year-old black man. The ST segment is elevated with a notched J point in leads V2 to V5
The T wave is usually ample and may be more than 10 mm tallin the precordial leads in one-third of patients,17 but as opposed to the ample T wave of STEMI, it is not broad and remains smaller than the QRS complex. The ample T wave distinguishes early repolarization from pericarditis, and explains the low ST-T ratio in lead V6. In up to 10% of young black men, the T wave has a terminal inversion in leads V3 to V5, and occasionally in V1 and V2, mimicking infarction(Figure 5).24
The QRS complex tends to have prominent precordial voltage, in sharp contrast to STEMI, in which QRS shrinking occurs.3,17,22
The early repolarization pattern may be intermittent, may vary among serial electrocardiograms, may decrease with a rise in sympathetic tone, as observed during exercise, and may increase with a rise in vagal tone.18,19,25,26 Although it is usually a benign finding, the early repolarization pattern in leads other than V1 to V3 has been associated with an increased risk of sudden death, particularly when the ST elevation is horizontal-descending rather than upsloping and, possibly, when early repolarization involves the inferior leads with a J point that is notched or elevated 2 mm or more.20,22
PERICARDITIS
Figure 6. Diffuse ST-segment elevation in most leads, with ST depression in lead aVR and an isoelectric ST segment in V1. None of the STEMI features are present: ST elevation is concave upward, no reciprocal ST depression is seen except in lead aVR; the T wave is not wide, inverted, or ample (in relation to the QRS complex); and no Q wave is seen. Furthermore, ST elevation does not exceed 5 mm; ST and T heights are smaller than QRS height; and PR depression is present (circled areas). As opposed to early repolarization, the ratio of ST to T in leads V5 and V6 exceeds 25%. This is consistent with pericarditis, and the hospital course of this patient confirmed this diagnosis.
In pericarditis, ST elevation is concave upward and is widespread to more than one region without reciprocal ST depression, except for the frequent ST depression in leads aVR and V1 (64%)27; ST elevation is seldom greater than 4 to 5 mm (Figure 6).27,28 Since the subepicardial injury is diffuse in pericarditis, the axis of the ST segment follows the anatomic axis of the heart and is generally +45° in the frontal plane. Thus, ST depression is seen in leads aVR and V1; ST elevation is highest in leads II, V5, and V6 and is less in leads III and aVL, where the ST segment may occasionally be depressed.29
Transient PR depression greater than 1 mm is often seen, particularly in leads II, aVF, and V4 to V6, and represents atrial subepicardial injury. PR depression in those leads is always associated with PR elevation in lead aVR and sometimes V1. PR changes often coexist with ST changes but may be isolated and may precede ST changes.30 PR depression is characteristic of pericarditis but may be seen in early repolarization, where it is less marked than in pericarditis (< 0.8 mm) and implies early repolarization of the atrial tissue,31 and in MI, where it implies atrial infarction with atrial injury pattern.
Classically, it is said that in pericarditis, unlike in STEMI, the T wave does not invert until the ST elevation subsides. In reality, up to 40% of patients develop a notched or biphasic positive-negative T wave before full return of the ST segment to the baseline.27,32 And if T-wave inversion antedates pericarditis, concomitant ST elevation and T-wave inversion may be seen once pericarditis develops. However, the T wave inverts less deeply and less completely than in STEMI, and the corrected QT interval remains normal even when the T wave inverts.
Three criteria distinguish pericarditis from early repolarization (but not from STEMI):
PR depression greater than 1 mm
ST-segment depression in lead V1
A ratio of ST-segment height to T-wave height of at least 25% in lead V6, V5, V4, or I. This feature distinguishes pericarditis from early repolarization with a high sensitivity and specificity. In pericarditis, the T waves have normal or reduced amplitude, and the ST-T ratio is therefore high,33 whereas in early repolarization the T waves are tall, so the ST-T ratio is less than 25%.
Widespread ST elevation may be seen with both pericarditis and early repolarization. ST elevation limited to the anterior leads is more likely to be early repolarization than pericarditis.
LEFT BUNDLE BRANCH BLOCK
Figure 7. Supraventricular tachycardia with a typical left bundle branch block pattern in leads I and aVL. Concordant ST-segment elevation is seen in leads I and aVL, while concordant ST depression is seen in the inferior leads (arrows). The ST elevation in lead V2 is discordant but is disproportionately high in relation to the QRS (well above 25% of the QRS height). All these features are diagnostic of STEMI.
In left bundle branch block, a deep and wide S wave is seen in leads V1 to V3 and sometimes in the inferior leads, with ST elevation and T waves that are discordant with the QRS complex—ie, directed opposite to the QRS (Figures 7–9). The ST elevation is typically concave upward.8,34 Occasionally, ST elevation may be straight or convex, mimicking the dome of STEMI. In the lateral leads, the discordant ST segment is depressed, mimicking a reciprocal ST change.
The following findings imply MI:
Figure 8. Left bundle branch block with discordant ST-segment changes. However, the T wave is wide and fused with the ST segment in a domed morphology, and the T wave is larger than the QRS in leads V4, V5, and II (arrows). This implies the diagnosis of STEMI with hyperacute T waves. This patient had an occluded left anterior descending coronary artery.
ST elevation or depression that is concordant with the QRS complex. Moreover, since ST deviation is mandatory with left bundle branch block, a “normal-looking” ST segment implies ischemia.
Inverted T waves concordant with the QRS in more than one lead, or biphasic T waves in more than one lead (eg, V1 to V3). Across the precordial leads, T waves may transition from positive to negative one lead earlier or later than the QRS and ST transition. Therefore, even in the absence of ischemia, the T wave may be inverted in lead V3, in which the QRS is deeply negative and the ST is still elevated (negative T-wave concordance in one lead). Also, the T wave may be upright in leads V5, V6, and I where QRS is upright and the ST segment is depressed (positive T-wave concordance does not imply ischemia).
Figure 9. Left bundle branch block with abnormal T waves. Panels A and B show discordant ST-segment elevation in V1 to V3 but concordant T wave inversion (A) or biphasic T wave (B). This is consistent with an anterior injury pattern. Panel C shows concordant T-wave inversion in the inferior leads, consistent with inferior injury. Panel D shows a large concordant T wave in lead V6, larger than the QRS, consistent with injury.
In addition to concordance, a discordant ST segment or T wave that is very large may imply ischemia. For example, a discordant ST segment or T wave that is larger than the QRS height implies ischemia. A discordant ST elevation greater than 5 mm has been suggested by Sgarbossa et al35 as a diagnostic feature of STEMI; however, this feature is seen in 10% of control patients with left bundle branch block and no STEMI, and it is thus poorly specific and also poorly sensitive, frequently missing STEMI.35–37 Smith et al36 have suggested that a discordant ST elevation of at least 25% of the S-wave depth is a far more sensitive and accurate feature but one that may still be found in up to 10% of control patients.36
LEFT VENTRICULAR HYPERTROPHY
In left ventricular hypertrophy, a deep S wave is seen in leads V1 to V3, with ST elevation and T waves that are discordant with the QRS complex. Rarely, ST elevation may be straight or convex. The following findings imply MI:
ST elevation or depression that is concordant with the QRS.
Inverted T waves that are concordant with the QRS in more than one lead, or biphasic T waves in more than one lead (eg, V1 to V3).
A discordant ST segment or a T wave that is very large may imply ischemia. In left ventricular hypertrophy, ST elevation is usually less than 2.5 mm in leads V1 to V3 and is rarely seen in the inferior leads, where it would be less than 1 mm.34 When ST elevation is seen in leads V1 to V3 in left ventricular hypertrophy, an ST magnitude of 25% or more of the total QRS voltage has a 91% specificity for STEMI.34
On another note, right ventricular hypertrophy and right bundle branch block may lead to ST-segment depression and T-wave inversion, but not to ST elevation. Thus, ST elevation occurring with right ventricular hypertrophy or right bundle branch block implies STEMI. While only left bundle branch block poses a diagnostic challenge, both types of bundle branch block, if secondary to STEMI, represent equally high-risk categories.38
PREEXCITATION
Figure 10. At first glance, it seems there is ST-segment elevation in the inferior leads II, III, and aVF, with a wide Q wave. Moreover, there is a wide and tall R wave in lead V1 suggesting an associated posterior infarction. All this is consistent with acute inferoposterior STEMI. On further analysis, however, a slur is seen on the upslope of QRS in leads V1 to V6 (arrows), and the P wave is “riding” this slur. In the inferior leads, the P wave is riding the Q wave, which is in fact a negative delta wave. Thus, this electrocardiogram represents preexcitation. The ST deviations are secondary to the preexcitation and have an orientation opposite to the delta wave.
Preexcitation may be associated with negative delta waves that mimic Q waves, and with ST elevation in the leads where the negative delta waves are seen, ie, ST elevation discordant with the delta wave (Figure 10). The QRS morphology and the delta wave allow preexcitation to be distinguished from STEMI.
HYPERKALEMIA
Figure 11. There are ST-segment elevations in leads V1–V4, ST-segment depressions in the inferior leads, and peaked T waves in leads V3–V5. These T waves have a narrow base and seem to “pull” the ST segment, creating ST elevation in the anterior leads and ST depression in the inferior leads (arrows). This shape is consistent with hyperkalemia. In addition, the downsloping ST elevation seen in V1 and V2 is consistent with hyperkalemia (arrowhead). Occasionally, STEMI may have a similar ST-T shape. An rSR’ pattern is seen in V1–V2; this is consistent with STEMI but also with hyperkalemia, in which conduction blocks are common. The serum potassium level was 7.4 mmol/L (normal 3.5–5), and coronary angiography revealed normal coronary arteries.
The most common finding in hyperkalemia is a peaked, narrow-based T wave that is usually, but not necessarily, tall. ST elevation may be evident in leads V1 to V3 (Figure 11). In contrast with hyperkalemia, the T wave of STEMI is typically wide.
OTHER CAUSES OF ST-SEGMENT ELEVATION
Takotsubo cardiomyopathy
Takotsubo cardiomyopathy mimics all electrocardiographic features of anteroapical STEMI. ST elevation may extend to the inferior leads but cannot be isolated in the inferior leads.39 As in apical STEMI, reciprocal ST depression is uncommon. Within 24 to 48 hours, ST elevation evolves into deep anterior T-wave inversion and a prolonged QT interval. Transient Q waves may be seen.
Myocarditis
Myocarditis may have one of two electrocardiographic patterns: a pericarditis pattern, or a typical STEMI pattern with Q waves sometimes localized to one area.40
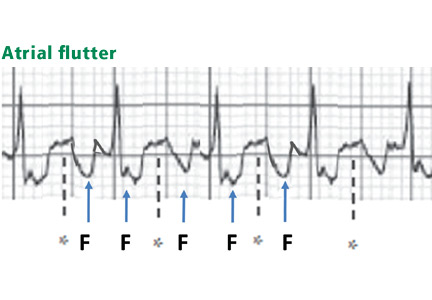
Atrial flutter waves
Figure 12. Atrial flutter that simulates ST-segment elevation. An “F” indicates the negative flutter wave; an asterisk indicates the upslope of the flutter wave that is superimposed on the ST segment, mimicking ST elevation.
Atrial flutter waves, particularly of 2:1 atrial flutter, may deform the ST segment so that it mimics an injury pattern on the electrocardiogram. Flutter waves may mimic ST elevation or ST depression (Figure 12).
Large pulmonary embolism
A large pulmonary embolism may be associated with T-wave inversion in the anterior leads or the inferior leads, or both, reflective of cor pulmonale. Less commonly, ST elevation in the anterior or inferior leads is seen. In fact, changes of both anterior and inferior ischemia should always suggest a pulmonary embolism.41,42
Brugada syndrome
Figure 13. Type 1 Brugada pattern in V1 and V1, with a downsloping ST-segment elevation that creates a pseudo-R’ wave (pseudo-right bundle branch block). The QRS does not have a right bundle branch block morphology in leads V5 and V6.
Brugada syndrome is characterized by ST elevation and a right bundle branch block or pseudo-right bundle branch block pattern in at least two of the leads V1 to V3. In pseudo-right bundle branch block, the QRS adopts an rSR morphology in the anterior leads but is normal in the lateral leads. Type 1 Brugada pattern, the pattern that is most specifically associated with sudden death, is characterized by a coved, downsloping ST elevation of 2 mm or more with T-wave inversion (Figure 13).43 The Brugada pattern can be transient, triggered by fever, cocaine, or class I antiarrhythmic drugs.
Hyperkalemia, Brugada syndrome, and sometimes pulmonary embolism are characterized by an ST elevation that slopes downward (Figures 11 and 13), which contrasts with the upsloping, convex ST elevation of STEMI.
References
Rautaharju PM, Surawicz B, Gettes LS, et al; American Heart Association Electrocardiography and Arrhythmias Committee, Council on Clinical Cardiology; American College of Cardiology Foundation; Heart Rhythm Society. AHA/ACCF/HRS recommendations for the standardization and interpretation of the electrocardiogram: part IV: the ST-segment, T and U waves, and the QT interval: a scientific statement from the American Heart Association Electrocardiography and Arrhythmias Committee, Council on Clinical Cardiology; the American College of Cardiology Foundation; and the Heart Rhythm Society. Endorsed by the International Society for Computerized Electrocardiology. J Am Coll Cardiol 2009; 53:982–991.
Surawicz B, Knilans TK. Chou’s Electrocardiography in Clinical Practice: Adult and Pediatric. 5th ed. Philadelphia, PA: WB Saunders; 2001:194–207.
Smith SW, Khalil A, Henry TD, et al. Electrocardiographic differentiation of early repolarization from subtle anterior ST-segment elevation myocardial infarction. Ann Emerg Med 2012; 60:45–56.e2.
American College of Emergency Physicians; Society for Cardiovascular Angiography and Interventions; O’Gara PT, Kushner FG, Ascheim DD, et al. 2013 ACCF/AHA guideline for the management of ST-elevation myocardial infarction: a report of the American College of Cardiology Foundation/American Heart Association Task Force on Practice Guidelines. J Am Coll Cardiol 2013; 61:e78–e140.
Thygesen K, Alpert JS, Jaffe AS, et al; Joint ESC/ACCF/AHA/WHF Task Force for the Universal Definition of Myocardial Infarction. Third universal definition of myocardial infarction. Circulation 2012; 126:2020–2035.
Matetzky S, Freimark D, Chouraqui P, et al. Significance of ST segment elevations in posterior chest leads (V7 to V9) in patients with acute inferior myocardial infarction: application for thrombolytic therapy. J Am Coll Cardiol 1998; 31:506–511.
Brady WJ, Perron AD, Martin ML, Beagle C, Aufderheide TP. Cause of ST-segment abnormality in ED chest pain patients. Am J Emerg Med 2001; 19:25–28.
Brady WJ, Syverud SA, Beagle C, et al. Electrocardiographic ST-segment elevation: the diagnosis of acute myocardial infarction by morphologic analysis of the ST segment. Acad Emerg Med 2001; 8:961–967.
Smith SW. Upwardly concave ST-segment morphology is common in acute left anterior descending coronary occlusion. J Emerg Med 2006; 31:69–77.
Kosuge M, Kimura K, Ishikawa T, et al. Value of ST-segment elevation pattern in predicting infarct size and left ventricular function at discharge in patients with reperfused acute anterior myocardial infarction. Am Heart J 1999; 137:522–527.
Birnbaum Y, Sclarovsky S, Mager A, Strasberg B, Rechavia E. ST segment depression in a VL: a sensitive marker for acute inferior myocardial infarction. Eur Heart J 1993; 14:4–7.
Engelen DJ, Gorgels AP, Cheriex EC, et al. Value of the electrocardiogram in localizing the occlusion site in the left anterior descending coronary artery in acute anterior myocardial infarction. J Am Coll Cardiol 1999; 34:389–395.
Collins MS, Carter JE, Dougherty JM, Majercik SM, Hodsden JE, Logue EE. Hyperacute T-wave criteria using computer ECG analysis. Ann Emerg Med 1990; 19:114–120.
Smith SW. T/QRS ratio best distinguishes ventricular aneurysm from anterior myocardial infarction. Am J Emerg Med 2005; 23:279–287.
Surawicz B, Parikh SR. Prevalence of male and female patterns of early ventricular repolarization in the normal ECG of males and females from childhood to old age. J Am Coll Cardiol 2002; 40:1870–1876.
Klatsky AL, Oehm R, Cooper RA, Udaltsova N, Armstrong MA. The early repolarization normal variant electrocardiogram: correlates and consequences. Am J Med 2003; 115:171–177.
Mehta M, Jain AC, Mehta A. Early repolarization. Clin Cardiol 1999; 22:59–65.
Mehta MC, Jain AC. Early repolarization on scalar electrocardiogram. Am J Med Sci 1995; 309:305–311.
Rollin A, Maury P, Bongard V, et al. Prevalence, prognosis, and identification of the malignant form of early repolarization pattern in a population-based study. Am J Cardiol 2012; 110:1302–1308.
Tikkanen JT, Anttonen O, Junttila MJ, et al. Long-term outcome associated with early repolarization on electrocardiography. N Engl J Med 2009; 361:2529–2537.
Tikkanen JT, Junttila MJ, Anttonen O, et al. Early repolarization: electrocardiographic phenotypes associated with favorable long-term outcome. Circulation 2011; 123:2666–2673.
Noseworthy PA, Tikkanen JT, Porthan K, et al. The early repolarization pattern in the general population: clinical correlates and heritability. J Am Coll Cardiol 2011; 57:2284–2289.
Wasserburger RH. Observations on the juvenile pattern of adult negro males. Am J Med 1955; 18:428–437.
Kralios FA, Martin L, Burgess MJ, Millar K. Local ventricular repolarization changes due to sympathetic nerve-branch stimulation. Am J Physiol 1975; 228:1621–1626.
Spratt KA, Borans SM, Michelson EL. Early repolarization: normalization of the electrocardiogram with exercise as a clinically useful diagnostic feature. J Invasive Cardiol 1995; 7:238–242.
Surawicz B, Lasseter KC. Electrocardiogram in pericarditis. Am J Cardiol 1970; 26:471–474.
Hull E. The electrocardiogram in pericarditis. Am J Cardiol 1961; 7:21–32.
Spodick DH. Diagnostic electrocardiographic sequences in acute pericarditis. Significance of PR segment and PR vector changes. Circulation 1973; 48:575–580.
Spodick DH. Acute pericarditis: current concepts and practice. JAMA 2003; 289:1150–1153.
Charles MA, Bensinger TA, Glasser SP. Atrial injury current in pericarditis. Arch Intern Med 1973; 131:657–662.
Noth PH, Barnes HR. Electrocardiographic changes associated with pericarditis. Arch Intern Med 1940; 65:291–320.
Ginzton LE, Laks MM. The differential diagnosis of acute pericarditis from the normal variant: new electrocardiographic criteria. Circulation 1982; 65:1004–1009.
Armstrong EJ, Kulkarni AR, Bhave PD, et al. Electrocardiographic criteria for ST-elevation myocardial infarction in patients with left ventricular hypertrophy. Am J Cardiol 2012; 110:977–983.
Sgarbossa EB, Pinski SL, Barbagelata A, et al. Electrocardiographic diagnosis of evolving acute myocardial infarction in the presence of left bundle-branch block. GUSTO-1 (Global Utilization of Streptokinase and Tissue Plasminogen Activator for Occluded Coronary Arteries) Investigators. N Engl J Med 1996; 334:481–487.
Smith SW, Dodd KW, Henry TD, Dvorak DM, Pearce LA. Diagnosis of ST-elevation myocardial infarction in the presence of left bundle branch block with the ST-elevation to S-wave ratio in a modified Sgarbossa rule. Ann Emerg Med 2012; 60:766–776.
Madias JE, Sinha A, Agarwal H, Ashtiani R. ST-segment elevation in leads V1-V3 in patients with LBBB. J Electrocardiol 2001; 34:87–88.
Sgarbossa EB, Pinski SL, Topol EJ, et al. Acute myocardial infarction and complete bundle branch block at hospital admission: clinical characteristics and outcome in the thrombolytic era. GUSTO-I Investigators. Global Utilization of Streptokinase and t-PA [tissue-type plasminogen activator] for Occluded Coronary Arteries. J Am Coll Cardiol 1998; 31:105–110.
Bybee KA, Kara T, Prasad A, et al. Systematic review: transient left ventricular apical ballooning: a syndrome that mimics ST-segment elevation myocardial infarction. Ann Intern Med 2004; 141:858–865.
Magnani JW, Dec GW. Myocarditis: current trends in diagnosis and treatment. Circulation 2006; 113:876–890.
Sreeram N, Cheriex EC, Smeets JL, Gorgels AP, Wellens HJ. Value of the 12-lead electrocardiogram at hospital admission in the diagnosis of pulmonary embolism. Am J Cardiol 1994; 73:298–303.
Glancy DL, Mikdadi GM. Syncope in a 67-year-old man. Proc (Bayl Univ Med Cent) 2005; 18:74–75.
Wilde AA, Antzelevitch C, Borggrefe M, et al; Study Group on the Molecular Basis of Arrhythmias of the European Society of Cardiology. Proposed diagnostic criteria for the Brugada syndrome: consensus report. Circulation 2002; 106:2514–2519.
Elias B. Hanna, MD Assistant Professor of Medicine, Department of Medicine, Cardiovascular Section, Louisiana State University Health Sciences Center, New Orleans
David Luke Glancy, MD Emeritus Professor of Medicine, Department of Medicine, Cardiovascular Section, Louisiana State University Health Sciences Center, New Orleans
Address: Elias B. Hanna, MD, Department of Medicine, Cardiovascular Section, Louisiana State University Health Sciences Center, 1542 Tulane Avenue, 3rd Floor, Room 323, New Orleans, LA, 70112; e-mail: [email protected]
ST, ST segment, ST segment elevation, ST elevation myocardial infarction, STEMI, early repolarization, pericarditis, left bundle branch block, hyperkalemia, Elias Hanna, David Glancy
Elias B. Hanna, MD Assistant Professor of Medicine, Department of Medicine, Cardiovascular Section, Louisiana State University Health Sciences Center, New Orleans
David Luke Glancy, MD Emeritus Professor of Medicine, Department of Medicine, Cardiovascular Section, Louisiana State University Health Sciences Center, New Orleans
Address: Elias B. Hanna, MD, Department of Medicine, Cardiovascular Section, Louisiana State University Health Sciences Center, 1542 Tulane Avenue, 3rd Floor, Room 323, New Orleans, LA, 70112; e-mail: [email protected]
Author and Disclosure Information
Elias B. Hanna, MD Assistant Professor of Medicine, Department of Medicine, Cardiovascular Section, Louisiana State University Health Sciences Center, New Orleans
David Luke Glancy, MD Emeritus Professor of Medicine, Department of Medicine, Cardiovascular Section, Louisiana State University Health Sciences Center, New Orleans
Address: Elias B. Hanna, MD, Department of Medicine, Cardiovascular Section, Louisiana State University Health Sciences Center, 1542 Tulane Avenue, 3rd Floor, Room 323, New Orleans, LA, 70112; e-mail: [email protected]
Figure 1.
When the ST segment is elevated on the electrocardiogram, our first concern is whether the patient is having an ST-segment elevation myocardial infarction (STEMI). However, a number of other conditions can cause ST elevation, and to complicate matters, some of these can coexist with STEMI.
Nevertheless, careful attention to the ST-T and QRS-complex configurations often allows diagnosis of the cause of ST elevation (Figure 1, Table 1). This paper discusses the differential diagnosis of ST elevation.
MEASURED AT THE J POINT OR LATER
ST-segment deviation is usually measured at its junction with the end of the QRS complex, ie, the J point, and is referenced against the TP or PR segment.1 Some authors prefer measuring the magnitude of the ST deviation 40 to 80 msec after the J point, when all myocardial fibers are expected to have reached the same level of membrane potential and to form an isoelectric ST segment.2,3
ST-SEGMENT ELEVATION MYOCARDIAL INFARCTION
A diagnosis of STEMI that mandates emergency reperfusion requires ST elevation equaling or exceeding the following cut-points, in at least two contiguous leads (using the standardization of 1.0 mV = 10 mm)4,5:
1 mm in all standard leads other than V2 and V3
2.5 mm in leads V2 and V3 in men younger than age 40, 2 mm in leads V2 and V3 in men age 40 and older, and 1.5 mm in these leads in women
0.5 mm in the posterior chest leads V7 to V9; ST elevation is attenuated in the posterior leads because of their greater distance from the heart, explaining the lower cut-point.6
While ST elevation that falls below these cut-points may be a normal variant, any ST elevation or depression (≥ 0.5 mm) may be abnormal and may necessitate further evaluation for ischemia, particularly when the clinical setting or the ST morphology suggests ischemia or when other signs of ischemia such as T-wave abnormalities, Q waves, or reciprocal ST-segment changes are also present on the electrocardiogram.
Conversely, ST elevation that exceeds these cut-points may not represent STEMI. In an analysis of patients with chest pain manifesting ST elevation, only 15% were eventually diagnosed with STEMI.7 In addition to size, careful attention to the morphology of the ST segment and the associated features is critical (Figure 1).
Other features of STEMI
Figure 2. Diffuse ST-segment elevation with ST-segment depression in lead aVR. This initially suggests pericarditis. PR depression in leads II, aVF, V5, and V6 further suggests pericarditis. But the presence of features of pericarditis does not necessarily rule out STEMI. The five STEMI features must be ruled out. In this case, the ST-segment morphology and the abnormally wide T wave are features of STEMI. The ST elevation has an upwardly convex shape with a wide and high T wave fused with the ST segment, typical of STEMI (leads V2–V4, arrows). Also, the size of the ST elevation (ie, > 5 mm in V2–V4 and larger than the QRS complex in V4, a feature called “tombstoning”) is more consistent with STEMI than with pericarditis. In this patient, the left anterior descending artery was found to be occluded on coronary arteriography.
In STEMI, the ST elevation is typically a convex or a straight oblique line, blending with a wide T wave to form a dome.8 But ST elevation may be concave in up to 40% of anterior STEMIs, especially in the early stage.3,9,10 The nonconcave morphology is highly specific but not sensitive for the diagnosis of anterior STEMI.3,8,9
Four other features characteristic of STEMI may be present (Figures 2 and 3):
Concomitant T-wave abnormalities (wide, ample, or inverted T waves)
Q waves
ST depression in the reciprocal leads. Reciprocal ST depression is seen in all inferior STEMIs and in 70% of anterior STEMIs.11,12 Diffuse ST elevation mimicking pericarditis may be seen with midvessel occlusion of a left anterior descending artery that wraps around the apex and supplies part of the inferior wall.
Figure 3. In a patient with lung cancer, sinus tachycardia is seen with diffuse ST-segment elevation, along with ST-segment depression in aVR. The QRS voltage is low, particularly when compared with the electrocardio-gram recorded a few days earlier (left lower panel). PR depression is seen in lead II. The combination of these findings may suggest pericarditis with a pericardial effusion. However, the ST-T morphology in lead V2, where the ST and T are blended to form one dome, is characteristic of STEMI (top arrow). Moreover, the ST elevation and T wave in leads V2–V4 are larger than the QRS, the QRS voltage is “shrinking” (arrowhead), and the R wave is pulled up by the ST segment (star); this is called “tombstoning.” All these features are characteristic of STEMI, wherein the R wave and the QRS complex shrink before forming a deep Q wave. In fact, an electrocardiogram recorded 1 hour later (right lower panel) shows a fully developed Q wave in lead V2 (bottom arrow).
ST or T-wave amplitude may approximate or exceed the QRS amplitude in at least one lead.3,13,14 This finding is characteristic of STEMI, in which the QRS “shrinks” as the infarcted area becomes electrically neutral, whereas the ST-T segments become ample.3,13 In fact, early STEMI may be characterized by a small R wave that seems to be “pulled up” by the elevated ST segment. A small or absent R wave along with an ample, convex ST segment that fuses with the T wave and exceeds the height of the remaining R wave is called “tombstoning” (Figure 3). Tombstoning is most commonly seen with anterior infarction and implies more extensive myocardial damage and a worse prognosis than STEMI without tombstoning.15
Note that ST elevation may not be acute STEMI but an old STEMI with a chronically dysfunctional myocardium (dyskinetic or aneurysmal myocardium). In fact, an old STEMI may manifest as a chronic, persistent ST elevation along with Q waves, and T waves may be inverted or upright, but not ample.14 A history of an old MI, old electrocardiograms, if available, and quick bedside echocardiography may allow the diagnosis. In the case of an old dyskinetic infarct, echocardiography shows a thin, bright (scarred), and possibly aneurysmal myocardium, whereas in acute STEMI, the myocardium is neither thin nor scarred yet. If the patient does not report a history of MI, if the T wave is ample (> 75% the size of QRS), or if the patient presents with atypical ongoing angina, presume it is acute STEMI.
EARLY REPOLARIZATION
Early repolarization is a normal variant of ST elevation that equals or exceeds 1 mm (measured at the J point). It is highly prevalent in people under age 40 and remains prevalent in middle-aged people.
Two distinct and sometimes coexistent forms of early repolarization have been described: (1) ST elevation in the anterior leads V1 to V3,16–19 and (2) ST elevation in the lateral leads (V4 to V6, I, aVL) or inferior leads.18–22 The prevalence of the first form—ie, ST elevation of 1 mm or more in any of the leads V1 through V3—is 60% to 90% in men age 45 and younger, 20% to 40% in men over age 45, and about 10% in women of any age.16 Thus, this form of early repolarization is called “normal male pattern.”
Even early repolarization that involves the lateral or inferior leads is common, with a prevalence of about 15% in people ages 30 to 40 and about 5% to 10% in those 40 to 65.20–23 It is two to four times more prevalent in men and three times more prevalent in African Americans. It is also highly prevalent in athletes younger than 25 (about 30% to 40%).22
Figure 4. Early repolarization with ST-segment elevation is seen in the inferior leads and in the anterolateral leads V2 to V6. ST elevation is most prominent in lead V4 and lead II, with a concavely upward ST morphology and a notch at the J point (arrows and left magnified image). In half of early repolarization cases, the J point is smooth but well demarcated (right magnified image). Note the slight PR depression in leads II and V5. Slight PR depression may be seen in normal individuals and corresponds to the normal atrial repolarization.
Either way, early repolarization closely resembles the ST elevation of pericarditis and has the following features (Figure 4):
The ST segment is concave upward, and the J point is well demarcated and may be notched or slurred (Figure 1).
ST elevation is usually no more than 3 mm.
ST elevation may be limited to the anterior leads or, in many instances, may extend to the inferior or lateral leads. Early repolarization is very rarely limited to the limb leads, and involvement of some precordial leads is the rule.18,19 The ST segment is depressed in lead aVR in 50% of patients.18,19
Figure 5. Early repolarization with a normal variant T-wave inversion in a 33-year-old black man. The ST segment is elevated with a notched J point in leads V2 to V5
The T wave is usually ample and may be more than 10 mm tallin the precordial leads in one-third of patients,17 but as opposed to the ample T wave of STEMI, it is not broad and remains smaller than the QRS complex. The ample T wave distinguishes early repolarization from pericarditis, and explains the low ST-T ratio in lead V6. In up to 10% of young black men, the T wave has a terminal inversion in leads V3 to V5, and occasionally in V1 and V2, mimicking infarction(Figure 5).24
The QRS complex tends to have prominent precordial voltage, in sharp contrast to STEMI, in which QRS shrinking occurs.3,17,22
The early repolarization pattern may be intermittent, may vary among serial electrocardiograms, may decrease with a rise in sympathetic tone, as observed during exercise, and may increase with a rise in vagal tone.18,19,25,26 Although it is usually a benign finding, the early repolarization pattern in leads other than V1 to V3 has been associated with an increased risk of sudden death, particularly when the ST elevation is horizontal-descending rather than upsloping and, possibly, when early repolarization involves the inferior leads with a J point that is notched or elevated 2 mm or more.20,22
PERICARDITIS
Figure 6. Diffuse ST-segment elevation in most leads, with ST depression in lead aVR and an isoelectric ST segment in V1. None of the STEMI features are present: ST elevation is concave upward, no reciprocal ST depression is seen except in lead aVR; the T wave is not wide, inverted, or ample (in relation to the QRS complex); and no Q wave is seen. Furthermore, ST elevation does not exceed 5 mm; ST and T heights are smaller than QRS height; and PR depression is present (circled areas). As opposed to early repolarization, the ratio of ST to T in leads V5 and V6 exceeds 25%. This is consistent with pericarditis, and the hospital course of this patient confirmed this diagnosis.
In pericarditis, ST elevation is concave upward and is widespread to more than one region without reciprocal ST depression, except for the frequent ST depression in leads aVR and V1 (64%)27; ST elevation is seldom greater than 4 to 5 mm (Figure 6).27,28 Since the subepicardial injury is diffuse in pericarditis, the axis of the ST segment follows the anatomic axis of the heart and is generally +45° in the frontal plane. Thus, ST depression is seen in leads aVR and V1; ST elevation is highest in leads II, V5, and V6 and is less in leads III and aVL, where the ST segment may occasionally be depressed.29
Transient PR depression greater than 1 mm is often seen, particularly in leads II, aVF, and V4 to V6, and represents atrial subepicardial injury. PR depression in those leads is always associated with PR elevation in lead aVR and sometimes V1. PR changes often coexist with ST changes but may be isolated and may precede ST changes.30 PR depression is characteristic of pericarditis but may be seen in early repolarization, where it is less marked than in pericarditis (< 0.8 mm) and implies early repolarization of the atrial tissue,31 and in MI, where it implies atrial infarction with atrial injury pattern.
Classically, it is said that in pericarditis, unlike in STEMI, the T wave does not invert until the ST elevation subsides. In reality, up to 40% of patients develop a notched or biphasic positive-negative T wave before full return of the ST segment to the baseline.27,32 And if T-wave inversion antedates pericarditis, concomitant ST elevation and T-wave inversion may be seen once pericarditis develops. However, the T wave inverts less deeply and less completely than in STEMI, and the corrected QT interval remains normal even when the T wave inverts.
Three criteria distinguish pericarditis from early repolarization (but not from STEMI):
PR depression greater than 1 mm
ST-segment depression in lead V1
A ratio of ST-segment height to T-wave height of at least 25% in lead V6, V5, V4, or I. This feature distinguishes pericarditis from early repolarization with a high sensitivity and specificity. In pericarditis, the T waves have normal or reduced amplitude, and the ST-T ratio is therefore high,33 whereas in early repolarization the T waves are tall, so the ST-T ratio is less than 25%.
Widespread ST elevation may be seen with both pericarditis and early repolarization. ST elevation limited to the anterior leads is more likely to be early repolarization than pericarditis.
LEFT BUNDLE BRANCH BLOCK
Figure 7. Supraventricular tachycardia with a typical left bundle branch block pattern in leads I and aVL. Concordant ST-segment elevation is seen in leads I and aVL, while concordant ST depression is seen in the inferior leads (arrows). The ST elevation in lead V2 is discordant but is disproportionately high in relation to the QRS (well above 25% of the QRS height). All these features are diagnostic of STEMI.
In left bundle branch block, a deep and wide S wave is seen in leads V1 to V3 and sometimes in the inferior leads, with ST elevation and T waves that are discordant with the QRS complex—ie, directed opposite to the QRS (Figures 7–9). The ST elevation is typically concave upward.8,34 Occasionally, ST elevation may be straight or convex, mimicking the dome of STEMI. In the lateral leads, the discordant ST segment is depressed, mimicking a reciprocal ST change.
The following findings imply MI:
Figure 8. Left bundle branch block with discordant ST-segment changes. However, the T wave is wide and fused with the ST segment in a domed morphology, and the T wave is larger than the QRS in leads V4, V5, and II (arrows). This implies the diagnosis of STEMI with hyperacute T waves. This patient had an occluded left anterior descending coronary artery.
ST elevation or depression that is concordant with the QRS complex. Moreover, since ST deviation is mandatory with left bundle branch block, a “normal-looking” ST segment implies ischemia.
Inverted T waves concordant with the QRS in more than one lead, or biphasic T waves in more than one lead (eg, V1 to V3). Across the precordial leads, T waves may transition from positive to negative one lead earlier or later than the QRS and ST transition. Therefore, even in the absence of ischemia, the T wave may be inverted in lead V3, in which the QRS is deeply negative and the ST is still elevated (negative T-wave concordance in one lead). Also, the T wave may be upright in leads V5, V6, and I where QRS is upright and the ST segment is depressed (positive T-wave concordance does not imply ischemia).
Figure 9. Left bundle branch block with abnormal T waves. Panels A and B show discordant ST-segment elevation in V1 to V3 but concordant T wave inversion (A) or biphasic T wave (B). This is consistent with an anterior injury pattern. Panel C shows concordant T-wave inversion in the inferior leads, consistent with inferior injury. Panel D shows a large concordant T wave in lead V6, larger than the QRS, consistent with injury.
In addition to concordance, a discordant ST segment or T wave that is very large may imply ischemia. For example, a discordant ST segment or T wave that is larger than the QRS height implies ischemia. A discordant ST elevation greater than 5 mm has been suggested by Sgarbossa et al35 as a diagnostic feature of STEMI; however, this feature is seen in 10% of control patients with left bundle branch block and no STEMI, and it is thus poorly specific and also poorly sensitive, frequently missing STEMI.35–37 Smith et al36 have suggested that a discordant ST elevation of at least 25% of the S-wave depth is a far more sensitive and accurate feature but one that may still be found in up to 10% of control patients.36
LEFT VENTRICULAR HYPERTROPHY
In left ventricular hypertrophy, a deep S wave is seen in leads V1 to V3, with ST elevation and T waves that are discordant with the QRS complex. Rarely, ST elevation may be straight or convex. The following findings imply MI:
ST elevation or depression that is concordant with the QRS.
Inverted T waves that are concordant with the QRS in more than one lead, or biphasic T waves in more than one lead (eg, V1 to V3).
A discordant ST segment or a T wave that is very large may imply ischemia. In left ventricular hypertrophy, ST elevation is usually less than 2.5 mm in leads V1 to V3 and is rarely seen in the inferior leads, where it would be less than 1 mm.34 When ST elevation is seen in leads V1 to V3 in left ventricular hypertrophy, an ST magnitude of 25% or more of the total QRS voltage has a 91% specificity for STEMI.34
On another note, right ventricular hypertrophy and right bundle branch block may lead to ST-segment depression and T-wave inversion, but not to ST elevation. Thus, ST elevation occurring with right ventricular hypertrophy or right bundle branch block implies STEMI. While only left bundle branch block poses a diagnostic challenge, both types of bundle branch block, if secondary to STEMI, represent equally high-risk categories.38
PREEXCITATION
Figure 10. At first glance, it seems there is ST-segment elevation in the inferior leads II, III, and aVF, with a wide Q wave. Moreover, there is a wide and tall R wave in lead V1 suggesting an associated posterior infarction. All this is consistent with acute inferoposterior STEMI. On further analysis, however, a slur is seen on the upslope of QRS in leads V1 to V6 (arrows), and the P wave is “riding” this slur. In the inferior leads, the P wave is riding the Q wave, which is in fact a negative delta wave. Thus, this electrocardiogram represents preexcitation. The ST deviations are secondary to the preexcitation and have an orientation opposite to the delta wave.
Preexcitation may be associated with negative delta waves that mimic Q waves, and with ST elevation in the leads where the negative delta waves are seen, ie, ST elevation discordant with the delta wave (Figure 10). The QRS morphology and the delta wave allow preexcitation to be distinguished from STEMI.
HYPERKALEMIA
Figure 11. There are ST-segment elevations in leads V1–V4, ST-segment depressions in the inferior leads, and peaked T waves in leads V3–V5. These T waves have a narrow base and seem to “pull” the ST segment, creating ST elevation in the anterior leads and ST depression in the inferior leads (arrows). This shape is consistent with hyperkalemia. In addition, the downsloping ST elevation seen in V1 and V2 is consistent with hyperkalemia (arrowhead). Occasionally, STEMI may have a similar ST-T shape. An rSR’ pattern is seen in V1–V2; this is consistent with STEMI but also with hyperkalemia, in which conduction blocks are common. The serum potassium level was 7.4 mmol/L (normal 3.5–5), and coronary angiography revealed normal coronary arteries.
The most common finding in hyperkalemia is a peaked, narrow-based T wave that is usually, but not necessarily, tall. ST elevation may be evident in leads V1 to V3 (Figure 11). In contrast with hyperkalemia, the T wave of STEMI is typically wide.
OTHER CAUSES OF ST-SEGMENT ELEVATION
Takotsubo cardiomyopathy
Takotsubo cardiomyopathy mimics all electrocardiographic features of anteroapical STEMI. ST elevation may extend to the inferior leads but cannot be isolated in the inferior leads.39 As in apical STEMI, reciprocal ST depression is uncommon. Within 24 to 48 hours, ST elevation evolves into deep anterior T-wave inversion and a prolonged QT interval. Transient Q waves may be seen.
Myocarditis
Myocarditis may have one of two electrocardiographic patterns: a pericarditis pattern, or a typical STEMI pattern with Q waves sometimes localized to one area.40
Atrial flutter waves
Figure 12. Atrial flutter that simulates ST-segment elevation. An “F” indicates the negative flutter wave; an asterisk indicates the upslope of the flutter wave that is superimposed on the ST segment, mimicking ST elevation.
Atrial flutter waves, particularly of 2:1 atrial flutter, may deform the ST segment so that it mimics an injury pattern on the electrocardiogram. Flutter waves may mimic ST elevation or ST depression (Figure 12).
Large pulmonary embolism
A large pulmonary embolism may be associated with T-wave inversion in the anterior leads or the inferior leads, or both, reflective of cor pulmonale. Less commonly, ST elevation in the anterior or inferior leads is seen. In fact, changes of both anterior and inferior ischemia should always suggest a pulmonary embolism.41,42
Brugada syndrome
Figure 13. Type 1 Brugada pattern in V1 and V1, with a downsloping ST-segment elevation that creates a pseudo-R’ wave (pseudo-right bundle branch block). The QRS does not have a right bundle branch block morphology in leads V5 and V6.
Brugada syndrome is characterized by ST elevation and a right bundle branch block or pseudo-right bundle branch block pattern in at least two of the leads V1 to V3. In pseudo-right bundle branch block, the QRS adopts an rSR morphology in the anterior leads but is normal in the lateral leads. Type 1 Brugada pattern, the pattern that is most specifically associated with sudden death, is characterized by a coved, downsloping ST elevation of 2 mm or more with T-wave inversion (Figure 13).43 The Brugada pattern can be transient, triggered by fever, cocaine, or class I antiarrhythmic drugs.
Hyperkalemia, Brugada syndrome, and sometimes pulmonary embolism are characterized by an ST elevation that slopes downward (Figures 11 and 13), which contrasts with the upsloping, convex ST elevation of STEMI.
References
Rautaharju PM, Surawicz B, Gettes LS, et al; American Heart Association Electrocardiography and Arrhythmias Committee, Council on Clinical Cardiology; American College of Cardiology Foundation; Heart Rhythm Society. AHA/ACCF/HRS recommendations for the standardization and interpretation of the electrocardiogram: part IV: the ST-segment, T and U waves, and the QT interval: a scientific statement from the American Heart Association Electrocardiography and Arrhythmias Committee, Council on Clinical Cardiology; the American College of Cardiology Foundation; and the Heart Rhythm Society. Endorsed by the International Society for Computerized Electrocardiology. J Am Coll Cardiol 2009; 53:982–991.
Surawicz B, Knilans TK. Chou’s Electrocardiography in Clinical Practice: Adult and Pediatric. 5th ed. Philadelphia, PA: WB Saunders; 2001:194–207.
Smith SW, Khalil A, Henry TD, et al. Electrocardiographic differentiation of early repolarization from subtle anterior ST-segment elevation myocardial infarction. Ann Emerg Med 2012; 60:45–56.e2.
American College of Emergency Physicians; Society for Cardiovascular Angiography and Interventions; O’Gara PT, Kushner FG, Ascheim DD, et al. 2013 ACCF/AHA guideline for the management of ST-elevation myocardial infarction: a report of the American College of Cardiology Foundation/American Heart Association Task Force on Practice Guidelines. J Am Coll Cardiol 2013; 61:e78–e140.
Thygesen K, Alpert JS, Jaffe AS, et al; Joint ESC/ACCF/AHA/WHF Task Force for the Universal Definition of Myocardial Infarction. Third universal definition of myocardial infarction. Circulation 2012; 126:2020–2035.
Matetzky S, Freimark D, Chouraqui P, et al. Significance of ST segment elevations in posterior chest leads (V7 to V9) in patients with acute inferior myocardial infarction: application for thrombolytic therapy. J Am Coll Cardiol 1998; 31:506–511.
Brady WJ, Perron AD, Martin ML, Beagle C, Aufderheide TP. Cause of ST-segment abnormality in ED chest pain patients. Am J Emerg Med 2001; 19:25–28.
Brady WJ, Syverud SA, Beagle C, et al. Electrocardiographic ST-segment elevation: the diagnosis of acute myocardial infarction by morphologic analysis of the ST segment. Acad Emerg Med 2001; 8:961–967.
Smith SW. Upwardly concave ST-segment morphology is common in acute left anterior descending coronary occlusion. J Emerg Med 2006; 31:69–77.
Kosuge M, Kimura K, Ishikawa T, et al. Value of ST-segment elevation pattern in predicting infarct size and left ventricular function at discharge in patients with reperfused acute anterior myocardial infarction. Am Heart J 1999; 137:522–527.
Birnbaum Y, Sclarovsky S, Mager A, Strasberg B, Rechavia E. ST segment depression in a VL: a sensitive marker for acute inferior myocardial infarction. Eur Heart J 1993; 14:4–7.
Engelen DJ, Gorgels AP, Cheriex EC, et al. Value of the electrocardiogram in localizing the occlusion site in the left anterior descending coronary artery in acute anterior myocardial infarction. J Am Coll Cardiol 1999; 34:389–395.
Collins MS, Carter JE, Dougherty JM, Majercik SM, Hodsden JE, Logue EE. Hyperacute T-wave criteria using computer ECG analysis. Ann Emerg Med 1990; 19:114–120.
Smith SW. T/QRS ratio best distinguishes ventricular aneurysm from anterior myocardial infarction. Am J Emerg Med 2005; 23:279–287.
Surawicz B, Parikh SR. Prevalence of male and female patterns of early ventricular repolarization in the normal ECG of males and females from childhood to old age. J Am Coll Cardiol 2002; 40:1870–1876.
Klatsky AL, Oehm R, Cooper RA, Udaltsova N, Armstrong MA. The early repolarization normal variant electrocardiogram: correlates and consequences. Am J Med 2003; 115:171–177.
Mehta M, Jain AC, Mehta A. Early repolarization. Clin Cardiol 1999; 22:59–65.
Mehta MC, Jain AC. Early repolarization on scalar electrocardiogram. Am J Med Sci 1995; 309:305–311.
Rollin A, Maury P, Bongard V, et al. Prevalence, prognosis, and identification of the malignant form of early repolarization pattern in a population-based study. Am J Cardiol 2012; 110:1302–1308.
Tikkanen JT, Anttonen O, Junttila MJ, et al. Long-term outcome associated with early repolarization on electrocardiography. N Engl J Med 2009; 361:2529–2537.
Tikkanen JT, Junttila MJ, Anttonen O, et al. Early repolarization: electrocardiographic phenotypes associated with favorable long-term outcome. Circulation 2011; 123:2666–2673.
Noseworthy PA, Tikkanen JT, Porthan K, et al. The early repolarization pattern in the general population: clinical correlates and heritability. J Am Coll Cardiol 2011; 57:2284–2289.
Wasserburger RH. Observations on the juvenile pattern of adult negro males. Am J Med 1955; 18:428–437.
Kralios FA, Martin L, Burgess MJ, Millar K. Local ventricular repolarization changes due to sympathetic nerve-branch stimulation. Am J Physiol 1975; 228:1621–1626.
Spratt KA, Borans SM, Michelson EL. Early repolarization: normalization of the electrocardiogram with exercise as a clinically useful diagnostic feature. J Invasive Cardiol 1995; 7:238–242.
Surawicz B, Lasseter KC. Electrocardiogram in pericarditis. Am J Cardiol 1970; 26:471–474.
Hull E. The electrocardiogram in pericarditis. Am J Cardiol 1961; 7:21–32.
Spodick DH. Diagnostic electrocardiographic sequences in acute pericarditis. Significance of PR segment and PR vector changes. Circulation 1973; 48:575–580.
Spodick DH. Acute pericarditis: current concepts and practice. JAMA 2003; 289:1150–1153.
Charles MA, Bensinger TA, Glasser SP. Atrial injury current in pericarditis. Arch Intern Med 1973; 131:657–662.
Noth PH, Barnes HR. Electrocardiographic changes associated with pericarditis. Arch Intern Med 1940; 65:291–320.
Ginzton LE, Laks MM. The differential diagnosis of acute pericarditis from the normal variant: new electrocardiographic criteria. Circulation 1982; 65:1004–1009.
Armstrong EJ, Kulkarni AR, Bhave PD, et al. Electrocardiographic criteria for ST-elevation myocardial infarction in patients with left ventricular hypertrophy. Am J Cardiol 2012; 110:977–983.
Sgarbossa EB, Pinski SL, Barbagelata A, et al. Electrocardiographic diagnosis of evolving acute myocardial infarction in the presence of left bundle-branch block. GUSTO-1 (Global Utilization of Streptokinase and Tissue Plasminogen Activator for Occluded Coronary Arteries) Investigators. N Engl J Med 1996; 334:481–487.
Smith SW, Dodd KW, Henry TD, Dvorak DM, Pearce LA. Diagnosis of ST-elevation myocardial infarction in the presence of left bundle branch block with the ST-elevation to S-wave ratio in a modified Sgarbossa rule. Ann Emerg Med 2012; 60:766–776.
Madias JE, Sinha A, Agarwal H, Ashtiani R. ST-segment elevation in leads V1-V3 in patients with LBBB. J Electrocardiol 2001; 34:87–88.
Sgarbossa EB, Pinski SL, Topol EJ, et al. Acute myocardial infarction and complete bundle branch block at hospital admission: clinical characteristics and outcome in the thrombolytic era. GUSTO-I Investigators. Global Utilization of Streptokinase and t-PA [tissue-type plasminogen activator] for Occluded Coronary Arteries. J Am Coll Cardiol 1998; 31:105–110.
Bybee KA, Kara T, Prasad A, et al. Systematic review: transient left ventricular apical ballooning: a syndrome that mimics ST-segment elevation myocardial infarction. Ann Intern Med 2004; 141:858–865.
Magnani JW, Dec GW. Myocarditis: current trends in diagnosis and treatment. Circulation 2006; 113:876–890.
Sreeram N, Cheriex EC, Smeets JL, Gorgels AP, Wellens HJ. Value of the 12-lead electrocardiogram at hospital admission in the diagnosis of pulmonary embolism. Am J Cardiol 1994; 73:298–303.
Glancy DL, Mikdadi GM. Syncope in a 67-year-old man. Proc (Bayl Univ Med Cent) 2005; 18:74–75.
Wilde AA, Antzelevitch C, Borggrefe M, et al; Study Group on the Molecular Basis of Arrhythmias of the European Society of Cardiology. Proposed diagnostic criteria for the Brugada syndrome: consensus report. Circulation 2002; 106:2514–2519.
ST, ST segment, ST segment elevation, ST elevation myocardial infarction, STEMI, early repolarization, pericarditis, left bundle branch block, hyperkalemia, Elias Hanna, David Glancy
Legacy Keywords
ST, ST segment, ST segment elevation, ST elevation myocardial infarction, STEMI, early repolarization, pericarditis, left bundle branch block, hyperkalemia, Elias Hanna, David Glancy
Features of STEMI: (1) ST elevation that is straight or convex upward and blends with T to form a dome; (2) wide upright T or inverted T waves; (3) Q waves; (4) ST elevation or T waves that may approximate or exceed QRS height; and (5) reciprocal ST depression.
Features of early repolarization include a notched J point and ST elevation not exceeding 3 mm.
Features of pericarditis include PR depression greater than 1 mm and ST elevation less than 5 mm.
Features of left bundle branch block, left ventricular hypertrophy, and preexcitation: both ST and T are discordant to QRS; ST elevation is less than 25% of QRS height (and less than 2.5 mm in left ventricular hypertrophy); and delta waves, short PR, and pseudo-Q waves are seen in preexcitation.
Features of hyperkalemia include narrow-based, peaked T waves “pulling” the ST segment.
Disallow All Ads
Alternative CME
Consolidated Pubs: Do Not Show Source Publication Logo
A 40-year-old man with end-stage renal disease on intermittent hemodialysis presented to the emergency department with a 1-week history of pain affecting his left lower back, left flank, and left lower abdomen, diagnosed as zoster prodrome.
Figure 1. Marked corneal opacification, noted in both eyes, was most severe in the limbus.
Of note, both corneas were cloudy, most severely in the limbus (Figure 1). His visual acuity and findings on funduscopic examination were normal.
CORNEAL OPACITY
The finding of corneal opacity should prompt an immediate ophthalmologic evaluation by the internist as well as an ophthalmologist. The initial examination should include visual acuity testing; gross examination with the naked eye; penlight examination of the pupil, conjunctiva, and anteriorchamber; funduscopic examination to at least confirm a red reflex; and fluorescein examination of the cornea. Fluorescein testing is done last, as the dye may interfere with the other initial tests.1
A number of causes of opacity
A number of conditions can cause corneal opacity. Several genetic conditions can cause developmental anomalies of the cornea, leading to corneal defects present at birth.2 Causes of secondary corneal opacity in early infancy include infections such as herpes, iatrogenic injury during amniocentesis or forceps delivery, and infantile congenital glaucoma.2
Later in life, causes of corneal opacity include cataract, glaucoma, chemical exposure, foreign body injury, irradiation, infection (eg, syphilis, herpes, chlamydia), endophthalmitis, and metabolic genetic disorders such as Fabry disease, trisomy 18 syndrome, and lecithin-cholesterol acyltransferase (LCAT) deficiency.3
LCAT DEFICIENCY
LCAT is a key protein in reverse transport of cholesterol from the systemic circulation to the liver for excretion into the bile. Its deficiency results in low serum concentrations of high-density lipoprotein cholesterol (HDL-C).4 About 80 different mutations in the LCAT gene have been linked to LCAT deficiency.5
LCAT deficiency varies in severity. Patients with complete deficiency can have nearly undetectable levels of HDL-C, eruptive xanthoma, hepatosplenomegaly, and premature coronary artery disease (ie, by age 40).5,6 Features of coronary atherosclerosis can be lacking in patients with partial deficiency.
Regardless of the degree of LCAT deficiency, most patients have corneal opacification that is most severe near the limbus (thus, the term “fish eye syndrome”) and anemia.7 Although corneal opacification presents early in life and persists, it does not seem to affect vision.5 The anemia is associated with enhanced fractional clearance of red blood cells secondary to hypersplenism.8
LCAT deficiency and the kidneys
LCAT deficiency has its most devastating effect on the kidney. Renal disease begins early in life with mild proteinuria and microscopic hematuria. With increasing age, renal function deteriorates and proteinuria and hematuria worsen.9
Renal biopsy study may reveal foam cells in the glomerular tufts, arterioles with thickened intima and narrowed lumens, and subendothelial deposits of lipids in the renal arteries and arterioles.10 Some studies have suggested that kidney disease is most likely initiated by lipid deposition or cellular uptake of lipoproteins in the glomerular basement membrane, mesangium, and capillary subendothelium.
Treatment
There are few treatment options for patients with LCAT deficiency. Control of hypertension, if present, may halt or slow renal deterioration.5 Many patients eventually require dialysis, and some undergo renal transplantation, but the renal disease can recur.
OUR PATIENT
Our patient had a known diagnosis of LCAT deficiency. Five years before this presentation at our emergency department, he developed malignant hypertension, followed shortly by renal disease. Over the next 4 years, his kidney function deteriorated, culminating in the need for dialysis; his corneal opacities manifested and gradually worsened; and after extensive studies including kidney biopsies, he was finally diagnosed with LCAT deficiency.
He also exhibited a chronically low level of HDL-C (2 to 5 mg/dL) and significant coronary artery disease. Although unrelated, his zoster pain was treated with renally dosed acyclovir and gabapentin. He never demonstrated the characteristic rash, and his pain improved significantly within 5 days of treatment.
References
Knox KA, McIntee J. Nurse management of corneal abrasion. Br J Nurs 1995; 4:440–460.
Nischal KK. Congenital corneal opacities—a surgical approach to nomenclature and classification. Eye (Lond) 2007; 21:1326–1337.
Chiapella AP, Rosenthal AR. One year in an eye casualty clinic. Br J Ophthalmol 1985; 69:865–870.
Rosenson RS, Brewer HB Jr, Davidson WS, et al. Cholesterol efflux and atheroprotection: advancing the concept of reverse cholesterol transport. Circulation 2012; 125:1905–1919.
Roshan B, Ganda OP, Desilva R, et al. Homozygous lecithin:cholesterol acyltransferase (LCAT) deficiency due to a new loss of function mutation and review of the literature. J Clin Lipidol 2011; 5:493–499.
Kuivenhoven JA, van Voorst tot Voorst EJ, Wiebusch H, et al. A unique genetic and biochemical presentation of fish-eye disease. J Clin Invest 1995; 96:2783–2791.
Palmiero PM, Sbeity Z, Liebmann J, Ritch R. In vivo imaging of the cornea in a patient with lecithin-cholesterol acyltransferase deficiency. Cornea 2009; 28:1061–1064.
Norum KR, Gjone E. Familial serum-cholesterol esterification failure. A new inborn error of metabolism. Biochim Biophys Acta 1967; 144:698–700.
Gjone E, Norum KR. Familial serum cholesterol ester deficiency. Clinical study of a patient with a new syndrome. Acta Med Scand 1968; 183:107–112.
Lager DJ, Rosenberg BF, Shapiro H, Bernstein J. Lecithin cholesterol acyltransferase deficiency: ultrastructural examination of sequential renal biopsies. Mod Pathol 1991; 4:331–335.
Omer Ibrahim, MD Department of Dermatology, Cleveland Clinic
Linda Amah, MD Department of Internal Medicine, Cleveland Clinic
Sharon E. Mace, MD, FACEP, FAAP Professor of Medicine, Cleveland Clinic Lerner College of Medicine of Case Western University, Cleveland, OH; Director of Research and Director of Observation Unit, Emergency Services Institute, Cleveland Clinic; Faculty, Emergency Medicine Residency Program, MetroHealth Medical Center/Cleveland Clinic, Cleveland, OH
Address: Omer Ibrahim, MD, Department of Dermatology, A61, Cleveland Clinic, 9500 Euclid Avenue, Cleveland, OH 44195; e-mail: [email protected]
Author and Disclosure Information
Omer Ibrahim, MD Department of Dermatology, Cleveland Clinic
Linda Amah, MD Department of Internal Medicine, Cleveland Clinic
Sharon E. Mace, MD, FACEP, FAAP Professor of Medicine, Cleveland Clinic Lerner College of Medicine of Case Western University, Cleveland, OH; Director of Research and Director of Observation Unit, Emergency Services Institute, Cleveland Clinic; Faculty, Emergency Medicine Residency Program, MetroHealth Medical Center/Cleveland Clinic, Cleveland, OH
Address: Omer Ibrahim, MD, Department of Dermatology, A61, Cleveland Clinic, 9500 Euclid Avenue, Cleveland, OH 44195; e-mail: [email protected]
A 40-year-old man with end-stage renal disease on intermittent hemodialysis presented to the emergency department with a 1-week history of pain affecting his left lower back, left flank, and left lower abdomen, diagnosed as zoster prodrome.
Figure 1. Marked corneal opacification, noted in both eyes, was most severe in the limbus.
Of note, both corneas were cloudy, most severely in the limbus (Figure 1). His visual acuity and findings on funduscopic examination were normal.
CORNEAL OPACITY
The finding of corneal opacity should prompt an immediate ophthalmologic evaluation by the internist as well as an ophthalmologist. The initial examination should include visual acuity testing; gross examination with the naked eye; penlight examination of the pupil, conjunctiva, and anteriorchamber; funduscopic examination to at least confirm a red reflex; and fluorescein examination of the cornea. Fluorescein testing is done last, as the dye may interfere with the other initial tests.1
A number of causes of opacity
A number of conditions can cause corneal opacity. Several genetic conditions can cause developmental anomalies of the cornea, leading to corneal defects present at birth.2 Causes of secondary corneal opacity in early infancy include infections such as herpes, iatrogenic injury during amniocentesis or forceps delivery, and infantile congenital glaucoma.2
Later in life, causes of corneal opacity include cataract, glaucoma, chemical exposure, foreign body injury, irradiation, infection (eg, syphilis, herpes, chlamydia), endophthalmitis, and metabolic genetic disorders such as Fabry disease, trisomy 18 syndrome, and lecithin-cholesterol acyltransferase (LCAT) deficiency.3
LCAT DEFICIENCY
LCAT is a key protein in reverse transport of cholesterol from the systemic circulation to the liver for excretion into the bile. Its deficiency results in low serum concentrations of high-density lipoprotein cholesterol (HDL-C).4 About 80 different mutations in the LCAT gene have been linked to LCAT deficiency.5
LCAT deficiency varies in severity. Patients with complete deficiency can have nearly undetectable levels of HDL-C, eruptive xanthoma, hepatosplenomegaly, and premature coronary artery disease (ie, by age 40).5,6 Features of coronary atherosclerosis can be lacking in patients with partial deficiency.
Regardless of the degree of LCAT deficiency, most patients have corneal opacification that is most severe near the limbus (thus, the term “fish eye syndrome”) and anemia.7 Although corneal opacification presents early in life and persists, it does not seem to affect vision.5 The anemia is associated with enhanced fractional clearance of red blood cells secondary to hypersplenism.8
LCAT deficiency and the kidneys
LCAT deficiency has its most devastating effect on the kidney. Renal disease begins early in life with mild proteinuria and microscopic hematuria. With increasing age, renal function deteriorates and proteinuria and hematuria worsen.9
Renal biopsy study may reveal foam cells in the glomerular tufts, arterioles with thickened intima and narrowed lumens, and subendothelial deposits of lipids in the renal arteries and arterioles.10 Some studies have suggested that kidney disease is most likely initiated by lipid deposition or cellular uptake of lipoproteins in the glomerular basement membrane, mesangium, and capillary subendothelium.
Treatment
There are few treatment options for patients with LCAT deficiency. Control of hypertension, if present, may halt or slow renal deterioration.5 Many patients eventually require dialysis, and some undergo renal transplantation, but the renal disease can recur.
OUR PATIENT
Our patient had a known diagnosis of LCAT deficiency. Five years before this presentation at our emergency department, he developed malignant hypertension, followed shortly by renal disease. Over the next 4 years, his kidney function deteriorated, culminating in the need for dialysis; his corneal opacities manifested and gradually worsened; and after extensive studies including kidney biopsies, he was finally diagnosed with LCAT deficiency.
He also exhibited a chronically low level of HDL-C (2 to 5 mg/dL) and significant coronary artery disease. Although unrelated, his zoster pain was treated with renally dosed acyclovir and gabapentin. He never demonstrated the characteristic rash, and his pain improved significantly within 5 days of treatment.
References
Knox KA, McIntee J. Nurse management of corneal abrasion. Br J Nurs 1995; 4:440–460.
Nischal KK. Congenital corneal opacities—a surgical approach to nomenclature and classification. Eye (Lond) 2007; 21:1326–1337.
Chiapella AP, Rosenthal AR. One year in an eye casualty clinic. Br J Ophthalmol 1985; 69:865–870.
Rosenson RS, Brewer HB Jr, Davidson WS, et al. Cholesterol efflux and atheroprotection: advancing the concept of reverse cholesterol transport. Circulation 2012; 125:1905–1919.
Roshan B, Ganda OP, Desilva R, et al. Homozygous lecithin:cholesterol acyltransferase (LCAT) deficiency due to a new loss of function mutation and review of the literature. J Clin Lipidol 2011; 5:493–499.
Kuivenhoven JA, van Voorst tot Voorst EJ, Wiebusch H, et al. A unique genetic and biochemical presentation of fish-eye disease. J Clin Invest 1995; 96:2783–2791.
Palmiero PM, Sbeity Z, Liebmann J, Ritch R. In vivo imaging of the cornea in a patient with lecithin-cholesterol acyltransferase deficiency. Cornea 2009; 28:1061–1064.
Norum KR, Gjone E. Familial serum-cholesterol esterification failure. A new inborn error of metabolism. Biochim Biophys Acta 1967; 144:698–700.
Gjone E, Norum KR. Familial serum cholesterol ester deficiency. Clinical study of a patient with a new syndrome. Acta Med Scand 1968; 183:107–112.
Lager DJ, Rosenberg BF, Shapiro H, Bernstein J. Lecithin cholesterol acyltransferase deficiency: ultrastructural examination of sequential renal biopsies. Mod Pathol 1991; 4:331–335.
From the Department of Medicine, University of Pennsylvania, and the Department of Emergency Medicine, Thomas Jefferson University Hospital, Philadelphia, PA.
Abstract
Objective: To detail strategies to improve sepsis recognition and the quality of care provided to the septic patient.
Methods: Review of the literature.
Results: Severe sepsis affects nearly 3 million individuals each year in the United States, and cost estimates for these hospitalizations exceed $24 billion. Effective management is predicated on timely recognition. In this review, we detail strategies to improve early identification of potentially septic patients as well as the quality of care provided to the septic patient in the emergency department (ED). The strategies discussed are based upon an understanding of the signs and symptoms of sepsis and the clinical risk factors associated with sepsis, which can be used to design novel strategies to screen patients for sepsis and risk stratify patients at risk for clinical deterioration.
Conclusion: ED structures and processes can be used to increase adherence with sepsis management guidelines to improve patient outcomes.
Severe sepsis affects nearly 3 million individuals each year in the United States and cost estimates for these hospitalizations exceed $24 billion [1–3]. Sepsis is a life-threatening condition characterized by a suspected or identified infection accompanied by a vigorous host inflammatory response. In severe sepsis, end-organ dysfunction manifests in myriad forms, including altered mental status, acute kidney injury, liver dysfunction, pulmonary dysfunction, and hemodynamic compromise [4,5]. This protean presentation of a deadly condition makes identification and risk stratification both challenging and essential to improving patient outcomes. The majority of patients with severe sepsis will receive their initial care within an emergency department (ED) [6,7]. It is essential that emergency medicine providers have the means to appropriately identify patients presenting with severe sepsis in a timely manner—thus facilitating life-saving measures such as early intravenous fluid resuscitation and administration of timely and appropriate antimicrobials.
In this review, we detail strategies to improve sepsis recognition and the quality of care provided to the septic patient in the ED. The strategies discussed are based upon an understanding of the signs and symptoms of sepsis and the clinical risk factors associated with sepsis, which can be used to design novel strategies to screen patients for sepsis and risk stratify patients for clinical deterioration. Then, we review suggested ED structures and processes to increase adherence with sepsis-based guidelines to improve patient outcomes. Successful implementation is predicated on hospital administrative support towards the efforts given the time and resources required and strong and committed leadership across the health care system.
Epidemiology of Severe Sepsis
Estimates of annual cases of severe sepsis vary, ranging from 1 million to 3 million cases in the United States [1–3]. In-hospital mortality for this condition ranges from 14% to 30% [5]. The incidence of severe sepsis in the United States has been increasing at a rate of 13% annually, with an estimated cost of greater than $24 billion per year [1,2]. In 2 large cohorts of hospitalized patients, it was found that sepsis contributed to 1 in every 2 to 3 deaths following inpatient admission [8]. Coincident with these increased estimates, advances in the early identification and treatment of sepsis have led to decreasing mortality rates over the past decade [1,9].
Of importance to the ED clinician, an episode of sepsis has long-term effects on cognitive and physical function, quality-of-life, and survival [10,11]. Post-discharge, approximately one-quarter of sepsis survivors will be readmitted within 30 days [12–14]. In as many as half of these instances, another life-threatening infection is the cause for readmission, making the past medical history, including a detailed accounting of recent episodes of sepsis, an important part of the initial ED evaluation [12]. Furthermore, severe sepsis survivors spend a large proportion of their time following discharge within a health care facility, and will frequently present to the ED with an acute condition from such an environment. Important factors for predicting readmission after a sepsis hospitalization include patient age, severity of illness, hospital length of stay, and the need for intensive care during the initial hospitalization [12–14].
Principles of Effective Sepsis Management
The principles of effective sepsis management begin with early identification in the pre-hospital setting, at triage, or when a patient begins to decompensate in the hospital. After the point of initial recognition, core principles include risk stratification, timely and appropriate antimicrobial administration, initial intravenous fluid boluses and ongoing resuscitation guided by physical examination and objective resuscitation end-points [4,5]. These practices have been operationalized in the care bundles of the Surviving Sepsis Campaign Guidelines [4]. Within 3 hours, the resuscitation bundle includes measuring serum lactate to risk stratify patients, obtaining blood cultures, administering broad-spectrum antibiotics, and administering 30 mL/kg crystalloid in patients with hypotension or hyperlactatemia [4]. The 6-hour bundle expands upon these initial measures and includes additional management recommendations based on resuscitation end-points.
As effective management is predicated on timely recognition, an understanding of the impact of delayed recognition is essential to provide optimal care for the severe sepsis patient in the ED. Decades of research has revealed that certain markers predict adverse outcomes, including transition to septic shock and death, as do delayed processes of care. Importantly, while early quantitative resuscitation was demonstrated to improve outcomes in a meta-analysis, there was no demonstrable benefit when resuscitation was initiated late (> 24 hours) in the course in the ICU (odds ratio of death, 1.16 [95% confidence interval, 0.60–2.22]) [15].
Strategies To Improve Recognition
Pre-Hospital Environment
As many as 40% of severe sepsis cases admitted to the hospital from the ED will present to the ED via emergency medical services (EMS) transport, and this rate appears to be increasing over time [16]. Thus, efforts to improve identification and risk-stratification of potential cases of severe sepsis should begin in the pre-hospital environment. These EMS encounters frequently exceed 45 minutes [16], pre-hospital interventions appear to be uncommon [16,17], and establishment of intravenous access paired with fluid resuscitation in the pre-hospital environment may improve survival [18]. Further, when EMS providers recognize sepsis, ED care processes (eg, time to antibiotics, protocol-directed resus-citation) are improved, with shorter time to antibiotics and initiation of early goal-directed therapy (EGDT) [19] and a trend towards achieving goal mean arterial pressure earlier [17]. In sum, while further investigation is required to facilitate this transition, efforts to improve sepsis outcomes should also include the interface between the pre-hospital environment and the ED (Figure).
From EMS to ED Triage
Borrowing the principle “time equals tissue” from a variety of time sensitive conditions (eg, myocardial infarction management [“time equals muscle”] and stroke care [“time equals brain”]), clinicians and researchers have realized that expedited recognition of severe sepsis patients begins at the time of initial contact with the health care system. For severe sepsis patients, clinicians need to think “time equals organ function.” Given the frequency with which sepsis patients arrive to the ED via EMS, effective communication between EMS and ED providers could be leveraged to prepare the ED team to provide timely care for the sepsis patient via a “sepsis alert.” While confirmation of its applicability to sepsis care is required in the absence of a regionalized network of sepsis centers, the rationale is based on the experience of the effectiveness of trauma and stroke alert systems [20–22]. For patients not recognized as potentially being infected by EMS providers during transport, repeat vital signs during ED triage can be screened to identify patients exhibiting signs of the systemic inflammatory response syndrome (SIRS) [4,23]. The same principles of effective communication apply for patients being sent from medical clinics to the ED for evaluation and treatment of potential severe sepsis. For patients arriving independent of EMS, focused triage and initial vital signs are the starting point for identifying severe sepsis at the most proximal phase of entry into the health care system.
Vital Signs and SIRS Criteria in the ED
The vast majority of patients who are hypotensive in triage are expedited to a treatment room and early resuscitation is begun. However, these patients represent a minority of severe sepsis patients seen in triage; therefore, all available data need to be analyzed to capture the highest percentage of severe sepsis patients. Acknowledging that SIRS criteria are not specific for sepsis [24], will miss as many as 1 out of 8 patients initially [25], and may not predict mortality [26], their presence is nonetheless characteristic of sepsis. As such, identifying the presence of SIRS at triage, or during the ED stay via serial vital signs, facilitates sepsis recognition, as do strategies that leverage routine vital signs to calculate predictors of instability including the shock index (heart rate/systolic blood pressure), where a shock index ≥ 0.7 has been associated with illness severity [27]. An increased respiratory rate has been demonstrated to identify risk for transfer from a floor bed to the ICU within 24 hours of ED admission [28]. Further, clinical manifestations of sepsis, including end-organ dysfunction, are protean, and patients frequently present with nonspecific, constitutional symptoms (eg, weakness, malaise, fever, chills, nausea) that could reflect one of many diseases (Table 1).
The Afferent Arm: Multimodal Screening Strategies
While institutional practice improvement initiatives to facilitate sepsis recognition and care should incorporate educational strategies, led by champions with expertise in sepsis, the complex presentation of sepsis requires multimodal approaches [29]. These multimodal approaches, beginning at the time of ED triage, should be designed to harness information technology to screen patients to improve severe sepsis recognition (the afferent arm) and to utilize structures and processes of care efficiently and effectively (the efferent arm) to guide severe sepsis management according to sepsis-care bundles espoused by guidelines (Figure) [4].
Operational processes to screen for sepsis in the ED will need to account for ED organizational flow (eg, average time from registration to triage, average time from triage to being seen by a physician, average length of stay in the ED, number of hospital beds) and hand-off practices (eg, care transition from ED team to floor or ICU team, or within ED at shift change). For ED organizations with shorter ED lengths of stay (eg, < 2 hours), screening practices at ED triage will serve as the focal point to identify cases of sepsis. Boarding, defined as caring for a patient in the ED pending transfer, is common, increasing as a result of ED closures [30,31], and associated with prolonged hospital length of stay and increased in-hospital mortality when ICU transfer is delayed [32]. Sepsis patients in particular appear to be a vulnerable group of patients. While many explanations exist to account for the relationship between delayed transfer and adverse outcomes, timely recognition and management of the septic patient could be compromised with prolonged boarding. To combat this potential effect, continual assessment during the entire ED stay may unmask an initially unclear presentation of sepsis.
One strategy to identify sepsis in ED organizations with prolonged ED lengths of stay is through the use of a track-and-trigger system, or early warning system. Traditionally, track-and-trigger systems were implemented on the hospital wards, as means to identify physiological deterioration in a timely manner to prevent clinical deterioration [33]. More recently, early warning systems have been used to identify patients with sepsis on the hospital wards and within EDs, as these systems rely on physiological parameters such as SIRS that are cardinal features of sepsis [34]. However, given the potential for alert fatigue, designing a system that operates with high accuracy is imperative.
Efforts are underway to redefine sepsis, using a simplified approach and readily available physiological variables, with the main goal of targeting those most at-risk of an adverse outcome during the hospitalization. Simultaneously, an understanding of the overt and more occult manifestations are essential to incorporate into the clinical decision-making and pattern recognition required to identify sepsis in a timely and accurate manner. InTable 2, the signs and symptoms that may serve as flags for severe sepsis are presented.
Mature early warning systems, designed to leverage the electronic medical record (EMR) by capturing vital signs, laboratory measures, (eg, elevated serum creatinine compared to a recent hospitalization) and symptoms (eg, altered mental status), are well-positioned to herald clinical deterioration (eg, cardiac arrest) with improved accuracy [35] and to be applied to sepsis specifically [34]. While sophisticated analytical strategies, such as machine learning, are being used to improve the test characteristics of these early warning systems, iterative, prospective chart review is an essential and complementary performance improvement step to refine the process. Further, chart review affords the opportunity to ensure compliance with sepsis care bundles.
Knowledge of the risk factors associated with development of sepsis is critical for the front-line emergency physician and nurse. Additionally, as many of these risk factors are associated with adverse outcomes, including unplanned ICU transfer and in-hospital mortality, which occur in as many as one out of 8 patients admitted directly to the ward, they have utility for early risk-stratification and triaging purposes in the ED. Advanced age and pre-existing comorbid conditions, particularly an oncologic diagnosis and/or chronic organ dysfunction, are major risk factors for sepsis and worse outcomes result in those who develop sepsis [2]. Further, illness severity, including an elevated serum lactate level, is associated with adverse outcomes. These factors can be incorporated into triage decisions and/or close monitoring for patients admitted to the general ward [36]. Conversely, because patients admitted to the ICU setting and subsequently stepped down through their hospitalization may experience better outcomes compared to patients admitted to the general ward who then require step-up to an ICU setting (37,38), attention to triage practices is critical.
These complementary strategies, which serve as the afferent arm of the system, summon health care providers to the bedside of a vulnerable patient. However, clinical effectiveness in the management of severe sepsis requires a robust, sophisticated, and mature efferent arm capable of delivering expert care to the now recognized septic patient.
Principles of Effective Management Post-Recognition
Risk Stratification
An elevated serum lactate level was initially described in pathological states in the mid 19th century by Johann Joseph Scherer [39] and has long been associated with increased mortality in hospitalized patients [40]. Lactate is a useful biomarker for risk stratification in a variety of patients arriving to the ED, particularly those who have been identified at high risk for sepsis. Jansen and colleagues examined the measurement of pre-hospital serum lactate at the time of paramedic on-scene assessment in a group of acutely ill patients [41]. Patients with point-of-care lactate levels of 3.5 mmol/L or greater were found to have an in-hospital mortality of 41% versus 12% for those with lactate levels less than 3.5 mmol/L. Within the population with an elevated lactate, patients with a systolic blood pressure greater than 100 mgHg experienced a mortality of nearly 30%, while it was greater than 50% in hypotensive patients with an elevated lactate, highlighting the value of both hemodynamic and serum lactate measures. Upon arrival to the ED, lactate measurements have a strong correlation with mortality. In one retrospective cohort, lactate level was linearly associated with mortality in a broad array of patients older than age 65 years [42]. An initial serum lactate level in the ED in the intermediate (2.0 – 3.9 mmol/L) or high range (≥ 4 mmol/L) has been associated with increased odds of death 2 to 5 times higher independent of organ dysfunction in severe sepsis specifically [43].
As the association between serum lactate levels and death is independent of organ dysfunction, serum lactate is a simple and reliable tool to both enhance detection and risk-stratify patients presenting to the ED with severe sepsis. Given the frequency with which hyperlactatemia is present in patients with suspected infection [43], operationalizing serum lactate measures with the initial phlebotomy draw is an important step to risk-stratify patients. This step can be coupled later with intravenous fluid resuscitation for those with marked elevations (≥ 4 mmol/L), in accord with guideline recommendations [4]. Screening of initial lactate values can be further expedited by utilizing fingerstick point-of-care lactate devices [44]. Last, while serial lactate measures can be incorporated into triage decisions, there is no clear threshold that warrants ICU admission. Rather, persistent elevations in serum lactate can be used to identify patients who require close observation regardless of their admission location.
Several scoring systems have been developed to augment sepsis risk stratification within the ED. The most prominent of these are the Predisposition Insult Response and Organ failure (PIRO), Sequential Organ Failure Assessment (SOFA), and Mortality in the Emergency Department Sepsis (MEDS) scores, and the National early warning score (NEWS) [45-48]. The MEDS score incorporates host factors including age and co-morbid illness, as well as physiologic and laboratory tests which can be obtained rapidly in an ED setting. Multiple prospective and retrospective examinations of the MEDS scoring systems have demonstrated that it performs optimally in ED patients with sepsis but not those with severe sepsis, in terms of predicting 30-day mortality [46,47]. The PIRO score more extensively incorporates predisposing co-morbidities, physiologic and laboratory parameters, and has been modified to consider presumed source of infection, leading to a stronger predictive ability for mortality in more severely ill patients. In patients presenting to the ED with severe sepsis and septic shock, a prospective observational study found the PIRO to be the best predictor of mortality, compared to SOFA and MEDS scores [45]. In a recent study by Corfield et al, sepsis patients with a higher NEWS, according to initial ED vital signs (temperature, pulse, respiratory rate, systolic blood pressure, oxyhemoglobin saturation) and consciousness level, were significantly more likely to be admitted to an ICU within 48 hours or to experience in-hospital mortality [48].
Timely and Appropriate Antibiotics
In a landmark study published by Kumar and colleagues in 2006, the relationship between timing of antibiotics and mortality was established [49]. In 2731 adult septic shock patients, mortality increased 7.6% for every hour delay in effective antimicrobial administration. A striking finding, given that the study population was limited to patients cared for in the ICU, was the fact that only 50% of patients received appropriate antibiotics within 6 hours of onset of shock and nearly one-quarter of patients did not receive antibiotics until the 15th hour. As a direct result, in-hospital mortality was observed to be 58% in this study.
Over the ensuing decade, a series of studies have demonstrated a narrowing of the quality gap in this regard, and the result has coincided with a significant improvement in survival. In 2010, Gaieski and colleagues demonstrated a significant improvement in the prompt administration of antibiotic delivery in patients presenting to an ED with severe sepsis, with the median time from shock onset (sustained hypotension or lactate ≥ 4 mmol/L) to antibiotics down to 42 minutes [50]. Importantly, consistent with the Kumar study, time to appropriate antibiotics, rather than simply initial antibiotics, remained associated with in-hospital mortality independent of initiating early goal-directed therapy. In 2011, Puskarich and colleagues revealed that time to antibiotics continued to improve and, as a result, the investigators did not identify a relationship between time from triage to antibiotics and in-hospital mortality [51]. However, when antibiotics were delayed until after shock recognition, consistent with the study by Kumar and colleagues, survival decreased. Until recently, this important observation was challenging to operationalize clinically as little was known about how to facilitate risk-stratification of those at risk to develop shock. However, Capp and colleagues recently found that deterioration to septic shock 48 hours after ED presentation occurs in approximately one out of eight patients and identified gender (female), transient hypotension, and/or hyperlactatemia upon presentation as risk factors associated with such a deterioration [52].
As an essential element of sepsis care bundles, a focus on timely use of antibiotics in patients with suspected infection, has the potential to increase the use of antibiotics in the ED in patients determined subsequently to not be infected. To combat this acknowledged downstream effect, reconsideration of the utility of empiric antibiotics 48 to 72 hours after admission is required. This step can be accomplished through the use of a sepsis care pathway and/or a formal antibiotic stewardship program.
Quantitative Resuscitation
Rivers and colleagues, in a landmark 2001 trial, examined the effectiveness of a protocolized resuscitation strategy in the most proximal phase of severe sepsis and septic shock [53]. A distinguishing characteristic between the usual care arm and the intervention in this ED-based study, in addition to whether mixed central venous oxygen saturation was measured as a resuscitation end-point, was the inclusion of an ED provider at the bedside to attend to clinical management. The intervention, aimed at achieving physiologic targets, resulted in significantly more fluid resuscitation (3.5 L vs. 5.0 L within the first 6 hours) and a significant decrease in in-hospital mortality compared to the usual care arm (46.5 vs. 30.5%). The study revolutionized the culture and practice of sepsis care, in part by shining a light on the importance of timely resuscitation at the most proximal point of contact between the patient and the healthcare system. It also highlighted the importance of integrating serum lactate measurement into the early screening and risk stratification processes for sepsis care delivery.
The 2014 randomized trial of Protocol-Based Care for Early Septic Shock (ProCESS) revisited this concept, comparing the Rivers 2001 protocol to both a current guideline-based non-invasive algorithmic protocol and what had become usual ED care in the interim [54]. The ProCESS trial, which operationalized a team of bedside providers to direct care for each of the 3 distinct arms, found no significant difference between the arms in terms of 90-day and 1-year mortality, but mortality was approximately 10% less in all arms compared with the intervention arm of the Riverstrial. Further, subjects in each of the 3 arms received in excess of 2 L intravenous fluid resuscitation pre-randomization and 4.4–5.5 L when resuscitation spanned from pre-randomization to 6 hours post-randomization. The conclusion drawn is that the commonalities between the arms—early fluid resuscitation, early antibiotics, and the option to use physiologic measures as markers of the adequacy of treatment, all guided by bedside ED providers—are the most important factors for surviving sepsis. And the result is that practitioners have refined these tools over a decade, leading to steady improvements in survival.
Consistent with the ProCESS trial, a recent Australia and New Zealand trial confirmed no significant difference in 90-day mortality between protocolized EGDT and current usual care for septic shock within an ED [55]. Consistent with ProCESS and ProMISe [56], subjects enrolled in ARISE received in excess of 2.5 L in resuscitation pre-randomization, which when paired with fluid resuscitation in the 0-6 hour post-randomization period (1.96 L in the EGDT arm and 1.71 in the usual-care arm) resulted in resuscitation in the 4.5 to 5L range during the initial resuscitation. The ARISE trial was unique in that appropriate antibiotic administration was a requirement prior to randomization, ensuring that this important driver of mortality reduction was standardized between the two arms of the trial. In summary, while the ideal fluid resuscitation amount is unknown, requires a personalized approach, and further investigation is required to effectively incorporate non-invasive measures to guide fluid responsiveness, early and aggressive resuscitation paired with early antibiotic administration are essential aspects of effective sepsis management.
The Efferent Arm: Structure And Processes To Improve Outcomes
The efferent arm of the system, beyond risk stratification, requires the implementation of optimal staffing and processes to care for the septic patient. While options will vary, preparation is a requisite, as are strategies that efficiently lead the clinician at the bedside to the use of evidence-based medicine (Table 2).
Personnel and Staffing
Quality care for the septic patient requires immediate availability of a multidisciplinary care team, including physicians and nurses with critical care experience who can be rapidly deployed to the bedside. The location of care provision may include on-going care in the initial ED room assignment or transfer to a dedicated area for the care of the critically ill patient within the ED.
To provide optimal care in the era of overcrowding and delayed transfer to an ICU, a movement towards ED intensive care units (ED-ICUs) has emerged [57]. The models of practice range from a model based upon ED intensivists, with expertise in critical care medicine, providing care within the traditional structure of an ED, to a model wherein a portion of the ED is assigned for the care of the critically ill for extended periods of time beyond the initial resuscitation. As these models mature from resuscitation bays capable of scaling up based on need to dedicated ED-ICUs, investments in shared Unit leadership (physician and nursing), staffing (physician, critical care nursing, respiratory therapy, critical care pharmacist) and processes of care (eg, multidisciplinary rounds) in line with established ICUs will be necessary.
While attractive conceptually, large-scale implementation of this movement is unlikely to occur outside of tertiary care academic medical centers. In the many EDs across the US without ED intensivists, and confronted with limited clinician resources, flexible physician and nursing staffing models will be necessary to ensure that care provisions are in accord with established guidelines. Potential solutions to provide the resources to meet the needs of these high-intensity patients include critical care consultation and a strategy traditionally applied to the ICU, telemedicine [58]. Last, given the relationship between hospital volume and mortality in severe sepsis [59,60], timely transfer to a high-volume center for specific cases may be appropriate, although the optimal timing, case selection, and impact of transfer on outcomes warrant further examination.
Clinical Decision Support Strategies
To complement the identification and risk-stratification available by screening and scoring systems, clinical decision support systems are novel tools to improve outcomes in the era of electronic medical records (EMR). Specific to sepsis care delivery, performance improvement initiatives including audit-and-feedback practice can increase severe sepsis guideline adherence, and even modest improvements in adherence appear to lead to sustained improvements that contributed to a 25% relative risk reduction in the observed mortality rate [61,62]. Clinical decision support tools can be used to link early recognition to optimal care processes, such as the Surviving Sepsis Campaign resuscitation and management bundles. The use of prompts as strategies to ensure that bundles of care are ordered and carried out is an important aspect to operationalize during the design phase [63].
Significant preparation is required to effectively carry out the clinical decision support design strategy. For example, to ensure timely antibiotic dispensing, a number of process steps will be required, including prompt notification to a central pharmacist or preferably, an ED pharmacist with access to a local pharmacy pre-stocked with commonly used antibiotics [64]. In addition, the use of an institution-specific antibiogram within the physician computer-order entry sepsis order set, that includes site-specific recommendations (eg, pulmonary, gastrointestinal source) and susceptibility patterns, is an essential aspect of optimal sepsis processes of care. Last, the antibiogram will need to be frequently updated to include season-specific (eg, oseltamivir administration for high-risk cases during influenza season) recommendations to ensure that providers are prompted with the most up-to-date clinical information.
Audit and Feedback and Continuous Performance Improvement
The multimodal approach required to translate knowledge (eg, guidelines) into sepsis care implemented at the bedside is an iterative process. An ED armed with a robust track-and-trigger system and an effective efferent arm, including sophisticated clinical decision support strategies, will require frequent auditing in the plan-do-study-act model of quality improvement to yield clinical effectiveness [61,62,65]. Auditing, paired with feedback to frontline providers, is essential to refine and improve the complex process required to provide expert care to the septic patient [29,65]. Sustained success in optimizing sepsis care delivery is the goal, yet significant work is required to determine the best strategies to achieve this endpoint.
Conclusion
Severe sepsis affects millions of individuals each year in the United States. Delays in recognition result in increased morbidity and mortality, at a tremendous cost to the patient and society. By designing strategies to identify sepsis in a timely, efficient, and effective manner, and by implementing ED structures and processes to increase adherence with sepsis-based guidelines, improved patient-centered outcomes can be realized.
Corresponding author: Mark E. Mikkelsen, MD, MSCE, Gates 05.042, 3400 Spruce St., Philadelphia, PA 19104, [email protected].
Financial disclosures: None.
Author contributions: conception and design, JHM, MEM; analysis and interpretation of data, DFG; drafting of article, JHM, DFG, MEM; critical revision of the article, JHM, MEM.
References
1. Gaieski DF, Edwards JM, Kallan MJ, Carr BG. Benchmarking the incidence and mortality of severe sepsis in the United States. Crit Care Med 2013;41:1167–74.
2. Angus DC, Linde-Zwirble WT, Lidicker J, et al. Epidemiology of severe sepsis in the United States: analysis of incidence, outcome, and associated costs of care. Crit Care Med 2001;29:1303–10.
3. Lagu T, Rothberg MB, Shieh MS, et al. Hospitalizations, costs, and outcomes of severe sepsis in the United States 2003 to 2007. Crit Care Med 2012;40:754–61.
4. Dellinger RP, Levy MM, Rhodes A, et al. Surviving Sepsis Campaign: international guidelines for management of severe sepsis and septic shock, 2012. Intensive Care Med 2013;39:165–228.
5. Angus DC, van der Poll T. Severe sepsis and septic shock. N Engl J Med 2013;369:840–51.
6. Wang HE, Shapiro NI, Angus DC, Yealy DM. National estimates of severe sepsis in United States emergency departments. Crit Care Med 2007;35:1928–36.
7. Dombrovskiy VY, Martin AA, Sunderram J, et al. Rapid increase in hospitalization and mortality rates for severe sepsis in the United States: a trend analysis from 1993 to 2003. Crit Care Med 2007;35:1244–50.
8. Liu V, Escobar GJ, Greene JD, et al. Hospital deaths in patients with sepsis from 2 independent cohorts. JAMA 2014;312:90–2.
9. Kaukonen KM, Bailey M, Suzuki S, et al. Mortality related to severe sepsis and septic shock among critically ill patients in Australia and New Zealand, 2000-2012. JAMA 2014;311:1308–16.
11. Iwashyna TJ, Ely EW, Smith DM, et al. Long-term cognitive impairment and functional disability among survivors of severe sepsis. JAMA 2010; 304:1787–94.
12. Ortego A, Gaieski DF, Fuchs BD, et al. Hospital-based acute care use in survivors of septic shock. Crit Care Med 2015;43:729–37.
13. Prescott HC, Langa KM, Liu V, et al. Increased 1-year healthcare use in survivors of severe sepsis. Am J Respir Crit Care Med 2014;190:62–9.
14. Liu V, Lei X, Prescott HC, et al. Hospital readmission and healthcare utilization following sepsis in community settings. J Hosp Med 2014;9:502–7.
15. Jones AE, Brown MD, Trzeciak S, et al. The effect of a quantitative resuscitation strategy on mortality in patients with sepsis: a meta-analysis. Crit Care Med 2008;36:2734–9.
16. Seymour CW, Rea TD, Kahn JM, et al. Severe sepsis in pre-hospital emergency care: analysis of incidence, care, and outcome. Am J Respir Crit Care Med 2012;186:1264–71.
17. Seymour CW, Cooke CR, Mikkelsen ME, et al. Out-of-hospital fluid in severe sepsis: effect on early resuscitation in the emergency department. Prehosp Emerg Care 2010;14:145–52.
18. Seymour CW, Cooke CR, Heckbert SR, et al. Prehospital intravenous access and fluid resuscitation in severe sepsis: an observational cohort study. Crit Care 2014;18:533
19. Studnek JR, Artho MR, Garner CL, Jones AE. The impact of emergency medical services on the ED care of severe sepsis. Am J Emerg Med 2012;30:51–6.
20. Guss DA, Meyer FT, Neuman TS, et al. The impact of a regionalized trauma system on trauma care in San Diego County. Ann Emerg Med 1989;18:1141–5.
21. Liberman M, Mulder DS, Jurkovich GJ, Sampalis JS. The association between trauma system and trauma center components and outcome in a mature regionalized trauma system. Surgery 2005;137:647–58.
22. Hachinski V, Donnan GA, Gorelick PB, et al. Stroke: working toward a prioritized world agenda. Stroke 2010;41:1084–99.
23. Levy MM, Fink MP, Marshall JC, et al. 2001 SCCM/ESICM/ACCP/ATS/SIS International Sepsis Definitions Conference. Crit Care Med 2003;31:1250–6.
24. Sibbald W, Doig G, Inman K. Sepsis, SIRS, and infection. Intensive Care Med 1995;21:299–301.
25. Kaukonen KM, Bailey M, Pilcher D, et al. Systemic inflammatory response syndrome criteria in defining severe sepsis. N Engl J Med 2015; online March 17, 2015.
26. Shapiro NI, Howell MD, Bates D, et al. The association of sepsis syndrome and organ dysfunction with mortality in emergency department patients with suspected infection. Ann Emerg Med 2006;48:583–90.
27. Berger T, Green J, Horeczko T, et al. Shock index and early recognition of sepsis in the emergency department: pilot study. West J Emerg Med 2013;14:168–74.
28. Farley H, Zubrow MT, Gies J, et al. Emergency department tachypnea predicts transfer to a higher level of care in the first 24 hours after ED admission. Acad Emerg Med 2010;17:718–22.
29. Sinuff T, Muscadere J, Adhikari NK, et al. Knowledge translation interventions for critically ill patients: a systematic review. Crit Care Med 2013;41:2627–40.
30. Hoot NR, Aronsky D. Systematic review of emergency department crowding: causes, effects, and solutions. Ann Emerg Med 2008;52:126–36.
31. Hsia RY, Kellermann AL, Shen YC. Factors associated with closures of emergency departments in the United States. JAMA 2011;305:1978–85.
32. Chalfin DB, Trzeciak S, Likourezos A, et al. Impact of delayed transfer of critically ill patients from the emergency department to the intensive care unit. Crit Care Med 2007;35:1477–83.
33. Subbe CP, Kruger M, Rutherford P, et al. Validation of a modified early warning score in medical admissions. Q J Med 2001;94:521–6.
34. Umscheid CA, Betesh J, VanZandbergen C, et al. Development, implementation, and impact of an automated early warning and response system for sepsis. J Hosp Med 2015;10:26–31.
35. Churpek MM, Yuen TC, Winslow C, et al. Multicenter development and validation of a risk stratification tool for ward patients. Am J Respir Crit Care Med 2014;190:649–55.
36. Whittaker SA, Fuchs BD, Gaieski DF, et al. Epidemiology and outcomes in patients with severe sepsis admitted to the hospital wards. J Crit Care 2015;30:78–84.
37. Delgado MK, Liu V, Pines JM, et al. Risk factors for unplanned transfer to intensive care within 24 hours of admission from the emergency department in an integrated healthcare system. J Hosp Med 2013;8:13–9.
38. Valentini I, Pacilli AM, Carbonara P, et al. Influence of the admission pattern on the outcome of patients admitted to a respiratory intensive care unit: does a step-down admission differ from a step-up one? Respir Care 2013;58:2053–60.
39. Kompanje EJO, Jansen TC, van der Hoven B, Bakker J. The first demonstration of lactic acid in human blood in shock by Johann Joseph Scherer (1814-1869) in January 1843. Intensive Care Med 2007;33:1967–71.
40. Kraut JA, Madias NE. Lactic acidosis. N Engl J Med 2014;371:2309–19.
41. Jansen TC, van Bommel J, Mulder PG, et al. The prognostic value of blood lactate levels relative to that of vital signs in the pre-hospital setting: a pilot study. Crit Care 2008;12:R160.
42. del Portal DA, Shofer F, Mikkelsen ME, et al. Emergency department lactate is associated with mortality in older adults admitted with and without infections. Acad Emerg Med 2010;17:260–8.
43. Mikkelsen ME, Miltiades AN, Gaieski DF, et al. Serum lactate is associated with mortality in severe sepsis independent of organ failure and shock. Crit Care Med 2009;37:1670–7.
44. Gaieski DF, Drumheller BC, Goyal M, et al. Accuracy of handheld point-of-care fingertip lactate measurement in the emergency department. West J Emerg Med 2013;14:58–62.
45. Macdonald SP, Arendts G, Fatovich DM, Brown SG. Comparison of PIRO, SOFA, and MEDS scores for predicting mortality in emergency department patients with severe sepsis and septic shock. Acad Emerg Med 2014;21:1257–63.
46. Carpenter CR, Keim SM, Upadhye S, Nguyen HB, Group BEiEMI. Risk stratification of the potentially septic patient in the emergency department: the Mortality in the Emergency Department Sepsis (MEDS) score. J Emerg Med 2009;37:319–27.
47. Sankoff JD, Goyal M, Gaieski DF, et al. Validation of the Mortality in Emergency Department Sepsis (MEDS) score in patients with the systemic inflammatory response syndrome (SIRS). Crit Care Med 2008;36:421–6.
48. Corfield AR, Lees F, Zealley I, et al. Utility of a single early warning score in patients with sepsis in the emergency department. Emerg Med J 2014;31:482–7.
49. Kumar A, Roberts D, Wood KE, et al. Duration of hypotension before initiation of effective antimicrobial therapy is the critical determinant of survival in human septic shock. Crit Care Med 2006;34:1589–96.
50. Gaieski DF, Mikkelsen ME, Band RA, et al. Impact of time to antibiotics on survival in patients with severe sepsis or septic shock in whom early goal-directed therapy was initiated in the emergency department. Crit Care Med 2010;38:1045–53.
51. Puskarich MA, Trzeciak S, Shapiro NI, et al. Association between timing of antibiotic administration and mortality from septic shock in patients treated with a quantitative resuscitation protocol. Crit Care Med 2011;39:2066–71.
52. Capp R, Horton CL, Takhar SS, et al. Predictors of patients who present to the emergency department with sepsis and progress to septic shock between 4 and 48 hours of emergency department arrival. Crit Care Med 2015 Jan 30.
53. Rivers E, Nguyen B, Havstad S, et al. Early goal-directed therapy in the treatment of severe sepsis and septic shock. N Engl J Med. 2001;345:1368–77.
54. The ProCESS Investigators. A ranodmized trial of protocol-based care for early septic shock. N Engl J Med 2014;370:1683–93.
55. The ARISE Investigators and the ANZICS Clinical Trials Group. Goal-directed resuscitation for patients with early septic shock. N Engl J Med 2014;371:1496–506.
56. Mouncey PR, Osborn TM, Power GS, et al. Trial of early, goal-directed resuscitation for septic shock. N Engl J Med 2015; online March 17, 2015.
57. Weingart SD, Sherwin RL, Emlet LL, et al. ED intensivists and ED intensive care units. Amer J Emerg Med 2013;31:617–20.
58. Lilly CM, Cody S, Zhao H, et al. Hospital mortality, length of stay, and preventable complications among critically ill patients before and after tele-ICU reengineering of critical care processes. JAMA 2011;305:2175–85.
59. Walkey AJ, Wiener RS. Hospital case volume and outcomes among patients hospitalized with severe sepsis. Am J Respir Crit Care Med 2014;189:548–55.
60. Gaieski DF, Edwards JM, Kallan MJ, et al. The relationship between hospital volume and mortality in severe sepsis. Am J Respir Crit Care Med 2014;190:665–74.
61. Levy MM, Dellinger RP, Townsend SR, et al. The surviving sepsis campaign: results of an international guideline-based performance improvement program targeting severe sepsis. Intensive Care Med 2010;36:222–31.
62. Levy MM, Rhodes A, Phillips GS, et al. Surviving sepsis campaign: association between performance metrics and outcomes in a 7.5-year study. Crit Care Med 2015;43:3–12.
63. Weiss CH, Moazed F, McEvoy CA, et al. Prompting physicians to address a daily checklist and process of care and clinical outcomes: a single-site study. Am J Respir Crit Care Med 2011;184:680–6.
64. Weant KA, Baker SN. Emergency medicine pharmacists and sepsis management. J Pharm Pract 2013;26:401–5.
65. Marwick CA, Guthrie B, Pringle JE, et al. A multifaceted intervention to improve sepsis management in general hospital wards with evaluation using segmented regression of interrupted time series. BMJ Qual Saf 2014;23:e2.
Issue
Journal of Clinical Outcomes Management - May 2015, VOL. 22, NO. 5
From the Department of Medicine, University of Pennsylvania, and the Department of Emergency Medicine, Thomas Jefferson University Hospital, Philadelphia, PA.
Abstract
Objective: To detail strategies to improve sepsis recognition and the quality of care provided to the septic patient.
Methods: Review of the literature.
Results: Severe sepsis affects nearly 3 million individuals each year in the United States, and cost estimates for these hospitalizations exceed $24 billion. Effective management is predicated on timely recognition. In this review, we detail strategies to improve early identification of potentially septic patients as well as the quality of care provided to the septic patient in the emergency department (ED). The strategies discussed are based upon an understanding of the signs and symptoms of sepsis and the clinical risk factors associated with sepsis, which can be used to design novel strategies to screen patients for sepsis and risk stratify patients at risk for clinical deterioration.
Conclusion: ED structures and processes can be used to increase adherence with sepsis management guidelines to improve patient outcomes.
Severe sepsis affects nearly 3 million individuals each year in the United States and cost estimates for these hospitalizations exceed $24 billion [1–3]. Sepsis is a life-threatening condition characterized by a suspected or identified infection accompanied by a vigorous host inflammatory response. In severe sepsis, end-organ dysfunction manifests in myriad forms, including altered mental status, acute kidney injury, liver dysfunction, pulmonary dysfunction, and hemodynamic compromise [4,5]. This protean presentation of a deadly condition makes identification and risk stratification both challenging and essential to improving patient outcomes. The majority of patients with severe sepsis will receive their initial care within an emergency department (ED) [6,7]. It is essential that emergency medicine providers have the means to appropriately identify patients presenting with severe sepsis in a timely manner—thus facilitating life-saving measures such as early intravenous fluid resuscitation and administration of timely and appropriate antimicrobials.
In this review, we detail strategies to improve sepsis recognition and the quality of care provided to the septic patient in the ED. The strategies discussed are based upon an understanding of the signs and symptoms of sepsis and the clinical risk factors associated with sepsis, which can be used to design novel strategies to screen patients for sepsis and risk stratify patients for clinical deterioration. Then, we review suggested ED structures and processes to increase adherence with sepsis-based guidelines to improve patient outcomes. Successful implementation is predicated on hospital administrative support towards the efforts given the time and resources required and strong and committed leadership across the health care system.
Epidemiology of Severe Sepsis
Estimates of annual cases of severe sepsis vary, ranging from 1 million to 3 million cases in the United States [1–3]. In-hospital mortality for this condition ranges from 14% to 30% [5]. The incidence of severe sepsis in the United States has been increasing at a rate of 13% annually, with an estimated cost of greater than $24 billion per year [1,2]. In 2 large cohorts of hospitalized patients, it was found that sepsis contributed to 1 in every 2 to 3 deaths following inpatient admission [8]. Coincident with these increased estimates, advances in the early identification and treatment of sepsis have led to decreasing mortality rates over the past decade [1,9].
Of importance to the ED clinician, an episode of sepsis has long-term effects on cognitive and physical function, quality-of-life, and survival [10,11]. Post-discharge, approximately one-quarter of sepsis survivors will be readmitted within 30 days [12–14]. In as many as half of these instances, another life-threatening infection is the cause for readmission, making the past medical history, including a detailed accounting of recent episodes of sepsis, an important part of the initial ED evaluation [12]. Furthermore, severe sepsis survivors spend a large proportion of their time following discharge within a health care facility, and will frequently present to the ED with an acute condition from such an environment. Important factors for predicting readmission after a sepsis hospitalization include patient age, severity of illness, hospital length of stay, and the need for intensive care during the initial hospitalization [12–14].
Principles of Effective Sepsis Management
The principles of effective sepsis management begin with early identification in the pre-hospital setting, at triage, or when a patient begins to decompensate in the hospital. After the point of initial recognition, core principles include risk stratification, timely and appropriate antimicrobial administration, initial intravenous fluid boluses and ongoing resuscitation guided by physical examination and objective resuscitation end-points [4,5]. These practices have been operationalized in the care bundles of the Surviving Sepsis Campaign Guidelines [4]. Within 3 hours, the resuscitation bundle includes measuring serum lactate to risk stratify patients, obtaining blood cultures, administering broad-spectrum antibiotics, and administering 30 mL/kg crystalloid in patients with hypotension or hyperlactatemia [4]. The 6-hour bundle expands upon these initial measures and includes additional management recommendations based on resuscitation end-points.
As effective management is predicated on timely recognition, an understanding of the impact of delayed recognition is essential to provide optimal care for the severe sepsis patient in the ED. Decades of research has revealed that certain markers predict adverse outcomes, including transition to septic shock and death, as do delayed processes of care. Importantly, while early quantitative resuscitation was demonstrated to improve outcomes in a meta-analysis, there was no demonstrable benefit when resuscitation was initiated late (> 24 hours) in the course in the ICU (odds ratio of death, 1.16 [95% confidence interval, 0.60–2.22]) [15].
Strategies To Improve Recognition
Pre-Hospital Environment
As many as 40% of severe sepsis cases admitted to the hospital from the ED will present to the ED via emergency medical services (EMS) transport, and this rate appears to be increasing over time [16]. Thus, efforts to improve identification and risk-stratification of potential cases of severe sepsis should begin in the pre-hospital environment. These EMS encounters frequently exceed 45 minutes [16], pre-hospital interventions appear to be uncommon [16,17], and establishment of intravenous access paired with fluid resuscitation in the pre-hospital environment may improve survival [18]. Further, when EMS providers recognize sepsis, ED care processes (eg, time to antibiotics, protocol-directed resus-citation) are improved, with shorter time to antibiotics and initiation of early goal-directed therapy (EGDT) [19] and a trend towards achieving goal mean arterial pressure earlier [17]. In sum, while further investigation is required to facilitate this transition, efforts to improve sepsis outcomes should also include the interface between the pre-hospital environment and the ED (Figure).
From EMS to ED Triage
Borrowing the principle “time equals tissue” from a variety of time sensitive conditions (eg, myocardial infarction management [“time equals muscle”] and stroke care [“time equals brain”]), clinicians and researchers have realized that expedited recognition of severe sepsis patients begins at the time of initial contact with the health care system. For severe sepsis patients, clinicians need to think “time equals organ function.” Given the frequency with which sepsis patients arrive to the ED via EMS, effective communication between EMS and ED providers could be leveraged to prepare the ED team to provide timely care for the sepsis patient via a “sepsis alert.” While confirmation of its applicability to sepsis care is required in the absence of a regionalized network of sepsis centers, the rationale is based on the experience of the effectiveness of trauma and stroke alert systems [20–22]. For patients not recognized as potentially being infected by EMS providers during transport, repeat vital signs during ED triage can be screened to identify patients exhibiting signs of the systemic inflammatory response syndrome (SIRS) [4,23]. The same principles of effective communication apply for patients being sent from medical clinics to the ED for evaluation and treatment of potential severe sepsis. For patients arriving independent of EMS, focused triage and initial vital signs are the starting point for identifying severe sepsis at the most proximal phase of entry into the health care system.
Vital Signs and SIRS Criteria in the ED
The vast majority of patients who are hypotensive in triage are expedited to a treatment room and early resuscitation is begun. However, these patients represent a minority of severe sepsis patients seen in triage; therefore, all available data need to be analyzed to capture the highest percentage of severe sepsis patients. Acknowledging that SIRS criteria are not specific for sepsis [24], will miss as many as 1 out of 8 patients initially [25], and may not predict mortality [26], their presence is nonetheless characteristic of sepsis. As such, identifying the presence of SIRS at triage, or during the ED stay via serial vital signs, facilitates sepsis recognition, as do strategies that leverage routine vital signs to calculate predictors of instability including the shock index (heart rate/systolic blood pressure), where a shock index ≥ 0.7 has been associated with illness severity [27]. An increased respiratory rate has been demonstrated to identify risk for transfer from a floor bed to the ICU within 24 hours of ED admission [28]. Further, clinical manifestations of sepsis, including end-organ dysfunction, are protean, and patients frequently present with nonspecific, constitutional symptoms (eg, weakness, malaise, fever, chills, nausea) that could reflect one of many diseases (Table 1).
The Afferent Arm: Multimodal Screening Strategies
While institutional practice improvement initiatives to facilitate sepsis recognition and care should incorporate educational strategies, led by champions with expertise in sepsis, the complex presentation of sepsis requires multimodal approaches [29]. These multimodal approaches, beginning at the time of ED triage, should be designed to harness information technology to screen patients to improve severe sepsis recognition (the afferent arm) and to utilize structures and processes of care efficiently and effectively (the efferent arm) to guide severe sepsis management according to sepsis-care bundles espoused by guidelines (Figure) [4].
Operational processes to screen for sepsis in the ED will need to account for ED organizational flow (eg, average time from registration to triage, average time from triage to being seen by a physician, average length of stay in the ED, number of hospital beds) and hand-off practices (eg, care transition from ED team to floor or ICU team, or within ED at shift change). For ED organizations with shorter ED lengths of stay (eg, < 2 hours), screening practices at ED triage will serve as the focal point to identify cases of sepsis. Boarding, defined as caring for a patient in the ED pending transfer, is common, increasing as a result of ED closures [30,31], and associated with prolonged hospital length of stay and increased in-hospital mortality when ICU transfer is delayed [32]. Sepsis patients in particular appear to be a vulnerable group of patients. While many explanations exist to account for the relationship between delayed transfer and adverse outcomes, timely recognition and management of the septic patient could be compromised with prolonged boarding. To combat this potential effect, continual assessment during the entire ED stay may unmask an initially unclear presentation of sepsis.
One strategy to identify sepsis in ED organizations with prolonged ED lengths of stay is through the use of a track-and-trigger system, or early warning system. Traditionally, track-and-trigger systems were implemented on the hospital wards, as means to identify physiological deterioration in a timely manner to prevent clinical deterioration [33]. More recently, early warning systems have been used to identify patients with sepsis on the hospital wards and within EDs, as these systems rely on physiological parameters such as SIRS that are cardinal features of sepsis [34]. However, given the potential for alert fatigue, designing a system that operates with high accuracy is imperative.
Efforts are underway to redefine sepsis, using a simplified approach and readily available physiological variables, with the main goal of targeting those most at-risk of an adverse outcome during the hospitalization. Simultaneously, an understanding of the overt and more occult manifestations are essential to incorporate into the clinical decision-making and pattern recognition required to identify sepsis in a timely and accurate manner. InTable 2, the signs and symptoms that may serve as flags for severe sepsis are presented.
Mature early warning systems, designed to leverage the electronic medical record (EMR) by capturing vital signs, laboratory measures, (eg, elevated serum creatinine compared to a recent hospitalization) and symptoms (eg, altered mental status), are well-positioned to herald clinical deterioration (eg, cardiac arrest) with improved accuracy [35] and to be applied to sepsis specifically [34]. While sophisticated analytical strategies, such as machine learning, are being used to improve the test characteristics of these early warning systems, iterative, prospective chart review is an essential and complementary performance improvement step to refine the process. Further, chart review affords the opportunity to ensure compliance with sepsis care bundles.
Knowledge of the risk factors associated with development of sepsis is critical for the front-line emergency physician and nurse. Additionally, as many of these risk factors are associated with adverse outcomes, including unplanned ICU transfer and in-hospital mortality, which occur in as many as one out of 8 patients admitted directly to the ward, they have utility for early risk-stratification and triaging purposes in the ED. Advanced age and pre-existing comorbid conditions, particularly an oncologic diagnosis and/or chronic organ dysfunction, are major risk factors for sepsis and worse outcomes result in those who develop sepsis [2]. Further, illness severity, including an elevated serum lactate level, is associated with adverse outcomes. These factors can be incorporated into triage decisions and/or close monitoring for patients admitted to the general ward [36]. Conversely, because patients admitted to the ICU setting and subsequently stepped down through their hospitalization may experience better outcomes compared to patients admitted to the general ward who then require step-up to an ICU setting (37,38), attention to triage practices is critical.
These complementary strategies, which serve as the afferent arm of the system, summon health care providers to the bedside of a vulnerable patient. However, clinical effectiveness in the management of severe sepsis requires a robust, sophisticated, and mature efferent arm capable of delivering expert care to the now recognized septic patient.
Principles of Effective Management Post-Recognition
Risk Stratification
An elevated serum lactate level was initially described in pathological states in the mid 19th century by Johann Joseph Scherer [39] and has long been associated with increased mortality in hospitalized patients [40]. Lactate is a useful biomarker for risk stratification in a variety of patients arriving to the ED, particularly those who have been identified at high risk for sepsis. Jansen and colleagues examined the measurement of pre-hospital serum lactate at the time of paramedic on-scene assessment in a group of acutely ill patients [41]. Patients with point-of-care lactate levels of 3.5 mmol/L or greater were found to have an in-hospital mortality of 41% versus 12% for those with lactate levels less than 3.5 mmol/L. Within the population with an elevated lactate, patients with a systolic blood pressure greater than 100 mgHg experienced a mortality of nearly 30%, while it was greater than 50% in hypotensive patients with an elevated lactate, highlighting the value of both hemodynamic and serum lactate measures. Upon arrival to the ED, lactate measurements have a strong correlation with mortality. In one retrospective cohort, lactate level was linearly associated with mortality in a broad array of patients older than age 65 years [42]. An initial serum lactate level in the ED in the intermediate (2.0 – 3.9 mmol/L) or high range (≥ 4 mmol/L) has been associated with increased odds of death 2 to 5 times higher independent of organ dysfunction in severe sepsis specifically [43].
As the association between serum lactate levels and death is independent of organ dysfunction, serum lactate is a simple and reliable tool to both enhance detection and risk-stratify patients presenting to the ED with severe sepsis. Given the frequency with which hyperlactatemia is present in patients with suspected infection [43], operationalizing serum lactate measures with the initial phlebotomy draw is an important step to risk-stratify patients. This step can be coupled later with intravenous fluid resuscitation for those with marked elevations (≥ 4 mmol/L), in accord with guideline recommendations [4]. Screening of initial lactate values can be further expedited by utilizing fingerstick point-of-care lactate devices [44]. Last, while serial lactate measures can be incorporated into triage decisions, there is no clear threshold that warrants ICU admission. Rather, persistent elevations in serum lactate can be used to identify patients who require close observation regardless of their admission location.
Several scoring systems have been developed to augment sepsis risk stratification within the ED. The most prominent of these are the Predisposition Insult Response and Organ failure (PIRO), Sequential Organ Failure Assessment (SOFA), and Mortality in the Emergency Department Sepsis (MEDS) scores, and the National early warning score (NEWS) [45-48]. The MEDS score incorporates host factors including age and co-morbid illness, as well as physiologic and laboratory tests which can be obtained rapidly in an ED setting. Multiple prospective and retrospective examinations of the MEDS scoring systems have demonstrated that it performs optimally in ED patients with sepsis but not those with severe sepsis, in terms of predicting 30-day mortality [46,47]. The PIRO score more extensively incorporates predisposing co-morbidities, physiologic and laboratory parameters, and has been modified to consider presumed source of infection, leading to a stronger predictive ability for mortality in more severely ill patients. In patients presenting to the ED with severe sepsis and septic shock, a prospective observational study found the PIRO to be the best predictor of mortality, compared to SOFA and MEDS scores [45]. In a recent study by Corfield et al, sepsis patients with a higher NEWS, according to initial ED vital signs (temperature, pulse, respiratory rate, systolic blood pressure, oxyhemoglobin saturation) and consciousness level, were significantly more likely to be admitted to an ICU within 48 hours or to experience in-hospital mortality [48].
Timely and Appropriate Antibiotics
In a landmark study published by Kumar and colleagues in 2006, the relationship between timing of antibiotics and mortality was established [49]. In 2731 adult septic shock patients, mortality increased 7.6% for every hour delay in effective antimicrobial administration. A striking finding, given that the study population was limited to patients cared for in the ICU, was the fact that only 50% of patients received appropriate antibiotics within 6 hours of onset of shock and nearly one-quarter of patients did not receive antibiotics until the 15th hour. As a direct result, in-hospital mortality was observed to be 58% in this study.
Over the ensuing decade, a series of studies have demonstrated a narrowing of the quality gap in this regard, and the result has coincided with a significant improvement in survival. In 2010, Gaieski and colleagues demonstrated a significant improvement in the prompt administration of antibiotic delivery in patients presenting to an ED with severe sepsis, with the median time from shock onset (sustained hypotension or lactate ≥ 4 mmol/L) to antibiotics down to 42 minutes [50]. Importantly, consistent with the Kumar study, time to appropriate antibiotics, rather than simply initial antibiotics, remained associated with in-hospital mortality independent of initiating early goal-directed therapy. In 2011, Puskarich and colleagues revealed that time to antibiotics continued to improve and, as a result, the investigators did not identify a relationship between time from triage to antibiotics and in-hospital mortality [51]. However, when antibiotics were delayed until after shock recognition, consistent with the study by Kumar and colleagues, survival decreased. Until recently, this important observation was challenging to operationalize clinically as little was known about how to facilitate risk-stratification of those at risk to develop shock. However, Capp and colleagues recently found that deterioration to septic shock 48 hours after ED presentation occurs in approximately one out of eight patients and identified gender (female), transient hypotension, and/or hyperlactatemia upon presentation as risk factors associated with such a deterioration [52].
As an essential element of sepsis care bundles, a focus on timely use of antibiotics in patients with suspected infection, has the potential to increase the use of antibiotics in the ED in patients determined subsequently to not be infected. To combat this acknowledged downstream effect, reconsideration of the utility of empiric antibiotics 48 to 72 hours after admission is required. This step can be accomplished through the use of a sepsis care pathway and/or a formal antibiotic stewardship program.
Quantitative Resuscitation
Rivers and colleagues, in a landmark 2001 trial, examined the effectiveness of a protocolized resuscitation strategy in the most proximal phase of severe sepsis and septic shock [53]. A distinguishing characteristic between the usual care arm and the intervention in this ED-based study, in addition to whether mixed central venous oxygen saturation was measured as a resuscitation end-point, was the inclusion of an ED provider at the bedside to attend to clinical management. The intervention, aimed at achieving physiologic targets, resulted in significantly more fluid resuscitation (3.5 L vs. 5.0 L within the first 6 hours) and a significant decrease in in-hospital mortality compared to the usual care arm (46.5 vs. 30.5%). The study revolutionized the culture and practice of sepsis care, in part by shining a light on the importance of timely resuscitation at the most proximal point of contact between the patient and the healthcare system. It also highlighted the importance of integrating serum lactate measurement into the early screening and risk stratification processes for sepsis care delivery.
The 2014 randomized trial of Protocol-Based Care for Early Septic Shock (ProCESS) revisited this concept, comparing the Rivers 2001 protocol to both a current guideline-based non-invasive algorithmic protocol and what had become usual ED care in the interim [54]. The ProCESS trial, which operationalized a team of bedside providers to direct care for each of the 3 distinct arms, found no significant difference between the arms in terms of 90-day and 1-year mortality, but mortality was approximately 10% less in all arms compared with the intervention arm of the Riverstrial. Further, subjects in each of the 3 arms received in excess of 2 L intravenous fluid resuscitation pre-randomization and 4.4–5.5 L when resuscitation spanned from pre-randomization to 6 hours post-randomization. The conclusion drawn is that the commonalities between the arms—early fluid resuscitation, early antibiotics, and the option to use physiologic measures as markers of the adequacy of treatment, all guided by bedside ED providers—are the most important factors for surviving sepsis. And the result is that practitioners have refined these tools over a decade, leading to steady improvements in survival.
Consistent with the ProCESS trial, a recent Australia and New Zealand trial confirmed no significant difference in 90-day mortality between protocolized EGDT and current usual care for septic shock within an ED [55]. Consistent with ProCESS and ProMISe [56], subjects enrolled in ARISE received in excess of 2.5 L in resuscitation pre-randomization, which when paired with fluid resuscitation in the 0-6 hour post-randomization period (1.96 L in the EGDT arm and 1.71 in the usual-care arm) resulted in resuscitation in the 4.5 to 5L range during the initial resuscitation. The ARISE trial was unique in that appropriate antibiotic administration was a requirement prior to randomization, ensuring that this important driver of mortality reduction was standardized between the two arms of the trial. In summary, while the ideal fluid resuscitation amount is unknown, requires a personalized approach, and further investigation is required to effectively incorporate non-invasive measures to guide fluid responsiveness, early and aggressive resuscitation paired with early antibiotic administration are essential aspects of effective sepsis management.
The Efferent Arm: Structure And Processes To Improve Outcomes
The efferent arm of the system, beyond risk stratification, requires the implementation of optimal staffing and processes to care for the septic patient. While options will vary, preparation is a requisite, as are strategies that efficiently lead the clinician at the bedside to the use of evidence-based medicine (Table 2).
Personnel and Staffing
Quality care for the septic patient requires immediate availability of a multidisciplinary care team, including physicians and nurses with critical care experience who can be rapidly deployed to the bedside. The location of care provision may include on-going care in the initial ED room assignment or transfer to a dedicated area for the care of the critically ill patient within the ED.
To provide optimal care in the era of overcrowding and delayed transfer to an ICU, a movement towards ED intensive care units (ED-ICUs) has emerged [57]. The models of practice range from a model based upon ED intensivists, with expertise in critical care medicine, providing care within the traditional structure of an ED, to a model wherein a portion of the ED is assigned for the care of the critically ill for extended periods of time beyond the initial resuscitation. As these models mature from resuscitation bays capable of scaling up based on need to dedicated ED-ICUs, investments in shared Unit leadership (physician and nursing), staffing (physician, critical care nursing, respiratory therapy, critical care pharmacist) and processes of care (eg, multidisciplinary rounds) in line with established ICUs will be necessary.
While attractive conceptually, large-scale implementation of this movement is unlikely to occur outside of tertiary care academic medical centers. In the many EDs across the US without ED intensivists, and confronted with limited clinician resources, flexible physician and nursing staffing models will be necessary to ensure that care provisions are in accord with established guidelines. Potential solutions to provide the resources to meet the needs of these high-intensity patients include critical care consultation and a strategy traditionally applied to the ICU, telemedicine [58]. Last, given the relationship between hospital volume and mortality in severe sepsis [59,60], timely transfer to a high-volume center for specific cases may be appropriate, although the optimal timing, case selection, and impact of transfer on outcomes warrant further examination.
Clinical Decision Support Strategies
To complement the identification and risk-stratification available by screening and scoring systems, clinical decision support systems are novel tools to improve outcomes in the era of electronic medical records (EMR). Specific to sepsis care delivery, performance improvement initiatives including audit-and-feedback practice can increase severe sepsis guideline adherence, and even modest improvements in adherence appear to lead to sustained improvements that contributed to a 25% relative risk reduction in the observed mortality rate [61,62]. Clinical decision support tools can be used to link early recognition to optimal care processes, such as the Surviving Sepsis Campaign resuscitation and management bundles. The use of prompts as strategies to ensure that bundles of care are ordered and carried out is an important aspect to operationalize during the design phase [63].
Significant preparation is required to effectively carry out the clinical decision support design strategy. For example, to ensure timely antibiotic dispensing, a number of process steps will be required, including prompt notification to a central pharmacist or preferably, an ED pharmacist with access to a local pharmacy pre-stocked with commonly used antibiotics [64]. In addition, the use of an institution-specific antibiogram within the physician computer-order entry sepsis order set, that includes site-specific recommendations (eg, pulmonary, gastrointestinal source) and susceptibility patterns, is an essential aspect of optimal sepsis processes of care. Last, the antibiogram will need to be frequently updated to include season-specific (eg, oseltamivir administration for high-risk cases during influenza season) recommendations to ensure that providers are prompted with the most up-to-date clinical information.
Audit and Feedback and Continuous Performance Improvement
The multimodal approach required to translate knowledge (eg, guidelines) into sepsis care implemented at the bedside is an iterative process. An ED armed with a robust track-and-trigger system and an effective efferent arm, including sophisticated clinical decision support strategies, will require frequent auditing in the plan-do-study-act model of quality improvement to yield clinical effectiveness [61,62,65]. Auditing, paired with feedback to frontline providers, is essential to refine and improve the complex process required to provide expert care to the septic patient [29,65]. Sustained success in optimizing sepsis care delivery is the goal, yet significant work is required to determine the best strategies to achieve this endpoint.
Conclusion
Severe sepsis affects millions of individuals each year in the United States. Delays in recognition result in increased morbidity and mortality, at a tremendous cost to the patient and society. By designing strategies to identify sepsis in a timely, efficient, and effective manner, and by implementing ED structures and processes to increase adherence with sepsis-based guidelines, improved patient-centered outcomes can be realized.
Corresponding author: Mark E. Mikkelsen, MD, MSCE, Gates 05.042, 3400 Spruce St., Philadelphia, PA 19104, [email protected].
Financial disclosures: None.
Author contributions: conception and design, JHM, MEM; analysis and interpretation of data, DFG; drafting of article, JHM, DFG, MEM; critical revision of the article, JHM, MEM.
References
1. Gaieski DF, Edwards JM, Kallan MJ, Carr BG. Benchmarking the incidence and mortality of severe sepsis in the United States. Crit Care Med 2013;41:1167–74.
2. Angus DC, Linde-Zwirble WT, Lidicker J, et al. Epidemiology of severe sepsis in the United States: analysis of incidence, outcome, and associated costs of care. Crit Care Med 2001;29:1303–10.
3. Lagu T, Rothberg MB, Shieh MS, et al. Hospitalizations, costs, and outcomes of severe sepsis in the United States 2003 to 2007. Crit Care Med 2012;40:754–61.
4. Dellinger RP, Levy MM, Rhodes A, et al. Surviving Sepsis Campaign: international guidelines for management of severe sepsis and septic shock, 2012. Intensive Care Med 2013;39:165–228.
5. Angus DC, van der Poll T. Severe sepsis and septic shock. N Engl J Med 2013;369:840–51.
6. Wang HE, Shapiro NI, Angus DC, Yealy DM. National estimates of severe sepsis in United States emergency departments. Crit Care Med 2007;35:1928–36.
7. Dombrovskiy VY, Martin AA, Sunderram J, et al. Rapid increase in hospitalization and mortality rates for severe sepsis in the United States: a trend analysis from 1993 to 2003. Crit Care Med 2007;35:1244–50.
8. Liu V, Escobar GJ, Greene JD, et al. Hospital deaths in patients with sepsis from 2 independent cohorts. JAMA 2014;312:90–2.
9. Kaukonen KM, Bailey M, Suzuki S, et al. Mortality related to severe sepsis and septic shock among critically ill patients in Australia and New Zealand, 2000-2012. JAMA 2014;311:1308–16.
11. Iwashyna TJ, Ely EW, Smith DM, et al. Long-term cognitive impairment and functional disability among survivors of severe sepsis. JAMA 2010; 304:1787–94.
12. Ortego A, Gaieski DF, Fuchs BD, et al. Hospital-based acute care use in survivors of septic shock. Crit Care Med 2015;43:729–37.
13. Prescott HC, Langa KM, Liu V, et al. Increased 1-year healthcare use in survivors of severe sepsis. Am J Respir Crit Care Med 2014;190:62–9.
14. Liu V, Lei X, Prescott HC, et al. Hospital readmission and healthcare utilization following sepsis in community settings. J Hosp Med 2014;9:502–7.
15. Jones AE, Brown MD, Trzeciak S, et al. The effect of a quantitative resuscitation strategy on mortality in patients with sepsis: a meta-analysis. Crit Care Med 2008;36:2734–9.
16. Seymour CW, Rea TD, Kahn JM, et al. Severe sepsis in pre-hospital emergency care: analysis of incidence, care, and outcome. Am J Respir Crit Care Med 2012;186:1264–71.
17. Seymour CW, Cooke CR, Mikkelsen ME, et al. Out-of-hospital fluid in severe sepsis: effect on early resuscitation in the emergency department. Prehosp Emerg Care 2010;14:145–52.
18. Seymour CW, Cooke CR, Heckbert SR, et al. Prehospital intravenous access and fluid resuscitation in severe sepsis: an observational cohort study. Crit Care 2014;18:533
19. Studnek JR, Artho MR, Garner CL, Jones AE. The impact of emergency medical services on the ED care of severe sepsis. Am J Emerg Med 2012;30:51–6.
20. Guss DA, Meyer FT, Neuman TS, et al. The impact of a regionalized trauma system on trauma care in San Diego County. Ann Emerg Med 1989;18:1141–5.
21. Liberman M, Mulder DS, Jurkovich GJ, Sampalis JS. The association between trauma system and trauma center components and outcome in a mature regionalized trauma system. Surgery 2005;137:647–58.
22. Hachinski V, Donnan GA, Gorelick PB, et al. Stroke: working toward a prioritized world agenda. Stroke 2010;41:1084–99.
23. Levy MM, Fink MP, Marshall JC, et al. 2001 SCCM/ESICM/ACCP/ATS/SIS International Sepsis Definitions Conference. Crit Care Med 2003;31:1250–6.
24. Sibbald W, Doig G, Inman K. Sepsis, SIRS, and infection. Intensive Care Med 1995;21:299–301.
25. Kaukonen KM, Bailey M, Pilcher D, et al. Systemic inflammatory response syndrome criteria in defining severe sepsis. N Engl J Med 2015; online March 17, 2015.
26. Shapiro NI, Howell MD, Bates D, et al. The association of sepsis syndrome and organ dysfunction with mortality in emergency department patients with suspected infection. Ann Emerg Med 2006;48:583–90.
27. Berger T, Green J, Horeczko T, et al. Shock index and early recognition of sepsis in the emergency department: pilot study. West J Emerg Med 2013;14:168–74.
28. Farley H, Zubrow MT, Gies J, et al. Emergency department tachypnea predicts transfer to a higher level of care in the first 24 hours after ED admission. Acad Emerg Med 2010;17:718–22.
29. Sinuff T, Muscadere J, Adhikari NK, et al. Knowledge translation interventions for critically ill patients: a systematic review. Crit Care Med 2013;41:2627–40.
30. Hoot NR, Aronsky D. Systematic review of emergency department crowding: causes, effects, and solutions. Ann Emerg Med 2008;52:126–36.
31. Hsia RY, Kellermann AL, Shen YC. Factors associated with closures of emergency departments in the United States. JAMA 2011;305:1978–85.
32. Chalfin DB, Trzeciak S, Likourezos A, et al. Impact of delayed transfer of critically ill patients from the emergency department to the intensive care unit. Crit Care Med 2007;35:1477–83.
33. Subbe CP, Kruger M, Rutherford P, et al. Validation of a modified early warning score in medical admissions. Q J Med 2001;94:521–6.
34. Umscheid CA, Betesh J, VanZandbergen C, et al. Development, implementation, and impact of an automated early warning and response system for sepsis. J Hosp Med 2015;10:26–31.
35. Churpek MM, Yuen TC, Winslow C, et al. Multicenter development and validation of a risk stratification tool for ward patients. Am J Respir Crit Care Med 2014;190:649–55.
36. Whittaker SA, Fuchs BD, Gaieski DF, et al. Epidemiology and outcomes in patients with severe sepsis admitted to the hospital wards. J Crit Care 2015;30:78–84.
37. Delgado MK, Liu V, Pines JM, et al. Risk factors for unplanned transfer to intensive care within 24 hours of admission from the emergency department in an integrated healthcare system. J Hosp Med 2013;8:13–9.
38. Valentini I, Pacilli AM, Carbonara P, et al. Influence of the admission pattern on the outcome of patients admitted to a respiratory intensive care unit: does a step-down admission differ from a step-up one? Respir Care 2013;58:2053–60.
39. Kompanje EJO, Jansen TC, van der Hoven B, Bakker J. The first demonstration of lactic acid in human blood in shock by Johann Joseph Scherer (1814-1869) in January 1843. Intensive Care Med 2007;33:1967–71.
40. Kraut JA, Madias NE. Lactic acidosis. N Engl J Med 2014;371:2309–19.
41. Jansen TC, van Bommel J, Mulder PG, et al. The prognostic value of blood lactate levels relative to that of vital signs in the pre-hospital setting: a pilot study. Crit Care 2008;12:R160.
42. del Portal DA, Shofer F, Mikkelsen ME, et al. Emergency department lactate is associated with mortality in older adults admitted with and without infections. Acad Emerg Med 2010;17:260–8.
43. Mikkelsen ME, Miltiades AN, Gaieski DF, et al. Serum lactate is associated with mortality in severe sepsis independent of organ failure and shock. Crit Care Med 2009;37:1670–7.
44. Gaieski DF, Drumheller BC, Goyal M, et al. Accuracy of handheld point-of-care fingertip lactate measurement in the emergency department. West J Emerg Med 2013;14:58–62.
45. Macdonald SP, Arendts G, Fatovich DM, Brown SG. Comparison of PIRO, SOFA, and MEDS scores for predicting mortality in emergency department patients with severe sepsis and septic shock. Acad Emerg Med 2014;21:1257–63.
46. Carpenter CR, Keim SM, Upadhye S, Nguyen HB, Group BEiEMI. Risk stratification of the potentially septic patient in the emergency department: the Mortality in the Emergency Department Sepsis (MEDS) score. J Emerg Med 2009;37:319–27.
47. Sankoff JD, Goyal M, Gaieski DF, et al. Validation of the Mortality in Emergency Department Sepsis (MEDS) score in patients with the systemic inflammatory response syndrome (SIRS). Crit Care Med 2008;36:421–6.
48. Corfield AR, Lees F, Zealley I, et al. Utility of a single early warning score in patients with sepsis in the emergency department. Emerg Med J 2014;31:482–7.
49. Kumar A, Roberts D, Wood KE, et al. Duration of hypotension before initiation of effective antimicrobial therapy is the critical determinant of survival in human septic shock. Crit Care Med 2006;34:1589–96.
50. Gaieski DF, Mikkelsen ME, Band RA, et al. Impact of time to antibiotics on survival in patients with severe sepsis or septic shock in whom early goal-directed therapy was initiated in the emergency department. Crit Care Med 2010;38:1045–53.
51. Puskarich MA, Trzeciak S, Shapiro NI, et al. Association between timing of antibiotic administration and mortality from septic shock in patients treated with a quantitative resuscitation protocol. Crit Care Med 2011;39:2066–71.
52. Capp R, Horton CL, Takhar SS, et al. Predictors of patients who present to the emergency department with sepsis and progress to septic shock between 4 and 48 hours of emergency department arrival. Crit Care Med 2015 Jan 30.
53. Rivers E, Nguyen B, Havstad S, et al. Early goal-directed therapy in the treatment of severe sepsis and septic shock. N Engl J Med. 2001;345:1368–77.
54. The ProCESS Investigators. A ranodmized trial of protocol-based care for early septic shock. N Engl J Med 2014;370:1683–93.
55. The ARISE Investigators and the ANZICS Clinical Trials Group. Goal-directed resuscitation for patients with early septic shock. N Engl J Med 2014;371:1496–506.
56. Mouncey PR, Osborn TM, Power GS, et al. Trial of early, goal-directed resuscitation for septic shock. N Engl J Med 2015; online March 17, 2015.
57. Weingart SD, Sherwin RL, Emlet LL, et al. ED intensivists and ED intensive care units. Amer J Emerg Med 2013;31:617–20.
58. Lilly CM, Cody S, Zhao H, et al. Hospital mortality, length of stay, and preventable complications among critically ill patients before and after tele-ICU reengineering of critical care processes. JAMA 2011;305:2175–85.
59. Walkey AJ, Wiener RS. Hospital case volume and outcomes among patients hospitalized with severe sepsis. Am J Respir Crit Care Med 2014;189:548–55.
60. Gaieski DF, Edwards JM, Kallan MJ, et al. The relationship between hospital volume and mortality in severe sepsis. Am J Respir Crit Care Med 2014;190:665–74.
61. Levy MM, Dellinger RP, Townsend SR, et al. The surviving sepsis campaign: results of an international guideline-based performance improvement program targeting severe sepsis. Intensive Care Med 2010;36:222–31.
62. Levy MM, Rhodes A, Phillips GS, et al. Surviving sepsis campaign: association between performance metrics and outcomes in a 7.5-year study. Crit Care Med 2015;43:3–12.
63. Weiss CH, Moazed F, McEvoy CA, et al. Prompting physicians to address a daily checklist and process of care and clinical outcomes: a single-site study. Am J Respir Crit Care Med 2011;184:680–6.
64. Weant KA, Baker SN. Emergency medicine pharmacists and sepsis management. J Pharm Pract 2013;26:401–5.
65. Marwick CA, Guthrie B, Pringle JE, et al. A multifaceted intervention to improve sepsis management in general hospital wards with evaluation using segmented regression of interrupted time series. BMJ Qual Saf 2014;23:e2.
Issue
Journal of Clinical Outcomes Management - May 2015, VOL. 22, NO. 5
Issue
Journal of Clinical Outcomes Management - May 2015, VOL. 22, NO. 5
ANSWER The radiograph shows a fracture dislocation of the ankle. The distal tibia is dislocated medially relative to the talus, as evidenced by the widened joint space. There is also an oblique fracture of the distal fibula.
Since the patient was experiencing neurovascular compromise, the dislocation was promptly reduced in the emergency department. Subsequently, he was taken to the operating room for open reduction and internal fixation of his fibula fracture.
A 70-year-old man is brought to your facility by EMS following a new-onset, witnessed seizure. He reportedly fell down some steps. On arrival, he has returned to baseline but is complaining of left-sided weakness and right ankle pain.
Medical history is significant for mild hypertension. Vital signs are stable. The patient exhibits slight confusion. He reports some mild weakness on his left side, especially in his lower extremity.
There also appears to be moderate soft-tissue swelling of his right ankle, with a slight deformity noted. Dorsalis pedal pulse appears to be slightly diminished in that foot as well.
You send the patient for noncontrast CT of the head, as well as a radiograph of the right ankle (the latter of which is shown). What is your impression?
An 8-month-old boy with a history of hypotonia, developmental delay, and seizure disorder refractory to multiple anticonvulsant medications, was presented to the ED with a 2-week history of intermittent fever and poor oral intake. His current medications included sodium bromide 185 mg orally twice daily for his seizure disorder.
On physical examination, the boy appeared small for his age, with diffuse hypotonia and diminished reflexes. He was able to track with his eyes but was otherwise unresponsive. No rash was present. Results of initial laboratory studies were: sodium 144 mEq/L; potassium, 4.8 mEq/L; chloride, 179 mEq/L; bicarbonate, 21 mEq/L; blood urea nitrogen, 6 mg/dL; creatinine, 0.1 mg/dL; and glucose, 63 mg/dL. His anion gap (AG) was −56.
What does the anion gap represent?
The AG is a valuable clinical calculation derived from the measured extracellular electrolytes and provides an index of acid-base status.1 Due to the necessity of electroneutrality, the sum of positive charges (cations) in the extracellular fluid must be balanced exactly with the sum of negative charges (anions). However, to routinely measure all of the cations and anions in the serum would be time-consuming and is also unnecessary. Because most clinical laboratories commonly only measure one relevant cation (sodium) and two anions (chloride and bicarbonate), the positive and negative sums are not completely balanced. The AG therefore refers to this difference (ie, AG = Na – [Cl + HCO3]).
Of course, electroneutrality exists in vivo, and is accomplished by the presence of unmeasured anions (UA) (eg, lactate and phosphate) and unmeasured cations (UC) (eg, potassium and calcium) not accounted for in the AG (ie, AG = UA – UC). In other words, the sum of measured plus the unmeasured anions must equal the sum of the measured plus unmeasured cations.
What causes a low or negative anion gap?
While most healthcare providers are well versed in the clinical significance of an elevated AG (eg, MUDPILES [methanol, uremia, diabetic ketoacidosis, propylene glycol or phenformin, iron or isoniazid, lactate, ethylene glycol, salicylates]), the meaning of a low or negative AG is underappreciated. There are several scenarios that could potentially yield a low or negative AG, including decreased concentration of UA, increased concentrations of nonsodium cations (UC), and overestimation of serum chloride.
Decreased Concentration of Unmeasured Anions. This most commonly occurs by two mechanisms: dilution of the extracellular fluid or hypoalbuminemia. The addition of water to the extracellular fluid will cause a proportionate dilution of all the measured electrolytes. Since the concentration of measured cations is higher than the measured anions, there is a small and relatively insignificant decrease in the AG.
Alternatively, hypoalbuminemia results in a low AG due to the change in UA; albumin is negatively charged. At physiologic pH, the overwhelming majority of serum proteins are anionic and counter-balanced by the positive charge of sodium. Albumin, the most abundant serum protein, accounts for approximately 75% of the normal AG. Hypoalbuminemic states, such as cirrhosis or nephrotic syndrome, can therefore cause low AG due to the retention of chloride to replace the lost negative charge. The albumin concentration can be corrected to calculate the AG.2
Nonsodium Cations. There are a number of clinical conditions that result in the retention of nonsodium cations. For example, the excess positively charged paraproteins associated with IgG myeloma raise the UC concentration, resulting in a low AG. Similarly, elevations of unmeasured cationic electrolytes, such as calcium and magnesium, may also result in a lower AG. Significant changes in AG, though, are caused only by profound (and often life-threatening) hypercalcemia or hypermagnesemia.
Overestimation of Serum Chloride. Overestimation of serum chloride most commonly occurs in the clinical scenario of bromide exposure. In normal physiologic conditions, chloride is the only halide present in the extracellular fluid. With intake of brominated products, chloride may be partially replaced by bromide. As there is greater renal tubular avidity for bromide, chronic ingestion of bromide results in a gradual rise in serum bromide concentrations with a proportional fall in chloride. However, and more importantly, bromide interferes with a number of laboratory techniques measuring chloride concentrations, resulting in a spuriously elevated chloride, or pseudohyperchloremia. Because the measured sodium and bicarbonate concentrations will remain unchanged, this falsely elevated chloride measurement will result in a negative AG.
What causes the falsely elevated chloride?
All of the current laboratory techniques for measurement of serum chloride concentration can potentially result in a falsely elevated value. However, the degree of pseudohyperchloremia will depend on the specific assay used for measurement. The ion-selective electrode method used by many common laboratory analyzers appears to have the greatest interference on chloride measurement in the presence of bromide. This is simply due to the molecular similarity of bromide and chloride. Conversely, the coulometry method, often used as a reference standard, has the least interference of current laboratory methods.3 This is because coulometry does not completely rely on molecular structure to measure concentration, but rather it measures the amount of energy produced or consumed in an electrolysis reaction. Iodide, another halide compound, has also been described as a cause of pseudohyperchloremia, whereas fluoride does not seem to have significant interference.4
How are patients exposed to bromide salts?
Bromide salts, specifically sodium bromide, are infrequently used to treat seizure disorders, but are generally reserved for patients with epilepsy refractory to other, less toxic anticonvulsant medications. During the era when bromide salts were more commonly used to treat epilepsy, bromide intoxication, or bromism, was frequently observed.
Bromism may manifest as a constellation of nonspecific neurological and psychiatric symptoms. These most commonly include headache, weakness, agitation, confusion, and hallucinations. In more severe cases of bromism, stupor and coma may occur.3,5
Although bromide salts are no longer commonly prescribed, a number of products still contain brominated ingredients. Symptoms of bromide intoxication can occur with chronic use of a cough syrup containing dextromethorphan hydrobromide as well as the brominated vegetable oils found in some soft drinks.5
How is bromism treated?
The treatment of bromism involves preventing further exposure to bromide and promoting bromide excretion. Bromide has a long half-life (10-12 days), and in patients with normal renal function, it is possible to reduce this half-life to approximately 3 days with hydration and diuresis with sodium chloride.3 Alternatively, in patients with impaired renal function or severe intoxication, hemodialysis has been used effectively.5
Case Conclusion
The patient was admitted for observation and treated with intravenous sodium chloride. After consultation with his neurologist, he was discharged home in the care of his parents, who were advised to continue him on sodium bromide 185 mg orally twice daily since his seizures were refractory to other anticonvulsant medications.
Dr Repplinger is a medical toxicology fellow in the department of emergency medicine at New York University Langone Medical Center. Dr Nelson, editor of “Case Studies in Toxicology,” is a professor in the department of emergency medicine and director of the medical toxicology fellowship program at the New York University School of Medicine and the New York City Poison Control Center. He is also associate editor, toxicology, of the EMERGENCY MEDICINE editorial board.
References
Emmett M, Narins RG. Clinical use of the anion gap. Medicine (Baltimore). 1977;56(1):38-54.
Figge J, Jabor A, Kazda A, Fencl V. Anion gap and hypoalbuminemia. Crit Care Med. 1998;26(11):1807-1810.
Vasuyattakul S, Lertpattanasuwan N, Vareesangthip K, Nimmannit S, Nilwarangkur S. A negative aniongap as a clue to diagnose bromide intoxication.Nephron. 1995;69(3):311-313.
An 8-month-old infant with a history of seizure presented to the ED with fever and poor oral intake.
An 8-month-old infant with a history of seizure presented to the ED with fever and poor oral intake.
Case
An 8-month-old boy with a history of hypotonia, developmental delay, and seizure disorder refractory to multiple anticonvulsant medications, was presented to the ED with a 2-week history of intermittent fever and poor oral intake. His current medications included sodium bromide 185 mg orally twice daily for his seizure disorder.
On physical examination, the boy appeared small for his age, with diffuse hypotonia and diminished reflexes. He was able to track with his eyes but was otherwise unresponsive. No rash was present. Results of initial laboratory studies were: sodium 144 mEq/L; potassium, 4.8 mEq/L; chloride, 179 mEq/L; bicarbonate, 21 mEq/L; blood urea nitrogen, 6 mg/dL; creatinine, 0.1 mg/dL; and glucose, 63 mg/dL. His anion gap (AG) was −56.
What does the anion gap represent?
The AG is a valuable clinical calculation derived from the measured extracellular electrolytes and provides an index of acid-base status.1 Due to the necessity of electroneutrality, the sum of positive charges (cations) in the extracellular fluid must be balanced exactly with the sum of negative charges (anions). However, to routinely measure all of the cations and anions in the serum would be time-consuming and is also unnecessary. Because most clinical laboratories commonly only measure one relevant cation (sodium) and two anions (chloride and bicarbonate), the positive and negative sums are not completely balanced. The AG therefore refers to this difference (ie, AG = Na – [Cl + HCO3]).
Of course, electroneutrality exists in vivo, and is accomplished by the presence of unmeasured anions (UA) (eg, lactate and phosphate) and unmeasured cations (UC) (eg, potassium and calcium) not accounted for in the AG (ie, AG = UA – UC). In other words, the sum of measured plus the unmeasured anions must equal the sum of the measured plus unmeasured cations.
What causes a low or negative anion gap?
While most healthcare providers are well versed in the clinical significance of an elevated AG (eg, MUDPILES [methanol, uremia, diabetic ketoacidosis, propylene glycol or phenformin, iron or isoniazid, lactate, ethylene glycol, salicylates]), the meaning of a low or negative AG is underappreciated. There are several scenarios that could potentially yield a low or negative AG, including decreased concentration of UA, increased concentrations of nonsodium cations (UC), and overestimation of serum chloride.
Decreased Concentration of Unmeasured Anions. This most commonly occurs by two mechanisms: dilution of the extracellular fluid or hypoalbuminemia. The addition of water to the extracellular fluid will cause a proportionate dilution of all the measured electrolytes. Since the concentration of measured cations is higher than the measured anions, there is a small and relatively insignificant decrease in the AG.
Alternatively, hypoalbuminemia results in a low AG due to the change in UA; albumin is negatively charged. At physiologic pH, the overwhelming majority of serum proteins are anionic and counter-balanced by the positive charge of sodium. Albumin, the most abundant serum protein, accounts for approximately 75% of the normal AG. Hypoalbuminemic states, such as cirrhosis or nephrotic syndrome, can therefore cause low AG due to the retention of chloride to replace the lost negative charge. The albumin concentration can be corrected to calculate the AG.2
Nonsodium Cations. There are a number of clinical conditions that result in the retention of nonsodium cations. For example, the excess positively charged paraproteins associated with IgG myeloma raise the UC concentration, resulting in a low AG. Similarly, elevations of unmeasured cationic electrolytes, such as calcium and magnesium, may also result in a lower AG. Significant changes in AG, though, are caused only by profound (and often life-threatening) hypercalcemia or hypermagnesemia.
Overestimation of Serum Chloride. Overestimation of serum chloride most commonly occurs in the clinical scenario of bromide exposure. In normal physiologic conditions, chloride is the only halide present in the extracellular fluid. With intake of brominated products, chloride may be partially replaced by bromide. As there is greater renal tubular avidity for bromide, chronic ingestion of bromide results in a gradual rise in serum bromide concentrations with a proportional fall in chloride. However, and more importantly, bromide interferes with a number of laboratory techniques measuring chloride concentrations, resulting in a spuriously elevated chloride, or pseudohyperchloremia. Because the measured sodium and bicarbonate concentrations will remain unchanged, this falsely elevated chloride measurement will result in a negative AG.
What causes the falsely elevated chloride?
All of the current laboratory techniques for measurement of serum chloride concentration can potentially result in a falsely elevated value. However, the degree of pseudohyperchloremia will depend on the specific assay used for measurement. The ion-selective electrode method used by many common laboratory analyzers appears to have the greatest interference on chloride measurement in the presence of bromide. This is simply due to the molecular similarity of bromide and chloride. Conversely, the coulometry method, often used as a reference standard, has the least interference of current laboratory methods.3 This is because coulometry does not completely rely on molecular structure to measure concentration, but rather it measures the amount of energy produced or consumed in an electrolysis reaction. Iodide, another halide compound, has also been described as a cause of pseudohyperchloremia, whereas fluoride does not seem to have significant interference.4
How are patients exposed to bromide salts?
Bromide salts, specifically sodium bromide, are infrequently used to treat seizure disorders, but are generally reserved for patients with epilepsy refractory to other, less toxic anticonvulsant medications. During the era when bromide salts were more commonly used to treat epilepsy, bromide intoxication, or bromism, was frequently observed.
Bromism may manifest as a constellation of nonspecific neurological and psychiatric symptoms. These most commonly include headache, weakness, agitation, confusion, and hallucinations. In more severe cases of bromism, stupor and coma may occur.3,5
Although bromide salts are no longer commonly prescribed, a number of products still contain brominated ingredients. Symptoms of bromide intoxication can occur with chronic use of a cough syrup containing dextromethorphan hydrobromide as well as the brominated vegetable oils found in some soft drinks.5
How is bromism treated?
The treatment of bromism involves preventing further exposure to bromide and promoting bromide excretion. Bromide has a long half-life (10-12 days), and in patients with normal renal function, it is possible to reduce this half-life to approximately 3 days with hydration and diuresis with sodium chloride.3 Alternatively, in patients with impaired renal function or severe intoxication, hemodialysis has been used effectively.5
Case Conclusion
The patient was admitted for observation and treated with intravenous sodium chloride. After consultation with his neurologist, he was discharged home in the care of his parents, who were advised to continue him on sodium bromide 185 mg orally twice daily since his seizures were refractory to other anticonvulsant medications.
Dr Repplinger is a medical toxicology fellow in the department of emergency medicine at New York University Langone Medical Center. Dr Nelson, editor of “Case Studies in Toxicology,” is a professor in the department of emergency medicine and director of the medical toxicology fellowship program at the New York University School of Medicine and the New York City Poison Control Center. He is also associate editor, toxicology, of the EMERGENCY MEDICINE editorial board.
References
Emmett M, Narins RG. Clinical use of the anion gap. Medicine (Baltimore). 1977;56(1):38-54.
Figge J, Jabor A, Kazda A, Fencl V. Anion gap and hypoalbuminemia. Crit Care Med. 1998;26(11):1807-1810.
Vasuyattakul S, Lertpattanasuwan N, Vareesangthip K, Nimmannit S, Nilwarangkur S. A negative aniongap as a clue to diagnose bromide intoxication.Nephron. 1995;69(3):311-313.
Ng YY, Lin WL, Chen TW. Spurious hyperchloremiaand decreased anion gap in a patient with dextromethorphan bromide. Am J Nephrol. 1992;12(4):268-270.
References
Emmett M, Narins RG. Clinical use of the anion gap. Medicine (Baltimore). 1977;56(1):38-54.
Figge J, Jabor A, Kazda A, Fencl V. Anion gap and hypoalbuminemia. Crit Care Med. 1998;26(11):1807-1810.
Vasuyattakul S, Lertpattanasuwan N, Vareesangthip K, Nimmannit S, Nilwarangkur S. A negative aniongap as a clue to diagnose bromide intoxication.Nephron. 1995;69(3):311-313.
Pericarditis is in most cases a one-time disease simply treated with anti-inflammatory drugs. It requires no extensive workup for systemic inflammatory or autoimmune disease. Further evaluation is required for patients who have recurrent pericarditis resistant to conventional therapy or pericarditis with manifestations of systemic disease.
ACUTE PERICARDITIS
Pericardial disease has different presentations: acute, recurrent, constrictive, effusive-constrictive, and pericardial effusion with or without tamponade. Acute pericarditis is the most common of these and can affect people of all ages. The typical acute manifestations are chest pain (usually pleuritic), a pericardial friction rub, and widespread ST-segment elevation on the electrocardiogram.1,2 The chest pain tends to be sharp and long-lasting; it radiates to the trapezius ridge and increases during respiration or body movements.
Acute pericarditis usually responds to an anti-inflammatory drug such as colchicine 0.6 mg/day for 3 months, a nonsteroidal anti-inflammatory drug such as ibuprofen 600 mg three times a day for 10 days, and in advanced resistant cases, an oral corticosteroid.3,4
Most often, pericarditis is either idiopathic or occurs after a respiratory viral illness. Much less common causes include bacterial infection, postpericardiotomy syndrome, myocardial infarction, primary or metastatic tumors, trauma, radiation, and uremia. However, pericarditis can also be part of the presentation of systemic inflammatory and autoimmune diseases such as rheumatoid arthritis and systemic lupus erythematosus; hereditary periodic fever syndromes such as familial Mediterranean fever; and systemic-onset juvenile idiopathic arthritis.1,5
Patients with recurrent pericarditis and pericarditis with manifestations of systemic disease need a thorough workup for autoimmune disease
In acute pericarditis, a complex workup is usually not justified, since the results will have limited usefulness in the clinical management of the patient. It is most often diagnosed by the presenting symptoms, auscultation, electrocardiography, echocardiography, and chest radiography, and by additional basic tests that include a complete blood cell count, complete metabolic profile, erythrocyte sedimentation rate, and C-reactive protein level. However, if pericarditis does not respond to anti-inflammatory treatment and if an autoimmune or infectious disease is suspected, further evaluation may include antinuclear antibody testing and testing for human immunodeficiency virus and tuberculosis. If the diagnosis of acute pericarditis remains uncertain, cardiac magnetic resonance imaging (MRI) may be useful.
RECURRENT PERICARDITIS
Although acute pericarditis most often has a benign course and responds well to anti-inflammatory drugs, 20% to 30% of patients who have a first attack of acute pericarditis have a recurrence, and up to 50% of patients who have one recurrence will have another.3,4
Disease activity can be followed with serial testing of inflammatory markers—eg, erythrocyte sedimentation rate and C-reactive protein level. Echocardiography, cardiac computed tomography, and cardiac MRI can characterize active inflammation, edema, pericardial thickness, and pericardial effusion.6–8
Recurrent pericarditis is often resistant to standard therapy and requires corticosteroids in high doses, which paradoxically can increase the risk of recurrence. Therefore, further workup for underlying autoimmune disease, systemic inflammatory disease, or infection is necessary. More potent immunosuppressive therapy may be required, not only in pericarditis associated with systemic autoimmune or inflammatory conditions, but even in idiopathic recurrent pericarditis, either to control symptoms or to mitigate the effects of corticosteroids.
SYSTEMIC INFLAMMATION
The true prevalence of pericardial disease in most systemic inflammatory and autoimmune diseases is difficult to determine from current data. But advances in serologic testing and imaging techniques have shown cardiac involvement in a number of inflammatory diseases.9
In one study, a serologic autoimmune workup in patients with acute pericarditis found that 2% had collagen vascular disease.9 Pericardial involvement is likely in systemic lupus erythematosus,10 and a postmortem study of patients with systemic sclerosis found that 72% had pericarditis.11 Mixed connective tissue disease has been associated with pericarditis in 29% of cases and 56% in autopsy studies.12,13 Pericarditis may be the initial manifestation of vasculitis—eg, Takayasu arteritis or granulomatosis with polyangiitis (formerly known as Wegener granulomatosis).
Other diseases with pericardial involvement include Still disease, Sjögren syndrome, sarcoidosis, and inflammatory bowel disease. Symptomatic pericarditis occurs in about 25% of patients with Sjögren syndrome and asymptomatic pericardial involvement in more than half. Autopsy studies reported pericardial involvement in up to 80% of patients with systemic lupus erythematosus. Cardiac tamponade occurs in fewer than 2%, and constrictive pericarditis is extremely rare.5,9–11
RECOMMENDATIONS
Patients with a first episode of pericarditis should be treated with an anti-inflammatory medication, with no comprehensive testing for autoimmune disease. An evaluation for autoimmune and infectious disease should be carried out in patients with fever (temperature > 38°C; 100.4°F), recurrent pericarditis, recurrent large pericardial effusion or tamponade, or night sweats despite conventional medical therapy. Signs of systemic disease such as renal failure, elevated liver enzymes, or skin rash merit further evaluation.
Prospective studies using appropriate serologic testing and imaging are needed to determine the correlation between myopericardial involvement and inflammatory diseases because of increased morbidity and mortality in several of these diseases.
References
Troughton RW, Asher CR, Klein AL. Pericarditis. Lancet 2004; 363:717–727.
Alraies MC, Klein AL. Should we still use electrocardiography to diagnose pericardial disease? Cleve Clin J Med 2013; 80:97–100.
Imazio M, Brucato A, Cemin R, et al; ICAP Investigators. A randomized trial of colchicine for acute pericarditis. N Engl J Med 2013; 369:1522–1528.
Imazio M, Cecchi E, Demichelis B, et al. Indicators of poor prognosis of acute pericarditis. Circulation 2007; 115:2739–2744.
Zayas R, Anguita M, Torres F, et al. Incidence of specific etiology and role of methods for specific etiologic diagnosis of primary acute pericarditis. Am J Cardiol 1995; 75:378–382.
Verhaert D, Gabriel RS, Johnston D, Lytle BW, Desai MY, Klein AL. The role of multimodality imaging in the management of pericardial disease. Circ Cardiovasc Imaging 2010; 3:333–343.
Klein AL, Abbara S, Agler DA, et al. American Society of Echocardiography clinical recommendations for multimodality cardiovascular imaging of patients with pericardial disease: endorsed by the Society for Cardiovascular Magnetic Resonance and Society of Cardiovascular Computed Tomography. J Am Soc Echocardiogr 2013; 26:965–1012.e15.
Yingchoncharoen T, Alraies MC, Kwon DH, Rodriguez ER, Tan CD, Klein AL. Emerging role of multimodality imaging in management of inflammatory pericardial diseases. Expert Rev Cardiovasc Ther 2013; 11:1211–1225.
M. Chadi Alraies, MD, FACP Department of Medicine, Division of Cardiology, University of Minnesota, Minneapolis, MN
M. Motaz Baibars, MD, FACP Department of Medicine, Peninsula Regional Medical Center, Salisbury, MD
Allan L. Klein, MD Center for Pericardial Disease, Heart and Vascular Institute, Cleveland Clinic
Address: M. Chadi Alraies, MD, FACP, Department of Medicine, Division of Cardiology, University of Minnesota, 420 Delaware Street SE, MMC 506, Minneapolis, MN 55455; e-mail: [email protected]
Author and Disclosure Information
M. Chadi Alraies, MD, FACP Department of Medicine, Division of Cardiology, University of Minnesota, Minneapolis, MN
M. Motaz Baibars, MD, FACP Department of Medicine, Peninsula Regional Medical Center, Salisbury, MD
Allan L. Klein, MD Center for Pericardial Disease, Heart and Vascular Institute, Cleveland Clinic
Address: M. Chadi Alraies, MD, FACP, Department of Medicine, Division of Cardiology, University of Minnesota, 420 Delaware Street SE, MMC 506, Minneapolis, MN 55455; e-mail: [email protected]
Pericarditis is in most cases a one-time disease simply treated with anti-inflammatory drugs. It requires no extensive workup for systemic inflammatory or autoimmune disease. Further evaluation is required for patients who have recurrent pericarditis resistant to conventional therapy or pericarditis with manifestations of systemic disease.
ACUTE PERICARDITIS
Pericardial disease has different presentations: acute, recurrent, constrictive, effusive-constrictive, and pericardial effusion with or without tamponade. Acute pericarditis is the most common of these and can affect people of all ages. The typical acute manifestations are chest pain (usually pleuritic), a pericardial friction rub, and widespread ST-segment elevation on the electrocardiogram.1,2 The chest pain tends to be sharp and long-lasting; it radiates to the trapezius ridge and increases during respiration or body movements.
Acute pericarditis usually responds to an anti-inflammatory drug such as colchicine 0.6 mg/day for 3 months, a nonsteroidal anti-inflammatory drug such as ibuprofen 600 mg three times a day for 10 days, and in advanced resistant cases, an oral corticosteroid.3,4
Most often, pericarditis is either idiopathic or occurs after a respiratory viral illness. Much less common causes include bacterial infection, postpericardiotomy syndrome, myocardial infarction, primary or metastatic tumors, trauma, radiation, and uremia. However, pericarditis can also be part of the presentation of systemic inflammatory and autoimmune diseases such as rheumatoid arthritis and systemic lupus erythematosus; hereditary periodic fever syndromes such as familial Mediterranean fever; and systemic-onset juvenile idiopathic arthritis.1,5
Patients with recurrent pericarditis and pericarditis with manifestations of systemic disease need a thorough workup for autoimmune disease
In acute pericarditis, a complex workup is usually not justified, since the results will have limited usefulness in the clinical management of the patient. It is most often diagnosed by the presenting symptoms, auscultation, electrocardiography, echocardiography, and chest radiography, and by additional basic tests that include a complete blood cell count, complete metabolic profile, erythrocyte sedimentation rate, and C-reactive protein level. However, if pericarditis does not respond to anti-inflammatory treatment and if an autoimmune or infectious disease is suspected, further evaluation may include antinuclear antibody testing and testing for human immunodeficiency virus and tuberculosis. If the diagnosis of acute pericarditis remains uncertain, cardiac magnetic resonance imaging (MRI) may be useful.
RECURRENT PERICARDITIS
Although acute pericarditis most often has a benign course and responds well to anti-inflammatory drugs, 20% to 30% of patients who have a first attack of acute pericarditis have a recurrence, and up to 50% of patients who have one recurrence will have another.3,4
Disease activity can be followed with serial testing of inflammatory markers—eg, erythrocyte sedimentation rate and C-reactive protein level. Echocardiography, cardiac computed tomography, and cardiac MRI can characterize active inflammation, edema, pericardial thickness, and pericardial effusion.6–8
Recurrent pericarditis is often resistant to standard therapy and requires corticosteroids in high doses, which paradoxically can increase the risk of recurrence. Therefore, further workup for underlying autoimmune disease, systemic inflammatory disease, or infection is necessary. More potent immunosuppressive therapy may be required, not only in pericarditis associated with systemic autoimmune or inflammatory conditions, but even in idiopathic recurrent pericarditis, either to control symptoms or to mitigate the effects of corticosteroids.
SYSTEMIC INFLAMMATION
The true prevalence of pericardial disease in most systemic inflammatory and autoimmune diseases is difficult to determine from current data. But advances in serologic testing and imaging techniques have shown cardiac involvement in a number of inflammatory diseases.9
In one study, a serologic autoimmune workup in patients with acute pericarditis found that 2% had collagen vascular disease.9 Pericardial involvement is likely in systemic lupus erythematosus,10 and a postmortem study of patients with systemic sclerosis found that 72% had pericarditis.11 Mixed connective tissue disease has been associated with pericarditis in 29% of cases and 56% in autopsy studies.12,13 Pericarditis may be the initial manifestation of vasculitis—eg, Takayasu arteritis or granulomatosis with polyangiitis (formerly known as Wegener granulomatosis).
Other diseases with pericardial involvement include Still disease, Sjögren syndrome, sarcoidosis, and inflammatory bowel disease. Symptomatic pericarditis occurs in about 25% of patients with Sjögren syndrome and asymptomatic pericardial involvement in more than half. Autopsy studies reported pericardial involvement in up to 80% of patients with systemic lupus erythematosus. Cardiac tamponade occurs in fewer than 2%, and constrictive pericarditis is extremely rare.5,9–11
RECOMMENDATIONS
Patients with a first episode of pericarditis should be treated with an anti-inflammatory medication, with no comprehensive testing for autoimmune disease. An evaluation for autoimmune and infectious disease should be carried out in patients with fever (temperature > 38°C; 100.4°F), recurrent pericarditis, recurrent large pericardial effusion or tamponade, or night sweats despite conventional medical therapy. Signs of systemic disease such as renal failure, elevated liver enzymes, or skin rash merit further evaluation.
Prospective studies using appropriate serologic testing and imaging are needed to determine the correlation between myopericardial involvement and inflammatory diseases because of increased morbidity and mortality in several of these diseases.
References
Troughton RW, Asher CR, Klein AL. Pericarditis. Lancet 2004; 363:717–727.
Alraies MC, Klein AL. Should we still use electrocardiography to diagnose pericardial disease? Cleve Clin J Med 2013; 80:97–100.
Imazio M, Brucato A, Cemin R, et al; ICAP Investigators. A randomized trial of colchicine for acute pericarditis. N Engl J Med 2013; 369:1522–1528.
Imazio M, Cecchi E, Demichelis B, et al. Indicators of poor prognosis of acute pericarditis. Circulation 2007; 115:2739–2744.
Zayas R, Anguita M, Torres F, et al. Incidence of specific etiology and role of methods for specific etiologic diagnosis of primary acute pericarditis. Am J Cardiol 1995; 75:378–382.
Verhaert D, Gabriel RS, Johnston D, Lytle BW, Desai MY, Klein AL. The role of multimodality imaging in the management of pericardial disease. Circ Cardiovasc Imaging 2010; 3:333–343.
Klein AL, Abbara S, Agler DA, et al. American Society of Echocardiography clinical recommendations for multimodality cardiovascular imaging of patients with pericardial disease: endorsed by the Society for Cardiovascular Magnetic Resonance and Society of Cardiovascular Computed Tomography. J Am Soc Echocardiogr 2013; 26:965–1012.e15.
Yingchoncharoen T, Alraies MC, Kwon DH, Rodriguez ER, Tan CD, Klein AL. Emerging role of multimodality imaging in management of inflammatory pericardial diseases. Expert Rev Cardiovasc Ther 2013; 11:1211–1225.
Doria A, Iaccarino L, Sarzi-Puttini P, Atzeni F, Turriel M, Petri M. Cardiac involvement in systemic lupus erythematosus. Lupus 2005; 14:683–686.
Byers RJ, Marshall DA, Freemont AJ. Pericardial involvement in systemic sclerosis. Ann Rheum Dis 1997; 56:393–394.
Kasukawa R. Mixed connective tissue disease. Intern Med 1999; 38:386–393.
Bezerra MC, Saraiva F Jr, Carvalho JF, Caleiro MT, Goncalves CR, Borba EF. Cardiac tamponade due to massive pericardial effusion in mixed connective tissue disease: reversal with steroid therapy. Lupus 2004; 13:618–620.
References
Troughton RW, Asher CR, Klein AL. Pericarditis. Lancet 2004; 363:717–727.
Alraies MC, Klein AL. Should we still use electrocardiography to diagnose pericardial disease? Cleve Clin J Med 2013; 80:97–100.
Imazio M, Brucato A, Cemin R, et al; ICAP Investigators. A randomized trial of colchicine for acute pericarditis. N Engl J Med 2013; 369:1522–1528.
Imazio M, Cecchi E, Demichelis B, et al. Indicators of poor prognosis of acute pericarditis. Circulation 2007; 115:2739–2744.
Zayas R, Anguita M, Torres F, et al. Incidence of specific etiology and role of methods for specific etiologic diagnosis of primary acute pericarditis. Am J Cardiol 1995; 75:378–382.
Verhaert D, Gabriel RS, Johnston D, Lytle BW, Desai MY, Klein AL. The role of multimodality imaging in the management of pericardial disease. Circ Cardiovasc Imaging 2010; 3:333–343.
Klein AL, Abbara S, Agler DA, et al. American Society of Echocardiography clinical recommendations for multimodality cardiovascular imaging of patients with pericardial disease: endorsed by the Society for Cardiovascular Magnetic Resonance and Society of Cardiovascular Computed Tomography. J Am Soc Echocardiogr 2013; 26:965–1012.e15.
Yingchoncharoen T, Alraies MC, Kwon DH, Rodriguez ER, Tan CD, Klein AL. Emerging role of multimodality imaging in management of inflammatory pericardial diseases. Expert Rev Cardiovasc Ther 2013; 11:1211–1225.