User login
Health information exchange in US hospitals: The current landscape and a path to improved information sharing
The US healthcare system is highly fragmented, with patients typically receiving treatment from multiple providers during an episode of care and from many more providers over their lifetime.1,2 As patients move between care delivery settings, whether and how their information follows them is determined by a haphazard and error-prone patchwork of telephone, fax, and electronic communication channels.3 The existence of more robust electronic communication channels is often dictated by factors such as which providers share the same electronic health record (EHR) vendor rather than which providers share the highest volume of patients. As a result, providers often make clinical decisions with incomplete information, increasing the chances of misdiagnosis, unsafe or suboptimal treatment, and duplicative utilization.
Providers across the continuum of care encounter challenges to optimal clinical decision-making as a result of incomplete information. These are particularly problematic among clinicians in hospitals and emergency departments (EDs). Clinical decision-making in EDs often involves urgent and critical conditions in which decisions are made under pressure. Time constraints limit provider ability to find key clinical information to accurately diagnose and safely treat patients.4-6 Even for planned inpatient care, providers are often unfamiliar with patients, and they make safer decisions when they have full access to information from outside providers.7,8
Transitions of care between hospitals and primary care settings are also fraught with gaps in information sharing. Clinical decisions made in primary care can set patients on treatment trajectories that are greatly affected by the quality of information available to the care team at the time of initial diagnosis as well as in their subsequent treatment. Primary care physicians are not universally notified when their patients are hospitalized and may not have access to detailed information about the hospitalization, which can impair their ability to provide high quality care.9-11
Widespread and effective electronic health information exchange (HIE) holds the potential to address these challenges.3 With robust, interconnected electronic systems, key pieces of a patient’s health record can be electronically accessed and reconciled during planned and unplanned care transitions. The concept of HIE is simple—make all relevant patient data available to the clinical care team at the point of care, regardless of where that information was generated. The estimated value of nationwide interoperable EHR adoption suggests large savings from the more efficient, less duplicative, and higher quality care that likely results.12,13
There has been substantial funding and activity at federal, state, and local levels to promote the development of HIE in the US. The 2009 Health Information Technology for Economic and Clinical Health (HITECH) Act has the specific goal of accelerating adoption and use of certified EHR technology coupled with the ability to exchange clinical information to support patient care.14 The HITECH programs supported specific types of HIE that were believed to be particularly critical to improving patient care and included them in the federally-defined criteria for Meaningful Use (MU) of EHRs (ie, providers receive financial incentives for achieving specific objectives). The MU criteria evolve, moving from data capture in stage 1 to improved patient outcomes in stage 3.15 The HIE criteria focus on sending and receiving summary-of-care records during care transitions.
Despite the clear benefits of HIE and substantial support stated in policy initiatives, the spread of national HIE has been slow. Today, HIE in the US is highly heterogeneous: as a result of multiple federal-, state-, community-, enterprise- and EHR vendor-level efforts, only some provider organizations are able to engage in HIE with the other provider organizations with which they routinely share patients. In this review, we offer a framework and a corresponding set of definitions to understand the current state of HIE in the US. We describe key challenges to HIE progress and offer insights into the likely path to ensure that clinicians have routine, electronic access to patient information.
FOUR KEY DIMENSIONS OF HEALTH INFORMATION EXCHANGE
While the concept of HIE is simple—electronic access to clinical information across healthcare settings—the operationalization of HIE occurs in many different ways.16 While the terms “health information exchange” and “interoperability” are often used interchangeably, they can have different meanings. In this section, we describe 4 important dimensions that serve as a framework for understanding any given effort to enable HIE (Table).

(1) What Is Exchanged? Types of Information
The term “health information exchange” is ambiguous with respect to the type(s) of information that are accessible. Health information exchange may refer to the process of 2 providers electronically sharing a wide range of data, from a single type of information (eg, lab test results), summary of care records, to complete patient records.17 Part of this ambiguity may stem from uncertainty about the scope of information that should be shared, and how this varies based on the type of clinical encounter. For example, critical types of information in the ED setting may differ from those relevant to a primary care team after a referral. While the ability to access only particular types of information will not address all information gaps, providing access to complete patient records may result in information overload that inhibits the ability to find the subset of information relevant in a given clinical encounter.
(2) Who is Exchanging? Relationship Between Provider Organizations
The types of information accessed electronically are effectively agnostic to the relationship between the provider organizations that are sharing information. Traditionally, HIE has been considered as information that is electronically shared among 2 or more unaffiliated organizations. However, there is increasing recognition that some providers may not have electronic access to all information about their patients that exists within their organization, often after a merger or acquisition between 2 providers with different EHR systems.18,19 In these cases, a primary care team in a large integrated delivery system may have as many information gaps as a primary care team in a small, independent practice. Fulfilling clinical information needs may require both intra- and interorganizational HIE, which complicates the design of HIE processes and how the care team approaches incorporating information from both types of organizations into their decision-making. It is also important to recognize that some provider organizations, particularly small, rural practices, may not have the information technology and connectivity infrastructure required to engage in HIE.
(3) How Is Information Exchanged? Types of Electronic Access: Push vs Pull Exchange
To minimize information gaps, electronic access to information from external settings needs to offer both “push” and “pull” options. Push exchange, which can direct information electronically to a targeted recipient, works in scenarios in which there is a known information gap and known information source. The classic use for push exchange is care coordination, such as primary care physician-specialist referrals or hospital-primary care physician transitions postdischarge. Pull exchange accommodates scenarios in which there is a known information gap but the source(s) of information are unknown; it requires that clinical care teams search for and locate the clinical information that exists about the patient in external settings. Here, the classic use is emergency care in which the care team may encounter a new patient and want to retrieve records.
Widespread use of provider portals that offer view-only access into EHRs and other clinical data repositories maintained by external organizations complicate the picture. Portals are commonly used by hospitals to enable community providers to view information from a hospitalization.21 While this does not fall under the commonly held notion of HIE because no exchange occurs, portals support a pull approach to accessing information electronically among care settings that treat the same patients but use different EHRs.
Regardless of whether information is pushed or pulled, this may happen with varying degrees of human effort. This distinction gives rise to the difference between HIE and interoperability. Health information exchange reflects the ability of EHRs to exchange information, while interoperability additionally requires that EHRs be able to use exchanged information. From an operational perspective, the key distinction between HIE and interoperability is the extent of human involvement. Health information exchange requires that a human read and decide how to enter information from external settings (eg, a chart in PDF format sent between 2 EHRs), while interoperability enables the EHR that receives the information to understand the content and automatically triage or reconcile information, such as a medication list, without any human action.21 Health information exchange, therefore, relies on the diligence of the receiving clinician, while interoperability does not.
(4) What Governance Entity Defines the “Rules” of Exchange?
When more than 1 provider organization shares patient-identified data, a governance entity must specify the framework that governs the exchange. While the specifics of HIE governance vary, there are 3 predominant types of HIE networks, based on the type of organization that governs exchange: enterprise HIE networks, EHR vendor HIE networks or community HIE networks.
Enterprise HIE networks exist when 1 or more provider organizations electronically share clinical information to support patient care with some restriction, beyond geography, that dictates which organizations are involved. Typically, restrictions are driven by strategic, proprietary interests.22,23 Although broad-based information access across settings would be in the best interest of the patient, provider organizations are sensitive to the competitive implications of sharing data and may pursue such sharing in a strategic way.24 A common scenario is when hospitals choose to strategically affiliate with select ambulatory providers and exclusively exchange information with them. This should facilitate better care coordination for patients shared by the hospital and those providers but can also benefit the hospital by increasing the referrals from those providers. While there is little direct evidence quantifying the extent to which this type of strategic sharing takes place, there have been anecdotal reports as well as indirect findings that for-profit hospitals in competitive markets are less likely to share patient data.19,25
EHR vendor HIE networks exist when exchange occurs within a community of provider organizations that use an EHR from the same vendor. A subset of EHR vendors have made this capability available; EPIC’s CareEverywhere solution27 is the best-known example. Providers with an EPIC EHR are able to query for and retrieve summary of care records and other documents from any provider organization with EPIC that has activated this functionality. There are also multivendor efforts, such as CommonWell27 and the Sequoia Project’s Carequality collaborative,28 which are initiatives that seek to provide a common interoperability framework across a diverse set of stakeholders, including provider organizations with different EHR systems, in a similar fashion to HIE modules like CareEverywhere. To date, growth in these cross-vendor collaborations has been slow, and they have limited participation. While HIE networks that involve EHR vendors are likely to grow, it is difficult to predict how quickly because they are still in an early phase of development, and face nontechnical barriers such as patient consent policies that vary between providers and across states.
Community HIE networks—also referred to as health information organizations (HIOs) or regional health information organizations (RHIOs)—exist when provider organizations in a community, frequently state-level organizations that were funded through HITECH grants,14 set up the technical infrastructure and governance approach to engage in HIE to improve patient care. In contrast to enterprise or vendor HIE networks that have pursued HIE in ways that appear strategically beneficial, the only restriction on participation in community and state HIE networks is usually geography because they view information exchange as a public good. Seventyone percent of hospital service areas (HSAs) are covered by at least 1 of the 106 operational HIOs, with 309,793 clinicians (licensed prescribers) participating in those exchange networks. Even with early infusions of public and other grant-funding, community HIE networks have experienced significant challenges to sustained operation, and many have ceased operating.29
Thus, for any given provider organization, available HIE networks are primarily shaped by 3 factors:
1. Geographic location, which determines the available community and state HIE networks (as well as other basic information technology and connectivity infrastructure); providers located outside the service areas covered by an operational HIE have little incentive to participate because they do not connect them to providers with whom they share patients. Providers in rural areas may simply not have the needed infrastructure to pursue HIE.
2. Type of organization to which they belong, which determines the available enterprise HIE networks; providers who are not members of large health systems may be excluded from participation in these types of networks.
3. EHR vendor, which determines whether they have access to an EHR vendor HIE network.
ONGOING CHALLENGES
Despite agreement about the substantial potential of HIE to reduce costs and increase the quality of care delivered across a broad range of providers, HIE progress has been slow. While HITECH has successfully increased EHR adoption in hospitals and ambulatory practices,30 HIE has lagged. This is largely because many complex, intertwined barriers must be addressed for HIE to be widespread.
Lack of a Defined Goal
The cost and complexity associated with the exchange of a single type of data (eg, medications) is substantially less than the cost and complexity of sharing complete patient records. There has been little industry consensus on the target goal—do we need to enable sharing of complete patient records across all providers, or will summary of care records suffice? If the latter, as is the focus of the current MU criteria, what types of information should be included in a summary of care record, and should content and/or structure vary depending on the type of care transition? While the MU criteria require the exchange of a summary of care record with defined data fields, it remains unclear whether this is the end state or whether we should continue to push towards broad-based sharing of all patient data as structured elements. Without a clear picture of the ideal end state, there has been significant heterogeneity in the development of HIE capabilities across providers and vendors, and difficulty coordinating efforts to continue to advance towards a nationwide approach. Addressing this issue also requires progress to define HIE usability, that is, how information from external organizations should be presented and integrated into clinical workflow and clinical decisions. Currently, where HIE is occurring and clinicians are receiving summary of care records, they find them long, cluttered, and difficult to locate key information.
Numerous, Complex Barriers Spanning Multiple Stakeholders
In the context of any individual HIE effort, even after the goal is defined, there are a myriad of challenges. In a recent survey of HIO efforts, many identified the following barriers as substantially impeding their development: establishing a sustainable business model, lack of funding, integration of HIE into provider workflow, limitations of current data standards, and working with governmental policy and mandates.30 What is notable about this list is that the barriers span an array of areas, including financial incentives and identifying a sustainable business model, technical barriers such as working within the limitations of data standards, and regulatory issues such as state laws that govern the requirements for patient consent to exchange personal health information. Overcoming any of these issues is challenging, but trying to tackle all of them simultaneously clearly reveals why progress has been slow. Further, resolving many of the issues involve different groups of stakeholders. For example, implementing appropriate patient consent procedures can require engaging with and harmonizing the regulations of multiple states, as well as the Health Insurance Portability and Accountability Act (HIPAA) and regulations specific to substance abuse data.
Weak or Misaligned Incentives
Among the top barriers to HIE efforts are those related to funding and lack of a sustainable business model. This reflects the fact that economic incentives in the current market have not promoted provider engagement in HIE. Traditional fee-for-service payment structures do not reward providers for avoiding duplicative care.31 Further, hospitals perceive patient data as a “key strategic asset, tying physicians and patients to their organization,”24 and are reluctant to share data with competitors. Compounding the problem is that EHR vendors have a business interest in using HIE as a lever to increase revenue. In the short-term, they can charge high fees for interfaces and other HIE-related functionality. In the long-run, vendors may try to influence provider choice of system by making it difficult to engage in cross-vendor exchange.32 Information blocking—when providers or vendors knowingly interfere with HIE33—reflects not only weak incentives, but perverse incentives. While not all providers and vendors experience perverse incentives, the combination of weak and perverse incentives suggests the need to strengthen incentives, so that both types of stakeholders are motivated to tackle the barriers to HIE development. Key to strengthening incentives are payers, who are thought to be the largest beneficiaries of HIE. Payers have been reluctant to make significant investments in HIE without a more active voice in its implementation,34 but a shift to value-based payment may increase their engagement.
THE PATH FORWARD
Despite the continued challenges to nationwide HIE, several policy and technology developments show promise. Stage 3 meaningful use criteria continue to build on previous stages in increasing HIE requirements, raising the threshold for electronic exchange and EHR integration of summary of care documentation in patient transitions. The recently released Medicare Access and CHIP Reauthorization Act (MACRA) Merit-based Incentive Payment System (MIPS) proposed rule replaces stage 3 meaningful use for Medicare-eligible providers with advancing care information (ACI), which accounts for 25% of a provider’s overall incentive reimbursement and includes multiple HIE criteria for providers to report as part of the base and performance score, and follows a very similar framework to stage 3 MU with its criteria regarding HIE.35 While the Centers for Medicare and Medicaid Services (CMS) has not publicly declared that stage 3 MU will be replaced by ACI for hospitals and Medicaid providers, it is likely it will align those programs with the newly announced Medicare incentives.
MACRA also included changes to the Office of the National Coordinator (ONC) EHR certification program in an attempt to further encourage HIE. Vendors and providers must attest that they do not engage in information blocking and will cooperate with the Office’s surveillance programs to that effect. They also must attest that, to the greatest degree possible, their EHR systems allow for bi-directional interoperability with other providers, including those with different EHR vendors, and timely access for patients to view, download, and transmit their health data. In addition, there are emerging federal efforts to pursue a more standardized approach to patient matching and harmonize consent policies across states. These types of new policy initiatives indicate a continued interest in prioritizing HIE and interoperability.21
New technologies may also help spur HIE progress. The newest policy initiatives from CMS, including stage 3 MU and MACRA, have looked to incentivize the creation of application program interfaces (APIs), a set of publicly available tools from EHR vendors to allow developers to build applications that can directly interface with, and retrieve data from, their EHRs. While most patient access to electronic health data to date has been accomplished via patient portals, open APIs would enable developers to build an array of programs for consumers to view, download, and transmit their health data.
Even more promising is the development of the newest Health Level 7 data transmission standard, Fast Healthcare Interoperability Resources (FHIR), which promises to dramatically simplify the technical aspects of interoperability. FHIR utilizes a human-readable, easy to implement modular “resources” standard that may alleviate many technical challenges that come with implementation of an HIE system, enabling cheaper and simpler interoperability.36 A consortium of EHR vendors are working together to test these standards.28 The new FHIR standards also work in conjunction with APIs to allow easier development of consumer-facing applications37 that may empower patients to take ownership of their health data.
CONCLUSION
While HIE holds great promise to reduce the cost and improve the quality of care, progress towards a nationally interoperable health system has been slow. Simply defining HIE and what types of HIE are needed in different clinical scenarios has proven challenging. The additional challenges to implementing HIE in complex technology, legal/regulatory, governance, and incentive environment are not without solutions. Continued policy interventions, private sector collaborations, and new technologies may hold the keys to realizing the vast potential of electronic HIE.
Disclosure
Nothing to report.
1. Pham HH, Schrag D, O’Malley AS, Wu B, Bach PB. Care patterns in Medicare and their implications for pay for performance. N Engl J Med. 2007;356(11):1130-1139. PubMed
2. Finnell JT, Overhage JM, Dexter PR, Perkins SM, Lane KA, McDonald CJ. Community clinical data exchange for emergency medicine patients. Paper presented at: AMIA Annual Symposium Proceedings 2003. PubMed
3. Bodenheimer T. Coordinating care-a perilous journey through the health care system. N Engl J Med. 2008;358(10):1064-1071. PubMed
4. Franczak MJ, Klein M, Raslau F, Bergholte J, Mark LP, Ulmer JL. In emergency departments, radiologists’ access to EHRs may influence interpretations and medical management. Health Aff (Millwood). 2014;33(5):800-806. PubMed
5. Shapiro JS, Kannry J, Kushniruk AW, Kuperman G; New York Clinical Information Exchange (NYCLIX) Clinical Advisory Subcommittee. Emergency physicians’ perceptions of health information exchange. J Am Med Inform Assoc. 2007;14(6):700-705. PubMed
6. Shapiro JS, Kannry J, Lipton M, et al. Approaches to patient health information exchange and their impact on emergency medicine. Ann Emerg Med. 2006;48(4):426-432. PubMed
7. Sutcliffe KM, Lewton E, Rosenthal MM. Communication failures: an insidious contributor to medical mishaps. Acad Med.. 2004;79(2):186-194. PubMed
8. Kaelber DC, Bates DW. Health information exchange and patient safety. J Biomed Inform. 2007;40(suppl 6):S40-S45. PubMed
9. Smith PC, Araya-Guerra R, Bublitz C, et al. MIssing clinical information during primary care visits. JAMA. 2005;293(5):565-571. PubMed
10. Bell CM, Schnipper JL, Auerbach AD, et al. Association of communication between hospital-based physicians and primary care providers with patient outcomes. J Gen Intern Med. 2009;24(3):381-386. PubMed
11. van Walraven C, Taljaard M, Bell CM, et al. A prospective cohort study found that provider and information continuity was low after patient discharge from hospital. J Clin Epidemiol. 2010;63(9):1000-1010. PubMed
12. Walker J, Pan E, Johnston D, Adler-Milstein J, Bates DW, Middleton B. The value of health care information exchange and interoperability. Health Aff (Millwood). 2005:(suppl)W5-10-W5-18. PubMed
13. Shekelle PG, Morton SC, Keeler EB. Costs and benefits of health information technology. Evid Rep Technol Assess (Full Rep). 2006;132:1-71. PubMed
14. Blumenthal D. Launching HITECH. N Engl J Med. 2010;362(5):382-385. PubMed
15. Blumenthal D, Tavenner M. The “meaningful use” regulation for electronic health records. N Engl J Med. 2010;363(6):501-504. PubMed
16. Kuperman G, McGowan J. Potential unintended consequences of health information exchange. J Gen Intern Med. 2013;28(12):1663-1666. PubMed
17. Mathematica Policy Research and Harvard School of Public Health. DesRoches CM, Painter MW, Jha AK, eds. Health Information Technology in the United States, 2015: Transition to a Post-HITECH World (Executive Summary). September 18, 2015. Princeton, NJ: Robert Wood Johnson Foundation; 2015.
18. O’Malley AS, Anglin G, Bond AM, Cunningham PJ, Stark LB, Yee T. Greenville & Spartanburg: Surging Hospital Employment of Physicians Poses Opportunities and Challenges. Washington, DC: Center for Studying Health System Change (HSC); February 2011. 6.
19. Katz A, Bond AM, Carrier E, Docteur E, Quach CW, Yee T. Cleveland Hospital Systems Expand Despite Weak Economy. Washington, DC: Center for Studying Health System Change (HSC); September 2010. 2.
20. Grossman JM, Bodenheimer TS, McKenzie K. Hospital-physician portals: the role of competition in driving clinical data exchange. Health Aff (Millwood). 2006;25(6):1629-1636. PubMed
21. De Salvo KB, Galvez E. Connecting Health and Care for the Nation A Shared Nationwide Interoperability Roadmap - Version 1.0. In: Office of the National Coordinator for Health Information Technology. ed 2015. https://www.healthit.gov/buzz-blog/electronic-health-and-medical-records/interoperability-electronic-health-and-medical-records/connecting-health-care-nation-shared-nationwide-interoperability-roadmap-version-10/. Accessed September 3, 2016.
22. Adler-Milstein J, DesRoches C, Jha AK. Health information exchange among US hospitals. Am J Manag Care. 2011;17(11):761-768. PubMed
23. Vest JR. More than just a question of technology: factors related to hospitals’ adoption and implementation of health information exchange. Int J Med Inform. 2010;79(12):797-806. PubMed
24. Grossman JM, Kushner KL, November EA. Creating sustainable local health information exchanges: can barriers to stakeholder participation be overcome? Res Brief. 2008;2:1-12. PubMed
25. Grossman JM, Cohen G. Despite regulatory changes, hospitals cautious in helping physicians purchase electronic medical records. Issue Brief Cent Stud Health Syst Change 2008;123:1-4. PubMed
26. Kaelber DC, Waheed R, Einstadter D, Love TE, Cebul RD. Use and perceived value of health information exchange: one public healthcare system’s experience. Am J Manag Care. 2013;19(10 spec no):SP337-SP343. PubMed
27. Commonwell Health Alliance. http://www.commonwellalliance.org/, 2016. Accessed September 3, 2016.
28. Carequality. http://sequoiaproject.org/carequality/, 2016. Accessed September 3, 2016.
29. Adler-Milstein J, Lin SC, Jha AK. The number of health information exchange efforts is declining, leaving the viability of broad clinical data exchange uncertain. Health Aff (Millwood). 2016;35(7):1278-1285. PubMed
30. Adler-Milstein J, DesRoches CM, Kralovec P, et al. Electronic health record adoption in US hospitals: progress continues, but challenges persist. Health Aff (Millwood). 2015:34(12):2174-2180. PubMed
31. Health IT Policy Committee Report to Congress: Challenges and Barriers to Interoperability. 2015. https://www.healthit.gov/facas/health-it-policy-committee/health-it-policy-committee-recommendations-national-coordinator-health-it. Accessed September 3, 2016.
32. Everson J, Adler-Milstein J. Engagement in hospital health information exchange is associated with vendor marketplace dominance. Health Aff (MIllwood). 2016;35(7):1286-1293. PubMed
33. Downing K, Mason J. ONC targets information blocking. J AHIMA. 2015;86(7):36-38. PubMed
34. Cross DA, Lin SC, Adler-Milstein J. Assessing payer perspectives on health information exchange. J Am Med Inform Assoc. 2016;23(2):297-303. PubMed
35. Centers for Medicare & Medicaid Services. MACRA: MIPS and APMs. 2016; https://www.cms.gov/Medicare/Quality-Initiatives-Patient-Assessment-Instruments/Value-Based-Programs/MACRA-MIPS-and-APMs/MACRA-MIPS-and-APMs.html. Accessed September 3, 2016.
36. Raths D. Trend: standards development. Catching FHIR. A new HL7 draft standard may boost web services development in healthcare. Healthc Inform. 2014;31(2):13,16. PubMed
37. Alterovitz G, Warner J, Zhang P, et al. SMART on FHIR genomics: facilitating
The US healthcare system is highly fragmented, with patients typically receiving treatment from multiple providers during an episode of care and from many more providers over their lifetime.1,2 As patients move between care delivery settings, whether and how their information follows them is determined by a haphazard and error-prone patchwork of telephone, fax, and electronic communication channels.3 The existence of more robust electronic communication channels is often dictated by factors such as which providers share the same electronic health record (EHR) vendor rather than which providers share the highest volume of patients. As a result, providers often make clinical decisions with incomplete information, increasing the chances of misdiagnosis, unsafe or suboptimal treatment, and duplicative utilization.
Providers across the continuum of care encounter challenges to optimal clinical decision-making as a result of incomplete information. These are particularly problematic among clinicians in hospitals and emergency departments (EDs). Clinical decision-making in EDs often involves urgent and critical conditions in which decisions are made under pressure. Time constraints limit provider ability to find key clinical information to accurately diagnose and safely treat patients.4-6 Even for planned inpatient care, providers are often unfamiliar with patients, and they make safer decisions when they have full access to information from outside providers.7,8
Transitions of care between hospitals and primary care settings are also fraught with gaps in information sharing. Clinical decisions made in primary care can set patients on treatment trajectories that are greatly affected by the quality of information available to the care team at the time of initial diagnosis as well as in their subsequent treatment. Primary care physicians are not universally notified when their patients are hospitalized and may not have access to detailed information about the hospitalization, which can impair their ability to provide high quality care.9-11
Widespread and effective electronic health information exchange (HIE) holds the potential to address these challenges.3 With robust, interconnected electronic systems, key pieces of a patient’s health record can be electronically accessed and reconciled during planned and unplanned care transitions. The concept of HIE is simple—make all relevant patient data available to the clinical care team at the point of care, regardless of where that information was generated. The estimated value of nationwide interoperable EHR adoption suggests large savings from the more efficient, less duplicative, and higher quality care that likely results.12,13
There has been substantial funding and activity at federal, state, and local levels to promote the development of HIE in the US. The 2009 Health Information Technology for Economic and Clinical Health (HITECH) Act has the specific goal of accelerating adoption and use of certified EHR technology coupled with the ability to exchange clinical information to support patient care.14 The HITECH programs supported specific types of HIE that were believed to be particularly critical to improving patient care and included them in the federally-defined criteria for Meaningful Use (MU) of EHRs (ie, providers receive financial incentives for achieving specific objectives). The MU criteria evolve, moving from data capture in stage 1 to improved patient outcomes in stage 3.15 The HIE criteria focus on sending and receiving summary-of-care records during care transitions.
Despite the clear benefits of HIE and substantial support stated in policy initiatives, the spread of national HIE has been slow. Today, HIE in the US is highly heterogeneous: as a result of multiple federal-, state-, community-, enterprise- and EHR vendor-level efforts, only some provider organizations are able to engage in HIE with the other provider organizations with which they routinely share patients. In this review, we offer a framework and a corresponding set of definitions to understand the current state of HIE in the US. We describe key challenges to HIE progress and offer insights into the likely path to ensure that clinicians have routine, electronic access to patient information.
FOUR KEY DIMENSIONS OF HEALTH INFORMATION EXCHANGE
While the concept of HIE is simple—electronic access to clinical information across healthcare settings—the operationalization of HIE occurs in many different ways.16 While the terms “health information exchange” and “interoperability” are often used interchangeably, they can have different meanings. In this section, we describe 4 important dimensions that serve as a framework for understanding any given effort to enable HIE (Table).
(1) What Is Exchanged? Types of Information
The term “health information exchange” is ambiguous with respect to the type(s) of information that are accessible. Health information exchange may refer to the process of 2 providers electronically sharing a wide range of data, from a single type of information (eg, lab test results), summary of care records, to complete patient records.17 Part of this ambiguity may stem from uncertainty about the scope of information that should be shared, and how this varies based on the type of clinical encounter. For example, critical types of information in the ED setting may differ from those relevant to a primary care team after a referral. While the ability to access only particular types of information will not address all information gaps, providing access to complete patient records may result in information overload that inhibits the ability to find the subset of information relevant in a given clinical encounter.
(2) Who is Exchanging? Relationship Between Provider Organizations
The types of information accessed electronically are effectively agnostic to the relationship between the provider organizations that are sharing information. Traditionally, HIE has been considered as information that is electronically shared among 2 or more unaffiliated organizations. However, there is increasing recognition that some providers may not have electronic access to all information about their patients that exists within their organization, often after a merger or acquisition between 2 providers with different EHR systems.18,19 In these cases, a primary care team in a large integrated delivery system may have as many information gaps as a primary care team in a small, independent practice. Fulfilling clinical information needs may require both intra- and interorganizational HIE, which complicates the design of HIE processes and how the care team approaches incorporating information from both types of organizations into their decision-making. It is also important to recognize that some provider organizations, particularly small, rural practices, may not have the information technology and connectivity infrastructure required to engage in HIE.
(3) How Is Information Exchanged? Types of Electronic Access: Push vs Pull Exchange
To minimize information gaps, electronic access to information from external settings needs to offer both “push” and “pull” options. Push exchange, which can direct information electronically to a targeted recipient, works in scenarios in which there is a known information gap and known information source. The classic use for push exchange is care coordination, such as primary care physician-specialist referrals or hospital-primary care physician transitions postdischarge. Pull exchange accommodates scenarios in which there is a known information gap but the source(s) of information are unknown; it requires that clinical care teams search for and locate the clinical information that exists about the patient in external settings. Here, the classic use is emergency care in which the care team may encounter a new patient and want to retrieve records.
Widespread use of provider portals that offer view-only access into EHRs and other clinical data repositories maintained by external organizations complicate the picture. Portals are commonly used by hospitals to enable community providers to view information from a hospitalization.21 While this does not fall under the commonly held notion of HIE because no exchange occurs, portals support a pull approach to accessing information electronically among care settings that treat the same patients but use different EHRs.
Regardless of whether information is pushed or pulled, this may happen with varying degrees of human effort. This distinction gives rise to the difference between HIE and interoperability. Health information exchange reflects the ability of EHRs to exchange information, while interoperability additionally requires that EHRs be able to use exchanged information. From an operational perspective, the key distinction between HIE and interoperability is the extent of human involvement. Health information exchange requires that a human read and decide how to enter information from external settings (eg, a chart in PDF format sent between 2 EHRs), while interoperability enables the EHR that receives the information to understand the content and automatically triage or reconcile information, such as a medication list, without any human action.21 Health information exchange, therefore, relies on the diligence of the receiving clinician, while interoperability does not.
(4) What Governance Entity Defines the “Rules” of Exchange?
When more than 1 provider organization shares patient-identified data, a governance entity must specify the framework that governs the exchange. While the specifics of HIE governance vary, there are 3 predominant types of HIE networks, based on the type of organization that governs exchange: enterprise HIE networks, EHR vendor HIE networks or community HIE networks.
Enterprise HIE networks exist when 1 or more provider organizations electronically share clinical information to support patient care with some restriction, beyond geography, that dictates which organizations are involved. Typically, restrictions are driven by strategic, proprietary interests.22,23 Although broad-based information access across settings would be in the best interest of the patient, provider organizations are sensitive to the competitive implications of sharing data and may pursue such sharing in a strategic way.24 A common scenario is when hospitals choose to strategically affiliate with select ambulatory providers and exclusively exchange information with them. This should facilitate better care coordination for patients shared by the hospital and those providers but can also benefit the hospital by increasing the referrals from those providers. While there is little direct evidence quantifying the extent to which this type of strategic sharing takes place, there have been anecdotal reports as well as indirect findings that for-profit hospitals in competitive markets are less likely to share patient data.19,25
EHR vendor HIE networks exist when exchange occurs within a community of provider organizations that use an EHR from the same vendor. A subset of EHR vendors have made this capability available; EPIC’s CareEverywhere solution27 is the best-known example. Providers with an EPIC EHR are able to query for and retrieve summary of care records and other documents from any provider organization with EPIC that has activated this functionality. There are also multivendor efforts, such as CommonWell27 and the Sequoia Project’s Carequality collaborative,28 which are initiatives that seek to provide a common interoperability framework across a diverse set of stakeholders, including provider organizations with different EHR systems, in a similar fashion to HIE modules like CareEverywhere. To date, growth in these cross-vendor collaborations has been slow, and they have limited participation. While HIE networks that involve EHR vendors are likely to grow, it is difficult to predict how quickly because they are still in an early phase of development, and face nontechnical barriers such as patient consent policies that vary between providers and across states.
Community HIE networks—also referred to as health information organizations (HIOs) or regional health information organizations (RHIOs)—exist when provider organizations in a community, frequently state-level organizations that were funded through HITECH grants,14 set up the technical infrastructure and governance approach to engage in HIE to improve patient care. In contrast to enterprise or vendor HIE networks that have pursued HIE in ways that appear strategically beneficial, the only restriction on participation in community and state HIE networks is usually geography because they view information exchange as a public good. Seventyone percent of hospital service areas (HSAs) are covered by at least 1 of the 106 operational HIOs, with 309,793 clinicians (licensed prescribers) participating in those exchange networks. Even with early infusions of public and other grant-funding, community HIE networks have experienced significant challenges to sustained operation, and many have ceased operating.29
Thus, for any given provider organization, available HIE networks are primarily shaped by 3 factors:
1. Geographic location, which determines the available community and state HIE networks (as well as other basic information technology and connectivity infrastructure); providers located outside the service areas covered by an operational HIE have little incentive to participate because they do not connect them to providers with whom they share patients. Providers in rural areas may simply not have the needed infrastructure to pursue HIE.
2. Type of organization to which they belong, which determines the available enterprise HIE networks; providers who are not members of large health systems may be excluded from participation in these types of networks.
3. EHR vendor, which determines whether they have access to an EHR vendor HIE network.
ONGOING CHALLENGES
Despite agreement about the substantial potential of HIE to reduce costs and increase the quality of care delivered across a broad range of providers, HIE progress has been slow. While HITECH has successfully increased EHR adoption in hospitals and ambulatory practices,30 HIE has lagged. This is largely because many complex, intertwined barriers must be addressed for HIE to be widespread.
Lack of a Defined Goal
The cost and complexity associated with the exchange of a single type of data (eg, medications) is substantially less than the cost and complexity of sharing complete patient records. There has been little industry consensus on the target goal—do we need to enable sharing of complete patient records across all providers, or will summary of care records suffice? If the latter, as is the focus of the current MU criteria, what types of information should be included in a summary of care record, and should content and/or structure vary depending on the type of care transition? While the MU criteria require the exchange of a summary of care record with defined data fields, it remains unclear whether this is the end state or whether we should continue to push towards broad-based sharing of all patient data as structured elements. Without a clear picture of the ideal end state, there has been significant heterogeneity in the development of HIE capabilities across providers and vendors, and difficulty coordinating efforts to continue to advance towards a nationwide approach. Addressing this issue also requires progress to define HIE usability, that is, how information from external organizations should be presented and integrated into clinical workflow and clinical decisions. Currently, where HIE is occurring and clinicians are receiving summary of care records, they find them long, cluttered, and difficult to locate key information.
Numerous, Complex Barriers Spanning Multiple Stakeholders
In the context of any individual HIE effort, even after the goal is defined, there are a myriad of challenges. In a recent survey of HIO efforts, many identified the following barriers as substantially impeding their development: establishing a sustainable business model, lack of funding, integration of HIE into provider workflow, limitations of current data standards, and working with governmental policy and mandates.30 What is notable about this list is that the barriers span an array of areas, including financial incentives and identifying a sustainable business model, technical barriers such as working within the limitations of data standards, and regulatory issues such as state laws that govern the requirements for patient consent to exchange personal health information. Overcoming any of these issues is challenging, but trying to tackle all of them simultaneously clearly reveals why progress has been slow. Further, resolving many of the issues involve different groups of stakeholders. For example, implementing appropriate patient consent procedures can require engaging with and harmonizing the regulations of multiple states, as well as the Health Insurance Portability and Accountability Act (HIPAA) and regulations specific to substance abuse data.
Weak or Misaligned Incentives
Among the top barriers to HIE efforts are those related to funding and lack of a sustainable business model. This reflects the fact that economic incentives in the current market have not promoted provider engagement in HIE. Traditional fee-for-service payment structures do not reward providers for avoiding duplicative care.31 Further, hospitals perceive patient data as a “key strategic asset, tying physicians and patients to their organization,”24 and are reluctant to share data with competitors. Compounding the problem is that EHR vendors have a business interest in using HIE as a lever to increase revenue. In the short-term, they can charge high fees for interfaces and other HIE-related functionality. In the long-run, vendors may try to influence provider choice of system by making it difficult to engage in cross-vendor exchange.32 Information blocking—when providers or vendors knowingly interfere with HIE33—reflects not only weak incentives, but perverse incentives. While not all providers and vendors experience perverse incentives, the combination of weak and perverse incentives suggests the need to strengthen incentives, so that both types of stakeholders are motivated to tackle the barriers to HIE development. Key to strengthening incentives are payers, who are thought to be the largest beneficiaries of HIE. Payers have been reluctant to make significant investments in HIE without a more active voice in its implementation,34 but a shift to value-based payment may increase their engagement.
THE PATH FORWARD
Despite the continued challenges to nationwide HIE, several policy and technology developments show promise. Stage 3 meaningful use criteria continue to build on previous stages in increasing HIE requirements, raising the threshold for electronic exchange and EHR integration of summary of care documentation in patient transitions. The recently released Medicare Access and CHIP Reauthorization Act (MACRA) Merit-based Incentive Payment System (MIPS) proposed rule replaces stage 3 meaningful use for Medicare-eligible providers with advancing care information (ACI), which accounts for 25% of a provider’s overall incentive reimbursement and includes multiple HIE criteria for providers to report as part of the base and performance score, and follows a very similar framework to stage 3 MU with its criteria regarding HIE.35 While the Centers for Medicare and Medicaid Services (CMS) has not publicly declared that stage 3 MU will be replaced by ACI for hospitals and Medicaid providers, it is likely it will align those programs with the newly announced Medicare incentives.
MACRA also included changes to the Office of the National Coordinator (ONC) EHR certification program in an attempt to further encourage HIE. Vendors and providers must attest that they do not engage in information blocking and will cooperate with the Office’s surveillance programs to that effect. They also must attest that, to the greatest degree possible, their EHR systems allow for bi-directional interoperability with other providers, including those with different EHR vendors, and timely access for patients to view, download, and transmit their health data. In addition, there are emerging federal efforts to pursue a more standardized approach to patient matching and harmonize consent policies across states. These types of new policy initiatives indicate a continued interest in prioritizing HIE and interoperability.21
New technologies may also help spur HIE progress. The newest policy initiatives from CMS, including stage 3 MU and MACRA, have looked to incentivize the creation of application program interfaces (APIs), a set of publicly available tools from EHR vendors to allow developers to build applications that can directly interface with, and retrieve data from, their EHRs. While most patient access to electronic health data to date has been accomplished via patient portals, open APIs would enable developers to build an array of programs for consumers to view, download, and transmit their health data.
Even more promising is the development of the newest Health Level 7 data transmission standard, Fast Healthcare Interoperability Resources (FHIR), which promises to dramatically simplify the technical aspects of interoperability. FHIR utilizes a human-readable, easy to implement modular “resources” standard that may alleviate many technical challenges that come with implementation of an HIE system, enabling cheaper and simpler interoperability.36 A consortium of EHR vendors are working together to test these standards.28 The new FHIR standards also work in conjunction with APIs to allow easier development of consumer-facing applications37 that may empower patients to take ownership of their health data.
CONCLUSION
While HIE holds great promise to reduce the cost and improve the quality of care, progress towards a nationally interoperable health system has been slow. Simply defining HIE and what types of HIE are needed in different clinical scenarios has proven challenging. The additional challenges to implementing HIE in complex technology, legal/regulatory, governance, and incentive environment are not without solutions. Continued policy interventions, private sector collaborations, and new technologies may hold the keys to realizing the vast potential of electronic HIE.
Disclosure
Nothing to report.
1. Pham HH, Schrag D, O’Malley AS, Wu B, Bach PB. Care patterns in Medicare and their implications for pay for performance. N Engl J Med. 2007;356(11):1130-1139. PubMed
2. Finnell JT, Overhage JM, Dexter PR, Perkins SM, Lane KA, McDonald CJ. Community clinical data exchange for emergency medicine patients. Paper presented at: AMIA Annual Symposium Proceedings 2003. PubMed
3. Bodenheimer T. Coordinating care-a perilous journey through the health care system. N Engl J Med. 2008;358(10):1064-1071. PubMed
4. Franczak MJ, Klein M, Raslau F, Bergholte J, Mark LP, Ulmer JL. In emergency departments, radiologists’ access to EHRs may influence interpretations and medical management. Health Aff (Millwood). 2014;33(5):800-806. PubMed
5. Shapiro JS, Kannry J, Kushniruk AW, Kuperman G; New York Clinical Information Exchange (NYCLIX) Clinical Advisory Subcommittee. Emergency physicians’ perceptions of health information exchange. J Am Med Inform Assoc. 2007;14(6):700-705. PubMed
6. Shapiro JS, Kannry J, Lipton M, et al. Approaches to patient health information exchange and their impact on emergency medicine. Ann Emerg Med. 2006;48(4):426-432. PubMed
7. Sutcliffe KM, Lewton E, Rosenthal MM. Communication failures: an insidious contributor to medical mishaps. Acad Med.. 2004;79(2):186-194. PubMed
8. Kaelber DC, Bates DW. Health information exchange and patient safety. J Biomed Inform. 2007;40(suppl 6):S40-S45. PubMed
9. Smith PC, Araya-Guerra R, Bublitz C, et al. MIssing clinical information during primary care visits. JAMA. 2005;293(5):565-571. PubMed
10. Bell CM, Schnipper JL, Auerbach AD, et al. Association of communication between hospital-based physicians and primary care providers with patient outcomes. J Gen Intern Med. 2009;24(3):381-386. PubMed
11. van Walraven C, Taljaard M, Bell CM, et al. A prospective cohort study found that provider and information continuity was low after patient discharge from hospital. J Clin Epidemiol. 2010;63(9):1000-1010. PubMed
12. Walker J, Pan E, Johnston D, Adler-Milstein J, Bates DW, Middleton B. The value of health care information exchange and interoperability. Health Aff (Millwood). 2005:(suppl)W5-10-W5-18. PubMed
13. Shekelle PG, Morton SC, Keeler EB. Costs and benefits of health information technology. Evid Rep Technol Assess (Full Rep). 2006;132:1-71. PubMed
14. Blumenthal D. Launching HITECH. N Engl J Med. 2010;362(5):382-385. PubMed
15. Blumenthal D, Tavenner M. The “meaningful use” regulation for electronic health records. N Engl J Med. 2010;363(6):501-504. PubMed
16. Kuperman G, McGowan J. Potential unintended consequences of health information exchange. J Gen Intern Med. 2013;28(12):1663-1666. PubMed
17. Mathematica Policy Research and Harvard School of Public Health. DesRoches CM, Painter MW, Jha AK, eds. Health Information Technology in the United States, 2015: Transition to a Post-HITECH World (Executive Summary). September 18, 2015. Princeton, NJ: Robert Wood Johnson Foundation; 2015.
18. O’Malley AS, Anglin G, Bond AM, Cunningham PJ, Stark LB, Yee T. Greenville & Spartanburg: Surging Hospital Employment of Physicians Poses Opportunities and Challenges. Washington, DC: Center for Studying Health System Change (HSC); February 2011. 6.
19. Katz A, Bond AM, Carrier E, Docteur E, Quach CW, Yee T. Cleveland Hospital Systems Expand Despite Weak Economy. Washington, DC: Center for Studying Health System Change (HSC); September 2010. 2.
20. Grossman JM, Bodenheimer TS, McKenzie K. Hospital-physician portals: the role of competition in driving clinical data exchange. Health Aff (Millwood). 2006;25(6):1629-1636. PubMed
21. De Salvo KB, Galvez E. Connecting Health and Care for the Nation A Shared Nationwide Interoperability Roadmap - Version 1.0. In: Office of the National Coordinator for Health Information Technology. ed 2015. https://www.healthit.gov/buzz-blog/electronic-health-and-medical-records/interoperability-electronic-health-and-medical-records/connecting-health-care-nation-shared-nationwide-interoperability-roadmap-version-10/. Accessed September 3, 2016.
22. Adler-Milstein J, DesRoches C, Jha AK. Health information exchange among US hospitals. Am J Manag Care. 2011;17(11):761-768. PubMed
23. Vest JR. More than just a question of technology: factors related to hospitals’ adoption and implementation of health information exchange. Int J Med Inform. 2010;79(12):797-806. PubMed
24. Grossman JM, Kushner KL, November EA. Creating sustainable local health information exchanges: can barriers to stakeholder participation be overcome? Res Brief. 2008;2:1-12. PubMed
25. Grossman JM, Cohen G. Despite regulatory changes, hospitals cautious in helping physicians purchase electronic medical records. Issue Brief Cent Stud Health Syst Change 2008;123:1-4. PubMed
26. Kaelber DC, Waheed R, Einstadter D, Love TE, Cebul RD. Use and perceived value of health information exchange: one public healthcare system’s experience. Am J Manag Care. 2013;19(10 spec no):SP337-SP343. PubMed
27. Commonwell Health Alliance. http://www.commonwellalliance.org/, 2016. Accessed September 3, 2016.
28. Carequality. http://sequoiaproject.org/carequality/, 2016. Accessed September 3, 2016.
29. Adler-Milstein J, Lin SC, Jha AK. The number of health information exchange efforts is declining, leaving the viability of broad clinical data exchange uncertain. Health Aff (Millwood). 2016;35(7):1278-1285. PubMed
30. Adler-Milstein J, DesRoches CM, Kralovec P, et al. Electronic health record adoption in US hospitals: progress continues, but challenges persist. Health Aff (Millwood). 2015:34(12):2174-2180. PubMed
31. Health IT Policy Committee Report to Congress: Challenges and Barriers to Interoperability. 2015. https://www.healthit.gov/facas/health-it-policy-committee/health-it-policy-committee-recommendations-national-coordinator-health-it. Accessed September 3, 2016.
32. Everson J, Adler-Milstein J. Engagement in hospital health information exchange is associated with vendor marketplace dominance. Health Aff (MIllwood). 2016;35(7):1286-1293. PubMed
33. Downing K, Mason J. ONC targets information blocking. J AHIMA. 2015;86(7):36-38. PubMed
34. Cross DA, Lin SC, Adler-Milstein J. Assessing payer perspectives on health information exchange. J Am Med Inform Assoc. 2016;23(2):297-303. PubMed
35. Centers for Medicare & Medicaid Services. MACRA: MIPS and APMs. 2016; https://www.cms.gov/Medicare/Quality-Initiatives-Patient-Assessment-Instruments/Value-Based-Programs/MACRA-MIPS-and-APMs/MACRA-MIPS-and-APMs.html. Accessed September 3, 2016.
36. Raths D. Trend: standards development. Catching FHIR. A new HL7 draft standard may boost web services development in healthcare. Healthc Inform. 2014;31(2):13,16. PubMed
37. Alterovitz G, Warner J, Zhang P, et al. SMART on FHIR genomics: facilitating
© 2017 Society of Hospital Medicine
Impact of patient-centered discharge tools: A systematic review
Patient-centered care, defined by the Institute of Medicine as “health care that establishes a partnership among practitioners, patients, and their families to ensure that decisions respect patients’ wants, needs and preferences and that patients have the education and support they need to make decisions and participate in their own care,” has been recognized as an important factor in improving care transitions after discharge from the hospital.1 Previous efforts to improve the discharge process for hospitalized patients and reduce avoidable readmissions have focused on improving systems surrounding the patient, such as by increasing the availability of outpatient follow-up or standardizing communication between the inpatient and outpatient care teams.1,2 In fact, successful programs such as Project BOOST and the Care Transitions Interventions™ provide healthcare institutions with a “bundle” of evidence-based transitional care guidelines for discharge: they provide postdischarge transition coaches, assistance with medication self-management, timely follow-up tips, and improved patient records in order to improve postdischarge outcomes.3,4 Successful interventions, however, may not provide more services, but also engage the patient in their own care.5,6 The impact of engaging the patient in his or her own care by providing patient-friendly discharge instructions alone, however, is unknown.
A patient-centered discharge may use tools that were designed with patients, or may involve engaging patients in an interactive process of reviewing discharge instructions and empowering them to manage aspects of their own care after leaving the hospital. This endeavour may lead to more effective use of discharge instructions and reduce the need for additional or more intensive (and costly) interventions. For example, a patient-centered discharge tool could include an educational intervention that uses the “teach-back” method, in which patients are asked to restate in their own words what they thought they heard, or in which staff use additional media or a visual design tool meant to enhance comprehension of discharge instructions.6,7 Visual aids and the use of larger fonts are particularly useful design elements for improving comprehension among non-English speakers and patients with low health literacy, who tend to have poorer recall of instructions.8-10 What may constitute essential design elements to include in a discharge instruction tool, however, is not clear.
Moreover, whether the use of discharge tools with a specific focus on patient engagement may improve postdischarge outcomes is not known. Particularly, the ability of patient-centered discharge tools to improve outcomes beyond comprehension such as self-management, adherence to discharge instructions, a reduction in unplanned visits, and a reduction in mortality has not been studied systematically. The objective of this systematic review was to review the literature on discharge instruction tools with a focus on patient engagement and their impact among hospitalized patients.
METHODS
The Preferred Reporting Items for Systematic Reviews and Meta-analyses (PRISMA) Statement was followed as a guideline for reporting throughout this review.11
Data Sources
A literature search was undertaken using the following databases from January 1994 or their inception date to May 2014: Medline, Embase, SIGLE, HTA, Bioethics, ASSIA, Psych Lit, CINAHL, Cochrane Library, EconLit, ERIC, and BioMed Central. We also searched relevant design-focused journals such as Design Issues, Journal of Design Research, Information Design Journal, Innovation, Design Studies, and International Journal of Design, as well as reference lists from studies obtained by electronic searching. The following key words and combination of key words were used with the assistance of a medical librarian: patient discharge, patient-centered discharge, patient-centered design, design thinking, user based design, patient education, discharge summary, education. Additional search terms were added when identified from relevant articles (Appendix).
Inclusion Criteria
We included all English-language studies with patients admitted to the hospital irrespective of age, sex, or medical condition, which included a control group or time period and which measured patient outcomes within 3 months of discharge. The 3-month period after discharge is often cited as a time when outcomes could reasonably be associated with an intervention at discharge.2
Exclusion Criteria
Studies that did not have clear implementation of a patient-centered tool, a control group, or those whose tool was used in the emergency department or as an outpatient were excluded. Studies that included postdischarge tools such as home visits or telephone calls were excluded unless independent effects of the predischarge interventions were measured. Studies with outcomes reported after 3 months were excluded unless outcomes before 3 months were also clearly noted.
All searches were entered into Endnote and duplicates were removed. A 2-stage inclusion process was used. Titles and abstracts of articles were first screened for meeting inclusion and exclusion criteria by 1 reviewer. A second reviewer independently checked a 10% random sample of all the abstracts that met the initial screening criteria. If the agreement to exclude studies was less than 95%, criteria were reviewed before checking the rest of the 90% sample. In the second stage, 2 independent reviewers examined paper copies of the full articles selected in the first stage. Disagreement between reviewers was resolved by discussion or a third reviewer if no agreement could be reached.
Data Analysis and Synthesis
The following information was extracted from the full reference: type of study, population studied, control group or time period, tool used, and outcomes measured. Based on the National Health Care Quality report’s priorities and goals on patient and/or family engagement during transitions of care, educational tools were further described based on method of teaching, involvement of the care team, involvement of the patient in the design or delivery of the tool, and/or the use of visual aids.12 All primary outcomes were classified according to 3 categories: improved knowledge/comprehension, patient experience (patient satisfaction, self-management/efficacy such as functional status, both physical and mental), and health outcomes (unscheduled visits or readmissions, adherence with medications, diet, exercise, or follow-up, and mortality).
No quantitative pooling of results or meta-analysis was done given the variability and heterogeneity of studies reviewed. However, following guidelines for Effect Practice and Organisation of Care (EPOC) Risk of Bias criteria,13 studies that had a higher risk of bias such as uncontrolled before-after studies or studies with only 1 intervention or control site (historical controls, eg) were excluded from the final review because of the difficulties in attributing causation. Only primary outcomes were reported in order to minimize type II errors.
RESULTS
Our search revealed a total of 3699 studies after duplicates had been removed (Figure). A total of 714 references were included after initial review by title and abstract and 30 studies after full-text review. Agreement on a 10% random sample of all abstracts and full text was 79% (k=0.58) and 86% (k=0.72), respectively. Discussion was needed for fewer than 100 references, and agreement was subsequently reached for 100%.

There were 22 randomized controlled trials and 8 nonrandomized studies (5 nonrandomized controlled trials and 3 controlled before-after studies). Most of these studies were conducted in the United States (13/30 studies), followed by other European countries (5 studies), and the United Kingdom (4 studies). A large number of studies were conducted among patients with cardiovascular disease or risk factors (10 studies), followed by postsurgical patients such as coronary artery bypass graft surgery or orthopaedic surgery (5 studies). Five of 30 studies were conducted among individuals older than 65 years. Most studies excluded patients who did not speak English or the country’s official language; only 3 studies included patients with limited literacy, patients who spoke other languages, or caregivers if the patients could not communicate.
Most studies tested the impact of educational discharge interventions (28 of 30 studies) (Table 1). Quite often, it was a member of the research team who carried out the patient education. Only 3 studies involved multiple members of the care team in designing or reviewing the discharge tool with the patient. Almost half (12 studies) targeted multiple aspects of postdischarge care, including medications and side effects, signs and symptoms to consider, plans for follow-up, dietary restrictions, and/or exercise modifications. Many (19 studies) provided education using one-on-one teaching in association with a discharge tool, accompanied by a written handout (13 studies), audiotape (2 studies), or video (3 studies). While 13 studies had patients involved in creating what content was discussed and 14 studies had patients involved in the delivery of the tool, only 6 studies had patients involved in both design and delivery of the tool. Nine studies also used visual aids such as pictures, larger font, or use of a tool enhanced for patients with language barriers or limited health literacy.

Among all 30 studies included, 16 studies tested the impact of their tool on comprehension postdischarge, with 10 studies demonstrating an improvement among patients who had received the tool (Table 2). Five studies evaluated healthcare utilization outcomes such as readmission, length of stay, or physician visits after discharge and 2 studies found improvements. Twelve studies also studied the impact on adherence with medications, diet, exercise, or follow-up instructions postdischarge. However, only 4 of these 12 studies showed a positive impact. Only 2 studies tested the impact on a patient’s ability to self-manage once at home, and both studies reported positive statistical outcomes. Few studies measured patient experience (such as patient satisfaction or improvement in self-efficacy) or mortality postdischarge.

DISCUSSION/CONCLUSION
Our systematic review found 30 studies that engaged patients during the design or the delivery of a discharge instruction tool and that tested the effect of the tool on postdischarge outcomes.6-10,14–38 Our review suggests that there is sufficient evidence that patient-centered discharge tools improve comprehension. However, evidence is currently insufficient to determine if patient-centered tools improve adherence with discharge instructions. Moreover, though limited studies show promising results, more studies are needed to determine if patient engagement improves self-efficacy and healthcare utilization after discharge.
A major limitation of current studies is the variability in the level of patient engagement in tool design or delivery. Patients were involved in the design mostly through targeted development of a discharge management plan and the delivery by encouraging them to ask questions. Few studies involved patients in the design of the tool such that patients were responsible for coming up with content that was of interest to them. The few that did, often with the additional use of video media, demonstrated significant outcomes. Only a minority of studies used an interactive process to assess understanding such as “teach-back” or maximize patient comprehension such as visual aids. Even fewer studies engaged patients in both developing the discharge tool and providing discharge instructions.
Several previous studies have demonstrated that most complications after discharge are the result of ineffective communication, which can be exacerbated by lack of fluency in English or by limited health literacy.2,39-43 As a result, poor understanding of discharge instructions by patients and their caregivers can create an important care gap.44 Therefore, the use of patient-centered tools to engage patients at discharge in their own care is needed. How to engage patients consistently and effectively is perhaps less evident, as demonstrated in this review of the literature in which different levels of patient engagement were found. Many of the tools tested placed attention on patient education, sometimes in the context of bundled care along with home visits or follow-up, all of which can require extensive resources and time. Providing patients with information that the patients themselves state is of value may be the easiest refinement to a discharge educational tool, although this was surprisingly uncommon.6,9,10,17,23,33,37 Only 2 studies were found that engaged patients in the initial stage of design of the discharge tool, by incorporating information of interest to them.23,32 For example, a study testing the impact of a computer-generated written education package on poststroke outcomes designed the information by asking patients to identify which topics they would like to receive information about (along with the amount of information and font size).23 Secondly, although most of the discharge tools reviewed included the use of one-on-one teaching and the use of media such as patient handouts, these tools were often used in such a way that patients were passive recipients. In fact, studies that used additional video media that incorporated personalized content were the most likely to demonstrate positive outcomes.17,34 The next level of patient engagement may therefore be to involve the patient as an interactive partner when delivering the tool in order to empower patients to self-care. For example, 1 study designed a structured education program by first assessing lifestyle risk factors related to hypertension that were modifiable along with preconceived notions through open-ended questions during a one-on-one interview.37 Patients were subsequently educated on any knowledge deficits regarding the management of their lifestyle. Another level of patient engagement may be to use visual aids during discussions, as a well-known complement to verbal instructions.45,46 For example, in a controlled study that randomized a ward of elderly patients with 4 or more prescriptions to predischarge counseling, the counseling session aimed to review reasons for their prescriptions along with corresponding side effects, doses, and dosage times with the help of a medicine reminder card. Other uses of visual aid tools identified in our review included the use of pictograms or illustrations or, at minimum, attention to font size.7,8,16,29,33,35 In the absence of a visual aid, asking the patient to repeat or demonstrate what was just communicated can be used to assess the amount of information retained.18,33
An important result discovered in our review of the literature was also the lack of studies that tested the impact of discharge tools on usability of discharge information once at home. Conducting an evaluation of the benefits to patients after discharge can help objectify vague outcomes like health gains or qualify benefits in patient’s views. This might also explain why many studies with documented patient engagement at the time of discharge were able to demonstrate improvements in comprehension but not adherence to instructions. Although patients and caregivers may understand the information, this comprehension does not necessarily mean they will find the information useful or adhere to it once at home. For example, in 1 study, patients discharged with at least 1 medication were randomized to a structured discharge interview during which the treatment plan was reviewed verbally and questions clarified along with a visually enhanced treatment card.26 Although knowledge of medications increased, no effect was found on adherence at 1 week postdischarge. However, use of the treatment card at home was not assessed. Similarly, another study tested the effect of an individualized video of exercises and failed to find a difference in patient adherence at 4 weeks.28 The authors suggested that the lack of benefit may have been because patients were not using the video once at home. This is in contrast to 2 studies that involved patients in their own care by requiring them to request their medication as part of a self-medication tool predischarge.16,30 Patients were engaged in the process such that increasing independence was given to patients based on their demonstration of understanding and adherence to their treatment while still in the hospital, a learning tool that can be applied once at home. Feeling knowledgeable and involved, as others have suggested, may be the intermediary outcomes that led to improved adherence.47 It is also possible that adherence to discharge instructions may vary based on complexity of the information provided, such that instructions focusing solely on medication use may require less patient engagement than discharge instructions that include information on medications, diet, exercise modifications, and follow-up.48
Our review has a few limitations. Previous systematic reviews have demonstrated that bundled discharge interventions that include patient-centered education have a positive effect on outcomes postdischarge.2,5 However, we sought to describe and study the individual and distinct impact of patient engagement in the creation and delivery of discharge tools on outcomes postdischarge. We hoped that this may provide others with key information regarding elements of patient engagement that were particularly useful when designing a new discharge tool. The variability of the studies we identified, however, made it difficult to ascertain what level of patient engagement is required to observe improvements in health outcomes. It is also possible that a higher level of patient engagement may have been used but not described in the studies we reviewed. As only primary outcomes were included, we may have underestimated the effect of patient-centered discharge tools on outcomes that were reported as secondary outcomes. As we were interested in reviewing as many studies of patient-centered discharge tools as possible, we did not assess the quality of the studies and cannot comment on the role of bias in these studies. However, we excluded studies with study designs known to have the highest risk of bias. Lastly, we also cannot comment on whether patient-centered tools may have an effect on outcomes more than 3 months after a hospital discharge. However, several studies included in this review suggest a sustained effect beyond this time period.8,25,32,37
Patient-centered discharge tools in which patients were engaged in the design or the delivery were found to improve comprehension of but not adherence with discharge instructions. The perceived lack of improved adherence may be due to a lack of studies that measured the usefulness and utilization of information for patients once at home. There was also substantial variability in the extent of patient involvement in designing the style and content of information provided to patients at discharge, as well as the extent of patient engagement when receiving discharge instructions. Future studies would benefit from detailing the level of patient engagement needed in designing and delivery of discharge tools. This information may lead to the discovery of barriers and facilitators to utilization of discharge information once at home and lead to a better understanding of the patient’s journey from hospital to home and onwards.
C.M.B. and this work were funded by a CIHR Canadian Patient Safety Institute Chair in Patient Safety and Continuity of Care. Funding was provided to cover fees to obtain articles from the Donald J. Matthews Complex Care Fund of the University Health Network in Toronto, Canada. The Toronto Central Local Health Integration Network provided funding for the design and implementation of a patient-oriented discharge summary. None of the funding or supportive agencies were involved in the design or conduct of the present study, analysis, or interpretation of the data, or approval of the manuscript.
Disclosures
The authors report no conflicts of interest.
1. Hurtad
2. Mistiaen P, Francke AL, Poot E. Interventions aimed at reducing problems in adult patients discharged from hospital to home: a systematic meta-review. BMC Health Serv Res. 2007;7:47. PubMed
3. Coleman EA, Parry C, Chalmers S, Min SJ. The care transitions intervention: results of a randomized controlled trial. Arch Intern Med. 2006;166(17):1822-1828. PubMed
4. Hansen LO, Greenwald JL, Budnitz T, et al. Project BOOST: effectiveness of a multihospital effort to reduce rehospitalization. J Hosp Med. 2013;8(8):421-427. PubMed
5. Hansen LO, Young RS, Hinami K, et al. Interventions to reduce 30-day rehospitalization: a systematic review. Ann Intern Med. 2011;155(8):520-528. PubMed
6. Osman LM, Calder C, Godden DJ, et al. A randomised trial of self-management planning for adult patients admitted to hospital with acute asthma. Thorax. 2002;57(10):869-874. PubMed
7. Cordasco KM, Asch SM, Bell DS, et al. A low-literacy medication education tool for safety-net hospital patients. Am J Prev Med. 2009;37(6 suppl 1):S209-S216. PubMed
8. Morice AH, Wrench C. The role of the asthma nurse in treatment compliance and self-management following hospital admission. Resp Med. 2001;95(11):851-856. PubMed
9. Haerem JW, Ronning EJ, Leidal R. Home access to hospital discharge information on audiotape reduces sick leave and readmissions in patients with first-time myocardial infarction. Scand Cardiovasc J. 2000;34(2):219-222. PubMed
10. Legrain S, Tubach F, Bonnet-Zamponi D, et al. A new multimodal geriatric discharge-planning intervention to prevent emergency visits and rehospitalizations of older adults: the optimization of medication in AGEd multicenter randomized controlled trial. J Am Geriatr Soc. 2011;59(11):2017-2028. PubMed
11. Moher D, Liberati A, Tetzlaff J, et al. Preferred reporting items for systematic reviews and meta-analyses: the PRISMA statement. Ann Intern Med. 2009;151(4):264-269. PubMed
12. Partnership NP. National Priorities and Goals: Aligning Our Efforts to Transform America’s Healthcare. Washington, DC: National Quality Forum; 2008.
13. Effective Practice and Organisation of Care (EPOC). EPOC-specific resources for review authors. Oslo, Norway: Norwegian Knowledge Centre for the Health Services; 2013. http://epoc.cochrane.org/epoc-specific-resources-review-authors. Accessed December 21, 2016.
14. Manning DM, O’Meara JG, Williams AR, et al. 3D: a tool for medication discharge education. Qual Saf Health Care. 2007;16(1):71-76. PubMed
15. Perera KY, Ranasinghe P, Adikari AM, et al. Medium of language in discharge summaries: would the use of native language improve patients’ knowledge of their illness and medications? J Health Commun. 2012;17(2):141-148. PubMed
16. Lowe CJ, Raynor DK, Courtney EA, et al. Effects of self medication programme on knowledge of drugs and compliance with treatment in elderly patients. BMJ. 1995;310(6989):1229-1231. PubMed
17. Mahler HI, Kulik JA, Tarazi RY. Effects of a videotape information intervention at discharge on diet and exercise compliance after coronary bypass surgery. J Cardiopulm Rehabil. 1999;19(3):170-177. PubMed
18. Al-Rashed SA, Wright DJ, Roebuck N, et al. The value of inpatient pharmaceutical counseling to elderly patients prior to discharge. Br J Clin Pharmacol. 2002;54(6):657-664. PubMed
19. Drenth-van Maanen AC, Wilting I, Jansen PA, et al. Effect of a discharge medication intervention on the incidence and nature of medication discrepancies in older adults. J Am Geriatr Soc. 2013;61(3):456-458. PubMed
20. Eshah NF. Predischarge education improves adherence to a healthy lifestyle among Jordanian patients with acute coronary syndrome. Nurs Health Sci. 2013;15(3):273-279. PubMed
21. Gwadry-Sridhar FH, Arnold JM, Zhang Y,et al. Pilot study to determine the impact of a multidisciplinary educational intervention in patients hospitalized with heart failure. Am Heart J. 2005;150(5):982. PubMed
22. Ho SM, Heh SS, Jevitt CM, et al. Effectiveness of a discharge education program in reducing the severity of postpartum depression: a randomized controlled evaluation study. Patient Educ Couns. 2009;77(1):68-71. PubMed
23. Hoffmann T, McKenna K, Worrall L, et al. Randomised trial of a computer-generated tailored written education package for patients following stroke. Age Ageing. 2007;36(3):280-286. PubMed
24. Jenkins HM, Blank V, Miller K, et al. A randomized single-blind evaluation of a discharge teaching book for pediatric patients with burns. J Burn Care Rehabil. 1996;17(1):49-61. PubMed
25. Kommuri NV, Johnson ML, Koelling TM. Relationship between improvements in heart failure patient disease specific knowledge and clinical events as part of a randomized controlled trial. Patient Educ Couns. 2012;86(2):233-238. PubMed
26. Louis-Simonet M, Kossovsky MP, Sarasin FP, et al. Effects of a structured patient-centered discharge interview on patients’ knowledge about their medications. Am J Med. 2004;117(8):563-568. PubMed
27. Lucas KS. Outcomes evaluation of a pharmacist discharge medication teaching service. Am J Health Syst Pharm. 1998;55(24 suppl 4):S32-S35. PubMed
28. Lysack C, Dama M, Neufeld S, et al. A compliance and satisfaction with home exercise: a comparison of computer-assisted video instruction and routine rehabilitation practice. J Allied Health. 2005;34(2):76-82. PubMed
29. Moore SM. The effects of a discharge information intervention on recovery outcomes following coronary artery bypass surgery. Int J Nurs Stud. 1996;33(2):181-189. PubMed
30. Pereles L, Romonko L, Murzyn T, et al. Evaluation of a self-medication program. J Am Geriatr Soc. 1996;44(2):161-165. PubMed
31. Reynolds MA. Postoperative pain management discharge teaching in a rural population. Pain Manag Nurs. 2009;10(2):76-84. PubMed
32. Sabariego C, Barrera AE, Neubert S, et al. Evaluation of an ICF-based patient education programme for stroke patients: a randomized, single-blinded, controlled, multicentre trial of the effects on self-efficacy, life satisfaction and functioning. Br J Health Psychol. 2013;18(4):707-728. PubMed
33. Shieh SJ, Chen HL, Liu FC, et al. The effectiveness of structured discharge education on maternal confidence, caring knowledge and growth of premature newborns. J Clin Nurs. 2010;19(23-24):3307-3313. PubMed
34. Steinberg TG, Diercks MJ, Millspaugh J. An evaluation of the effectiveness of a videotape for discharge teaching of organ transplant recipients. J Transpl Coord. 1996;6(2):59-63. PubMed
35. Whitby M, McLaws ML, Doidge S, et al. Post-discharge surgical site surveillance: does patient education improve reliability of diagnosis? J Hosp Infect. 2007;66(3):237-242. PubMed
36. Williford SL, Johnson DF. Impact of pharmacist counseling on medication knowledge and compliance. Mil Med. 1995;160(11):561–564. PubMed
37. Zernike W, Henderson A. Evaluating the effectiveness of two teaching strategies for patients diagnosed with hypertension. J Clin Nurs. 1998;7(1):37–44. PubMed
38. Press VG, Arora V, Constantine KL, et al. Forget me not: a randomized trial of the durability of hospital-based education on inhalers for patients with COPD or asthma [abstract]. J Gen Intern Med. 2014;29(1 suppl):S102.
39. Davis TC, Wolf MS, Bass PF, et al. Literacy and misunderstanding prescription drug labels. Ann Intern Med. 2006;145(12):887–894. PubMed
40. McCarthy DM, Waite KR, Curtis LM, et al. What did the doctor say? Health literacy and recall of medical instructions. Med Care. 2012;50(4):277–282. PubMed
41. Tarn DM, Heritage J, Paterniti DA, et al. Physician communication when prescribing new medications. Arch Intern Med. 2006;166(17):1855–1862. PubMed
42. Cawthon C, Walia S, Osborn CY, et al. Improving care transitions: the patient perspective. J Health Commun. 2012;17(suppl 3):312–324. PubMed
43. Karliner LS, Auerbach A, Nápoles A, et al. Language barriers and understanding of hospital discharge instructions. Med Care. 2012;50(4):283–289. PubMed
44. Enhancing the Continuum of Care. Report of the Avoidable Hospitalization Advisory Panel. http://www.health.gov.on.ca/en/common/ministry/publications/reports/baker_2011/baker_2011.pdf. Published November 2011. Accessed December 22, 2016.
45. Chugh A, Williams MV, Grigsby J, et al. Better transitions: improving comprehension of discharge instructions. Front Health Serv Manage. 2009;25(3):11–32. PubMed
46. Schillinger D, Machtinger EL, Wang F, et al. Language, literacy, and communication regarding medication in an anticoagulation clinic: a comparison of verbal vs. visual assessment. J Health Commun. 2006;11(7):651–664. PubMed
47. Epstein RM, Street RL, Jr. The values and value of patient-centered care. Ann Fam Med. 2011;9(2):100–103. PubMed
48. Albrecht JS, Gruber-Baldini AL, Hirshon JM, et al. Hospital discharge instructions: comprehension and compliance among older adults. J Gen Intern Med. 2014;29(11):1491–1498. PubMed
Patient-centered care, defined by the Institute of Medicine as “health care that establishes a partnership among practitioners, patients, and their families to ensure that decisions respect patients’ wants, needs and preferences and that patients have the education and support they need to make decisions and participate in their own care,” has been recognized as an important factor in improving care transitions after discharge from the hospital.1 Previous efforts to improve the discharge process for hospitalized patients and reduce avoidable readmissions have focused on improving systems surrounding the patient, such as by increasing the availability of outpatient follow-up or standardizing communication between the inpatient and outpatient care teams.1,2 In fact, successful programs such as Project BOOST and the Care Transitions Interventions™ provide healthcare institutions with a “bundle” of evidence-based transitional care guidelines for discharge: they provide postdischarge transition coaches, assistance with medication self-management, timely follow-up tips, and improved patient records in order to improve postdischarge outcomes.3,4 Successful interventions, however, may not provide more services, but also engage the patient in their own care.5,6 The impact of engaging the patient in his or her own care by providing patient-friendly discharge instructions alone, however, is unknown.
A patient-centered discharge may use tools that were designed with patients, or may involve engaging patients in an interactive process of reviewing discharge instructions and empowering them to manage aspects of their own care after leaving the hospital. This endeavour may lead to more effective use of discharge instructions and reduce the need for additional or more intensive (and costly) interventions. For example, a patient-centered discharge tool could include an educational intervention that uses the “teach-back” method, in which patients are asked to restate in their own words what they thought they heard, or in which staff use additional media or a visual design tool meant to enhance comprehension of discharge instructions.6,7 Visual aids and the use of larger fonts are particularly useful design elements for improving comprehension among non-English speakers and patients with low health literacy, who tend to have poorer recall of instructions.8-10 What may constitute essential design elements to include in a discharge instruction tool, however, is not clear.
Moreover, whether the use of discharge tools with a specific focus on patient engagement may improve postdischarge outcomes is not known. Particularly, the ability of patient-centered discharge tools to improve outcomes beyond comprehension such as self-management, adherence to discharge instructions, a reduction in unplanned visits, and a reduction in mortality has not been studied systematically. The objective of this systematic review was to review the literature on discharge instruction tools with a focus on patient engagement and their impact among hospitalized patients.
METHODS
The Preferred Reporting Items for Systematic Reviews and Meta-analyses (PRISMA) Statement was followed as a guideline for reporting throughout this review.11
Data Sources
A literature search was undertaken using the following databases from January 1994 or their inception date to May 2014: Medline, Embase, SIGLE, HTA, Bioethics, ASSIA, Psych Lit, CINAHL, Cochrane Library, EconLit, ERIC, and BioMed Central. We also searched relevant design-focused journals such as Design Issues, Journal of Design Research, Information Design Journal, Innovation, Design Studies, and International Journal of Design, as well as reference lists from studies obtained by electronic searching. The following key words and combination of key words were used with the assistance of a medical librarian: patient discharge, patient-centered discharge, patient-centered design, design thinking, user based design, patient education, discharge summary, education. Additional search terms were added when identified from relevant articles (Appendix).
Inclusion Criteria
We included all English-language studies with patients admitted to the hospital irrespective of age, sex, or medical condition, which included a control group or time period and which measured patient outcomes within 3 months of discharge. The 3-month period after discharge is often cited as a time when outcomes could reasonably be associated with an intervention at discharge.2
Exclusion Criteria
Studies that did not have clear implementation of a patient-centered tool, a control group, or those whose tool was used in the emergency department or as an outpatient were excluded. Studies that included postdischarge tools such as home visits or telephone calls were excluded unless independent effects of the predischarge interventions were measured. Studies with outcomes reported after 3 months were excluded unless outcomes before 3 months were also clearly noted.
All searches were entered into Endnote and duplicates were removed. A 2-stage inclusion process was used. Titles and abstracts of articles were first screened for meeting inclusion and exclusion criteria by 1 reviewer. A second reviewer independently checked a 10% random sample of all the abstracts that met the initial screening criteria. If the agreement to exclude studies was less than 95%, criteria were reviewed before checking the rest of the 90% sample. In the second stage, 2 independent reviewers examined paper copies of the full articles selected in the first stage. Disagreement between reviewers was resolved by discussion or a third reviewer if no agreement could be reached.
Data Analysis and Synthesis
The following information was extracted from the full reference: type of study, population studied, control group or time period, tool used, and outcomes measured. Based on the National Health Care Quality report’s priorities and goals on patient and/or family engagement during transitions of care, educational tools were further described based on method of teaching, involvement of the care team, involvement of the patient in the design or delivery of the tool, and/or the use of visual aids.12 All primary outcomes were classified according to 3 categories: improved knowledge/comprehension, patient experience (patient satisfaction, self-management/efficacy such as functional status, both physical and mental), and health outcomes (unscheduled visits or readmissions, adherence with medications, diet, exercise, or follow-up, and mortality).
No quantitative pooling of results or meta-analysis was done given the variability and heterogeneity of studies reviewed. However, following guidelines for Effect Practice and Organisation of Care (EPOC) Risk of Bias criteria,13 studies that had a higher risk of bias such as uncontrolled before-after studies or studies with only 1 intervention or control site (historical controls, eg) were excluded from the final review because of the difficulties in attributing causation. Only primary outcomes were reported in order to minimize type II errors.
RESULTS
Our search revealed a total of 3699 studies after duplicates had been removed (Figure). A total of 714 references were included after initial review by title and abstract and 30 studies after full-text review. Agreement on a 10% random sample of all abstracts and full text was 79% (k=0.58) and 86% (k=0.72), respectively. Discussion was needed for fewer than 100 references, and agreement was subsequently reached for 100%.
There were 22 randomized controlled trials and 8 nonrandomized studies (5 nonrandomized controlled trials and 3 controlled before-after studies). Most of these studies were conducted in the United States (13/30 studies), followed by other European countries (5 studies), and the United Kingdom (4 studies). A large number of studies were conducted among patients with cardiovascular disease or risk factors (10 studies), followed by postsurgical patients such as coronary artery bypass graft surgery or orthopaedic surgery (5 studies). Five of 30 studies were conducted among individuals older than 65 years. Most studies excluded patients who did not speak English or the country’s official language; only 3 studies included patients with limited literacy, patients who spoke other languages, or caregivers if the patients could not communicate.
Most studies tested the impact of educational discharge interventions (28 of 30 studies) (Table 1). Quite often, it was a member of the research team who carried out the patient education. Only 3 studies involved multiple members of the care team in designing or reviewing the discharge tool with the patient. Almost half (12 studies) targeted multiple aspects of postdischarge care, including medications and side effects, signs and symptoms to consider, plans for follow-up, dietary restrictions, and/or exercise modifications. Many (19 studies) provided education using one-on-one teaching in association with a discharge tool, accompanied by a written handout (13 studies), audiotape (2 studies), or video (3 studies). While 13 studies had patients involved in creating what content was discussed and 14 studies had patients involved in the delivery of the tool, only 6 studies had patients involved in both design and delivery of the tool. Nine studies also used visual aids such as pictures, larger font, or use of a tool enhanced for patients with language barriers or limited health literacy.
Among all 30 studies included, 16 studies tested the impact of their tool on comprehension postdischarge, with 10 studies demonstrating an improvement among patients who had received the tool (Table 2). Five studies evaluated healthcare utilization outcomes such as readmission, length of stay, or physician visits after discharge and 2 studies found improvements. Twelve studies also studied the impact on adherence with medications, diet, exercise, or follow-up instructions postdischarge. However, only 4 of these 12 studies showed a positive impact. Only 2 studies tested the impact on a patient’s ability to self-manage once at home, and both studies reported positive statistical outcomes. Few studies measured patient experience (such as patient satisfaction or improvement in self-efficacy) or mortality postdischarge.
DISCUSSION/CONCLUSION
Our systematic review found 30 studies that engaged patients during the design or the delivery of a discharge instruction tool and that tested the effect of the tool on postdischarge outcomes.6-10,14–38 Our review suggests that there is sufficient evidence that patient-centered discharge tools improve comprehension. However, evidence is currently insufficient to determine if patient-centered tools improve adherence with discharge instructions. Moreover, though limited studies show promising results, more studies are needed to determine if patient engagement improves self-efficacy and healthcare utilization after discharge.
A major limitation of current studies is the variability in the level of patient engagement in tool design or delivery. Patients were involved in the design mostly through targeted development of a discharge management plan and the delivery by encouraging them to ask questions. Few studies involved patients in the design of the tool such that patients were responsible for coming up with content that was of interest to them. The few that did, often with the additional use of video media, demonstrated significant outcomes. Only a minority of studies used an interactive process to assess understanding such as “teach-back” or maximize patient comprehension such as visual aids. Even fewer studies engaged patients in both developing the discharge tool and providing discharge instructions.
Several previous studies have demonstrated that most complications after discharge are the result of ineffective communication, which can be exacerbated by lack of fluency in English or by limited health literacy.2,39-43 As a result, poor understanding of discharge instructions by patients and their caregivers can create an important care gap.44 Therefore, the use of patient-centered tools to engage patients at discharge in their own care is needed. How to engage patients consistently and effectively is perhaps less evident, as demonstrated in this review of the literature in which different levels of patient engagement were found. Many of the tools tested placed attention on patient education, sometimes in the context of bundled care along with home visits or follow-up, all of which can require extensive resources and time. Providing patients with information that the patients themselves state is of value may be the easiest refinement to a discharge educational tool, although this was surprisingly uncommon.6,9,10,17,23,33,37 Only 2 studies were found that engaged patients in the initial stage of design of the discharge tool, by incorporating information of interest to them.23,32 For example, a study testing the impact of a computer-generated written education package on poststroke outcomes designed the information by asking patients to identify which topics they would like to receive information about (along with the amount of information and font size).23 Secondly, although most of the discharge tools reviewed included the use of one-on-one teaching and the use of media such as patient handouts, these tools were often used in such a way that patients were passive recipients. In fact, studies that used additional video media that incorporated personalized content were the most likely to demonstrate positive outcomes.17,34 The next level of patient engagement may therefore be to involve the patient as an interactive partner when delivering the tool in order to empower patients to self-care. For example, 1 study designed a structured education program by first assessing lifestyle risk factors related to hypertension that were modifiable along with preconceived notions through open-ended questions during a one-on-one interview.37 Patients were subsequently educated on any knowledge deficits regarding the management of their lifestyle. Another level of patient engagement may be to use visual aids during discussions, as a well-known complement to verbal instructions.45,46 For example, in a controlled study that randomized a ward of elderly patients with 4 or more prescriptions to predischarge counseling, the counseling session aimed to review reasons for their prescriptions along with corresponding side effects, doses, and dosage times with the help of a medicine reminder card. Other uses of visual aid tools identified in our review included the use of pictograms or illustrations or, at minimum, attention to font size.7,8,16,29,33,35 In the absence of a visual aid, asking the patient to repeat or demonstrate what was just communicated can be used to assess the amount of information retained.18,33
An important result discovered in our review of the literature was also the lack of studies that tested the impact of discharge tools on usability of discharge information once at home. Conducting an evaluation of the benefits to patients after discharge can help objectify vague outcomes like health gains or qualify benefits in patient’s views. This might also explain why many studies with documented patient engagement at the time of discharge were able to demonstrate improvements in comprehension but not adherence to instructions. Although patients and caregivers may understand the information, this comprehension does not necessarily mean they will find the information useful or adhere to it once at home. For example, in 1 study, patients discharged with at least 1 medication were randomized to a structured discharge interview during which the treatment plan was reviewed verbally and questions clarified along with a visually enhanced treatment card.26 Although knowledge of medications increased, no effect was found on adherence at 1 week postdischarge. However, use of the treatment card at home was not assessed. Similarly, another study tested the effect of an individualized video of exercises and failed to find a difference in patient adherence at 4 weeks.28 The authors suggested that the lack of benefit may have been because patients were not using the video once at home. This is in contrast to 2 studies that involved patients in their own care by requiring them to request their medication as part of a self-medication tool predischarge.16,30 Patients were engaged in the process such that increasing independence was given to patients based on their demonstration of understanding and adherence to their treatment while still in the hospital, a learning tool that can be applied once at home. Feeling knowledgeable and involved, as others have suggested, may be the intermediary outcomes that led to improved adherence.47 It is also possible that adherence to discharge instructions may vary based on complexity of the information provided, such that instructions focusing solely on medication use may require less patient engagement than discharge instructions that include information on medications, diet, exercise modifications, and follow-up.48
Our review has a few limitations. Previous systematic reviews have demonstrated that bundled discharge interventions that include patient-centered education have a positive effect on outcomes postdischarge.2,5 However, we sought to describe and study the individual and distinct impact of patient engagement in the creation and delivery of discharge tools on outcomes postdischarge. We hoped that this may provide others with key information regarding elements of patient engagement that were particularly useful when designing a new discharge tool. The variability of the studies we identified, however, made it difficult to ascertain what level of patient engagement is required to observe improvements in health outcomes. It is also possible that a higher level of patient engagement may have been used but not described in the studies we reviewed. As only primary outcomes were included, we may have underestimated the effect of patient-centered discharge tools on outcomes that were reported as secondary outcomes. As we were interested in reviewing as many studies of patient-centered discharge tools as possible, we did not assess the quality of the studies and cannot comment on the role of bias in these studies. However, we excluded studies with study designs known to have the highest risk of bias. Lastly, we also cannot comment on whether patient-centered tools may have an effect on outcomes more than 3 months after a hospital discharge. However, several studies included in this review suggest a sustained effect beyond this time period.8,25,32,37
Patient-centered discharge tools in which patients were engaged in the design or the delivery were found to improve comprehension of but not adherence with discharge instructions. The perceived lack of improved adherence may be due to a lack of studies that measured the usefulness and utilization of information for patients once at home. There was also substantial variability in the extent of patient involvement in designing the style and content of information provided to patients at discharge, as well as the extent of patient engagement when receiving discharge instructions. Future studies would benefit from detailing the level of patient engagement needed in designing and delivery of discharge tools. This information may lead to the discovery of barriers and facilitators to utilization of discharge information once at home and lead to a better understanding of the patient’s journey from hospital to home and onwards.
C.M.B. and this work were funded by a CIHR Canadian Patient Safety Institute Chair in Patient Safety and Continuity of Care. Funding was provided to cover fees to obtain articles from the Donald J. Matthews Complex Care Fund of the University Health Network in Toronto, Canada. The Toronto Central Local Health Integration Network provided funding for the design and implementation of a patient-oriented discharge summary. None of the funding or supportive agencies were involved in the design or conduct of the present study, analysis, or interpretation of the data, or approval of the manuscript.
Disclosures
The authors report no conflicts of interest.
1. Hurtad
2. Mistiaen P, Francke AL, Poot E. Interventions aimed at reducing problems in adult patients discharged from hospital to home: a systematic meta-review. BMC Health Serv Res. 2007;7:47. PubMed
3. Coleman EA, Parry C, Chalmers S, Min SJ. The care transitions intervention: results of a randomized controlled trial. Arch Intern Med. 2006;166(17):1822-1828. PubMed
4. Hansen LO, Greenwald JL, Budnitz T, et al. Project BOOST: effectiveness of a multihospital effort to reduce rehospitalization. J Hosp Med. 2013;8(8):421-427. PubMed
5. Hansen LO, Young RS, Hinami K, et al. Interventions to reduce 30-day rehospitalization: a systematic review. Ann Intern Med. 2011;155(8):520-528. PubMed
6. Osman LM, Calder C, Godden DJ, et al. A randomised trial of self-management planning for adult patients admitted to hospital with acute asthma. Thorax. 2002;57(10):869-874. PubMed
7. Cordasco KM, Asch SM, Bell DS, et al. A low-literacy medication education tool for safety-net hospital patients. Am J Prev Med. 2009;37(6 suppl 1):S209-S216. PubMed
8. Morice AH, Wrench C. The role of the asthma nurse in treatment compliance and self-management following hospital admission. Resp Med. 2001;95(11):851-856. PubMed
9. Haerem JW, Ronning EJ, Leidal R. Home access to hospital discharge information on audiotape reduces sick leave and readmissions in patients with first-time myocardial infarction. Scand Cardiovasc J. 2000;34(2):219-222. PubMed
10. Legrain S, Tubach F, Bonnet-Zamponi D, et al. A new multimodal geriatric discharge-planning intervention to prevent emergency visits and rehospitalizations of older adults: the optimization of medication in AGEd multicenter randomized controlled trial. J Am Geriatr Soc. 2011;59(11):2017-2028. PubMed
11. Moher D, Liberati A, Tetzlaff J, et al. Preferred reporting items for systematic reviews and meta-analyses: the PRISMA statement. Ann Intern Med. 2009;151(4):264-269. PubMed
12. Partnership NP. National Priorities and Goals: Aligning Our Efforts to Transform America’s Healthcare. Washington, DC: National Quality Forum; 2008.
13. Effective Practice and Organisation of Care (EPOC). EPOC-specific resources for review authors. Oslo, Norway: Norwegian Knowledge Centre for the Health Services; 2013. http://epoc.cochrane.org/epoc-specific-resources-review-authors. Accessed December 21, 2016.
14. Manning DM, O’Meara JG, Williams AR, et al. 3D: a tool for medication discharge education. Qual Saf Health Care. 2007;16(1):71-76. PubMed
15. Perera KY, Ranasinghe P, Adikari AM, et al. Medium of language in discharge summaries: would the use of native language improve patients’ knowledge of their illness and medications? J Health Commun. 2012;17(2):141-148. PubMed
16. Lowe CJ, Raynor DK, Courtney EA, et al. Effects of self medication programme on knowledge of drugs and compliance with treatment in elderly patients. BMJ. 1995;310(6989):1229-1231. PubMed
17. Mahler HI, Kulik JA, Tarazi RY. Effects of a videotape information intervention at discharge on diet and exercise compliance after coronary bypass surgery. J Cardiopulm Rehabil. 1999;19(3):170-177. PubMed
18. Al-Rashed SA, Wright DJ, Roebuck N, et al. The value of inpatient pharmaceutical counseling to elderly patients prior to discharge. Br J Clin Pharmacol. 2002;54(6):657-664. PubMed
19. Drenth-van Maanen AC, Wilting I, Jansen PA, et al. Effect of a discharge medication intervention on the incidence and nature of medication discrepancies in older adults. J Am Geriatr Soc. 2013;61(3):456-458. PubMed
20. Eshah NF. Predischarge education improves adherence to a healthy lifestyle among Jordanian patients with acute coronary syndrome. Nurs Health Sci. 2013;15(3):273-279. PubMed
21. Gwadry-Sridhar FH, Arnold JM, Zhang Y,et al. Pilot study to determine the impact of a multidisciplinary educational intervention in patients hospitalized with heart failure. Am Heart J. 2005;150(5):982. PubMed
22. Ho SM, Heh SS, Jevitt CM, et al. Effectiveness of a discharge education program in reducing the severity of postpartum depression: a randomized controlled evaluation study. Patient Educ Couns. 2009;77(1):68-71. PubMed
23. Hoffmann T, McKenna K, Worrall L, et al. Randomised trial of a computer-generated tailored written education package for patients following stroke. Age Ageing. 2007;36(3):280-286. PubMed
24. Jenkins HM, Blank V, Miller K, et al. A randomized single-blind evaluation of a discharge teaching book for pediatric patients with burns. J Burn Care Rehabil. 1996;17(1):49-61. PubMed
25. Kommuri NV, Johnson ML, Koelling TM. Relationship between improvements in heart failure patient disease specific knowledge and clinical events as part of a randomized controlled trial. Patient Educ Couns. 2012;86(2):233-238. PubMed
26. Louis-Simonet M, Kossovsky MP, Sarasin FP, et al. Effects of a structured patient-centered discharge interview on patients’ knowledge about their medications. Am J Med. 2004;117(8):563-568. PubMed
27. Lucas KS. Outcomes evaluation of a pharmacist discharge medication teaching service. Am J Health Syst Pharm. 1998;55(24 suppl 4):S32-S35. PubMed
28. Lysack C, Dama M, Neufeld S, et al. A compliance and satisfaction with home exercise: a comparison of computer-assisted video instruction and routine rehabilitation practice. J Allied Health. 2005;34(2):76-82. PubMed
29. Moore SM. The effects of a discharge information intervention on recovery outcomes following coronary artery bypass surgery. Int J Nurs Stud. 1996;33(2):181-189. PubMed
30. Pereles L, Romonko L, Murzyn T, et al. Evaluation of a self-medication program. J Am Geriatr Soc. 1996;44(2):161-165. PubMed
31. Reynolds MA. Postoperative pain management discharge teaching in a rural population. Pain Manag Nurs. 2009;10(2):76-84. PubMed
32. Sabariego C, Barrera AE, Neubert S, et al. Evaluation of an ICF-based patient education programme for stroke patients: a randomized, single-blinded, controlled, multicentre trial of the effects on self-efficacy, life satisfaction and functioning. Br J Health Psychol. 2013;18(4):707-728. PubMed
33. Shieh SJ, Chen HL, Liu FC, et al. The effectiveness of structured discharge education on maternal confidence, caring knowledge and growth of premature newborns. J Clin Nurs. 2010;19(23-24):3307-3313. PubMed
34. Steinberg TG, Diercks MJ, Millspaugh J. An evaluation of the effectiveness of a videotape for discharge teaching of organ transplant recipients. J Transpl Coord. 1996;6(2):59-63. PubMed
35. Whitby M, McLaws ML, Doidge S, et al. Post-discharge surgical site surveillance: does patient education improve reliability of diagnosis? J Hosp Infect. 2007;66(3):237-242. PubMed
36. Williford SL, Johnson DF. Impact of pharmacist counseling on medication knowledge and compliance. Mil Med. 1995;160(11):561–564. PubMed
37. Zernike W, Henderson A. Evaluating the effectiveness of two teaching strategies for patients diagnosed with hypertension. J Clin Nurs. 1998;7(1):37–44. PubMed
38. Press VG, Arora V, Constantine KL, et al. Forget me not: a randomized trial of the durability of hospital-based education on inhalers for patients with COPD or asthma [abstract]. J Gen Intern Med. 2014;29(1 suppl):S102.
39. Davis TC, Wolf MS, Bass PF, et al. Literacy and misunderstanding prescription drug labels. Ann Intern Med. 2006;145(12):887–894. PubMed
40. McCarthy DM, Waite KR, Curtis LM, et al. What did the doctor say? Health literacy and recall of medical instructions. Med Care. 2012;50(4):277–282. PubMed
41. Tarn DM, Heritage J, Paterniti DA, et al. Physician communication when prescribing new medications. Arch Intern Med. 2006;166(17):1855–1862. PubMed
42. Cawthon C, Walia S, Osborn CY, et al. Improving care transitions: the patient perspective. J Health Commun. 2012;17(suppl 3):312–324. PubMed
43. Karliner LS, Auerbach A, Nápoles A, et al. Language barriers and understanding of hospital discharge instructions. Med Care. 2012;50(4):283–289. PubMed
44. Enhancing the Continuum of Care. Report of the Avoidable Hospitalization Advisory Panel. http://www.health.gov.on.ca/en/common/ministry/publications/reports/baker_2011/baker_2011.pdf. Published November 2011. Accessed December 22, 2016.
45. Chugh A, Williams MV, Grigsby J, et al. Better transitions: improving comprehension of discharge instructions. Front Health Serv Manage. 2009;25(3):11–32. PubMed
46. Schillinger D, Machtinger EL, Wang F, et al. Language, literacy, and communication regarding medication in an anticoagulation clinic: a comparison of verbal vs. visual assessment. J Health Commun. 2006;11(7):651–664. PubMed
47. Epstein RM, Street RL, Jr. The values and value of patient-centered care. Ann Fam Med. 2011;9(2):100–103. PubMed
48. Albrecht JS, Gruber-Baldini AL, Hirshon JM, et al. Hospital discharge instructions: comprehension and compliance among older adults. J Gen Intern Med. 2014;29(11):1491–1498. PubMed
Screening for depression in hospitalized medical patients
In our current healthcare system, pressure to provide cost- and time-efficient care is immense. Inpatient care often focuses on assessing the patient’s presenting illness or injury and treating that condition in a manner that gets the patient on their feet and out of the hospital quickly. Because depression is not an indication for hospitalization so long as active suicidality is absent, inpatient physicians may view it as a problem best managed in the outpatient setting. Yet both psychosocial and physical factors associated with depression put patients at risk for rehospitalization.1 Furthermore, hospitalization represents an unrecognized opportunity to optimize both mental and physical health outcomes.2
Indeed, poor physical and mental health often occur together. Depressed inpatients have poorer outcomes, increased length of stay, and greater vulnerability to hospital readmission.3,4 Among elderly hospitalized patients, depression is particularly common, especially in those with poor physical health, alcoholism,5 hip fracture, and stroke.6 Yet little is known about how often depression goes unrecognized, undiagnosed, and, therefore, untreated.
The US Preventive Services Task Force (USPSTF) recommends screening for depression in the general adult population, including pregnant and postpartum women, and further suggests that screening should be implemented “with adequate systems in place to ensure accurate diagnosis, effective treatment, and appropriate follow-up.”2 The USPSTF guidelines do not distinguish between inpatient and outpatient settings. However, the preponderance of evidence for screening comes from outpatient care settings, and little is known about screening among inpatient populations.7
This study had 2 objectives. First, we sought to examine the performance of depression screening tools in inpatient settings. If depression screening were to become routine in hospital settings, screening tools would need to be sensitive and specific as well as brief and suitable for self-administration by patients or for administration by nurses, resident physicians, or hospitalists. It is also important to consider administration by mental health professionals, who may be best trained to administer such tests. We, therefore, examined 3 types of studies: (1) studies that tested a self-administered screening instrument, (2) studies that tested screening by individuals without formal training, and (3) studies that compared screening tools administered by mental health professionals. Second, we sought to describe associations between depression and clinical or utilization outcomes among hospitalized patients.
METHODS
We adhered to recommendations in the Preferred Reporting Items for Systematic Reviews and Meta-Analyses (PRISMA) Statement,8,9 including designing the analysis before performing the review. However, we did not post a protocol in an online registry, formally assess study quality, or perform a meta-analysis.
Data Sources and Searches
We searched PsycINFO and PubMed databases for articles published between 1990 and 2016 (as of July 31, 2016). In PubMed, 2 search term strings were used to capture studies of depression screening tools in inpatient settings. The first used the advanced search option to exclude studies related to primary care settings or children and adolescents, and the second used MeSH terms to ensure that a wide variety of studies were included. Specific search terms are included in the Appendix. A similar search was conducted in the PsycINFO database and these search terms are also included in the Appendix.
Study Selection
Articles were eligible if they were published in English in peer-reviewed journals, included at least 20 adults hospitalized for nonpsychiatric reasons, and described the use of at least 1 measure of depression. The studies must have either tested the validity of a depression screening tool or examined the association between depression screening and clinical or utilization outcomes. Two investigators reviewed each title, abstract, and full-text article to determine eligibility, then reached a consensus on which studies to include in this review.
Data Extraction
Two investigators reviewed each full-text article to extract information related to study design, population, and outcomes regarding screening tool analysis or clinical results. From articles that assessed the performance of depression screening tools, we extracted information related to the nature and application of the index test, the nature and application of the reference test, the prevalence of depression, and the sensitivity and specificity of the index test compared with the reference test. For articles that focused on the association between depression screening and clinical or utilization outcomes, the data on relevant clinical outcomes included symptom severity, quality of life, and daily functioning, whereas the data on utilization outcomes included length of stay, readmission, and the cost of care.
RESULTS
Altogether, the search identified 3226 records. After eliminating duplicates and abstracts not suitable for inclusion (Figure), 101 articles underwent full-text review and 32 were found to be eligible. Of these, 12 focused on the association between depression and clinical or utilization outcomes, while 20 assessed the performance of depression screening tools.

Depression Screening Tools
Table 1 describes the index and reference instruments as well as methods of administration, the prevalence of depression, and the sensitivity and specificity of the index instruments relative to the reference instruments. Across the 20 studies, the prevalence of depression ranged from 15% to 60%, with a median of 34%.10–29 This finding may reflect different methods of screening or variation among diverse hospitalized populations. Many of the studies excluded patients with cognitive impairment or communication barriers.

The included studies tested a wide range of unique instruments, and compared them with diverse reference standards. Five studies examined instruments that were self-administered by patients10–14; 9 studies assessed instruments administered by nurses, physicians, or research staff members without formal psychiatric training15–23; and 6 studies evaluated instruments administered by mental health professionals.24–29 Four studies compared different instruments that were administered in the same manner (eg, both self-administered by patients).12–14,22 In the remaining studies, both instruments and methods of administration differed between the index and reference conditions.
Eight studies tested brief instruments with 5 or fewer items, most of which exhibited good sensitivity (range 38%–91%) and specificity (range 68%–86%) relative to longer instruments.12,14–19,22 In 2 of these studies, instruments were self-administered. In 1 case, a single self-administered item from the STOP-D instrument (“Over the past 2 weeks, how much have you been bothered by feeling sad, down, or uninterested in life?”) performed nearly as well as the 14-item Hospital Anxiety and Depression Scale.14 In the other 6 studies testing brief instruments, the instruments were administered by individuals without formal training.15–19,22 In 1 such study, geriatricians asking 2 questions about depressed mood and anhedonia performed well compared with a formal psychiatric interview.17
Four studies tested variations of the Geriatric Depression Scale (GDS).12,18,21,23 In 3 of these studies, abbreviated versions of the GDS exhibited relatively high sensitivity and specificity.12,18,21 However, a study comparing the 15-item GDS (GDS-15) with the GDS-4 found that GDS-15 correctly classified 10% more patients with suspected depression.12 Two studies examined variations of the Patient Health Questionnaire (PHQ). One study found that both the PHQ-2 and PHQ-9 obtained by staff nurses performed well relative to a comprehensive assessment by a trained advanced practice nurse.13,19
When reported, positive predictive value, negative predictive value, and area under the receiver-operator curve were generally high.
Depression and Clinical or Utilization Outcomes
Of the 12 studies that reported either clinical or utilization outcomes for depression screening in an inpatient setting,4,30–40 3 measured rates of rehospitalization.4,31,39 The other 9 studies tested for associations between symptoms of depression and either health or treatment outcomes. Table 2 provides a more detailed description of the study designs and results.

Other studies found that depression was associated with reduced functional abilities such as mobility and self-care,30,32–34 and increased hospital readmission31 as well as physical and mental health deficits.37 Interestingly, although 1 study did not find that depression and hospital readmission were closely linked (frequency at 19%), it found that comorbid illness and previous hospitalizations predicted readmission.4
We also evaluated the associations between depression diagnosed in the inpatient studies and 2 types of outcomes. The first type includes clinical outcomes including symptom severity, quality of life, and daily functioning. Most studies we identified assessed clinical outcomes, and all detected an association between depression and worse clinical outcomes. The second type includes healthcare utilization, which can be measured with the patients’ length of hospital stay, readmission and cost of care. In 1 such study, Mitchell aet al.31 reported a 54% increase in readmission within 30 days of discharge among patients who screened positive for depression.31 Additionally, Cully et al.30 found that depression may impinge on the recovery process of acute rehabilitation patients.
DISCUSSION
The purpose of this study was to describe the feasibility and performance of depression screening tools in inpatient medical settings, as well as associations between depression diagnosed in the inpatient setting and clinical and utilization outcomes. The median rate at which depression was detected among inpatients was 33%, ranging from 5% to 60%. Studies from several individual hospitals indicated that depression can be associated with higher healthcare utilization, including return to the hospital after discharge, as well as worse clinical outcomes. To detect undiagnosed depression among inpatients, screening appears feasible. Depression screening instruments generally exhibited good sensitivity and specificity relative to comprehensive clinical evaluations by mental health professionals. Furthermore, several self-administered and brief instruments had good performance. Prior authors have reported that screening for depression among inpatients may not be particularly burdensome to patients or staff members.41
The studies we reviewed used diverse screening instruments. Further research is needed to determine which tools are preferable in which patient populations, and to confirm that brief instruments are adequate for screening. The GDS is widely used, and many patients hospitalized in the United States fall into the geriatric group. The PHQ has been validated for self-administration and is widely used among outpatients42; it may be more suitable for younger populations. We found that several abbreviated versions of these and other screening instruments have exhibited good sensitivity and specificity among inpatients. However, many of the studies excluded patients with cognitive impairment or communication barriers. For individuals with auditory impairment, the Brief Assessment Schedule Depression Cards (BASDEC) might be an option. Used in 2 studies, the BASDEC involves showing patients a deck of 19 easy-to-read cards. The time required to administer the BASDEC is modest.15,23 Sets of smiley face diagrams might also be suitable for some patients with communication barriers or cognitive impairment. An ineligible study among stroke survivors found that selecting a sad face had a sensitivity of 76% and specificity of 77% relative to a formal diagnostic evaluation for depression.43
In considering the instruments that may be most suitable for inpatients, the role of somatic symptoms is also important because these can overlap between depression and the medical conditions that lead to hospitalization.44–46 Prior investigators found, for example, that 47% of Beck Depression Inventory (BDI) scores were attributable to somatic symptoms among patients hospitalized after myocardial infarction, whereas 37% of BDI scores were attributable to somatic symptoms among depressed outpatients.47 Future research is needed to determine the significance of somatic symptoms among inpatients, including whether they should be considered during screening, add prognostic value, or warrant specific treatment. In addition, although positive and negative predictive values were generally high among the screening instruments we evaluated, confirming the diagnosis of depression with a thorough clinical assessment is likely to be necessary.44,45
Despite the high prevalence of depression, associations with suboptimal outcomes, and the good performance of screening tools to date, screening for depression in the inpatient setting has received little attention. Prior authors have questioned whether hospital-based screening is an efficient and effective way to detect depression, and have raised valid concerns regarding false-positive diagnoses and unnecessary treatment, as well as a lack of randomized controlled trials.7,48,49 Whereas some studies suggest that depression is associated with greater healthcare utilization,3,4 little information exists regarding whether screening during hospitalization and treating previously undiagnosed depression improves clinical outcomes or reduces healthcare utilization.
Several important questions remain. What is the pathophysiology of depressed mood during hospitalization? How often does depressed mood during hospitalization reflect longstanding undiagnosed depression, longstanding undertreated depression, an acute stress disorder, or a normal if unpleasant short-term reaction to the stress of acute illnesses? Do the manifestations and effects of depressed mood differ among these situations? What is the prognosis of depressed mood occurring during hospitalization, and how many patients continue to have depression after recovery from acute illness; what factors affect prognosis? In a small sample of hospitalized patients, nearly 50% of those who had been depressed at intake remained depressed 1 month after discharge.50 Given that most antidepressant medications have to be taken for several weeks before effects can be detected, what, if any, approach to treatment should be taken? More research is needed on the effectiveness and cost-effectiveness of diagnosing and treating depression in the inpatient setting.
This work has several limitations. We found relatively few studies meeting eligibility criteria, particularly studies assessing clinical and utilization outcomes among depressed inpatients. Among the screening tools that were studied in the hospital setting, the highly diverse instruments and modes of administration precluded a quantitative synthesis such as meta-analysis. Prior meta-analyses on specific screening tools have focused on outpatient populations.51–53 Furthermore, we did not evaluate study quality or risk of bias.
In conclusion, screening for depression in the inpatient setting via patient self-assessment or assessment by hospital staff appears feasible. Several brief screening tools are available that have good sensitivity and specificity relative to diagnoses made by mental health professionals. Limited evidence suggests that screening tools for depression may be ready to integrate into inpatient care.41 Yet, although depression appears to be common and associated with worse clinical outcomes and higher healthcare utilization, more research is needed on the benefits, risks, and potential costs of adding depression screening in the inpatient healthcare setting.
Disclosures
The authors report no conflicts of interest.
1. Kahn KL, Keeler EB, Sherwood MJ, et al. Comparing outcomes of care before and after implementation of the DRG-based prospective payment system. JAMA. 1990;264(15):1984-1988. PubMed
2. U.S. Preventive Services Task Force (USPSTF). Screening for depression in adults: US Preventive Services Task Force recommendation statement. JAMA. 2016;315(4):380-387. PubMed
3. Dennis M, Kadri A, Coffey J. Depression in older people in the general hospital: a systematic review of screening instruments. Age Ageing. 2012;41(2):148-154. PubMed
4. Albrecht JS, Gruber-Baldini AL, Hirshon JM, et al. Depressive symptoms and hospital readmission in older adults. J Am Geriatr Soc. 2014;62(3):495-499. PubMed
5. Grant BF, Hasin DS, Harford TC. Screening for major depression among alcoholics: an application of receiver operating characteristic analysis. Drug Alcohol Depend. 1989;23(2):123-131. PubMed
6. Lieberman D, Galinsky D, Fried V, et al. Geriatric Depression Screening Scale (GDS) in patients hospitalized for physical rehabilitation. Int J Geriatr Psychiatry. 1999;14(7):549-555. PubMed
7. Canadian Task Force on Preventive Health Care. Recommendations on screening for depression in adults. CMAJ. 2013;185(9):775-782.
8. Moher D, Liberati A, Tetzlaff J, Altman DG, The PRISMA Group. Preferred reporting items for systematic reviews and meta-analyses: the PRISMA statement. PLoS Med. 2009;6(7):e1000097. PubMed
9. Shea BJ, Hamel C, Wells GA, et al. AMSTAR is a reliable and valid measurement tool to assess the methodological quality of systematic reviews. J Clin Epidemiol. 2009;62(10):1013-1020. PubMed
10. Le Fevre P, Devereux J, Smith S, Lawrie SM, Cornbleet M. Screening for psychiatric illness in the palliative care inpatient setting: a comparison between the Hospital Anxiety and Depression Scale and the General Health Questionnaire-12. Palliat Med. 1999;13(5):399-407. PubMed
11. Lloyd-Williams M, Friedman T, Rudd N. Criterion validation of the Edinburgh Postnatal Depression Scale as a screening tool for depression in patients with advanced metastatic cancer. J Pain Symptom Manag. 2000;20(4):259-265. PubMed
12. Amadori K, Herrmann E, Püllen RK. Comparison of the 15-item Geriatric Depression Scale (GDS-15) and the GDS-4 during screening for depression in an in-patient geriatric patient group. J Am Geriatr Soc. 2011;59(1):171-172. PubMed
13. Diez-Quevedo C, Rangil T, Sanchez-Planell L, Kroenke K, Spitzer RL. Validation and utility of the Patient Health Questionnaire in diagnosing mental disorders in 1003 general hospital Spanish inpatients. Psychosom Med. 2001;63(4):679-686. PubMed
14. Young Q-R, Nguyen M, Roth S, Broadberry A, Mackay MH. Single-item measures for depression and anxiety: validation of the screening tool for psychological distress in an inpatient cardiology setting. Eur J Cardiovasc Nursing. 2015;14(6):544-551. PubMed
15. Loke B, Nicklason F, Burvill P. Screening for depression: clinical validation of geriatricians’ diagnosis, the Brief Assessment Schedule Depression Cards and the 5-item version of the Symptom Check List among non-demented geriatric inpatients. Int J Geriatr Psychiatry. 1996;11(5):461-465.
16. Shah A, Karasu M, De T. Nursing staff and screening for depression among acutely ill geriatric inpatients: a pilot study. Aging Ment Health. 1998;2(1):71-74.
17. Payne A, Barry S, Creedon B, et al. Sensitivity and specificity of a two-question screening tool for depression in a specialist palliative care unit. Palliat Med. 2007;21(3):193-198. PubMed
18. Rinaldi P, Mecocci P, Benedetti C, et al. Validation of the five-item geriatric depression scale in elderly subjects in three different settings. J Am Geriatr Soc. 2003;51(5):694-698. PubMed
19. McGuire AW, Eastwood J, Macabasco-O’Connell A, Hays RD, Doering LV. Depression screening: utility of the Patient Health Questionnaire in patients with acute coronary syndrome. Am J Crit Care. 2013;22(1):12-19. PubMed
20. Furlanetto LM, Mendlowicz MV, Bueno JR. The validity of the Beck Depression Inventory-Short Form as a screening and diagnostic instrument for moderate and severe depression in medical inpatients. J Affect Disord. 2005;86(1):87-91. PubMed
21. Heidenblut S, Zank S. Screening for depression with the Depression in Old Age Scale (DIA-S) and the Geriatric Depression Scale (GDS15): diagnostic accuracy in a geriatric inpatient setting. GeroPsych (Bern). 2014;27(1):41. PubMed
22. Pantilat SZ, O’Riordan DL, Dibble SL, Landefeld CS. An assessment of the screening performance of a single-item measure of depression from the Edmonton Symptom Assessment Scale among chronically ill hospitalized patients. J Pain Symptom Manage. 2012;43(5):866-873. PubMed
23. Adshead F, Cody DD, Pitt B. BASDEC: a novel screening instrument for depression in elderly medical inpatients. BMJ. 1992;305(6850):397. PubMed
24. Singh D, Sunpath H, John S, Eastham L, Gouden R. The utility of a rapid screening tool for depression and HIV dementia amongst patients with low CD4 counts – a preliminary report. Afr J Psychiatry (Johannesbg). 2008;11(4):282-286. PubMed
25. Bonin-Guillaume S, Sautel L, Demattei C, Jouve E, Blin O. Validation of the Retardation Rating Scale for detecting in geriatric inpatients. Int J Geriatr Psychiatry. 2007;22(1):68-76. PubMed
26. Rybarczyk B, Winemiller DR, Lazarus LW, Haut A, Hartman C. Validation of a depression screening measure for stroke inpatients. Am J Geriatr Psychiatry. 1996;4(2):131-139.
27. Parker G, Hilton T, Hadzi-Pavlovic D, Bains J. Screening for depression in the medically ill: the suggested utility of a cognitive-based approach. Aust N Z J Psychiatry. 2001;35(4):474-480. PubMed
28. Samaras N, Herrmann FR, Samaras D, et al. The Hospital Anxiety and Depression Scale: low sensitivity for depression screening in demented and non-demented hospitalized elderly. Int Psychogeriatr. 2013;25(1):82-87. PubMed
29. Koenig HG, Cohen HJ, Blazer DG, Meador KG, Westlund R. A brief depression scale for use in the medically ill. Int J Psychiatry Med. 1992;22(2):183-195. PubMed
30. Cully JA, Gfeller JD, Heise RA, Ross MJ, Teal CR, Kunik ME. Geriatric depression, medical diagnosis, and functional recovery during acute rehabilitation. Arch Phys Med Rehabil. 2005;86(12):2256-2260. PubMed
31. Mitchell SE, Paasche-Orlow MK, Forsythe SR, et al. Post-discharge hospital utilization among adult medical inpatients with depressive symptoms. J Hosp Med. 2010;5(7):378-384. PubMed
32. Huffman JC, Mastromauro CA, Sowden GL, Wittmann C, Rodman R, Januzzi JL. A collaborative care depression management program for cardiac inpatients: depression characteristics and in-hospital outcomes. Psychosomatics. 2011;52(1):26-3. 2007;22(11):1596-1602.J Gen Intern Med PubMed
53. Gilbody S, Richards D, Brealey S, Hewitt C. Screening for depression in medical settings with the Patient Health Questionnaire (PHQ): a diagnostic meta-analysis. 2010;126(3):335-348.J Affect Disord. PubMed
52. Mitchell AJ, Meader N, Symonds P. Diagnostic validity of the Hospital Anxiety and Depression Scale (HADS) in cancer and palliative settings: a meta-analysis. 2010;69(4):371-378.J Psychosom Res. PubMed
51. Brennan C, Worrall-Davis A, McMillan D, Gilbody S, House A. The Hospital Anxiety and Depression Scale: a diagnostic meta-analysis of case-finding ability. . 1992;22(3):281-289.Int J Psychiatry Med PubMed
50. Pomerantz AS, de-Nesnera A, West AN. Resolution of depressive symptoms in medical inpatients after discharge. 2014;12(1):13.BMC Med PubMed
49. Thombs BD, Ziegelstein RC, Roseman M, Kloda LA, Ioannidis JPA. There are no randomized controlled trials that support the United States Preventive Services Task Force guideline on screening for depression in primary care: a systematic review. 2013;1(4):E159-E167.CMAJ Open PubMed
48. Keshavarz H, Fitzpatrick-Lewis D, Streiner DL, et al. Screening for depression: a systematic review and meta-analysis. 2012;73(3):157-162.J Psychosom Res. PubMed
47. Delisle VC, Beck AT, Ziegelstein RC, Thombs BD. Symptoms of heart disease or its treatment may increase Beck Depression Inventory Scores in hospitalized post-myocardial infarction patients. 2014;23(9):1079.Psychooncology PubMed
46. Palmer SC. Study provides little insight into routine screening for depression.
2005;20(3):289.Int J Geriatr Psychiatry. PubMed
45. Baldwin RC. Validation of short screening tests for depression, response to Seymour [letter to the editor]. 2005;20(3):289.Int J Geriatr Psychiatry.
44. Seymour J. Validation of short screening tests for depression: comment on Goring et al. (2004) [letter to the editor]. 2008;45(7):1081-1089.Int J Nurs Stud. PubMed
43. Lee ACK, Tang SW, Yu GKK, Cheung RTF. The smiley as a simple screening tool for depression after stroke: a preliminary study. 1999;282(18):1737-1744.JAMA. PubMed
42. Spitzer RL, Kroenke K, Williams JW. Validation and utility of a self-report version of PRIME-MD: the PHQ primary care study. Primary care evaluation of mental disorders. Patient health questionnaire. . 2011;14(3):275-279.J Palliat Med PubMed
41. Rao S, Ferris FD, Irwin SA. Ease of screening for depression and delirium in patients enrolled in inpatient hospice care. . 2004;161(6):1090-1095.Am J Psychiatry PubMed
40. Williams LS, Ghose SS, Swindle RW. Depression and other mental health diagnoses increase mortality risk after ischemic stroke. 2013;75(5):409-413.J Psychosom Res. PubMed
39. Beach SR, Januzzi JL, Mastromauro CA, et al. Patient Health Questionnaire-9 score and adverse cardiac outcomes in patients hospitalized for acute cardiac disease. 2003;18(4):358-359.Int J Geriatr Psychiatry PubMed
38. Cullum S, Nandhra H, Darley J, Todd C. Screening for depression in older people on medical wards: which cut-point should we use? 2007;29(4):340-348.Gen Hosp Psychiatry. PubMed
37. McCusker J, Cole M, Ciampi A, Latimer E, Windholz S, Belzile E. Major depression in older medical inpatients predicts poor physical and mental health status over 12 months. 2008;37(6):690-695.Age Ageing PubMed
36. Cullum S, Metcalfe C, Todd C, Brayne C. Does depression predict adverse outcomes for older medical inpatients? A prospective cohort study of individuals screened for a trial.
. 2010;50(1):6-10.Arch Gerontol Geriatr PubMed
35. Unsar S, Sut N. Depression and health status in elderly hospitalized patients with chronic illness. 150-159.:2010;25(2)Int J Geriatr Psychiatry. PubMed
34. Helvik A-S, Skancke RH, Selbæk G. Screening for depression in elderly medical inpatients from rural area of Norway: prevalence and associated factors. . 2012;60(12):2254-2262.J Am Geriatr Soc PubMed
33. Pierlussi E, Mehta KM, Kirby KA, et al. Depressive symptoms after hospitalization in older adults: function and mortality outcomes. PubMed
In our current healthcare system, pressure to provide cost- and time-efficient care is immense. Inpatient care often focuses on assessing the patient’s presenting illness or injury and treating that condition in a manner that gets the patient on their feet and out of the hospital quickly. Because depression is not an indication for hospitalization so long as active suicidality is absent, inpatient physicians may view it as a problem best managed in the outpatient setting. Yet both psychosocial and physical factors associated with depression put patients at risk for rehospitalization.1 Furthermore, hospitalization represents an unrecognized opportunity to optimize both mental and physical health outcomes.2
Indeed, poor physical and mental health often occur together. Depressed inpatients have poorer outcomes, increased length of stay, and greater vulnerability to hospital readmission.3,4 Among elderly hospitalized patients, depression is particularly common, especially in those with poor physical health, alcoholism,5 hip fracture, and stroke.6 Yet little is known about how often depression goes unrecognized, undiagnosed, and, therefore, untreated.
The US Preventive Services Task Force (USPSTF) recommends screening for depression in the general adult population, including pregnant and postpartum women, and further suggests that screening should be implemented “with adequate systems in place to ensure accurate diagnosis, effective treatment, and appropriate follow-up.”2 The USPSTF guidelines do not distinguish between inpatient and outpatient settings. However, the preponderance of evidence for screening comes from outpatient care settings, and little is known about screening among inpatient populations.7
This study had 2 objectives. First, we sought to examine the performance of depression screening tools in inpatient settings. If depression screening were to become routine in hospital settings, screening tools would need to be sensitive and specific as well as brief and suitable for self-administration by patients or for administration by nurses, resident physicians, or hospitalists. It is also important to consider administration by mental health professionals, who may be best trained to administer such tests. We, therefore, examined 3 types of studies: (1) studies that tested a self-administered screening instrument, (2) studies that tested screening by individuals without formal training, and (3) studies that compared screening tools administered by mental health professionals. Second, we sought to describe associations between depression and clinical or utilization outcomes among hospitalized patients.
METHODS
We adhered to recommendations in the Preferred Reporting Items for Systematic Reviews and Meta-Analyses (PRISMA) Statement,8,9 including designing the analysis before performing the review. However, we did not post a protocol in an online registry, formally assess study quality, or perform a meta-analysis.
Data Sources and Searches
We searched PsycINFO and PubMed databases for articles published between 1990 and 2016 (as of July 31, 2016). In PubMed, 2 search term strings were used to capture studies of depression screening tools in inpatient settings. The first used the advanced search option to exclude studies related to primary care settings or children and adolescents, and the second used MeSH terms to ensure that a wide variety of studies were included. Specific search terms are included in the Appendix. A similar search was conducted in the PsycINFO database and these search terms are also included in the Appendix.
Study Selection
Articles were eligible if they were published in English in peer-reviewed journals, included at least 20 adults hospitalized for nonpsychiatric reasons, and described the use of at least 1 measure of depression. The studies must have either tested the validity of a depression screening tool or examined the association between depression screening and clinical or utilization outcomes. Two investigators reviewed each title, abstract, and full-text article to determine eligibility, then reached a consensus on which studies to include in this review.
Data Extraction
Two investigators reviewed each full-text article to extract information related to study design, population, and outcomes regarding screening tool analysis or clinical results. From articles that assessed the performance of depression screening tools, we extracted information related to the nature and application of the index test, the nature and application of the reference test, the prevalence of depression, and the sensitivity and specificity of the index test compared with the reference test. For articles that focused on the association between depression screening and clinical or utilization outcomes, the data on relevant clinical outcomes included symptom severity, quality of life, and daily functioning, whereas the data on utilization outcomes included length of stay, readmission, and the cost of care.
RESULTS
Altogether, the search identified 3226 records. After eliminating duplicates and abstracts not suitable for inclusion (Figure), 101 articles underwent full-text review and 32 were found to be eligible. Of these, 12 focused on the association between depression and clinical or utilization outcomes, while 20 assessed the performance of depression screening tools.
Depression Screening Tools
Table 1 describes the index and reference instruments as well as methods of administration, the prevalence of depression, and the sensitivity and specificity of the index instruments relative to the reference instruments. Across the 20 studies, the prevalence of depression ranged from 15% to 60%, with a median of 34%.10–29 This finding may reflect different methods of screening or variation among diverse hospitalized populations. Many of the studies excluded patients with cognitive impairment or communication barriers.
The included studies tested a wide range of unique instruments, and compared them with diverse reference standards. Five studies examined instruments that were self-administered by patients10–14; 9 studies assessed instruments administered by nurses, physicians, or research staff members without formal psychiatric training15–23; and 6 studies evaluated instruments administered by mental health professionals.24–29 Four studies compared different instruments that were administered in the same manner (eg, both self-administered by patients).12–14,22 In the remaining studies, both instruments and methods of administration differed between the index and reference conditions.
Eight studies tested brief instruments with 5 or fewer items, most of which exhibited good sensitivity (range 38%–91%) and specificity (range 68%–86%) relative to longer instruments.12,14–19,22 In 2 of these studies, instruments were self-administered. In 1 case, a single self-administered item from the STOP-D instrument (“Over the past 2 weeks, how much have you been bothered by feeling sad, down, or uninterested in life?”) performed nearly as well as the 14-item Hospital Anxiety and Depression Scale.14 In the other 6 studies testing brief instruments, the instruments were administered by individuals without formal training.15–19,22 In 1 such study, geriatricians asking 2 questions about depressed mood and anhedonia performed well compared with a formal psychiatric interview.17
Four studies tested variations of the Geriatric Depression Scale (GDS).12,18,21,23 In 3 of these studies, abbreviated versions of the GDS exhibited relatively high sensitivity and specificity.12,18,21 However, a study comparing the 15-item GDS (GDS-15) with the GDS-4 found that GDS-15 correctly classified 10% more patients with suspected depression.12 Two studies examined variations of the Patient Health Questionnaire (PHQ). One study found that both the PHQ-2 and PHQ-9 obtained by staff nurses performed well relative to a comprehensive assessment by a trained advanced practice nurse.13,19
When reported, positive predictive value, negative predictive value, and area under the receiver-operator curve were generally high.
Depression and Clinical or Utilization Outcomes
Of the 12 studies that reported either clinical or utilization outcomes for depression screening in an inpatient setting,4,30–40 3 measured rates of rehospitalization.4,31,39 The other 9 studies tested for associations between symptoms of depression and either health or treatment outcomes. Table 2 provides a more detailed description of the study designs and results.
Other studies found that depression was associated with reduced functional abilities such as mobility and self-care,30,32–34 and increased hospital readmission31 as well as physical and mental health deficits.37 Interestingly, although 1 study did not find that depression and hospital readmission were closely linked (frequency at 19%), it found that comorbid illness and previous hospitalizations predicted readmission.4
We also evaluated the associations between depression diagnosed in the inpatient studies and 2 types of outcomes. The first type includes clinical outcomes including symptom severity, quality of life, and daily functioning. Most studies we identified assessed clinical outcomes, and all detected an association between depression and worse clinical outcomes. The second type includes healthcare utilization, which can be measured with the patients’ length of hospital stay, readmission and cost of care. In 1 such study, Mitchell aet al.31 reported a 54% increase in readmission within 30 days of discharge among patients who screened positive for depression.31 Additionally, Cully et al.30 found that depression may impinge on the recovery process of acute rehabilitation patients.
DISCUSSION
The purpose of this study was to describe the feasibility and performance of depression screening tools in inpatient medical settings, as well as associations between depression diagnosed in the inpatient setting and clinical and utilization outcomes. The median rate at which depression was detected among inpatients was 33%, ranging from 5% to 60%. Studies from several individual hospitals indicated that depression can be associated with higher healthcare utilization, including return to the hospital after discharge, as well as worse clinical outcomes. To detect undiagnosed depression among inpatients, screening appears feasible. Depression screening instruments generally exhibited good sensitivity and specificity relative to comprehensive clinical evaluations by mental health professionals. Furthermore, several self-administered and brief instruments had good performance. Prior authors have reported that screening for depression among inpatients may not be particularly burdensome to patients or staff members.41
The studies we reviewed used diverse screening instruments. Further research is needed to determine which tools are preferable in which patient populations, and to confirm that brief instruments are adequate for screening. The GDS is widely used, and many patients hospitalized in the United States fall into the geriatric group. The PHQ has been validated for self-administration and is widely used among outpatients42; it may be more suitable for younger populations. We found that several abbreviated versions of these and other screening instruments have exhibited good sensitivity and specificity among inpatients. However, many of the studies excluded patients with cognitive impairment or communication barriers. For individuals with auditory impairment, the Brief Assessment Schedule Depression Cards (BASDEC) might be an option. Used in 2 studies, the BASDEC involves showing patients a deck of 19 easy-to-read cards. The time required to administer the BASDEC is modest.15,23 Sets of smiley face diagrams might also be suitable for some patients with communication barriers or cognitive impairment. An ineligible study among stroke survivors found that selecting a sad face had a sensitivity of 76% and specificity of 77% relative to a formal diagnostic evaluation for depression.43
In considering the instruments that may be most suitable for inpatients, the role of somatic symptoms is also important because these can overlap between depression and the medical conditions that lead to hospitalization.44–46 Prior investigators found, for example, that 47% of Beck Depression Inventory (BDI) scores were attributable to somatic symptoms among patients hospitalized after myocardial infarction, whereas 37% of BDI scores were attributable to somatic symptoms among depressed outpatients.47 Future research is needed to determine the significance of somatic symptoms among inpatients, including whether they should be considered during screening, add prognostic value, or warrant specific treatment. In addition, although positive and negative predictive values were generally high among the screening instruments we evaluated, confirming the diagnosis of depression with a thorough clinical assessment is likely to be necessary.44,45
Despite the high prevalence of depression, associations with suboptimal outcomes, and the good performance of screening tools to date, screening for depression in the inpatient setting has received little attention. Prior authors have questioned whether hospital-based screening is an efficient and effective way to detect depression, and have raised valid concerns regarding false-positive diagnoses and unnecessary treatment, as well as a lack of randomized controlled trials.7,48,49 Whereas some studies suggest that depression is associated with greater healthcare utilization,3,4 little information exists regarding whether screening during hospitalization and treating previously undiagnosed depression improves clinical outcomes or reduces healthcare utilization.
Several important questions remain. What is the pathophysiology of depressed mood during hospitalization? How often does depressed mood during hospitalization reflect longstanding undiagnosed depression, longstanding undertreated depression, an acute stress disorder, or a normal if unpleasant short-term reaction to the stress of acute illnesses? Do the manifestations and effects of depressed mood differ among these situations? What is the prognosis of depressed mood occurring during hospitalization, and how many patients continue to have depression after recovery from acute illness; what factors affect prognosis? In a small sample of hospitalized patients, nearly 50% of those who had been depressed at intake remained depressed 1 month after discharge.50 Given that most antidepressant medications have to be taken for several weeks before effects can be detected, what, if any, approach to treatment should be taken? More research is needed on the effectiveness and cost-effectiveness of diagnosing and treating depression in the inpatient setting.
This work has several limitations. We found relatively few studies meeting eligibility criteria, particularly studies assessing clinical and utilization outcomes among depressed inpatients. Among the screening tools that were studied in the hospital setting, the highly diverse instruments and modes of administration precluded a quantitative synthesis such as meta-analysis. Prior meta-analyses on specific screening tools have focused on outpatient populations.51–53 Furthermore, we did not evaluate study quality or risk of bias.
In conclusion, screening for depression in the inpatient setting via patient self-assessment or assessment by hospital staff appears feasible. Several brief screening tools are available that have good sensitivity and specificity relative to diagnoses made by mental health professionals. Limited evidence suggests that screening tools for depression may be ready to integrate into inpatient care.41 Yet, although depression appears to be common and associated with worse clinical outcomes and higher healthcare utilization, more research is needed on the benefits, risks, and potential costs of adding depression screening in the inpatient healthcare setting.
Disclosures
The authors report no conflicts of interest.
1. Kahn KL, Keeler EB, Sherwood MJ, et al. Comparing outcomes of care before and after implementation of the DRG-based prospective payment system. JAMA. 1990;264(15):1984-1988. PubMed
2. U.S. Preventive Services Task Force (USPSTF). Screening for depression in adults: US Preventive Services Task Force recommendation statement. JAMA. 2016;315(4):380-387. PubMed
3. Dennis M, Kadri A, Coffey J. Depression in older people in the general hospital: a systematic review of screening instruments. Age Ageing. 2012;41(2):148-154. PubMed
4. Albrecht JS, Gruber-Baldini AL, Hirshon JM, et al. Depressive symptoms and hospital readmission in older adults. J Am Geriatr Soc. 2014;62(3):495-499. PubMed
5. Grant BF, Hasin DS, Harford TC. Screening for major depression among alcoholics: an application of receiver operating characteristic analysis. Drug Alcohol Depend. 1989;23(2):123-131. PubMed
6. Lieberman D, Galinsky D, Fried V, et al. Geriatric Depression Screening Scale (GDS) in patients hospitalized for physical rehabilitation. Int J Geriatr Psychiatry. 1999;14(7):549-555. PubMed
7. Canadian Task Force on Preventive Health Care. Recommendations on screening for depression in adults. CMAJ. 2013;185(9):775-782.
8. Moher D, Liberati A, Tetzlaff J, Altman DG, The PRISMA Group. Preferred reporting items for systematic reviews and meta-analyses: the PRISMA statement. PLoS Med. 2009;6(7):e1000097. PubMed
9. Shea BJ, Hamel C, Wells GA, et al. AMSTAR is a reliable and valid measurement tool to assess the methodological quality of systematic reviews. J Clin Epidemiol. 2009;62(10):1013-1020. PubMed
10. Le Fevre P, Devereux J, Smith S, Lawrie SM, Cornbleet M. Screening for psychiatric illness in the palliative care inpatient setting: a comparison between the Hospital Anxiety and Depression Scale and the General Health Questionnaire-12. Palliat Med. 1999;13(5):399-407. PubMed
11. Lloyd-Williams M, Friedman T, Rudd N. Criterion validation of the Edinburgh Postnatal Depression Scale as a screening tool for depression in patients with advanced metastatic cancer. J Pain Symptom Manag. 2000;20(4):259-265. PubMed
12. Amadori K, Herrmann E, Püllen RK. Comparison of the 15-item Geriatric Depression Scale (GDS-15) and the GDS-4 during screening for depression in an in-patient geriatric patient group. J Am Geriatr Soc. 2011;59(1):171-172. PubMed
13. Diez-Quevedo C, Rangil T, Sanchez-Planell L, Kroenke K, Spitzer RL. Validation and utility of the Patient Health Questionnaire in diagnosing mental disorders in 1003 general hospital Spanish inpatients. Psychosom Med. 2001;63(4):679-686. PubMed
14. Young Q-R, Nguyen M, Roth S, Broadberry A, Mackay MH. Single-item measures for depression and anxiety: validation of the screening tool for psychological distress in an inpatient cardiology setting. Eur J Cardiovasc Nursing. 2015;14(6):544-551. PubMed
15. Loke B, Nicklason F, Burvill P. Screening for depression: clinical validation of geriatricians’ diagnosis, the Brief Assessment Schedule Depression Cards and the 5-item version of the Symptom Check List among non-demented geriatric inpatients. Int J Geriatr Psychiatry. 1996;11(5):461-465.
16. Shah A, Karasu M, De T. Nursing staff and screening for depression among acutely ill geriatric inpatients: a pilot study. Aging Ment Health. 1998;2(1):71-74.
17. Payne A, Barry S, Creedon B, et al. Sensitivity and specificity of a two-question screening tool for depression in a specialist palliative care unit. Palliat Med. 2007;21(3):193-198. PubMed
18. Rinaldi P, Mecocci P, Benedetti C, et al. Validation of the five-item geriatric depression scale in elderly subjects in three different settings. J Am Geriatr Soc. 2003;51(5):694-698. PubMed
19. McGuire AW, Eastwood J, Macabasco-O’Connell A, Hays RD, Doering LV. Depression screening: utility of the Patient Health Questionnaire in patients with acute coronary syndrome. Am J Crit Care. 2013;22(1):12-19. PubMed
20. Furlanetto LM, Mendlowicz MV, Bueno JR. The validity of the Beck Depression Inventory-Short Form as a screening and diagnostic instrument for moderate and severe depression in medical inpatients. J Affect Disord. 2005;86(1):87-91. PubMed
21. Heidenblut S, Zank S. Screening for depression with the Depression in Old Age Scale (DIA-S) and the Geriatric Depression Scale (GDS15): diagnostic accuracy in a geriatric inpatient setting. GeroPsych (Bern). 2014;27(1):41. PubMed
22. Pantilat SZ, O’Riordan DL, Dibble SL, Landefeld CS. An assessment of the screening performance of a single-item measure of depression from the Edmonton Symptom Assessment Scale among chronically ill hospitalized patients. J Pain Symptom Manage. 2012;43(5):866-873. PubMed
23. Adshead F, Cody DD, Pitt B. BASDEC: a novel screening instrument for depression in elderly medical inpatients. BMJ. 1992;305(6850):397. PubMed
24. Singh D, Sunpath H, John S, Eastham L, Gouden R. The utility of a rapid screening tool for depression and HIV dementia amongst patients with low CD4 counts – a preliminary report. Afr J Psychiatry (Johannesbg). 2008;11(4):282-286. PubMed
25. Bonin-Guillaume S, Sautel L, Demattei C, Jouve E, Blin O. Validation of the Retardation Rating Scale for detecting in geriatric inpatients. Int J Geriatr Psychiatry. 2007;22(1):68-76. PubMed
26. Rybarczyk B, Winemiller DR, Lazarus LW, Haut A, Hartman C. Validation of a depression screening measure for stroke inpatients. Am J Geriatr Psychiatry. 1996;4(2):131-139.
27. Parker G, Hilton T, Hadzi-Pavlovic D, Bains J. Screening for depression in the medically ill: the suggested utility of a cognitive-based approach. Aust N Z J Psychiatry. 2001;35(4):474-480. PubMed
28. Samaras N, Herrmann FR, Samaras D, et al. The Hospital Anxiety and Depression Scale: low sensitivity for depression screening in demented and non-demented hospitalized elderly. Int Psychogeriatr. 2013;25(1):82-87. PubMed
29. Koenig HG, Cohen HJ, Blazer DG, Meador KG, Westlund R. A brief depression scale for use in the medically ill. Int J Psychiatry Med. 1992;22(2):183-195. PubMed
30. Cully JA, Gfeller JD, Heise RA, Ross MJ, Teal CR, Kunik ME. Geriatric depression, medical diagnosis, and functional recovery during acute rehabilitation. Arch Phys Med Rehabil. 2005;86(12):2256-2260. PubMed
31. Mitchell SE, Paasche-Orlow MK, Forsythe SR, et al. Post-discharge hospital utilization among adult medical inpatients with depressive symptoms. J Hosp Med. 2010;5(7):378-384. PubMed
32. Huffman JC, Mastromauro CA, Sowden GL, Wittmann C, Rodman R, Januzzi JL. A collaborative care depression management program for cardiac inpatients: depression characteristics and in-hospital outcomes. Psychosomatics. 2011;52(1):26-3. 2007;22(11):1596-1602.J Gen Intern Med PubMed
53. Gilbody S, Richards D, Brealey S, Hewitt C. Screening for depression in medical settings with the Patient Health Questionnaire (PHQ): a diagnostic meta-analysis. 2010;126(3):335-348.J Affect Disord. PubMed
52. Mitchell AJ, Meader N, Symonds P. Diagnostic validity of the Hospital Anxiety and Depression Scale (HADS) in cancer and palliative settings: a meta-analysis. 2010;69(4):371-378.J Psychosom Res. PubMed
51. Brennan C, Worrall-Davis A, McMillan D, Gilbody S, House A. The Hospital Anxiety and Depression Scale: a diagnostic meta-analysis of case-finding ability. . 1992;22(3):281-289.Int J Psychiatry Med PubMed
50. Pomerantz AS, de-Nesnera A, West AN. Resolution of depressive symptoms in medical inpatients after discharge. 2014;12(1):13.BMC Med PubMed
49. Thombs BD, Ziegelstein RC, Roseman M, Kloda LA, Ioannidis JPA. There are no randomized controlled trials that support the United States Preventive Services Task Force guideline on screening for depression in primary care: a systematic review. 2013;1(4):E159-E167.CMAJ Open PubMed
48. Keshavarz H, Fitzpatrick-Lewis D, Streiner DL, et al. Screening for depression: a systematic review and meta-analysis. 2012;73(3):157-162.J Psychosom Res. PubMed
47. Delisle VC, Beck AT, Ziegelstein RC, Thombs BD. Symptoms of heart disease or its treatment may increase Beck Depression Inventory Scores in hospitalized post-myocardial infarction patients. 2014;23(9):1079.Psychooncology PubMed
46. Palmer SC. Study provides little insight into routine screening for depression.
2005;20(3):289.Int J Geriatr Psychiatry. PubMed
45. Baldwin RC. Validation of short screening tests for depression, response to Seymour [letter to the editor]. 2005;20(3):289.Int J Geriatr Psychiatry.
44. Seymour J. Validation of short screening tests for depression: comment on Goring et al. (2004) [letter to the editor]. 2008;45(7):1081-1089.Int J Nurs Stud. PubMed
43. Lee ACK, Tang SW, Yu GKK, Cheung RTF. The smiley as a simple screening tool for depression after stroke: a preliminary study. 1999;282(18):1737-1744.JAMA. PubMed
42. Spitzer RL, Kroenke K, Williams JW. Validation and utility of a self-report version of PRIME-MD: the PHQ primary care study. Primary care evaluation of mental disorders. Patient health questionnaire. . 2011;14(3):275-279.J Palliat Med PubMed
41. Rao S, Ferris FD, Irwin SA. Ease of screening for depression and delirium in patients enrolled in inpatient hospice care. . 2004;161(6):1090-1095.Am J Psychiatry PubMed
40. Williams LS, Ghose SS, Swindle RW. Depression and other mental health diagnoses increase mortality risk after ischemic stroke. 2013;75(5):409-413.J Psychosom Res. PubMed
39. Beach SR, Januzzi JL, Mastromauro CA, et al. Patient Health Questionnaire-9 score and adverse cardiac outcomes in patients hospitalized for acute cardiac disease. 2003;18(4):358-359.Int J Geriatr Psychiatry PubMed
38. Cullum S, Nandhra H, Darley J, Todd C. Screening for depression in older people on medical wards: which cut-point should we use? 2007;29(4):340-348.Gen Hosp Psychiatry. PubMed
37. McCusker J, Cole M, Ciampi A, Latimer E, Windholz S, Belzile E. Major depression in older medical inpatients predicts poor physical and mental health status over 12 months. 2008;37(6):690-695.Age Ageing PubMed
36. Cullum S, Metcalfe C, Todd C, Brayne C. Does depression predict adverse outcomes for older medical inpatients? A prospective cohort study of individuals screened for a trial.
. 2010;50(1):6-10.Arch Gerontol Geriatr PubMed
35. Unsar S, Sut N. Depression and health status in elderly hospitalized patients with chronic illness. 150-159.:2010;25(2)Int J Geriatr Psychiatry. PubMed
34. Helvik A-S, Skancke RH, Selbæk G. Screening for depression in elderly medical inpatients from rural area of Norway: prevalence and associated factors. . 2012;60(12):2254-2262.J Am Geriatr Soc PubMed
33. Pierlussi E, Mehta KM, Kirby KA, et al. Depressive symptoms after hospitalization in older adults: function and mortality outcomes. PubMed
© 2017 Society of Hospital Medicine
Cardiopulmonary exercise testing: A contemporary and versatile clinical tool
Cardiopulmonary exercise testing (CPET) is a versatile tool that can be useful in patient management and clinical decision-making. Many physicians are unfamiliar with it, in part because historically it was cumbersome, done mostly in research or exercise physiology centers, and used mostly in assessing athletic fitness rather than pathologic conditions. In addition, medical schools provide little instruction about it, and hands-on use has typically been relegated to pulmonologists.
Improvements in hardware and software and ease of use have brought this test into the clinical arena to the point that clinicians should consider it earlier in the evaluation of appropriate patients. It now has a class I recommendation (ie, the test is indicated) from the American College of Cardiology and American Heart Association for evaluating exertional dyspnea of uncertain cause and for evaluating cardiac patients being considered for transplant.1 It also is a powerful prognosticator of outcomes in heart failure patients.
CARDIOPULMONARY EXERCISE TESTING MADE SIMPLE
CPET is the analysis of gas exchange during exercise. Modern systems measure, breath-by-breath, the volume of oxygen taken up (Vo2), and the volumes of carbon dioxide (Vco2) and air expired (Ve).
Testing can be done with nearly any kind of exercise (treadmill, cycle, arm ergometry), thus accommodating patient or provider preference. Most exercise protocols involve a gradual increase in work rather than increasing stages of work for smooth data collection, and graphical display for optimal test interpretation.
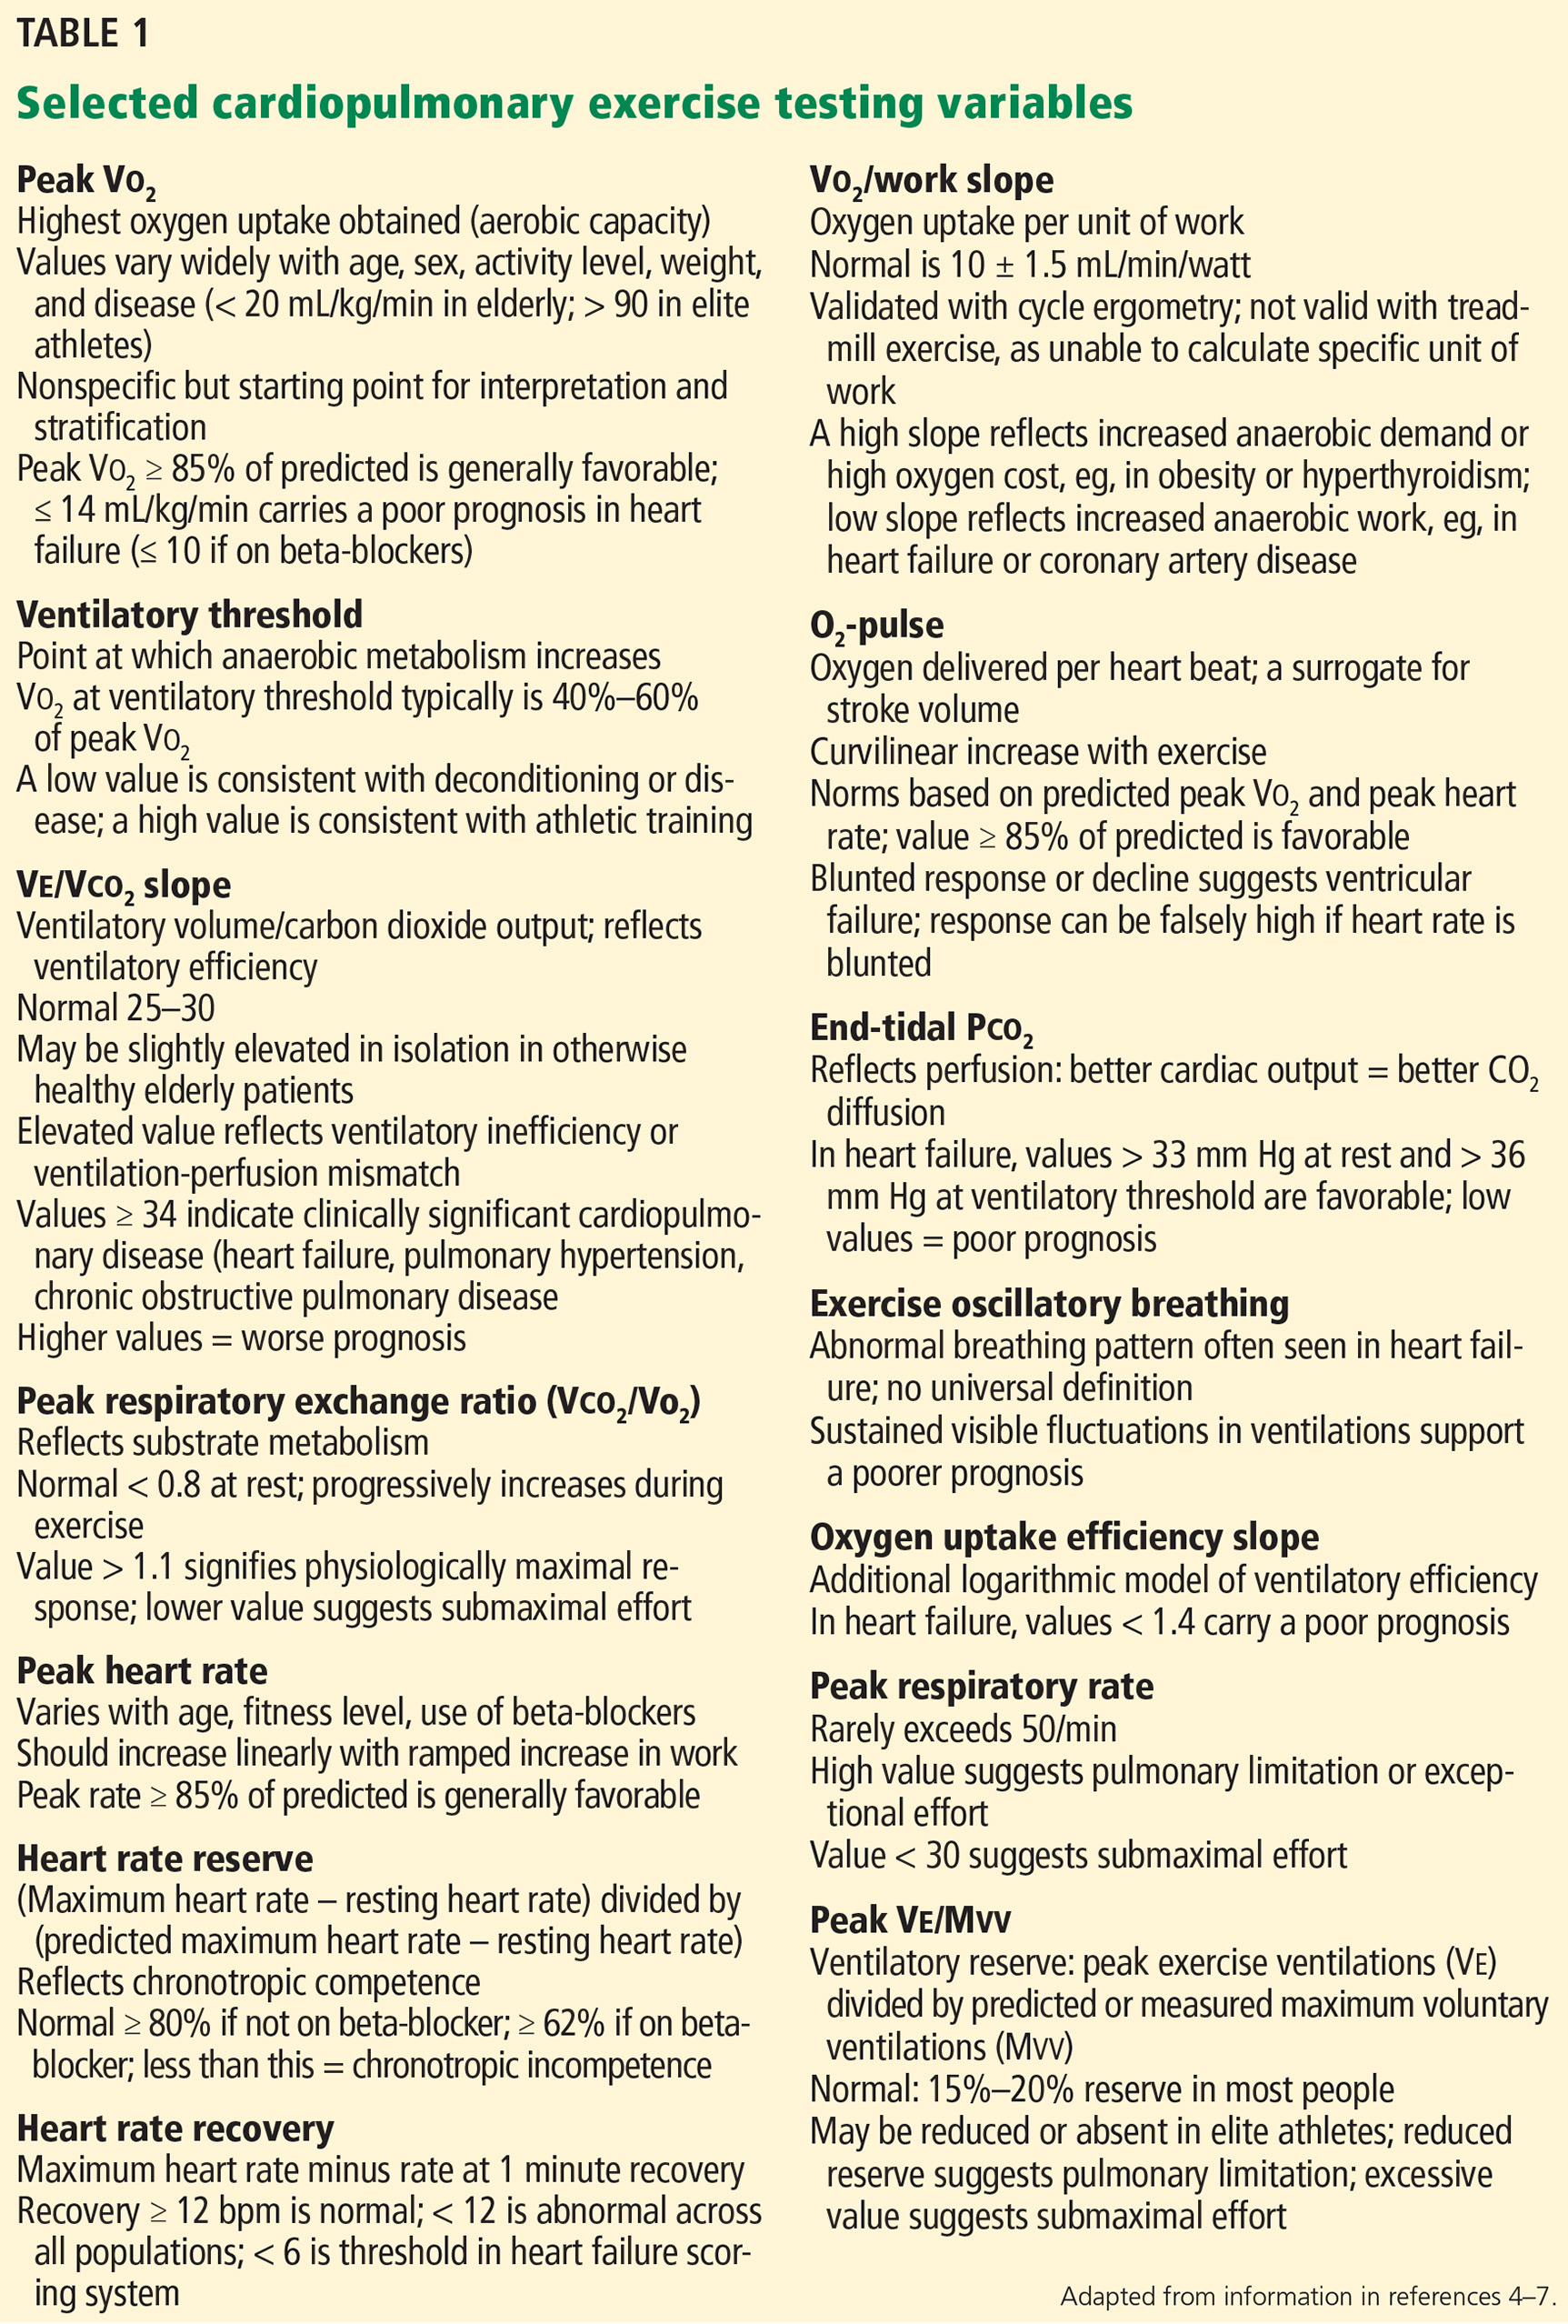
After undergoing baseline screening spirometry, the patient rides a stationary bicycle or walks on a treadmill while breathing through a nonrebreathing mask and wearing electrocardiographic leads, a blood pressure cuff, and a pulse oximeter. The test starts out easy and gets progressively harder until the patient fatigues, reaches his or her predicted peak Vo2, or, as in any stress test, experiences any other clinical indication for stopping, such as arrhythmias, hypotension, or symptoms (rare). We advise patients to wear comfortable workout clothes, and we ask them to try as hard as they can. The test takes about 10 to 15 minutes. Patients are instructed to take all of their usual medications, including beta-blockers, unless advised otherwise at the discretion of the supervising physician.
What the numbers mean
Table 1 lists common CPET variables; Table 2 lists common patterns of results and what they suggest. Other reviews further discuss disease-specific CPET patterns.2–5

Peak Vo2. As the level of work increases, the body needs more oxygen, and oxygen consumption (Vo2) increases in a linear fashion up to a peak value (Figure 1). Peak Vo2 is the central variable in CPET. Whereas elite athletes have high peak Vo2 values, patients with exercise impairment from any cause have lower values, and average adults typically have results in the middle. Peak Vo2 can be expressed in absolute terms as liters of oxygen per minute, in indexed terms as milliliters of oxygen per kilogram of body weight per minute, and as a percentage of the predicted value.
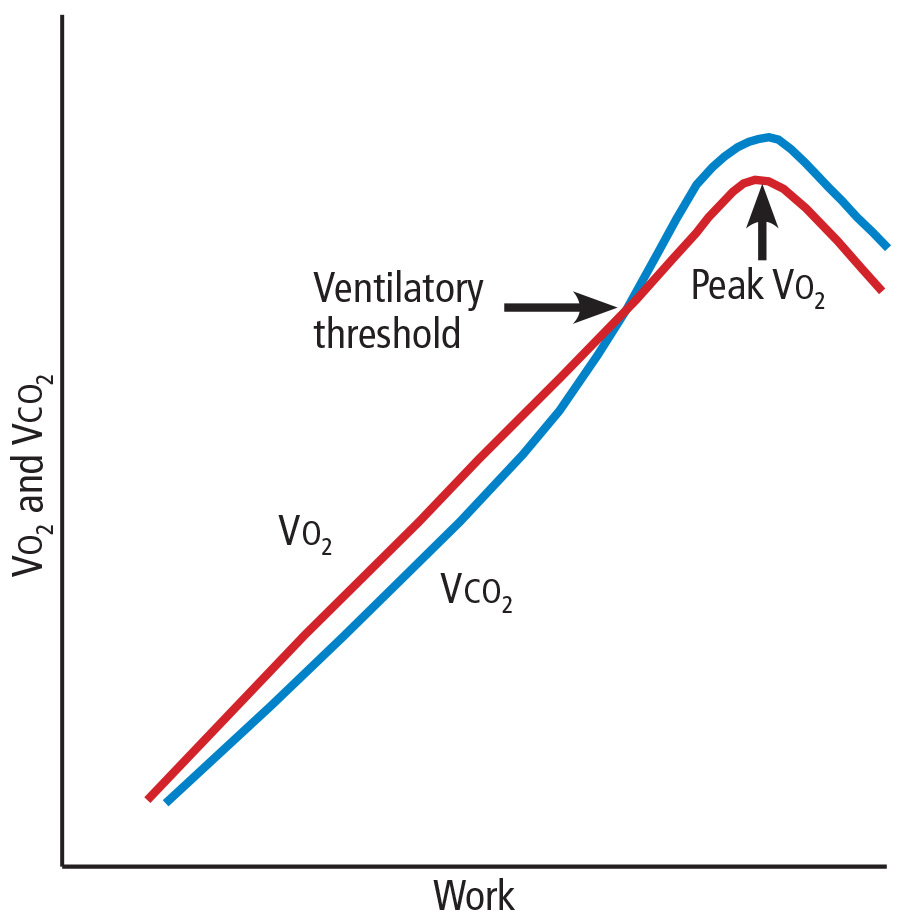
Ventilatory threshold. Before people reach their peak Vo2, they reach a point where the work demand on the muscles exceeds the oxygen that is being delivered to them, and their metabolism becomes more anaerobic. This point is called the anaerobic threshold, or more precisely the ventilatory threshold. In states of deconditioning or disease, this threshold is often lower than predicted. It can be detected either directly by measuring blood lactate levels or, more often, indirectly from the Vo2, Vco2, and Ve data (Figure 2).
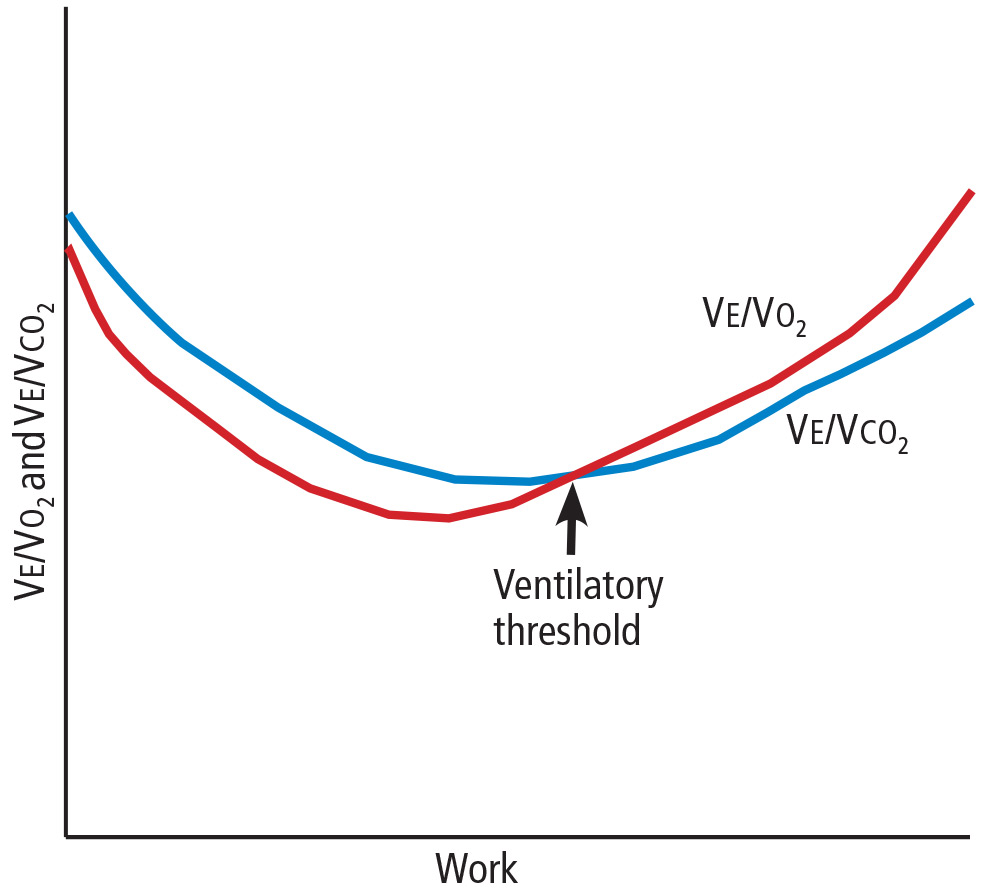
Ve/Vco2 slope. As exercise impairment advances, ventilatory efficiency worsens. Put simply, the demands of exercise result in greater ventilatory effort at any given level of work. This is a consequence of ventilation-perfusion mismatching from a milieu of metabolic, ventilatory, and cardiac dysregulation that accompanies advanced cardiopulmonary or metabolic disease.6,7 The most validated CPET variable reflecting this is the minute ventilation-carbon dioxide relationship (Ve/Vco2 slope) (Figure 3).
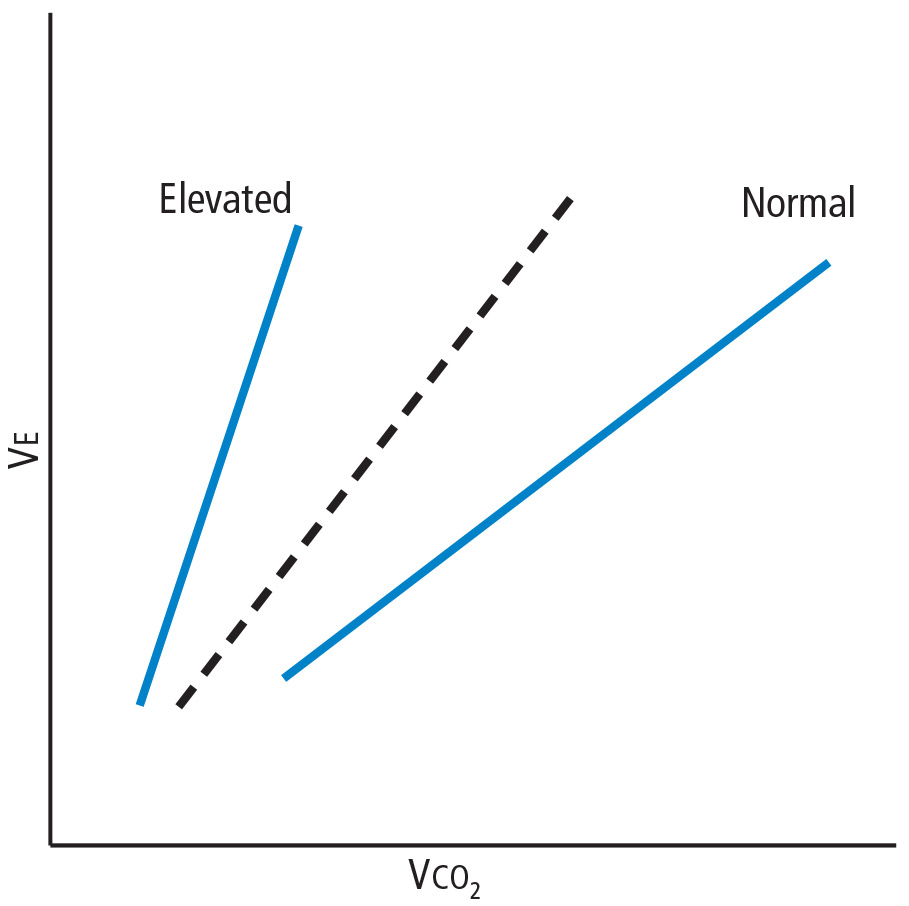
Coupled with other common CPET variables and measures such as screening spirometry, electrocardiography, heart and respiratory rate responses, pulse oximetry, and blood pressure, the Ve/Vco2 allows for a detailed and integrated assessment of exercise performance.
USING CPET TO EVALUATE EXERTIONAL DYSPNEA
Shortness of breath, particularly with exertion, is a common reason patients are referred to internists, pulmonologists, and cardiologists. It is a nonspecific symptom for which a precise cause can be elusive. Possible causes range from physical deconditioning due to obesity to new or progressive cardiopulmonary or muscular disease.
If conventional initial studies such as standard exercise testing, echocardiography, or spirometry do not definitively identify the problem, CPET can help guide additional investigation or management. Any abnormal patterns seen, together with the patient’s clinical context and other test results, can give direction to additional evaluation.
Table 2 outlines various CPET patterns that can suggest clinically significant cardiac, pulmonary, or muscle disorders.8–13 Alternatively, normal responses reassure the patient and clinician, since they suggest the patient does not have clinically significant disease.
Case 1: Obesity and dyspnea
You evaluate a 53-year-old mildly obese man for dyspnea. Cardiology evaluation 1 year earlier included normal transthoracic and stress echocardiograms. He is referred for CPET.
His peak Vo2 is low in indexed terms (22.3 mL/kg/min; 74% of predicted) but 90% of predicted in absolute terms (2.8 L/min), reflecting the contribution of his obesity. His ventilatory threshold is near the lower end of normal (50% of peak Vo2), and all other findings are normal. You conclude his dyspnea is due to deconditioning and obesity.
Case 2: Diastolic dysfunction
You follow a normal-weight 65-year-old woman who has long-standing exertional dyspnea. Evaluation 1 year ago included an echocardiogram showing a normal left ventricular ejection fraction and grade II (moderate) diastolic dysfunction, a normal exercise stress test (details were not provided), normal pulmonary function testing, and high-resolution computed tomography of the chest. She too is referred for CPET.
The findings include mild sinus tachycardia at rest and low peak Vo2 (23.7 mL/kg/min; 69% of predicted). The Ve/Vco2 slope is substantially elevated at 43. Other measures of cardiopulmonary impairment and ventilatory inefficiency such as the end-tidal Pco2 response, oxygen uptake efficiency slope, and oxygen-pulse relationship (O2-pulse, a surrogate for stroke volume) are also abnormal. In clinical context this suggests diastolic dysfunction or unappreciated pulmonary hypertension. You refer her for right heart catheterization, which confirms findings consistent with diastolic dysfunction.
Case 3: Systemic sclerosis
A 64-year-old woman with systemic sclerosis, hypertension, diabetes, and sleep apnea is referred for CPET evaluation of dyspnea. Echocardiography 6 months ago showed a normal left ventricular ejection fraction and moderate diastolic dysfunction.
She undergoes screening spirometry. Results are abnormal and suggest restrictive disease, borderline-low breathing reserve, and low peak Vo2 (20 mL/kg/min; 71% of predicted). She also has chronotropic incompetence (peak heart rate 105 beats per minute; 67% of predicted). These findings are thought to be manifestations of her systemic sclerosis. You refer her for both pulmonary and electrophysiology consultation.
Case 4: Mitral valve prolapse
A generally healthy 73-year-old woman undergoes echocardiography because of a murmur. Findings reveal mitral valve prolapse and mitral regurgitation, which is difficult to quantify. She is referred for CPET as a noninvasive means of assessing the hemodynamic significance of her mitral regurgitation.
Her overall peak Vo2 is low (15 mL/kg/min). The Ve/Vco2 slope is elevated at 32 (normal < 30), and end-tidal Pco2 response is also abnormal. The recovery heart rate is also abnormally elevated. Collectively, these findings indicate that her mitral valve regurgitation is hemodynamically significant, and you refer her for mitral valve surgery.
CPET’S ROLE IN HEART FAILURE
Over 2 decades ago, the direct measure of peak Vo2 during exercise was found to be an important prognosticator for patients with advanced heart failure and thus became a conventional measure for stratifying patients most in need of a heart transplant.14 To this day, a peak Vo2 of 14 mL/kg/min remains a prognostic threshold—values this low or less carry a poor prognosis.
Additional CPET variables are prognostically useful, both independently and with each other. Many of them reflect the ventilatory and metabolic inefficiencies that result from the extensive central and peripheral pathophysiology seen in heart failure.7,15–17
An elevated Ve/Vco2 slope is a strong predictor of adverse outcomes for patients with heart failure with either reduced or preserved ejection fraction.18,19 Other recognized prognostic indicators include20–23:
Low end-tidal Pco2
Exercise oscillatory breathing
Low oxygen uptake efficiency slope. All of these are readily provided in the reports of modern CPET systems. Explanations are in Table 1.

Collectively, these variables are strong predictors of outcomes in heart failure patients in terms of survival, adverse cardiac events, or progression to advanced therapy such as a left ventricular assist device or transplant. A multicenter consortium analyzed CPET results from more than 2,600 systolic heart failure patients and devised a scoring system for predicting outcomes (Table 3). This scoring system is a recommended component of the standard evaluation in patients with advanced heart failure.24
EXERCISE TEST REPORTING

Currently there is no universal reporting format for CPET. Using a systematic approach such as the one proposed by Guazzi et al5 can help assure that abnormal values and patterns in all areas will be identified and incorporated in test interpretation. Table 4 lists suggested components of a CPET report and representative examples.
OTHER USES OF EXERCISE TESTING
CPET has also been found useful in several other clinical conditions that are beyond the scope of this review. These include pulmonary hypertension,25 differentiation of pathologic vs physiologic hypertrophy of the left ventricle,26 preclinical diastolic dysfunction,27,28 congenital heart disease in adults,29 prediction of postoperative complications in bariatric surgery,30 preoperative evaluation for lung resection and pectus excavatum,31,32 hemodynamic impact of mitral regurgitation,33 and mitochondrial myopathies.34
COST-EFFECTIVENESS UNKNOWN
The Current Procedural Terminology code for billing for CPET is 94621 (complex pulmonary stress test). The technical fee is $1,605, and the professional fee is $250. The allowable charges vary according to insurer, but under Medicare A and B, the charges are $258.93 and $70.65, respectively, of which patients typically must copay 20%. Total relative value units are 4.60, of which 1.95 are work relative value units.
The cost-effectiveness of CPET has not been studied. As illustrated in the case examples, patients often undergo numerous tests before CPET. While one might infer that CPET could streamline testing and management if done sooner in disease evaluation, this hypothesis has not been adequately studied, and further research is needed to determine if and how doing so will affect overall costs.
IMPLICATIONS FOR PRACTICE
Newer hardware and software have made CPET more available to practicing clinicians.
CPET has proven value in evaluating patients with exertional dyspnea. If first-line evaluation has not revealed an obvious cause of a patient’s dyspnea, CPET should be considered. This may avoid additional testing or streamline subsequent evaluation and management. CPET also has an established role in risk stratification of those with heart failure.
The clinical application of CPET continues to evolve. Future research will continue to refine its diagnostic and prognostic abilities in a variety of diseases. Most major hospitals and medical centers have CPET capabilities, and interested practitioners should seek out those experienced in test interpretation to increase personal familiarity and to foster appropriate patient referrals.
- Gibbons RJ, Balady GJ, Bricker JT, et al; American College of Cardiology/American Heart Association Task Force on Practice Guidelines (Committee to Update the 1997 Exercise Testing Guidelines). ACC/AHA 2002 guideline update for exercise testing: summary article: a report of the American College of Cardiology/American Heart Association Task Force on Practice Guidelines (Committee to Update the 1997 Exercise Testing Guidelines). Circulation 2002; 106:1883–1892.
- American Thoracic Society; American College of Chest Physicians. ATS/ACCP statement on cardiopulmonary exercise testing. Am J Respir Crit Care Med 2003; 167:211–277.
- Mezzani A, Agostoni P, Cohen-Solal A, et al. Standards for the use of cardiopulmonary exercise testing for the functional evaluation of cardiac patients: a report from the exercise physiology section of the European Association for Cardiovascular Prevention and Rehabilitation. Eur J Cardiovasc Prev Rehabil 2009; 16:249–267.
- Balady GJ, Arena R, Sietsema K, et al; American Heart Association Exercise, Cardiac Rehabilitation, and Prevention Committee of the Council on Clinical Cardiology; Council on Epidemiology and Prevention; Council on Peripheral Vascular Disease; Interdisciplinary Council on Quality of Care and Outcomes Research. Clinician’s guide to cardiopulmonary exercise testing in adults: a scientific statement from the American Heart Association. Circulation 2010; 122:191–225.
- Guazzi M, Adams V, Conraads V, et al; European Association for Cardiovascular Prevention & Rehabilitation; American Heart Association. EACPR/AHA Scientific Statement. Clinical recommendations for cardiopulmonary exercise testing data assessment in specific patient populations. Circulation 2012; 126:2261–2274.
- Wasserman K, Hansen JE, Sue DY, Whipp BJ, Casaburi R. Principles of Exercise Testing and Interpretation: Including Pathophysiology and Clinical Applications. 3rd ed. Baltimore, MD: Lippincott Williams and Wilkins; 1999.
- Lewis GD, Shah RV, Pappagianopolas PP, Systrom DM, Semigran MJ. Determinants of ventilatory efficiency in heart failure: the role of right ventricular performance and pulmonary vascular tone. Circ Heart Fail 2008; 1:227-233.
- Wasserman K. Diagnosing cardiovascular and lung pathophysiology from exercise gas exchange. Chest 1997; 112:1091–1101.
- Killian KJ, Leblanc P, Martin DH, Summers E, Jones NL, Campbell EJ. Exercise capacity and ventilatory, circulatory, and symptom limitation in patients with chronic airflow limitation. Am Rev Respir Dis 1992; 146:935–940.
- Chaudhry S, Arena R, Wasserman K, et al. Exercise-induced myocardial ischemia detected by cardiopulmonary exercise testing. Am J Cardiol 2009; 103:615–619.
- Tarnopolsky MA, Raha S. Mitochondrial myopathies: diagnosis, exercise intolerance, and treatment options. Med Sci Sports Exerc 2005; 37:2086–2093.
- Siciliano G, Volpi L, Piazza S, Ricci G, Mancuso M, Murri L. Functional diagnostics in mitochondrial diseases. Biosci Rep 2007; 27:53–67.
- Lorenzo S, Babb TG. Quantification of cardiorespiratory fitness in healthy nonobese and obese men and women. Chest 2012; 141:1031–1039.
- Mancini DM, Eisen H, Kussmaul W, Mull R, Edmunds LH Jr, Wilson JR. Value of peak exercise oxygen consumption for optimal timing of cardiac transplantation in ambulatory patients with heart failure. Circulation 1991; 83:778–786.
- Ponikowski P, Francis DP, Piepoli MF, et al. Enhanced ventilatory response to exercise in patients with chronic heart failure and preserved exercise tolerance. Marker of abnormal cardiorespiratory reflex control and predictor of poor prognosis. Circulation 2001; 103:967–972.
- Levy WC, Maichel BA, Steele NP, Leclerc KM, Stratton JR. Biomechanical efficiency is decreased in heart failure during low-level steady state and maximal ramp exercise. Eur J Heart Fail 2004; 6:917–926.
- Poole DC, Hirai DM, Copp SW, Musch TI. Muscle oxygen transport and utilization in heart failure: implications for exercise (in)tolerance. Am J Physiol Heart Circ Physiol 2012; 302:H1050–H1063.
- Robbins M, Francis G, Pashkow FJ, et al. Ventilatory and heart rate responses to exercise: better predictors of heart failure mortality than peak oxygen consumption. Circulation 1999; 100:2411–2417.
- Guazzi M, Myers J, Arena R. Cardiopulmonary exercise testing in the clinical and prognostic assessment of diastolic heart failure. J Am Coll Cardiol 2005; 46:1883–1890.
- Arena R, Guazzi M, Myers J. Prognostic value of end-tidal carbon dioxide during exercise testing in heart failure. Int J Cardiol 2007; 117:103–108.
- Leite JJ, Mansur AJ, de Freitas HF, et al. Periodic breathing during incremental exercise predicts mortality in patients with chronic heart failure evaluated for cardiac transplantation. J Am Coll Cardiol 2003; 41:2175–2181.
- Guazzi M, Arena R, Ascione A, Piepoli M, Guazzi MD; Gruppo di Studio Fisiologia dell’Esercizio, Cardiologia dello Sport e Riabilitazione Cardiovascolare of the Italian Society of Cardiology. Exercise oscillatory breathing and increased ventilation to carbon dioxide production slope in heart failure: an unfavorable combination with high prognostic value. Am Heart J 2007; 153:859–867.
- Davies LC, Wensel R, Georgiadou P, et al. Enhanced prognostic value from cardiopulmonary exercise testing in chronic heart failure by non-linear analysis: oxygen uptake efficiency slope. Eur Heart J 2006; 27:684–690.
- Myers J, Oliveira R, Dewey F, et al. Validation of a cardiopulmonary exercise test score in heart failure. Circ Heart Fail 2013; 6:211–218.
- Arena R, Lavie CJ, Milani RV, Myers J, Guazzi M. Cardiopulmonary exercise testing in patients with pulmonary arterial hypertension: an evidence-based review. J Heart Lung Transplant 2010; 29:159–173.
- Whyte GP, Sharma S, George K, McKenna WJ. Exercise gas exchange responses in the differentiation of pathologic and physiologic left ventricular hypertrophy. Med Sci Sports Exerc 1999; 31:1237–1241.
- Wan SH, Vogel MW, Chen HH. Pre-clinical diastolic dysfunction. J Am Coll Cardiol 2014; 63:407–416.
- Ahmadian H, Sherratt J, Lochner K, duBois M, Leclerc K. Cardiopulmonary exercise testing responses and pro-BNP values in adults with mild degrees of diastolic dysfunction. JARCP J Aging Res Clin Practice 2014; 4:1–3.
- Inuzuka R, Diller GP, Borgia F, et al. Comprehensive use of cardiopulmonary exercise testing identifies adults with congenital heart disease at increased mortality risk in the medium term. Circulation 2012; 125:250–259.
- McCullough PA, Gallagher MJ, Dejong AT, et al. Cardiorespiratory fitness and short-term complications after bariatric surgery. Chest 2006; 130:517–525.
- Kallianos A, Rapti A, Tsimpoukis S, et al. Cardiopulmonary exercise testing (CPET) as preoperative test before lung resection. In Vivo 2014; 28:1013–1020.
- Cavestri B, Wurtz A, Bart F, Neviere R, Augilaniu B, Wallaert B. Cardiopulmonary exercise testing in patients with pectus excavatum. Rev Mal Respir 2010; 27:717–723. French.
- Messika-Zeitoun D, Johnson BD, Nkomo V, et al. Cardiopulmonary exercise testing determination of functional capacity in mitral regurgitation. J Am Coll Cardiol 2006; 47:2521–2527.
- Testa M, Navazio FM, Neugebauer J. Recognition, diagnosis, and treatment of mitochondrial myopathies in endurance athletes. Curr Sports Med Rep 2005; 4:282–287.
Cardiopulmonary exercise testing (CPET) is a versatile tool that can be useful in patient management and clinical decision-making. Many physicians are unfamiliar with it, in part because historically it was cumbersome, done mostly in research or exercise physiology centers, and used mostly in assessing athletic fitness rather than pathologic conditions. In addition, medical schools provide little instruction about it, and hands-on use has typically been relegated to pulmonologists.
Improvements in hardware and software and ease of use have brought this test into the clinical arena to the point that clinicians should consider it earlier in the evaluation of appropriate patients. It now has a class I recommendation (ie, the test is indicated) from the American College of Cardiology and American Heart Association for evaluating exertional dyspnea of uncertain cause and for evaluating cardiac patients being considered for transplant.1 It also is a powerful prognosticator of outcomes in heart failure patients.
CARDIOPULMONARY EXERCISE TESTING MADE SIMPLE
CPET is the analysis of gas exchange during exercise. Modern systems measure, breath-by-breath, the volume of oxygen taken up (Vo2), and the volumes of carbon dioxide (Vco2) and air expired (Ve).
Testing can be done with nearly any kind of exercise (treadmill, cycle, arm ergometry), thus accommodating patient or provider preference. Most exercise protocols involve a gradual increase in work rather than increasing stages of work for smooth data collection, and graphical display for optimal test interpretation.
After undergoing baseline screening spirometry, the patient rides a stationary bicycle or walks on a treadmill while breathing through a nonrebreathing mask and wearing electrocardiographic leads, a blood pressure cuff, and a pulse oximeter. The test starts out easy and gets progressively harder until the patient fatigues, reaches his or her predicted peak Vo2, or, as in any stress test, experiences any other clinical indication for stopping, such as arrhythmias, hypotension, or symptoms (rare). We advise patients to wear comfortable workout clothes, and we ask them to try as hard as they can. The test takes about 10 to 15 minutes. Patients are instructed to take all of their usual medications, including beta-blockers, unless advised otherwise at the discretion of the supervising physician.
What the numbers mean
Table 1 lists common CPET variables; Table 2 lists common patterns of results and what they suggest. Other reviews further discuss disease-specific CPET patterns.2–5
Peak Vo2. As the level of work increases, the body needs more oxygen, and oxygen consumption (Vo2) increases in a linear fashion up to a peak value (Figure 1). Peak Vo2 is the central variable in CPET. Whereas elite athletes have high peak Vo2 values, patients with exercise impairment from any cause have lower values, and average adults typically have results in the middle. Peak Vo2 can be expressed in absolute terms as liters of oxygen per minute, in indexed terms as milliliters of oxygen per kilogram of body weight per minute, and as a percentage of the predicted value.
Ventilatory threshold. Before people reach their peak Vo2, they reach a point where the work demand on the muscles exceeds the oxygen that is being delivered to them, and their metabolism becomes more anaerobic. This point is called the anaerobic threshold, or more precisely the ventilatory threshold. In states of deconditioning or disease, this threshold is often lower than predicted. It can be detected either directly by measuring blood lactate levels or, more often, indirectly from the Vo2, Vco2, and Ve data (Figure 2).
Ve/Vco2 slope. As exercise impairment advances, ventilatory efficiency worsens. Put simply, the demands of exercise result in greater ventilatory effort at any given level of work. This is a consequence of ventilation-perfusion mismatching from a milieu of metabolic, ventilatory, and cardiac dysregulation that accompanies advanced cardiopulmonary or metabolic disease.6,7 The most validated CPET variable reflecting this is the minute ventilation-carbon dioxide relationship (Ve/Vco2 slope) (Figure 3).
Coupled with other common CPET variables and measures such as screening spirometry, electrocardiography, heart and respiratory rate responses, pulse oximetry, and blood pressure, the Ve/Vco2 allows for a detailed and integrated assessment of exercise performance.
USING CPET TO EVALUATE EXERTIONAL DYSPNEA
Shortness of breath, particularly with exertion, is a common reason patients are referred to internists, pulmonologists, and cardiologists. It is a nonspecific symptom for which a precise cause can be elusive. Possible causes range from physical deconditioning due to obesity to new or progressive cardiopulmonary or muscular disease.
If conventional initial studies such as standard exercise testing, echocardiography, or spirometry do not definitively identify the problem, CPET can help guide additional investigation or management. Any abnormal patterns seen, together with the patient’s clinical context and other test results, can give direction to additional evaluation.
Table 2 outlines various CPET patterns that can suggest clinically significant cardiac, pulmonary, or muscle disorders.8–13 Alternatively, normal responses reassure the patient and clinician, since they suggest the patient does not have clinically significant disease.
Case 1: Obesity and dyspnea
You evaluate a 53-year-old mildly obese man for dyspnea. Cardiology evaluation 1 year earlier included normal transthoracic and stress echocardiograms. He is referred for CPET.
His peak Vo2 is low in indexed terms (22.3 mL/kg/min; 74% of predicted) but 90% of predicted in absolute terms (2.8 L/min), reflecting the contribution of his obesity. His ventilatory threshold is near the lower end of normal (50% of peak Vo2), and all other findings are normal. You conclude his dyspnea is due to deconditioning and obesity.
Case 2: Diastolic dysfunction
You follow a normal-weight 65-year-old woman who has long-standing exertional dyspnea. Evaluation 1 year ago included an echocardiogram showing a normal left ventricular ejection fraction and grade II (moderate) diastolic dysfunction, a normal exercise stress test (details were not provided), normal pulmonary function testing, and high-resolution computed tomography of the chest. She too is referred for CPET.
The findings include mild sinus tachycardia at rest and low peak Vo2 (23.7 mL/kg/min; 69% of predicted). The Ve/Vco2 slope is substantially elevated at 43. Other measures of cardiopulmonary impairment and ventilatory inefficiency such as the end-tidal Pco2 response, oxygen uptake efficiency slope, and oxygen-pulse relationship (O2-pulse, a surrogate for stroke volume) are also abnormal. In clinical context this suggests diastolic dysfunction or unappreciated pulmonary hypertension. You refer her for right heart catheterization, which confirms findings consistent with diastolic dysfunction.
Case 3: Systemic sclerosis
A 64-year-old woman with systemic sclerosis, hypertension, diabetes, and sleep apnea is referred for CPET evaluation of dyspnea. Echocardiography 6 months ago showed a normal left ventricular ejection fraction and moderate diastolic dysfunction.
She undergoes screening spirometry. Results are abnormal and suggest restrictive disease, borderline-low breathing reserve, and low peak Vo2 (20 mL/kg/min; 71% of predicted). She also has chronotropic incompetence (peak heart rate 105 beats per minute; 67% of predicted). These findings are thought to be manifestations of her systemic sclerosis. You refer her for both pulmonary and electrophysiology consultation.
Case 4: Mitral valve prolapse
A generally healthy 73-year-old woman undergoes echocardiography because of a murmur. Findings reveal mitral valve prolapse and mitral regurgitation, which is difficult to quantify. She is referred for CPET as a noninvasive means of assessing the hemodynamic significance of her mitral regurgitation.
Her overall peak Vo2 is low (15 mL/kg/min). The Ve/Vco2 slope is elevated at 32 (normal < 30), and end-tidal Pco2 response is also abnormal. The recovery heart rate is also abnormally elevated. Collectively, these findings indicate that her mitral valve regurgitation is hemodynamically significant, and you refer her for mitral valve surgery.
CPET’S ROLE IN HEART FAILURE
Over 2 decades ago, the direct measure of peak Vo2 during exercise was found to be an important prognosticator for patients with advanced heart failure and thus became a conventional measure for stratifying patients most in need of a heart transplant.14 To this day, a peak Vo2 of 14 mL/kg/min remains a prognostic threshold—values this low or less carry a poor prognosis.
Additional CPET variables are prognostically useful, both independently and with each other. Many of them reflect the ventilatory and metabolic inefficiencies that result from the extensive central and peripheral pathophysiology seen in heart failure.7,15–17
An elevated Ve/Vco2 slope is a strong predictor of adverse outcomes for patients with heart failure with either reduced or preserved ejection fraction.18,19 Other recognized prognostic indicators include20–23:
Low end-tidal Pco2
Exercise oscillatory breathing
Low oxygen uptake efficiency slope. All of these are readily provided in the reports of modern CPET systems. Explanations are in Table 1.
Collectively, these variables are strong predictors of outcomes in heart failure patients in terms of survival, adverse cardiac events, or progression to advanced therapy such as a left ventricular assist device or transplant. A multicenter consortium analyzed CPET results from more than 2,600 systolic heart failure patients and devised a scoring system for predicting outcomes (Table 3). This scoring system is a recommended component of the standard evaluation in patients with advanced heart failure.24
EXERCISE TEST REPORTING
Currently there is no universal reporting format for CPET. Using a systematic approach such as the one proposed by Guazzi et al5 can help assure that abnormal values and patterns in all areas will be identified and incorporated in test interpretation. Table 4 lists suggested components of a CPET report and representative examples.
OTHER USES OF EXERCISE TESTING
CPET has also been found useful in several other clinical conditions that are beyond the scope of this review. These include pulmonary hypertension,25 differentiation of pathologic vs physiologic hypertrophy of the left ventricle,26 preclinical diastolic dysfunction,27,28 congenital heart disease in adults,29 prediction of postoperative complications in bariatric surgery,30 preoperative evaluation for lung resection and pectus excavatum,31,32 hemodynamic impact of mitral regurgitation,33 and mitochondrial myopathies.34
COST-EFFECTIVENESS UNKNOWN
The Current Procedural Terminology code for billing for CPET is 94621 (complex pulmonary stress test). The technical fee is $1,605, and the professional fee is $250. The allowable charges vary according to insurer, but under Medicare A and B, the charges are $258.93 and $70.65, respectively, of which patients typically must copay 20%. Total relative value units are 4.60, of which 1.95 are work relative value units.
The cost-effectiveness of CPET has not been studied. As illustrated in the case examples, patients often undergo numerous tests before CPET. While one might infer that CPET could streamline testing and management if done sooner in disease evaluation, this hypothesis has not been adequately studied, and further research is needed to determine if and how doing so will affect overall costs.
IMPLICATIONS FOR PRACTICE
Newer hardware and software have made CPET more available to practicing clinicians.
CPET has proven value in evaluating patients with exertional dyspnea. If first-line evaluation has not revealed an obvious cause of a patient’s dyspnea, CPET should be considered. This may avoid additional testing or streamline subsequent evaluation and management. CPET also has an established role in risk stratification of those with heart failure.
The clinical application of CPET continues to evolve. Future research will continue to refine its diagnostic and prognostic abilities in a variety of diseases. Most major hospitals and medical centers have CPET capabilities, and interested practitioners should seek out those experienced in test interpretation to increase personal familiarity and to foster appropriate patient referrals.
- Gibbons RJ, Balady GJ, Bricker JT, et al; American College of Cardiology/American Heart Association Task Force on Practice Guidelines (Committee to Update the 1997 Exercise Testing Guidelines). ACC/AHA 2002 guideline update for exercise testing: summary article: a report of the American College of Cardiology/American Heart Association Task Force on Practice Guidelines (Committee to Update the 1997 Exercise Testing Guidelines). Circulation 2002; 106:1883–1892.
- American Thoracic Society; American College of Chest Physicians. ATS/ACCP statement on cardiopulmonary exercise testing. Am J Respir Crit Care Med 2003; 167:211–277.
- Mezzani A, Agostoni P, Cohen-Solal A, et al. Standards for the use of cardiopulmonary exercise testing for the functional evaluation of cardiac patients: a report from the exercise physiology section of the European Association for Cardiovascular Prevention and Rehabilitation. Eur J Cardiovasc Prev Rehabil 2009; 16:249–267.
- Balady GJ, Arena R, Sietsema K, et al; American Heart Association Exercise, Cardiac Rehabilitation, and Prevention Committee of the Council on Clinical Cardiology; Council on Epidemiology and Prevention; Council on Peripheral Vascular Disease; Interdisciplinary Council on Quality of Care and Outcomes Research. Clinician’s guide to cardiopulmonary exercise testing in adults: a scientific statement from the American Heart Association. Circulation 2010; 122:191–225.
- Guazzi M, Adams V, Conraads V, et al; European Association for Cardiovascular Prevention & Rehabilitation; American Heart Association. EACPR/AHA Scientific Statement. Clinical recommendations for cardiopulmonary exercise testing data assessment in specific patient populations. Circulation 2012; 126:2261–2274.
- Wasserman K, Hansen JE, Sue DY, Whipp BJ, Casaburi R. Principles of Exercise Testing and Interpretation: Including Pathophysiology and Clinical Applications. 3rd ed. Baltimore, MD: Lippincott Williams and Wilkins; 1999.
- Lewis GD, Shah RV, Pappagianopolas PP, Systrom DM, Semigran MJ. Determinants of ventilatory efficiency in heart failure: the role of right ventricular performance and pulmonary vascular tone. Circ Heart Fail 2008; 1:227-233.
- Wasserman K. Diagnosing cardiovascular and lung pathophysiology from exercise gas exchange. Chest 1997; 112:1091–1101.
- Killian KJ, Leblanc P, Martin DH, Summers E, Jones NL, Campbell EJ. Exercise capacity and ventilatory, circulatory, and symptom limitation in patients with chronic airflow limitation. Am Rev Respir Dis 1992; 146:935–940.
- Chaudhry S, Arena R, Wasserman K, et al. Exercise-induced myocardial ischemia detected by cardiopulmonary exercise testing. Am J Cardiol 2009; 103:615–619.
- Tarnopolsky MA, Raha S. Mitochondrial myopathies: diagnosis, exercise intolerance, and treatment options. Med Sci Sports Exerc 2005; 37:2086–2093.
- Siciliano G, Volpi L, Piazza S, Ricci G, Mancuso M, Murri L. Functional diagnostics in mitochondrial diseases. Biosci Rep 2007; 27:53–67.
- Lorenzo S, Babb TG. Quantification of cardiorespiratory fitness in healthy nonobese and obese men and women. Chest 2012; 141:1031–1039.
- Mancini DM, Eisen H, Kussmaul W, Mull R, Edmunds LH Jr, Wilson JR. Value of peak exercise oxygen consumption for optimal timing of cardiac transplantation in ambulatory patients with heart failure. Circulation 1991; 83:778–786.
- Ponikowski P, Francis DP, Piepoli MF, et al. Enhanced ventilatory response to exercise in patients with chronic heart failure and preserved exercise tolerance. Marker of abnormal cardiorespiratory reflex control and predictor of poor prognosis. Circulation 2001; 103:967–972.
- Levy WC, Maichel BA, Steele NP, Leclerc KM, Stratton JR. Biomechanical efficiency is decreased in heart failure during low-level steady state and maximal ramp exercise. Eur J Heart Fail 2004; 6:917–926.
- Poole DC, Hirai DM, Copp SW, Musch TI. Muscle oxygen transport and utilization in heart failure: implications for exercise (in)tolerance. Am J Physiol Heart Circ Physiol 2012; 302:H1050–H1063.
- Robbins M, Francis G, Pashkow FJ, et al. Ventilatory and heart rate responses to exercise: better predictors of heart failure mortality than peak oxygen consumption. Circulation 1999; 100:2411–2417.
- Guazzi M, Myers J, Arena R. Cardiopulmonary exercise testing in the clinical and prognostic assessment of diastolic heart failure. J Am Coll Cardiol 2005; 46:1883–1890.
- Arena R, Guazzi M, Myers J. Prognostic value of end-tidal carbon dioxide during exercise testing in heart failure. Int J Cardiol 2007; 117:103–108.
- Leite JJ, Mansur AJ, de Freitas HF, et al. Periodic breathing during incremental exercise predicts mortality in patients with chronic heart failure evaluated for cardiac transplantation. J Am Coll Cardiol 2003; 41:2175–2181.
- Guazzi M, Arena R, Ascione A, Piepoli M, Guazzi MD; Gruppo di Studio Fisiologia dell’Esercizio, Cardiologia dello Sport e Riabilitazione Cardiovascolare of the Italian Society of Cardiology. Exercise oscillatory breathing and increased ventilation to carbon dioxide production slope in heart failure: an unfavorable combination with high prognostic value. Am Heart J 2007; 153:859–867.
- Davies LC, Wensel R, Georgiadou P, et al. Enhanced prognostic value from cardiopulmonary exercise testing in chronic heart failure by non-linear analysis: oxygen uptake efficiency slope. Eur Heart J 2006; 27:684–690.
- Myers J, Oliveira R, Dewey F, et al. Validation of a cardiopulmonary exercise test score in heart failure. Circ Heart Fail 2013; 6:211–218.
- Arena R, Lavie CJ, Milani RV, Myers J, Guazzi M. Cardiopulmonary exercise testing in patients with pulmonary arterial hypertension: an evidence-based review. J Heart Lung Transplant 2010; 29:159–173.
- Whyte GP, Sharma S, George K, McKenna WJ. Exercise gas exchange responses in the differentiation of pathologic and physiologic left ventricular hypertrophy. Med Sci Sports Exerc 1999; 31:1237–1241.
- Wan SH, Vogel MW, Chen HH. Pre-clinical diastolic dysfunction. J Am Coll Cardiol 2014; 63:407–416.
- Ahmadian H, Sherratt J, Lochner K, duBois M, Leclerc K. Cardiopulmonary exercise testing responses and pro-BNP values in adults with mild degrees of diastolic dysfunction. JARCP J Aging Res Clin Practice 2014; 4:1–3.
- Inuzuka R, Diller GP, Borgia F, et al. Comprehensive use of cardiopulmonary exercise testing identifies adults with congenital heart disease at increased mortality risk in the medium term. Circulation 2012; 125:250–259.
- McCullough PA, Gallagher MJ, Dejong AT, et al. Cardiorespiratory fitness and short-term complications after bariatric surgery. Chest 2006; 130:517–525.
- Kallianos A, Rapti A, Tsimpoukis S, et al. Cardiopulmonary exercise testing (CPET) as preoperative test before lung resection. In Vivo 2014; 28:1013–1020.
- Cavestri B, Wurtz A, Bart F, Neviere R, Augilaniu B, Wallaert B. Cardiopulmonary exercise testing in patients with pectus excavatum. Rev Mal Respir 2010; 27:717–723. French.
- Messika-Zeitoun D, Johnson BD, Nkomo V, et al. Cardiopulmonary exercise testing determination of functional capacity in mitral regurgitation. J Am Coll Cardiol 2006; 47:2521–2527.
- Testa M, Navazio FM, Neugebauer J. Recognition, diagnosis, and treatment of mitochondrial myopathies in endurance athletes. Curr Sports Med Rep 2005; 4:282–287.
KEY POINTS
- Technological advances and ease of use have brought CPET out of specialized centers and into the realm of daily clinical practice.
- CPET is a versatile test that has unique ability to assess cardiopulmonary and metabolic responses to exercise that can reflect underlying pathology.
- CPET has established value in assessing patients with exertional dyspnea and can guide clinical decision-making and help streamline patient management by focusing on the cause or excluding pathology.
- CPET has useful prognostic capabilities in patients with heart failure to guide medical treatment or referral for advanced therapies.
Severely frail elderly patients do not need lipid-lowering drugs
Frail elderly patients are at high risk of adverse clinical outcomes, including those due to polypharmacy. Several groups tackle “deprescribing” by developing lists of medications that are potentially inappropriate for the elderly, such as the Beers or STOPP/START criteria.1–4
See related editorialIn contrast, our group (the Palliative and Therapeutic Harmonization [PATH] program and the Dalhousie Academic Detailing Service) has developed evidence-based, frailty-specific guidelines for treating hypertension5 and diabetes,6 in which we advocate less-stringent treatment targets and tapering or discontinuing medications, as needed.
The PATH program7 is a clinical approach that prioritizes the consideration of frailty when making treatment decisions. The Dalhousie Academic Detailing Service collaborates with the Nova Scotia Health Authority to research and develop evidence-informed educational messages about the treatment of common medical conditions.
Here, we address lipid-lowering therapy in this population.
CONSIDERING FRAILTY
Frailty is defined in several ways. The Fried model8,9 identifies frailty when 3 of the following characteristics are present: unintentional weight loss, exhaustion, muscle weakness, slow walking speed, or low levels of activity. The Clinical Frailty Scale10,11 and the Frailty Assessment for Care-planning Tool (FACT)5 use deficits in cognition, function, and mobility to define frailty. According to these scales, people are considered severely frail when they require assistance with basic activities of daily living (such as bathing or dressing), owing to cognitive or physical deficits from any cause.
In reviewing the evidence, we consider five questions:
- What is the quality of the evidence? (Up to 48% of clinical practice guideline recommendations may be based on low-level evidence or expert opinion.12)
- How did the study population compare with the frail?
- Are study outcomes and potential benefits clinically relevant to those who are frail?
- How long did it take for the clinical benefit of a treatment to become apparent, and are the frail elderly likely to live that long?
- Have the harms of treatment been sufficiently considered?
WHAT IS THE QUALITY OF THE EVIDENCE?
We found no studies that specifically evaluated the benefit of lipid-lowering for severely frail older adults. Therefore, we examined randomized controlled trials that enrolled non-frail older adults,13–28 subgroup analyses of randomized controlled trials,29,30 meta-analyses that analyzed subgroups of elderly populations,31,32 and publications describing the study designs of randomized controlled trials.33–37
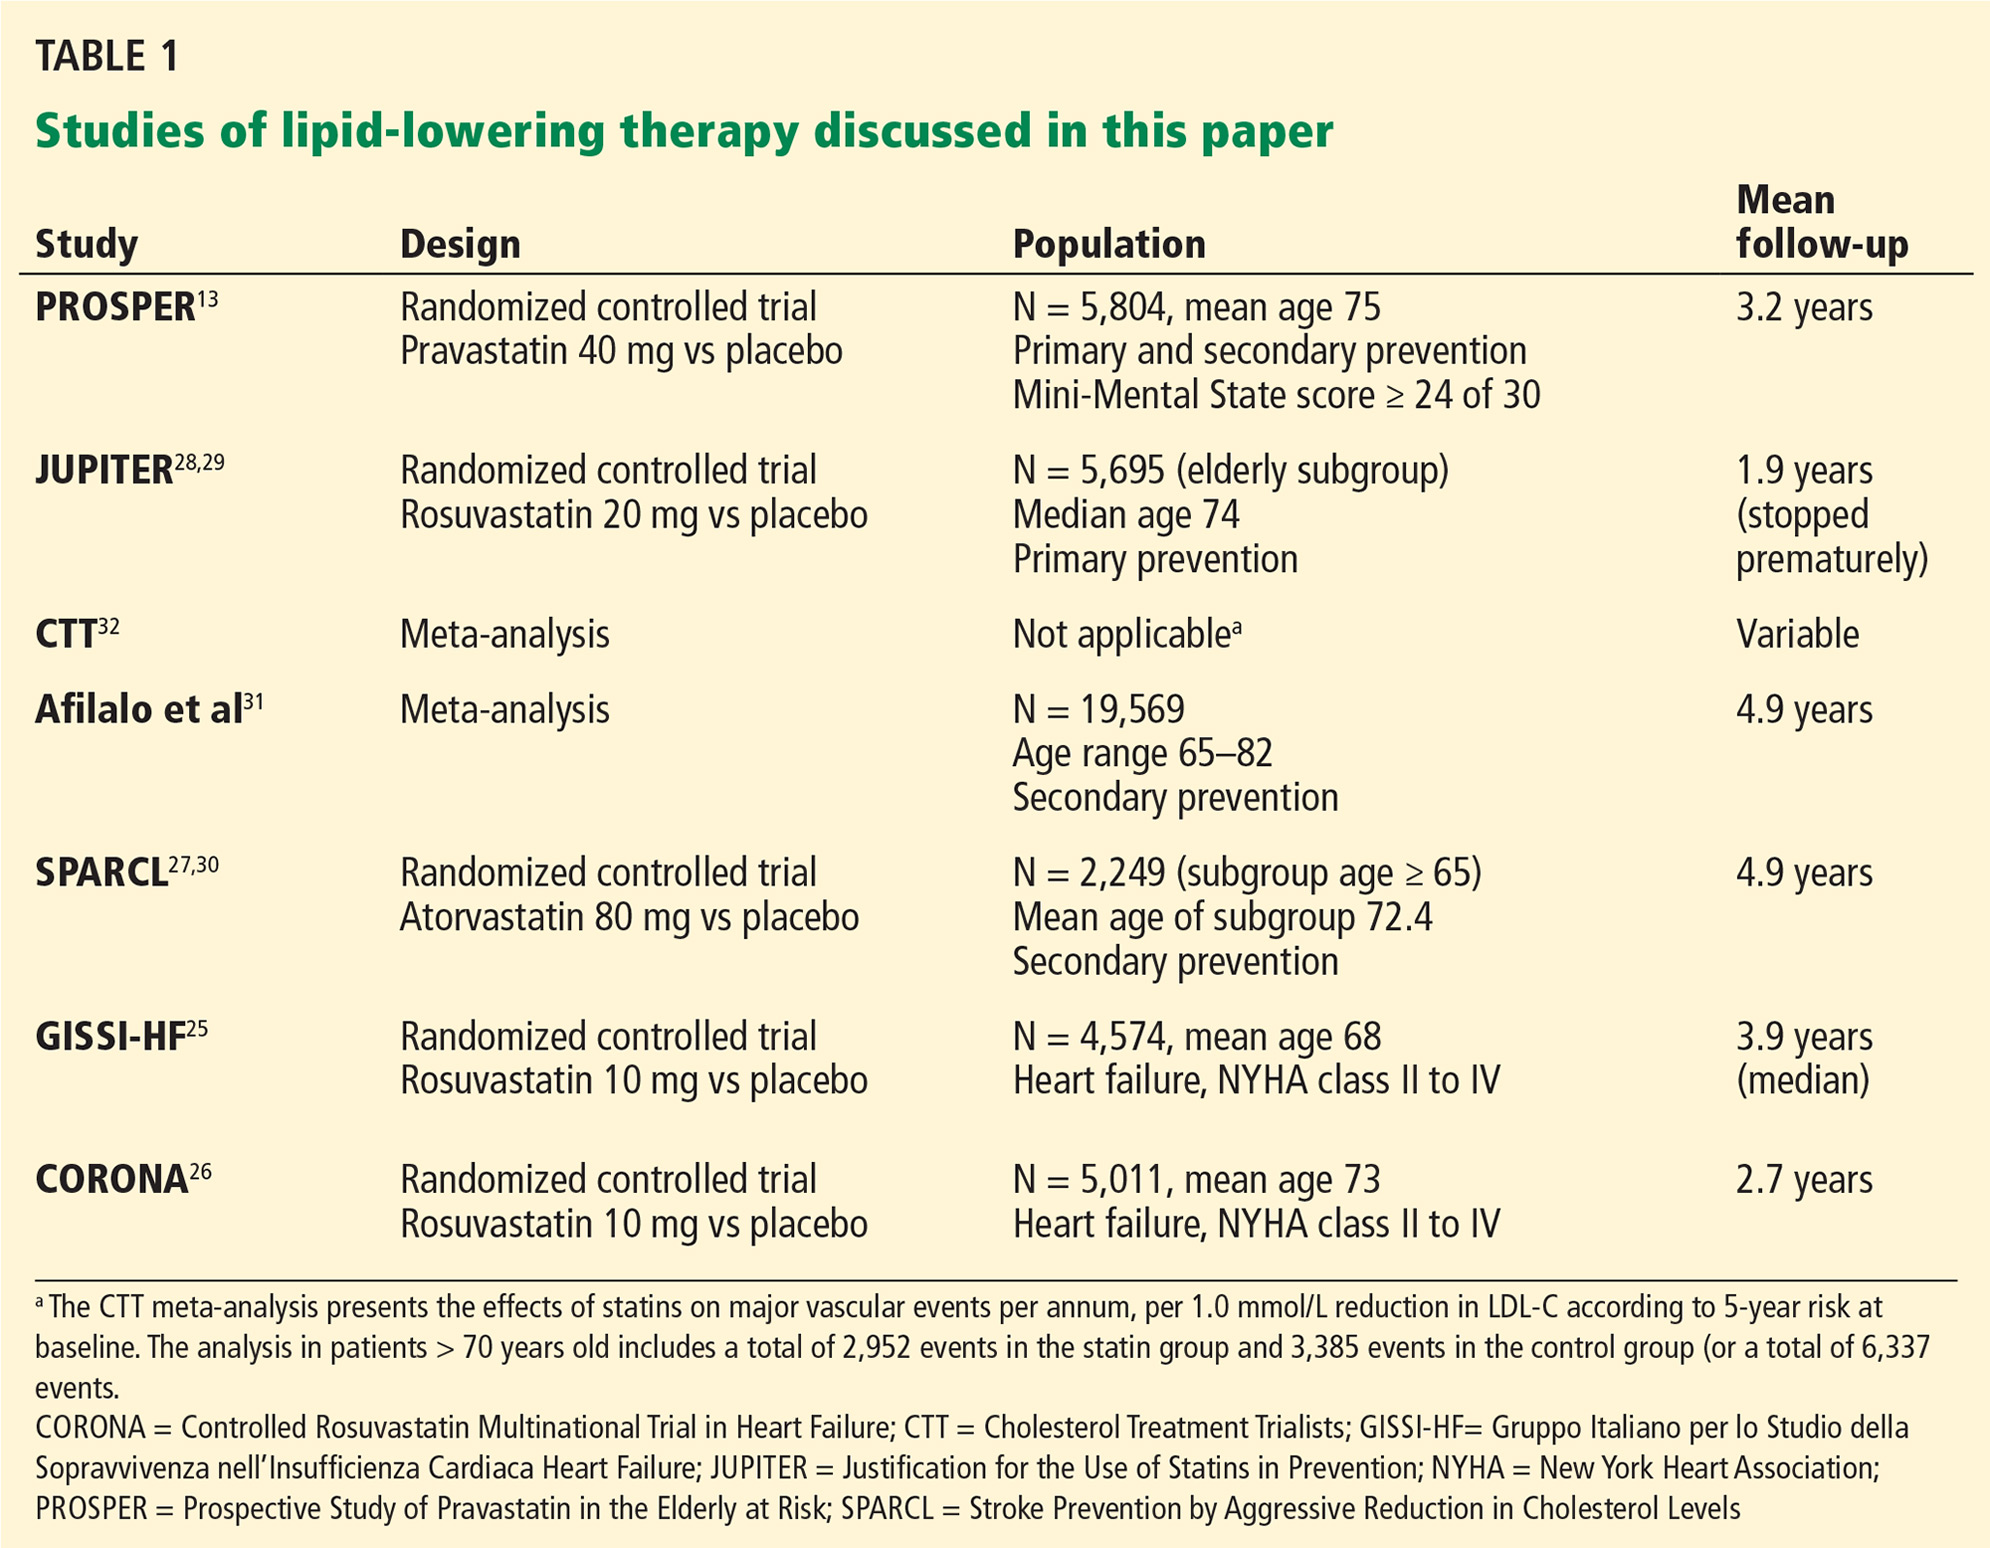
Most of the evidence comes from post hoc subgroup analyses of elderly populations. Although meta-analysis is commonly used to compare subgroups, the Cochrane handbook and others consider subgroup comparisons observational by nature.38,39 (See Table 1 for lipid-lowering studies discussed in this article.)
Studies of statins for primary prevention of cardiovascular disease
For evidence of benefit from lipid-lowering for primary prevention (ie, to reduce the risk of cardiovascular events in patients with no known cardiovascular disease at baseline but at increased risk), we reviewed the meta-analysis conducted by the Cholesterol Treatment Trialists’ (CTT) Collaborators.32 Since this meta-analysis included the major trials that enrolled elderly patients, individual publications of post hoc, elderly subgroups were, for the most part, not examined individually. The exception to this approach was a decision to report on the PROSPER13 and JUPITER28 trials separately, because PROSPER is the most representative of the elderly population and JUPITER reached the lowest LDL-C of primary prevention trials published to date and included a large elderly subgroup (n = 5,695).
Savarese et al40 evaluated the benefits of statins for older adults who did not have established cardiovascular disease. We did not report on this meta-analysis, as not all of the subjects that populated the meta-analysis were representative of a typical prevention population. For instance, in the Anglo-Scandinavian Cardiac Outcomes Trial lipid-lowering arm,41 14% of the subjects had had a previous stroke or transient ischemic attack. In the Antihypertensive and Lipid-Lowering Treatment Trial,42 16% of the population had a family history of premature coronary heart disease.
In addition, all the trials in the Savarese meta-analysis were also included in the CTT meta-analysis.32 The CTT reports on baseline risk using patient-level data stratified by age and risk, which may be more relevant to the question of primary prevention for older adults, as highlighted in our review.
PROSPER (Prospective Study of Pravastatin in the Elderly at Risk),13 a well-conducted, double-blind, randomized controlled trial with low probability of bias, compared pravastatin 40 mg and placebo. It was the only study that specifically enrolled older adults, with prespecified analysis of primary and secondary prevention subgroups. The primary prevention subgroup accounted for 56% of the 5,084 participants.
JUPITER (Justification for the Use of Statins in Prevention)28 compared rosuvastatin 20 mg and placebo in 17,802 participants. All had low-density lipoprotein cholesterol (LDL-C) levels below 3.4 mmol/L (130 mg/dL) and elevated levels of the inflammatory biomarker high-sensitivity C-reactive protein (hsCRP), ie, 2 mg/L or higher. Subsequently, Glynn et al performed a post hoc, exploratory subgroup analysis of elderly participants (N = 5,695).29
The JUPITER trial had several limitations.43,44 The planned follow-up period was 5 years, but the trial was stopped early at 1.9 years, after a statistically significant difference was detected in the primary composite outcome of reduction in all vascular events. Studies that are stopped early may exaggerate positive findings.45
Further, JUPITER’s patients were a select group, with normal LDL-C levels, elevated hsCRP values, and without diabetes. Of 90,000 patients screened, 72,000 (80%) did not meet the inclusion criteria and were not enrolled. This high rate of exclusion limits the generalizability of study findings beyond the shortcomings of post hoc subgroup analysis.
The meta-analysis performed by the CTT Collaborators32 used individual participant data from large-scale randomized trials of lipid-modifying treatment. This analysis was specific to people at low risk of vascular disease. In a supplementary appendix, the authors described the reduction in major vascular events for each 1.0 mmol/L decrease in LDL-C in three age categories: under age 60, ages 61 to 70, and over age 70.
The authors also stratified the results by risk category and provided information about those with a risk of major vascular events of less than 20%, which would be more representative of a purer primary prevention population.
For the elderly subgroup at low risk, the CTT Collaborators32 only reported a composite of major vascular events (coronary death, nonfatal myocardial infarction [MI], ischemic stroke, or revascularization) and did not describe individual outcomes, such as prevention of coronary heart disease.
Study results are based on postrandomization findings and therefore may be observational, not experimental.46
Studies of statins for secondary prevention of cardiovascular disease
The aim of secondary prevention is to reduce the risk of recurrent cardiovascular events in patients who already have cardiovascular disease.
To address the question of whether statins reduce cardiovascular risk, we reviewed:
PROSPER,13 which included a preplanned analysis of the secondary prevention population.
Afilalo et al,31,47 who performed a meta-analysis of the elderly subgroups of nine major secondary prevention studies (19,569 patients) using published and unpublished data.
To address the question of whether statins benefit individuals with heart failure, we found two relevant studies:
GISSI-HF (Gruppo Italiano per lo Studio della Sopravvivenza nell’Insufficienza Cardiaca Heart Failure)25 and CORONA (Controlled Rosuvastatin Multinational Trial in Heart Failure),26 which were large, international, well-conducted randomized controlled trials that examined statin use in heart failure.
To answer the question of whether statins benefit individuals after a stroke or transient ischemic attack, we found one relevant study:
SPARCL (Stroke Prevention by Aggressive Reduction in Cholesterol Levels),27 which evaluated the benefit of statins in older adults with a history of stroke or transient ischemic attack. It was a prospective, double-blind, placebo-controlled, international trial conducted at 205 centers. One to 6 months after their cerebrovascular event, patients were randomized to receive either atorvastatin 80 mg or placebo. Given the young age of patients in this trial (mean age 63), we also reviewed a post hoc subgroup analysis of the elderly patients in SPARCL (age > 65).30
HOW DID THE STUDY POPULATION COMPARE WITH THOSE WHO ARE FRAIL?
Frail older adults are almost always excluded from large-scale clinical trials,48 leading to uncertainty about whether the conclusions can be applied to those with advanced frailty.
Although age is an imperfect proxy measure of frailty,49 we consider the age of the study population as well as their comorbidities.
Participants in the studies we reviewed were generally younger and healthier than those who are frail, with mean ages of about 75 or less (Table 1).
PROSPER was the most representative study, as it specifically enrolled older adults, albeit without frailty,13 and excluded people with poor cognitive function as defined by a Mini Mental State Examination score less than 24.
JUPITER enrolled a select population, as described above. The median age in the elderly subgroup was 74 (interquartile range 72–78).29
The Afilalo et al31 meta-analysis primarily included studies of young-elderly patients, with a mean age of less than 70. PROSPER13 was an exception.
The GISSI-HF study,25 which examined the benefit of statins in heart failure, described their study population as frail, although the mean age was only 68. Compared with those in GISSI-HF, the CORONA patients26 with heart failure were older (mean age 73) and had more severe heart failure. Accordingly, it is possible that many of the CORONA participants were frail.
ARE STUDY OUTCOMES CLINICALLY RELEVANT TO THOSE WHO ARE FRAIL?
Because baseline cardiovascular risk increases with age, the elderly should, in theory, experience greater absolute benefit from lipid-lowering. However, there is uncertainty about whether this is true in practice.
Some, but not all, epidemiologic studies show a weaker relationship between cholesterol levels and cardiovascular morbidity and mortality rates in older compared to younger adults.50,51 This may be because those with high cholesterol levels die before they get old (time-related bias), or because those with life-threatening illness may have lower cholesterol levels.50 In addition, classic risk factors such as age, sex, systolic blood pressure, cholesterol values, diabetes, smoking, and left ventricular hypertrophy on electrocardiography may have less power to predict cardiovascular risk among older patients.52
The goal of treatment in frailty is to prevent further disability or improve quality of life. Therefore, meaningful outcomes for lipid-lowering therapy should include symptomatic nonfatal MI and its associated morbidity (eg, heart failure and persistent angina) or symptomatic nonfatal stroke leading to disability. Outcomes without sustained clinical impact, such as transient ischemic attack, nondisabling stroke, or silent MI, while potentially important in other populations, are less relevant in severe frailty. Notably, in many statin studies, outcomes include asymptomatic heart disease (eg, silent MI and “suspected events”) and nondisabling stroke (eg, mild stroke, transient ischemic attack). When symptomatic outcomes are not reported separately, the impact of the reported benefit on quality of life and function is uncertain.
The outcome of all-cause mortality is generally recognized as a gold standard for determining treatment benefit. However, since advanced frailty is characterized by multiple competing causes for mortality, a reduction in all-cause mortality that is achieved by addressing a single issue in nonfrail populations may not extend to the frail.
To more fully understand the impact of lipid-lowering therapy on quality of life and function, we examined the following questions:
Do statins as primary prevention reduce symptomatic heart disease?
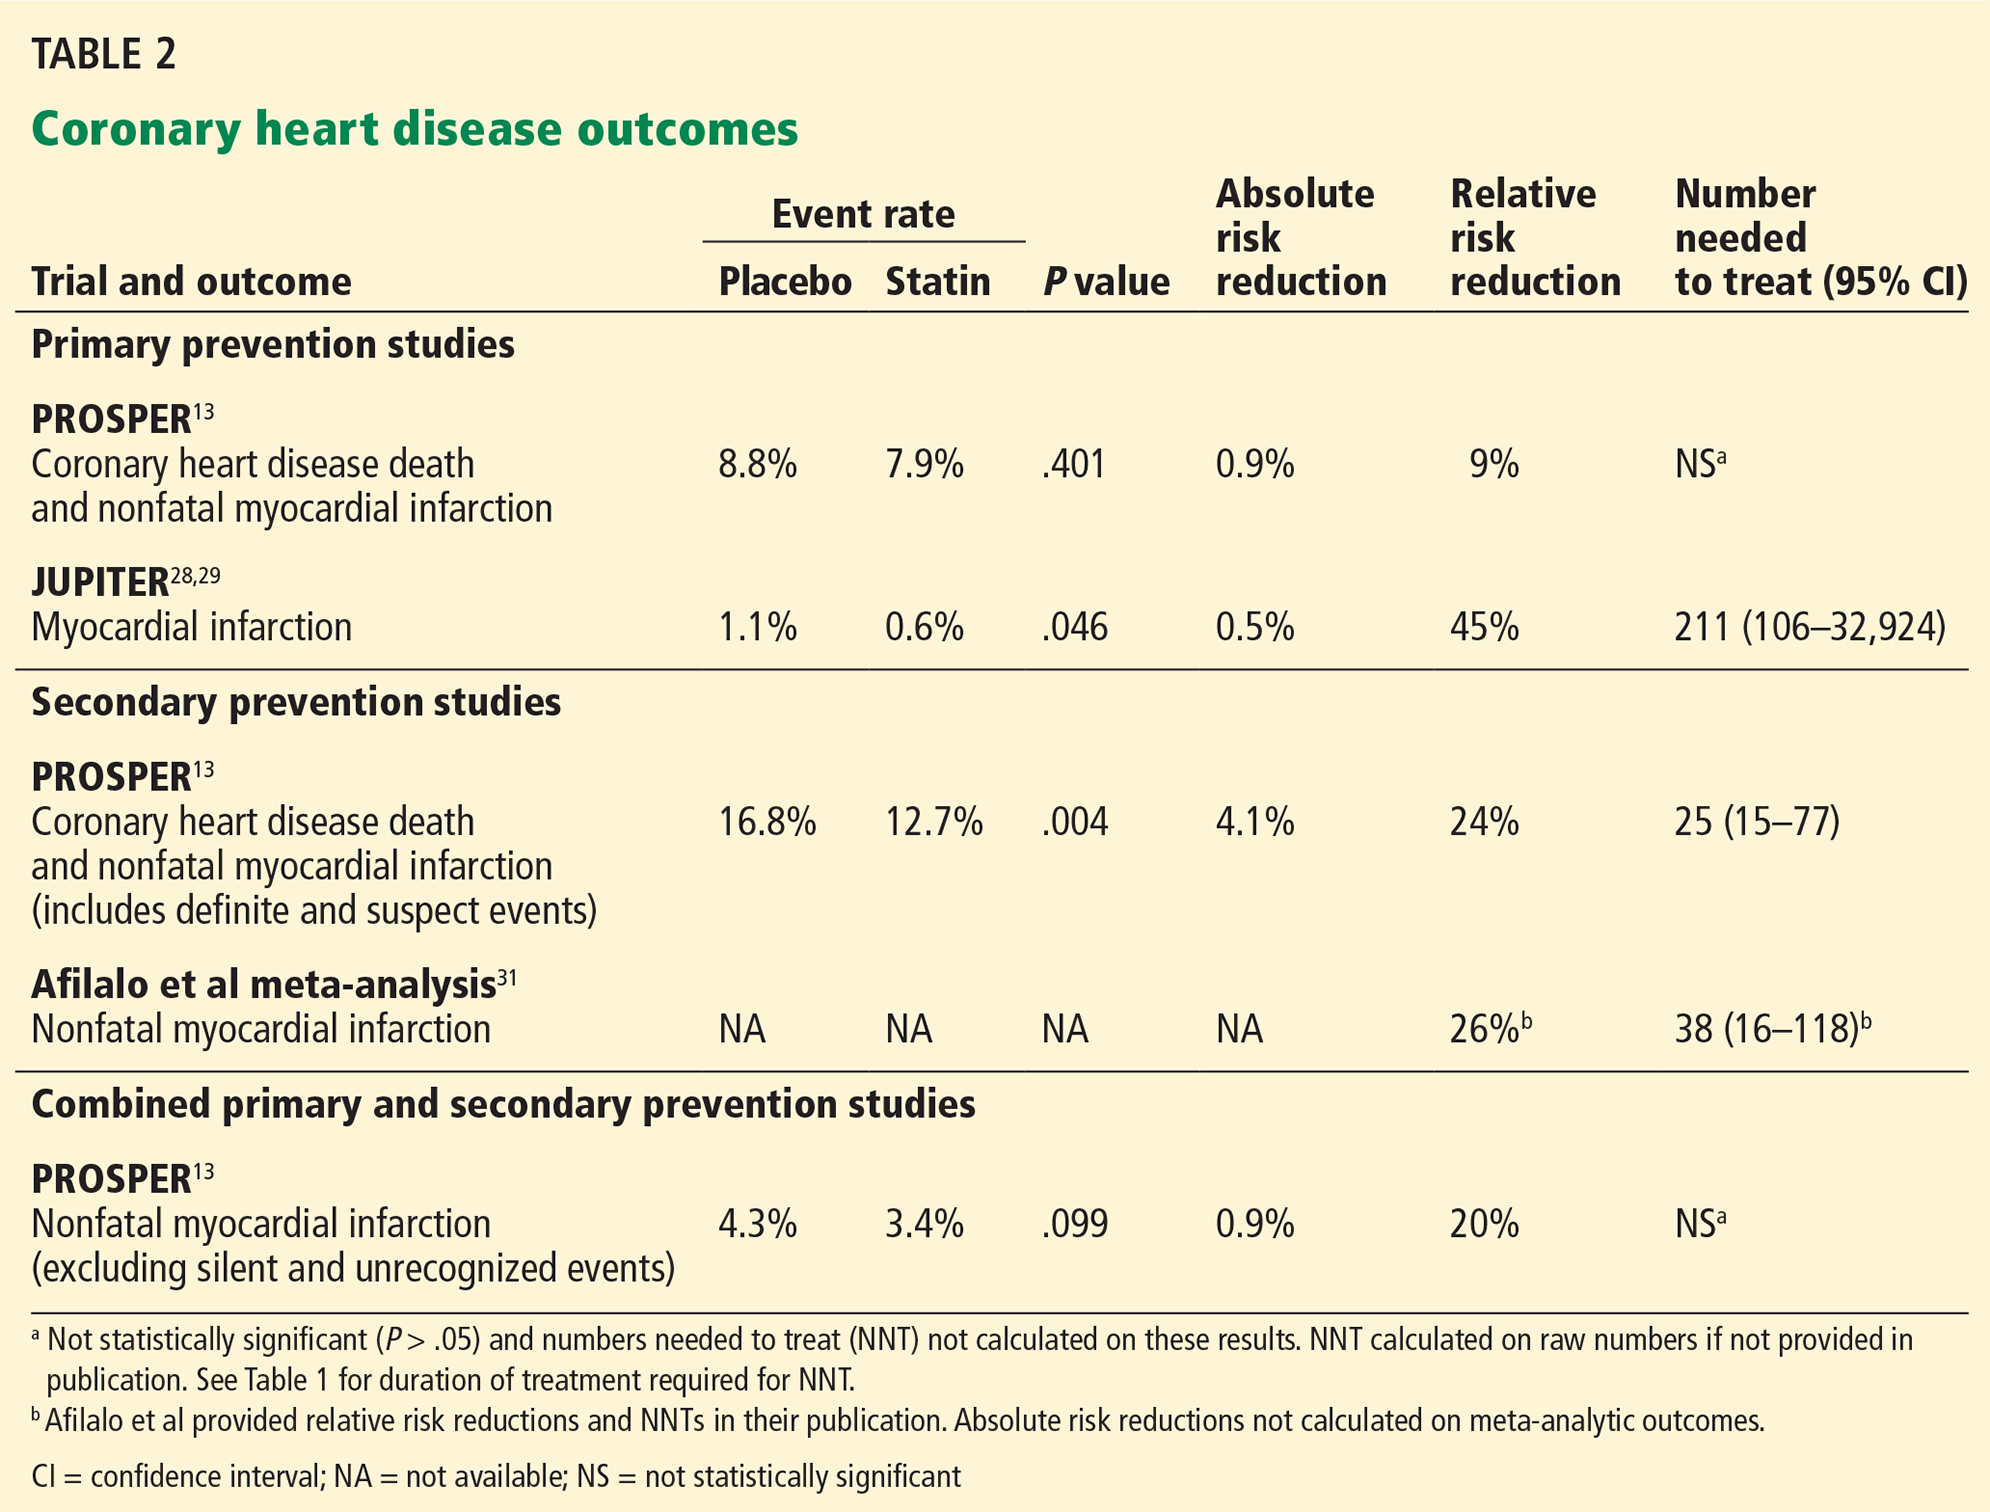
Outcomes for coronary heart disease from PROSPER and JUPITER are summarized in Table 2.
PROSPER. In the PROSPER primary prevention group,13 statin therapy did not reduce the combined outcome of coronary heart disease death and nonfatal MI.
The JUPITER trial demonstrated a statistically significant benefit for preventing MI in the elderly subpopulation (ages 70–97),29 but the number needed to treat was high (211 for 2 years), with a wide confidence interval (CI) (95% CI 106–32,924). The trial did not adequately differentiate between symptomatic and asymptomatic events, making it difficult to determine outcome relevance. Also, due to the methodologic limitations of JUPITER as described above, its results should be interpreted with caution.43,44
The CTT Collaborators32 did not report individual outcomes (eg, coronary heart disease) for the elderly low-risk subgroup and, therefore, this meta-analysis does not answer the question of whether statins reduce symptomatic heart disease in primary prevention populations.
Taken together, these findings do not provide convincing evidence that statin therapy as primary prevention reduces the incidence of symptomatic heart disease for severely frail older adults.
Do statins as secondary prevention reduce symptomatic heart disease?
Most studies defined secondary prevention narrowly as treatment for patients with established coronary artery disease. For instance, in the Afilalo et al meta-analysis,31 the small number of studies that included individuals with other forms of vascular disease (such as peripheral vascular disease) enrolled few participants with noncardiac conditions (eg, 29% in PROSPER13 and 13% in the Heart Protection Study20).
Therefore, any evidence of benefit for secondary prevention demonstrated in these studies is most applicable to patients with coronary heart disease, with less certainty for those with other forms of cardiovascular disease.
In PROSPER,13 the secondary prevention group experienced benefit in the combined outcome of coronary heart disease death or nonfatal MI. In the treatment group, 12.7% experienced this outcome compared with 16.8% with placebo, an absolute risk reduction of 4.1% in 3 years (P = .004, number needed to treat 25, 95% CI 15–77). This measure includes coronary heart disease death, an outcome that may not be generalizable to those who are frail. In addition, the outcome of nonfatal MI includes both symptomatic and suspected events. As such, there is uncertainty whether the realized benefit is clinically relevant to frail older adults.
The Afilalo et al meta-analysis31 showed that the number needed to treat to prevent one nonfatal MI was 38 (95% CI 16–118) over 5 years (Table 2). However, this outcome included both symptomatic and asymptomatic (silent) events.
Based on the available data, we conclude that it is not possible to determine whether statins reduce symptomatic heart disease as secondary prevention for older adults who are frail.
Do statins reduce heart disease in combined populations?
In the combined primary and secondary population from PROSPER,13 pravastatin decreased the risk of nonfatal symptomatic MI from 4.3% in the placebo group to 3.4%, a relatively small reduction in absolute risk (0.9%) and not statistically significant by our chi-square calculation (P = .099).
Do statins prevent a first symptomatic stroke in people with or without preexisting cardiovascular disease?
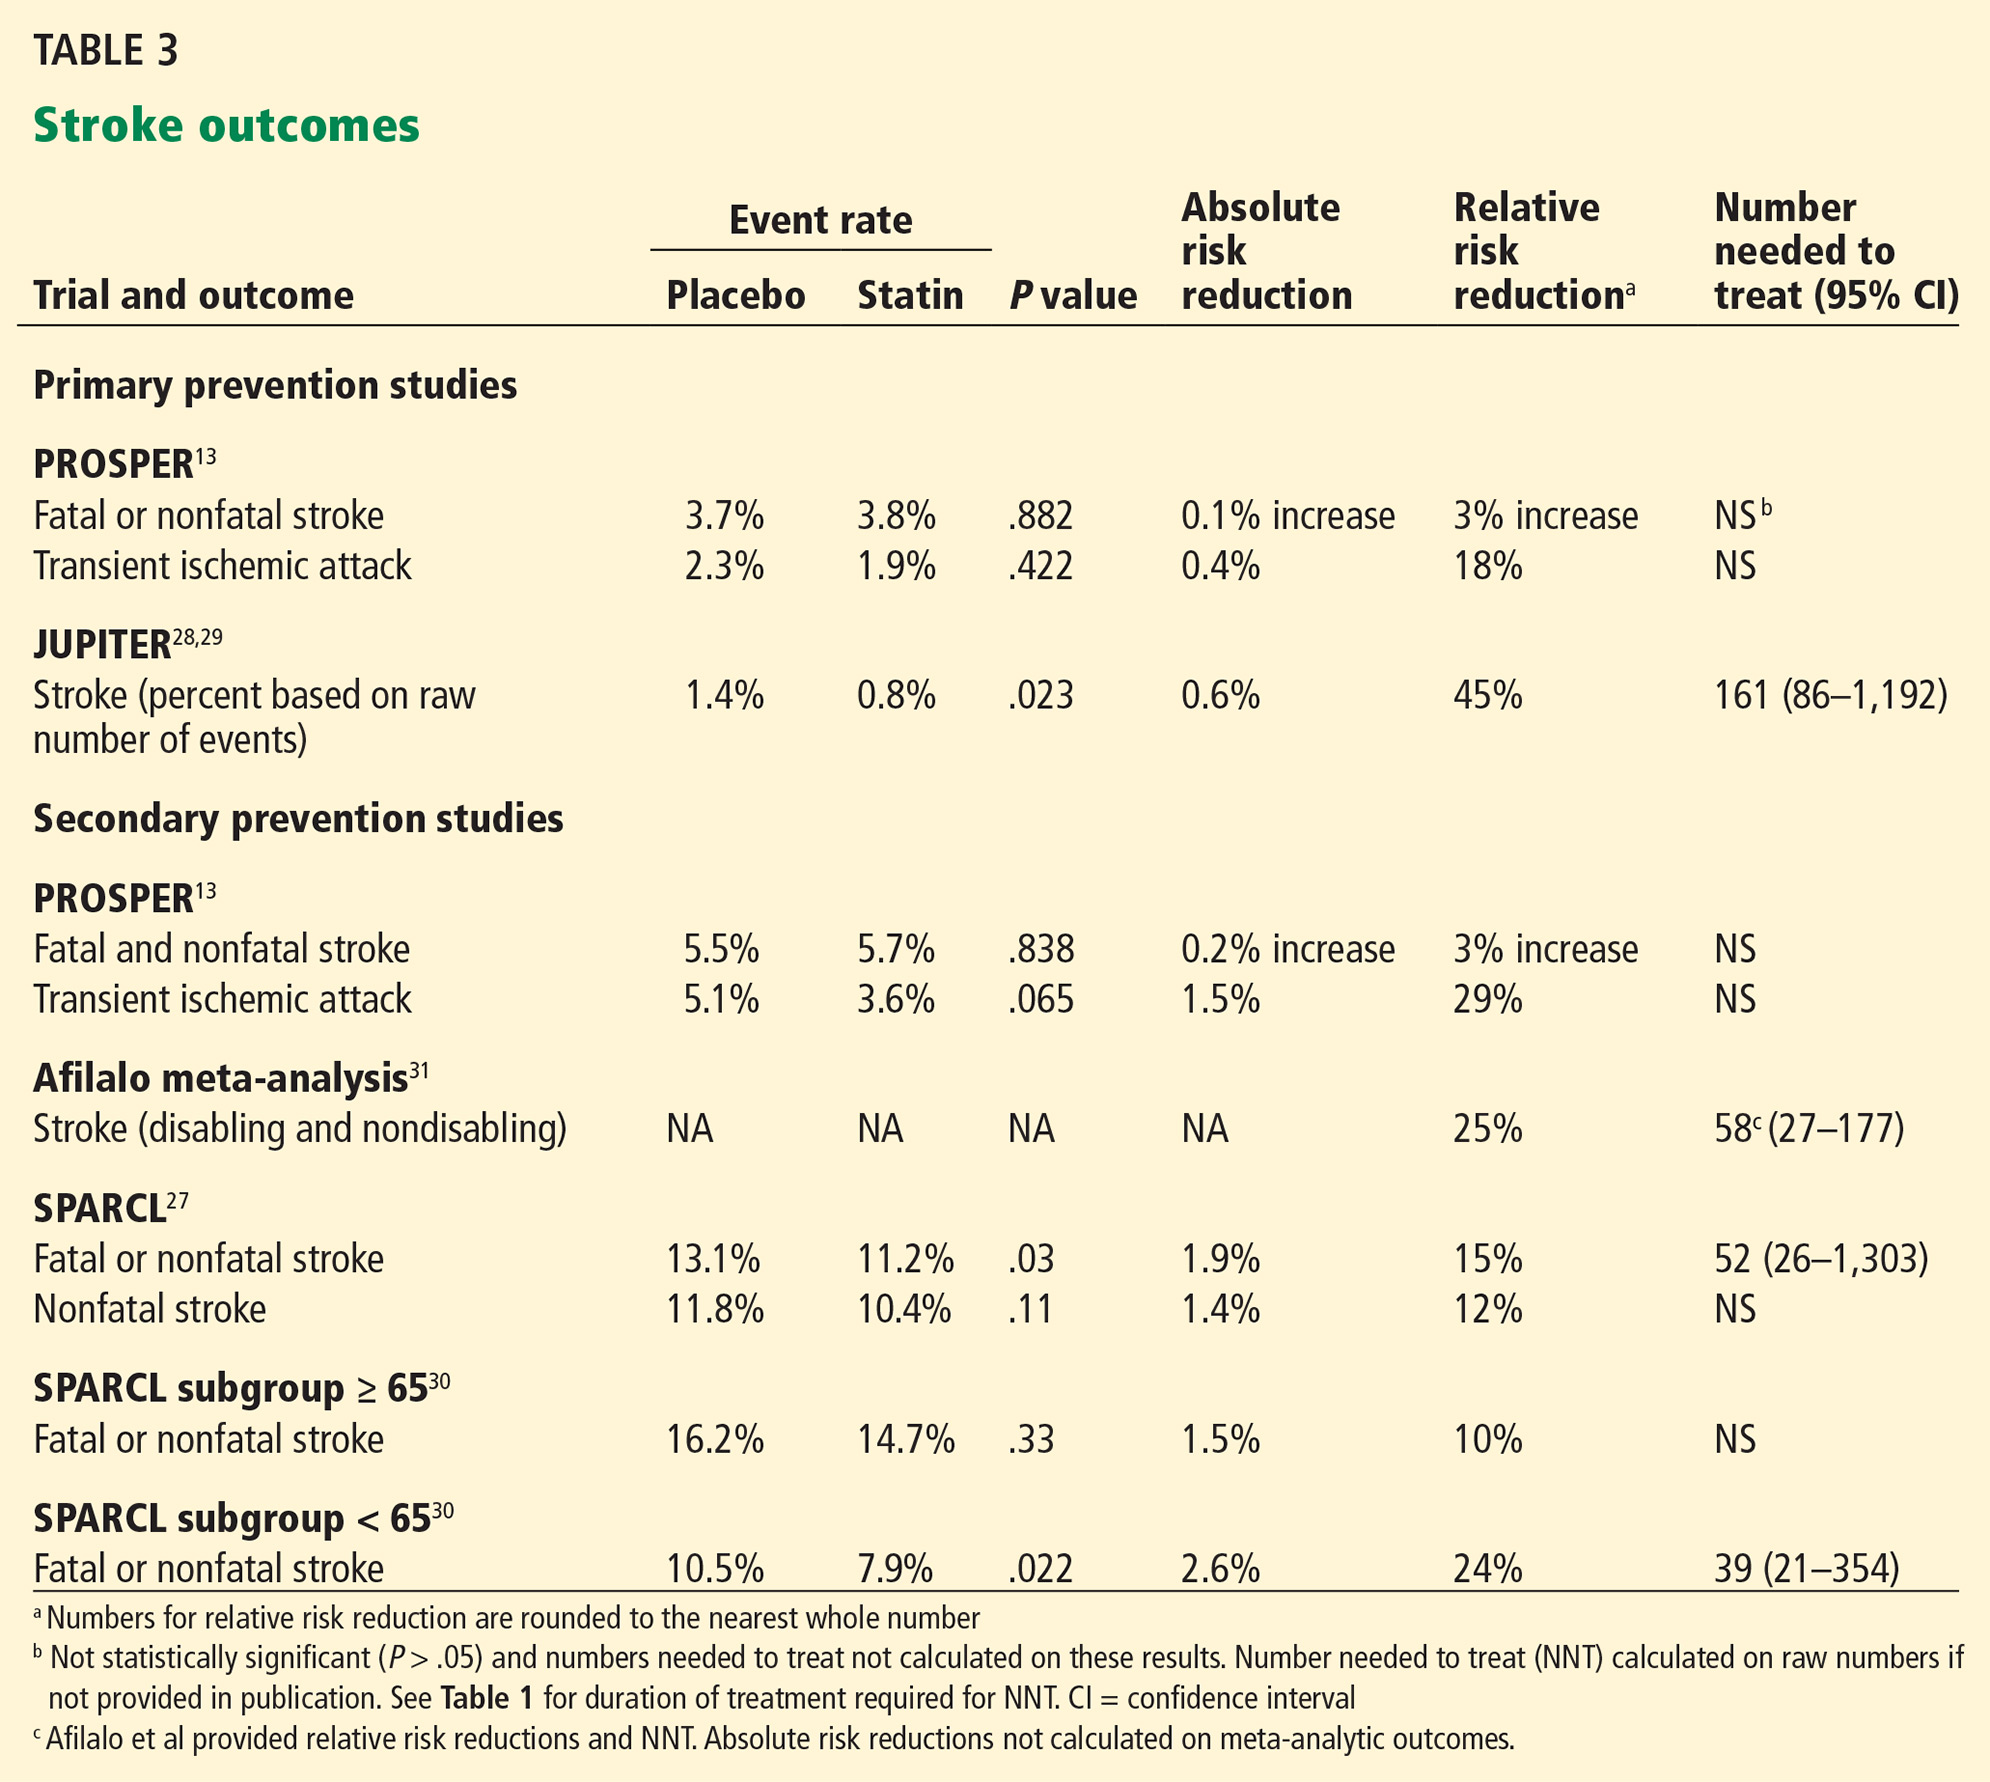
Preventing strokes that cause functional decline is an important outcome for the frail elderly. Stroke outcomes from PROSPER,13 JUPITER,29 and the Afilalo et al meta-analysis31 are summarized in Table 3.
For primary prevention:
In PROSPER (primary prevention),13 there was no statistically significant benefit in the combined outcome of fatal and nonfatal stroke or the single outcome of transient ischemic attack after 3.2 years.
JUPITER,29 in contrast, found that rosuvastatin 20 mg reduced strokes in primary prevention, but the absolute benefit was small. In 2 years, 0.8% of the treatment group had strokes, compared with 1.4% with placebo, an absolute risk reduction of 0.6% (P = .023, number needed to treat 161, 95% CI 86–1,192).
Neither PROSPER nor JUPITER differentiated between disabling and nondisabling strokes.
For secondary prevention:
In PROSPER (secondary prevention),13 there was no statistically significant benefit in the combined outcome of fatal and nonfatal stroke or the single outcome of transient ischemic attack after 3.2 years.
The Afilalo et al secondary prevention meta-analysis demonstrated a 25% relative reduction in stroke (relative risk 0.75, 95% CI 0.56–0.94, number needed to treat 58, 95% CI 27–177).31
Notably, the stroke outcome in Afilalo included both disabling and nondisabling strokes. For example, in the Heart Protection Study,20 the largest study in the Afilalo et al meta-analysis, approximately 50% of nonfatal, classifiable strokes in the overall study population (ie, both younger and older patients) were not disabling. Including disabling and nondisabling strokes in a composite outcome confounds the clinical meaningfulness of these findings in frailty, as the number needed to treat to prevent one disabling stroke cannot be calculated from the data provided.
Do statins prevent a second (symptomatic) stroke in people with a previous stroke?
SPARCL27 (Table 3) examined the question of whether statins decrease the risk of recurrent ischemic stroke for patients with a prior history of stroke or transient ischemic attack. There was a statistically significant reduction in the primary composite outcome of fatal and nonfatal stroke, with 11.2% of the treatment group and 13.1% of the placebo group experiencing this outcome, an absolute risk reduction of 1.9% at 5 years (P = .03; number needed to treat 52, 95% CI 26–1,303). However, the difference in nonfatal stroke, which is the outcome of interest for frailty (since mortality has uncertain relevance), was not statistically significant (10.4% with treatment vs 11.8% with placebo, P =.11).
An exploratory subgroup analysis of SPARCL patients based on age30 showed a smaller, nonsignificant reduction in the primary end point of fatal and nonfatal stroke in the group over age 65 (relative risk 0.90, 95% confidence interval 0.73–1.11, P = .33) compared with the younger group (age < 65) (relative risk 0.74, 95% CI 0.57–0.96, P = .02).
The applicability of these results to the frail elderly is uncertain, since the subgroup analysis was not powered to determine outcomes based on age stratification and there were differences between groups in characteristics such as blood pressure and smoking status. In addition, the outcome of interest, nonfatal stroke, is not provided for the elderly subgroup.
In conclusion, in both primary and secondary prevention populations, the evidence that statins reduce nonfatal, symptomatic stroke rates for older adults is uncertain.
Do statins decrease all-cause mortality for primary or secondary prevention?
Due to competing risks for death, the outcome of mortality may not be relevant to those who are frail; however, studies showed the following:
For primary prevention, there was no decrease in mortality in PROSPER13 or in the elderly subgroup of JUPITER.29
For secondary prevention, an analysis of PROSPER trial data by Afilalo et al31 showed a significant 18% decrease in all-cause mortality (relative risk 0.82, 95% CI 0.69–0.98) using pravastatin 40 mg.
A decrease in all-cause mortality with statins was also reported in the pooled result of the Afilalo et al meta-analysis.31
What are the reported composite outcomes for primary and secondary prevention?
While we were most interested in the symptomatic outcomes described above, we recognize that the small numbers of events make it difficult to draw firm conclusions. Therefore, we also considered composite primary outcomes, even though most included multiple measures that have varying associations with disability and relevancy to frail older adults.
For primary prevention, in the PROSPER preplanned subgroup analysis,13 there was no statistical benefit for any outcome, including the primary composite measure. In contrast, the elderly subpopulation in the JUPITER trial28 showed a treatment benefit with rosuvastatin 20 mg compared with placebo for the primary composite outcome of MI, stroke, cardiovascular death, hospitalization for unstable angina, or revascularization. The number needed to treat for 2 years was 62 (95% CI 39–148).
In the CTT meta-analysis,32 patients at all levels of baseline risk showed benefit up to age 70. However, there was no statistically significant benefit in the composite primary outcome of coronary deaths, nonfatal myocardial infarction, ischemic stroke, or revascularization in the population most representative of elderly primary prevention—those who were more than 70 years old with a 5-year baseline risk of less than 20%.
For secondary prevention, in PROSPER,13 the subpopulation of patients treated for secondary prevention experienced benefit in the primary composite outcome of coronary heart disease death, nonfatal MI, or fatal or nonfatal stroke, achieving a 4% absolute risk reduction with a number needed to treat of 23 (95% CI 14–81) over 3 years.
Do statins decrease disability?
PROSPER was the only study that reported on disability. Compared with placebo, pravastatin did not decrease disability in the total population as measured by basic and instrumental activities of daily living scales.
Do statins help patients with heart failure?
Neither GISSI-HF25 nor CORONA26 found significant benefit from rosuvastatin 10 mg, despite LDL-C lowering of 27% in GISSI-HF and 45% in CORONA.
Do ezetimibe or other nonstatin lipid-lowering agents improve outcomes?
There is no definitive evidence that ezetimibe provides clinically meaningful benefit as a single agent.
For combination therapy, the IMPROVE-IT (Improved Reduction of Outcomes: Vytorin Efficacy International Trial)53 showed that adding ezetimibe 10 mg to simvastatin 40 mg after an acute coronary syndrome reduced the risk of nonfatal myocardial infarction compared with simvastatin monotherapy (event rate 12.8% vs 14.4%; hazard ratio 0.87, 95% CI 0.80–0.95; P = .002) for a population with a mean age of 64. The risk of any stroke was also reduced; strokes occurred in 4.2% of those receiving combination therapy vs 4.8% with monotherapy (hazard ratio 0.86, 95% CI 0.73–1.00, P = .05). After a median of 6 years, 42% of patients in each group had discontinued treatment. Given the very specific clinical scenario of acute coronary syndrome and the young age of the patients in this trial, we do not think that this study justifies the use of ezetimibe for severely frail older adults.
There is no evidence that other combinations (ie, a statin plus another lipid-lowering drug) improve clinical outcomes for either primary or secondary prevention in any population.54
WILL FRAIL PATIENTS LIVE LONG ENOUGH TO BENEFIT?
It is often difficult to determine the number of years that are needed to achieve benefit, as most trials do not provide a statistical analysis of varying time frames.
The PROSPER trial13 lasted 3.2 years. From the Kaplan-Meier curves in PROSPER, we estimate that it took about 1.5 years to achieve a 1% absolute risk reduction and 2.5 years for a 2% absolute risk reduction in coronary heart disease death and nonfatal MI in the combined primary and secondary groups.
JUPITER28 was stopped early at 1.9 years. The Afilalo et al meta-analysis31 was based on follow-up over 4.9 years.
IMPROVE-IT53 reported event rates at 7 years. The authors note that benefit in the primary composite outcome appeared to emerge at 1 year, although no statistical support is given for this statement and divergence in the Kaplan-Meier curves is not visually apparent.
The duration of other studies ranged between 2.7 and 4.9 years (Table 1).26–28
It has been suggested that statins should be considered for elderly patients who have a life expectancy of at least 5 years.3 However, many older adults have already been taking statins for many years, which makes it difficult to interpret the available timeframe evidence.
In a multicenter, unblinded, randomized trial,55 statins were either stopped or continued in older adults who had a short life expectancy and a median survival of approximately 7 months. Causes of death were evenly divided between cancer and noncancer diagnoses, and 22% of the patients were cognitively impaired. Discontinuing statin therapy did not increase mortality or cardiovascular events within 60 days. Nevertheless, stopping statin therapy did not achieve noninferiority for the primary end point, the proportion of participants who died within 60 days. Statin discontinuation was associated with improved quality of life, although the study was not blinded, which could have influenced results.
HAVE THE HARMS BEEN SUFFICIENTLY CONSIDERED?
Frail older adults commonly take multiple medications and are more vulnerable to adverse events.56
Many statins require dose reduction with severe renal impairment (creatinine clearance < 30 mL/min/1.73 m2), which would be a common consideration in severely frail older adults.
Myopathy
Myopathy, which includes myalgias and muscle weakness, is a statin-related adverse event that can impair quality of life. Myopathy typically develops within the first 6 months but can occur at any time during statin treatment.57 When muscle-related adverse effects occur, they may affect the elderly more significantly, particularly their ability to perform activities of daily living, rise from a chair, or mobilize independently. Another concern is that older adults with dementia may not be able to accurately report muscle-related symptoms.
It is difficult to ascertain the true prevalence of myopathy, especially in advanced age and frailty. Randomized controlled trials report incidence rates of 1.5% to 5%, which is comparable to placebo.57,58 However, inconsistent definitions of myopathy and exclusion of subjects with previous statin intolerance or adverse effects during run-in periods limit interpretability.57 Clinical experience suggests that muscle complaints may be relatively common.59–61
Advanced age, female sex, low body mass index, and multisystem disease are all associated with frailty and have also been described as risk factors for statin-associated muscle syndromes.61 Physiologic changes associated with frailty, such as reduced muscle strength, decreased lean body mass, impaired functional mobility, decreased reserve capacity, and altered drug metabolism may increase the risk and severity of myopathy.62
Adverse cognitive events
Meta-analyses of randomized clinical trials and narrative reviews find no definitive relationship between statin therapy and adverse cognitive events.63–67 Nevertheless, there have been case reports of memory loss associated with the use of statins, and the US Food and Drug Administration has issued a warning that statins have been associated with memory loss and confusion.68
It may be difficult to determine whether a statin is causing or aggravating cognitive symptoms among individuals with dementia without a trial withdrawal of the drug.
OUR RECOMMENDATIONS
The recommendations below are intended for adults with severe or very severe frailty (ie, a score of 7 or 8 on the Clinical Frailty Scale11 or FACT5 and therefore apply to most older adults living in long-term care facilities.
Primary prevention
There is no reason to prescribe or continue statins for primary prevention, as it is unlikely that they would provide benefit for outcomes that are relevant in this population.
Secondary prevention
Statin treatment is probably not necessary for secondary prevention in those with severe frailty, although there may be extenuating circumstances that justify statin use.
Heart failure
There is no reason to start or continue statins for heart failure, as there is insufficient evidence that they are effective for this indication in any population.
Ezetimibe
There is no evidence that ezetimibe reduces cardiovascular events in any population when used as monotherapy. For a select population with acute coronary syndromes, ezetimibe has a modest effect. Given the very specific clinical scenario of acute coronary syndrome, we do not think that the available evidence justifies the use of ezetimibe for severely frail older adults.
Agents other than ezetimibe combined with statins
There is no reason to start or continue other lipid-lowering drugs in conjunction with statins.
Statin dosing
As statin adverse effects have the potential to increase with advancing age and frailty, lower doses may be appropriate.68
Adverse events
Consider stopping statins on a trial basis if there is concern regarding myopathy, drug interactions, or other adverse effects.
BOTTOM LINE: DO STATINS IMPROVE QUALITY OF LIFE OR FUNCTION?
In primary prevention for older adults, there is doubt that statins prevent cardiovascular disease and stroke-related events because the main study involving the elderly did not show a benefit in the primary prevention subgroup.13 Additionally, there is no conclusive evidence that statin treatment decreases mortality in primary prevention.13,29
There is insufficient information to determine whether the frail elderly should receive statins for secondary prevention. Although there is evidence that treatment decreases measures of coronary heart disease and stroke, it is unclear whether it improves quality of life or function for those who are frail. To answer this question, we need more information about whether reported outcomes (such as stroke and MI) are associated with disability, which is not provided in many of the studies we reviewed. When disability was specifically considered in the PROSPER trial for the combined population of primary and secondary prevention, treatment with statins had no impact on basic and instrumental activities of daily living.
Some experts may not agree with our interpretation of the complex evidence presented in this article. Others may ask, “What is the harm in using statins, even if there is no definitive benefit?” However, the harms associated with statin therapy for the frail are poorly defined. In the face of these uncertainties and in the absence of definitive improvement in quality of life, we believe that “less is more” in the context of severe frailty.69
The cost of medications should also be considered, especially in long-term care facilities, where there is an added expense of drug administration that diverts human resources away from interactions that are more congruent with respecting the lifestage of frailty.
Careful review of evidence before applying clinical practice guidelines to those who are frail should become the norm. When considering treatment of frail patients, the five questions described in this review shed light on the applicability of clinical trial evidence. Therapies that are highly effective in healthier populations may be less effective when individuals are severely frail. Accordingly, we propose that medications should only be used if they improve quality of life or function.
- Ontario Pharmacy Research Collaboration. Deprescribing guidelines for the elderly. www.open-pharmacy-research.ca/research-projects/emerging-services/deprescribing-guidelines. Accessed December 28, 2016.
- Scott IA, Hilmer SN, Reeve E, et al. Reducing inappropriate polypharmacy: the process of deprescribing. JAMA Intern Med 2015; 175:827–834.
- O’Mahony D, O’Sullivan D, Byrne S, O’Connor MN, Ryan C, Gallagher P. STOPP/START criteria for potentially inappropriate prescribing in older people: version 2. Age Ageing 2015; 44:213–218.
- American Geriatrics Society 2012 Beers Criteria Update Expert Panel. American Geriatrics Society updated Beers Criteria for potentially inappropriate medication use in older adults. J Am Geriatr Soc 2012; 60:616–631.
- Mallery LH, Allen M, Fleming I, et al. Promoting higher blood pressure targets for frail older adults: a consensus guideline from Canada. Cleve Clin J Med 2014; 81:427–437.
- Mallery LH, Ransom T, Steeves B, Cook B, Dunbar P, Moorhouse P. Evidence-informed guidelines for treating frail older adults with type 2 diabetes: from the Diabetes Care Program of Nova Scotia (DCPNS) and the Palliative and Therapeutic Harmonization (PATH) program. J Am Med Dir Assoc 2013; 14:801–808.
- Moorhouse P, Mallery L. Palliative and therapeutic harmonization: a model for appropriate decision-making in frail older adults. J Am Geriatr Soc 2012; 60:2326–2332.
- Fried LP, Tangen CM, Walston J, et al; Cardiovascular Health Study Collaborative Research Group. Frailty in older adults: evidence for a phenotype. J Gerontol A Biol Sci Med Sci 2001; 56:M146–M156.
- Morley JE, Malmstrom TK, Miller DK. A simple frailty questionnaire (FRAIL) predicts outcomes in middle aged African Americans. J Nutr Health Aging 2012; 16:601–608.
- Rockwood K, Song Z, MacKnight C, et al. A global clinical measure of fitness and frailty in elderly people. CMAJ 2005; 173:489–495.
- Morley JE, Vellas B, van Kan GA, et al. Frailty consensus: a call to action. J Am Med Dir Assoc 2013; 14:392–397.
- Tricoci P, Allen JM, Kramer JM, Califf RM, Smith SC Jr. Scientific evidence underlying the ACC/AHA clinical practice guidelines. JAMA 2009; 301:831–841.
- Shepherd J, Blauw GJ, Murphy MB, et al; PROSPER study group. PROspective Study of Pravastatin in the Elderly at Risk. Pravastatin in elderly individuals at risk of vascular disease (PROSPER): a randomised controlled trial. Lancet 2002; 360:1623–1630.
- Randomised trial of cholesterol lowering in 4444 patients with coronary heart disease: the Scandinavian Simvastatin Survival Study (4S). Lancet 1994; 344:1383–1389.
- Miettien TA, Pyorala K, Olsson AG, et al. Cholesterol-lowering therapy in women and elderly patients with myocardial infarction or angina pectoris: findings from the Scandinavian Simvastatin Study Group (4S). Circulation 1997; 96:4211–4218.
- Lewis SJ, Moye LA, Sacks FM, et al. Effect of pravastatin on cardiovascular events in older patients with myocardial infarction and cholesterol levels in the average range. Results of the Cholesterol and Recurrent Events (CARE) trial. Ann Intern Med 1998; 129:681–689.
- Hunt D, Young P, Simes J, et al. Benefits of pravastatin on cardiovascular events and mortality in older patients with coronary heart disease are equal to or exceed those seen in younger patients: results from the LIPID trial. Ann Intern Med 2001; 134:931–940.
- Prevention of cardiovascular events and death with pravastatin in patients with coronary heart disease and a broad range of initial cholesterol levels. The Long-Term Intervention with Pravastatin in Ischaemic Disease (LIPID) Study Group. N Engl J Med 1998; 339:1349–1357.
- Heart Protection Study Collaborative Group. The effects of cholesterol lowering with simvastatin on cause-specific mortality and on cancer incidence in 20,536 high-risk people: a randomized placebo-controlled trial. BMC Med 2005; 3:6.
- Heart Protection Study Collaborative Group. MRC/BHF Heart Protection Study of cholesterol lowering with simvastatin in 20,536 high-risk individuals: a randomized placebo-controlled trial. Lancet 2002; 360:7–22.
- Pitt B, Mancini GB, Ellis SG, Rosman HS, Park JS, McGovern ME. Pravastatin limitation of atherosclerosis in the coronary arteries (PLAC 1): reduction in atherosclerosis progression and clinical events. PLAC 1 investigation. J Am Coll Cardiol 1995; 26:1133–1139.
- Jukema JW, Bruschke AV, van Boven AJ, et al. Effects of lipid lowering by pravastatin on progression and regression of coronary artery disease in symptomatic men with normal to moderately elevated serum cholesterol levels. The Regression Growth Evaluation Statin Study (REGRESS). Circulation 1995; 91:2528–2540.
- Serruys PW, Foley DP, Jackson G, et al. A randomized placebo-controlled trial of fluvastatin for prevention of restenosis after successful coronary balloon angioplasty; final results of the fluvastatin angiographic restenosis (FLARE) trial. Eur Heart J 1999; 20:58–69.
- Serruys PW, de Feyter P, Macaya C, et al; Lescol Intervention Prevention Study (LIPS) Investigators. Fluvastatin for prevention of cardiac events following successful first percutaneous coronary intervention: a randomized controlled trial. JAMA 2002; 287:3215–3222.
- Tavazzi L, Maggioni AP, Marchioli R, et al; Gissi-HF Investigators. Effect of rosuvastatin in patients with chronic heart failure (the GISSI-HF trial): a randomized, double-blind, placebo-controlled trial. Lancet 2008; 372:1231–1239.
- Kjekshus J, Apatrei E, Barrios V, et al; CORONA Group. Rosuvastatin in older patients with systolic heart failure. N Engl J Med 2007; 357:2248–2261.
- Amarenco P, Bogousslavsky J, Callahan A, et al; Stroke Prevention by Aggressive Reduction in Cholesterol Levels (SPARCL) Investigators. High-dose atorvastatin after stroke or transient ischemic attack. N Engl J Med 2006; 355:549–559.
- Ridker PM, Danielson E, Fonseca FA, et al; JUPITER Study Group. Rosuvastatin to prevent vascular events in men and women with elevated C-reactive protein. N Engl J Med 2008; 359:2195–2207.
- Glynn RJ, Koenig W, Nordestgaard BG, Shepherd J, Ridker PM. Rosuvastatin for primary prevention in older persons with elevated C-reactive protein and low to average low-density lipoprotein cholesterol levels: exploratory analysis of a randomized trial. Ann Intern Med 2010; 152:488–496, W174.
- Chaturvedi S, Zivin J, Breazna A, et al; SPARCL Investigators. Effect of atorvastatin in elderly patients with a recent stroke or transient ischemic attack. Neurology 2009; 72:688–694.
- Afilalo J, Duque G, Steele R, Jukema JW, de Craen AJ, Eisenberg MJ. Statins for secondary prevention in elderly patients: a hierarchical bayesian meta-analysis. J Am Coll Cardiol 2008; 51:37–45.
- Cholesterol Treatment Trialists’ (CTT) Collaborators; Mihaylova B, Emberson J, Blackwell L, et al. The effects of lowering LDL cholesterol with statin therapy in people at low risk of vascular disease: meta-analysis of individual data from 27 randomised trials. Lancet 2012; 380:581– 590.
- Sacks FM, Pfeffer MA, Moye L, et al. Rationale and design of a secondary prevention trial of lowering normal plasma cholesterol levels after acute myocardial infarction: the Cholesterol and Recurrent Events (CARE). Am J Cardiol 1991; 68:1436–1446.
- Armitage J, Collins R. Need for large scale randomised evidence about lowering LDL cholesterol in people with diabetes mellitus: MRC/BHF Heart Protection Study and other major trials. Heart 2000; 84:357–360.
- Design features and baseline characteristics of the LIPID (Long-Term Intervention with Pravastatin in Ischemic Disease) study: a randomized trial in patients with previous acute myocardial infarction and/or unstable angina pectoris. Am J Cardiol 1995; 76:474–479.
- Shepherd J, Blauw GJ, Murphy MB, et al. The design of a prospective study of Pravastatin in the Elderly at Risk (PROSPER). Am J Cardiol 1999; 84:1192–1197.
- Amarenco P, Bogousslavsky J, Callahan AS, et al; SPARCL Investigators. Design and baseline characteristics of the stroke prevention by aggressive reduction in cholesterol levels (SPARCL) study. Cerebrovasc Dis 2003; 16:389–395.
- Interpretation of subgroup analyses and meta-regressions. In: Higgins JPT, Green S, editors. Cochrane Handbook for Systematic Reviews of Interventions Version 5.1.0. The Cochrane Collaboration, 2011. http://handbook.cochrane.org/chapter_9/9_6_6_interpretation_of_subgroup_analyses_and_meta_regressions.htm. Accessed December 5, 2016.
- Borenstein M, Higgins JP. Meta-analysis and subgroups. Prev Sci 2013; 14:134–143.
- Savarese G, Gotto AM Jr, Paolillo S, et al. Benefits of statins in elderly subjects without established cardiovascular disease: a meta-analysis. J Am Coll Cardiol 2013; 62:2090–2099.
- Sever PS, Dahlof B, Poulter NR, et al. Prevention of coronary and stroke events with atorvastatin in hypertensive patients who have average or lower-than-average cholesterol concentrations, in the Anglo-Scandinavian Cardiac Outcomes Trial—Lipid Lowering Arm (ASCOT-LLA): a multicentre randomised controlled trial. Lancet 2003; 361:1149–1158.
- The Antihypertensive and Lipid-Lowering Treatment to Prevent Heart Attack Trial. Major outcomes in moderately hypercholesterolemic, hypertensive patients randomized to pravastatin vs usual care: The Antihypertensive and Lipid-Lowering Treatment to Prevent Heart Attack Trial (ALLHAT-LLT). JAMA 2002; 288:2998–3007.
- de Longeril M, Salen P, Abramson J, et al. Cholesterol lowering, cardiovascular diseases, and the rosuvastatin-JUPITER controversy: a critical reappraisal. Arch Intern Med 2010; 170:1032–1036.
- Yusuf S, Lonn E, Bosch J. Lipid lowering for primary prevention. Lancet 2009: 373:1152–1155.
- Briel M, Bassler D, Wang AT, Guyatt GH, Montori VM. The dangers of stopping a trial too early. J Bone Joint Surg Am 2012; 94(suppl 1):56–60.
- Hayward RA, Krumholz HM. Three reasons to abandon low-density lipoprotein targets: an open letter to the Adult Treatment Panel IV of the National Institutes of Health. Circ Cardiovasc Qual Outcomes 2012; 5:2–5.
- Afilalo J, Duque G, Steele R, Jukema JW, de Craen AJ, Eisenberg MJ. Statins for secondary prevention in elderly patients: a hierarchical Bayesian meta-analysis. www.ncbi.nlm.nih.gov/pubmedhealth/PMH0026417. Accessed December 5, 2016.
- Holmes HM, Hayley DC, Alexander GC, Sachs GA. Reconsidering medication appropriateness for patients late in life. Arch Intern Med 2006; 166:605–609.
- Rockwood K, Mitnitski A. Frailty defined by deficit accumulation and geriatric medicine defined by frailty. Clin Geriatr Med 2011; 27:17–26.
- Petersen LK, Christensen K, Kragstrup J. Lipid-lowering treatment to the end? A review of observational studies and RCTs on cholesterol and mortality in 80+-year olds. Age Ageing 2010; 39:674–680.
- Psaty BM, Anderson M, Kronmal RA, et al. The association between lipid levels and the risks of incident myocardial infarction, stroke, and total mortality: the Cardiovascular Health Study. J Am Geriatr Soc 2004; 52:1639–1647.
- de Ruijter W, Westendorp RG, Assendelft WJ, et al. Use of Framingham risk score and new biomarkers to predict cardiovascular mortality in older people: population based observational cohort study. BMJ 2009; 338:a3083.
- Canon CP, Blazing MA, Giugliano RP, et al; IMPROVE-IT Investigators. Ezetimibe added to statin therapy after acute coronary syndromes. N Engl J Med 2015; 372:2387–2397.
- Anderson TJ, Gregoire J, Hegele RA, et al. 2012 update of the Canadian Cardiovascular Society guidelines for the diagnosis and treatment of dyslipidemia for the prevention of cardiovascular disease in the adult. Can J Cardiol 2013; 29:151–167.
- Kutner JS, Blatchford PJ, Taylor DH, et al. Safety and benefit of discontinuing statin therapy in the setting of advanced, life-limiting illness: a randomized clinical trial. JAMA Intern Med 2015; 175:691–700.
- Tinetti ME, Bogardus ST Jr, Agostini JV. Potential pitfalls of disease-specific guidelines for patients with multiple conditions. N Engl J Med 2004; 351:2870–2874.
- Rosenson RS. Current overview of statin-induced myopathy. Am J Med 2004; 116:408–416.
- Mancini GB, Baker S, Bergeron J, et al. Diagnosis, prevention, and management of statin adverse effects and intolerance: proceedings of a Canadian Working Group Consensus Conference. Can J Cardiol 2011; 27:635–662.
- Cohen JD, Brinton EA, Ito MK, Jacobson TA. Understanding Statin Use in America and Gaps in Patient Education (USAGE): an internet-based survey of 10,138 current and former statin users. J Clin Lipidol 2012; 6:208–215.
- Joy TR, Hegele RA. Narrative review: statin-related myopathy. Ann Intern Med 2009; 150:858–868.
- Talbert RL. Safety issues with statin therapy. J Am Pharm Assoc (2003) 2006; 46:479–490.
- Sewright KA, Clarkson PM, Thompson PD. Statin myopathy: incidence, risk factors, and pathophysiology. Curr Atheroscler Rep 2007; 9:389–396.
- Ott BR, Daiello LA, Dahabreh IJ, et al. Do statins impair cognition? A systematic review and meta-analysis of randomized controlled trials. J Gen Intern Med 2015; 30:348–358.
- Mancini GB, Tashakkor AY, Baker S, et al. Diagnosis, prevention and management of statin adverse effects and intolerance: Canadian Working Group Consensus update. Can J Cardiol 2013: 29:1553–1568.
- Rojas-Fernandez CH, Cameron JC. Is statin-associated cognitive impairment clinically relevant? A narrative review and clinical recommendations. Ann Pharmacother 2012; 46:549–557.
- McGuinness B, O’Hare J, Craig D, Bullock R, Malouf R, Passmore P. Cochrane review on ‘Statins for the treatment of dementia’. Int J Geriatr Psychiatry 2013; 28:119–126.
- Pandey RD, Gupta PP, Jha D, Kumar S. Role of statins in Alzheimer’s disease: a retrospective meta-analysis for commonly investigated clinical parameters in RCTs. Int J Neurosci 2013; 123:521–525.
- Food and Drug Administration (FDA). FDA drug safety communication: important safety label changes to cholesterol-lowering statin drugs. www.fda.gov/drugs/ drugsafety/ucm293101.htm. Accessed December 5, 2016.
- Garfinkel D, Mangin D. Feasibility study of a systematic approach for discontinuation of multiple medications in older adults: addressing polypharmacy. Arch Intern Med 2010; 170:1648–1654.
Frail elderly patients are at high risk of adverse clinical outcomes, including those due to polypharmacy. Several groups tackle “deprescribing” by developing lists of medications that are potentially inappropriate for the elderly, such as the Beers or STOPP/START criteria.1–4
See related editorialIn contrast, our group (the Palliative and Therapeutic Harmonization [PATH] program and the Dalhousie Academic Detailing Service) has developed evidence-based, frailty-specific guidelines for treating hypertension5 and diabetes,6 in which we advocate less-stringent treatment targets and tapering or discontinuing medications, as needed.
The PATH program7 is a clinical approach that prioritizes the consideration of frailty when making treatment decisions. The Dalhousie Academic Detailing Service collaborates with the Nova Scotia Health Authority to research and develop evidence-informed educational messages about the treatment of common medical conditions.
Here, we address lipid-lowering therapy in this population.
CONSIDERING FRAILTY
Frailty is defined in several ways. The Fried model8,9 identifies frailty when 3 of the following characteristics are present: unintentional weight loss, exhaustion, muscle weakness, slow walking speed, or low levels of activity. The Clinical Frailty Scale10,11 and the Frailty Assessment for Care-planning Tool (FACT)5 use deficits in cognition, function, and mobility to define frailty. According to these scales, people are considered severely frail when they require assistance with basic activities of daily living (such as bathing or dressing), owing to cognitive or physical deficits from any cause.
In reviewing the evidence, we consider five questions:
- What is the quality of the evidence? (Up to 48% of clinical practice guideline recommendations may be based on low-level evidence or expert opinion.12)
- How did the study population compare with the frail?
- Are study outcomes and potential benefits clinically relevant to those who are frail?
- How long did it take for the clinical benefit of a treatment to become apparent, and are the frail elderly likely to live that long?
- Have the harms of treatment been sufficiently considered?
WHAT IS THE QUALITY OF THE EVIDENCE?
We found no studies that specifically evaluated the benefit of lipid-lowering for severely frail older adults. Therefore, we examined randomized controlled trials that enrolled non-frail older adults,13–28 subgroup analyses of randomized controlled trials,29,30 meta-analyses that analyzed subgroups of elderly populations,31,32 and publications describing the study designs of randomized controlled trials.33–37
Most of the evidence comes from post hoc subgroup analyses of elderly populations. Although meta-analysis is commonly used to compare subgroups, the Cochrane handbook and others consider subgroup comparisons observational by nature.38,39 (See Table 1 for lipid-lowering studies discussed in this article.)
Studies of statins for primary prevention of cardiovascular disease
For evidence of benefit from lipid-lowering for primary prevention (ie, to reduce the risk of cardiovascular events in patients with no known cardiovascular disease at baseline but at increased risk), we reviewed the meta-analysis conducted by the Cholesterol Treatment Trialists’ (CTT) Collaborators.32 Since this meta-analysis included the major trials that enrolled elderly patients, individual publications of post hoc, elderly subgroups were, for the most part, not examined individually. The exception to this approach was a decision to report on the PROSPER13 and JUPITER28 trials separately, because PROSPER is the most representative of the elderly population and JUPITER reached the lowest LDL-C of primary prevention trials published to date and included a large elderly subgroup (n = 5,695).
Savarese et al40 evaluated the benefits of statins for older adults who did not have established cardiovascular disease. We did not report on this meta-analysis, as not all of the subjects that populated the meta-analysis were representative of a typical prevention population. For instance, in the Anglo-Scandinavian Cardiac Outcomes Trial lipid-lowering arm,41 14% of the subjects had had a previous stroke or transient ischemic attack. In the Antihypertensive and Lipid-Lowering Treatment Trial,42 16% of the population had a family history of premature coronary heart disease.
In addition, all the trials in the Savarese meta-analysis were also included in the CTT meta-analysis.32 The CTT reports on baseline risk using patient-level data stratified by age and risk, which may be more relevant to the question of primary prevention for older adults, as highlighted in our review.
PROSPER (Prospective Study of Pravastatin in the Elderly at Risk),13 a well-conducted, double-blind, randomized controlled trial with low probability of bias, compared pravastatin 40 mg and placebo. It was the only study that specifically enrolled older adults, with prespecified analysis of primary and secondary prevention subgroups. The primary prevention subgroup accounted for 56% of the 5,084 participants.
JUPITER (Justification for the Use of Statins in Prevention)28 compared rosuvastatin 20 mg and placebo in 17,802 participants. All had low-density lipoprotein cholesterol (LDL-C) levels below 3.4 mmol/L (130 mg/dL) and elevated levels of the inflammatory biomarker high-sensitivity C-reactive protein (hsCRP), ie, 2 mg/L or higher. Subsequently, Glynn et al performed a post hoc, exploratory subgroup analysis of elderly participants (N = 5,695).29
The JUPITER trial had several limitations.43,44 The planned follow-up period was 5 years, but the trial was stopped early at 1.9 years, after a statistically significant difference was detected in the primary composite outcome of reduction in all vascular events. Studies that are stopped early may exaggerate positive findings.45
Further, JUPITER’s patients were a select group, with normal LDL-C levels, elevated hsCRP values, and without diabetes. Of 90,000 patients screened, 72,000 (80%) did not meet the inclusion criteria and were not enrolled. This high rate of exclusion limits the generalizability of study findings beyond the shortcomings of post hoc subgroup analysis.
The meta-analysis performed by the CTT Collaborators32 used individual participant data from large-scale randomized trials of lipid-modifying treatment. This analysis was specific to people at low risk of vascular disease. In a supplementary appendix, the authors described the reduction in major vascular events for each 1.0 mmol/L decrease in LDL-C in three age categories: under age 60, ages 61 to 70, and over age 70.
The authors also stratified the results by risk category and provided information about those with a risk of major vascular events of less than 20%, which would be more representative of a purer primary prevention population.
For the elderly subgroup at low risk, the CTT Collaborators32 only reported a composite of major vascular events (coronary death, nonfatal myocardial infarction [MI], ischemic stroke, or revascularization) and did not describe individual outcomes, such as prevention of coronary heart disease.
Study results are based on postrandomization findings and therefore may be observational, not experimental.46
Studies of statins for secondary prevention of cardiovascular disease
The aim of secondary prevention is to reduce the risk of recurrent cardiovascular events in patients who already have cardiovascular disease.
To address the question of whether statins reduce cardiovascular risk, we reviewed:
PROSPER,13 which included a preplanned analysis of the secondary prevention population.
Afilalo et al,31,47 who performed a meta-analysis of the elderly subgroups of nine major secondary prevention studies (19,569 patients) using published and unpublished data.
To address the question of whether statins benefit individuals with heart failure, we found two relevant studies:
GISSI-HF (Gruppo Italiano per lo Studio della Sopravvivenza nell’Insufficienza Cardiaca Heart Failure)25 and CORONA (Controlled Rosuvastatin Multinational Trial in Heart Failure),26 which were large, international, well-conducted randomized controlled trials that examined statin use in heart failure.
To answer the question of whether statins benefit individuals after a stroke or transient ischemic attack, we found one relevant study:
SPARCL (Stroke Prevention by Aggressive Reduction in Cholesterol Levels),27 which evaluated the benefit of statins in older adults with a history of stroke or transient ischemic attack. It was a prospective, double-blind, placebo-controlled, international trial conducted at 205 centers. One to 6 months after their cerebrovascular event, patients were randomized to receive either atorvastatin 80 mg or placebo. Given the young age of patients in this trial (mean age 63), we also reviewed a post hoc subgroup analysis of the elderly patients in SPARCL (age > 65).30
HOW DID THE STUDY POPULATION COMPARE WITH THOSE WHO ARE FRAIL?
Frail older adults are almost always excluded from large-scale clinical trials,48 leading to uncertainty about whether the conclusions can be applied to those with advanced frailty.
Although age is an imperfect proxy measure of frailty,49 we consider the age of the study population as well as their comorbidities.
Participants in the studies we reviewed were generally younger and healthier than those who are frail, with mean ages of about 75 or less (Table 1).
PROSPER was the most representative study, as it specifically enrolled older adults, albeit without frailty,13 and excluded people with poor cognitive function as defined by a Mini Mental State Examination score less than 24.
JUPITER enrolled a select population, as described above. The median age in the elderly subgroup was 74 (interquartile range 72–78).29
The Afilalo et al31 meta-analysis primarily included studies of young-elderly patients, with a mean age of less than 70. PROSPER13 was an exception.
The GISSI-HF study,25 which examined the benefit of statins in heart failure, described their study population as frail, although the mean age was only 68. Compared with those in GISSI-HF, the CORONA patients26 with heart failure were older (mean age 73) and had more severe heart failure. Accordingly, it is possible that many of the CORONA participants were frail.
ARE STUDY OUTCOMES CLINICALLY RELEVANT TO THOSE WHO ARE FRAIL?
Because baseline cardiovascular risk increases with age, the elderly should, in theory, experience greater absolute benefit from lipid-lowering. However, there is uncertainty about whether this is true in practice.
Some, but not all, epidemiologic studies show a weaker relationship between cholesterol levels and cardiovascular morbidity and mortality rates in older compared to younger adults.50,51 This may be because those with high cholesterol levels die before they get old (time-related bias), or because those with life-threatening illness may have lower cholesterol levels.50 In addition, classic risk factors such as age, sex, systolic blood pressure, cholesterol values, diabetes, smoking, and left ventricular hypertrophy on electrocardiography may have less power to predict cardiovascular risk among older patients.52
The goal of treatment in frailty is to prevent further disability or improve quality of life. Therefore, meaningful outcomes for lipid-lowering therapy should include symptomatic nonfatal MI and its associated morbidity (eg, heart failure and persistent angina) or symptomatic nonfatal stroke leading to disability. Outcomes without sustained clinical impact, such as transient ischemic attack, nondisabling stroke, or silent MI, while potentially important in other populations, are less relevant in severe frailty. Notably, in many statin studies, outcomes include asymptomatic heart disease (eg, silent MI and “suspected events”) and nondisabling stroke (eg, mild stroke, transient ischemic attack). When symptomatic outcomes are not reported separately, the impact of the reported benefit on quality of life and function is uncertain.
The outcome of all-cause mortality is generally recognized as a gold standard for determining treatment benefit. However, since advanced frailty is characterized by multiple competing causes for mortality, a reduction in all-cause mortality that is achieved by addressing a single issue in nonfrail populations may not extend to the frail.
To more fully understand the impact of lipid-lowering therapy on quality of life and function, we examined the following questions:
Do statins as primary prevention reduce symptomatic heart disease?
Outcomes for coronary heart disease from PROSPER and JUPITER are summarized in Table 2.
PROSPER. In the PROSPER primary prevention group,13 statin therapy did not reduce the combined outcome of coronary heart disease death and nonfatal MI.
The JUPITER trial demonstrated a statistically significant benefit for preventing MI in the elderly subpopulation (ages 70–97),29 but the number needed to treat was high (211 for 2 years), with a wide confidence interval (CI) (95% CI 106–32,924). The trial did not adequately differentiate between symptomatic and asymptomatic events, making it difficult to determine outcome relevance. Also, due to the methodologic limitations of JUPITER as described above, its results should be interpreted with caution.43,44
The CTT Collaborators32 did not report individual outcomes (eg, coronary heart disease) for the elderly low-risk subgroup and, therefore, this meta-analysis does not answer the question of whether statins reduce symptomatic heart disease in primary prevention populations.
Taken together, these findings do not provide convincing evidence that statin therapy as primary prevention reduces the incidence of symptomatic heart disease for severely frail older adults.
Do statins as secondary prevention reduce symptomatic heart disease?
Most studies defined secondary prevention narrowly as treatment for patients with established coronary artery disease. For instance, in the Afilalo et al meta-analysis,31 the small number of studies that included individuals with other forms of vascular disease (such as peripheral vascular disease) enrolled few participants with noncardiac conditions (eg, 29% in PROSPER13 and 13% in the Heart Protection Study20).
Therefore, any evidence of benefit for secondary prevention demonstrated in these studies is most applicable to patients with coronary heart disease, with less certainty for those with other forms of cardiovascular disease.
In PROSPER,13 the secondary prevention group experienced benefit in the combined outcome of coronary heart disease death or nonfatal MI. In the treatment group, 12.7% experienced this outcome compared with 16.8% with placebo, an absolute risk reduction of 4.1% in 3 years (P = .004, number needed to treat 25, 95% CI 15–77). This measure includes coronary heart disease death, an outcome that may not be generalizable to those who are frail. In addition, the outcome of nonfatal MI includes both symptomatic and suspected events. As such, there is uncertainty whether the realized benefit is clinically relevant to frail older adults.
The Afilalo et al meta-analysis31 showed that the number needed to treat to prevent one nonfatal MI was 38 (95% CI 16–118) over 5 years (Table 2). However, this outcome included both symptomatic and asymptomatic (silent) events.
Based on the available data, we conclude that it is not possible to determine whether statins reduce symptomatic heart disease as secondary prevention for older adults who are frail.
Do statins reduce heart disease in combined populations?
In the combined primary and secondary population from PROSPER,13 pravastatin decreased the risk of nonfatal symptomatic MI from 4.3% in the placebo group to 3.4%, a relatively small reduction in absolute risk (0.9%) and not statistically significant by our chi-square calculation (P = .099).
Do statins prevent a first symptomatic stroke in people with or without preexisting cardiovascular disease?
Preventing strokes that cause functional decline is an important outcome for the frail elderly. Stroke outcomes from PROSPER,13 JUPITER,29 and the Afilalo et al meta-analysis31 are summarized in Table 3.
For primary prevention:
In PROSPER (primary prevention),13 there was no statistically significant benefit in the combined outcome of fatal and nonfatal stroke or the single outcome of transient ischemic attack after 3.2 years.
JUPITER,29 in contrast, found that rosuvastatin 20 mg reduced strokes in primary prevention, but the absolute benefit was small. In 2 years, 0.8% of the treatment group had strokes, compared with 1.4% with placebo, an absolute risk reduction of 0.6% (P = .023, number needed to treat 161, 95% CI 86–1,192).
Neither PROSPER nor JUPITER differentiated between disabling and nondisabling strokes.
For secondary prevention:
In PROSPER (secondary prevention),13 there was no statistically significant benefit in the combined outcome of fatal and nonfatal stroke or the single outcome of transient ischemic attack after 3.2 years.
The Afilalo et al secondary prevention meta-analysis demonstrated a 25% relative reduction in stroke (relative risk 0.75, 95% CI 0.56–0.94, number needed to treat 58, 95% CI 27–177).31
Notably, the stroke outcome in Afilalo included both disabling and nondisabling strokes. For example, in the Heart Protection Study,20 the largest study in the Afilalo et al meta-analysis, approximately 50% of nonfatal, classifiable strokes in the overall study population (ie, both younger and older patients) were not disabling. Including disabling and nondisabling strokes in a composite outcome confounds the clinical meaningfulness of these findings in frailty, as the number needed to treat to prevent one disabling stroke cannot be calculated from the data provided.
Do statins prevent a second (symptomatic) stroke in people with a previous stroke?
SPARCL27 (Table 3) examined the question of whether statins decrease the risk of recurrent ischemic stroke for patients with a prior history of stroke or transient ischemic attack. There was a statistically significant reduction in the primary composite outcome of fatal and nonfatal stroke, with 11.2% of the treatment group and 13.1% of the placebo group experiencing this outcome, an absolute risk reduction of 1.9% at 5 years (P = .03; number needed to treat 52, 95% CI 26–1,303). However, the difference in nonfatal stroke, which is the outcome of interest for frailty (since mortality has uncertain relevance), was not statistically significant (10.4% with treatment vs 11.8% with placebo, P =.11).
An exploratory subgroup analysis of SPARCL patients based on age30 showed a smaller, nonsignificant reduction in the primary end point of fatal and nonfatal stroke in the group over age 65 (relative risk 0.90, 95% confidence interval 0.73–1.11, P = .33) compared with the younger group (age < 65) (relative risk 0.74, 95% CI 0.57–0.96, P = .02).
The applicability of these results to the frail elderly is uncertain, since the subgroup analysis was not powered to determine outcomes based on age stratification and there were differences between groups in characteristics such as blood pressure and smoking status. In addition, the outcome of interest, nonfatal stroke, is not provided for the elderly subgroup.
In conclusion, in both primary and secondary prevention populations, the evidence that statins reduce nonfatal, symptomatic stroke rates for older adults is uncertain.
Do statins decrease all-cause mortality for primary or secondary prevention?
Due to competing risks for death, the outcome of mortality may not be relevant to those who are frail; however, studies showed the following:
For primary prevention, there was no decrease in mortality in PROSPER13 or in the elderly subgroup of JUPITER.29
For secondary prevention, an analysis of PROSPER trial data by Afilalo et al31 showed a significant 18% decrease in all-cause mortality (relative risk 0.82, 95% CI 0.69–0.98) using pravastatin 40 mg.
A decrease in all-cause mortality with statins was also reported in the pooled result of the Afilalo et al meta-analysis.31
What are the reported composite outcomes for primary and secondary prevention?
While we were most interested in the symptomatic outcomes described above, we recognize that the small numbers of events make it difficult to draw firm conclusions. Therefore, we also considered composite primary outcomes, even though most included multiple measures that have varying associations with disability and relevancy to frail older adults.
For primary prevention, in the PROSPER preplanned subgroup analysis,13 there was no statistical benefit for any outcome, including the primary composite measure. In contrast, the elderly subpopulation in the JUPITER trial28 showed a treatment benefit with rosuvastatin 20 mg compared with placebo for the primary composite outcome of MI, stroke, cardiovascular death, hospitalization for unstable angina, or revascularization. The number needed to treat for 2 years was 62 (95% CI 39–148).
In the CTT meta-analysis,32 patients at all levels of baseline risk showed benefit up to age 70. However, there was no statistically significant benefit in the composite primary outcome of coronary deaths, nonfatal myocardial infarction, ischemic stroke, or revascularization in the population most representative of elderly primary prevention—those who were more than 70 years old with a 5-year baseline risk of less than 20%.
For secondary prevention, in PROSPER,13 the subpopulation of patients treated for secondary prevention experienced benefit in the primary composite outcome of coronary heart disease death, nonfatal MI, or fatal or nonfatal stroke, achieving a 4% absolute risk reduction with a number needed to treat of 23 (95% CI 14–81) over 3 years.
Do statins decrease disability?
PROSPER was the only study that reported on disability. Compared with placebo, pravastatin did not decrease disability in the total population as measured by basic and instrumental activities of daily living scales.
Do statins help patients with heart failure?
Neither GISSI-HF25 nor CORONA26 found significant benefit from rosuvastatin 10 mg, despite LDL-C lowering of 27% in GISSI-HF and 45% in CORONA.
Do ezetimibe or other nonstatin lipid-lowering agents improve outcomes?
There is no definitive evidence that ezetimibe provides clinically meaningful benefit as a single agent.
For combination therapy, the IMPROVE-IT (Improved Reduction of Outcomes: Vytorin Efficacy International Trial)53 showed that adding ezetimibe 10 mg to simvastatin 40 mg after an acute coronary syndrome reduced the risk of nonfatal myocardial infarction compared with simvastatin monotherapy (event rate 12.8% vs 14.4%; hazard ratio 0.87, 95% CI 0.80–0.95; P = .002) for a population with a mean age of 64. The risk of any stroke was also reduced; strokes occurred in 4.2% of those receiving combination therapy vs 4.8% with monotherapy (hazard ratio 0.86, 95% CI 0.73–1.00, P = .05). After a median of 6 years, 42% of patients in each group had discontinued treatment. Given the very specific clinical scenario of acute coronary syndrome and the young age of the patients in this trial, we do not think that this study justifies the use of ezetimibe for severely frail older adults.
There is no evidence that other combinations (ie, a statin plus another lipid-lowering drug) improve clinical outcomes for either primary or secondary prevention in any population.54
WILL FRAIL PATIENTS LIVE LONG ENOUGH TO BENEFIT?
It is often difficult to determine the number of years that are needed to achieve benefit, as most trials do not provide a statistical analysis of varying time frames.
The PROSPER trial13 lasted 3.2 years. From the Kaplan-Meier curves in PROSPER, we estimate that it took about 1.5 years to achieve a 1% absolute risk reduction and 2.5 years for a 2% absolute risk reduction in coronary heart disease death and nonfatal MI in the combined primary and secondary groups.
JUPITER28 was stopped early at 1.9 years. The Afilalo et al meta-analysis31 was based on follow-up over 4.9 years.
IMPROVE-IT53 reported event rates at 7 years. The authors note that benefit in the primary composite outcome appeared to emerge at 1 year, although no statistical support is given for this statement and divergence in the Kaplan-Meier curves is not visually apparent.
The duration of other studies ranged between 2.7 and 4.9 years (Table 1).26–28
It has been suggested that statins should be considered for elderly patients who have a life expectancy of at least 5 years.3 However, many older adults have already been taking statins for many years, which makes it difficult to interpret the available timeframe evidence.
In a multicenter, unblinded, randomized trial,55 statins were either stopped or continued in older adults who had a short life expectancy and a median survival of approximately 7 months. Causes of death were evenly divided between cancer and noncancer diagnoses, and 22% of the patients were cognitively impaired. Discontinuing statin therapy did not increase mortality or cardiovascular events within 60 days. Nevertheless, stopping statin therapy did not achieve noninferiority for the primary end point, the proportion of participants who died within 60 days. Statin discontinuation was associated with improved quality of life, although the study was not blinded, which could have influenced results.
HAVE THE HARMS BEEN SUFFICIENTLY CONSIDERED?
Frail older adults commonly take multiple medications and are more vulnerable to adverse events.56
Many statins require dose reduction with severe renal impairment (creatinine clearance < 30 mL/min/1.73 m2), which would be a common consideration in severely frail older adults.
Myopathy
Myopathy, which includes myalgias and muscle weakness, is a statin-related adverse event that can impair quality of life. Myopathy typically develops within the first 6 months but can occur at any time during statin treatment.57 When muscle-related adverse effects occur, they may affect the elderly more significantly, particularly their ability to perform activities of daily living, rise from a chair, or mobilize independently. Another concern is that older adults with dementia may not be able to accurately report muscle-related symptoms.
It is difficult to ascertain the true prevalence of myopathy, especially in advanced age and frailty. Randomized controlled trials report incidence rates of 1.5% to 5%, which is comparable to placebo.57,58 However, inconsistent definitions of myopathy and exclusion of subjects with previous statin intolerance or adverse effects during run-in periods limit interpretability.57 Clinical experience suggests that muscle complaints may be relatively common.59–61
Advanced age, female sex, low body mass index, and multisystem disease are all associated with frailty and have also been described as risk factors for statin-associated muscle syndromes.61 Physiologic changes associated with frailty, such as reduced muscle strength, decreased lean body mass, impaired functional mobility, decreased reserve capacity, and altered drug metabolism may increase the risk and severity of myopathy.62
Adverse cognitive events
Meta-analyses of randomized clinical trials and narrative reviews find no definitive relationship between statin therapy and adverse cognitive events.63–67 Nevertheless, there have been case reports of memory loss associated with the use of statins, and the US Food and Drug Administration has issued a warning that statins have been associated with memory loss and confusion.68
It may be difficult to determine whether a statin is causing or aggravating cognitive symptoms among individuals with dementia without a trial withdrawal of the drug.
OUR RECOMMENDATIONS
The recommendations below are intended for adults with severe or very severe frailty (ie, a score of 7 or 8 on the Clinical Frailty Scale11 or FACT5 and therefore apply to most older adults living in long-term care facilities.
Primary prevention
There is no reason to prescribe or continue statins for primary prevention, as it is unlikely that they would provide benefit for outcomes that are relevant in this population.
Secondary prevention
Statin treatment is probably not necessary for secondary prevention in those with severe frailty, although there may be extenuating circumstances that justify statin use.
Heart failure
There is no reason to start or continue statins for heart failure, as there is insufficient evidence that they are effective for this indication in any population.
Ezetimibe
There is no evidence that ezetimibe reduces cardiovascular events in any population when used as monotherapy. For a select population with acute coronary syndromes, ezetimibe has a modest effect. Given the very specific clinical scenario of acute coronary syndrome, we do not think that the available evidence justifies the use of ezetimibe for severely frail older adults.
Agents other than ezetimibe combined with statins
There is no reason to start or continue other lipid-lowering drugs in conjunction with statins.
Statin dosing
As statin adverse effects have the potential to increase with advancing age and frailty, lower doses may be appropriate.68
Adverse events
Consider stopping statins on a trial basis if there is concern regarding myopathy, drug interactions, or other adverse effects.
BOTTOM LINE: DO STATINS IMPROVE QUALITY OF LIFE OR FUNCTION?
In primary prevention for older adults, there is doubt that statins prevent cardiovascular disease and stroke-related events because the main study involving the elderly did not show a benefit in the primary prevention subgroup.13 Additionally, there is no conclusive evidence that statin treatment decreases mortality in primary prevention.13,29
There is insufficient information to determine whether the frail elderly should receive statins for secondary prevention. Although there is evidence that treatment decreases measures of coronary heart disease and stroke, it is unclear whether it improves quality of life or function for those who are frail. To answer this question, we need more information about whether reported outcomes (such as stroke and MI) are associated with disability, which is not provided in many of the studies we reviewed. When disability was specifically considered in the PROSPER trial for the combined population of primary and secondary prevention, treatment with statins had no impact on basic and instrumental activities of daily living.
Some experts may not agree with our interpretation of the complex evidence presented in this article. Others may ask, “What is the harm in using statins, even if there is no definitive benefit?” However, the harms associated with statin therapy for the frail are poorly defined. In the face of these uncertainties and in the absence of definitive improvement in quality of life, we believe that “less is more” in the context of severe frailty.69
The cost of medications should also be considered, especially in long-term care facilities, where there is an added expense of drug administration that diverts human resources away from interactions that are more congruent with respecting the lifestage of frailty.
Careful review of evidence before applying clinical practice guidelines to those who are frail should become the norm. When considering treatment of frail patients, the five questions described in this review shed light on the applicability of clinical trial evidence. Therapies that are highly effective in healthier populations may be less effective when individuals are severely frail. Accordingly, we propose that medications should only be used if they improve quality of life or function.
- Ontario Pharmacy Research Collaboration. Deprescribing guidelines for the elderly. www.open-pharmacy-research.ca/research-projects/emerging-services/deprescribing-guidelines. Accessed December 28, 2016.
- Scott IA, Hilmer SN, Reeve E, et al. Reducing inappropriate polypharmacy: the process of deprescribing. JAMA Intern Med 2015; 175:827–834.
- O’Mahony D, O’Sullivan D, Byrne S, O’Connor MN, Ryan C, Gallagher P. STOPP/START criteria for potentially inappropriate prescribing in older people: version 2. Age Ageing 2015; 44:213–218.
- American Geriatrics Society 2012 Beers Criteria Update Expert Panel. American Geriatrics Society updated Beers Criteria for potentially inappropriate medication use in older adults. J Am Geriatr Soc 2012; 60:616–631.
- Mallery LH, Allen M, Fleming I, et al. Promoting higher blood pressure targets for frail older adults: a consensus guideline from Canada. Cleve Clin J Med 2014; 81:427–437.
- Mallery LH, Ransom T, Steeves B, Cook B, Dunbar P, Moorhouse P. Evidence-informed guidelines for treating frail older adults with type 2 diabetes: from the Diabetes Care Program of Nova Scotia (DCPNS) and the Palliative and Therapeutic Harmonization (PATH) program. J Am Med Dir Assoc 2013; 14:801–808.
- Moorhouse P, Mallery L. Palliative and therapeutic harmonization: a model for appropriate decision-making in frail older adults. J Am Geriatr Soc 2012; 60:2326–2332.
- Fried LP, Tangen CM, Walston J, et al; Cardiovascular Health Study Collaborative Research Group. Frailty in older adults: evidence for a phenotype. J Gerontol A Biol Sci Med Sci 2001; 56:M146–M156.
- Morley JE, Malmstrom TK, Miller DK. A simple frailty questionnaire (FRAIL) predicts outcomes in middle aged African Americans. J Nutr Health Aging 2012; 16:601–608.
- Rockwood K, Song Z, MacKnight C, et al. A global clinical measure of fitness and frailty in elderly people. CMAJ 2005; 173:489–495.
- Morley JE, Vellas B, van Kan GA, et al. Frailty consensus: a call to action. J Am Med Dir Assoc 2013; 14:392–397.
- Tricoci P, Allen JM, Kramer JM, Califf RM, Smith SC Jr. Scientific evidence underlying the ACC/AHA clinical practice guidelines. JAMA 2009; 301:831–841.
- Shepherd J, Blauw GJ, Murphy MB, et al; PROSPER study group. PROspective Study of Pravastatin in the Elderly at Risk. Pravastatin in elderly individuals at risk of vascular disease (PROSPER): a randomised controlled trial. Lancet 2002; 360:1623–1630.
- Randomised trial of cholesterol lowering in 4444 patients with coronary heart disease: the Scandinavian Simvastatin Survival Study (4S). Lancet 1994; 344:1383–1389.
- Miettien TA, Pyorala K, Olsson AG, et al. Cholesterol-lowering therapy in women and elderly patients with myocardial infarction or angina pectoris: findings from the Scandinavian Simvastatin Study Group (4S). Circulation 1997; 96:4211–4218.
- Lewis SJ, Moye LA, Sacks FM, et al. Effect of pravastatin on cardiovascular events in older patients with myocardial infarction and cholesterol levels in the average range. Results of the Cholesterol and Recurrent Events (CARE) trial. Ann Intern Med 1998; 129:681–689.
- Hunt D, Young P, Simes J, et al. Benefits of pravastatin on cardiovascular events and mortality in older patients with coronary heart disease are equal to or exceed those seen in younger patients: results from the LIPID trial. Ann Intern Med 2001; 134:931–940.
- Prevention of cardiovascular events and death with pravastatin in patients with coronary heart disease and a broad range of initial cholesterol levels. The Long-Term Intervention with Pravastatin in Ischaemic Disease (LIPID) Study Group. N Engl J Med 1998; 339:1349–1357.
- Heart Protection Study Collaborative Group. The effects of cholesterol lowering with simvastatin on cause-specific mortality and on cancer incidence in 20,536 high-risk people: a randomized placebo-controlled trial. BMC Med 2005; 3:6.
- Heart Protection Study Collaborative Group. MRC/BHF Heart Protection Study of cholesterol lowering with simvastatin in 20,536 high-risk individuals: a randomized placebo-controlled trial. Lancet 2002; 360:7–22.
- Pitt B, Mancini GB, Ellis SG, Rosman HS, Park JS, McGovern ME. Pravastatin limitation of atherosclerosis in the coronary arteries (PLAC 1): reduction in atherosclerosis progression and clinical events. PLAC 1 investigation. J Am Coll Cardiol 1995; 26:1133–1139.
- Jukema JW, Bruschke AV, van Boven AJ, et al. Effects of lipid lowering by pravastatin on progression and regression of coronary artery disease in symptomatic men with normal to moderately elevated serum cholesterol levels. The Regression Growth Evaluation Statin Study (REGRESS). Circulation 1995; 91:2528–2540.
- Serruys PW, Foley DP, Jackson G, et al. A randomized placebo-controlled trial of fluvastatin for prevention of restenosis after successful coronary balloon angioplasty; final results of the fluvastatin angiographic restenosis (FLARE) trial. Eur Heart J 1999; 20:58–69.
- Serruys PW, de Feyter P, Macaya C, et al; Lescol Intervention Prevention Study (LIPS) Investigators. Fluvastatin for prevention of cardiac events following successful first percutaneous coronary intervention: a randomized controlled trial. JAMA 2002; 287:3215–3222.
- Tavazzi L, Maggioni AP, Marchioli R, et al; Gissi-HF Investigators. Effect of rosuvastatin in patients with chronic heart failure (the GISSI-HF trial): a randomized, double-blind, placebo-controlled trial. Lancet 2008; 372:1231–1239.
- Kjekshus J, Apatrei E, Barrios V, et al; CORONA Group. Rosuvastatin in older patients with systolic heart failure. N Engl J Med 2007; 357:2248–2261.
- Amarenco P, Bogousslavsky J, Callahan A, et al; Stroke Prevention by Aggressive Reduction in Cholesterol Levels (SPARCL) Investigators. High-dose atorvastatin after stroke or transient ischemic attack. N Engl J Med 2006; 355:549–559.
- Ridker PM, Danielson E, Fonseca FA, et al; JUPITER Study Group. Rosuvastatin to prevent vascular events in men and women with elevated C-reactive protein. N Engl J Med 2008; 359:2195–2207.
- Glynn RJ, Koenig W, Nordestgaard BG, Shepherd J, Ridker PM. Rosuvastatin for primary prevention in older persons with elevated C-reactive protein and low to average low-density lipoprotein cholesterol levels: exploratory analysis of a randomized trial. Ann Intern Med 2010; 152:488–496, W174.
- Chaturvedi S, Zivin J, Breazna A, et al; SPARCL Investigators. Effect of atorvastatin in elderly patients with a recent stroke or transient ischemic attack. Neurology 2009; 72:688–694.
- Afilalo J, Duque G, Steele R, Jukema JW, de Craen AJ, Eisenberg MJ. Statins for secondary prevention in elderly patients: a hierarchical bayesian meta-analysis. J Am Coll Cardiol 2008; 51:37–45.
- Cholesterol Treatment Trialists’ (CTT) Collaborators; Mihaylova B, Emberson J, Blackwell L, et al. The effects of lowering LDL cholesterol with statin therapy in people at low risk of vascular disease: meta-analysis of individual data from 27 randomised trials. Lancet 2012; 380:581– 590.
- Sacks FM, Pfeffer MA, Moye L, et al. Rationale and design of a secondary prevention trial of lowering normal plasma cholesterol levels after acute myocardial infarction: the Cholesterol and Recurrent Events (CARE). Am J Cardiol 1991; 68:1436–1446.
- Armitage J, Collins R. Need for large scale randomised evidence about lowering LDL cholesterol in people with diabetes mellitus: MRC/BHF Heart Protection Study and other major trials. Heart 2000; 84:357–360.
- Design features and baseline characteristics of the LIPID (Long-Term Intervention with Pravastatin in Ischemic Disease) study: a randomized trial in patients with previous acute myocardial infarction and/or unstable angina pectoris. Am J Cardiol 1995; 76:474–479.
- Shepherd J, Blauw GJ, Murphy MB, et al. The design of a prospective study of Pravastatin in the Elderly at Risk (PROSPER). Am J Cardiol 1999; 84:1192–1197.
- Amarenco P, Bogousslavsky J, Callahan AS, et al; SPARCL Investigators. Design and baseline characteristics of the stroke prevention by aggressive reduction in cholesterol levels (SPARCL) study. Cerebrovasc Dis 2003; 16:389–395.
- Interpretation of subgroup analyses and meta-regressions. In: Higgins JPT, Green S, editors. Cochrane Handbook for Systematic Reviews of Interventions Version 5.1.0. The Cochrane Collaboration, 2011. http://handbook.cochrane.org/chapter_9/9_6_6_interpretation_of_subgroup_analyses_and_meta_regressions.htm. Accessed December 5, 2016.
- Borenstein M, Higgins JP. Meta-analysis and subgroups. Prev Sci 2013; 14:134–143.
- Savarese G, Gotto AM Jr, Paolillo S, et al. Benefits of statins in elderly subjects without established cardiovascular disease: a meta-analysis. J Am Coll Cardiol 2013; 62:2090–2099.
- Sever PS, Dahlof B, Poulter NR, et al. Prevention of coronary and stroke events with atorvastatin in hypertensive patients who have average or lower-than-average cholesterol concentrations, in the Anglo-Scandinavian Cardiac Outcomes Trial—Lipid Lowering Arm (ASCOT-LLA): a multicentre randomised controlled trial. Lancet 2003; 361:1149–1158.
- The Antihypertensive and Lipid-Lowering Treatment to Prevent Heart Attack Trial. Major outcomes in moderately hypercholesterolemic, hypertensive patients randomized to pravastatin vs usual care: The Antihypertensive and Lipid-Lowering Treatment to Prevent Heart Attack Trial (ALLHAT-LLT). JAMA 2002; 288:2998–3007.
- de Longeril M, Salen P, Abramson J, et al. Cholesterol lowering, cardiovascular diseases, and the rosuvastatin-JUPITER controversy: a critical reappraisal. Arch Intern Med 2010; 170:1032–1036.
- Yusuf S, Lonn E, Bosch J. Lipid lowering for primary prevention. Lancet 2009: 373:1152–1155.
- Briel M, Bassler D, Wang AT, Guyatt GH, Montori VM. The dangers of stopping a trial too early. J Bone Joint Surg Am 2012; 94(suppl 1):56–60.
- Hayward RA, Krumholz HM. Three reasons to abandon low-density lipoprotein targets: an open letter to the Adult Treatment Panel IV of the National Institutes of Health. Circ Cardiovasc Qual Outcomes 2012; 5:2–5.
- Afilalo J, Duque G, Steele R, Jukema JW, de Craen AJ, Eisenberg MJ. Statins for secondary prevention in elderly patients: a hierarchical Bayesian meta-analysis. www.ncbi.nlm.nih.gov/pubmedhealth/PMH0026417. Accessed December 5, 2016.
- Holmes HM, Hayley DC, Alexander GC, Sachs GA. Reconsidering medication appropriateness for patients late in life. Arch Intern Med 2006; 166:605–609.
- Rockwood K, Mitnitski A. Frailty defined by deficit accumulation and geriatric medicine defined by frailty. Clin Geriatr Med 2011; 27:17–26.
- Petersen LK, Christensen K, Kragstrup J. Lipid-lowering treatment to the end? A review of observational studies and RCTs on cholesterol and mortality in 80+-year olds. Age Ageing 2010; 39:674–680.
- Psaty BM, Anderson M, Kronmal RA, et al. The association between lipid levels and the risks of incident myocardial infarction, stroke, and total mortality: the Cardiovascular Health Study. J Am Geriatr Soc 2004; 52:1639–1647.
- de Ruijter W, Westendorp RG, Assendelft WJ, et al. Use of Framingham risk score and new biomarkers to predict cardiovascular mortality in older people: population based observational cohort study. BMJ 2009; 338:a3083.
- Canon CP, Blazing MA, Giugliano RP, et al; IMPROVE-IT Investigators. Ezetimibe added to statin therapy after acute coronary syndromes. N Engl J Med 2015; 372:2387–2397.
- Anderson TJ, Gregoire J, Hegele RA, et al. 2012 update of the Canadian Cardiovascular Society guidelines for the diagnosis and treatment of dyslipidemia for the prevention of cardiovascular disease in the adult. Can J Cardiol 2013; 29:151–167.
- Kutner JS, Blatchford PJ, Taylor DH, et al. Safety and benefit of discontinuing statin therapy in the setting of advanced, life-limiting illness: a randomized clinical trial. JAMA Intern Med 2015; 175:691–700.
- Tinetti ME, Bogardus ST Jr, Agostini JV. Potential pitfalls of disease-specific guidelines for patients with multiple conditions. N Engl J Med 2004; 351:2870–2874.
- Rosenson RS. Current overview of statin-induced myopathy. Am J Med 2004; 116:408–416.
- Mancini GB, Baker S, Bergeron J, et al. Diagnosis, prevention, and management of statin adverse effects and intolerance: proceedings of a Canadian Working Group Consensus Conference. Can J Cardiol 2011; 27:635–662.
- Cohen JD, Brinton EA, Ito MK, Jacobson TA. Understanding Statin Use in America and Gaps in Patient Education (USAGE): an internet-based survey of 10,138 current and former statin users. J Clin Lipidol 2012; 6:208–215.
- Joy TR, Hegele RA. Narrative review: statin-related myopathy. Ann Intern Med 2009; 150:858–868.
- Talbert RL. Safety issues with statin therapy. J Am Pharm Assoc (2003) 2006; 46:479–490.
- Sewright KA, Clarkson PM, Thompson PD. Statin myopathy: incidence, risk factors, and pathophysiology. Curr Atheroscler Rep 2007; 9:389–396.
- Ott BR, Daiello LA, Dahabreh IJ, et al. Do statins impair cognition? A systematic review and meta-analysis of randomized controlled trials. J Gen Intern Med 2015; 30:348–358.
- Mancini GB, Tashakkor AY, Baker S, et al. Diagnosis, prevention and management of statin adverse effects and intolerance: Canadian Working Group Consensus update. Can J Cardiol 2013: 29:1553–1568.
- Rojas-Fernandez CH, Cameron JC. Is statin-associated cognitive impairment clinically relevant? A narrative review and clinical recommendations. Ann Pharmacother 2012; 46:549–557.
- McGuinness B, O’Hare J, Craig D, Bullock R, Malouf R, Passmore P. Cochrane review on ‘Statins for the treatment of dementia’. Int J Geriatr Psychiatry 2013; 28:119–126.
- Pandey RD, Gupta PP, Jha D, Kumar S. Role of statins in Alzheimer’s disease: a retrospective meta-analysis for commonly investigated clinical parameters in RCTs. Int J Neurosci 2013; 123:521–525.
- Food and Drug Administration (FDA). FDA drug safety communication: important safety label changes to cholesterol-lowering statin drugs. www.fda.gov/drugs/ drugsafety/ucm293101.htm. Accessed December 5, 2016.
- Garfinkel D, Mangin D. Feasibility study of a systematic approach for discontinuation of multiple medications in older adults: addressing polypharmacy. Arch Intern Med 2010; 170:1648–1654.
KEY POINTS
- There is no reason to prescribe or continue statins for primary prevention in severely frail elderly patients, as these drugs are unlikely to provide benefit in terms of outcomes relevant to this population.
- Statins are probably not necessary for secondary prevention in patients who are severely frail, although there may be extenuating circumstances for their use.
- There is no reason to start or continue statins for heart failure, as there is insufficient evidence that they are effective for this indication in any population.
- There is no reason to start or continue other lipid-lowering drugs in conjunction with statins.
- As the frail elderly may be more vulnerable to the side effects of statins, lower doses may be more appropriate if these drugs are prescribed.
- If there is concern regarding myopathy, a drug interaction, or other adverse effects, consider a trial of statin discontinuation.

Medical management of urinary incontinence in women
Urinary incontinence can lead to a cascade of symptomatic burden on the patient, causing distress, embarrassment, and suffering.
See related patient information
Traditionally, incontinence has been treated by surgeons, and surgery remains an option. However, more patients are now being managed by medical clinicians, who can offer a number of newer therapies. Ideally, a medical physician can initiate the evaluation and treatment and even effectively cure some forms of urinary incontinence.
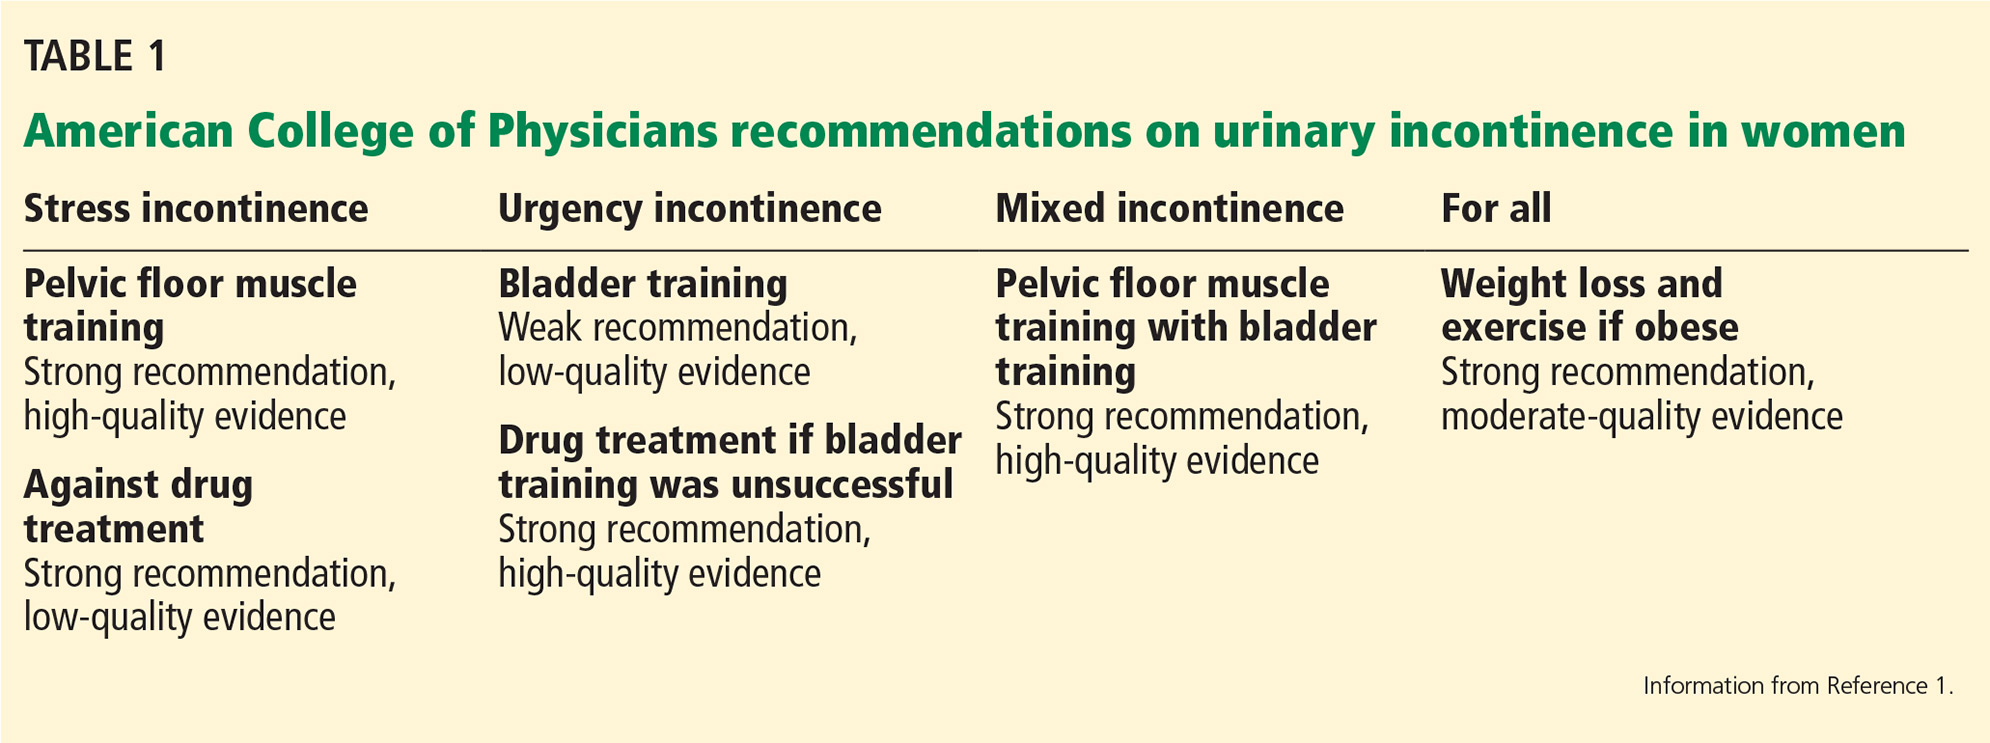
In 2014, the American College of Physicians (ACP) published recommendations on the medical treatment of urinary incontinence in women (Table 1).1
This review describes the medical management of urinary incontinence in women, emphasizing the ACP recommendations1 and newer over-the-counter options.
COMMON AND UNDERREPORTED
Many women erroneously believe that urinary incontinence is an inevitable consequence of aging and allow it to lessen their quality of life without seeking medical attention.
Indeed, it is common. The 2005–2006 National Health and Nutritional Examination Survey2 found the prevalence of urinary incontinence in US women to be 15.7%. The prevalence increases with age from 6.9% in women ages 20 through 29 to 31.7% in those age 80 and older. A separate analysis of the same data found that 25.0% of women age 20 and older had 1 or more pelvic floor disorders.3 Some estimates are even higher. Wu et al4 reported a prevalence of urinary incontinence of 51.1% in women ages 31 through 54.
Too few of these women are identified and treated, for many reasons, including embarrassment and inadequate screening. Half of women with urinary incontinence do not report their symptoms because of humiliation or anxiety.5
The burden of urinary incontinence extends beyond the individual and into society. The total cost of overactive bladder and urgency urinary incontinence in the United States was estimated to be $65.9 billion in 2007 and is projected to reach $82.6 billion in 2020.6
THREE TYPES
There are 3 types of urinary incontinence: stress, urgency, and mixed.
Stress urinary incontinence is involuntary loss of urine associated with physical exertion or increased abdominal pressure, eg, with coughing or sneezing.
Urgency urinary incontinence is involuntary loss of urine associated with the sudden need to void. Many patients experience these symptoms simultaneously, making the distinction difficult.
Mixed urinary incontinence is loss of urine with both urgency and increased abdominal pressure or physical exertion.
Overactive bladder, a related problem, is defined as urinary urgency, usually accompanied by frequency and nocturia, with or without urgency urinary incontinence, in the absence of a urinary tract infection or other obvious disease.7
Nongenitourinary causes such as neurologic disorders or even malignancy can present with urinary incontinence, and thus it is critical to perform a thorough initial evaluation.
A 2014 study revealed that by age 80, 20% of women may need to undergo surgery for stress urinary incontinence or pelvic organ prolapse. This statistic should motivate healthcare providers to focus on prevention and offer conservative medical management for these conditions first.8
QUESTIONS TO ASK
When doing a pelvic examination, once could inquire about urinary incontinence with questions such as:
Do you leak urine when you cough, sneeze, laugh, or jump or during sexual climax?
Do you have to get up more than once at night to urinate?
Do you feel the urge to urinate frequently?
BEHAVIORAL MODIFICATION AND BLADDER TRAINING
Bladder training is a conservative behavioral treatment for urinary incontinence that primary care physicians can teach. It is primarily used for urgency urinary incontinence but can also be useful in stress urinary incontinence.
After completing a bladder diary and gaining awareness of their daily voiding patterns, patients can learn scheduled voiding to train the bladder, gradually extending the urges to longer intervals.
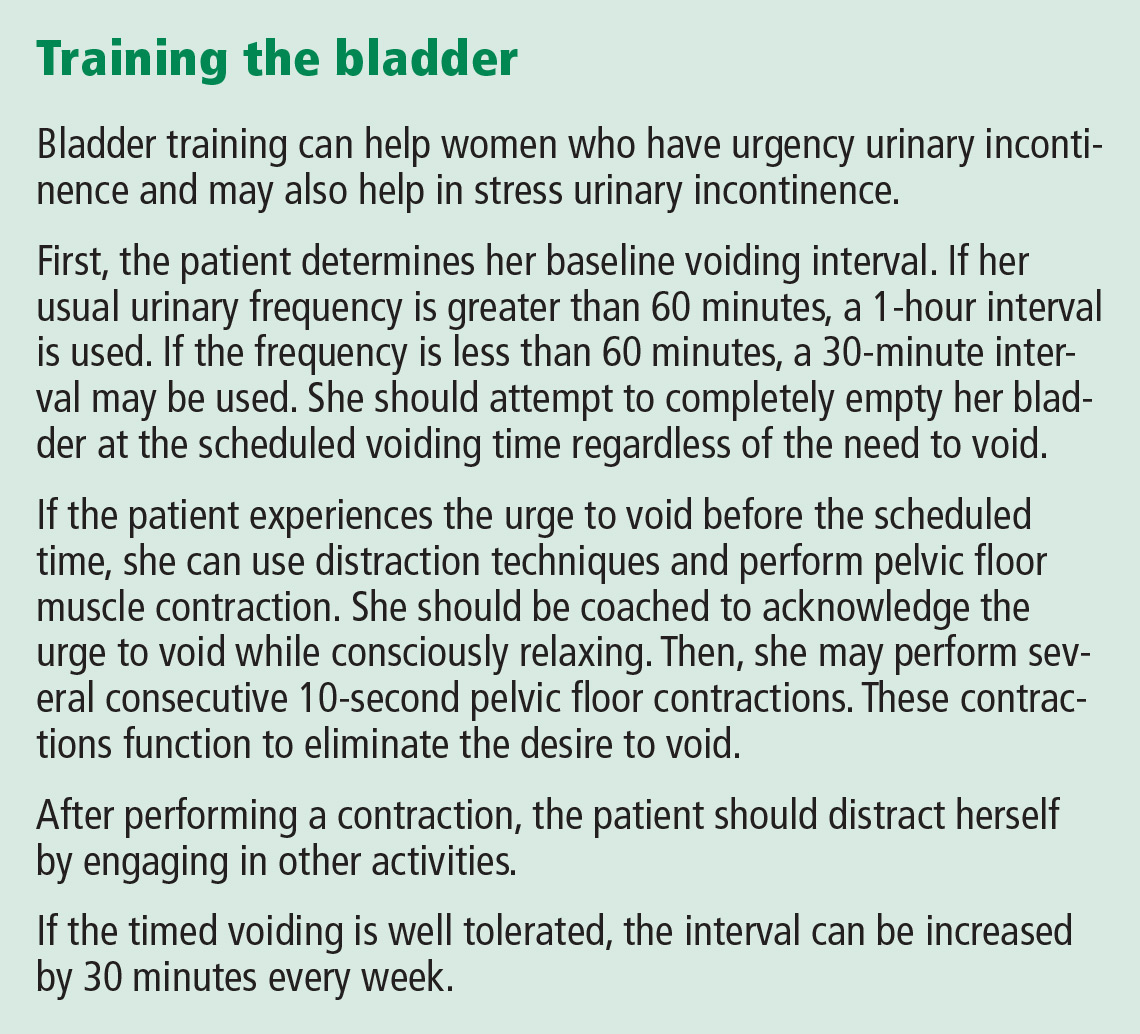
Clinicians should instruct patients on how to train the bladder, using methods first described by Wyman and Fantl.9 (See Training the bladder.)
There is evidence that bladder training improves urinary incontinence compared with usual care.10,11
The ACP recommends bladder training for women who have urgency urinary incontinence, but grades this recommendation as weak with low-quality evidence.
PELVIC FLOOR MUSCLE TRAINING
Introduced in 1948 by Dr. Arnold Kegel, pelvic floor muscle training has become widely adopted.12
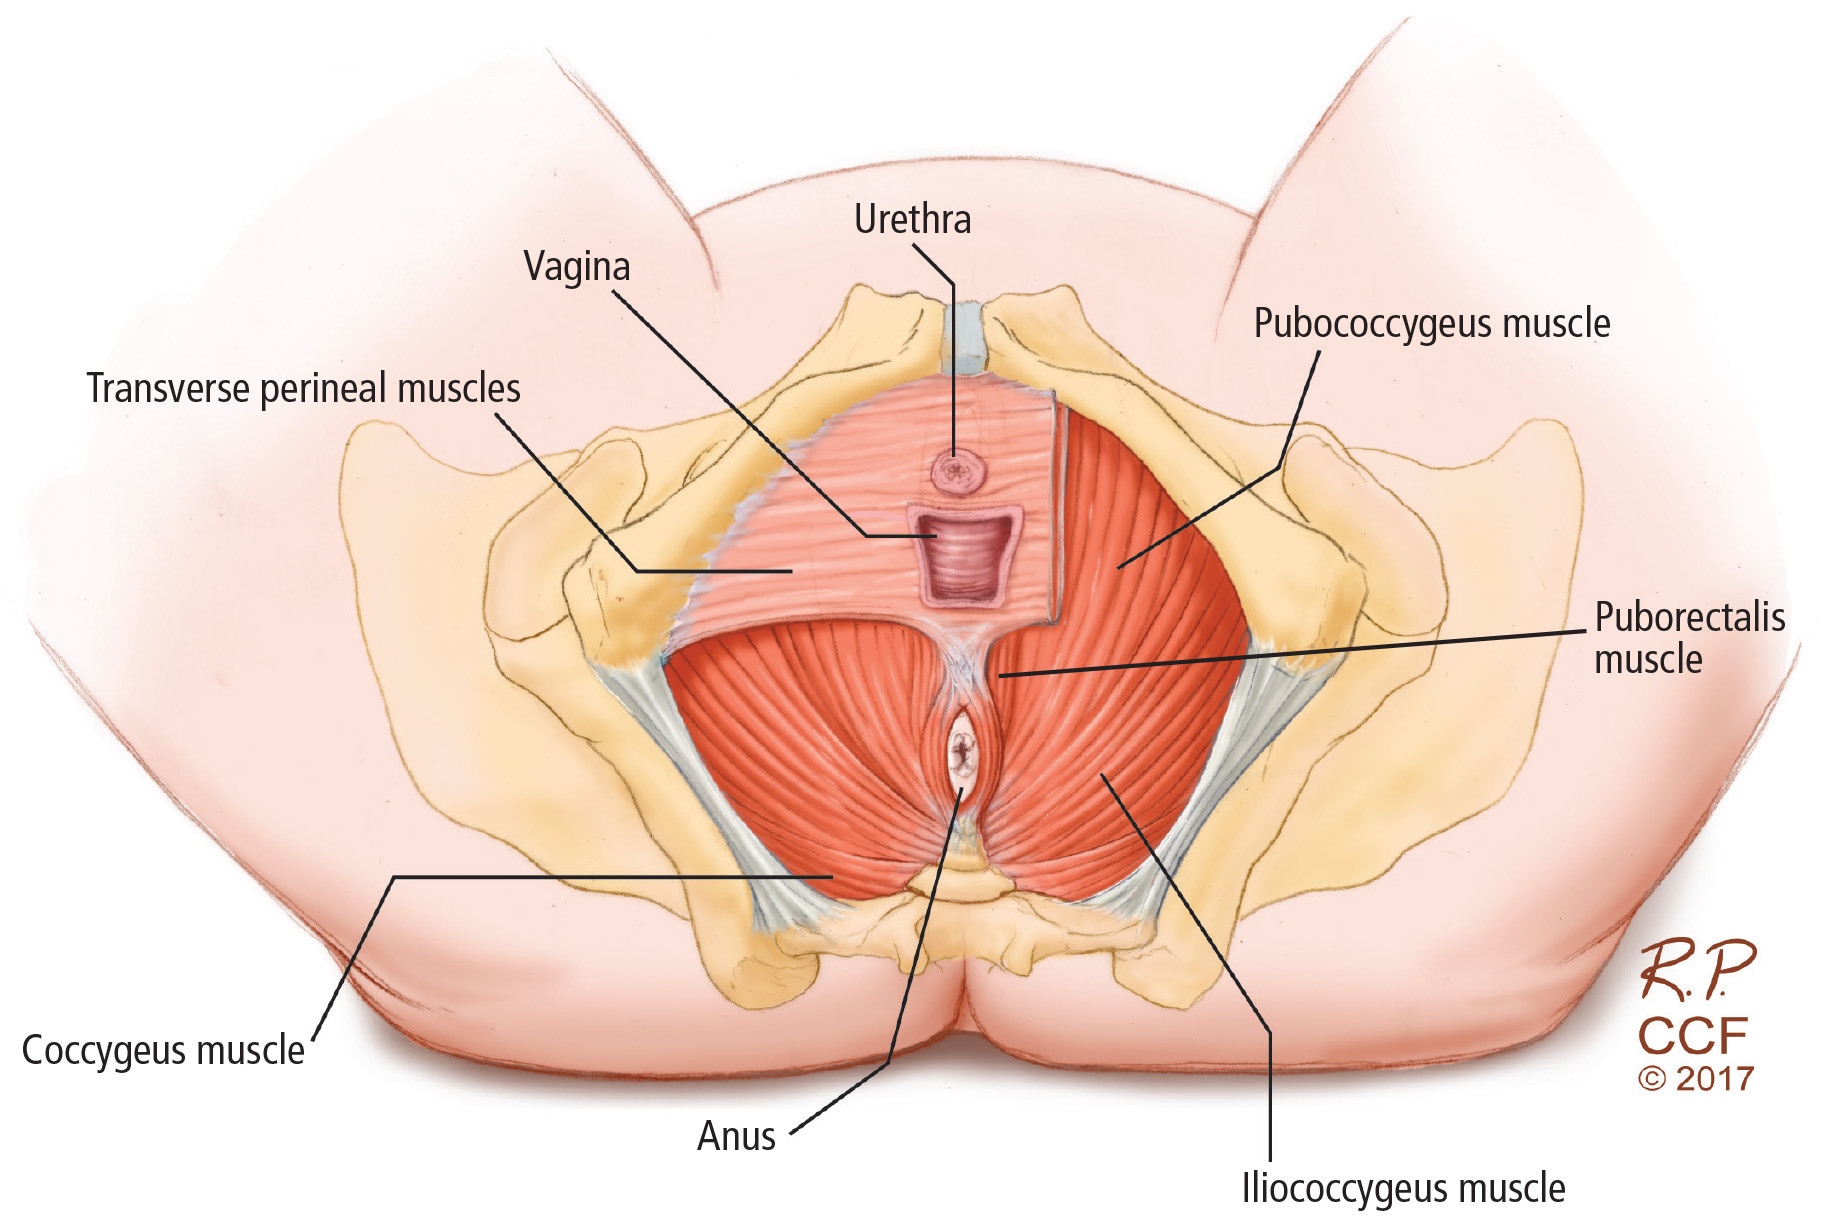
The pelvic floor consists of a group of muscles, resembling a hammock, that support the pelvic viscera. These muscles include the coccygeus and the layers of the levator ani (Figure 1). A weak pelvic floor is one of many risk factors for developing stress urinary incontinence. Like other muscle groups, a weak pelvic floor can be rehabilitated through various techniques, often guided by a physical therapist.
Compared with those who received no treatment, women with stress urinary incontinence who performed pelvic floor muscle training were 8 times more likely to report being cured and 17 times more likely to report cure or improvement.13
To perform a Kegel exercise, a woman consciously contracts her pelvic floor muscles as if stopping the flow of urine.
The Knack maneuver can be used to prevent leakage during anticipated events that increase intra-abdominal pressure. For example, when a cough or sneeze is imminent, patients can preemptively contract their pelvic floor and hold the contraction through the cough or sneeze.
Although many protocols have been compared, no specific pelvic floor exercise strategy has proven superior. A systematic review assessed variations in pelvic floor interventions, exercises, and delivery and found that there was insufficient evidence to make any recommendations about the best approach. However, the benefit was greater with regular supervision during pelvic floor muscle training than with little or no supervision.14
Pelvic floor muscle training strengthens the pelvic floor, which better supports the bladder neck and anatomically compensates for defects in stress urinary incontinence. In urgency urinary incontinence, a strong pelvic floor created by muscle training prevents leaking induced by the involuntary contractions of the detrusor muscle.
Recommendation
The ACP recommends pelvic floor muscle training as first-line treatment for stress urinary incontinence and mixed urinary incontinence, and grades this recommendation as strong with high-quality evidence.
BIOFEEDBACK AND PELVIC STIMULATION
Although pelvic floor exercises are effective in urinary incontinence, 30% of patients perform them incorrectly.15
Biofeedback therapy uses visual, verbal, and acoustic signals to give the patient immediate feedback and a greater awareness of her muscular activity. A commonly used technique employs a vaginal probe to measure and display pressure changes as the patient contracts her levator ani muscles.
Women who received biofeedback in addition to traditional pelvic floor physical therapy had greater improvement in urinary incontinence than those who received pelvic physical therapy alone (risk ratio 0.75, 95% confidence interval 0.66–0.86).16
Pelvic stimulation can be used separately or in conjunction with biofeedback in both urgency and stress urinary incontinence. When pelvic stimulation is used alone, 9 women need to be treated to achieve continence in 1, and 6 women need to be treated to improve continence in 1.16
Traditionally delivered by a pelvic floor physical therapist, pelvic stimulation and biofeedback have also been validated for home use.17,18 Several pelvic stimulation devices have been approved by the US Food and Drug Administration (FDA) for treating stress, urgency, and mixed urinary incontinence. These devices deliver stimulation to the pelvic floor at single or multiple frequencies. Although the mechanisms are not clearly understood, lower frequencies are used to treat urgency incontinence, while higher frequencies are used for stress incontinence. A theory is that higher-frequency stimulation strengthens the pelvic floor in stress urinary incontinence while lower frequency stimulation calms the detrusor muscle in urgency urinary incontinence.
The Apex and Apex M devices are both available over the counter, the former to treat stress urinary incontinence and the latter to treat mixed urinary incontinence, using pelvic stimulation alone. Other available devices, including the InTone and a smaller version, the InTone MV, are available by prescription and combine pelvic stimulation with biofeedback.18
Women who wish to avoid surgery, botulinum toxin injections, and daily oral medications, particularly those who are highly motivated, are ideal candidates for these over-the-counter automatic neuromuscular pelvic exercising devices.
PESSARIES AND OTHER DEVICES
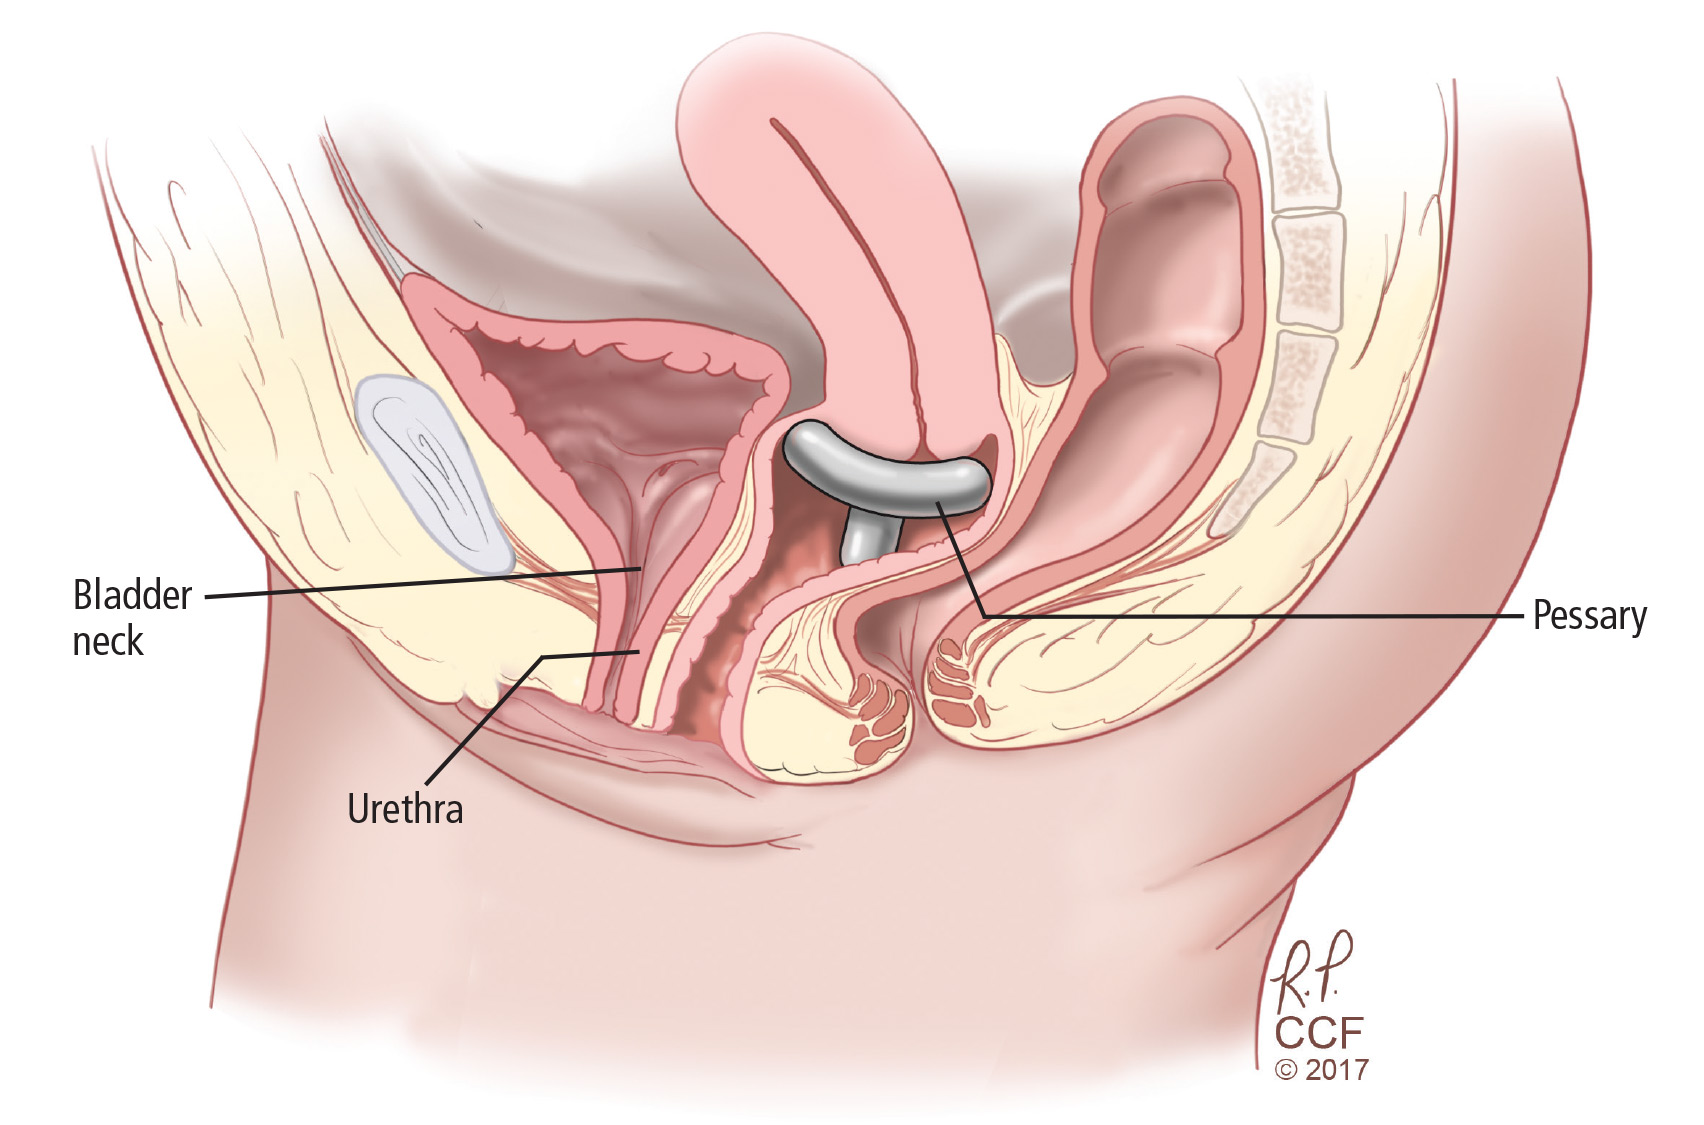
Pessaries are commonly used to treat pelvic organ prolapse but can also be designed to help correct the anatomic defect responsible for stress urinary incontinence. Continence pessaries support the bladder neck so that the urethrovesicular junction is stabilized rather than hypermobile during the increased intra-abdominal pressure that occurs with coughing, sneezing, or physical exertion (Figure 2). In theory, this should decrease leakage.
A systematic review concluded that the value of pessaries in the management of incontinence remains uncertain. However, there are inherent challenges in conducting trials of such devices.19 A pessary needs to be fitted by an appropriately trained healthcare provider. The Ambulatory Treatments for Leakage Associated With Stress Incontinence (ATLAS) trial20 reported that behavioral therapy was more effective than a pessary at 3 months, but the treatments were equivalent at 12 months.
The FDA has approved a disposable, over-the-counter silicone intravaginal device for treating stress urinary incontinence. Patients initially purchase a sizing kit and subsequently insert the nonabsorbent temporary intravaginal bladder supportive device, which is worn for up to 8 hours.
Women may elect to use regular tampons to do the job of a pessary, as they are easy to use and low in cost. No large randomized trials have compared tampons and pessaries, and currently no one device is known to be superior to another.
Overall, these devices are temporizing measures that have few serious adverse effects.
WEIGHT LOSS AND DIETARY CHANGES
Obesity has become a national epidemic, with more than 68% of Americans found to be overweight or obese according to the National Institutes of Health.21
Several studies found obesity to be an independent risk factor for urinary incontinence. As early as 1946, the British Birth Cohort study found that women ages 48 through 54 who were obese earlier in life had a higher risk of urinary incontinence in middle age, and those who were obese by age 20 were more likely to report severe incontinence.22 Likewise, the Nurses’ Health Study showed that women with a body mass index (BMI) more than 30 kg/m2 had 3.1 times the risk of severe incontinence compared with women with a normal BMI. Also, the Study of Women’s Health Across the Nation and the Leicestershire Medical Research Council (MRC) incontinence study both showed that a higher BMI and weight gain are strongly correlated with urinary incontinence.23,24
Increased intra-abdominal pressure may be the causative mechanism of stress urinary incontinence in obesity. The Korean National Health and Nutrition Examination Survey showed that central adiposity correlated with urgency incontinence.25,26
The MRC study was one of the largest to evaluate the effect of diet on urinary symptoms. Consuming a diet dense in vegetables, bread, and chicken was found to reduce the risk of urinary incontinence, while carbonated drinks were associated with a higher risk.25 These studies and others may point to reducing calories, and thus BMI, as a conservative treatment for urinary incontinence.
Newer data show bariatric surgery is associated with a strong reduction in urinary incontinence, demonstrated in a study that followed patients for 3 years after surgery.27 This encouraging result is but one of several positive health outcomes from bariatric surgery.
Recommendation
The ACP recommends both weight loss and exercise for overweight women with urinary incontinence, and grades this as strong with moderate-quality evidence.
DRUG THERAPY
The bladder neck is rich with sympathetic alpha-adrenergic receptors, and the bladder dome is dense with parasympathetic muscarinic receptors and sympathetic beta-adrenergic receptors. When the parasympathetic system is stimulated, the muscarinic receptors are activated, causing detrusor contraction and ultimately bladder emptying.
Agonism of beta-alpha adrenergic receptors and inhibition of parasympathetic receptors are both strategies of drug treatment of urinary incontinence.
Anticholinergic drugs
Anticholinergic medications function by blocking the muscarinic receptor, thereby inhibiting detrusor contraction.
Six oral anticholinergic medications are available: oxybutynin, tolterodine, fesoterodine, solifenacin, trospium, and darifenacin. These drugs have about the same effectiveness in treating urgency urinary incontinence, as measured by achieving continence and improving quality of life.28 Given their similarity in effectiveness, the choice of agent typically relies on the side-effect profile. Extended-release formulations have a more favorable side-effect profile, with fewer cases of dry mouth compared with immediate-release formulations.29
Overall, however, the benefit of these medications is small, with fewer than 200 patients achieving continence per 1,000 treated.28
Other limitations of these medications include their adverse effects and contraindications, and patients’ poor adherence to therapy. The most commonly reported adverse effect is dry mouth, but other common side effects include constipation, abdominal pain, dyspepsia, fatigue, dry eye, and dry skin. Transdermal oxybutynin therapy has been associated with fewer anticholinergic side effects than oral therapy.30
Contraindications to these medications include gastric retention, urinary retention, and angle-closure glaucoma.
Long-term adherence to anticholinergics is low, reported between 14% to 35% after 12 months, with the highest rates of adherence with solifenacin.31 The most commonly cited reason for discontinuation is lack of effect.32
Caution is urged when considering starting anticholinergic medications in older adults because of the central nervous system side effects, including drowsiness, hallucinations, cognitive impairment, and dementia. After 3 weeks, oxybutynin caused a memory decline as measured by delayed recall that was comparable to the decline seen over 10 years in normal aging.33 There is evidence suggesting trospium may cause less cognitive impairment, and therefore may be a better option for older patients.34
Beta-3 adrenoreceptor agonists
Activation of beta-3 adrenergic receptors through the sympathetic nervous system relaxes the detrusor muscle, allowing the bladder to store urine.
Mirabegron is a selective beta-3 adrenoreceptor agonist that effectively relaxes the bladder and increases bladder capacity. It improves continence, treatment satisfaction, and quality of life.35,36 There are fewer reports of dry mouth and constipation with this drug than with the anticholinergics; however, beta-3 adrenoreceptor agonists may be associated with greater risk of hypertension, nasopharyngitis, headache, and urinary tract infection.37
Duloxetine
Duloxetine, an antidepressant, blocks the reuptake of both serotonin and norepinephrine. Consequently, it decreases parasympathetic activity and increases sympathetic and somatic activity in the urinary system.38 While urine is stored, this cascade of neural activity is thought to collectively increase pudendal nerve activity and improve closure of the urethra.
Although duloxetine is approved to treat stress urinary incontinence in Europe, this is an off-label use in the United States.
A meta-analysis39 found that duloxetine improved quality of life in patients with stress urinary incontinence and that subjective cure rates were 10.8% with duloxetine vs 7.7% with placebo (P = .04). However the rate of adverse events is high, with nausea most common. Given its modest benefit and high rate of side effects, physicians may consider starting duloxetine only if there are psychiatric comorbidities such as depression, anxiety, or fibromyalgia.
Recommendations
The ACP recommends against systemic pharmacologic therapy for stress urinary incontinence. For urgency urinary incontinence, pharmacologic therapy is recommended if bladder training fails, and should be individualized based on the patient’s preference and medical comorbidities and the drug’s tolerability, cost, and ease of use.
Hormone therapy
In 2014, the North American Menopause Society recommended replacing the term “vulvovaginal atrophy” with the term genitourinary syndrome of menopause, which better encompasses the postmenopausal changes to the female genital system.40
Estrogen therapy is commercially available in both systemic and local preparations. The effect of exogenous estrogen on urinary incontinence may depend on whether it is given locally or systemically.
A systematic review41 definitively concluded that all commercially prepared local vaginal estrogen preparations can effectively relieve the genitourinary syndrome of menopause, including not only the common complaints of dryness, burning, and irritation but also urinary complaints of frequency, urgency, and urgency urinary incontinence.41 Additionally, the estradiol vaginal ring for vaginal atrophy (Estring) may have dual effects, functioning like an incontinence pessary by supporting the bladder neck while simultaneously providing local estrogen to the atrophied vaginal tissue.
However, in the Women’s Health Initiative,42 continent women who received either systemic estrogen therapy alone or systemic estrogen combined with progestin actually had a higher risk of developing urinary incontinence, and those already experiencing incontinence developed a worsening of their symptoms on systemic hormone therapy. The mechanism by which systemic hormone therapy causes urinary incontinence is unclear; however, previous studies showed that hormone therapy leads to a reduction in periurethral collagen and increased bladder contractility.43,44
TAKE-HOME POINTS
- Half of women with symptomatic urinary incontinence never report their symptoms.
- Bladder training is recommended for urgency incontinence and pelvic floor muscle training for stress incontinence.
- Thirty percent of women perform pelvic floor exercises incorrectly.
- Devices can be considered, including automatic pelvic exercise devices for stress and urgency incontinence and incontinence pessaries and disposable intravaginal bladder support devices for stress incontinence.
- Higher BMIs are strongly correlated with urinary incontinence.
- Anticholinergic medications are recommended for urgency but not stress incontinence.
- Vaginal estrogen cream may help with symptoms of urinary urgency, recurrent bladder infections, and nocturia in addition to incontinence.
- Qaseem A, Dallas P, Forciea MA, Starkey M, Denberg TD, Shekelle P; Clinical Guidelines Committee of the American College of Physicians. Nonsurgical management of urinary incontinence in women: a clinical practice guideline from the American College of Physicians. Ann Intern Med 2014; 161:429–440.
- Nygaard I, Barber MD, Burgio KL, et al; Pelvic Floor Disorders Network. Prevalence of symptomatic pelvic floor disorders in US women. JAMA 2008; 300:1311–1316.
- Wu JM, Vaughan CP, Goode PS, et al. Prevalence and trends of symptomatic pelvic floor disorders in US women. Obstet Gynecol 2014; 123:141–148.
- Wu JM, Stinnett S, Jackson RA, Jacoby A, Learman LA, Kuppermann M. Prevalence and incidence of urinary incontinence in a diverse population of women with noncancerous gynecologic conditions. Female Pelvic Med Reconstr Surg 2010; 16:284–289.
- Griffiths AN, Makam A, Edward GJ. Should we actively screen for urinary and anal incontinence in the general gynaecology outpatients setting? A prospective observational study. J Obstet Gynaecol 2006; 26:442–444.
- Coyne KS, Wein A, Nicholson S, Kvasz M, Chen CI, Milsom I. Economic burden of urgency urinary incontinence in the United Stated: a systematic review. J Manag Care Pharm 2014; 20:130–140.
- Haylen BT, Ridder D, Freeman RM, et al; International Urogynecological Association; International Continence Society. An International Urogynecological Association (IUGA)/International Continence Society (ICS) joint report on the terminology for female pelvic floor dysfunction. Neurourol Urodyn 2010; 29:4–20.
- Wu JM, Matthews CA, Conover MM, Pate V, Jonsson Funk M. Lifetime risk of stress urinary incontinence or pelvic organ prolapse surgery. Obstet Gynecol 2014; 123:1201–1206.
- Wyman JF, Fantl JA. Bladder training in the ambulatory care management of urinary incontinence. Urol Nurs 1991; 11:11–17.
- Fantl JA, Wyman JF, McClish DK, et al. Efficacy of bladder training in older women with urinary incontinence. JAMA 1991; 265:609–613.
- Subak LL, Quesenberry CP, Posner SF, Cattolica E, Soghikian K. The effect of behavioral therapy on urinary incontinence: a randomized controlled trial. Obstet Gynecol 2002; 100:72–78.
- Kegel AH. Progressive resistance exercise in the functional restoration of the perineal muscles. Am J Obstet Gynecol 1948; 56:238–248.
- Domoulin C, Hay-Smith EJ, Mac Habée-Séguin G. Pelvic floor muscle training versus no treatment, or inactive control treatments, for urinary incontinence in women. Cochrane Database Syst Rev 2014; 5:CD005654.
- Hay-Smith EJ, Herderschee R, Dumoulin C, Herbison GP. Comparisons of approaches to pelvic floor muscle training for urinary incontinence in women. Cochrane Database Syst Rev 2011; 12:CD009508.
- Bo K. Pelvic floor muscle strength and response to pelvic floor muscle training for stress urinary incontinence. Neurourol Urodyn 2003; 22:654–658.
- Herderschee R, Hay-Smith EJ, Herbison GP, Roovers JP, Heineman MJ. Feedback or biofeedback to augment pelvic floor muscle training for urinary incontinence in women. Cochrane Database Syst Rev 2011; 7:CD009252.
- Terlikowski R, Dobrzycka B, Kinalski M, Kuryliszyn-Moskal A, Terlikowski SJ. Transvaginal electrical stimulation with surface-EMG biofeedback in managing stress urinary incontinence in women of premenopausal age: a double-blind, placebo-controlled, randomized clinical trial. Int Urogynecol J 2013; 17:1631–1638.
- Guralnick ML, Kelly H, Engelke H, Koduri S, O’Connor RC. InTone: a novel pelvic floor rehabilitation device for urinary incontinence. Int Urogynecol J 2015; 26:99–106.
- Lipp A, Shaw C, Glavind K. Mechanical devices for urinary incontinence in women. Cochrane Database Syst Rev 2014; 12:CD001756.
- Richter HE, Burgio KL, Brubaker L, et al; Pelvic Floor Disorders Network. Continence pessary compared with behavioral therapy or combined therapy for stress incontinence: a randomized controlled trial. Obstet Gynecol 2010; 115:609–617.
- National Institute of Diabetes and Digestive and Kidney Diseases (NIDDK). Overweight and obesity statistics. www.niddk.nih.gov/health-information/health-statistics/Pages/overweight-obesity-statistics.aspx. Accessed January 6, 2017.
- Mishra GD, Hardy R, Cardozo L, Kuh D. Body weight through adult life and risk of urinary incontinence in middle-aged women. Results from a British prospective cohort. Int J Obes (Lond) 2008; 32:1415–1422.
- Danforth KN, Townsend MK, Lifford K, Curhan GC, Resnick NM, Grodstein F. Risk factors for urinary incontinence among middle age women. Am J Obstet Gynecol 2006; 194:339–345.
- Waetjen LE, Liao S, Johnson WO, et al. Factors associated with prevalence and incident urinary incontinence in a cohort of midlife women: a longitudinal analysis of data: study of women’s health across the nation. Am J Epidemiol 2007; 165:309–318.
- Dallosso HM, McGrother CW, Matthews RJ, Donaldson MM; Leicestershire MRC Incontinence Study Group. The association of diet and other lifestyle factors with overactive bladder and stress incontinence: a longitudinal study in women. BJU Int 2003; 92:69–77.
- Kim IH, Chung H, Kwon JW. Gender differences in the effect of obesity on chronic diseases among the elderly Koreans. J Korean Med Sci. 2011; 26:250–257.
- Subak LL, King WC, Belle SH, et al. Urinary incontinence before and after bariatric surgery. JAMA Intern Med 2015; 175:1378–1387.
- Shamliyan T, Wyman JF, Ramakrishnan R, Sainfort F, Kane RL. Benefits and harms of pharmacologic treatment for urinary incontinence in women: a systematic review. Ann Intern Med 2012; 156:861–874, W301–W310.
- Hay-Smith J, Herbison P, Ellis G, Morris A. Which anticholinergic drug for overactive bladder symptoms in adults. Cochrane Database Syst Rev 2005; 3:CD005429.
- Davila GW, Daugherty CA, Sanders SW; Transdermal Oxybutynin Study Group. A short term, multicenter, randomized double-blind dose titration study of the efficacy and anticholinergic side effects of transdermal compared to immediate release oral oxybutynin treatment of patients with urge urinary incontinence. J Urol 2001; 166:140–145.
- Wagg A, Compion G, Fahey A, Siddiqui E. Persistence with prescribed antimuscarinic therapy for overactive bladder: a UK experience. BJU Int 2012; 110:1767–1774.
- Benner JS, Nichol MB, Rovner ES, et al. Patient-reported reasons for discontinuing overactive bladder medication. BJU Int 2010; 105:1276–1282.
- Kay G, Crook T, Rekeda L, et al. Differential effects of the antimuscarinic agents darifenacin and oxybutynin ER on memory in older subjects. Eur Urol 2006; 50:317–326.
- Staskin D, Kay G, Tannenbaum C, et al. Trospium chloride has no effect on memory testing and is assay undetectable in the central nervous system of older patients with overactive bladder. Int J Clin Pract 2010; 64:1294–1300.
- Chapple CR, Amarenco G, Lopez A, et al; BLOSSOM Investigator Group. A proof of concept study: mirabegron, a new therapy for overactive bladder. Neurourol Urodyn 2013; 32:1116–1122.
- Nitti VB, Khullar V, van Kerrebroeck P, et al. Mirabegron for the treatment of overactive bladder: a prespecified pooled efficacy analysis and pooled safety analysis of three randomised, double-blind, placebo-controlled, phase III studies. Int J Clin Pract 2013; 67:619–632.
- Maman K, Aballea S, Nazir J, et al. Comparative efficacy and safety of medical treatments for the management of overactive bladder: a systematic literature review and mixed treatment comparison. Eur Urol 2014; 65:755–765.
- Katofiasc MA, Nissen J, Audia JE, Thor KB. Comparison of the effects of serotonin selective, norepinephrine, and dual serotonin and norepinephrine reuptake inhibitors on lower urinary tract function in cats. Life Sci 2002; 71:1227–1236.
- Mariappan P, Alhasso A, Ballantyne Z, Grant A, N’Dow J. Duloxetine, a serotonin and noradrenaline reuptake inhibitor for the treatment of stress urinary incontinence: a systematic review. Eur Urol 2007; 51:67–74.
- Portman DJ, Gass ML; Vulvovaginal Atrophy Terminology Consensus Conference Panel. Genitourinary syndrome of menopause: new terminology for vulvovaginal atrophy from the International Society for the Study of Women’s Sexual Health and the North American Menopause Society. Menopause 2014; 21:1063–1068.
- Rahn DD, Carberry C, Sanses TV, et al; Society of Gynecologic Surgeons Systematic Review Group. Vaginal estrogen for genitourinary syndrome of menopause: a systematic review. Obstet Gynecol 2014; 124:1147–1156.
- Hendrix SL, Cochrane BB, Nygaard IE, et al. Effects of estrogen with and without progestin on urinary incontinence. JAMA 2005; 293:935–948.
- Jackson S, James M, Abrams P. The effect of estradiol on vaginal collagen metabolism in postmenopausal women with genuine stress incontinence. BJOG 2002; 109:339–344.
- Lin AD, Levin R, Kogan B, et al. Estrogen induced functional hypertrophy and increased force generation of the female rabbit bladder. Neurourol Urodyn 2006; 25:473–479.
Urinary incontinence can lead to a cascade of symptomatic burden on the patient, causing distress, embarrassment, and suffering.
See related patient information
Traditionally, incontinence has been treated by surgeons, and surgery remains an option. However, more patients are now being managed by medical clinicians, who can offer a number of newer therapies. Ideally, a medical physician can initiate the evaluation and treatment and even effectively cure some forms of urinary incontinence.
In 2014, the American College of Physicians (ACP) published recommendations on the medical treatment of urinary incontinence in women (Table 1).1
This review describes the medical management of urinary incontinence in women, emphasizing the ACP recommendations1 and newer over-the-counter options.
COMMON AND UNDERREPORTED
Many women erroneously believe that urinary incontinence is an inevitable consequence of aging and allow it to lessen their quality of life without seeking medical attention.
Indeed, it is common. The 2005–2006 National Health and Nutritional Examination Survey2 found the prevalence of urinary incontinence in US women to be 15.7%. The prevalence increases with age from 6.9% in women ages 20 through 29 to 31.7% in those age 80 and older. A separate analysis of the same data found that 25.0% of women age 20 and older had 1 or more pelvic floor disorders.3 Some estimates are even higher. Wu et al4 reported a prevalence of urinary incontinence of 51.1% in women ages 31 through 54.
Too few of these women are identified and treated, for many reasons, including embarrassment and inadequate screening. Half of women with urinary incontinence do not report their symptoms because of humiliation or anxiety.5
The burden of urinary incontinence extends beyond the individual and into society. The total cost of overactive bladder and urgency urinary incontinence in the United States was estimated to be $65.9 billion in 2007 and is projected to reach $82.6 billion in 2020.6
THREE TYPES
There are 3 types of urinary incontinence: stress, urgency, and mixed.
Stress urinary incontinence is involuntary loss of urine associated with physical exertion or increased abdominal pressure, eg, with coughing or sneezing.
Urgency urinary incontinence is involuntary loss of urine associated with the sudden need to void. Many patients experience these symptoms simultaneously, making the distinction difficult.
Mixed urinary incontinence is loss of urine with both urgency and increased abdominal pressure or physical exertion.
Overactive bladder, a related problem, is defined as urinary urgency, usually accompanied by frequency and nocturia, with or without urgency urinary incontinence, in the absence of a urinary tract infection or other obvious disease.7
Nongenitourinary causes such as neurologic disorders or even malignancy can present with urinary incontinence, and thus it is critical to perform a thorough initial evaluation.
A 2014 study revealed that by age 80, 20% of women may need to undergo surgery for stress urinary incontinence or pelvic organ prolapse. This statistic should motivate healthcare providers to focus on prevention and offer conservative medical management for these conditions first.8
QUESTIONS TO ASK
When doing a pelvic examination, once could inquire about urinary incontinence with questions such as:
Do you leak urine when you cough, sneeze, laugh, or jump or during sexual climax?
Do you have to get up more than once at night to urinate?
Do you feel the urge to urinate frequently?
BEHAVIORAL MODIFICATION AND BLADDER TRAINING
Bladder training is a conservative behavioral treatment for urinary incontinence that primary care physicians can teach. It is primarily used for urgency urinary incontinence but can also be useful in stress urinary incontinence.
After completing a bladder diary and gaining awareness of their daily voiding patterns, patients can learn scheduled voiding to train the bladder, gradually extending the urges to longer intervals.
Clinicians should instruct patients on how to train the bladder, using methods first described by Wyman and Fantl.9 (See Training the bladder.)
There is evidence that bladder training improves urinary incontinence compared with usual care.10,11
The ACP recommends bladder training for women who have urgency urinary incontinence, but grades this recommendation as weak with low-quality evidence.
PELVIC FLOOR MUSCLE TRAINING
Introduced in 1948 by Dr. Arnold Kegel, pelvic floor muscle training has become widely adopted.12
The pelvic floor consists of a group of muscles, resembling a hammock, that support the pelvic viscera. These muscles include the coccygeus and the layers of the levator ani (Figure 1). A weak pelvic floor is one of many risk factors for developing stress urinary incontinence. Like other muscle groups, a weak pelvic floor can be rehabilitated through various techniques, often guided by a physical therapist.
Compared with those who received no treatment, women with stress urinary incontinence who performed pelvic floor muscle training were 8 times more likely to report being cured and 17 times more likely to report cure or improvement.13
To perform a Kegel exercise, a woman consciously contracts her pelvic floor muscles as if stopping the flow of urine.
The Knack maneuver can be used to prevent leakage during anticipated events that increase intra-abdominal pressure. For example, when a cough or sneeze is imminent, patients can preemptively contract their pelvic floor and hold the contraction through the cough or sneeze.
Although many protocols have been compared, no specific pelvic floor exercise strategy has proven superior. A systematic review assessed variations in pelvic floor interventions, exercises, and delivery and found that there was insufficient evidence to make any recommendations about the best approach. However, the benefit was greater with regular supervision during pelvic floor muscle training than with little or no supervision.14
Pelvic floor muscle training strengthens the pelvic floor, which better supports the bladder neck and anatomically compensates for defects in stress urinary incontinence. In urgency urinary incontinence, a strong pelvic floor created by muscle training prevents leaking induced by the involuntary contractions of the detrusor muscle.
Recommendation
The ACP recommends pelvic floor muscle training as first-line treatment for stress urinary incontinence and mixed urinary incontinence, and grades this recommendation as strong with high-quality evidence.
BIOFEEDBACK AND PELVIC STIMULATION
Although pelvic floor exercises are effective in urinary incontinence, 30% of patients perform them incorrectly.15
Biofeedback therapy uses visual, verbal, and acoustic signals to give the patient immediate feedback and a greater awareness of her muscular activity. A commonly used technique employs a vaginal probe to measure and display pressure changes as the patient contracts her levator ani muscles.
Women who received biofeedback in addition to traditional pelvic floor physical therapy had greater improvement in urinary incontinence than those who received pelvic physical therapy alone (risk ratio 0.75, 95% confidence interval 0.66–0.86).16
Pelvic stimulation can be used separately or in conjunction with biofeedback in both urgency and stress urinary incontinence. When pelvic stimulation is used alone, 9 women need to be treated to achieve continence in 1, and 6 women need to be treated to improve continence in 1.16
Traditionally delivered by a pelvic floor physical therapist, pelvic stimulation and biofeedback have also been validated for home use.17,18 Several pelvic stimulation devices have been approved by the US Food and Drug Administration (FDA) for treating stress, urgency, and mixed urinary incontinence. These devices deliver stimulation to the pelvic floor at single or multiple frequencies. Although the mechanisms are not clearly understood, lower frequencies are used to treat urgency incontinence, while higher frequencies are used for stress incontinence. A theory is that higher-frequency stimulation strengthens the pelvic floor in stress urinary incontinence while lower frequency stimulation calms the detrusor muscle in urgency urinary incontinence.
The Apex and Apex M devices are both available over the counter, the former to treat stress urinary incontinence and the latter to treat mixed urinary incontinence, using pelvic stimulation alone. Other available devices, including the InTone and a smaller version, the InTone MV, are available by prescription and combine pelvic stimulation with biofeedback.18
Women who wish to avoid surgery, botulinum toxin injections, and daily oral medications, particularly those who are highly motivated, are ideal candidates for these over-the-counter automatic neuromuscular pelvic exercising devices.
PESSARIES AND OTHER DEVICES
Pessaries are commonly used to treat pelvic organ prolapse but can also be designed to help correct the anatomic defect responsible for stress urinary incontinence. Continence pessaries support the bladder neck so that the urethrovesicular junction is stabilized rather than hypermobile during the increased intra-abdominal pressure that occurs with coughing, sneezing, or physical exertion (Figure 2). In theory, this should decrease leakage.
A systematic review concluded that the value of pessaries in the management of incontinence remains uncertain. However, there are inherent challenges in conducting trials of such devices.19 A pessary needs to be fitted by an appropriately trained healthcare provider. The Ambulatory Treatments for Leakage Associated With Stress Incontinence (ATLAS) trial20 reported that behavioral therapy was more effective than a pessary at 3 months, but the treatments were equivalent at 12 months.
The FDA has approved a disposable, over-the-counter silicone intravaginal device for treating stress urinary incontinence. Patients initially purchase a sizing kit and subsequently insert the nonabsorbent temporary intravaginal bladder supportive device, which is worn for up to 8 hours.
Women may elect to use regular tampons to do the job of a pessary, as they are easy to use and low in cost. No large randomized trials have compared tampons and pessaries, and currently no one device is known to be superior to another.
Overall, these devices are temporizing measures that have few serious adverse effects.
WEIGHT LOSS AND DIETARY CHANGES
Obesity has become a national epidemic, with more than 68% of Americans found to be overweight or obese according to the National Institutes of Health.21
Several studies found obesity to be an independent risk factor for urinary incontinence. As early as 1946, the British Birth Cohort study found that women ages 48 through 54 who were obese earlier in life had a higher risk of urinary incontinence in middle age, and those who were obese by age 20 were more likely to report severe incontinence.22 Likewise, the Nurses’ Health Study showed that women with a body mass index (BMI) more than 30 kg/m2 had 3.1 times the risk of severe incontinence compared with women with a normal BMI. Also, the Study of Women’s Health Across the Nation and the Leicestershire Medical Research Council (MRC) incontinence study both showed that a higher BMI and weight gain are strongly correlated with urinary incontinence.23,24
Increased intra-abdominal pressure may be the causative mechanism of stress urinary incontinence in obesity. The Korean National Health and Nutrition Examination Survey showed that central adiposity correlated with urgency incontinence.25,26
The MRC study was one of the largest to evaluate the effect of diet on urinary symptoms. Consuming a diet dense in vegetables, bread, and chicken was found to reduce the risk of urinary incontinence, while carbonated drinks were associated with a higher risk.25 These studies and others may point to reducing calories, and thus BMI, as a conservative treatment for urinary incontinence.
Newer data show bariatric surgery is associated with a strong reduction in urinary incontinence, demonstrated in a study that followed patients for 3 years after surgery.27 This encouraging result is but one of several positive health outcomes from bariatric surgery.
Recommendation
The ACP recommends both weight loss and exercise for overweight women with urinary incontinence, and grades this as strong with moderate-quality evidence.
DRUG THERAPY
The bladder neck is rich with sympathetic alpha-adrenergic receptors, and the bladder dome is dense with parasympathetic muscarinic receptors and sympathetic beta-adrenergic receptors. When the parasympathetic system is stimulated, the muscarinic receptors are activated, causing detrusor contraction and ultimately bladder emptying.
Agonism of beta-alpha adrenergic receptors and inhibition of parasympathetic receptors are both strategies of drug treatment of urinary incontinence.
Anticholinergic drugs
Anticholinergic medications function by blocking the muscarinic receptor, thereby inhibiting detrusor contraction.
Six oral anticholinergic medications are available: oxybutynin, tolterodine, fesoterodine, solifenacin, trospium, and darifenacin. These drugs have about the same effectiveness in treating urgency urinary incontinence, as measured by achieving continence and improving quality of life.28 Given their similarity in effectiveness, the choice of agent typically relies on the side-effect profile. Extended-release formulations have a more favorable side-effect profile, with fewer cases of dry mouth compared with immediate-release formulations.29
Overall, however, the benefit of these medications is small, with fewer than 200 patients achieving continence per 1,000 treated.28
Other limitations of these medications include their adverse effects and contraindications, and patients’ poor adherence to therapy. The most commonly reported adverse effect is dry mouth, but other common side effects include constipation, abdominal pain, dyspepsia, fatigue, dry eye, and dry skin. Transdermal oxybutynin therapy has been associated with fewer anticholinergic side effects than oral therapy.30
Contraindications to these medications include gastric retention, urinary retention, and angle-closure glaucoma.
Long-term adherence to anticholinergics is low, reported between 14% to 35% after 12 months, with the highest rates of adherence with solifenacin.31 The most commonly cited reason for discontinuation is lack of effect.32
Caution is urged when considering starting anticholinergic medications in older adults because of the central nervous system side effects, including drowsiness, hallucinations, cognitive impairment, and dementia. After 3 weeks, oxybutynin caused a memory decline as measured by delayed recall that was comparable to the decline seen over 10 years in normal aging.33 There is evidence suggesting trospium may cause less cognitive impairment, and therefore may be a better option for older patients.34
Beta-3 adrenoreceptor agonists
Activation of beta-3 adrenergic receptors through the sympathetic nervous system relaxes the detrusor muscle, allowing the bladder to store urine.
Mirabegron is a selective beta-3 adrenoreceptor agonist that effectively relaxes the bladder and increases bladder capacity. It improves continence, treatment satisfaction, and quality of life.35,36 There are fewer reports of dry mouth and constipation with this drug than with the anticholinergics; however, beta-3 adrenoreceptor agonists may be associated with greater risk of hypertension, nasopharyngitis, headache, and urinary tract infection.37
Duloxetine
Duloxetine, an antidepressant, blocks the reuptake of both serotonin and norepinephrine. Consequently, it decreases parasympathetic activity and increases sympathetic and somatic activity in the urinary system.38 While urine is stored, this cascade of neural activity is thought to collectively increase pudendal nerve activity and improve closure of the urethra.
Although duloxetine is approved to treat stress urinary incontinence in Europe, this is an off-label use in the United States.
A meta-analysis39 found that duloxetine improved quality of life in patients with stress urinary incontinence and that subjective cure rates were 10.8% with duloxetine vs 7.7% with placebo (P = .04). However the rate of adverse events is high, with nausea most common. Given its modest benefit and high rate of side effects, physicians may consider starting duloxetine only if there are psychiatric comorbidities such as depression, anxiety, or fibromyalgia.
Recommendations
The ACP recommends against systemic pharmacologic therapy for stress urinary incontinence. For urgency urinary incontinence, pharmacologic therapy is recommended if bladder training fails, and should be individualized based on the patient’s preference and medical comorbidities and the drug’s tolerability, cost, and ease of use.
Hormone therapy
In 2014, the North American Menopause Society recommended replacing the term “vulvovaginal atrophy” with the term genitourinary syndrome of menopause, which better encompasses the postmenopausal changes to the female genital system.40
Estrogen therapy is commercially available in both systemic and local preparations. The effect of exogenous estrogen on urinary incontinence may depend on whether it is given locally or systemically.
A systematic review41 definitively concluded that all commercially prepared local vaginal estrogen preparations can effectively relieve the genitourinary syndrome of menopause, including not only the common complaints of dryness, burning, and irritation but also urinary complaints of frequency, urgency, and urgency urinary incontinence.41 Additionally, the estradiol vaginal ring for vaginal atrophy (Estring) may have dual effects, functioning like an incontinence pessary by supporting the bladder neck while simultaneously providing local estrogen to the atrophied vaginal tissue.
However, in the Women’s Health Initiative,42 continent women who received either systemic estrogen therapy alone or systemic estrogen combined with progestin actually had a higher risk of developing urinary incontinence, and those already experiencing incontinence developed a worsening of their symptoms on systemic hormone therapy. The mechanism by which systemic hormone therapy causes urinary incontinence is unclear; however, previous studies showed that hormone therapy leads to a reduction in periurethral collagen and increased bladder contractility.43,44
TAKE-HOME POINTS
- Half of women with symptomatic urinary incontinence never report their symptoms.
- Bladder training is recommended for urgency incontinence and pelvic floor muscle training for stress incontinence.
- Thirty percent of women perform pelvic floor exercises incorrectly.
- Devices can be considered, including automatic pelvic exercise devices for stress and urgency incontinence and incontinence pessaries and disposable intravaginal bladder support devices for stress incontinence.
- Higher BMIs are strongly correlated with urinary incontinence.
- Anticholinergic medications are recommended for urgency but not stress incontinence.
- Vaginal estrogen cream may help with symptoms of urinary urgency, recurrent bladder infections, and nocturia in addition to incontinence.
- Qaseem A, Dallas P, Forciea MA, Starkey M, Denberg TD, Shekelle P; Clinical Guidelines Committee of the American College of Physicians. Nonsurgical management of urinary incontinence in women: a clinical practice guideline from the American College of Physicians. Ann Intern Med 2014; 161:429–440.
- Nygaard I, Barber MD, Burgio KL, et al; Pelvic Floor Disorders Network. Prevalence of symptomatic pelvic floor disorders in US women. JAMA 2008; 300:1311–1316.
- Wu JM, Vaughan CP, Goode PS, et al. Prevalence and trends of symptomatic pelvic floor disorders in US women. Obstet Gynecol 2014; 123:141–148.
- Wu JM, Stinnett S, Jackson RA, Jacoby A, Learman LA, Kuppermann M. Prevalence and incidence of urinary incontinence in a diverse population of women with noncancerous gynecologic conditions. Female Pelvic Med Reconstr Surg 2010; 16:284–289.
- Griffiths AN, Makam A, Edward GJ. Should we actively screen for urinary and anal incontinence in the general gynaecology outpatients setting? A prospective observational study. J Obstet Gynaecol 2006; 26:442–444.
- Coyne KS, Wein A, Nicholson S, Kvasz M, Chen CI, Milsom I. Economic burden of urgency urinary incontinence in the United Stated: a systematic review. J Manag Care Pharm 2014; 20:130–140.
- Haylen BT, Ridder D, Freeman RM, et al; International Urogynecological Association; International Continence Society. An International Urogynecological Association (IUGA)/International Continence Society (ICS) joint report on the terminology for female pelvic floor dysfunction. Neurourol Urodyn 2010; 29:4–20.
- Wu JM, Matthews CA, Conover MM, Pate V, Jonsson Funk M. Lifetime risk of stress urinary incontinence or pelvic organ prolapse surgery. Obstet Gynecol 2014; 123:1201–1206.
- Wyman JF, Fantl JA. Bladder training in the ambulatory care management of urinary incontinence. Urol Nurs 1991; 11:11–17.
- Fantl JA, Wyman JF, McClish DK, et al. Efficacy of bladder training in older women with urinary incontinence. JAMA 1991; 265:609–613.
- Subak LL, Quesenberry CP, Posner SF, Cattolica E, Soghikian K. The effect of behavioral therapy on urinary incontinence: a randomized controlled trial. Obstet Gynecol 2002; 100:72–78.
- Kegel AH. Progressive resistance exercise in the functional restoration of the perineal muscles. Am J Obstet Gynecol 1948; 56:238–248.
- Domoulin C, Hay-Smith EJ, Mac Habée-Séguin G. Pelvic floor muscle training versus no treatment, or inactive control treatments, for urinary incontinence in women. Cochrane Database Syst Rev 2014; 5:CD005654.
- Hay-Smith EJ, Herderschee R, Dumoulin C, Herbison GP. Comparisons of approaches to pelvic floor muscle training for urinary incontinence in women. Cochrane Database Syst Rev 2011; 12:CD009508.
- Bo K. Pelvic floor muscle strength and response to pelvic floor muscle training for stress urinary incontinence. Neurourol Urodyn 2003; 22:654–658.
- Herderschee R, Hay-Smith EJ, Herbison GP, Roovers JP, Heineman MJ. Feedback or biofeedback to augment pelvic floor muscle training for urinary incontinence in women. Cochrane Database Syst Rev 2011; 7:CD009252.
- Terlikowski R, Dobrzycka B, Kinalski M, Kuryliszyn-Moskal A, Terlikowski SJ. Transvaginal electrical stimulation with surface-EMG biofeedback in managing stress urinary incontinence in women of premenopausal age: a double-blind, placebo-controlled, randomized clinical trial. Int Urogynecol J 2013; 17:1631–1638.
- Guralnick ML, Kelly H, Engelke H, Koduri S, O’Connor RC. InTone: a novel pelvic floor rehabilitation device for urinary incontinence. Int Urogynecol J 2015; 26:99–106.
- Lipp A, Shaw C, Glavind K. Mechanical devices for urinary incontinence in women. Cochrane Database Syst Rev 2014; 12:CD001756.
- Richter HE, Burgio KL, Brubaker L, et al; Pelvic Floor Disorders Network. Continence pessary compared with behavioral therapy or combined therapy for stress incontinence: a randomized controlled trial. Obstet Gynecol 2010; 115:609–617.
- National Institute of Diabetes and Digestive and Kidney Diseases (NIDDK). Overweight and obesity statistics. www.niddk.nih.gov/health-information/health-statistics/Pages/overweight-obesity-statistics.aspx. Accessed January 6, 2017.
- Mishra GD, Hardy R, Cardozo L, Kuh D. Body weight through adult life and risk of urinary incontinence in middle-aged women. Results from a British prospective cohort. Int J Obes (Lond) 2008; 32:1415–1422.
- Danforth KN, Townsend MK, Lifford K, Curhan GC, Resnick NM, Grodstein F. Risk factors for urinary incontinence among middle age women. Am J Obstet Gynecol 2006; 194:339–345.
- Waetjen LE, Liao S, Johnson WO, et al. Factors associated with prevalence and incident urinary incontinence in a cohort of midlife women: a longitudinal analysis of data: study of women’s health across the nation. Am J Epidemiol 2007; 165:309–318.
- Dallosso HM, McGrother CW, Matthews RJ, Donaldson MM; Leicestershire MRC Incontinence Study Group. The association of diet and other lifestyle factors with overactive bladder and stress incontinence: a longitudinal study in women. BJU Int 2003; 92:69–77.
- Kim IH, Chung H, Kwon JW. Gender differences in the effect of obesity on chronic diseases among the elderly Koreans. J Korean Med Sci. 2011; 26:250–257.
- Subak LL, King WC, Belle SH, et al. Urinary incontinence before and after bariatric surgery. JAMA Intern Med 2015; 175:1378–1387.
- Shamliyan T, Wyman JF, Ramakrishnan R, Sainfort F, Kane RL. Benefits and harms of pharmacologic treatment for urinary incontinence in women: a systematic review. Ann Intern Med 2012; 156:861–874, W301–W310.
- Hay-Smith J, Herbison P, Ellis G, Morris A. Which anticholinergic drug for overactive bladder symptoms in adults. Cochrane Database Syst Rev 2005; 3:CD005429.
- Davila GW, Daugherty CA, Sanders SW; Transdermal Oxybutynin Study Group. A short term, multicenter, randomized double-blind dose titration study of the efficacy and anticholinergic side effects of transdermal compared to immediate release oral oxybutynin treatment of patients with urge urinary incontinence. J Urol 2001; 166:140–145.
- Wagg A, Compion G, Fahey A, Siddiqui E. Persistence with prescribed antimuscarinic therapy for overactive bladder: a UK experience. BJU Int 2012; 110:1767–1774.
- Benner JS, Nichol MB, Rovner ES, et al. Patient-reported reasons for discontinuing overactive bladder medication. BJU Int 2010; 105:1276–1282.
- Kay G, Crook T, Rekeda L, et al. Differential effects of the antimuscarinic agents darifenacin and oxybutynin ER on memory in older subjects. Eur Urol 2006; 50:317–326.
- Staskin D, Kay G, Tannenbaum C, et al. Trospium chloride has no effect on memory testing and is assay undetectable in the central nervous system of older patients with overactive bladder. Int J Clin Pract 2010; 64:1294–1300.
- Chapple CR, Amarenco G, Lopez A, et al; BLOSSOM Investigator Group. A proof of concept study: mirabegron, a new therapy for overactive bladder. Neurourol Urodyn 2013; 32:1116–1122.
- Nitti VB, Khullar V, van Kerrebroeck P, et al. Mirabegron for the treatment of overactive bladder: a prespecified pooled efficacy analysis and pooled safety analysis of three randomised, double-blind, placebo-controlled, phase III studies. Int J Clin Pract 2013; 67:619–632.
- Maman K, Aballea S, Nazir J, et al. Comparative efficacy and safety of medical treatments for the management of overactive bladder: a systematic literature review and mixed treatment comparison. Eur Urol 2014; 65:755–765.
- Katofiasc MA, Nissen J, Audia JE, Thor KB. Comparison of the effects of serotonin selective, norepinephrine, and dual serotonin and norepinephrine reuptake inhibitors on lower urinary tract function in cats. Life Sci 2002; 71:1227–1236.
- Mariappan P, Alhasso A, Ballantyne Z, Grant A, N’Dow J. Duloxetine, a serotonin and noradrenaline reuptake inhibitor for the treatment of stress urinary incontinence: a systematic review. Eur Urol 2007; 51:67–74.
- Portman DJ, Gass ML; Vulvovaginal Atrophy Terminology Consensus Conference Panel. Genitourinary syndrome of menopause: new terminology for vulvovaginal atrophy from the International Society for the Study of Women’s Sexual Health and the North American Menopause Society. Menopause 2014; 21:1063–1068.
- Rahn DD, Carberry C, Sanses TV, et al; Society of Gynecologic Surgeons Systematic Review Group. Vaginal estrogen for genitourinary syndrome of menopause: a systematic review. Obstet Gynecol 2014; 124:1147–1156.
- Hendrix SL, Cochrane BB, Nygaard IE, et al. Effects of estrogen with and without progestin on urinary incontinence. JAMA 2005; 293:935–948.
- Jackson S, James M, Abrams P. The effect of estradiol on vaginal collagen metabolism in postmenopausal women with genuine stress incontinence. BJOG 2002; 109:339–344.
- Lin AD, Levin R, Kogan B, et al. Estrogen induced functional hypertrophy and increased force generation of the female rabbit bladder. Neurourol Urodyn 2006; 25:473–479.
KEY POINTS
- The 3 types of urinary incontinence are stress, urgency, and mixed.
- The American College of Physicians (ACP) recommends weight loss and exercise for obese women with any of the 3 types of urinary incontinence.
- Pelvic floor muscle training has a strong ACP recommendation for stress incontinence, bladder training has a weak recommendation for urgency incontinence, and the combination of both has a strong recommendation in mixed incontinence.
- Drug treatment has a strong ACP recommendation for urgency incontinence if bladder training is unsuccessful, whereas the recommendation is against drug treatment for stress incontinence.
When to consider cranial electrotherapy stimulation for patients with PTSD
Individuals with posttraumatic stress disorder (PTSD) often report cognitive and sleep disturbances, such as insomnia and poor concentration. Although many patients report improvement with traditional evidence-based treatments, such as pharmacotherapy and psychotherapy, it might be valuable to consider complementary or alternative therapies. Many patients seek treatments that they can self-administer as needed, at their convenience, particularly during symptom exacerbation. One treatment option is cranial electrotherapy stimulation (CES).
As a medical device, CES has been cleared—rather than approved, as is the case for medications—by the FDA to treat depression, insomnia, and anxiety.1 In the United States, CES devices require a prescription from a licensed health care practitioner, but they are available without a prescription in other countries. Cost for devices range from $600 to $1,200 and $10 to $20 for electrodes and contact solution. However, insurance companies that provide coverage for durable medical equipment might cover some or all of this expense.
How CES works
After applying contact solution, depending on the device used, the user attaches electrodes to the earlobes, mastoid processes, or other parts of the head that deliver a pulsed current, usually from AA batteries for 20 to 60 minutes.1 The current causes cortical deactivation and could affect emotional regulation by influencing neurotransmission in the thalamus, hypothalamus, and limbic system.1,2 CES increases cerebrospinal fluid levels of beta-endorphin, adrenocorticotropic hormone, and serotonin, which play a role in depression and anxiety.3
There are no known contraindications for CES. Adverse effects are rare, temporary, and mild; skin irritation, vertigo, or headache are the most common.1
Evidence of efficacy
There are no double-blind placebo-controlled trials evaluating the efficacy of CES for PTSD. However, there is a case series and a large survey of patients supporting its use.
- In a case series, 2 patients reported improved occupational functioning and reduced PTSD symptoms after using CES, 100 to 500 mA, 20 to 60 minutes a day, 3 to 5 days per week.4
- In an online survey of 145 veterans and active-duty military personnel, 60% of individuals used CES for PTSD, and 20% of those individuals were not receiving pharmacotherapy.5 Participants reported at least a 25% reduction in symptoms using CES for at least 20 minutes, once or twice daily, with a current of 100 to 600 mA.5
- In an expert opinion, patients noted improved sleep quality and reduced alcohol and drug withdrawal symptoms after 20-minute treatments, twice a day, with a current of 2 mA. Currents could be increased to 4 mA, if there was no improvement after 2 weeks.6
Some patients experiencing exacerbation of PTSD symptoms could benefit from using the device for 1 hour several times a day until symptoms subside.5
Optimal strength, frequency, and duration of treatment vary among patients, and further studies are needed to assess these parameters as well as efficacy because definitive studies are currently lacking. CES has not always shown efficacy, such as in some patients with depression.7 Despite the limited evidence base, it is reasonable to consider CES for patients with PTSD. This modality might be helpful for patients who have comorbid pain, anxiety, and insomnia, or for those who seek a complementary, convenient, safe, self-administered treatment.
1. Kirsch DL, Nichols F. Cranial electrotherapy stimulation for treatment of anxiety, depression, and insomnia. Psychiatr Clin North Am. 2013;36(1):169-176.
2. Feusner JD, Madsen S, Moody TD, et al. Effects of cranial electrotherapy stimulation on resting state brain activity. Brain Behav. 2012;2(3):211-220.
3. Shealy CN, Cady RK, Culver-Veehoff D, et al. Cerebrospinal fluid and plasma neurochemicals: response to cranial electrical stimulation. J Neuro Orthop Med Surg. 1998;18(2):94-97.
4. Bracciano AG, Chang WP, Kokesh S, et al. Cranial electrotherapy stimulation in the treatment of posttraumatic stress disorder: a pilot study of two military veterans. J Neurother. 2012;16(1):60-69.
5. Kirsch DL, Price LR, Nichols F, et al. Military service member and veteran self reports of efficacy of cranial electrotherapy stimulation for anxiety, posttraumatic stress disorder, insomnia, and depression. US Army Med Dep J. 2014:46-54.
6. Xenakis SN. The rise of cranial electrotherapy. Psychiatric Times. http://www.psychiatrictimes.com/electroconvulsive-therapy/rise-cranial-electrotherapy. Published July 24, 2014. Accessed December 20, 2016.
7. Mischoulon D, De Jong MF, Vitolo OV, et al. Efficacy and safety of a form of cranial electrical stimulation (CES) as an add-on intervention for treatment-resistant major depressive disorder: a three week double blind pilot study. J Psychiatr Res. 2015;70:98-105.
Individuals with posttraumatic stress disorder (PTSD) often report cognitive and sleep disturbances, such as insomnia and poor concentration. Although many patients report improvement with traditional evidence-based treatments, such as pharmacotherapy and psychotherapy, it might be valuable to consider complementary or alternative therapies. Many patients seek treatments that they can self-administer as needed, at their convenience, particularly during symptom exacerbation. One treatment option is cranial electrotherapy stimulation (CES).
As a medical device, CES has been cleared—rather than approved, as is the case for medications—by the FDA to treat depression, insomnia, and anxiety.1 In the United States, CES devices require a prescription from a licensed health care practitioner, but they are available without a prescription in other countries. Cost for devices range from $600 to $1,200 and $10 to $20 for electrodes and contact solution. However, insurance companies that provide coverage for durable medical equipment might cover some or all of this expense.
How CES works
After applying contact solution, depending on the device used, the user attaches electrodes to the earlobes, mastoid processes, or other parts of the head that deliver a pulsed current, usually from AA batteries for 20 to 60 minutes.1 The current causes cortical deactivation and could affect emotional regulation by influencing neurotransmission in the thalamus, hypothalamus, and limbic system.1,2 CES increases cerebrospinal fluid levels of beta-endorphin, adrenocorticotropic hormone, and serotonin, which play a role in depression and anxiety.3
There are no known contraindications for CES. Adverse effects are rare, temporary, and mild; skin irritation, vertigo, or headache are the most common.1
Evidence of efficacy
There are no double-blind placebo-controlled trials evaluating the efficacy of CES for PTSD. However, there is a case series and a large survey of patients supporting its use.
- In a case series, 2 patients reported improved occupational functioning and reduced PTSD symptoms after using CES, 100 to 500 mA, 20 to 60 minutes a day, 3 to 5 days per week.4
- In an online survey of 145 veterans and active-duty military personnel, 60% of individuals used CES for PTSD, and 20% of those individuals were not receiving pharmacotherapy.5 Participants reported at least a 25% reduction in symptoms using CES for at least 20 minutes, once or twice daily, with a current of 100 to 600 mA.5
- In an expert opinion, patients noted improved sleep quality and reduced alcohol and drug withdrawal symptoms after 20-minute treatments, twice a day, with a current of 2 mA. Currents could be increased to 4 mA, if there was no improvement after 2 weeks.6
Some patients experiencing exacerbation of PTSD symptoms could benefit from using the device for 1 hour several times a day until symptoms subside.5
Optimal strength, frequency, and duration of treatment vary among patients, and further studies are needed to assess these parameters as well as efficacy because definitive studies are currently lacking. CES has not always shown efficacy, such as in some patients with depression.7 Despite the limited evidence base, it is reasonable to consider CES for patients with PTSD. This modality might be helpful for patients who have comorbid pain, anxiety, and insomnia, or for those who seek a complementary, convenient, safe, self-administered treatment.
1. Kirsch DL, Nichols F. Cranial electrotherapy stimulation for treatment of anxiety, depression, and insomnia. Psychiatr Clin North Am. 2013;36(1):169-176.
2. Feusner JD, Madsen S, Moody TD, et al. Effects of cranial electrotherapy stimulation on resting state brain activity. Brain Behav. 2012;2(3):211-220.
3. Shealy CN, Cady RK, Culver-Veehoff D, et al. Cerebrospinal fluid and plasma neurochemicals: response to cranial electrical stimulation. J Neuro Orthop Med Surg. 1998;18(2):94-97.
4. Bracciano AG, Chang WP, Kokesh S, et al. Cranial electrotherapy stimulation in the treatment of posttraumatic stress disorder: a pilot study of two military veterans. J Neurother. 2012;16(1):60-69.
5. Kirsch DL, Price LR, Nichols F, et al. Military service member and veteran self reports of efficacy of cranial electrotherapy stimulation for anxiety, posttraumatic stress disorder, insomnia, and depression. US Army Med Dep J. 2014:46-54.
6. Xenakis SN. The rise of cranial electrotherapy. Psychiatric Times. http://www.psychiatrictimes.com/electroconvulsive-therapy/rise-cranial-electrotherapy. Published July 24, 2014. Accessed December 20, 2016.
7. Mischoulon D, De Jong MF, Vitolo OV, et al. Efficacy and safety of a form of cranial electrical stimulation (CES) as an add-on intervention for treatment-resistant major depressive disorder: a three week double blind pilot study. J Psychiatr Res. 2015;70:98-105.
Risks of increasingly potent Cannabis: The joint effects of potency and frequency
In the United States, the average potency of Cannabis has increased significantly over the past few decades in response to consumer demand and policies in some states that have legalized marijuana for medicinal and recreational purposes.1 Whereas the delta-9-tetrahydrocannabinol (THC) content of “street” marijuana was <1% in the 1970s and 4% in the 1990s, by 2012, analyses of Cannabis samples seized by law enforcement agencies documented a rise in average THC potency to >12%.1-3
Although this increase in potency has been overstated in the media because studies did not control for the effects of changes in sampling methods on freshness, it is estimated that Cannabis potency increased 7-fold from 1970 to 2010.3 Also, Cannabis preparations such as hashish and hash oil extracts containing THC well above average—from 35% to 90% THC—are now more widely available. In states where marijuana has been legalized, high-potency Cannabis (HPC) in the form of “edibles” (eg, marijuana added to baked goods, candy, or drinks) and hash oil extracts (Table 1)4-13 can be readily obtained from dispensaries or even at local farmers’ markets.
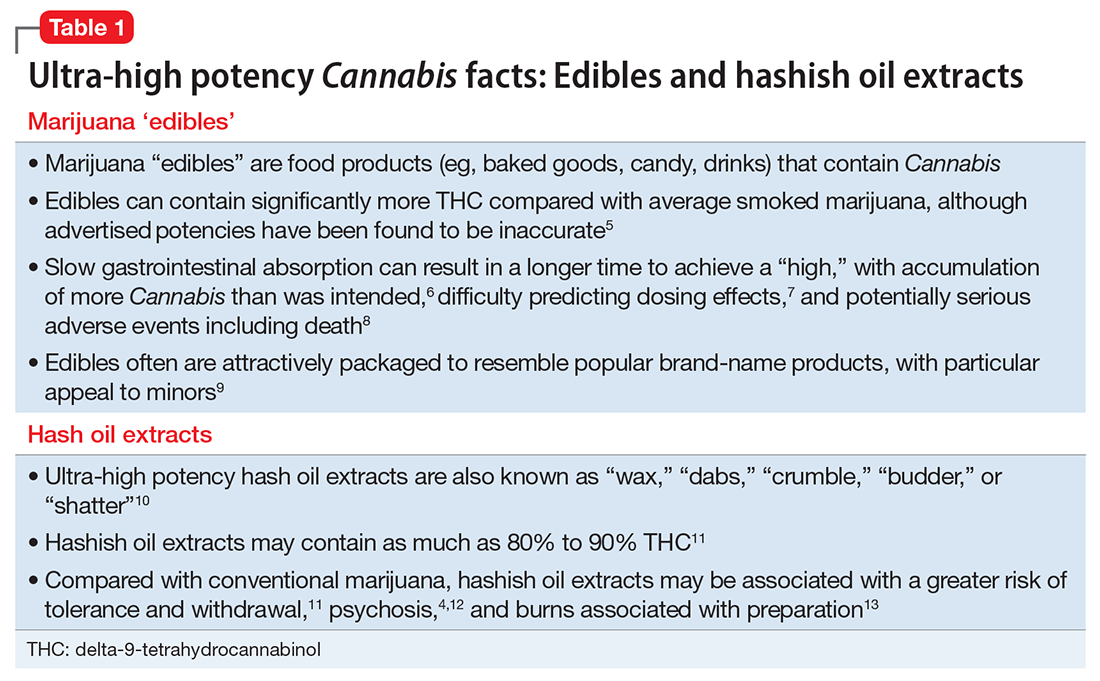
The potency of Cannabis, typically defined as the percentage of THC, its chief psychoactive component, varies depending on the genetic strain of the plant, cultivation techniques, and methods of processing and storage. For example, relative to “average marijuana,” hemp (Cannabis bred for industrial purposes) has very little THC, while sinsemilla (flowering buds from unpollinated female plants), hashish (Cannabis resin), and extracted hash oil contain increasing amounts of THC (Table 2).1,2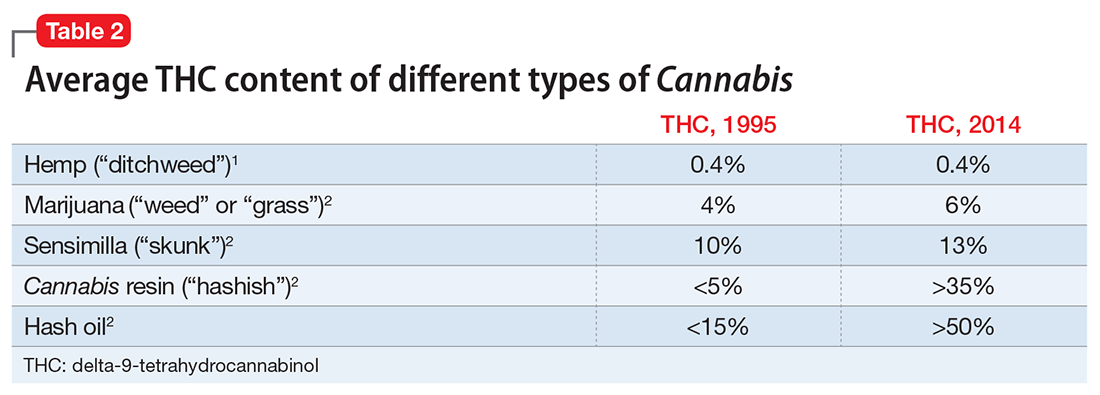
As THC levels in Cannabis have risen over time, cannabidiol (CBD) levels have dropped to <0.2%.2 Although THC appears to be largely responsible for the psychiatric morbidity associated with Cannabis, CBD may have neuroprotective and antipsychotic properties.14,15 The sharp spike in the THC:CBD ratio in recent years therefore raises the possibility that Cannabis use today might carry a much greater risk of psychiatric sequelae than it did in previous generations.
This article reviews the evidence for an increased risk of psychiatric morbidity with increasing Cannabis potency.
Cannabis use disorder
Recent data indicate that the prevalence of Cannabis use disorders (eg, abuse and dependence) in the United States is approximately 3% among the general population and >30% among Cannabis users.16 The availability of increasingly potent forms of Cannabis has been cited as a possible explanation for this rise, despite no change in the prevalence of overall marijuana use between 1991 to 1992 and 2001 to 2002.17 However, while the prevalence of marijuana use disorders has continued to rise—nearly doubling from 2001 to 2002 to 2012 to 2013—this latest increase occurred with a significant increase in overall marijuana use, such that the actual rate of Cannabis use disorders among users seems to have plateaued, despite the continued rise in marijuana potency.16 This discrepancy could be explained if Cannabis users cut back past a specific threshold of increasing potency. However, 2 studies have called into question how effective such titration efforts might be in practice. In one study, Cannabis users who preferred more potent Cannabis inhaled lower volumes of smoke, but did not fully compensate for the increased potency, such that use of HPC still resulted in greater THC exposure.18 Another study found that HPC users rolled less marijuana into their joints but not enough to mitigate the impact of greater potency.19 Therefore, it appears that HPC users typically expose themselves to greater amounts of THC, which could place them at higher risk of addiction.
Although a causal association between increasing Cannabis potency and the rate of substance use disorders among users remains unclear based on epidemiologic studies from the United States, a recent study from the United Kingdom examined the impact of Cannabis potency on dependence.20 This cross-sectional survey found that, although HPC was preferred by users and was rated as offering the “best high,” its use was associated with increasing severity of dependence, especially among young people. The limited available evidence supports a greater risk of Cannabis use disorders with increasing potency.
Psychosis
Based on longitudinal studies published over the past 30 years, it is clear that using Cannabis at a young age (age <15 to 18) increases the risk of developing a psychotic disorder.21 This association appears to be dose-dependent, with studies consistently demonstrating that psychosis risk increases with greater frequency of Cannabis use.22 The accumulated evidence to date is strong enough to view the psychotic potential of Cannabis as a significant public health concern.21
If risk of psychosis is proportional to the amount of Cannabis used as measured by frequency, it follows that this risk might be affected similarly by Cannabis potency. In another paper, I discussed the potential for greater risk of psychosis in the context of medical marijuana and synthetic cannabinoids.23 My colleagues and I also have published case reports describing emerging psychosis among regular Cannabis users after escalating to higher potency medical marijuana24 and a hyperconcentrated form of hash oil known as Cannabis “wax” or “dabs” that contains as much as 90% THC.4 Preliminary anecdotal evidence supports the plausibility of HPC being more psychotoxic than less potent forms.
Several studies from a research group in the United Kingdom, where sinsemilla has increasingly dominated the drug market, likewise have reported that the use of HPC is associated with a greater risk of psychosis. The first of these studies, published in 2009, found that adults hospitalized for first-episode psychosis were more likely to have used HPC than healthy controls.25 Among Cannabis users, HPC use was associated with a 7-fold increased risk of psychosis, with daily HPC use associated with a 12-fold increased risk.
Based on a larger dataset, a second study reported that high-potency, but not low-potency, Cannabis increased the risk of first-episode psychosis with increasing frequency of use.26 Daily users of HPC had a 5-fold higher risk of psychosis compared with those that had never used Cannabis. A third study reported that HPC use and daily Cannabis use were independently associated with an earlier onset of first-episode psychosis, with daily HPC users developing first-episode psychosis an average of 6 years earlier than non-Cannabis users.27 Finally, a prospective study following patients with first-episode psychosis over 2 years found that the greatest risk of relapse—defined by hospital admission caused by exacerbation of psychotic symptoms—was found among self-reported daily users of HPC, while the lowest risk was among those who stopped using Cannabis after their initial psychotic episode.28
The findings from these 4 studies suggest that the increased risk of psychosis with Cannabis is proportional to overall exposure, determined by both frequency of use and Cannabis potency.
Cognition
There is little doubt that using Cannabis can impair cognition acutely, “after all, this is the basic reason for its recreational use,” as one author wrote.29 As with psychosis, the available evidence indicates that the degree of cognitive impairment is related to the frequency and duration of Cannabis use as well as age of onset of use.30,31
Few studies have assessed cognitive functioning in relation to Cannabis potency with most only examining the effects of relatively low-potency Cannabis with inconsistent results. For example, 2 studies compared cognitive performance in individuals smoking Cannabis with 1.8% and 3.9% THC. One study found that using higher potency Cannabis resulted in prolonged time needed to complete certain cognitive tasks,32 whereas the other found greater impairment in performance on a decision-making task at both potencies compared with non-users but no differences between the 2 dosages.33 Detecting significant differences may be difficult within the narrow range of low Cannabis potency studied where any findings have limited applicability in the context of today’s Cannabis with much higher THC content.
To date, only 1 study has assessed cognition at higher Cannabis potencies, comparing Cannabis with 4% THC to 13% THC.34 Cognitive impairments increased with higher potency, especially in tasks that measured motor control and executive functioning. Therefore it appears that higher potency Cannabis use is associated with greater acute cognitive impairment.
The longer-term effects on cognition are less clear, with conflicting evidence about whether Cannabis use can result in residual cognitive impairment despite abstinence.30,35 A recent review concluded that “the magnitude of neuropsychological impairment and the extent to which it persists after abstinence may depend on the frequency and the duration of Cannabis use, length of abstinence, and age at onset of use.”31 The effects of HPC on long-term cognitive deficits have not been studied.
Structural brain changes
A number of studies have determined an association between Cannabis use and brain changes involving structures governing memory and emotional processing, including reduced volume of the hippocampus,36 temporal cortex, insula, and orbitofrontal cortex.37 Although many of these changes appear to be dose-related, some morphologic changes have been reported among young recreational users without Cannabis dependence.38 This has resulted in an understandable concern about the effects of Cannabis on the brains of young people with limited exposure; however, it is not yet clear to what extent detected brain changes are pathological and reflect functional deficits.
Recent research using newer neuroimaging modalities provides preliminary support of Cannabis use associated with white matter changes that, in turn, are correlated with cognitive impairment.39 One study comparing low-potency Cannabis and HPC users with and without first-episode psychosis found a significant effect of Cannabis potency on disturbances in white matter microstructural organization in the corpus callosum.40 These findings provide sufficient cause for concern that structural brain changes associated with cognitive impairment are more likely to occur with HPC use.
Recommendations for clinicians
Similar to any drug, the effects of THC and its psychiatric sequelae can be expected to increase with dosage. To date, much of the information about psychiatric risks has been based on studies of low- and moderate-potency Cannabis rather than the much higher potency Cannabis products, such as hyper-concentrated “wax dabs,” that are available today. Data from social media suggest that these products may be associated with novel patterns of use, such as with the intention of “passing out.”41 It is likely that clinicians will encounter greater psychiatric morbidity associated with HPC use.
Although clinicians may be accustomed to asking about the frequency and duration of Cannabis use, it is now prudent also to ask patients about Cannabis potency to better assess the potential risks of use. The potency of different marijuana products is openly advertised within some “medical marijuana” dispensaries, although the accuracy of information in products such as “edibles” has been called into question.5
Physicians are increasingly asked to provide recommendations on “medical marijuana” use. A recent paper outlined characteristics of appropriate candidates for “medical marijuana” including:
- having a debilitating condition that might benefit from Cannabis
- multiple failed trials of conventional pharmacotherapies including FDA-approved cannabinoids
- lack of substance use disorders, psychosis, or unstable mood or anxiety disorders
- residence in a state where “medical marijuana” is legal.42
As part of the informed consent process, physicians providing recommendations for “medical marijuana” now must consider the effects of HPC when weighing potential risks against any benefits of Cannabis use. Those monitoring patients using Cannabis should be aware of the potential for greater psychiatric morbidity with HPC and should educate patients about that risk. Failure to adequately warn patients about such morbidity or to screen for risk factors such as psychosis could leave physicians vulnerable to malpractice litigation.
In the United States, the average potency of Cannabis has increased significantly over the past few decades in response to consumer demand and policies in some states that have legalized marijuana for medicinal and recreational purposes.1 Whereas the delta-9-tetrahydrocannabinol (THC) content of “street” marijuana was <1% in the 1970s and 4% in the 1990s, by 2012, analyses of Cannabis samples seized by law enforcement agencies documented a rise in average THC potency to >12%.1-3
Although this increase in potency has been overstated in the media because studies did not control for the effects of changes in sampling methods on freshness, it is estimated that Cannabis potency increased 7-fold from 1970 to 2010.3 Also, Cannabis preparations such as hashish and hash oil extracts containing THC well above average—from 35% to 90% THC—are now more widely available. In states where marijuana has been legalized, high-potency Cannabis (HPC) in the form of “edibles” (eg, marijuana added to baked goods, candy, or drinks) and hash oil extracts (Table 1)4-13 can be readily obtained from dispensaries or even at local farmers’ markets.
The potency of Cannabis, typically defined as the percentage of THC, its chief psychoactive component, varies depending on the genetic strain of the plant, cultivation techniques, and methods of processing and storage. For example, relative to “average marijuana,” hemp (Cannabis bred for industrial purposes) has very little THC, while sinsemilla (flowering buds from unpollinated female plants), hashish (Cannabis resin), and extracted hash oil contain increasing amounts of THC (Table 2).1,2
As THC levels in Cannabis have risen over time, cannabidiol (CBD) levels have dropped to <0.2%.2 Although THC appears to be largely responsible for the psychiatric morbidity associated with Cannabis, CBD may have neuroprotective and antipsychotic properties.14,15 The sharp spike in the THC:CBD ratio in recent years therefore raises the possibility that Cannabis use today might carry a much greater risk of psychiatric sequelae than it did in previous generations.
This article reviews the evidence for an increased risk of psychiatric morbidity with increasing Cannabis potency.
Cannabis use disorder
Recent data indicate that the prevalence of Cannabis use disorders (eg, abuse and dependence) in the United States is approximately 3% among the general population and >30% among Cannabis users.16 The availability of increasingly potent forms of Cannabis has been cited as a possible explanation for this rise, despite no change in the prevalence of overall marijuana use between 1991 to 1992 and 2001 to 2002.17 However, while the prevalence of marijuana use disorders has continued to rise—nearly doubling from 2001 to 2002 to 2012 to 2013—this latest increase occurred with a significant increase in overall marijuana use, such that the actual rate of Cannabis use disorders among users seems to have plateaued, despite the continued rise in marijuana potency.16 This discrepancy could be explained if Cannabis users cut back past a specific threshold of increasing potency. However, 2 studies have called into question how effective such titration efforts might be in practice. In one study, Cannabis users who preferred more potent Cannabis inhaled lower volumes of smoke, but did not fully compensate for the increased potency, such that use of HPC still resulted in greater THC exposure.18 Another study found that HPC users rolled less marijuana into their joints but not enough to mitigate the impact of greater potency.19 Therefore, it appears that HPC users typically expose themselves to greater amounts of THC, which could place them at higher risk of addiction.
Although a causal association between increasing Cannabis potency and the rate of substance use disorders among users remains unclear based on epidemiologic studies from the United States, a recent study from the United Kingdom examined the impact of Cannabis potency on dependence.20 This cross-sectional survey found that, although HPC was preferred by users and was rated as offering the “best high,” its use was associated with increasing severity of dependence, especially among young people. The limited available evidence supports a greater risk of Cannabis use disorders with increasing potency.
Psychosis
Based on longitudinal studies published over the past 30 years, it is clear that using Cannabis at a young age (age <15 to 18) increases the risk of developing a psychotic disorder.21 This association appears to be dose-dependent, with studies consistently demonstrating that psychosis risk increases with greater frequency of Cannabis use.22 The accumulated evidence to date is strong enough to view the psychotic potential of Cannabis as a significant public health concern.21
If risk of psychosis is proportional to the amount of Cannabis used as measured by frequency, it follows that this risk might be affected similarly by Cannabis potency. In another paper, I discussed the potential for greater risk of psychosis in the context of medical marijuana and synthetic cannabinoids.23 My colleagues and I also have published case reports describing emerging psychosis among regular Cannabis users after escalating to higher potency medical marijuana24 and a hyperconcentrated form of hash oil known as Cannabis “wax” or “dabs” that contains as much as 90% THC.4 Preliminary anecdotal evidence supports the plausibility of HPC being more psychotoxic than less potent forms.
Several studies from a research group in the United Kingdom, where sinsemilla has increasingly dominated the drug market, likewise have reported that the use of HPC is associated with a greater risk of psychosis. The first of these studies, published in 2009, found that adults hospitalized for first-episode psychosis were more likely to have used HPC than healthy controls.25 Among Cannabis users, HPC use was associated with a 7-fold increased risk of psychosis, with daily HPC use associated with a 12-fold increased risk.
Based on a larger dataset, a second study reported that high-potency, but not low-potency, Cannabis increased the risk of first-episode psychosis with increasing frequency of use.26 Daily users of HPC had a 5-fold higher risk of psychosis compared with those that had never used Cannabis. A third study reported that HPC use and daily Cannabis use were independently associated with an earlier onset of first-episode psychosis, with daily HPC users developing first-episode psychosis an average of 6 years earlier than non-Cannabis users.27 Finally, a prospective study following patients with first-episode psychosis over 2 years found that the greatest risk of relapse—defined by hospital admission caused by exacerbation of psychotic symptoms—was found among self-reported daily users of HPC, while the lowest risk was among those who stopped using Cannabis after their initial psychotic episode.28
The findings from these 4 studies suggest that the increased risk of psychosis with Cannabis is proportional to overall exposure, determined by both frequency of use and Cannabis potency.
Cognition
There is little doubt that using Cannabis can impair cognition acutely, “after all, this is the basic reason for its recreational use,” as one author wrote.29 As with psychosis, the available evidence indicates that the degree of cognitive impairment is related to the frequency and duration of Cannabis use as well as age of onset of use.30,31
Few studies have assessed cognitive functioning in relation to Cannabis potency with most only examining the effects of relatively low-potency Cannabis with inconsistent results. For example, 2 studies compared cognitive performance in individuals smoking Cannabis with 1.8% and 3.9% THC. One study found that using higher potency Cannabis resulted in prolonged time needed to complete certain cognitive tasks,32 whereas the other found greater impairment in performance on a decision-making task at both potencies compared with non-users but no differences between the 2 dosages.33 Detecting significant differences may be difficult within the narrow range of low Cannabis potency studied where any findings have limited applicability in the context of today’s Cannabis with much higher THC content.
To date, only 1 study has assessed cognition at higher Cannabis potencies, comparing Cannabis with 4% THC to 13% THC.34 Cognitive impairments increased with higher potency, especially in tasks that measured motor control and executive functioning. Therefore it appears that higher potency Cannabis use is associated with greater acute cognitive impairment.
The longer-term effects on cognition are less clear, with conflicting evidence about whether Cannabis use can result in residual cognitive impairment despite abstinence.30,35 A recent review concluded that “the magnitude of neuropsychological impairment and the extent to which it persists after abstinence may depend on the frequency and the duration of Cannabis use, length of abstinence, and age at onset of use.”31 The effects of HPC on long-term cognitive deficits have not been studied.
Structural brain changes
A number of studies have determined an association between Cannabis use and brain changes involving structures governing memory and emotional processing, including reduced volume of the hippocampus,36 temporal cortex, insula, and orbitofrontal cortex.37 Although many of these changes appear to be dose-related, some morphologic changes have been reported among young recreational users without Cannabis dependence.38 This has resulted in an understandable concern about the effects of Cannabis on the brains of young people with limited exposure; however, it is not yet clear to what extent detected brain changes are pathological and reflect functional deficits.
Recent research using newer neuroimaging modalities provides preliminary support of Cannabis use associated with white matter changes that, in turn, are correlated with cognitive impairment.39 One study comparing low-potency Cannabis and HPC users with and without first-episode psychosis found a significant effect of Cannabis potency on disturbances in white matter microstructural organization in the corpus callosum.40 These findings provide sufficient cause for concern that structural brain changes associated with cognitive impairment are more likely to occur with HPC use.
Recommendations for clinicians
Similar to any drug, the effects of THC and its psychiatric sequelae can be expected to increase with dosage. To date, much of the information about psychiatric risks has been based on studies of low- and moderate-potency Cannabis rather than the much higher potency Cannabis products, such as hyper-concentrated “wax dabs,” that are available today. Data from social media suggest that these products may be associated with novel patterns of use, such as with the intention of “passing out.”41 It is likely that clinicians will encounter greater psychiatric morbidity associated with HPC use.
Although clinicians may be accustomed to asking about the frequency and duration of Cannabis use, it is now prudent also to ask patients about Cannabis potency to better assess the potential risks of use. The potency of different marijuana products is openly advertised within some “medical marijuana” dispensaries, although the accuracy of information in products such as “edibles” has been called into question.5
Physicians are increasingly asked to provide recommendations on “medical marijuana” use. A recent paper outlined characteristics of appropriate candidates for “medical marijuana” including:
- having a debilitating condition that might benefit from Cannabis
- multiple failed trials of conventional pharmacotherapies including FDA-approved cannabinoids
- lack of substance use disorders, psychosis, or unstable mood or anxiety disorders
- residence in a state where “medical marijuana” is legal.42
As part of the informed consent process, physicians providing recommendations for “medical marijuana” now must consider the effects of HPC when weighing potential risks against any benefits of Cannabis use. Those monitoring patients using Cannabis should be aware of the potential for greater psychiatric morbidity with HPC and should educate patients about that risk. Failure to adequately warn patients about such morbidity or to screen for risk factors such as psychosis could leave physicians vulnerable to malpractice litigation.

CORRECT: Insights into working at correctional facilities
Providing care in a correctional facility is inherent with danger, complexities, and risks. The mnemonic CORRECT strives to shed light on some of these factors and to provide a window of understanding on the needs and experiences of patients and staff in correctional facilities.
Challenges. The inherently coercive environment of a correctional facility affects all those confined within—staff and inmates. Staff members have varied background and experience (ie, custody, medical services, and mental health services). A large percentage of incarcerated individuals have been diagnosed with antisocial personality disorder, substance use disorder, psychosis, or medical illnesses. Many of these individuals have received little, if any, treatment, and are monitored most of the time by custody staff, who have limited training in mental health care.
Inmates also have considerable interaction with medical services. The goals of medical and psychiatric providers differ from that of corrections: to diagnose and treat vs to confine, deter, and punish.1 Disagreements and friction may be inevitable and require ongoing diplomacy.
Opportunity. Many inmates have a history of homelessness and arrive with untreated medical conditions; hypertension, impaired liver function, tuberculosis, and hepatitis C are common. Correctional facilities often become primary care providers for the physically and mentally ill. Inmates might have never received any form of patient education, and could respond well to patience, education, and compassion. Challenges can become opportunities to help this neglected, underserved, and underprivileged population.
Reflection. The need to continually assess a patient and provide a treatment plan is not unique to corrections. However, the patient caseload, the day-to-day continuum, and the need to complete patient care within time restrictions, can become a mundane process that could invite a sense of conditioned familiarity and boredom over the years, despite the predictable unpredictability of a correctional setting. The need to periodically stop and reflect is crucial, which can be done independently or with ongoing staff education.
Risks. A heightened level of risk starts from the time the incarcerated individual enters the correctional facility to the moment he (she) is released. This involves many facets, including physical, psychological, and medical exposure. Individuals could arrive in a state of drug withdrawal, and often in a state of delirium, which can complicate the presentation.
Potential inmate–inmate conflicts are a constant risk. Trading and swapping medications for sedative purposes or to get “high” is common in most correctional facilities, which has prompted many institutions to remove select medications from their formulary. Some individuals might prey on the novice, weak, or elderly inmates if they are taking sought-after medications. The suicide rate is high in correctional facilities. Because of these increased risks, the psychiatrist needs to be mindful of prescribing practices.
Experience. Despite years of education in medical school, residency, and fellowships, there is no substitute for clinical experience for novice correctional psychiatrists. Becoming competent can take years, and requires face-to-face evaluations, immersion, presence, and movement within a facility, and on-call responsibilities. Telepsychiatry is no replacement for the experience of being “in the trenches.” Despite a position of apparent power and superiority, physicians are human. Learning from mistakes is crucial to evolve and improve patient rapport.
Confidentiality. Lack of confidentiality often is the norm. Custody staff might be present during evaluations because of the potentially dangerous environment. Because certain areas of the facility require further caution, such as single cells or solitary confinement (as a result of unpredictability, dangerousness, specific charges, behavioral problems, etc.), the psychiatrist might be required to perform assessments at the front of the cell, in the presence of adjacent cells and other inmates and often an entire group. This might be unavoidable and requires a higher level of sensitivity. The need for correctional employees to maintain a sense of confidentiality has been well demonstrated in media events regarding serious boundary violations or sexual contact.
Treatment. Psychiatrists “confined” in corrections could feel isolated from the “outside” world and from their professional colleagues. Therefore, clinicians employed in corrections could develop a specific variety of burnout. Avoiding burnout requires a mindful discipline in self-care, efforts in healthy socialization, recreation, and outdoor activities. It’s crucial to maintain and update one’s knowledge base in order to provide treatment within the standard of care.
1. Dubler N. Ethical dilemmas in prison and jail health care. http://healthaffairs.org/blog/2014/03/10/ethical-dilemmas-in-prison-and-jail-health-care. Published March 10, 2014. Accessed December 14, 2016.
Providing care in a correctional facility is inherent with danger, complexities, and risks. The mnemonic CORRECT strives to shed light on some of these factors and to provide a window of understanding on the needs and experiences of patients and staff in correctional facilities.
Challenges. The inherently coercive environment of a correctional facility affects all those confined within—staff and inmates. Staff members have varied background and experience (ie, custody, medical services, and mental health services). A large percentage of incarcerated individuals have been diagnosed with antisocial personality disorder, substance use disorder, psychosis, or medical illnesses. Many of these individuals have received little, if any, treatment, and are monitored most of the time by custody staff, who have limited training in mental health care.
Inmates also have considerable interaction with medical services. The goals of medical and psychiatric providers differ from that of corrections: to diagnose and treat vs to confine, deter, and punish.1 Disagreements and friction may be inevitable and require ongoing diplomacy.
Opportunity. Many inmates have a history of homelessness and arrive with untreated medical conditions; hypertension, impaired liver function, tuberculosis, and hepatitis C are common. Correctional facilities often become primary care providers for the physically and mentally ill. Inmates might have never received any form of patient education, and could respond well to patience, education, and compassion. Challenges can become opportunities to help this neglected, underserved, and underprivileged population.
Reflection. The need to continually assess a patient and provide a treatment plan is not unique to corrections. However, the patient caseload, the day-to-day continuum, and the need to complete patient care within time restrictions, can become a mundane process that could invite a sense of conditioned familiarity and boredom over the years, despite the predictable unpredictability of a correctional setting. The need to periodically stop and reflect is crucial, which can be done independently or with ongoing staff education.
Risks. A heightened level of risk starts from the time the incarcerated individual enters the correctional facility to the moment he (she) is released. This involves many facets, including physical, psychological, and medical exposure. Individuals could arrive in a state of drug withdrawal, and often in a state of delirium, which can complicate the presentation.
Potential inmate–inmate conflicts are a constant risk. Trading and swapping medications for sedative purposes or to get “high” is common in most correctional facilities, which has prompted many institutions to remove select medications from their formulary. Some individuals might prey on the novice, weak, or elderly inmates if they are taking sought-after medications. The suicide rate is high in correctional facilities. Because of these increased risks, the psychiatrist needs to be mindful of prescribing practices.
Experience. Despite years of education in medical school, residency, and fellowships, there is no substitute for clinical experience for novice correctional psychiatrists. Becoming competent can take years, and requires face-to-face evaluations, immersion, presence, and movement within a facility, and on-call responsibilities. Telepsychiatry is no replacement for the experience of being “in the trenches.” Despite a position of apparent power and superiority, physicians are human. Learning from mistakes is crucial to evolve and improve patient rapport.
Confidentiality. Lack of confidentiality often is the norm. Custody staff might be present during evaluations because of the potentially dangerous environment. Because certain areas of the facility require further caution, such as single cells or solitary confinement (as a result of unpredictability, dangerousness, specific charges, behavioral problems, etc.), the psychiatrist might be required to perform assessments at the front of the cell, in the presence of adjacent cells and other inmates and often an entire group. This might be unavoidable and requires a higher level of sensitivity. The need for correctional employees to maintain a sense of confidentiality has been well demonstrated in media events regarding serious boundary violations or sexual contact.
Treatment. Psychiatrists “confined” in corrections could feel isolated from the “outside” world and from their professional colleagues. Therefore, clinicians employed in corrections could develop a specific variety of burnout. Avoiding burnout requires a mindful discipline in self-care, efforts in healthy socialization, recreation, and outdoor activities. It’s crucial to maintain and update one’s knowledge base in order to provide treatment within the standard of care.
1. Dubler N. Ethical dilemmas in prison and jail health care. http://healthaffairs.org/blog/2014/03/10/ethical-dilemmas-in-prison-and-jail-health-care. Published March 10, 2014. Accessed December 14, 2016.
1. Dubler N. Ethical dilemmas in prison and jail health care. http://healthaffairs.org/blog/2014/03/10/ethical-dilemmas-in-prison-and-jail-health-care. Published March 10, 2014. Accessed December 14, 2016.
Using rating scales in a clinical setting: A guide for psychiatrists
In the current health care environment, there is an increasing demand for objective assessment of disease states.1 This is particularly apparent in psychiatry, where documentation of outcomes lags that of other areas of medicine.
In 2012, the additional health care costs incurred by persons with mental health diagnoses were estimated to be $293 billion among commercially insured, Medicaid, and Medicare beneficiaries in the United States—a figure that is 273% higher than the cost for those without psychiatric diagnoses.2 Psychiatric and medical illnesses can be so tightly linked that accurate diagnosis and treatment of psychiatric disorders becomes essential to control medical illnesses. It is not surprising that there is increased scrutiny to the ways in which psychiatric care can be objectively assessed and monitored, and payers such as Centers for Medicare and Medicaid Services (CMS) increasingly require objective documentation of disease state improvement for payment.3
Support for objective assessment of disease derives from the collaborative care model. This model is designed to better integrate psychiatric and primary care by (among other practices) establishing the Patient-Centered Medical Home and emphasizing screening and monitoring patient-reported outcomes over time to assess treatment response.4 This approach, which is endorsed by the American Psychiatric Association, is associated with significant improvements in outcomes compared with usual care.5 It tracks a patient’s progress using validated clinical rating scales and other screening tools (eg, Patient Health Questionnaire [PHQ-9] for depression), an approach that is analogous to how patients with type 2 diabetes mellitus are monitored by hemoglobin A1c laboratory tests.6 An increasingly extensive body of research supports the impact of this approach on treatment. A 2012 Cochrane Review associated collaborative care with significant improvements in depression and anxiety outcomes compared with usual treatment.7
Despite these findings, a recent Kennedy Forum brief asserts that behavioral health is characterized by a “lack of systematic measurement to determine whether patients are responding to treatment.”8 That same brief points to the many easy-to-administer and validated rating scales and other screening tools that can reliably measure the frequency and severity of psychiatric symptoms over time, and likens the lack of their use as “equivalent to treating high blood pressure without using a blood pressure cuff to measure if a patient’s blood pressure is improving.”8 It is estimated that only 18% of psychiatrists and 11% of psychologists administer them routinely.9,10 This lack of use denies clinicians important information that can help detect deterioration or lack of improvement in their patients.
Psychiatry is replete with rating scales and screening tools, and the number of competing scales can make choosing a measure difficult.1 Nonetheless, not all scales are appropriate for clinical use; many are designed for research, for instance, and are lengthy and difficult to administer.
This article reviews a number of rating scales that are brief, useful, and easy to administer. A framework for the screening tools addressed in this article is available on the federally funded Center for Integrated Health Systems Web site (www.integration.samhsa.gov). This site promotes the use of tools designed to assist in screening and monitoring for depression, anxiety, bipolar disorder, substance use, and suicidality.11
Quality criteria for rating scales
The quality of a rating scale is determined by the following attributes12:
- Objectivity. The ability of a scale to obtain the same results, regardless of who administers, analyzes, or interprets it.
- Reliability. The ability of a scale to convey consistent and reproducible information across time, patients, and raters.
- Validity. The degree to which the scale measures what it is supposed to measure (eg, depressive symptoms). Sensitivity and specificity are measures of validity and provide additional information about the rating scale; namely, whether the scale can detect the presence of a disease (sensitivity) and whether it detects only that disease or condition and not another (specificity).
- Establishment of norms. Whether a scale provides reference values for different clinical groups.
- Practicability. The resources required to administer the assessment instrument in terms of time, staff, and material.
In addition to meeting these quality criteria, selection of a scale can be based on whether it is self-rated or observer-rated. Advantages to self-rated scales, such as the PHQ-9, Mood Disorder Questionnaire (MDQ), and Generalized Anxiety Disorder 7-item (GAD-7) scale, are their practicability—they are easy to administer and don’t require clinician or staff time—and their use in evaluating and raising awareness of subjective states.
However, reliability may be a concern, as some patients either may lack insight or exaggerate or mask symptoms when completing such scales.13 Both observer and self-rated scales can be used together to minimize bias, identify symptoms that might have been missed/not addressed in the clinical interview, and drive clinical decision-making. Both also can help patients communicate with their providers and make them feel more involved in clinical decision-making.8
The following scales have met many of the quality criteria described here and are endorsed by the government payer system. They can easily be incorporated into clinical practice and will provide useful clinical information that can assist in diagnosis and monitoring patient outcomes.
Patient Health Questionnaire
PHQ-9 is a 9-item self-report questionnaire that can help to detect the presence of depression and supplement a thorough psychiatric and mental health interview. It scores the 9 DSM-IV criteria for depression on a scale of 0 (not at all) to 3 (nearly every day). It is a public resource that is easy to find online, available without cost in several languages, and takes just a few minutes to complete.14
PHQ-9 has shown excellent test–retest reliability in screening for depression, and normative data on the instrument’s use are available in various clinical populations.15 Research has shown that as PHQ-9 depression scores increase, functional status decrease, while depressive symptoms, sick days, and health care utilization increase.15 In one study, a PHQ-9 score of ≥10 had 88% sensitivity and specificity for detecting depression, with scores of 5, 10, 15, and 20 indicating mild, moderate, moderately severe, and severe depression, respectively.16 In addition to its use as a screening tool, PHQ-9 is a responsive and reliable measure of depression treatment outcomes.17
Mood Disorder Questionnaire
MDQ is another brief, self-report questionnaire that is available online. It is designed to identify and monitor patients who are likely to meet diagnostic criteria for bipolar disorder.18,19
The first question on the MDQ asks if the patient has experienced any of 13 common mood and behavior symptoms. The second question asks if these symptoms have ever occurred at the same time, and the third asks the degree to which the patient finds the symptoms to be problematic. The remaining 2 questions provide additional, clinical information, because they address family history of manic–depressive illness or bipolar disorder and whether a diagnosis of either disorder has been made.
The MDQ has shown validity in assessing bipolar disorder symptoms in a general population,20 although recent research suggests that imprecise recall bias may limit its reliability in detecting hypomanic episodes earlier in life.21 Nonetheless, its specificity of >97% means that it will effectively screen out just about all true negatives.18
Generalized Anxiety Disorder 7-item scale
GAD-7 scale is a brief, self-administered questionnaire for screening and measuring severity of GAD.22 It asks patients to rate 7 items that represent problems with general anxiety and scores each item on a scale of 0 (not at all) to 3 (nearly every day). Similar to the other measures, it is easily accessible online.
Research evidence supports the reliability and validity of GAD-7 as a measure of anxiety in the general population. Sensitivity and specificity are 89% and 82%, respectively. Normative data for age and sex specific subgroups support its use across age groups and in both males and females.23 The GAD-7 performs well for detecting and monitoring not only GAD but also panic disorder, social anxiety disorder, and posttraumatic stress disorder.24
CAGE questionnaire for detection of substance use
The CAGE questionnaire is a widely-used screening tool that was originally developed to detect alcohol abuse, but has been adapted to assess other substance abuse.25,26 The omission of substance abuse from diagnostic consideration can have a major effect on quality of care, because substance abuse can be the underlying cause of other diseases. Therefore, routine administration of this instrument in clinical practice can lead to better understanding and monitoring of patient health.27
Similar to other instruments, CAGE is free and available online.27 It contains 4 simple questions, with 1 point is assigned to each positive answer.
Have you ever:
1. Felt the need to cut down on your drinking or drug use?
2. Have people annoyed you by criticizing your drinking or drug use?
3. Have you felt bad or guilty about your drinking or drug use?
4. Have you ever had a drink or used drugs first thing in the morning to steady your nerves or to get rid of a hangover (eye-opener)?
The simple mnemonic CAGE makes the questions easy to remember and to administer in a clinical setting. CAGE has demonstrated validity, with one study determining that CAGE scores ≥2 had a specificity and sensitivity of 76% and 93%, respectively, for identifying excessive drinking, and a specificity and sensitivity of 77% and 91%, respectively, for identifying alcohol abuse.28
Columbia Suicide Severity Rating Scale (C-SSRS)
C-SSRS was developed by researchers at Columbia University to assess the severity of and track changes over time in suicidal ideation and behavior. C-SSRS is 2 pages and takes only a few minutes to administer; however, it also may be completed as a self-report measure. The questions are phrased for use in an interview format, and clinicians are encouraged to receive training prior to its administration, although specific training in mental health is not required.
The “Lifetime/Recent” version allows practitioners to gather lifetime history of suicidality as well as any recent suicidal ideation and/or behavior, whereas the “Since Last Visit” version of the scale assesses suicidality in patients who have completed at least 1 Lifetime/Recent C-SSRS assessment. A truncated, 6-item “Screener” version is typically used in emergency situations. A risk assessment can be added to either the Full or Screener version to summarize the answers from C-SSRS and document risk and protective factors.29
Several studies have found C-SSRS to be reliable and valid for identifying suicide risk in children and adults.30,31USA Today reported that an individual exhibiting even a single behavior identified by the scale is 8 to 10 times more likely to complete suicide.32 In addition, the C-SSRS has helped reduce the suicide rate 65% in one of the largest providers of community-based behavioral health care in the United States.32
Using scales to augment care
Each of the scales described in this article can easily be incorporated into clinical practice and offers psychiatrists important clinical information that may have been missed or not addressed in the initial clinical interview. This information can be used to follow progression of symptoms and effectiveness of treatment. Although rating scales should never be used alone to establish a diagnosis or clinical treatment plan, they can and should be used to augment information from the clinician’s assessment and follow-up interviews.5
1. McDowell I. Measuring health: a guide to rating scales and questionnaires. 3rd ed. New York, NY: Oxford University Press; 2006.
2. Kennedy Forum. Fixing behavioral health care in America: a national call for integrating and coordinating specialty behavioral health care with the medical system. http://thekennedyforum-dot-org.s3.amazonaws.com/documents/KennedyForum-BehavioralHealth_FINAL_3.pdf. Published 2015. Accessed January 13, 2017.
3. The Office of the National Coordinator for Health Information Technology. Behavioral health (BH) Clinical Quality Measures (CQMs) Program initiatives. https://www.healthit.gov/sites/default/files/pdf/2012-09-27-behavioral-health-clinical-quality-measures-program-initiatives-public-forum.pdf. Published September 27, 2012. Accessed January 13, 2017.
4. Unutzer J, Harbin H, Schoenbaum M. The collaborative care model: an approach for integrating physical and mental health care in Medicaid health homes. https://www.medicaid.gov/State-Resource-Center/Medicaid-State-Technical-Assistance/Health-Homes-Technical-Assistance/Downloads/HH-IRC-Collaborative-5-13.pdf. Published May 2013. Accessed January 13, 2016.
5. World Group On Psychiatric Evaluation; American Psychiatric Association Steering Committee On Practice Guidelines. Practice guideline for the psychiatric evaluation of adults. 2nd ed. http://psychiatryonline.org/pb/assets/raw/sitewide/practice_guidelines/guidelines/psychevaladults.pdf. Published June 2006. Accessed January 13, 2016.
6. Melek S, Norris D, Paulus J. Economic impact of integrated medical-behavioral healthcare: implications for psychiatry. Denver, CO: Milliman, Inc; 2014.
7. Archer J, Bower P, Gilbody S, et al. Collaborative care for depression and anxiety problems. Cochrane Database Syst Rev. 2012;10:CD006525. doi: 10.1002/14651858.CD006525.pub2.
8. Kennedy P. Forum. Fixing behavioral health care in America: a national call for measurement-based care. https://www.thekennedyforum.org/news/measurement-based-care-issue-brief. Published December 10, 2015. Accessed January 13, 2017.
9. Zimmerman M, McGlinchey JB. Why don’t psychiatrists use scales to measure outcome when treating depressed patients? J Clin Psychiatry. 2008;69(12):1916-1919.
10. Hatfield D, McCullough L, Frantz SH, et al. Do we know when our clients get worse? An investigation of therapists’ ability to detect negative client change. Clin Psychol Psychother. 2010;17(1):25-32.
11. SAMHSA-HRSA Center for Integrated Solutions. Screening tools. http://www.integration.samhsa.gov/clinical-practice/screening-tools. Accessed January 14, 2016.
12. Moller HJ. Standardised rating scales in psychiatry: methodological basis, their possibilities and limitations and descriptions of important rating scales. World J Biol Psychiatry. 2009;10(1):6-26.
13. Sajatovic M, Ramirez LF. Rating scales in mental health. 2nd ed. Hudson, OH: Lexi-Comp; 2003.
14. Patient Health Questionnaire-9 (PHQ-9). http://www.agencymeddirectors.wa.gov/files/AssessmentTools/14-PHQ-9%20overview.pdf. Accessed February 16, 2016.
15. Patient Health Questionnaire-9 (PHQ-9). Rehab Measures Web site. http://www.rehabmeasures.org/Lists/RehabMeasures/DispForm.aspx?ID=954. Updated August 28, 2014. Accessed February 16, 2016.
16. Kroenke K, Spitzer RL, Williams JB. The PHQ-9: validity of a brief depression severity measure. J Gen Intern Med. 2001;16(9):606-613.
17. Löwe B, Unützer J, Callahan CM, et al. Monitoring depression treatment outcomes with the Patient Health Questionnaire-9. Med Care. 2004;42(12):1194-1201.
18. Ketter TA. Strategies for monitoring outcomes in patients with bipolar disorder. Prim Care Companion J Clin Psychiatry. 2010;12(suppl 1):10-16.
19. The Mood Disorder Questionnaire. University of Texas Medical Branch. http://www.dbsalliance.org/pdfs/MDQ.pdf. Published 2000. Accessed March 1, 2016.
20. Hirschfeld RM, Holzer C, Calabrese JR, et al. Validity of the mood disorder questionnaire: a general population study. Am J Psychiatry. 2003;160(1):178-180.
21. Boschloo L, Nolen WA, Spijker AT, et al. The Mood Disorder Questionnaire (MDQ) for detecting (hypo)manic episodes: its validity and impact of recall bias. J Affect Disord. 2013;151(1):203-208.
22. Spitzer RL, Kroenke K, Williams JB, et al. A brief measure for assessing generalized anxiety disorder: the GAD-7. Arch Intern Med. 2006;166(10):1092-1097.
23. Lowe B, Decker O, Müller S, et al. Validation and standardization of the Generalized Anxiety Disorder Screener (GAD-7) in the general population. Med Care. 2008;46(3):266-274.
24. Kroenke K, Spitzer RL, Williams JB, et al. Anxiety disorders in primary care: prevalence, impairment, comorbidity, and detection. Ann Intern Med. 2007;146(5):317-325.
25. Ewing JA. Detecting alcoholism. The CAGE Questionnaire. JAMA. 1984;252(14):1905-1907.
26. CAGE substance abuse screening tool. Johns Hopkins Medicine. http://www.hopkinsmedicine.org/johns_hopkins_healthcare/downloads/CAGE%20Substance%20Screening%20Tool.pdf. Accessed January 13, 2017.
27. O’Brien CP. The CAGE questionnaire for detection of alcoholism: a remarkably useful but simple tool. JAMA. 2008;300(17):2054-2056.
28. Bernadt MW, Mumford J, Taylor C, et al. Comparison of questionnaire and laboratory tests in the detection of excessive drinking and alcoholism. Lancet. 1982;1(8267):325-328.
29. Columbia Suicide-Severity Rating Scale (CS-SRS). http://cssrs.columbia.edu/the-columbia-scale-c-ssrs/cssrs-for-communities-and-healthcare/#filter=.general-use.english. Accessed March 6, 2016.
30. Mundt JC, Greist JH, Jefferson JW, et al. Prediction of suicidal behavior in clinical research by lifetime suicidal ideation and behavior ascertained by the electronic Columbia-Suicide Severity Rating Scale. J Clin Psychiatry. 2013;74(9):887-893.
31. Posner K, Brown GK, Stanley B, et al. The Columbia-Suicide Severity Rating Scale: initial validity and internal consistency findings from three multisite studies with adolescents and adults. Am J Psychiatry. 2011;168(12):1266-1277.
32. Esposito L. Suicide Checklist Spots People at Highest Risk. USA Today. http://usatoday30.usatoday.com/news/health/story/health/story/2011-11-09/Suicide-checklist-spots-people-at-highest-risk/51135944/1. Published November 9, 2011. Accessed March 6, 2016.
In the current health care environment, there is an increasing demand for objective assessment of disease states.1 This is particularly apparent in psychiatry, where documentation of outcomes lags that of other areas of medicine.
In 2012, the additional health care costs incurred by persons with mental health diagnoses were estimated to be $293 billion among commercially insured, Medicaid, and Medicare beneficiaries in the United States—a figure that is 273% higher than the cost for those without psychiatric diagnoses.2 Psychiatric and medical illnesses can be so tightly linked that accurate diagnosis and treatment of psychiatric disorders becomes essential to control medical illnesses. It is not surprising that there is increased scrutiny to the ways in which psychiatric care can be objectively assessed and monitored, and payers such as Centers for Medicare and Medicaid Services (CMS) increasingly require objective documentation of disease state improvement for payment.3
Support for objective assessment of disease derives from the collaborative care model. This model is designed to better integrate psychiatric and primary care by (among other practices) establishing the Patient-Centered Medical Home and emphasizing screening and monitoring patient-reported outcomes over time to assess treatment response.4 This approach, which is endorsed by the American Psychiatric Association, is associated with significant improvements in outcomes compared with usual care.5 It tracks a patient’s progress using validated clinical rating scales and other screening tools (eg, Patient Health Questionnaire [PHQ-9] for depression), an approach that is analogous to how patients with type 2 diabetes mellitus are monitored by hemoglobin A1c laboratory tests.6 An increasingly extensive body of research supports the impact of this approach on treatment. A 2012 Cochrane Review associated collaborative care with significant improvements in depression and anxiety outcomes compared with usual treatment.7
Despite these findings, a recent Kennedy Forum brief asserts that behavioral health is characterized by a “lack of systematic measurement to determine whether patients are responding to treatment.”8 That same brief points to the many easy-to-administer and validated rating scales and other screening tools that can reliably measure the frequency and severity of psychiatric symptoms over time, and likens the lack of their use as “equivalent to treating high blood pressure without using a blood pressure cuff to measure if a patient’s blood pressure is improving.”8 It is estimated that only 18% of psychiatrists and 11% of psychologists administer them routinely.9,10 This lack of use denies clinicians important information that can help detect deterioration or lack of improvement in their patients.
Psychiatry is replete with rating scales and screening tools, and the number of competing scales can make choosing a measure difficult.1 Nonetheless, not all scales are appropriate for clinical use; many are designed for research, for instance, and are lengthy and difficult to administer.
This article reviews a number of rating scales that are brief, useful, and easy to administer. A framework for the screening tools addressed in this article is available on the federally funded Center for Integrated Health Systems Web site (www.integration.samhsa.gov). This site promotes the use of tools designed to assist in screening and monitoring for depression, anxiety, bipolar disorder, substance use, and suicidality.11
Quality criteria for rating scales
The quality of a rating scale is determined by the following attributes12:
- Objectivity. The ability of a scale to obtain the same results, regardless of who administers, analyzes, or interprets it.
- Reliability. The ability of a scale to convey consistent and reproducible information across time, patients, and raters.
- Validity. The degree to which the scale measures what it is supposed to measure (eg, depressive symptoms). Sensitivity and specificity are measures of validity and provide additional information about the rating scale; namely, whether the scale can detect the presence of a disease (sensitivity) and whether it detects only that disease or condition and not another (specificity).
- Establishment of norms. Whether a scale provides reference values for different clinical groups.
- Practicability. The resources required to administer the assessment instrument in terms of time, staff, and material.
In addition to meeting these quality criteria, selection of a scale can be based on whether it is self-rated or observer-rated. Advantages to self-rated scales, such as the PHQ-9, Mood Disorder Questionnaire (MDQ), and Generalized Anxiety Disorder 7-item (GAD-7) scale, are their practicability—they are easy to administer and don’t require clinician or staff time—and their use in evaluating and raising awareness of subjective states.
However, reliability may be a concern, as some patients either may lack insight or exaggerate or mask symptoms when completing such scales.13 Both observer and self-rated scales can be used together to minimize bias, identify symptoms that might have been missed/not addressed in the clinical interview, and drive clinical decision-making. Both also can help patients communicate with their providers and make them feel more involved in clinical decision-making.8
The following scales have met many of the quality criteria described here and are endorsed by the government payer system. They can easily be incorporated into clinical practice and will provide useful clinical information that can assist in diagnosis and monitoring patient outcomes.
Patient Health Questionnaire
PHQ-9 is a 9-item self-report questionnaire that can help to detect the presence of depression and supplement a thorough psychiatric and mental health interview. It scores the 9 DSM-IV criteria for depression on a scale of 0 (not at all) to 3 (nearly every day). It is a public resource that is easy to find online, available without cost in several languages, and takes just a few minutes to complete.14
PHQ-9 has shown excellent test–retest reliability in screening for depression, and normative data on the instrument’s use are available in various clinical populations.15 Research has shown that as PHQ-9 depression scores increase, functional status decrease, while depressive symptoms, sick days, and health care utilization increase.15 In one study, a PHQ-9 score of ≥10 had 88% sensitivity and specificity for detecting depression, with scores of 5, 10, 15, and 20 indicating mild, moderate, moderately severe, and severe depression, respectively.16 In addition to its use as a screening tool, PHQ-9 is a responsive and reliable measure of depression treatment outcomes.17
Mood Disorder Questionnaire
MDQ is another brief, self-report questionnaire that is available online. It is designed to identify and monitor patients who are likely to meet diagnostic criteria for bipolar disorder.18,19
The first question on the MDQ asks if the patient has experienced any of 13 common mood and behavior symptoms. The second question asks if these symptoms have ever occurred at the same time, and the third asks the degree to which the patient finds the symptoms to be problematic. The remaining 2 questions provide additional, clinical information, because they address family history of manic–depressive illness or bipolar disorder and whether a diagnosis of either disorder has been made.
The MDQ has shown validity in assessing bipolar disorder symptoms in a general population,20 although recent research suggests that imprecise recall bias may limit its reliability in detecting hypomanic episodes earlier in life.21 Nonetheless, its specificity of >97% means that it will effectively screen out just about all true negatives.18
Generalized Anxiety Disorder 7-item scale
GAD-7 scale is a brief, self-administered questionnaire for screening and measuring severity of GAD.22 It asks patients to rate 7 items that represent problems with general anxiety and scores each item on a scale of 0 (not at all) to 3 (nearly every day). Similar to the other measures, it is easily accessible online.
Research evidence supports the reliability and validity of GAD-7 as a measure of anxiety in the general population. Sensitivity and specificity are 89% and 82%, respectively. Normative data for age and sex specific subgroups support its use across age groups and in both males and females.23 The GAD-7 performs well for detecting and monitoring not only GAD but also panic disorder, social anxiety disorder, and posttraumatic stress disorder.24
CAGE questionnaire for detection of substance use
The CAGE questionnaire is a widely-used screening tool that was originally developed to detect alcohol abuse, but has been adapted to assess other substance abuse.25,26 The omission of substance abuse from diagnostic consideration can have a major effect on quality of care, because substance abuse can be the underlying cause of other diseases. Therefore, routine administration of this instrument in clinical practice can lead to better understanding and monitoring of patient health.27
Similar to other instruments, CAGE is free and available online.27 It contains 4 simple questions, with 1 point is assigned to each positive answer.
Have you ever:
1. Felt the need to cut down on your drinking or drug use?
2. Have people annoyed you by criticizing your drinking or drug use?
3. Have you felt bad or guilty about your drinking or drug use?
4. Have you ever had a drink or used drugs first thing in the morning to steady your nerves or to get rid of a hangover (eye-opener)?
The simple mnemonic CAGE makes the questions easy to remember and to administer in a clinical setting. CAGE has demonstrated validity, with one study determining that CAGE scores ≥2 had a specificity and sensitivity of 76% and 93%, respectively, for identifying excessive drinking, and a specificity and sensitivity of 77% and 91%, respectively, for identifying alcohol abuse.28
Columbia Suicide Severity Rating Scale (C-SSRS)
C-SSRS was developed by researchers at Columbia University to assess the severity of and track changes over time in suicidal ideation and behavior. C-SSRS is 2 pages and takes only a few minutes to administer; however, it also may be completed as a self-report measure. The questions are phrased for use in an interview format, and clinicians are encouraged to receive training prior to its administration, although specific training in mental health is not required.
The “Lifetime/Recent” version allows practitioners to gather lifetime history of suicidality as well as any recent suicidal ideation and/or behavior, whereas the “Since Last Visit” version of the scale assesses suicidality in patients who have completed at least 1 Lifetime/Recent C-SSRS assessment. A truncated, 6-item “Screener” version is typically used in emergency situations. A risk assessment can be added to either the Full or Screener version to summarize the answers from C-SSRS and document risk and protective factors.29
Several studies have found C-SSRS to be reliable and valid for identifying suicide risk in children and adults.30,31USA Today reported that an individual exhibiting even a single behavior identified by the scale is 8 to 10 times more likely to complete suicide.32 In addition, the C-SSRS has helped reduce the suicide rate 65% in one of the largest providers of community-based behavioral health care in the United States.32
Using scales to augment care
Each of the scales described in this article can easily be incorporated into clinical practice and offers psychiatrists important clinical information that may have been missed or not addressed in the initial clinical interview. This information can be used to follow progression of symptoms and effectiveness of treatment. Although rating scales should never be used alone to establish a diagnosis or clinical treatment plan, they can and should be used to augment information from the clinician’s assessment and follow-up interviews.5
1. McDowell I. Measuring health: a guide to rating scales and questionnaires. 3rd ed. New York, NY: Oxford University Press; 2006.
2. Kennedy Forum. Fixing behavioral health care in America: a national call for integrating and coordinating specialty behavioral health care with the medical system. http://thekennedyforum-dot-org.s3.amazonaws.com/documents/KennedyForum-BehavioralHealth_FINAL_3.pdf. Published 2015. Accessed January 13, 2017.
3. The Office of the National Coordinator for Health Information Technology. Behavioral health (BH) Clinical Quality Measures (CQMs) Program initiatives. https://www.healthit.gov/sites/default/files/pdf/2012-09-27-behavioral-health-clinical-quality-measures-program-initiatives-public-forum.pdf. Published September 27, 2012. Accessed January 13, 2017.
4. Unutzer J, Harbin H, Schoenbaum M. The collaborative care model: an approach for integrating physical and mental health care in Medicaid health homes. https://www.medicaid.gov/State-Resource-Center/Medicaid-State-Technical-Assistance/Health-Homes-Technical-Assistance/Downloads/HH-IRC-Collaborative-5-13.pdf. Published May 2013. Accessed January 13, 2016.
5. World Group On Psychiatric Evaluation; American Psychiatric Association Steering Committee On Practice Guidelines. Practice guideline for the psychiatric evaluation of adults. 2nd ed. http://psychiatryonline.org/pb/assets/raw/sitewide/practice_guidelines/guidelines/psychevaladults.pdf. Published June 2006. Accessed January 13, 2016.
6. Melek S, Norris D, Paulus J. Economic impact of integrated medical-behavioral healthcare: implications for psychiatry. Denver, CO: Milliman, Inc; 2014.
7. Archer J, Bower P, Gilbody S, et al. Collaborative care for depression and anxiety problems. Cochrane Database Syst Rev. 2012;10:CD006525. doi: 10.1002/14651858.CD006525.pub2.
8. Kennedy P. Forum. Fixing behavioral health care in America: a national call for measurement-based care. https://www.thekennedyforum.org/news/measurement-based-care-issue-brief. Published December 10, 2015. Accessed January 13, 2017.
9. Zimmerman M, McGlinchey JB. Why don’t psychiatrists use scales to measure outcome when treating depressed patients? J Clin Psychiatry. 2008;69(12):1916-1919.
10. Hatfield D, McCullough L, Frantz SH, et al. Do we know when our clients get worse? An investigation of therapists’ ability to detect negative client change. Clin Psychol Psychother. 2010;17(1):25-32.
11. SAMHSA-HRSA Center for Integrated Solutions. Screening tools. http://www.integration.samhsa.gov/clinical-practice/screening-tools. Accessed January 14, 2016.
12. Moller HJ. Standardised rating scales in psychiatry: methodological basis, their possibilities and limitations and descriptions of important rating scales. World J Biol Psychiatry. 2009;10(1):6-26.
13. Sajatovic M, Ramirez LF. Rating scales in mental health. 2nd ed. Hudson, OH: Lexi-Comp; 2003.
14. Patient Health Questionnaire-9 (PHQ-9). http://www.agencymeddirectors.wa.gov/files/AssessmentTools/14-PHQ-9%20overview.pdf. Accessed February 16, 2016.
15. Patient Health Questionnaire-9 (PHQ-9). Rehab Measures Web site. http://www.rehabmeasures.org/Lists/RehabMeasures/DispForm.aspx?ID=954. Updated August 28, 2014. Accessed February 16, 2016.
16. Kroenke K, Spitzer RL, Williams JB. The PHQ-9: validity of a brief depression severity measure. J Gen Intern Med. 2001;16(9):606-613.
17. Löwe B, Unützer J, Callahan CM, et al. Monitoring depression treatment outcomes with the Patient Health Questionnaire-9. Med Care. 2004;42(12):1194-1201.
18. Ketter TA. Strategies for monitoring outcomes in patients with bipolar disorder. Prim Care Companion J Clin Psychiatry. 2010;12(suppl 1):10-16.
19. The Mood Disorder Questionnaire. University of Texas Medical Branch. http://www.dbsalliance.org/pdfs/MDQ.pdf. Published 2000. Accessed March 1, 2016.
20. Hirschfeld RM, Holzer C, Calabrese JR, et al. Validity of the mood disorder questionnaire: a general population study. Am J Psychiatry. 2003;160(1):178-180.
21. Boschloo L, Nolen WA, Spijker AT, et al. The Mood Disorder Questionnaire (MDQ) for detecting (hypo)manic episodes: its validity and impact of recall bias. J Affect Disord. 2013;151(1):203-208.
22. Spitzer RL, Kroenke K, Williams JB, et al. A brief measure for assessing generalized anxiety disorder: the GAD-7. Arch Intern Med. 2006;166(10):1092-1097.
23. Lowe B, Decker O, Müller S, et al. Validation and standardization of the Generalized Anxiety Disorder Screener (GAD-7) in the general population. Med Care. 2008;46(3):266-274.
24. Kroenke K, Spitzer RL, Williams JB, et al. Anxiety disorders in primary care: prevalence, impairment, comorbidity, and detection. Ann Intern Med. 2007;146(5):317-325.
25. Ewing JA. Detecting alcoholism. The CAGE Questionnaire. JAMA. 1984;252(14):1905-1907.
26. CAGE substance abuse screening tool. Johns Hopkins Medicine. http://www.hopkinsmedicine.org/johns_hopkins_healthcare/downloads/CAGE%20Substance%20Screening%20Tool.pdf. Accessed January 13, 2017.
27. O’Brien CP. The CAGE questionnaire for detection of alcoholism: a remarkably useful but simple tool. JAMA. 2008;300(17):2054-2056.
28. Bernadt MW, Mumford J, Taylor C, et al. Comparison of questionnaire and laboratory tests in the detection of excessive drinking and alcoholism. Lancet. 1982;1(8267):325-328.
29. Columbia Suicide-Severity Rating Scale (CS-SRS). http://cssrs.columbia.edu/the-columbia-scale-c-ssrs/cssrs-for-communities-and-healthcare/#filter=.general-use.english. Accessed March 6, 2016.
30. Mundt JC, Greist JH, Jefferson JW, et al. Prediction of suicidal behavior in clinical research by lifetime suicidal ideation and behavior ascertained by the electronic Columbia-Suicide Severity Rating Scale. J Clin Psychiatry. 2013;74(9):887-893.
31. Posner K, Brown GK, Stanley B, et al. The Columbia-Suicide Severity Rating Scale: initial validity and internal consistency findings from three multisite studies with adolescents and adults. Am J Psychiatry. 2011;168(12):1266-1277.
32. Esposito L. Suicide Checklist Spots People at Highest Risk. USA Today. http://usatoday30.usatoday.com/news/health/story/health/story/2011-11-09/Suicide-checklist-spots-people-at-highest-risk/51135944/1. Published November 9, 2011. Accessed March 6, 2016.