User login
Bringing you the latest news, research and reviews, exclusive interviews, podcasts, quizzes, and more.
Powered by CHEST Physician, Clinician Reviews, MDedge Family Medicine, Internal Medicine News, and The Journal of Clinical Outcomes Management.
ESC: Too much TV boosts PE risk
LONDON – Middle-aged adults who watch TV for an average of 5 or more hours per night face an adjusted 6.5-fold increased risk of fatal pulmonary embolism, compared with those who watch less than 2.5 hours per night, Toru Shirakawa reported at the annual congress of the European Society of Cardiology.
This was the key lesson gleaned from an analysis from the Japan Collaborative Cohort Study, the first large-scale prospective investigation of the relationship between prolonged television watching and pulmonary embolism (PE). The study included 86,024 Japanese participants aged 40-79 years prospectively followed for a median of 18.4 years, explained Mr. Shirakawa, a medical student at Osaka (Japan) University.

And while many busy medical professionals might presume 5 hours–plus of TV watching per night constitutes extreme behavior, that’s hardly the case. Indeed, according to the Nielsen survey, American adults watch an average of 4.85 hours of TV nightly.
During the study period there were 59 confirmed deaths from PE. In a multivariate analysis adjusted for sex and baseline age, cardiovascular risk factors, and physical activity level, a strong dose-response relationship was evident between hours of TV viewing and fatal PE.
This association was most pronounced in the 40- to 59-year-olds. Using as a reference group subjects who watched less than 2.5 hours per day, those who watched 2.5-4.9 hours had an adjusted 3.14-fold increased risk of fatal PE. Individuals who watched 5 hours or more – less than the average length of two American football games – were at 6.49-fold increased risk.
The same dose-response association was evident in the full study population spanning ages 40 through 79 years at entry. However, the magnitude of risk attributable to prolonged television watching in the overall group wasn’t as great, since 60- to 79-year-olds face multiple age-related competing mortality risks. Still, 40- to 79-year-olds who watched at least 5 hours of TV daily had an adjusted 2.36-fold greater risk of fatal PE, compared with those who watched for less than 2.5 hours.
Mr. Shirakawa observed that the mechanism of injury is presumably the same as previously reported in studies of “shelter death” during the bombing of London during World War II, as well as “economy-class syndrome,” first described in conjunction with long-distance airplane flights in 1954. Basically, prolonged leg immobility leads to inadequate circulation and resultant venous clot formation. But prolonged TV watching is a much more common risk factor than is economy-class syndrome, he noted.
“The take-home message is this: Public awareness of the risk of pulmonary embolism from lengthy leg immobility is essential. To prevent the occurrence of pulmonary embolism, we recommend the same preventive behavior used against economy-class syndrome. That is, take a break, stand up, and walk around during the television viewing. And drink water to prevent dehydration; that is also important,” Mr. Shirakawa said.
Session cochair Dr. José Ramón González Juanatey observed that the true burden of PE triggered by prolonged TV watching is far greater than documented in the Japanese study because the analysis focused exclusively on fatal cases.
“Only about 10% of cases of pulmonary embolism are immediately fatal events,” commented Dr. González Juanatey of the University of Santiago de Compostela and president of the Spanish Society of Cardiology.
“The absolute risk may be fairly small, but it’s a devastating thing to have happen to you,” added cochair Dr. Ian Graham, professor of cardiovascular medicine at Trinity College, Dublin.
The Japan Collaborative Cohort Study has been funded by scientific grants from various Japanese health and education ministries. Mr. Shirakawa reported having no financial conflicts.
LONDON – Middle-aged adults who watch TV for an average of 5 or more hours per night face an adjusted 6.5-fold increased risk of fatal pulmonary embolism, compared with those who watch less than 2.5 hours per night, Toru Shirakawa reported at the annual congress of the European Society of Cardiology.
This was the key lesson gleaned from an analysis from the Japan Collaborative Cohort Study, the first large-scale prospective investigation of the relationship between prolonged television watching and pulmonary embolism (PE). The study included 86,024 Japanese participants aged 40-79 years prospectively followed for a median of 18.4 years, explained Mr. Shirakawa, a medical student at Osaka (Japan) University.
And while many busy medical professionals might presume 5 hours–plus of TV watching per night constitutes extreme behavior, that’s hardly the case. Indeed, according to the Nielsen survey, American adults watch an average of 4.85 hours of TV nightly.
During the study period there were 59 confirmed deaths from PE. In a multivariate analysis adjusted for sex and baseline age, cardiovascular risk factors, and physical activity level, a strong dose-response relationship was evident between hours of TV viewing and fatal PE.
This association was most pronounced in the 40- to 59-year-olds. Using as a reference group subjects who watched less than 2.5 hours per day, those who watched 2.5-4.9 hours had an adjusted 3.14-fold increased risk of fatal PE. Individuals who watched 5 hours or more – less than the average length of two American football games – were at 6.49-fold increased risk.
The same dose-response association was evident in the full study population spanning ages 40 through 79 years at entry. However, the magnitude of risk attributable to prolonged television watching in the overall group wasn’t as great, since 60- to 79-year-olds face multiple age-related competing mortality risks. Still, 40- to 79-year-olds who watched at least 5 hours of TV daily had an adjusted 2.36-fold greater risk of fatal PE, compared with those who watched for less than 2.5 hours.
Mr. Shirakawa observed that the mechanism of injury is presumably the same as previously reported in studies of “shelter death” during the bombing of London during World War II, as well as “economy-class syndrome,” first described in conjunction with long-distance airplane flights in 1954. Basically, prolonged leg immobility leads to inadequate circulation and resultant venous clot formation. But prolonged TV watching is a much more common risk factor than is economy-class syndrome, he noted.
“The take-home message is this: Public awareness of the risk of pulmonary embolism from lengthy leg immobility is essential. To prevent the occurrence of pulmonary embolism, we recommend the same preventive behavior used against economy-class syndrome. That is, take a break, stand up, and walk around during the television viewing. And drink water to prevent dehydration; that is also important,” Mr. Shirakawa said.
Session cochair Dr. José Ramón González Juanatey observed that the true burden of PE triggered by prolonged TV watching is far greater than documented in the Japanese study because the analysis focused exclusively on fatal cases.
“Only about 10% of cases of pulmonary embolism are immediately fatal events,” commented Dr. González Juanatey of the University of Santiago de Compostela and president of the Spanish Society of Cardiology.
“The absolute risk may be fairly small, but it’s a devastating thing to have happen to you,” added cochair Dr. Ian Graham, professor of cardiovascular medicine at Trinity College, Dublin.
The Japan Collaborative Cohort Study has been funded by scientific grants from various Japanese health and education ministries. Mr. Shirakawa reported having no financial conflicts.
AT THE ESC CONGRESS 2015
Key clinical point: Tuning in to the television for an average of 5 hours or more per day is independently associated with a sharply increased pulmonary embolism risk.
Major finding: Middle-aged Japanese adults who spent 5 or more hours per day watching television were at an adjusted 6.5-fold greater risk of fatal pulmonary embolism than were those who averaged less than 2.5 hours of viewing.
Data source: This prospective Japanese national study included 86,024 participants aged 40-79 years who were followed for a median of 18.4 years.
Disclosures: The Japan Collaborative Cohort Study has been funded by scientific grants from various Japanese health and education ministries. The presenter reported having no financial conflicts.

ICEID: Population-level data support ACIP flu vaccine recommendations
ATLANTA – Expanded influenza vaccination coverage among children between 2002 and 2012 appears to have provided direct benefit with respect to influenza-related hospitalizations among vaccinated children, according to an analysis of vaccination and hospitalization data.
Additionally, the coverage among children appears to have provided indirect benefits in adults, Cecile Viboud, Ph.D. of the National Institutes of Health, Bethesda, Md., reported at the International Conference on Emerging Infectious Diseases.

Between 2006-2007 and 2010-2011, the U.S. Advisory Committee on Immunization Practices (ACIP) broadened vaccination recommendations to include not only children aged 6-23 months, but also those aged 24-59 months, then those aged 5-18 years, and eventually all those over age 6 months. Consequently, the vaccine coverage rate increased from less than 5% in 2002 to about 52% in 2012 (and to about 70% in those under age 5 years). Modeling of weekly influenza-related hospitalization outcomes (pneumonia and influenza outcomes and respiratory and circulatory outcomes) provided solid evidence of a direct and significant protective effect of vaccination both in children under age 5 years and in those aged 5-19 years. This finding was consistent across disease outcomes, and remained significant in those under age 5 after adjusting for state, but the association was weaker with stratification by season, Dr. Viboud noted.
Further, hospitalization rates among working-age adults and seniors aged 65-74 years declined with increasing pediatric vaccine coverage, suggesting an indirect protective effect in that population, she said, noting that the vaccination rate among older adults remained stable across the study period.
No evidence was seen for an indirect protective effect among adults over age 74 years, she said.
Dr. Viboud and her colleagues used age-specific annual vaccination rates derived from the National Immunization Survey and the Behavioral Risk Factor Surveillance System. Age-specific rates of influenza-associated hospitalizations were estimated for each season during 1989-2012 by modeling weekly pneumonia and influenza outcomes plus respiratory and circulatory outcomes from the State Inpatient Databases of the Agency for Healthcare Research & Quality.
“In a nutshell, we see strong statistical evidence for the direct protective effects of the influenza vaccination program in children on the basis of analyses of population-level hospitalization data, which supports the expansion of the ACIP flu vaccine recommendations in the past decade,” Dr. Viboud said in an interview. “We also find weak evidence of herd immunity effects, whereby hospitalization rates are reduced in adults. That the evidence is weak is perhaps not surprising given that vaccine uptake in children remains moderate (60% in most highly vaccinated states) and vaccine effectiveness is modest at 40%-60% depending on the season. Independent information from mathematical transmission models confirms that herd immunity benefits are expected to be low given these levels of vaccine coverage.”
The indirect effects may become clearer with increasing vaccine uptake, she added.
Dr. Viboud reported having no disclosures.
ATLANTA – Expanded influenza vaccination coverage among children between 2002 and 2012 appears to have provided direct benefit with respect to influenza-related hospitalizations among vaccinated children, according to an analysis of vaccination and hospitalization data.
Additionally, the coverage among children appears to have provided indirect benefits in adults, Cecile Viboud, Ph.D. of the National Institutes of Health, Bethesda, Md., reported at the International Conference on Emerging Infectious Diseases.
Between 2006-2007 and 2010-2011, the U.S. Advisory Committee on Immunization Practices (ACIP) broadened vaccination recommendations to include not only children aged 6-23 months, but also those aged 24-59 months, then those aged 5-18 years, and eventually all those over age 6 months. Consequently, the vaccine coverage rate increased from less than 5% in 2002 to about 52% in 2012 (and to about 70% in those under age 5 years). Modeling of weekly influenza-related hospitalization outcomes (pneumonia and influenza outcomes and respiratory and circulatory outcomes) provided solid evidence of a direct and significant protective effect of vaccination both in children under age 5 years and in those aged 5-19 years. This finding was consistent across disease outcomes, and remained significant in those under age 5 after adjusting for state, but the association was weaker with stratification by season, Dr. Viboud noted.
Further, hospitalization rates among working-age adults and seniors aged 65-74 years declined with increasing pediatric vaccine coverage, suggesting an indirect protective effect in that population, she said, noting that the vaccination rate among older adults remained stable across the study period.
No evidence was seen for an indirect protective effect among adults over age 74 years, she said.
Dr. Viboud and her colleagues used age-specific annual vaccination rates derived from the National Immunization Survey and the Behavioral Risk Factor Surveillance System. Age-specific rates of influenza-associated hospitalizations were estimated for each season during 1989-2012 by modeling weekly pneumonia and influenza outcomes plus respiratory and circulatory outcomes from the State Inpatient Databases of the Agency for Healthcare Research & Quality.
“In a nutshell, we see strong statistical evidence for the direct protective effects of the influenza vaccination program in children on the basis of analyses of population-level hospitalization data, which supports the expansion of the ACIP flu vaccine recommendations in the past decade,” Dr. Viboud said in an interview. “We also find weak evidence of herd immunity effects, whereby hospitalization rates are reduced in adults. That the evidence is weak is perhaps not surprising given that vaccine uptake in children remains moderate (60% in most highly vaccinated states) and vaccine effectiveness is modest at 40%-60% depending on the season. Independent information from mathematical transmission models confirms that herd immunity benefits are expected to be low given these levels of vaccine coverage.”
The indirect effects may become clearer with increasing vaccine uptake, she added.
Dr. Viboud reported having no disclosures.
AT ICEID 2015
Key clinical point: Expanded influenza vaccination coverage in children provided direct benefits with respect to hospitalizations.
Major finding: Vaccine coverage rate increased from less than 5% in 2002 to about 52% in 2012 .
Data source: An analysis of vaccination and hospitalization data.
Disclosures: Dr. Viboud reported having no disclosures.

ICEID: Pertussis vaccination reduces disease severity
ATLANTA – Pertussis vaccination does not eliminate the risk of disease, but it does appear to reduce disease severity, according to findings from a study of more than 10,000 cases.
In fact, despite high acellular pertussis vaccine coverage in the United States, 48,277 cases were reported in 2012, and many of these were among vaccinated individuals – a result of waning protection over time following childhood pertussis vaccination, Lucy A. McNamara, Ph.D., of the Centers for Disease Control and Prevention in Atlanta reported at the International Conference on Emerging Infectious Diseases.

To assess whether severe symptoms or complications are more common in those who are not fully vaccinated, Dr. McNamara and her colleagues identified a total of 10,092 pertussis case patients from the Enhanced Pertussis Surveillance/Emerging Infections Program network in 2010-2012 and collected case information through vaccine registries and interviews with physicians and patients at six network sites. Of those aged 3 months to 19 years, 81% were up to date for pertussis vaccinations for their age, and of adults, 45% had received Tdap.
Up-to-date status was protective against severe disease, defined as disease involving seizures, encephalopathy, pneumonia, or hospitalization, in children aged 7 months to 6 years, who had about a 60% reduction in risk, compared with those who were not up to date. Up-to-date status also reduced the risk of posttussive vomiting, which sometimes accompanies severe coughing fits, by about 25% in those aged 19 months to 64 years, she said, adding that the risk of vomiting after coughing was about 38% lower in this age group when patients received antibiotic treatment within 1 week of the start of the illness.
The effect on posttussive vomiting was independent of antibiotic treatment timing, which further underscores the value of both rapid treatment and completion of the pertussis vaccination schedule, she said.
Dr. McNamara reported having no disclosures.
ATLANTA – Pertussis vaccination does not eliminate the risk of disease, but it does appear to reduce disease severity, according to findings from a study of more than 10,000 cases.
In fact, despite high acellular pertussis vaccine coverage in the United States, 48,277 cases were reported in 2012, and many of these were among vaccinated individuals – a result of waning protection over time following childhood pertussis vaccination, Lucy A. McNamara, Ph.D., of the Centers for Disease Control and Prevention in Atlanta reported at the International Conference on Emerging Infectious Diseases.
To assess whether severe symptoms or complications are more common in those who are not fully vaccinated, Dr. McNamara and her colleagues identified a total of 10,092 pertussis case patients from the Enhanced Pertussis Surveillance/Emerging Infections Program network in 2010-2012 and collected case information through vaccine registries and interviews with physicians and patients at six network sites. Of those aged 3 months to 19 years, 81% were up to date for pertussis vaccinations for their age, and of adults, 45% had received Tdap.
Up-to-date status was protective against severe disease, defined as disease involving seizures, encephalopathy, pneumonia, or hospitalization, in children aged 7 months to 6 years, who had about a 60% reduction in risk, compared with those who were not up to date. Up-to-date status also reduced the risk of posttussive vomiting, which sometimes accompanies severe coughing fits, by about 25% in those aged 19 months to 64 years, she said, adding that the risk of vomiting after coughing was about 38% lower in this age group when patients received antibiotic treatment within 1 week of the start of the illness.
The effect on posttussive vomiting was independent of antibiotic treatment timing, which further underscores the value of both rapid treatment and completion of the pertussis vaccination schedule, she said.
Dr. McNamara reported having no disclosures.
AT ICEID 2015
Key clinical point: Pertussis vaccination does not eliminate the risk of disease, but it does reduce disease severity, according to findings from a study of more than 10,000 cases.
Major finding: The risk of severe disease in children aged 7 months to 6 years was about 60% lower in children with up-to-date status, compared with those who were not up to date on their pertussis vaccinations.
Data source: Surveillance data on 10,092 patients.
Disclosures: Dr. McNamara reported having no disclosures.

Siblings were most common source of infant pertussis
Infants most often acquired pertussis from siblings, not their mothers as was previously found, researchers reported online in Pediatrics.
The trend reflects the changing epidemiology of pertussis in the United States as immunity to acellular Tdap vaccination wanes among older children and adolescents, who then develop clinical or subclinical pertussis and infect younger siblings, said Tami Skoff at the Centers for Disease Control and Prevention in Atlanta, and her associates. “Prevention efforts should focus on increasing Tdap coverage during pregnancy, because this is currently our best strategy for providing direct protection to the infant, regardless of the changing source of infant infection.”
Bordetella pertussis infects up to 80% of exposed, naive individuals and is particularly risky for infants, the researchers noted. To examine infection sources for this age group, they studied 1,306 pertussis cases among children less than 1 year old that were reported to the Enhanced Pertussis Surveillance program between 2006 and 2013. The program tracks pertussis in Colorado, Connecticut, Massachusetts, Minnesota, New Mexico, New York, and Oregon. For each case, the researchers attempted to identify the infection source – a person with suspected pertussis who had contact with the infant 7-20 days before cough onset (Pediatrics 2015 Sep 7. doi: 10.1542/peds.2015-1120). A source of infection was identified in 43.6% of cases.

Siblings were the infection source for 36% of infants, followed by mothers (21%), fathers (10%), grandparents (8%), and aunts and uncles (7%), the investigators reported. The source was unspecified for 6% of cases, while ill day care contacts, cousins, friends, babysitters, and other contacts accounted for less than 5% of infections each.
“Consistent with previous studies, our analysis of 8 years of enhanced surveillance data identified a source of infection for less than half of reported infant pertussis cases,” the researchers emphasized. Such a high proportion of unknown infection sources limits the efficacy of the cocooning strategy, in which a Tdap booster dose is given to adults and adolescents who are in close contact with infants, the investigators added. “The cocooning strategy is less than ideal, and strong support of vaccination during pregnancy is needed to maximize the protection of infants in the first critical months of life.”
The Enhanced Pertussis Surveillance Program is funded through a cooperative agreement with the Centers for Disease Control and Prevention. The investigators reported no financial disclosures.
Infants most often acquired pertussis from siblings, not their mothers as was previously found, researchers reported online in Pediatrics.
The trend reflects the changing epidemiology of pertussis in the United States as immunity to acellular Tdap vaccination wanes among older children and adolescents, who then develop clinical or subclinical pertussis and infect younger siblings, said Tami Skoff at the Centers for Disease Control and Prevention in Atlanta, and her associates. “Prevention efforts should focus on increasing Tdap coverage during pregnancy, because this is currently our best strategy for providing direct protection to the infant, regardless of the changing source of infant infection.”
Bordetella pertussis infects up to 80% of exposed, naive individuals and is particularly risky for infants, the researchers noted. To examine infection sources for this age group, they studied 1,306 pertussis cases among children less than 1 year old that were reported to the Enhanced Pertussis Surveillance program between 2006 and 2013. The program tracks pertussis in Colorado, Connecticut, Massachusetts, Minnesota, New Mexico, New York, and Oregon. For each case, the researchers attempted to identify the infection source – a person with suspected pertussis who had contact with the infant 7-20 days before cough onset (Pediatrics 2015 Sep 7. doi: 10.1542/peds.2015-1120). A source of infection was identified in 43.6% of cases.
Siblings were the infection source for 36% of infants, followed by mothers (21%), fathers (10%), grandparents (8%), and aunts and uncles (7%), the investigators reported. The source was unspecified for 6% of cases, while ill day care contacts, cousins, friends, babysitters, and other contacts accounted for less than 5% of infections each.
“Consistent with previous studies, our analysis of 8 years of enhanced surveillance data identified a source of infection for less than half of reported infant pertussis cases,” the researchers emphasized. Such a high proportion of unknown infection sources limits the efficacy of the cocooning strategy, in which a Tdap booster dose is given to adults and adolescents who are in close contact with infants, the investigators added. “The cocooning strategy is less than ideal, and strong support of vaccination during pregnancy is needed to maximize the protection of infants in the first critical months of life.”
The Enhanced Pertussis Surveillance Program is funded through a cooperative agreement with the Centers for Disease Control and Prevention. The investigators reported no financial disclosures.
FROM PEDIATRICS
Key clinical point: Siblings were the most common source of infant pertussis in a national surveillance study.
Major finding: Siblings were the infection source for 36% of cases, followed by mothers (21%), fathers (10%), and grandparents (8%).
Data source: Analysis of 1,306 infant pertussis cases identified through the Enhanced Pertussis Surveillance program between 2006 and 2013.
Disclosures: The Enhanced Pertussis Surveillance Program is funded through a cooperative agreement with the Centers for Disease Control and Prevention. The investigators reported no financial disclosures.

VIDEO: Adverse ventilation effect means rethinking Cheyne-Stokes respiration
LONDON – The management of Cheyne-Stokes respiration in patients with heart failure with reduced ejection fraction needs to be reconsidered following the troubling outcome of a major trial that tested adaptive servo-ventilation as treatment for this symptom, Dr. Lars Køber commented during an interview at the annual congress of the European Society of Cardiology.
Cheyne-Stokes respiration, a form of central sleep apnea, differs from obstructive sleep apnea in that heart failure patients do not seem to derive symptomatic benefit from adaptive servo-ventilation treatment, but “physicians have thought they could treat this sleep apnea [with ventilation] and it would change prognosis,” said Dr. Køber. “Treatment of sleep apnea is possible, so physicians had started doing it.” But instead of helping patients, the trial results strongly suggested that patients were harmed by treatment, which was significantly linked with increased rates of both all-cause and cardiovascular mortality (N Engl J Med. 2015 Sep 1. doi: 10.1056/NEJMoa1506459).
In our video interview, Dr. Køber, professor of cardiology at Rigshospitalet and the University of Copenhagen, discusses the results and what the findings imply for future treatment.
The video associated with this article is no longer available on this site. Please view all of our videos on the MDedge YouTube channel
On Twitter @mitchelzoler
AT THE ESC CONGRESS 2015

Liberia officially Ebola free for second time
Liberia was declared free of Ebola by the World Health Organization for the second time on Sept. 3, according to a report from the Centers for Disease Control and Prevention.
Ebola was first detected in Liberia in late March 2014, and since that time the country has reported 5,036 confirmed or probable cases of Ebola, and more than 4,800 deaths. Case incidence reached its highest point in September and October 2014 and began to fall dramatically by December. On May 9, 2015, the country was declared Ebola free.
The disease reentered Liberia on June 29, but through rapid response and active case tracking, the new outbreak was contained within a month. Only 6 confirmed and 2 probable cases were identified, and 143 contacts were identified and monitored. On July 23, the last patient with Ebola was discharged, and after the standard 42-day waiting period, Liberia is once again officially Ebola free.
“As Liberia transitions again from an emergency public health response to a phase of continued vigilance, many of the practices that have been put into place will, in addition to ensuring continued heightened surveillance for Ebola, facilitate the overall rebuilding of the country’s public health infrastructure,” the CDC investigators concluded.
Find the full report in the MMWR (Sept. 3, 2015/Vol. 64).
FROM THE MMWR
Flu vaccine and heart attacks
As we head into influenza season, we are likely steeling our nerves for the inevitable debate with some of our patients about receiving the influenza vaccination.
We are used to hearing patients say, “I have never had it, and I have never gotten the flu,” or (my favorite), “Last time I got the shot, I got the flu.” Arguments that – while defying chance, logic, and science in general – keep us rooted in the daily joys of clinical practice.
Some handy influenza facts:
1. In well-matched years, the number needed to treat (NNT) to prevent one flu-like illness is 33.
2. In unmatched years, the NNT is 100.
We should be adding to this discussion some information about the observed association between the influenza vaccine and acute myocardial infarction (AMI). If compelling arguments about preventing flu-like symptoms don’t carry the day, maybe preventing heart attack will.
Dr. Michelle Barnes and her colleagues at UNSW Australia, Sydney, published the results of a systematic review of case-control studies evaluating the association between the influenza vaccine and AMI (Heart, 2015 Aug. 26. doi:10.1136/heartjnl-2015-307691). In this study, the investigators identified 16 studies on AMI and influenza vaccination or influenza infection.
The odds of influenza infection, influenza-like illness, or respiratory infection were significantly greater in patients with AMI (odds ratio, 2.01; 95% confidence interval: 1.47-2.76). Influenza vaccine was associated with a lower risk of AMI (OR, 0.71; 95% CI: 0.56-0.91).
This is the first meta-analysis compiling all case-control data on the relationship between AMI and the influenza vaccine. Overall, cases had double the risk of influenza or respiratory tract infection, compared with controls.
Influenza has been hypothesized to cause coronary artery occlusion through stenosis of subcritical atherosclerotic plaque, and it has been shown to promote atherogenesis in animal models. The connection between AMI and influenza was first observed in the 1930s during the flu season.
But medicine has a short memory, and our patients sometimes do as well. So, it is time we remind them about this link and encourage them to get their flu shots.
Dr. Ebbert is professor of medicine, a general internist at the Mayo Clinic in Rochester, Minn., and a diplomate of the American Board of Addiction Medicine. The opinions expressed are those of the author and do not necessarily represent the views and opinions of the Mayo Clinic. The opinions expressed in this article should not be used to diagnose or treat any medical condition nor should they be used as a substitute for medical advice from a qualified, board-certified practicing clinician. Dr. Ebbert has no relevant financial disclosures about this article. Follow him on Twitter @jonebbert.

Hot flashes and night sweats • amenorrhea • positive home pregnancy test • Dx?
THE CASE
A 25-year-old G2P2 woman came to our family practice clinic because she had multiple positive home pregnancy test results despite having undergone a sterilization procedure 4 years earlier. She said that 9 months ago, she had begun to experience hot flashes and night sweats that were getting progressively worse. Her menstrual cycles had been regular until 6 months earlier, when her bleeding became very light and irregular (2- to 6-week cycles with only one day of menstruation). Then 3 months ago, she stopped menstruating.
She’d had 2 uncomplicated pregnancies with normal vaginal deliveries 3 and 4 years ago, and had undergone a transcervical sterilization procedure after delivering her second child. Her medical history included hypothyroidism diagnosed at age 15, moderate persistent asthma, and seasonal allergies. She was taking levothyroxine 250 mcg/d, inhaled fluticasone/salmeterol, albuterol, and intranasal mometasone.
Transvaginal ultrasound failed to identify an intrauterine or ectopic pregnancy, and the patient’s ovaries were not visualized (uterine anatomy was normal with an endometrial stripe of 5.7 mm). The result of a serum human chorionic gonadotropin (hCG) test was 6.73 mIU/ mL. (In a nonpregnant, premenopausal woman, hCG is typically undetectable.) Subsequent serial hCG measurements remained low (6.72-7.09 mIU/mL), but persistent. Given these low hCG levels, it was imperative to rule out an intrauterine or ectopic pregnancy. A urine hCG was negative.
THE DIAGNOSIS
Because of our patient’s vasomotor symptoms, we ordered additional laboratory studies, which revealed an elevated follicle-stimulating hormone (FSH) level (66.08 mIU/mL and 42.2 mIU/mL taken one year apart; normal, 1.98-9.58 mIU/mL in a premenopausal female), an elevated luteinizing hormone (LH) level (46.1 mIU/mL; normal, 2.58-15.5 mIU/mL in a premenopausal female), a low thyroid-stimulating hormone (TSH) level (0.445 mIU/mL; normal, 0.465-4.65 mIU/mL), and a normal prolactin level (12.5 mIU/mL). Based on these results, we diagnosed primary ovarian insufficiency (POI).
DISCUSSION
POI, formerly known as premature ovarian failure, is defined as 4 to 6 months of amenorrhea or oligomenorrhea in a woman younger than 40 with an elevated FSH on 2 occasions, at least 4 weeks apart.1-3
The etiology of POI is broad. It can be caused by a failure of the pituitary gland or hypothalamus to secrete regulating hormones to stimulate the ovaries. Possible genetic causes include Turner’s syndrome, fragile X permutation, and other autosomal disorders that cause follicle dysfunction or destruction.1 Infections such as mumps, varicella, and tuberculosis are known to affect ovary function, as well.1,4 In addition, women who are exposed to chemotherapy or radiation are at higher risk for developing POI.1
Because POI and autoimmune disorders tend to occur together, consider screening any patient with POI for disorders such as hypothyroidism and Addison’s disease. A serum analysis to evaluate for autoantibodies against steroid-producing cells may be a potential marker for POI in patients with an autoimmune disease that affects the adrenal glands or thyroid. However, patients with isolated Addison’s disease, autoimmune hypothyroidism, or diabetes mellitus in the absence of POI do not appear to have steroid-specific antibodies.2 In our patient’s case, her hypothyroidism may have placed her at higher risk of having a second organ system adversely affected by her immune system.
What causes a false-positive pregnancy test? This case is unique because our patient reported multiple positive home pregnancy test results and had persistently low serum hCG levels. While she had symptoms that suggested menopause (hot flashes, oligomenorrhea that progressed to amenorrhea), she believed these symptoms were related to pregnancy. In addition to pregnancy, an elevated serum hCG measurement can be due to various malignancies, molar pregnancy, pituitary production of hCG, elevated LH, cross-reactivity with multiple animal exposures (due to the production of human anti-animal antibodies that react with testing), and recent mononucleosis infection.5
Other potential causes for false-positive urine pregnancy test results include tuboovarian abscess,6 adenomyosis,7 and cancers that produce hCG, such as colon, pancreatic, lung, liver, and urothelial bladder carcinoma.8,9 Urine with significant proteinuria can also cause a positive pregnancy test result.10
Our patient likely had a false-positive hCG due to elevated LH, secondary to POI, that demonstrated cross-reactivity on the hCG assay. The similarity in the chemical structure of the beta subunits of hCG and LH have been reported as false-positive tests in the absence of pregnancy.5
Because home pregnancy tests are designed to detect pregnancy as early as possible, they typically feature a high sensitivity by detecting very low levels of hCG, which leads to more frequent false-positive results. It is possible that different assay methods could account for the discrepancy between our patient’s positive home pregnancy tests and our negative laboratory urine pregnancy test.
Our patient and her husband were both counseled regarding her POI diagnosis. We conducted further studies to establish a possible etiology. She was found to have a normal karyotype of 46, XX, which ruled out Turner’s syndrome. Testing for permutations of the FMR1 gene was negative for fragile X syndrome, and antibody testing for thyroid and adrenal glands was negative for autoimmune disease.
Hormone therapy and supplemental calcium and vitamin D are recommended for women with POI to help prevent bone loss and other negative effects of low estrogen.11 We did not take this tack with our patient, however, because she decided she wanted to pursue a tubal ligation reversal in order to get pregnant. So instead, we decreased her dose of levothyroxine to 150 mcg (since her TSH was low) and we referred her to the Reproductive Endocrinology Department.
THE TAKEAWAY
Although many cases of POI have no discernible etiology, it is important to rule out malignancies, failure of pituitary production, genetic causes, infections, and other possible causes. Hormone therapy and prophylactic doses of calcium and vitamin D are recommended for patients diagnosed with POI.
1. Welt CK. Primary ovarian insufficiency: a more accurate term for premature ovarian failure. Clin Endocrinol (Oxf). 2008;68:499-509.
2. Betterle C, Rossi A, Dalla Pria S, et al. Premature ovarian failure: autoimmunity and natural history. Clin Endocrinol (Oxf). 1993;39:35-43.
3. Fox H. The pathology of premature ovarian failure. J Pathol. 1992;167:357-363.
4. Panay N, Kalu E. Management of premature ovarian failure. Best Practice & Research Clinical Obstetrics and Gynaecology. 2009;23;129-140.
5. Braunstein GD. False-positive serum human chorionic gonadotropin results: causes, characteristics, and recognition. Am J Obstet Gynecol. 2002;187:217-224.
6. Levsky ME, Handler JA, Suarez RD, et al. False-positive urine beta-HCG in a woman with a tubo-ovarian abscess. J Emerg Med. 2001;21:407-409.
7. Er TK, Chiang CH, Cheng BH, et al. False-positive urine pregnancy test in a woman with adenomysosis. Am J Emerg Med. 2009;27:1019.e5-7.
8. Rajabi B, Khoury J, Brewer C, et al. Urothelial bladder carcinoma with choriocarcinomatous differentiation presenting with a false-positive pregnancy test. Am J Med Sci. 2013;346:256-258.
9. Marcillac I, Troalen F, Bidart JM, et al. Free human chorionic gonadotropin beta subunit in gonadal and nongonadal neoplasms. Cancer Res. 1992;52:3901-3907.
10. Kountz DS, Kolander SA, Rozovsky A. False positive urinary pregnancy test in the nephrotic syndrome. N Engl J Med. 1989;321:1416.
11. National Institute of Health, National Institute of Child Health and Human Development. What are the treatments for POI? National Institute of Child Health and Human Development Web site. Available at: https://www.nichd.nih.gov/health/topics/poi/conditioninfo/Pages/treatments.aspx. Accessed August 5, 2015.
THE CASE
A 25-year-old G2P2 woman came to our family practice clinic because she had multiple positive home pregnancy test results despite having undergone a sterilization procedure 4 years earlier. She said that 9 months ago, she had begun to experience hot flashes and night sweats that were getting progressively worse. Her menstrual cycles had been regular until 6 months earlier, when her bleeding became very light and irregular (2- to 6-week cycles with only one day of menstruation). Then 3 months ago, she stopped menstruating.
She’d had 2 uncomplicated pregnancies with normal vaginal deliveries 3 and 4 years ago, and had undergone a transcervical sterilization procedure after delivering her second child. Her medical history included hypothyroidism diagnosed at age 15, moderate persistent asthma, and seasonal allergies. She was taking levothyroxine 250 mcg/d, inhaled fluticasone/salmeterol, albuterol, and intranasal mometasone.
Transvaginal ultrasound failed to identify an intrauterine or ectopic pregnancy, and the patient’s ovaries were not visualized (uterine anatomy was normal with an endometrial stripe of 5.7 mm). The result of a serum human chorionic gonadotropin (hCG) test was 6.73 mIU/ mL. (In a nonpregnant, premenopausal woman, hCG is typically undetectable.) Subsequent serial hCG measurements remained low (6.72-7.09 mIU/mL), but persistent. Given these low hCG levels, it was imperative to rule out an intrauterine or ectopic pregnancy. A urine hCG was negative.
THE DIAGNOSIS
Because of our patient’s vasomotor symptoms, we ordered additional laboratory studies, which revealed an elevated follicle-stimulating hormone (FSH) level (66.08 mIU/mL and 42.2 mIU/mL taken one year apart; normal, 1.98-9.58 mIU/mL in a premenopausal female), an elevated luteinizing hormone (LH) level (46.1 mIU/mL; normal, 2.58-15.5 mIU/mL in a premenopausal female), a low thyroid-stimulating hormone (TSH) level (0.445 mIU/mL; normal, 0.465-4.65 mIU/mL), and a normal prolactin level (12.5 mIU/mL). Based on these results, we diagnosed primary ovarian insufficiency (POI).
DISCUSSION
POI, formerly known as premature ovarian failure, is defined as 4 to 6 months of amenorrhea or oligomenorrhea in a woman younger than 40 with an elevated FSH on 2 occasions, at least 4 weeks apart.1-3
The etiology of POI is broad. It can be caused by a failure of the pituitary gland or hypothalamus to secrete regulating hormones to stimulate the ovaries. Possible genetic causes include Turner’s syndrome, fragile X permutation, and other autosomal disorders that cause follicle dysfunction or destruction.1 Infections such as mumps, varicella, and tuberculosis are known to affect ovary function, as well.1,4 In addition, women who are exposed to chemotherapy or radiation are at higher risk for developing POI.1
Because POI and autoimmune disorders tend to occur together, consider screening any patient with POI for disorders such as hypothyroidism and Addison’s disease. A serum analysis to evaluate for autoantibodies against steroid-producing cells may be a potential marker for POI in patients with an autoimmune disease that affects the adrenal glands or thyroid. However, patients with isolated Addison’s disease, autoimmune hypothyroidism, or diabetes mellitus in the absence of POI do not appear to have steroid-specific antibodies.2 In our patient’s case, her hypothyroidism may have placed her at higher risk of having a second organ system adversely affected by her immune system.
What causes a false-positive pregnancy test? This case is unique because our patient reported multiple positive home pregnancy test results and had persistently low serum hCG levels. While she had symptoms that suggested menopause (hot flashes, oligomenorrhea that progressed to amenorrhea), she believed these symptoms were related to pregnancy. In addition to pregnancy, an elevated serum hCG measurement can be due to various malignancies, molar pregnancy, pituitary production of hCG, elevated LH, cross-reactivity with multiple animal exposures (due to the production of human anti-animal antibodies that react with testing), and recent mononucleosis infection.5
Other potential causes for false-positive urine pregnancy test results include tuboovarian abscess,6 adenomyosis,7 and cancers that produce hCG, such as colon, pancreatic, lung, liver, and urothelial bladder carcinoma.8,9 Urine with significant proteinuria can also cause a positive pregnancy test result.10
Our patient likely had a false-positive hCG due to elevated LH, secondary to POI, that demonstrated cross-reactivity on the hCG assay. The similarity in the chemical structure of the beta subunits of hCG and LH have been reported as false-positive tests in the absence of pregnancy.5
Because home pregnancy tests are designed to detect pregnancy as early as possible, they typically feature a high sensitivity by detecting very low levels of hCG, which leads to more frequent false-positive results. It is possible that different assay methods could account for the discrepancy between our patient’s positive home pregnancy tests and our negative laboratory urine pregnancy test.
Our patient and her husband were both counseled regarding her POI diagnosis. We conducted further studies to establish a possible etiology. She was found to have a normal karyotype of 46, XX, which ruled out Turner’s syndrome. Testing for permutations of the FMR1 gene was negative for fragile X syndrome, and antibody testing for thyroid and adrenal glands was negative for autoimmune disease.
Hormone therapy and supplemental calcium and vitamin D are recommended for women with POI to help prevent bone loss and other negative effects of low estrogen.11 We did not take this tack with our patient, however, because she decided she wanted to pursue a tubal ligation reversal in order to get pregnant. So instead, we decreased her dose of levothyroxine to 150 mcg (since her TSH was low) and we referred her to the Reproductive Endocrinology Department.
THE TAKEAWAY
Although many cases of POI have no discernible etiology, it is important to rule out malignancies, failure of pituitary production, genetic causes, infections, and other possible causes. Hormone therapy and prophylactic doses of calcium and vitamin D are recommended for patients diagnosed with POI.
1. Welt CK. Primary ovarian insufficiency: a more accurate term for premature ovarian failure. Clin Endocrinol (Oxf). 2008;68:499-509.
2. Betterle C, Rossi A, Dalla Pria S, et al. Premature ovarian failure: autoimmunity and natural history. Clin Endocrinol (Oxf). 1993;39:35-43.
3. Fox H. The pathology of premature ovarian failure. J Pathol. 1992;167:357-363.
4. Panay N, Kalu E. Management of premature ovarian failure. Best Practice & Research Clinical Obstetrics and Gynaecology. 2009;23;129-140.
5. Braunstein GD. False-positive serum human chorionic gonadotropin results: causes, characteristics, and recognition. Am J Obstet Gynecol. 2002;187:217-224.
6. Levsky ME, Handler JA, Suarez RD, et al. False-positive urine beta-HCG in a woman with a tubo-ovarian abscess. J Emerg Med. 2001;21:407-409.
7. Er TK, Chiang CH, Cheng BH, et al. False-positive urine pregnancy test in a woman with adenomysosis. Am J Emerg Med. 2009;27:1019.e5-7.
8. Rajabi B, Khoury J, Brewer C, et al. Urothelial bladder carcinoma with choriocarcinomatous differentiation presenting with a false-positive pregnancy test. Am J Med Sci. 2013;346:256-258.
9. Marcillac I, Troalen F, Bidart JM, et al. Free human chorionic gonadotropin beta subunit in gonadal and nongonadal neoplasms. Cancer Res. 1992;52:3901-3907.
10. Kountz DS, Kolander SA, Rozovsky A. False positive urinary pregnancy test in the nephrotic syndrome. N Engl J Med. 1989;321:1416.
11. National Institute of Health, National Institute of Child Health and Human Development. What are the treatments for POI? National Institute of Child Health and Human Development Web site. Available at: https://www.nichd.nih.gov/health/topics/poi/conditioninfo/Pages/treatments.aspx. Accessed August 5, 2015.

Tuberculosis testing: Which patients, which test?
› Test for latent tuberculosis (TB) infection by using a tuberculin skin test (TST) or interferon gamma release assay (IGRA) in all patients at risk for developing active TB. B
› Consider patient characteristics such as age, previous vaccination with bacille Calmette-Guérin (BCG), and whether the patient will need serial testing to decide whether TST or IGRA is most appropriate for a specific patient. C
› Don’t use TST or IGRA to make or exclude a diagnosis of active TB; use cultures instead. B
Strength of recommendation (SOR)
A Good-quality patient-oriented evidence
B Inconsistent or limited-quality patient-oriented evidence
C Consensus, usual practice, opinion, disease-oriented evidence, case series
CASE 1 › Judy C is a newly employed 40-year-old health care worker who was born in China and received the bacille Calmette-Guérin (BCG) vaccination as a child. Her new employer requires her to undergo testing for tuberculosis (TB). Her initial tuberculin skin test (TST) is 0 mm, but on a second TST 2 weeks later, it is 8 mm. She is otherwise healthy, negative for human immunodeficiency virus (HIV), and has no constitutional symptoms. Does she have latent tuberculosis infection (LTBI)?
CASE 2 › A mom brings in her 3-year-old son, Patrick. She reports that a staff member at his day care center traveled outside the country for 3 months and was diagnosed with LTBI upon her return. She wants to know if her son should be tested.
More than 2 billion people—nearly one-third of the world’s population—are infected with Mycobacterium tuberculosis.1 Most harbor the bacilli as LTBI, which means that while they have living TB bacilli within their bodies, these mycobacteria are kept dormant by an intact immune system. These individuals are not contagious, nor are they likely to become ill from active TB unless something adversely affects their immune system and increases the likelihood that LTBI will progress to active TB.
Two tests are available for diagnosing LTBI: the TST and the newer interferon gamma release assay (IGRA). Each test has advantages and disadvantages, and the best test to use depends on various patient-specific factors. This article describes whom you should test for LTBI, which test to use, and how to diagnose active TB.
Why test for LTBI?
LTBI is an asymptomatic infection; patients with LTBI have a 5% to 10% lifetime risk of developing active TB.2 The risk of developing active TB is approximately 5% within the first 18 months of infection, and the remaining risk is spread out over the rest of the patient’s life.2 Screening for LTBI is desirable because early diagnosis and treatment can reduce the activation risk to 1% to 2%,3 and treatment for LTBI is simpler, less costly, and less toxic than treatment for active TB.
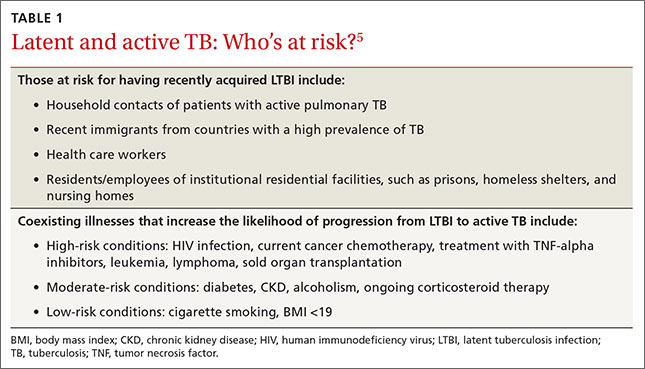
Whom to test. Screening for LTBI should target patients for whom the benefits of treatment outweigh the cost and risks of treatment.4 A decision to screen for LTBI implies that the patient will be treated if he or she tests positive.3
The benefit of treatment increases in people who have a significant risk of progression to active TB—primarily those with recently acquired LTBI, or with co-existing conditions that increase their likelihood of progression (TABLE 1).5
All household contacts of patients with active TB and recent immigrants from countries with a high TB prevalence should be tested for LTBI.6 Those with a negative test and recent exposure should be retested in 8 to 12 weeks to allow for the delay in conversion to a positive test after recent infection.7 Health care workers and others who are potentially exposed to active TB on an ongoing basis should be tested at the time of employment, with repeat testing done periodically based on their risk of infection.8,9
Individuals with coexisting conditions should be tested for LTBI as long as the benefit of treatment outweighs the risk of drug-induced hepatitis. Because the risk of drug-induced hepatitis increases with age, the decision to test/treat is affected by age as well as the individual’s risk of progression. Patients with the highest risk conditions would benefit from testing/treating regardless of age, while treatment may not be justified in those with lower-risk conditions. A reasonable strategy is as follows:10
• high-risk conditions: test regardless of age
• moderate-risk conditions: test those <65 years
• low-risk conditions: test those <50 years.
Children with LTBI are at particularly high risk of progression to active TB.5 The American Academy of Pediatrics (AAP) recommends assessing a child’s risk for TB at first contact with the child and once every 6 months for the first year of life. After one year, annual assessment is recommended, but specific TB testing is not required for children who don’t have risk factors.11 The AAP suggests using a TB risk assessment questionnaire that consists of 4 screening questions with follow-up questions if any of the screening questions are positive (TABLE 2).11
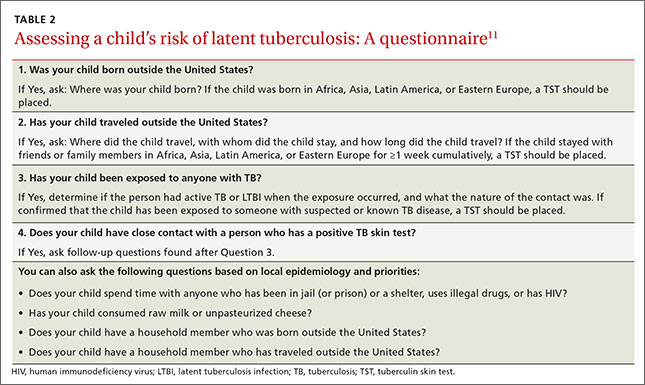
Use of TST is well established
To perform a TST, inject 5 tuberculin units (0.1 mL) of purified protein derivative (PPD) intradermally into the inner surface of the forearm using a 27- to 30-gauge needle. (In the United States, PPD is available as Aplisol or Tubersol.) Avoid the former practice of “control” or anergy testing with mumps or Candida antigens because this is rarely helpful in making TB treatment decisions, even in HIV-positive patients.12
To facilitate intradermal injection, gently stretch the skin taut during injection. Raising a wheal confirms correct placement. The test should be read 48 to 72 hours after it is administered by measuring the greatest diameter of induration at the administration site. (Erythema is irrelevant to how the test is interpreted.) Induration is best read by using a ballpoint pen held at a 45-degree angle pointing toward the injection site. Roll the point of the pen over the skin with gentle pressure toward the injection site until induration causes the pen to stop rolling freely (FIGURE). The induration should be measured with a rule that has millimeter measurements and interpreted as positive or negative based on the individual’s risk factors (TABLE 3).3
Watch for these 2 factors that can affect TST results
Bacille Calmette-Guérin (BCG), an attenuated strain of Mycobacterium bovis, is (or has been) used as a routine childhood immunization in many parts of the world, although not in the United States.13 It is ordinarily given as a single dose shortly after birth, and has some utility in preventing serious childhood TB infection. The antigens in PPD and those in BCG are not identical, but they do overlap.
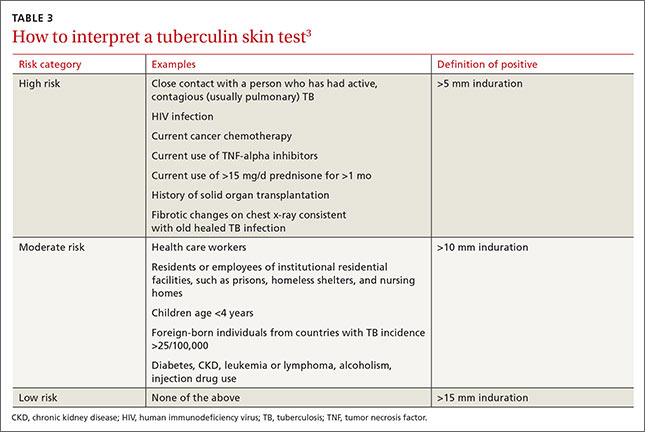
BCG administered after an individual’s first birthday resulted in false positive TSTs >10 mm in 21% of those tested more than 10 years after BCG was administered.14 However, a single BCG vaccine in infancy causes little if any change in the TST result in individuals who are older than age 10 years. When a TST is performed for appropriate reasons, a positive TST in people previously vaccinated with BCG is generally more likely to be the result of LTBI than of BCG.15 Current guidelines from the Centers for Disease Control and Prevention (CDC) recommend that previous BCG status not change the cutoffs used for interpreting TST results.16
Booster phenomenon. In many adults who have undiagnosed LTBI that they acquired in the distant past, or who received BCG vaccination as a child, immunity wanes after several decades. This can result in an initial TST being negative, but because the antigens in the PPD itself stimulate antigenic memory, the next time a TST is performed, it may be positive.
In people who will have annual TST screenings, such as health care workers or nursing home residents, a 2-step PPD can help discriminate this “booster” phenomenon from a new LTBI acquired during the first year of annual TST testing. A second TST is placed 1 to 2 weeks after the initial test, a time interval during which acquisition of LTBI would be unlikely. The result of the second test should be considered the person’s baseline for evaluation of subsequent TSTs. A subsequent TST would be considered positive if the induration is >10 mm and has increased by ≥6 mm since the previous baseline.17
IGRA offers certain benefits
IGRA uses antigens that are more specific for Mycobacterium tuberculosis than the TST, and as a result, this test is not influenced by previous BCG vaccination. It requires only one blood draw, and interpretation does not depend on the patient’s risk category or interpretation of skin induration. The primary disadvantage of IGRAs is high cost (currently $200 to $300 per test), and the need for a laboratory with adequate equipment and personnel trained in performing the test. IGRAs must be collected in special blood tubes, and the samples must be processed within 8 to 16 hours of collection, depending on the test used.5
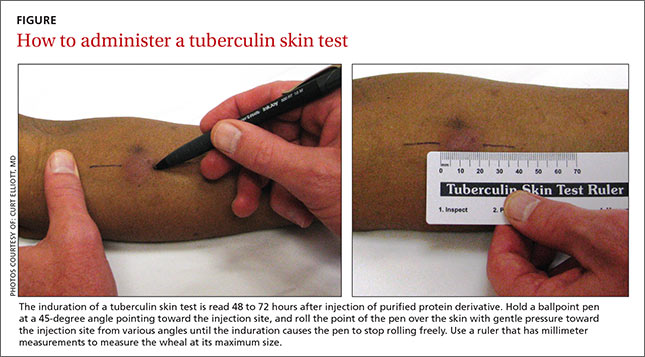
Currently, 2 IGRAs are approved for use in the United States—the QuantiFERON-TB Gold In-Tube (QFT-GIT) and the T-SPOT.TB assay. Both tests may produce false positives in patients infected with Mycobacterium marinum or Mycobacterium kansasii, but otherwise are highly specific for Mycobacterium tuberculosis. IGRA results may be “boosted” by recent TST (ie, a TST given within the previous 3 months may cause a false positive IGRA result), and this effect may begin as early as 3 days after a TST is administered.18 Therefore, if an IGRA is needed to clarify a TST result, it should be drawn on the day the TST is read.19
CDC guidelines (2010) recommend that IGRAs may be used in place of—but not routinely in addition to—TSTs in all cases in which TST is otherwise indicated.20 There are a few situations where one test may be preferred over the other.21
IGRA may be preferred over TST in individuals in one of 2 categories:
• those who have received BCG immunization. If a patient is unsure of their BCG status, the World Atlas of BCG Policies and Practices, available at www.bcgatlas.org,22 can aid clinicians in determining which patients likely received BCG as part of their routine childhood immunizations.
• those in groups that historically have poor rates of return for TST reading, such as individuals who are homeless or suffer from alcoholism or a substance use disorder.
Individuals in whom TST is preferred over IGRA include:
• children age <5 years, because data guiding use of IGRAs in this age group are limited.23 Both TST and IGRA may be falsely negative in children under the age of 3 months.24
• patients who require serial testing, because individuals with positive IGRAs have been shown to commonly test negative on subsequent tests, and there are limited data on interpretation and prognosis of positive IGRAs in people who require serial testing.25
Individuals in whom performing both tests simultaneously could be helpful include:
• those with an initial negative test, but with a high risk for progression to active TB or a poor outcome if the first result is falsely negative (eg, patients with HIV infection or children ages <5 years who have been exposed to a person with active TB)
• those with an initial positive test who don’t believe the test result and are reluctant to be treated for LTBI.
TST and IGRA have comparable sensitivities—around 80% to 90%, respectively—for diagnosing LTBI. IGRAs have a specificity >95% for diagnosing LTBI. While TST specificity is approximately 97% in patients not vaccinated with BCG, it can be as low as 60% in people previously vaccinated with BCG.26 IGRAs have been shown to have higher positive and negative predictive values than TSTs in high-risk patients.27 A recent study suggested that the IGRAs might have a higher rate of false-positive results compared to TSTs in a low-risk population of health care workers.28
Both the TST and IGRA have lag times of 3 to 8 weeks from the time of a new infection until the test becomes positive. It is therefore best to defer testing for LTBI infection until at least 8 weeks after a known TB exposure to decrease the likelihood of a false-negative test.3
Diagnose active TB based on symptoms, culture
The CDC reported 9412 new cases of active TB in the United States in 2014, for a rate of 3 new cases per 100,000 people.29 This is the lowest rate reported since national reporting began in 1953, when the incidence in the United States was 53 cases per 100,000.
Who should you test for active TB? The risk factors for active TB are the same as those for LTBI: recent exposure to an individual with active TB, and other disease processes or medications that compromise the immune system. Consider active TB when a patient with one of these risk factors presents with:2
• persistent fever
• weight loss
• night sweats
• cough, especially if there is any blood.
Routine laboratory and radiographic studies that should prompt you to consider TB include:2
• upper lobe infiltrates on chest x-ray
• sterile pyuria on urinalysis with a negative culture for routine pathogens
• elevated levels of C-reactive protein or an elevated erythrocyte sedimentation rate without another obvious cause.
Active TB typically presents as pulmonary TB, but it can also affect nearly every other body system. Other common presentations include:30
• vertebral destruction and collapse (“Pott's disease”)
• subacute meningitis
• peritonitis
• lymphadenopathy (especially in children).
Culture is the gold standard. Neither TST or IGRA should ever be relied upon to make or exclude the diagnosis of active TB, as these tests are neither sensitive nor specific for diagnosing active TB.31,32 Instead, the gold standard for the diagnosis of active TB remains a positive culture from infected tissue—commonly sputum, pleura or pleural fluid, cerebrospinal fluid, urine, or peritoneal fluid. Cultures are crucial not only to confirm the diagnosis, but to guide therapy, because of the rapidly increasing resistance to firstline antibiotics used to treat TB.33
Culture results and drug sensitivities are ordinarily not available until 2 to 6 weeks after the culture was obtained. A smear for acid-fast bacilli as well as newer rapid diagnostic tests such as nucleic acid amplification (NAA) tests are generally performed on the tissue sample submitted for culture, and these results, while less trustworthy, are generally available within 24 to 48 hours. The CDC recommends that an NAA test be performed in addition to microscopy and culture for specimens submitted for TB diagnosis.34
Since 2011, the World Health Organization has endorsed the use of a new molecular diagnostic test called Xpert MTB/RIF in settings with high prevalence of HIV infection or multidrug-resistant TB (MDR-TB).35 This test is able to detect M. tuberculosis as well as rifampin resistance, a surrogate for MDR-TB, within 2 hours, with sensitivity and specificity approaching that of culture.36
“Culture-negative” TB? A small but not insignificant proportion of patients will present with risk factors for, and clinical signs and symptoms of, active TB; their cultures, however, will be negative. In such cases, consultation with an infectious disease or pulmonary specialist may be warranted. If no alternative diagnosis is found, such patients are said to have “culture-negative active TB” and should be continued on anti-TB drug therapy, although the course may be shortened.37 This highlights the fact that while cultures are key to diagnosing and treating active TB, the condition is—practically speaking—a clinical diagnosis; treatment should not be withheld or stopped simply because of a negative culture or rapid diagnostic test.
CASE 1 › Based on her risk factors (being a health care worker, born in a country with a high prevalence of TB), Ms. C’s cutoff for a positive test is >10 mm, so her TST result is negative and she is not considered to have LTBI. The increase to 8 mm seen on the second TST probably represents either childhood BCG vaccination or previous infection with nontuberculous Mycobacterium.
CASE 2 › Strictly speaking, 3-year-old Patrick does not need testing, because he was exposed only to LTBI, which is not infectious. However, because children under age 5 are at particularly high risk for progressing to active TB and poor outcomes, it would be best to confirm the mother’s story with the day care center and/or health department. If it turns out that Patrick had, in fact, been exposed to active TB, much more aggressive management would be required.
CORRESPONDENCE
Jeff Hall, MD, Family Medicine Center, 3209 Colonial Drive Columbia, SC 29203; [email protected]
1. World Health Organization. Tuberculosis. World Health Organization Web site. Available at: http://www.who.int/mediacentre/factsheets/fs104/en/. Accessed July 7, 2015.
2. Zumla A, Raviglione M, Hafner R, et al. Current concepts: tuberculosis. N Engl J Med. 2013;368:745-755.
3. Targeted tuberculin testing and treatment of latent tuberculosis infection. American Thoracic Society. MMWR Recomm Rep. 2000;49:1-51.
4. Hauck FR, Neese BH, Panchal AS, et al. Identification and management of latent tuberculosis infection. Am Fam Physician. 2009;79:879-886.
5. Getahun H, Matteelli A, Chaisson RE, et al. Latent Mycobacterium tuberculosis infection. N Engl J Med. 2015;372:2127-2135.
6. Arshad S, Bavan L, Gajari K, et al. Active screening at entry for tuberculosis among new immigrants: a systematic review and meta-analysis. Eur Respir J. 2010;35:1336-1345.
7. Greenaway C, Sandoe A, Vissandjee B, et al; Canadian Collaboration for Immigrant and Refugee Health. Tuberculosis: evidence review for newly arriving immigrants and refugees. CMAJ. 2011;183:E939-E951.
8. Jensen PA, Lambert LA, Iademarco MF, et al; CDC. Guidelines for preventing the transmission of Mycobacterium tuberculosis in health-care settings, 2005. MMWR Recomm Rep. 2005;54:1-141.
9. Taylor Z, Nolan CM, Blumberg HM; American Thoracic Society; Centers for Disease Control and Prevention; Infectious Diseases Society of America. Controlling tuberculosis in the United States. Recommendations from the American Thoracic Society, CDC, and the Infectious Diseases Society of America. MMWR Recomm Rep. 2005;54:1-81.
10. Pai M, Menzies D. Diagnosis of latent tuberculosis infection (tuberculosis screening) in HIV-negative adults. UpToDate Web site. Available at: http://www.uptodate.com/contents/diagnosisof-latent-tuberculosis-infection-tuberculosis-screening-in-hivnegative-adults. Accessed July 7, 2015.
11. Pediatric Tuberculosis Collaborative Group. Targeted tuberculin skin testing and treatment of latent tuberculosis infection in children and adolescents. Pediatrics. 2004;114:1175-1201.
12. Centers for Disease Control and Prevention. Anergy skin testing and tuberculosis [corrected] preventive therapy for HIV-infected persons: revised recommendations. MMWR Recomm Rep. 1997;46:1-10.
13. The role of BCG vaccine in the prevention and control of tuberculosis in the United States. A joint statement by the Advisory Council for the Elimination of Tuberculosis and the Advisory Committee on Immunization Practices. MMWR Recomm Rep. 1996;45:1-18.
14. Farhat M, Greenaway C, Pai M, et al. False-positive tuberculin skin tests: what is the absolute effect of BCG and non-tuberculous mycobacteria? Int J Tuberc Lung Dis. 2006;10:1192-1204.
15. Wang L, Turner MO, Elwood RK, et al. A meta-analysis of the effect of Bacille Calmette Guérin vaccination on tuberculin skin test measurements. Thorax. 2002;57:804-809.
16. Centers for Disease Control and Prevention (CDC). Fact sheets: BCG vaccine. CDC Web site. Available at: http://www.cdc.gov/tb/publications/factsheets/prevention/bcg.htm. Accessed July 16, 2015.
17. Menzies D. Interpretation of repeated tuberculin tests. Boosting, conversion, and reversion. Am J Respir Crit Care Med. 1999;159:15-21.
18. van Zyl-Smit RN, Zwerling A, Dheda K, et al. Within-subject variability of interferon-g assay results for tuberculosis and boosting effect of tuberculin skin testing: a systematic review. PLoS One. 2009;4:e8517.
19. Mazurek GH, Jereb J, Lobue P, et al; Division of Tuberculosis Elimination, National Center for HIV, STD, and TB Prevention, Centers for Disease Control and Prevention (CDC). Guidelines for using the QuantiFERON-TB Gold test for detecting Mycobacterium tuberculosis infection, United States. MMWR Recomm Rep. 2005;54:49-55.
20. Mazurek GH, Jereb J, Vernon A, et al; IGRA Expert Committee; Centers for Disease Control and Prevention (CDC). Updated guidelines for using Interferon Gamma Release Assays to detect Mycobacterium tuberculosis infection - United States, 2010. MMWR Recomm Rep. 2010;59:1-25.
21. Muñoz L, Santin M. Interferon- release assays versus tuberculin skin test for targeting people for tuberculosis preventive treatment: an evidence-based review. J Infect. 2013;66:381-387.
22. Zwerling A, Behr MA, Verma A, et al. The BCG World Atlas: a database of global BCG vaccination policies and practices. PLoS Med. 2011;8:e1001012.
23. Mandalakas AM, Detjen AK, Hesseling AC, et al. Interferon-gamma release assays and childhood tuberculosis: systematic review and meta-analysis. Int J Tuberc Lung Dis. 2011;15:1018-1032.
24. American Academy of Pediatrics Committee on Infectious Diseases, Pickering L, ed. Red Book. Report of the Committee on Infectious Diseases. 29th ed. Elk Grove Village, IL: American Academy of Pediatrics; 2012:741.
25. Zwerling A, van den Hof S, Scholten J, et al. Interferon-gamma release assays for tuberculosis screening of healthcare workers: a systematic review. Thorax. 2012;67:62-70. 26. Pai M, Zwerling A, Menzies D. Systematic review: T-cell-based assays for the diagnosis of latent tuberculosis infection: an update. Ann Intern Med. 2008;149:177-184.
27. Diel R, Loddenkemper R, Nienhaus A. Predictive value of interferon- release assays and tuberculin skin testing for progression from latent TB infection to disease state: a meta-analysis. Chest. 2012;142:63-75.
28. Dorman SE, Belknap R, Graviss EA, et al; Tuberculosis Epidemiologic Studies Consortium. Interferon-release assays and tuberculin skin testing for diagnosis of latent tuberculosis infection in healthcare workers in the United States. Am J Respir Crit Care Med. 2014;189:77-87.
29. Scott C, Kirking HL, Jeffries C, et al; Centers for Disease Control and Prevention (CDC). Tuberculosis trends—United States, 2014. MMWR Morb Mortal Wkly Rep. 2015;64:265-269.
30. Golden MP, Vikram HR. Extrapulmonary tuberculosis: an overview. Am Fam Physician. 2005;72:1761-1768.
31. Rangaka MX, Wilkinson KA, Glynn JR, et al. Predictive value of interferon-release assays for incident active tuberculosis: a systematic review and meta-analysis. Lancet Infect Dis. 2012;12:45-55.
32. Metcalfe JZ, Everett CK, Steingart KR, et al. Interferon-release assays for active pulmonary tuberculosis diagnosis in adults in low- and middle-income countries: systematic review and metaanalysis. J Infect Dis. 2011;204:S1120-S1129.
33. Keshavjee S, Farmer PE. Tuberculosis, drug resistance, and the history of modern medicine. N Engl J Med. 2012;367:931-936.
34. Centers for Disease Control and Prevention (CDC). Updated guidelines for the use of nucleic acid amplification tests in the diagnosis of tuberculosis. MMWR Morb Mortal Wkly Rep. 2009;58:7-10.
35. World Health Organization. Global tuberculosis report 2014. World Health Organization Web site. Available at: http://www.who.int/tb/publications/global_report/en/. Accessed July 17, 2015.
36. Steingart KR, Schiller I, Horne DJ, et al. Xpert® MTB/RIF assay for pulmonary tuberculosis and rifampicin resistance in adults. Cochrane Database Syst Rev. 2014;1:CD009593.
37. Hall J, Elliott C. Tuberculosis: Which drug regimen and when. J Fam Practice. 2015;64:27-33.
› Test for latent tuberculosis (TB) infection by using a tuberculin skin test (TST) or interferon gamma release assay (IGRA) in all patients at risk for developing active TB. B
› Consider patient characteristics such as age, previous vaccination with bacille Calmette-Guérin (BCG), and whether the patient will need serial testing to decide whether TST or IGRA is most appropriate for a specific patient. C
› Don’t use TST or IGRA to make or exclude a diagnosis of active TB; use cultures instead. B
Strength of recommendation (SOR)
A Good-quality patient-oriented evidence
B Inconsistent or limited-quality patient-oriented evidence
C Consensus, usual practice, opinion, disease-oriented evidence, case series
CASE 1 › Judy C is a newly employed 40-year-old health care worker who was born in China and received the bacille Calmette-Guérin (BCG) vaccination as a child. Her new employer requires her to undergo testing for tuberculosis (TB). Her initial tuberculin skin test (TST) is 0 mm, but on a second TST 2 weeks later, it is 8 mm. She is otherwise healthy, negative for human immunodeficiency virus (HIV), and has no constitutional symptoms. Does she have latent tuberculosis infection (LTBI)?
CASE 2 › A mom brings in her 3-year-old son, Patrick. She reports that a staff member at his day care center traveled outside the country for 3 months and was diagnosed with LTBI upon her return. She wants to know if her son should be tested.
More than 2 billion people—nearly one-third of the world’s population—are infected with Mycobacterium tuberculosis.1 Most harbor the bacilli as LTBI, which means that while they have living TB bacilli within their bodies, these mycobacteria are kept dormant by an intact immune system. These individuals are not contagious, nor are they likely to become ill from active TB unless something adversely affects their immune system and increases the likelihood that LTBI will progress to active TB.
Two tests are available for diagnosing LTBI: the TST and the newer interferon gamma release assay (IGRA). Each test has advantages and disadvantages, and the best test to use depends on various patient-specific factors. This article describes whom you should test for LTBI, which test to use, and how to diagnose active TB.
Why test for LTBI?
LTBI is an asymptomatic infection; patients with LTBI have a 5% to 10% lifetime risk of developing active TB.2 The risk of developing active TB is approximately 5% within the first 18 months of infection, and the remaining risk is spread out over the rest of the patient’s life.2 Screening for LTBI is desirable because early diagnosis and treatment can reduce the activation risk to 1% to 2%,3 and treatment for LTBI is simpler, less costly, and less toxic than treatment for active TB.
Whom to test. Screening for LTBI should target patients for whom the benefits of treatment outweigh the cost and risks of treatment.4 A decision to screen for LTBI implies that the patient will be treated if he or she tests positive.3
The benefit of treatment increases in people who have a significant risk of progression to active TB—primarily those with recently acquired LTBI, or with co-existing conditions that increase their likelihood of progression (TABLE 1).5
All household contacts of patients with active TB and recent immigrants from countries with a high TB prevalence should be tested for LTBI.6 Those with a negative test and recent exposure should be retested in 8 to 12 weeks to allow for the delay in conversion to a positive test after recent infection.7 Health care workers and others who are potentially exposed to active TB on an ongoing basis should be tested at the time of employment, with repeat testing done periodically based on their risk of infection.8,9
Individuals with coexisting conditions should be tested for LTBI as long as the benefit of treatment outweighs the risk of drug-induced hepatitis. Because the risk of drug-induced hepatitis increases with age, the decision to test/treat is affected by age as well as the individual’s risk of progression. Patients with the highest risk conditions would benefit from testing/treating regardless of age, while treatment may not be justified in those with lower-risk conditions. A reasonable strategy is as follows:10
• high-risk conditions: test regardless of age
• moderate-risk conditions: test those <65 years
• low-risk conditions: test those <50 years.
Children with LTBI are at particularly high risk of progression to active TB.5 The American Academy of Pediatrics (AAP) recommends assessing a child’s risk for TB at first contact with the child and once every 6 months for the first year of life. After one year, annual assessment is recommended, but specific TB testing is not required for children who don’t have risk factors.11 The AAP suggests using a TB risk assessment questionnaire that consists of 4 screening questions with follow-up questions if any of the screening questions are positive (TABLE 2).11
Use of TST is well established
To perform a TST, inject 5 tuberculin units (0.1 mL) of purified protein derivative (PPD) intradermally into the inner surface of the forearm using a 27- to 30-gauge needle. (In the United States, PPD is available as Aplisol or Tubersol.) Avoid the former practice of “control” or anergy testing with mumps or Candida antigens because this is rarely helpful in making TB treatment decisions, even in HIV-positive patients.12
To facilitate intradermal injection, gently stretch the skin taut during injection. Raising a wheal confirms correct placement. The test should be read 48 to 72 hours after it is administered by measuring the greatest diameter of induration at the administration site. (Erythema is irrelevant to how the test is interpreted.) Induration is best read by using a ballpoint pen held at a 45-degree angle pointing toward the injection site. Roll the point of the pen over the skin with gentle pressure toward the injection site until induration causes the pen to stop rolling freely (FIGURE). The induration should be measured with a rule that has millimeter measurements and interpreted as positive or negative based on the individual’s risk factors (TABLE 3).3
Watch for these 2 factors that can affect TST results
Bacille Calmette-Guérin (BCG), an attenuated strain of Mycobacterium bovis, is (or has been) used as a routine childhood immunization in many parts of the world, although not in the United States.13 It is ordinarily given as a single dose shortly after birth, and has some utility in preventing serious childhood TB infection. The antigens in PPD and those in BCG are not identical, but they do overlap.
BCG administered after an individual’s first birthday resulted in false positive TSTs >10 mm in 21% of those tested more than 10 years after BCG was administered.14 However, a single BCG vaccine in infancy causes little if any change in the TST result in individuals who are older than age 10 years. When a TST is performed for appropriate reasons, a positive TST in people previously vaccinated with BCG is generally more likely to be the result of LTBI than of BCG.15 Current guidelines from the Centers for Disease Control and Prevention (CDC) recommend that previous BCG status not change the cutoffs used for interpreting TST results.16
Booster phenomenon. In many adults who have undiagnosed LTBI that they acquired in the distant past, or who received BCG vaccination as a child, immunity wanes after several decades. This can result in an initial TST being negative, but because the antigens in the PPD itself stimulate antigenic memory, the next time a TST is performed, it may be positive.
In people who will have annual TST screenings, such as health care workers or nursing home residents, a 2-step PPD can help discriminate this “booster” phenomenon from a new LTBI acquired during the first year of annual TST testing. A second TST is placed 1 to 2 weeks after the initial test, a time interval during which acquisition of LTBI would be unlikely. The result of the second test should be considered the person’s baseline for evaluation of subsequent TSTs. A subsequent TST would be considered positive if the induration is >10 mm and has increased by ≥6 mm since the previous baseline.17
IGRA offers certain benefits
IGRA uses antigens that are more specific for Mycobacterium tuberculosis than the TST, and as a result, this test is not influenced by previous BCG vaccination. It requires only one blood draw, and interpretation does not depend on the patient’s risk category or interpretation of skin induration. The primary disadvantage of IGRAs is high cost (currently $200 to $300 per test), and the need for a laboratory with adequate equipment and personnel trained in performing the test. IGRAs must be collected in special blood tubes, and the samples must be processed within 8 to 16 hours of collection, depending on the test used.5
Currently, 2 IGRAs are approved for use in the United States—the QuantiFERON-TB Gold In-Tube (QFT-GIT) and the T-SPOT.TB assay. Both tests may produce false positives in patients infected with Mycobacterium marinum or Mycobacterium kansasii, but otherwise are highly specific for Mycobacterium tuberculosis. IGRA results may be “boosted” by recent TST (ie, a TST given within the previous 3 months may cause a false positive IGRA result), and this effect may begin as early as 3 days after a TST is administered.18 Therefore, if an IGRA is needed to clarify a TST result, it should be drawn on the day the TST is read.19
CDC guidelines (2010) recommend that IGRAs may be used in place of—but not routinely in addition to—TSTs in all cases in which TST is otherwise indicated.20 There are a few situations where one test may be preferred over the other.21
IGRA may be preferred over TST in individuals in one of 2 categories:
• those who have received BCG immunization. If a patient is unsure of their BCG status, the World Atlas of BCG Policies and Practices, available at www.bcgatlas.org,22 can aid clinicians in determining which patients likely received BCG as part of their routine childhood immunizations.
• those in groups that historically have poor rates of return for TST reading, such as individuals who are homeless or suffer from alcoholism or a substance use disorder.
Individuals in whom TST is preferred over IGRA include:
• children age <5 years, because data guiding use of IGRAs in this age group are limited.23 Both TST and IGRA may be falsely negative in children under the age of 3 months.24
• patients who require serial testing, because individuals with positive IGRAs have been shown to commonly test negative on subsequent tests, and there are limited data on interpretation and prognosis of positive IGRAs in people who require serial testing.25
Individuals in whom performing both tests simultaneously could be helpful include:
• those with an initial negative test, but with a high risk for progression to active TB or a poor outcome if the first result is falsely negative (eg, patients with HIV infection or children ages <5 years who have been exposed to a person with active TB)
• those with an initial positive test who don’t believe the test result and are reluctant to be treated for LTBI.
TST and IGRA have comparable sensitivities—around 80% to 90%, respectively—for diagnosing LTBI. IGRAs have a specificity >95% for diagnosing LTBI. While TST specificity is approximately 97% in patients not vaccinated with BCG, it can be as low as 60% in people previously vaccinated with BCG.26 IGRAs have been shown to have higher positive and negative predictive values than TSTs in high-risk patients.27 A recent study suggested that the IGRAs might have a higher rate of false-positive results compared to TSTs in a low-risk population of health care workers.28
Both the TST and IGRA have lag times of 3 to 8 weeks from the time of a new infection until the test becomes positive. It is therefore best to defer testing for LTBI infection until at least 8 weeks after a known TB exposure to decrease the likelihood of a false-negative test.3
Diagnose active TB based on symptoms, culture
The CDC reported 9412 new cases of active TB in the United States in 2014, for a rate of 3 new cases per 100,000 people.29 This is the lowest rate reported since national reporting began in 1953, when the incidence in the United States was 53 cases per 100,000.
Who should you test for active TB? The risk factors for active TB are the same as those for LTBI: recent exposure to an individual with active TB, and other disease processes or medications that compromise the immune system. Consider active TB when a patient with one of these risk factors presents with:2
• persistent fever
• weight loss
• night sweats
• cough, especially if there is any blood.
Routine laboratory and radiographic studies that should prompt you to consider TB include:2
• upper lobe infiltrates on chest x-ray
• sterile pyuria on urinalysis with a negative culture for routine pathogens
• elevated levels of C-reactive protein or an elevated erythrocyte sedimentation rate without another obvious cause.
Active TB typically presents as pulmonary TB, but it can also affect nearly every other body system. Other common presentations include:30
• vertebral destruction and collapse (“Pott's disease”)
• subacute meningitis
• peritonitis
• lymphadenopathy (especially in children).
Culture is the gold standard. Neither TST or IGRA should ever be relied upon to make or exclude the diagnosis of active TB, as these tests are neither sensitive nor specific for diagnosing active TB.31,32 Instead, the gold standard for the diagnosis of active TB remains a positive culture from infected tissue—commonly sputum, pleura or pleural fluid, cerebrospinal fluid, urine, or peritoneal fluid. Cultures are crucial not only to confirm the diagnosis, but to guide therapy, because of the rapidly increasing resistance to firstline antibiotics used to treat TB.33
Culture results and drug sensitivities are ordinarily not available until 2 to 6 weeks after the culture was obtained. A smear for acid-fast bacilli as well as newer rapid diagnostic tests such as nucleic acid amplification (NAA) tests are generally performed on the tissue sample submitted for culture, and these results, while less trustworthy, are generally available within 24 to 48 hours. The CDC recommends that an NAA test be performed in addition to microscopy and culture for specimens submitted for TB diagnosis.34
Since 2011, the World Health Organization has endorsed the use of a new molecular diagnostic test called Xpert MTB/RIF in settings with high prevalence of HIV infection or multidrug-resistant TB (MDR-TB).35 This test is able to detect M. tuberculosis as well as rifampin resistance, a surrogate for MDR-TB, within 2 hours, with sensitivity and specificity approaching that of culture.36
“Culture-negative” TB? A small but not insignificant proportion of patients will present with risk factors for, and clinical signs and symptoms of, active TB; their cultures, however, will be negative. In such cases, consultation with an infectious disease or pulmonary specialist may be warranted. If no alternative diagnosis is found, such patients are said to have “culture-negative active TB” and should be continued on anti-TB drug therapy, although the course may be shortened.37 This highlights the fact that while cultures are key to diagnosing and treating active TB, the condition is—practically speaking—a clinical diagnosis; treatment should not be withheld or stopped simply because of a negative culture or rapid diagnostic test.
CASE 1 › Based on her risk factors (being a health care worker, born in a country with a high prevalence of TB), Ms. C’s cutoff for a positive test is >10 mm, so her TST result is negative and she is not considered to have LTBI. The increase to 8 mm seen on the second TST probably represents either childhood BCG vaccination or previous infection with nontuberculous Mycobacterium.
CASE 2 › Strictly speaking, 3-year-old Patrick does not need testing, because he was exposed only to LTBI, which is not infectious. However, because children under age 5 are at particularly high risk for progressing to active TB and poor outcomes, it would be best to confirm the mother’s story with the day care center and/or health department. If it turns out that Patrick had, in fact, been exposed to active TB, much more aggressive management would be required.
CORRESPONDENCE
Jeff Hall, MD, Family Medicine Center, 3209 Colonial Drive Columbia, SC 29203; [email protected]
1. World Health Organization. Tuberculosis. World Health Organization Web site. Available at: http://www.who.int/mediacentre/factsheets/fs104/en/. Accessed July 7, 2015.
2. Zumla A, Raviglione M, Hafner R, et al. Current concepts: tuberculosis. N Engl J Med. 2013;368:745-755.
3. Targeted tuberculin testing and treatment of latent tuberculosis infection. American Thoracic Society. MMWR Recomm Rep. 2000;49:1-51.
4. Hauck FR, Neese BH, Panchal AS, et al. Identification and management of latent tuberculosis infection. Am Fam Physician. 2009;79:879-886.
5. Getahun H, Matteelli A, Chaisson RE, et al. Latent Mycobacterium tuberculosis infection. N Engl J Med. 2015;372:2127-2135.
6. Arshad S, Bavan L, Gajari K, et al. Active screening at entry for tuberculosis among new immigrants: a systematic review and meta-analysis. Eur Respir J. 2010;35:1336-1345.
7. Greenaway C, Sandoe A, Vissandjee B, et al; Canadian Collaboration for Immigrant and Refugee Health. Tuberculosis: evidence review for newly arriving immigrants and refugees. CMAJ. 2011;183:E939-E951.
8. Jensen PA, Lambert LA, Iademarco MF, et al; CDC. Guidelines for preventing the transmission of Mycobacterium tuberculosis in health-care settings, 2005. MMWR Recomm Rep. 2005;54:1-141.
9. Taylor Z, Nolan CM, Blumberg HM; American Thoracic Society; Centers for Disease Control and Prevention; Infectious Diseases Society of America. Controlling tuberculosis in the United States. Recommendations from the American Thoracic Society, CDC, and the Infectious Diseases Society of America. MMWR Recomm Rep. 2005;54:1-81.
10. Pai M, Menzies D. Diagnosis of latent tuberculosis infection (tuberculosis screening) in HIV-negative adults. UpToDate Web site. Available at: http://www.uptodate.com/contents/diagnosisof-latent-tuberculosis-infection-tuberculosis-screening-in-hivnegative-adults. Accessed July 7, 2015.
11. Pediatric Tuberculosis Collaborative Group. Targeted tuberculin skin testing and treatment of latent tuberculosis infection in children and adolescents. Pediatrics. 2004;114:1175-1201.
12. Centers for Disease Control and Prevention. Anergy skin testing and tuberculosis [corrected] preventive therapy for HIV-infected persons: revised recommendations. MMWR Recomm Rep. 1997;46:1-10.
13. The role of BCG vaccine in the prevention and control of tuberculosis in the United States. A joint statement by the Advisory Council for the Elimination of Tuberculosis and the Advisory Committee on Immunization Practices. MMWR Recomm Rep. 1996;45:1-18.
14. Farhat M, Greenaway C, Pai M, et al. False-positive tuberculin skin tests: what is the absolute effect of BCG and non-tuberculous mycobacteria? Int J Tuberc Lung Dis. 2006;10:1192-1204.
15. Wang L, Turner MO, Elwood RK, et al. A meta-analysis of the effect of Bacille Calmette Guérin vaccination on tuberculin skin test measurements. Thorax. 2002;57:804-809.
16. Centers for Disease Control and Prevention (CDC). Fact sheets: BCG vaccine. CDC Web site. Available at: http://www.cdc.gov/tb/publications/factsheets/prevention/bcg.htm. Accessed July 16, 2015.
17. Menzies D. Interpretation of repeated tuberculin tests. Boosting, conversion, and reversion. Am J Respir Crit Care Med. 1999;159:15-21.
18. van Zyl-Smit RN, Zwerling A, Dheda K, et al. Within-subject variability of interferon-g assay results for tuberculosis and boosting effect of tuberculin skin testing: a systematic review. PLoS One. 2009;4:e8517.
19. Mazurek GH, Jereb J, Lobue P, et al; Division of Tuberculosis Elimination, National Center for HIV, STD, and TB Prevention, Centers for Disease Control and Prevention (CDC). Guidelines for using the QuantiFERON-TB Gold test for detecting Mycobacterium tuberculosis infection, United States. MMWR Recomm Rep. 2005;54:49-55.
20. Mazurek GH, Jereb J, Vernon A, et al; IGRA Expert Committee; Centers for Disease Control and Prevention (CDC). Updated guidelines for using Interferon Gamma Release Assays to detect Mycobacterium tuberculosis infection - United States, 2010. MMWR Recomm Rep. 2010;59:1-25.
21. Muñoz L, Santin M. Interferon- release assays versus tuberculin skin test for targeting people for tuberculosis preventive treatment: an evidence-based review. J Infect. 2013;66:381-387.
22. Zwerling A, Behr MA, Verma A, et al. The BCG World Atlas: a database of global BCG vaccination policies and practices. PLoS Med. 2011;8:e1001012.
23. Mandalakas AM, Detjen AK, Hesseling AC, et al. Interferon-gamma release assays and childhood tuberculosis: systematic review and meta-analysis. Int J Tuberc Lung Dis. 2011;15:1018-1032.
24. American Academy of Pediatrics Committee on Infectious Diseases, Pickering L, ed. Red Book. Report of the Committee on Infectious Diseases. 29th ed. Elk Grove Village, IL: American Academy of Pediatrics; 2012:741.
25. Zwerling A, van den Hof S, Scholten J, et al. Interferon-gamma release assays for tuberculosis screening of healthcare workers: a systematic review. Thorax. 2012;67:62-70. 26. Pai M, Zwerling A, Menzies D. Systematic review: T-cell-based assays for the diagnosis of latent tuberculosis infection: an update. Ann Intern Med. 2008;149:177-184.
27. Diel R, Loddenkemper R, Nienhaus A. Predictive value of interferon- release assays and tuberculin skin testing for progression from latent TB infection to disease state: a meta-analysis. Chest. 2012;142:63-75.
28. Dorman SE, Belknap R, Graviss EA, et al; Tuberculosis Epidemiologic Studies Consortium. Interferon-release assays and tuberculin skin testing for diagnosis of latent tuberculosis infection in healthcare workers in the United States. Am J Respir Crit Care Med. 2014;189:77-87.
29. Scott C, Kirking HL, Jeffries C, et al; Centers for Disease Control and Prevention (CDC). Tuberculosis trends—United States, 2014. MMWR Morb Mortal Wkly Rep. 2015;64:265-269.
30. Golden MP, Vikram HR. Extrapulmonary tuberculosis: an overview. Am Fam Physician. 2005;72:1761-1768.
31. Rangaka MX, Wilkinson KA, Glynn JR, et al. Predictive value of interferon-release assays for incident active tuberculosis: a systematic review and meta-analysis. Lancet Infect Dis. 2012;12:45-55.
32. Metcalfe JZ, Everett CK, Steingart KR, et al. Interferon-release assays for active pulmonary tuberculosis diagnosis in adults in low- and middle-income countries: systematic review and metaanalysis. J Infect Dis. 2011;204:S1120-S1129.
33. Keshavjee S, Farmer PE. Tuberculosis, drug resistance, and the history of modern medicine. N Engl J Med. 2012;367:931-936.
34. Centers for Disease Control and Prevention (CDC). Updated guidelines for the use of nucleic acid amplification tests in the diagnosis of tuberculosis. MMWR Morb Mortal Wkly Rep. 2009;58:7-10.
35. World Health Organization. Global tuberculosis report 2014. World Health Organization Web site. Available at: http://www.who.int/tb/publications/global_report/en/. Accessed July 17, 2015.
36. Steingart KR, Schiller I, Horne DJ, et al. Xpert® MTB/RIF assay for pulmonary tuberculosis and rifampicin resistance in adults. Cochrane Database Syst Rev. 2014;1:CD009593.
37. Hall J, Elliott C. Tuberculosis: Which drug regimen and when. J Fam Practice. 2015;64:27-33.
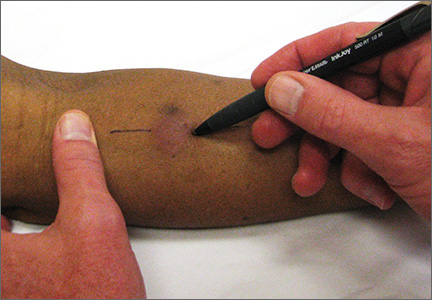
“A” Is for “Airway” (and “Accountability”)
A 3-month-old boy was diagnosed with severe respiratory syncytial virus infection at a North Carolina hospital in 2009. The infant was intubated, and a transfer to another hospital that had a pediatric ICU was ordered. The second hospital’s emergency transport service facilitated the transfer.
The ambulance was staffed by an EMT-paramedic and a transport registered nurse, both certified in Pediatric Advanced Life Support (PALS). During transport, the infant was intubated and medically paralyzed with vecuronium. About 10 minutes prior to arrival, the infant’s condition worsened, and he experienced cardiac arrest. Chest compressions and heart medications were provided.
Upon arrival at the second hospital, the infant was resuscitated. An emergency department physician, Dr S., ordered reintubation, and the infant again experienced cardiac arrest. For the next 10 minutes, Dr S. ordered chest compressions and heart medication; he eventually reintubated the infant, at which point cardiac arrest ceased with a spontaneous heartbeat.
After transfer to the pediatric ICU, the infant was diagnosed with permanent hypoxic ischemic brain injury caused by the cardiac episodes and low oxygen intake. At the time of trial, the child could not walk, talk, or hear very well and was fed via feeding tube. His vision and cognitive function were also impaired.
The plaintiff claimed that the intubation tube should have been adjusted or removed and re-inserted in the ambulance, but that did not happen. At trial, they called as an adverse witness the EMT-paramedic who had been in the ambulance with the plaintiff.
Continue for the outcome >>
OUTCOME
During the plaintiff’s presentation of evidence, the hospital agreed to a settlement of $13 million. The trial against Dr S. continued but ended in a mistrial. The plaintiffs were expected to re-try the claims against him.
COMMENT
This is a bad-airway case. Many medical malpractice cases are bad-airways cases: They are easy to bring and easy for jurors to understand, since hypoxic/anoxic injury is evident and plainly correlated with the airway missteps. These cases are also easy to prove, since the plaintiff can always hire an expert to testify that a reasonably prudent clinician would have been able to properly secure and monitor the airway—and the patient “would be standing here today,” unscathed.
Of course, securing an airway is not a “given” and can be challenging. Factor in variables such as anatomy, age, body habitus, intoxication, combativeness, medical comorbidities, and a full stomach, and the risk swells. If your employment requires that you manage airways, you are practicing in a high-legal-risk environment.
Make sure your skills are up to par. Practice often. Have a plan, a backup plan, and rescue backup plan. Have working suction ready. Check your equipment regularly. Run practice codes—particularly if your practice does not manage cardiorespiratory emergencies often. Does your staff know how to open the crash cart? Are the meds expired? Is the oxygen cylinder empty? Are roles clearly defined? As clinicians, we sit through our share of useless meetings (discussing things like who left what in the break room fridge). We should find time to drill on cardiorespiratory emergencies, because there is no time to “reacquaint oneself” on the fly.
In the case report, we are told that the patient was monitored by O2 saturation (SaO2) and end tidal CO2 (ETCO2). The plaintiff alleges that the transport team (EMT-paramedic and RN) failed to address tube placement and rather focused their efforts on chest compressions and medications. As we know, most cases of pediatric cardiac arrest are not primarily cardiac but instead follow primary progressive respiratory failure. Despite the emphasis on “airway, breathing, circulation” covered by PALS, the airway appears to have been missed and tube placement unquestioned after the child began to decompensate. Tube placement wasn’t reconsidered until 10 minutes after arrival at the second hospital, when the patient was reintubated and ventilatory status improved.
Airway cases—this one included—are “high damages” cases. A high damages case is one in which the injury is clear and expenses and costs to care for the patient are clear and immense. Such cases can be difficult to defend, because the enormity of the plaintiff’s plight (the limitations, years of required rehabilitation, hospitalization, PT, OT, nutritional care, etc) can overwhelm the jury, who may infer negligence based on the plaintiff’s condition. While jurors are required to consider damages only after negligence has been proven, lay jurors are human and many find it difficult to parse liability from damages. This is particularly true in airway cases involving a young, now-debilitated patient and an expert witness claiming an error that was preventable.
In this case, the plaintiff’s attorney made an unusual move, by calling as a “hostile witness” the paramedic who treated the 3-month-old boy. The paramedic would generally be called by the defense and later cross-examined by the plaintiff. Instead, the plaintiff chose to examine him first. Under evidence rules in most states (including North Carolina,1 where this case was heard), an adverse (or hostile) witness can be called by the opposing party.
Why is this important? Because during direct examination, you cannot lead the witness; during cross-examination, you can. Leading questions (if done correctly) generally produce the most effective and damaging moments during a trial. In this case, the plaintiffs were able to immediately examine one of the defendant’s principal actors using leading questions. Shortly thereafter, when the plaintiff was directly examining his own paramedic expert witnesses, the defense relented and settled for $13 million, with further recovery against the emergency physician still available.
Interestingly, the attorney suing the medical personnel in this case was none other than John Edwards. Yes, that John Edwards—the former vice presidential candidate famous for his $500 haircuts, campaign finance tribulations, and ethical lapses. He originally became famous (and rich) suing clinicians. After his political fall from grace, he is back in business suing clinicians—and for him, business is good.
IN SUM
This case was unfortunate. Always use care in securing the airway, particularly during patient movement. Once it is established, monitor the airway using SaO2, ETCO2, and keen observation. Airways are not in the “set it and forget it” camp. An airway must be maintained, safeguarded, and protected. Be prepared to act quickly should the airway become dislodged, migrate, or otherwise fail. —DML
REFERENCE
1. North Carolina Rules of Evidence Rule 611 (1983, c. 701, s. 1.).