User login
Bringing you the latest news, research and reviews, exclusive interviews, podcasts, quizzes, and more.
Powered by CHEST Physician, Clinician Reviews, MDedge Family Medicine, Internal Medicine News, and The Journal of Clinical Outcomes Management.
Mild cough • wheezing • loud heart sounds • Dx?
THE CASE
A 25-year-old man, who was an active duty US Navy sailor, went to his ship’s medical department complaining of a mild cough that he’d had for 2 days. He denied having any fevers, chills, night sweats, angina, or dyspnea. He said he hadn’t experienced any exertional fatigue or difficulty completing the rigorous physical tasks of his occupation as an engineman on the ship. The patient had no medical or surgical history of significance, and he wasn’t taking any medications or supplements.
On exam, he was not in acute distress and his vital signs were within normal limits. Auscultation revealed mild wheezing throughout the upper lung fields and loud heart sounds throughout his chest that were audible even with gentle contact of the stethoscope diaphragm. He had no discernible murmurs, rubs, or gallops.
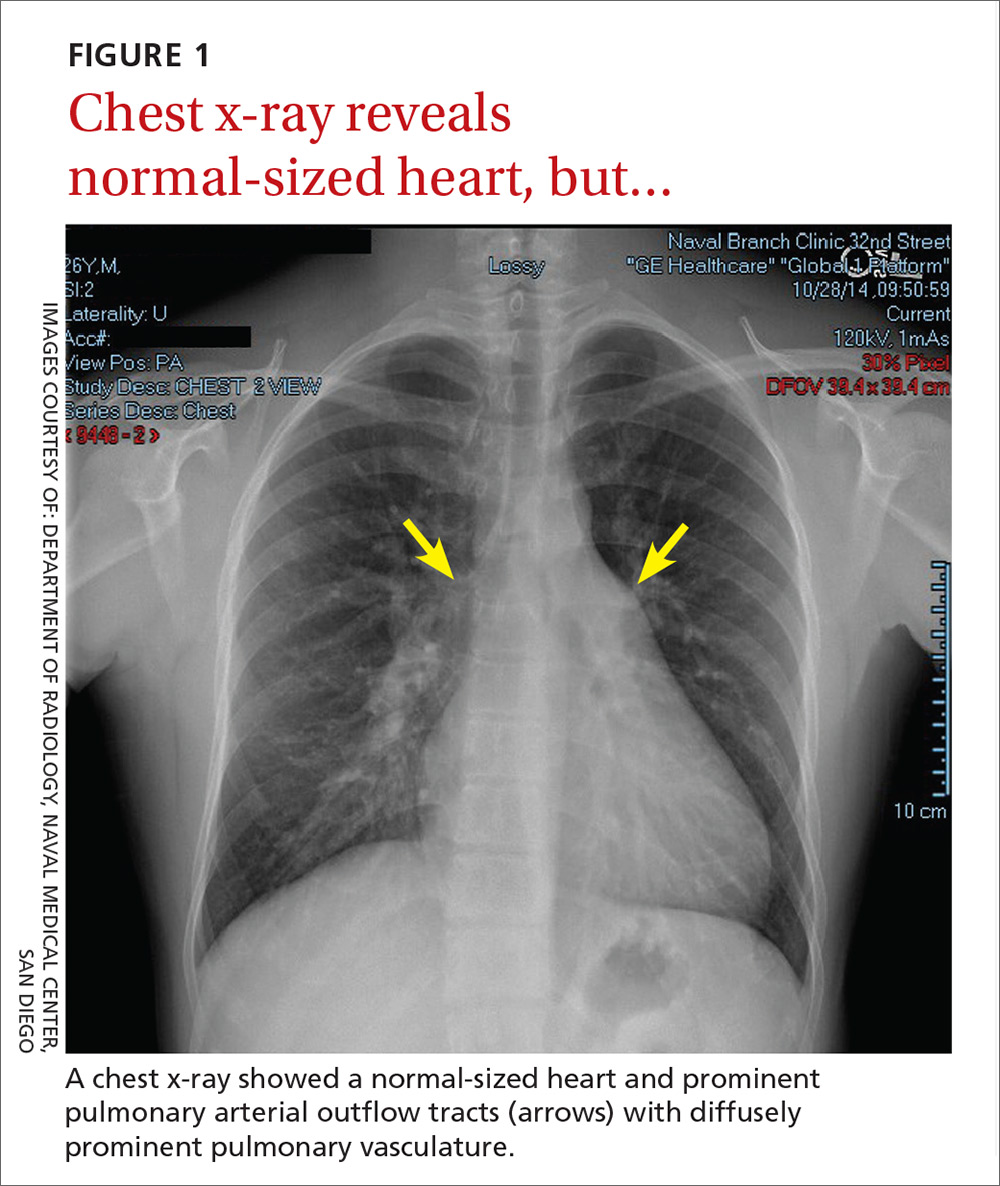
In light of the unusually loud heart sounds heard on exam, we performed an electrocardiogram. The EKG revealed a normal sinus rhythm, slight right axis deviation indicated by tall R-waves in V1 (also suggestive of right ventricular hypertrophy), an incomplete right bundle branch block, and a crochetage sign (a notch in the R-waves of the inferior leads).1 A chest x-ray (FIGURE 1) revealed a normal-sized heart and dilated pulmonary vasculature suggestive of pulmonary hypertension.

THE DIAGNOSIS
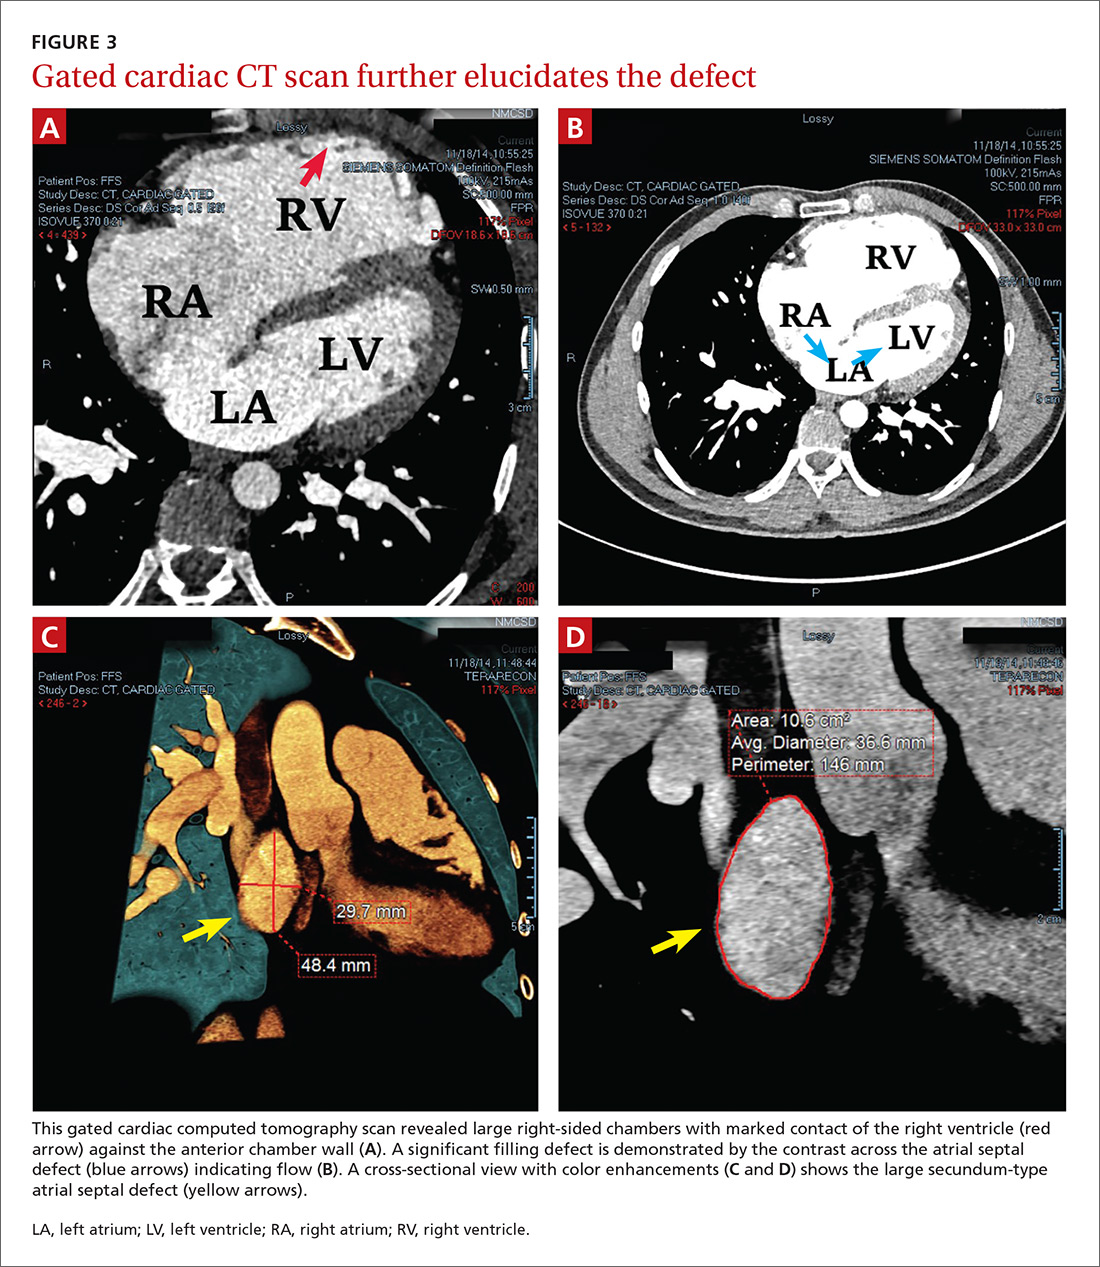
To further evaluate the cardiopulmonary findings, ultrasound studies (transthoracic and transesophageal echocardiography) were performed. These demonstrated a very large secundum-type atrial septal defect (ASD), measuring at its largest point about 30 × 48 mm (FIGURE 2 and FIGURE 3C). Doppler flow analysis and a bubble study (VIDEOS 1 and 2) demonstrated significant shunting across the ASD. Gated cardiac computed tomography (CT) was also used to characterize the ASD (FIGURE 3). It revealed that the superior and posterior rims of the ASD were essentially absent and that the right atrium and ventricle were severely enlarged, while the left chambers were normal in size and function with an ejection fraction >55%. The notching of the R-waves of the inferior leads, seen in our patient’s EKG, is typically seen with large ASDs.1,2
The video associated with this article is no longer available on this site. Please view all of our videos on the MDedge YouTube channel
Transthoracic echocardiography with color Doppler flow (red) demonstrated significant shunting across a large atrial septal defect (white box). The largest white dot is positioned near the center of the defect.
LA, left atrium; LV, left ventricle; RA, right atrium; RV, right ventricle.
The video associated with this article is no longer available on this site. Please view all of our videos on the MDedge YouTube channel
Transthoracic echocardiography with a bubble study showed injected air bubbles traversing the atrial septal defect.
LA, left atrium; LV, left ventricle; RA, right atrium; RV, right ventricle.
DISCUSSION
ASDs are typically uncovered on exam via auscultation of heart sounds, which might reveal a split of the second heart sound (S2) and diastolic murmurs. ASDs are typically classified by size, and their management depends on this factor, along with the patient’s age and symptoms. In children with small defects (<6 mm), treatment usually consists of conservative observation, as more than half of these ASDs will spontaneously close.3 But, as children age, they are more likely to engage in exertional activity (work, recreational sports) and an unrepaired ASD may yield symptoms (angina, dyspnea, fatigue, other cardiopulmonary strain). With such symptoms and when closure is not spontaneously achieved by adolescence or adulthood, an invasive approach is often necessary to correct the defect.
ASD repair. Traditionally, repair has involved some form of open thoracotomy. More recently, several minimally invasive techniques have been developed. Catheter-based device closure, in which a catheter is percutaneously guided to the defect and a patch is deployed to seal the ASD, is a technique that has been shown to successfully correct large ASDs of up to 40 mm in size.4 Robotic procedures have also been developed to correct ASDs through much smaller incisions.5 Both of these techniques require a significant rim of residual septal tissue around the defect.
Individualized approach. Since our patient had a rather large ASD that did not have sufficient residual septal rim tissue, percutaneous and robotic approaches were not feasible. Instead, he required more invasive cardiothoracic surgery. In cases such as this, the exact technique and type of incision (sternotomy vs access through the lateral chest wall) depend on age, gender, and the presence of other comorbidities.6
Our patient. Because there was concern that any approach other than a median one might not afford enough space to fix an ASD of such considerable size, our patient underwent a median sternotomy by a pediatric cardiothoracic surgeon who specialized in these repairs (in children as well as young adults). During the procedure, the ASD was accessed and confirmed to be as large as predicted by diagnostic imaging. A surgical patch was sutured in place to correct the defect. There were no intra-operative or postop complications.
Four weeks later, the patient had a mild pericardial effusion that was managed medically with daily furosemide and aspirin. At his 8-week postop appointment, the fluid accumulation had resolved, and he was completely asymptomatic. The patient returned to full-time active duty in the US Navy.
Adults with rather large ASDs can present in a relatively asymptomatic manner and report none of the classic complaints (angina, dyspnea, fatigue). They may even engage in heavy exertional activity with no difficulty. The underlying defect may be discovered incidentally on exam by noting a split of the S2 on auscultation. If pulmonary hypertension exists, the clinician may also note a loud S2. An exam that raises suspicion for an ASD can then be followed by tests that solidify the diagnosis. Surgery is usually necessary to correct an ASD in an adult who is symptomatic or exhibits significant cardiopulmonary strain.
1. Heller J, Hagège AA, Besse B, et al. “Crochetage” (notch) on R wave in inferior limb leads: a new independent electrocardiographic sign of atrial septal defect. J Am Coll Cardiol. 1996;27:877-882.
2. Kuijpers JM, Mulder BJM, Bouma BJ. Secundum atrial septal defect in adults: a practical review and recent developments. Neth Heart J. 2015;23:205-211.
3. McMahon CJ, Feltes TF, Fraley JK, et al. Natural history of growth of secundum atrial septal defects and implications for transcatheter closure. Heart. 2002;87:256-259.
4. Lopez K, Dalvi BV, Balzer D, et al. Transcatheter closure of large secundum atrial septal defects using the 40 mm amplatzer septal occluder: results of an international registry. Catheter Cardiovasc Interv. 2005;66:580-584.
5. Argenziano M, Oz MC, Kohmoto T, et al. Totally endoscopic atrial septal defect repair with robotic assistance. Circulation. 2003;108 Suppl 1:II191-II194.
6. Hopkins RA, Bert AA, Buchholz B, et al. Surgical patch closure of atrial septal defects. Ann Thorac Surg. 2004;77:2144-2149.
THE CASE
A 25-year-old man, who was an active duty US Navy sailor, went to his ship’s medical department complaining of a mild cough that he’d had for 2 days. He denied having any fevers, chills, night sweats, angina, or dyspnea. He said he hadn’t experienced any exertional fatigue or difficulty completing the rigorous physical tasks of his occupation as an engineman on the ship. The patient had no medical or surgical history of significance, and he wasn’t taking any medications or supplements.
On exam, he was not in acute distress and his vital signs were within normal limits. Auscultation revealed mild wheezing throughout the upper lung fields and loud heart sounds throughout his chest that were audible even with gentle contact of the stethoscope diaphragm. He had no discernible murmurs, rubs, or gallops.
In light of the unusually loud heart sounds heard on exam, we performed an electrocardiogram. The EKG revealed a normal sinus rhythm, slight right axis deviation indicated by tall R-waves in V1 (also suggestive of right ventricular hypertrophy), an incomplete right bundle branch block, and a crochetage sign (a notch in the R-waves of the inferior leads).1 A chest x-ray (FIGURE 1) revealed a normal-sized heart and dilated pulmonary vasculature suggestive of pulmonary hypertension.
THE DIAGNOSIS
To further evaluate the cardiopulmonary findings, ultrasound studies (transthoracic and transesophageal echocardiography) were performed. These demonstrated a very large secundum-type atrial septal defect (ASD), measuring at its largest point about 30 × 48 mm (FIGURE 2 and FIGURE 3C). Doppler flow analysis and a bubble study (VIDEOS 1 and 2) demonstrated significant shunting across the ASD. Gated cardiac computed tomography (CT) was also used to characterize the ASD (FIGURE 3). It revealed that the superior and posterior rims of the ASD were essentially absent and that the right atrium and ventricle were severely enlarged, while the left chambers were normal in size and function with an ejection fraction >55%. The notching of the R-waves of the inferior leads, seen in our patient’s EKG, is typically seen with large ASDs.1,2
The video associated with this article is no longer available on this site. Please view all of our videos on the MDedge YouTube channel
Transthoracic echocardiography with color Doppler flow (red) demonstrated significant shunting across a large atrial septal defect (white box). The largest white dot is positioned near the center of the defect.
LA, left atrium; LV, left ventricle; RA, right atrium; RV, right ventricle.
The video associated with this article is no longer available on this site. Please view all of our videos on the MDedge YouTube channel
Transthoracic echocardiography with a bubble study showed injected air bubbles traversing the atrial septal defect.
LA, left atrium; LV, left ventricle; RA, right atrium; RV, right ventricle.
DISCUSSION
ASDs are typically uncovered on exam via auscultation of heart sounds, which might reveal a split of the second heart sound (S2) and diastolic murmurs. ASDs are typically classified by size, and their management depends on this factor, along with the patient’s age and symptoms. In children with small defects (<6 mm), treatment usually consists of conservative observation, as more than half of these ASDs will spontaneously close.3 But, as children age, they are more likely to engage in exertional activity (work, recreational sports) and an unrepaired ASD may yield symptoms (angina, dyspnea, fatigue, other cardiopulmonary strain). With such symptoms and when closure is not spontaneously achieved by adolescence or adulthood, an invasive approach is often necessary to correct the defect.
ASD repair. Traditionally, repair has involved some form of open thoracotomy. More recently, several minimally invasive techniques have been developed. Catheter-based device closure, in which a catheter is percutaneously guided to the defect and a patch is deployed to seal the ASD, is a technique that has been shown to successfully correct large ASDs of up to 40 mm in size.4 Robotic procedures have also been developed to correct ASDs through much smaller incisions.5 Both of these techniques require a significant rim of residual septal tissue around the defect.
Individualized approach. Since our patient had a rather large ASD that did not have sufficient residual septal rim tissue, percutaneous and robotic approaches were not feasible. Instead, he required more invasive cardiothoracic surgery. In cases such as this, the exact technique and type of incision (sternotomy vs access through the lateral chest wall) depend on age, gender, and the presence of other comorbidities.6
Our patient. Because there was concern that any approach other than a median one might not afford enough space to fix an ASD of such considerable size, our patient underwent a median sternotomy by a pediatric cardiothoracic surgeon who specialized in these repairs (in children as well as young adults). During the procedure, the ASD was accessed and confirmed to be as large as predicted by diagnostic imaging. A surgical patch was sutured in place to correct the defect. There were no intra-operative or postop complications.
Four weeks later, the patient had a mild pericardial effusion that was managed medically with daily furosemide and aspirin. At his 8-week postop appointment, the fluid accumulation had resolved, and he was completely asymptomatic. The patient returned to full-time active duty in the US Navy.
Adults with rather large ASDs can present in a relatively asymptomatic manner and report none of the classic complaints (angina, dyspnea, fatigue). They may even engage in heavy exertional activity with no difficulty. The underlying defect may be discovered incidentally on exam by noting a split of the S2 on auscultation. If pulmonary hypertension exists, the clinician may also note a loud S2. An exam that raises suspicion for an ASD can then be followed by tests that solidify the diagnosis. Surgery is usually necessary to correct an ASD in an adult who is symptomatic or exhibits significant cardiopulmonary strain.
1. Heller J, Hagège AA, Besse B, et al. “Crochetage” (notch) on R wave in inferior limb leads: a new independent electrocardiographic sign of atrial septal defect. J Am Coll Cardiol. 1996;27:877-882.
2. Kuijpers JM, Mulder BJM, Bouma BJ. Secundum atrial septal defect in adults: a practical review and recent developments. Neth Heart J. 2015;23:205-211.
3. McMahon CJ, Feltes TF, Fraley JK, et al. Natural history of growth of secundum atrial septal defects and implications for transcatheter closure. Heart. 2002;87:256-259.
4. Lopez K, Dalvi BV, Balzer D, et al. Transcatheter closure of large secundum atrial septal defects using the 40 mm amplatzer septal occluder: results of an international registry. Catheter Cardiovasc Interv. 2005;66:580-584.
5. Argenziano M, Oz MC, Kohmoto T, et al. Totally endoscopic atrial septal defect repair with robotic assistance. Circulation. 2003;108 Suppl 1:II191-II194.
6. Hopkins RA, Bert AA, Buchholz B, et al. Surgical patch closure of atrial septal defects. Ann Thorac Surg. 2004;77:2144-2149.

Does fish oil during pregnancy help prevent asthma in kids?
ILLUSTRATIVE CASE
A 24-year-old G2P1 at 24 weeks’ gestation presents to your clinic for a routine prenatal visit. Her older daughter has asthma and she is inquiring as to whether there is anything she can do to lower the risk of her second child developing asthma in the future. What do you recommend?
Asthma is the most common chronic disease in children in resource-rich countries such as the United States.2 The Centers for Disease Control and Prevention (CDC) reported that 8.4% of children were diagnosed with asthma in 2015.3
Omega-3 fatty acids, found naturally in fish oil, are thought to confer anti-inflammatory properties that offer protection against asthma. Clinical trials have shown that fish oil supplementation in pregnancy results in higher levels of omega-3 fatty acids, along with anti-inflammatory changes, in offspring.4 Previous epidemiologic studies have also found that consumption of omega-3 fatty acids decreased the risk of atopy and asthma in offspring.5,6
A Cochrane review published in 2015, however, concluded that omega-3 supplementation during pregnancy had no benefit on wheeze or asthma in offspring.7 Five RCTs were included in the analysis. The largest trial by Palmer et al, which included 706 women, showed no benefit for omega-3 supplementation.8 The second largest by Olsen et al, which included 533 women, did show a benefit (hazard ratio [HR]=0.37; 95% confidence interval [CI], 0.15-0.92; number needed to treat [NNT]=19.6).9
These results, however, were limited by heterogeneity in the amount of fish oil supplemented and duration of follow-up. For example, the children in the Palmer study were followed only until 3 years of age, which is around the time that asthma can be formally diagnosed, potentially leading to under-reporting.8 In addition, the diagnosis of asthma was based on parent report of 3 episodes of wheezing, use of daily asthma medication, or use of a national registry—all of which can underestimate the incidence of asthma. The reported rate of childhood asthma with IgE-sensitization (they did not report the rate without sensitization) was 1.8% in both arms, which is much lower than the CDC’s rate of 8.4%, suggesting underdiagnosis.3,8 Due to these biases and other potential confounders, no firm conclusions can be drawn from the Cochrane review.
STUDY SUMMARY
Maternal fish oil supplementation reduces incidence of asthma in children
This single-center, double-blinded RCT of 736 pregnant women evaluated the effect of 2.4 g/d of n-3 long-chain polyunsaturated fatty acids (eicosapentaenoic acid [EPA] and docosahexaenoic acid [DHA]) or placebo (olive oil), starting at an estimated gestational age of 24 to 26 weeks, on wheeze or asthma incidence in their offspring.1
Eligible women were between 22 and 26 weeks’ pregnant at the time of recruitment. Exclusion criteria included supplementation of 600 IU/d or more of vitamin D, or having any endocrine, cardiac, or renal disorders. The investigators randomized the women in a 1:1 ratio to either fish oil or placebo. Maternal EPA and DHA blood levels were tested at the time of randomization and one week after birth.
The primary outcome was persistent wheeze or asthma (after 3 years of age, the diagnosis of persistent wheeze was termed asthma) based on daily diary recordings of 5 episodes of troublesome lung symptoms within the last 6 months (each lasting for at least 3 consecutive days), rescue use of inhaled beta2-agonists, and/or relapse after a 3-month course of inhaled glucocorticoids. Secondary outcomes included lower respiratory tract infections, asthma exacerbations, eczema, and allergic sensitization.
In total, 695 offspring were included in the study with 95.5% follow-up at 3 years and 93.1% follow-up at 5 years. The children had scheduled pediatric visits at 1 week; 1, 3, 6, 12, 18, 24, 30, and 36 months; and at 4 and 5 years, and acute visits for any pulmonary, allergic, or dermatologic symptoms that arose.
Results. The investigators found that the children of the mothers who received the fish oil had a lower risk of persistent wheeze or asthma at ages 3 to 5 years compared to those who received placebo (16.9% vs 23.7%; HR=0.69; 95% CI, 0.49-0.97; P=.035; NNT=14.7). But the effect of the fish oil supplementation was significant only in the children of the mothers with baseline EPA and DHA levels in the lowest third (17.5% vs 34.1%; HR=0.46; 95% CI, 0.25-0.83; P=.011; NNT=5.6). Similarly, in mothers who consumed the least EPA and DHA before the start of the study, fish oil supplementation had a greater benefit in terms of decreased wheeze and asthma (18.5% vs 32.4%; HR=0.55; 95% CI, 0.30-0.98; P=.043; NNT=7.2).
As for the secondary outcomes, only a reduction in lower respiratory tract infections was associated with the fish oil supplementation vs the control (38.8% vs 45.5%; HR=0.77; 95% CI, 0.61-0.99; P=.041; NNT=14.9). There was no reduction in asthma exacerbations, eczema, or risk of sensitization in the fish oil group.
WHAT'S NEW?
Study adds fuel to the fire
This study strengthens the case for fish oil supplementation during pregnancy to reduce the risk of asthma in offspring, despite the recent Cochrane review that showed no benefit.1,7 The Palmer study used a much lower amount of omega-3s (900 mg/d fish oil vs 2400 mg/d in the current trial).1,8 Olsen et al supplemented with a greater amount of omega-3s (2700 mg/d) and did find a benefit.9 The NNT from the Olsen study (19.6) is consistent with that of the current investigation, suggesting that a higher dosage may be necessary to prevent the onset of asthma.
Additionally, this study followed children for a longer period than did the Palmer study, which may have led to more accurate diagnoses of asthma.1,8 Lastly, the diagnosis of asthma in the Palmer study was based on parent survey data and use of daily asthma medicine rather than on daily diary cards, which are often more accurate.
Consider fish consumption. Both this study and the Olsen trial were performed in Denmark.1,9 While Denmark and the United States have had a relatively similar level of fish consumption since the 1990s, women in Denmark may eat a higher proportion of oily fish than women in the United States, given the more common inclusion of mackerel and herring in their diet.10 Thus, the effect of supplementation may be more pronounced in women in the United States.
CAVEATS
Questions remain: Ideal dose and which women to treat?
The US Food and Drug Administration currently recommends 8 to 12 ounces of fish per week for pregnant women, but there are no guidelines on the ideal amount of fish oil to be consumed.11 The Palmer study,8 using 900 mg/d fish oil, did not show a benefit, whereas there did appear to be benefit in this study (2400 mg/d)1 and the Olsen study (2700 mg/d).9 Further research is needed to determine the optimal dosage.
The decreased risk of persistent wheeze or asthma was seen only in the children of the women whose EPA and DHA blood levels were in the lowest third of the study population. Thus, only women whose blood levels are low to begin with will likely benefit from this intervention. Currently, EPA and DHA levels are not routinely checked, but there may be some benefit to doing so.
One proxy for blood levels is maternal intake of fish at baseline. The investigators found that there was an association between dietary intake of fish and blood levels of EPA and DHA (r=0.32; P<.001).1 Therefore, additional screening questions to determine fish consumption would be useful for identifying women most likely to benefit from supplementation.
CHALLENGES TO IMPLEMENTATION
Multiple pills and additional cost
Since omega-3 fatty acids are relatively safe and the NNT in the general population is low, it may be worth supplementing all pregnant women, even without a commercially-available blood test for EPA or DHA. Nevertheless, some women may find it challenging to take up to an additional 4 pills/d for 13 or more weeks. Also, there is an associated cost with these supplements, although it is low.
ACKNOWLEDGEMENT
The PURLs Surveillance System was supported in part by Grant Number UL1RR024999 from the National Center For Research Resources, a Clinical Translational Science Award to the University of Chicago. The content is solely the responsibility of the authors and does not necessarily represent the official views of the National Center For Research Resources or the National Institutes of Health.
1. Bisgaard H, Stokholm J, Chawes BL, et al. Fish oil-derived fatty acids in pregnancy and wheeze and asthma in offspring. N Engl J Med. 2016;375:2530-2539.
2. Masoli M, Fabian D, Holt S, et al. The global burden of asthma: executive summary of the GINA Dessemination Committee Report. Allergy. 2004;59:469-478.
3. Centers for Disease Control and Prevention. Asthma. Available at: https://www.cdc.gov/asthma/most_recent_data.htm. Accessed October 9, 2017.
4. Miyata J, Arita M. Role of omega-3 fatty acids and their metabolites in asthma and allergic diseases. Allergol Int. 2015;64:27-34.
5. Salam MT, Li YF, Langholz B, et al. Maternal fish consumption during pregnancy and risk of early childhood asthma. J Asthma. 2005;42:513-518.
6. Calvani M, Alessandri C, Sopo SM, et al. Consumption of fish, butter and margarine during pregnancy and development of allergic sensitizations in the offspring: role of maternal atopy. Pediatr Allergy Immunol. 2006;17:94-102.
7. Gunaratne AW, Makrides M, Collins CT. Maternal prenatal and/or postnatal n-3 long chain polyunsaturated fatty acids (LCPUFA) supplementation for preventing allergies in early childhood. Cochrane Database Syst Rev. 2015;22:CD010085.
8. Palmer D, Sullivan T, Gold M, et al. Randomized controlled trial of fish oil supplementation in pregnancy on childhood allergies. Allergy. 2013;68:1370-1376.
9. Olsen SF, Østerdal ML, Salvig JD, et al. Fish oil intake compared with olive oil intake in late pregnancy and asthma in the offspring: 16 y of registry-based follow-up from a randomized controlled trial. Am J Clin Nutr. 2008;88:167-175.
10. Helgi Library. Fish consumption per capita by country. Available at: http://www.helgilibrary.com/indicators/fish-consumption-per-capita/. Accessed September 27, 2017.
11. FDA Advice About Eating Fish, From the Environmental Protection Agency and Food and Drug Administration; Revised Fish Advice; Availability. Federal Register.2017;82:6571-6574.
ILLUSTRATIVE CASE
A 24-year-old G2P1 at 24 weeks’ gestation presents to your clinic for a routine prenatal visit. Her older daughter has asthma and she is inquiring as to whether there is anything she can do to lower the risk of her second child developing asthma in the future. What do you recommend?
Asthma is the most common chronic disease in children in resource-rich countries such as the United States.2 The Centers for Disease Control and Prevention (CDC) reported that 8.4% of children were diagnosed with asthma in 2015.3
Omega-3 fatty acids, found naturally in fish oil, are thought to confer anti-inflammatory properties that offer protection against asthma. Clinical trials have shown that fish oil supplementation in pregnancy results in higher levels of omega-3 fatty acids, along with anti-inflammatory changes, in offspring.4 Previous epidemiologic studies have also found that consumption of omega-3 fatty acids decreased the risk of atopy and asthma in offspring.5,6
A Cochrane review published in 2015, however, concluded that omega-3 supplementation during pregnancy had no benefit on wheeze or asthma in offspring.7 Five RCTs were included in the analysis. The largest trial by Palmer et al, which included 706 women, showed no benefit for omega-3 supplementation.8 The second largest by Olsen et al, which included 533 women, did show a benefit (hazard ratio [HR]=0.37; 95% confidence interval [CI], 0.15-0.92; number needed to treat [NNT]=19.6).9
These results, however, were limited by heterogeneity in the amount of fish oil supplemented and duration of follow-up. For example, the children in the Palmer study were followed only until 3 years of age, which is around the time that asthma can be formally diagnosed, potentially leading to under-reporting.8 In addition, the diagnosis of asthma was based on parent report of 3 episodes of wheezing, use of daily asthma medication, or use of a national registry—all of which can underestimate the incidence of asthma. The reported rate of childhood asthma with IgE-sensitization (they did not report the rate without sensitization) was 1.8% in both arms, which is much lower than the CDC’s rate of 8.4%, suggesting underdiagnosis.3,8 Due to these biases and other potential confounders, no firm conclusions can be drawn from the Cochrane review.
STUDY SUMMARY
Maternal fish oil supplementation reduces incidence of asthma in children
This single-center, double-blinded RCT of 736 pregnant women evaluated the effect of 2.4 g/d of n-3 long-chain polyunsaturated fatty acids (eicosapentaenoic acid [EPA] and docosahexaenoic acid [DHA]) or placebo (olive oil), starting at an estimated gestational age of 24 to 26 weeks, on wheeze or asthma incidence in their offspring.1
Eligible women were between 22 and 26 weeks’ pregnant at the time of recruitment. Exclusion criteria included supplementation of 600 IU/d or more of vitamin D, or having any endocrine, cardiac, or renal disorders. The investigators randomized the women in a 1:1 ratio to either fish oil or placebo. Maternal EPA and DHA blood levels were tested at the time of randomization and one week after birth.
The primary outcome was persistent wheeze or asthma (after 3 years of age, the diagnosis of persistent wheeze was termed asthma) based on daily diary recordings of 5 episodes of troublesome lung symptoms within the last 6 months (each lasting for at least 3 consecutive days), rescue use of inhaled beta2-agonists, and/or relapse after a 3-month course of inhaled glucocorticoids. Secondary outcomes included lower respiratory tract infections, asthma exacerbations, eczema, and allergic sensitization.
In total, 695 offspring were included in the study with 95.5% follow-up at 3 years and 93.1% follow-up at 5 years. The children had scheduled pediatric visits at 1 week; 1, 3, 6, 12, 18, 24, 30, and 36 months; and at 4 and 5 years, and acute visits for any pulmonary, allergic, or dermatologic symptoms that arose.
Results. The investigators found that the children of the mothers who received the fish oil had a lower risk of persistent wheeze or asthma at ages 3 to 5 years compared to those who received placebo (16.9% vs 23.7%; HR=0.69; 95% CI, 0.49-0.97; P=.035; NNT=14.7). But the effect of the fish oil supplementation was significant only in the children of the mothers with baseline EPA and DHA levels in the lowest third (17.5% vs 34.1%; HR=0.46; 95% CI, 0.25-0.83; P=.011; NNT=5.6). Similarly, in mothers who consumed the least EPA and DHA before the start of the study, fish oil supplementation had a greater benefit in terms of decreased wheeze and asthma (18.5% vs 32.4%; HR=0.55; 95% CI, 0.30-0.98; P=.043; NNT=7.2).
As for the secondary outcomes, only a reduction in lower respiratory tract infections was associated with the fish oil supplementation vs the control (38.8% vs 45.5%; HR=0.77; 95% CI, 0.61-0.99; P=.041; NNT=14.9). There was no reduction in asthma exacerbations, eczema, or risk of sensitization in the fish oil group.
WHAT'S NEW?
Study adds fuel to the fire
This study strengthens the case for fish oil supplementation during pregnancy to reduce the risk of asthma in offspring, despite the recent Cochrane review that showed no benefit.1,7 The Palmer study used a much lower amount of omega-3s (900 mg/d fish oil vs 2400 mg/d in the current trial).1,8 Olsen et al supplemented with a greater amount of omega-3s (2700 mg/d) and did find a benefit.9 The NNT from the Olsen study (19.6) is consistent with that of the current investigation, suggesting that a higher dosage may be necessary to prevent the onset of asthma.
Additionally, this study followed children for a longer period than did the Palmer study, which may have led to more accurate diagnoses of asthma.1,8 Lastly, the diagnosis of asthma in the Palmer study was based on parent survey data and use of daily asthma medicine rather than on daily diary cards, which are often more accurate.
Consider fish consumption. Both this study and the Olsen trial were performed in Denmark.1,9 While Denmark and the United States have had a relatively similar level of fish consumption since the 1990s, women in Denmark may eat a higher proportion of oily fish than women in the United States, given the more common inclusion of mackerel and herring in their diet.10 Thus, the effect of supplementation may be more pronounced in women in the United States.
CAVEATS
Questions remain: Ideal dose and which women to treat?
The US Food and Drug Administration currently recommends 8 to 12 ounces of fish per week for pregnant women, but there are no guidelines on the ideal amount of fish oil to be consumed.11 The Palmer study,8 using 900 mg/d fish oil, did not show a benefit, whereas there did appear to be benefit in this study (2400 mg/d)1 and the Olsen study (2700 mg/d).9 Further research is needed to determine the optimal dosage.
The decreased risk of persistent wheeze or asthma was seen only in the children of the women whose EPA and DHA blood levels were in the lowest third of the study population. Thus, only women whose blood levels are low to begin with will likely benefit from this intervention. Currently, EPA and DHA levels are not routinely checked, but there may be some benefit to doing so.
One proxy for blood levels is maternal intake of fish at baseline. The investigators found that there was an association between dietary intake of fish and blood levels of EPA and DHA (r=0.32; P<.001).1 Therefore, additional screening questions to determine fish consumption would be useful for identifying women most likely to benefit from supplementation.
CHALLENGES TO IMPLEMENTATION
Multiple pills and additional cost
Since omega-3 fatty acids are relatively safe and the NNT in the general population is low, it may be worth supplementing all pregnant women, even without a commercially-available blood test for EPA or DHA. Nevertheless, some women may find it challenging to take up to an additional 4 pills/d for 13 or more weeks. Also, there is an associated cost with these supplements, although it is low.
ACKNOWLEDGEMENT
The PURLs Surveillance System was supported in part by Grant Number UL1RR024999 from the National Center For Research Resources, a Clinical Translational Science Award to the University of Chicago. The content is solely the responsibility of the authors and does not necessarily represent the official views of the National Center For Research Resources or the National Institutes of Health.
1. Bisgaard H, Stokholm J, Chawes BL, et al. Fish oil-derived fatty acids in pregnancy and wheeze and asthma in offspring. N Engl J Med. 2016;375:2530-2539.
2. Masoli M, Fabian D, Holt S, et al. The global burden of asthma: executive summary of the GINA Dessemination Committee Report. Allergy. 2004;59:469-478.
3. Centers for Disease Control and Prevention. Asthma. Available at: https://www.cdc.gov/asthma/most_recent_data.htm. Accessed October 9, 2017.
4. Miyata J, Arita M. Role of omega-3 fatty acids and their metabolites in asthma and allergic diseases. Allergol Int. 2015;64:27-34.
5. Salam MT, Li YF, Langholz B, et al. Maternal fish consumption during pregnancy and risk of early childhood asthma. J Asthma. 2005;42:513-518.
6. Calvani M, Alessandri C, Sopo SM, et al. Consumption of fish, butter and margarine during pregnancy and development of allergic sensitizations in the offspring: role of maternal atopy. Pediatr Allergy Immunol. 2006;17:94-102.
7. Gunaratne AW, Makrides M, Collins CT. Maternal prenatal and/or postnatal n-3 long chain polyunsaturated fatty acids (LCPUFA) supplementation for preventing allergies in early childhood. Cochrane Database Syst Rev. 2015;22:CD010085.
8. Palmer D, Sullivan T, Gold M, et al. Randomized controlled trial of fish oil supplementation in pregnancy on childhood allergies. Allergy. 2013;68:1370-1376.
9. Olsen SF, Østerdal ML, Salvig JD, et al. Fish oil intake compared with olive oil intake in late pregnancy and asthma in the offspring: 16 y of registry-based follow-up from a randomized controlled trial. Am J Clin Nutr. 2008;88:167-175.
10. Helgi Library. Fish consumption per capita by country. Available at: http://www.helgilibrary.com/indicators/fish-consumption-per-capita/. Accessed September 27, 2017.
11. FDA Advice About Eating Fish, From the Environmental Protection Agency and Food and Drug Administration; Revised Fish Advice; Availability. Federal Register.2017;82:6571-6574.
Copyright © 2018. The Family Physicians Inquiries Network. All rights reserved.
PRACTICE CHANGER
Fish oil supplementation taken by women in the third trimester of pregnancy can reduce the risk of persistent wheeze, asthma, and infections of the lower respiratory tract in their children.1
STRENGTH OF RECOMMENDATION
B: Based on 2 double-blinded randomized controlled trials (RCTs).
Bisgaard H, Stokholm J, Chawes BL, et al. Fish oil-derived fatty acids in pregnancy and wheeze and asthma in offspring. N Engl J Med. 2016;375:2530-2539.1

Preop physiotherapy training reduces risk of postop pulmonary complications
A single 30-minute coaching session with a physiotherapist within 6 weeks of major upper abdominal surgery significantly reduced postoperative pulmonary complications (PPC), according to the results of a prospective trial.
Ianthe Boden and her colleagues recruited 441 eligible adults scheduled for elective major upper abdominal surgery to participate in the prospective, multicenter, double-blinded, controlled superiority study to assess whether PPC outcomes were affected by preoperative physiotherapy. Consecutive participants were obtained from outpatient preadmission assessment clinics during June 2013 to August 2015; they were assigned randomly in a 1:1 ratio to the control (219) or intervention (222) groups. The median patient age was 68 years for the control and 63 for the intervention group, and each group was composed of 31% women.
Immediately after receiving the booklets, however, participants in the intervention group were also given an added 30-minute education and training session by preoperative physiotherapists. This instruction covered factors contributing to PPC occurrence, strategies to help prevention it, and three coached repetitions of breathing exercises. Emphasis was placed on initiating prescribed breathing exercises upon regaining postoperative consciousness and continuing them every hour until the patients were fully ambulatory.
The primary outcome was evaluated by masked assessors using the Melbourne group score criteria to determine PPC incidence within 14 postoperative days or by the time of hospital discharge, whichever was sooner. Nine participants, 4 from the intervention and 5 from the control group, withdrew from the study. Of the total remaining 432 participants, 85 (20%) had a documented PPC incident, including hospital acquired pneumonia, within the specified postoperative time frame, as reported in the BMJ.
Results showed that the physiotherapy group had significantly fewer PPC occurrences (27/218, 12%) than did the control group (58/214, 27%). The calculated absolute risk reduction was 15% (P less than .001). Adjustment for three of the prespecified covariates (age, respiratory comorbidity, and surgical procedure) showed PPC incidence remained halved (hazard ratio, 0.48; P = .001) for the intervention group with a number needed to treat of 7 (95% confidence interval, 5-14).
Secondary outcomes included incidence of hospital acquired pneumonia, hospital utilization, mobility, patient reported complications at 6 weeks, and mortality rates in hospital, at 6 weeks, and at 12 months. For secondary outcomes in the adjusted analysis, incidences of pneumonia were halved in the physiotherapy intervention group with a number needed to treat of 9 (95% CI, 6-21). No significant differences in secondary outcomes were detected between the control and treatment groups.
Sensitivity analysis that removed participants who had lower abdominal and laparoscopic surgery strengthened both primary and secondary outcome results to favor the preoperative physiotherapy intervention for reducing PPC. The researchers found that, in an adjusted analysis of subgroup effects, there was a gradient in reduction of PPCs according to surgical category.
Shorter lengths hospital stay and lower all-cause 12-month mortality were also associated with more experienced physiotherapists providing the preoperative education and training.
Ms. Boden and her colleagues proposed that the timing for patients to begin breathing exercises after major open upper abdominal surgery could be critical in reducing PPC incidence. Initiating breathing exercises within the first 24 hours after surgery – in contrast to the common practice of waiting 1-2 days to begin postoperative physiotherapy – could prevent general anesthesia-associated mild atelectasis from developing into severe atelectasis and PPCs.
The researchers concluded that “in a general population of patients listed for elective upper abdominal surgery, a 30-minute preoperative physiotherapy session provided within existing hospital multidisciplinary preadmission clinics halves the incidence of PPCs and specifically hospital acquired pneumonia. Further research is required to investigate benefits to mortality and length of stay.”
The authors reported that they received grants from the Clifford Craig Foundation; the University of Tasmania (Hobart), Australia; and the Waitemata District Health Board in Auckland, New Zealand.
SOURCE: Boden I et al. BMJ. 2018. doi: 10.1136/bmj.j5916.
FROM THE BMJ
Key clinical point: Reduction in PPC incidences corresponded to physiotherapists providing preoperative education and coaching intervention.
Major finding: Compared with the control group, Absolute risk was reduced by 15%, and seven was determined as number needed to treat.
Study details: Prospective, blinded study of 441 adult participants randomly assigned in a 1:1 ratio, comparing PPC outcomes associated with preop practices for upper abdominal surgeries.
Disclosures: The authors reported that they received grants from the Clifford Craig Foundation; the University of Tasmania (Hobart), Australia; and the Waitemata District Health Board in Auckland, New Zealand.
Source: Boden I. et al. BMJ. 2018. doi: 10.1136/bmj.j5916.
Birth cohort affected 2015-2016 flu vaccine effectiveness
The influenza vaccine introduced in 2009 showed reduced effectiveness during the 2015-2016 influenza season, but only in adults born between 1958 and 1979, according to an analysis published online in the Journal of Infectious Diseases.
Using the Influenza Vaccine Effectiveness Network, researchers analyzed data from 2,115 patients with medically attended acute respiratory illness who tested positive for A(H1N1)pdm09 influenza virus, and 14,696 patients who tested negative for the influenza virus, from 2010-2011 to 2015-2016 (excluding the 2014-2015 influenza season).
Overall, 48% of the influenza virus–negative patients and 28% of the virus-positive patients had received at least one dose of the seasonal inactivated influenza vaccine more than 2 weeks before they fell ill.
However, the vaccine, which was based on the A/California/07/2009 strain of the A(H1N1)pdm09 virus, was only 47% effective during the 2015-2016 season, compared with 61% effectiveness during the 2010-2011 season through to the 2013-2014 season.
When researchers looked at vaccine effectiveness by birth cohort, they found that one particular cohort – individuals born between 1958 and 1979 – showed a significantly reduced vaccine effectiveness (22%) during the 2015-2016 season. By comparison, vaccine effectiveness in this cohort was 61% during the 2010-2013 seasons, and 56% during the 2013-2014 season.
When this birth cohort was excluded from analysis of the 2015-2016 season, the overall vaccine effectiveness for that season was 61%.
While the vaccine was based on an early reference strain of A(H1N1)pdm09, the virus itself later acquired mutations in the hemagglutinin gene, leading to the emergence of new genetic clades, including 6B, which dominated in the 2013-2014 influenza season, and 6B.1, which dominated in 2015-2016.
“Limited serologic data suggest that some adults born during 1958-1979 (age range in 2015-2016, 36-57 years) have decreased antibody titers against A(H1N1)pdm09 group 6B and 6B.1 viruses,” wrote Brendan Flannery, PhD, from the Centers for Disease Control and Prevention, and his coauthors.
They suggested that individuals in this cohort may have been immunologically primed with A/USSR/90/1977-like viruses, which were the first group of A(H1N1) viruses that this cohort would have been exposed to. A(H1N1) strains didn’t circulate between 1958 and 1977. Vaccination with A(H1N1)pdm09 viruses may have induced antibodies against shared antigenic components found on early versions of A(H1N1)pdm09.
If these shared antigenic epitopes were then altered in the later 6B and 6B.1 viruses, that might account for decreased antibody titers in this age group.
“Replacement of the A/California/07/2009(H1N1)pdm09 vaccine reference strain with A/Michigan/45/2015 (group 6B.1) should lead to improved [vaccine effectiveness] against circulating A(H1N1)pdm09 viruses,” the investigators noted.
The study was supported by the Centers for Disease Control and Prevention, the National Institutes of Health, and the National Center for Advancing Translational Sciences. Eight authors declared funding, grants, and consultancies with the pharmaceutical industry, with five also declaring funding from the CDC.
SOURCE: Flannery B et al. J Infect Dis. 2018 Jan 18. doi: 10.1093/infdis/jix634.
This study proposes that influenza virus strains encountered early in life focus the immune response to later infection or vaccination on shared epitopes between the early and later strains. Supporting this hypothesis is evidence from other studies showing that 60% of the serological response to inactivated influenza vaccines is the result of boosting pre-existing antibodies, rather than the creation of new, vaccine-induced antibodies.
However there are also some flaws to this argument, and we should be careful to avoid confirmation bias. For example, the reduction in effectiveness of vaccines against A(H1N1) has been observed in North America, where this study is located, but to a lesser extent in studies conducted in other regions. Reductions in vaccine effectiveness have also been observed in other birth cohorts and during other influenza seasons.
That aside, accumulating evidence suggests that the vaccine strain be updated from A/California/7/2009 to A/Michigan/45/2015 (a clade 6B.1 strain) for the 2016-2017 influenza seasons.
Allen C. Cheng, PhD, is from the School of Public Health and Preventive Medicine at Monash University, Melbourne, and Kanta Subbarao, MBBS, is from the World Health Organization Collaborating Centre for Reference and Research on Influenza and the Peter Doherty Institute for Infection and Immunity, Australia. These comments are taken from an accompanying editorial (J Infect Dis. 2018, Jan 18. doi: 10.1093/infdis/jix635). The authors declared support from the Australian Department of Health and the Australian National Health and Medical Research Council. No conflicts of interest were declared.
The influenza vaccine introduced in 2009 showed reduced effectiveness during the 2015-2016 influenza season, but only in adults born between 1958 and 1979, according to an analysis published online in the Journal of Infectious Diseases.
Using the Influenza Vaccine Effectiveness Network, researchers analyzed data from 2,115 patients with medically attended acute respiratory illness who tested positive for A(H1N1)pdm09 influenza virus, and 14,696 patients who tested negative for the influenza virus, from 2010-2011 to 2015-2016 (excluding the 2014-2015 influenza season).
Overall, 48% of the influenza virus–negative patients and 28% of the virus-positive patients had received at least one dose of the seasonal inactivated influenza vaccine more than 2 weeks before they fell ill.
However, the vaccine, which was based on the A/California/07/2009 strain of the A(H1N1)pdm09 virus, was only 47% effective during the 2015-2016 season, compared with 61% effectiveness during the 2010-2011 season through to the 2013-2014 season.
When researchers looked at vaccine effectiveness by birth cohort, they found that one particular cohort – individuals born between 1958 and 1979 – showed a significantly reduced vaccine effectiveness (22%) during the 2015-2016 season. By comparison, vaccine effectiveness in this cohort was 61% during the 2010-2013 seasons, and 56% during the 2013-2014 season.
When this birth cohort was excluded from analysis of the 2015-2016 season, the overall vaccine effectiveness for that season was 61%.
While the vaccine was based on an early reference strain of A(H1N1)pdm09, the virus itself later acquired mutations in the hemagglutinin gene, leading to the emergence of new genetic clades, including 6B, which dominated in the 2013-2014 influenza season, and 6B.1, which dominated in 2015-2016.
“Limited serologic data suggest that some adults born during 1958-1979 (age range in 2015-2016, 36-57 years) have decreased antibody titers against A(H1N1)pdm09 group 6B and 6B.1 viruses,” wrote Brendan Flannery, PhD, from the Centers for Disease Control and Prevention, and his coauthors.
They suggested that individuals in this cohort may have been immunologically primed with A/USSR/90/1977-like viruses, which were the first group of A(H1N1) viruses that this cohort would have been exposed to. A(H1N1) strains didn’t circulate between 1958 and 1977. Vaccination with A(H1N1)pdm09 viruses may have induced antibodies against shared antigenic components found on early versions of A(H1N1)pdm09.
If these shared antigenic epitopes were then altered in the later 6B and 6B.1 viruses, that might account for decreased antibody titers in this age group.
“Replacement of the A/California/07/2009(H1N1)pdm09 vaccine reference strain with A/Michigan/45/2015 (group 6B.1) should lead to improved [vaccine effectiveness] against circulating A(H1N1)pdm09 viruses,” the investigators noted.
The study was supported by the Centers for Disease Control and Prevention, the National Institutes of Health, and the National Center for Advancing Translational Sciences. Eight authors declared funding, grants, and consultancies with the pharmaceutical industry, with five also declaring funding from the CDC.
SOURCE: Flannery B et al. J Infect Dis. 2018 Jan 18. doi: 10.1093/infdis/jix634.
FROM THE JOURNAL OF INFECTIOUS DISEASES
Key clinical point:
Major finding: The influenza vaccine effectiveness during the 2015-2016 season was just 22% in individuals born between 1958 and 1979.
Data source: A retrospective case-control study of 2,115 patients who tested positive for A(H1N1)pdm09 influenza virus, and 14,696 negative controls.
Disclosures: The study was supported by the Centers for Disease Control and Prevention, the National Institutes of Health, and the National Center for Advancing Translational Sciences. Eight authors declared funding, grants, and consultancies with the pharmaceutical industry, with five also declaring funding from the CDC.
Source: Flannery B et al. J Infect Dis. 2018 Jan 18. doi: 10.1093/infdis/jix634.
CDC: Flu levels highest since pandemic year 2009
according to data from the Centers for Disease Control and Prevention.
That season was dominated by influenza A (H3N2), and the 2017-2018 season seems to be going down that same path. For the week ending Jan. 20, the proportion of outpatient visits for influenza-like illness increased to 6.6%, which is, for the second consecutive week, the highest level reported since October of – you guessed it – 2009, when it hit 7.7%, the CDC said in its weekly flu surveillance report.
The level reported last week, 6.3%, has been revised downward and now stands at an even 6%.
It turns out that 2018 is something of a milestone for the H3N2 virus. The virus first emerged in 1968, so it has reached its 50th anniversary, Dan Jernigan, MD, director of the influenza division at the CDC’s National Center for Immunization and Respiratory Diseases, Atlanta, said on Jan. 26 in a weekly briefing.
H3N2 must not be happy about hitting the big 5-0, however, because the map of influenza-like illness activity looks pretty red and angry. For the week ending Jan. 20, there were 30 states at the highest level of flu activity on the CDC’s 1-10 scale, with another nine in the “high” range at levels 8 and 9.
Dr. Jernigan did suggest that activity may have peaked in some areas of the country, with California among them.
There were seven pediatric deaths reported for the week ending Jan. 20, although six occurred in previous weeks. There have been 37 flu-related deaths among children so far during the 2017-2018 season, the CDC said.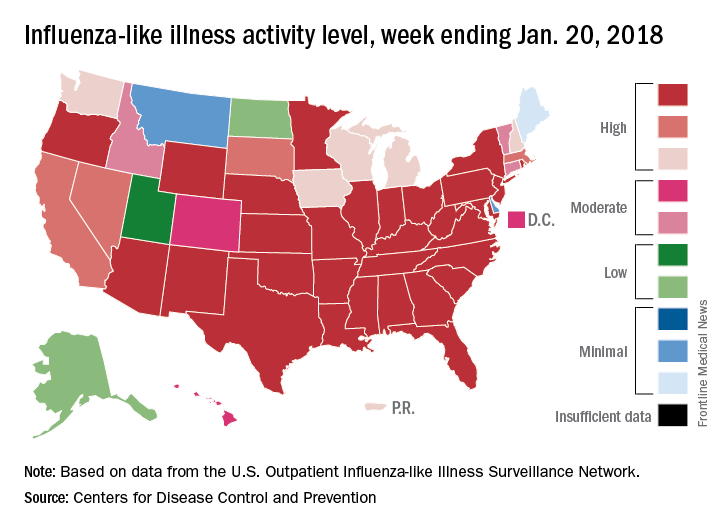
FDA approves starting dose of roflumilast
The Food and Drug Administration has approved the use of a 250-mcg dose of roflumilast for patients with chronic obstructive pulmonary disease (COPD) for 4 weeks, followed by the use of 500-mcg therapeutic doses, according to a statement from the drug’s marketer, AstraZeneca.
The larger doses of roflumilast (Daliresp) are currently indicated for reducing the risk of COPD exacerbations in patients with severe COPD associated with chronic bronchitis and a history of exacerbations, according to the statement. The selective phosphodiesterase-4 inhibitor, roflumilast, was approved for this use in 500-mcg doses in 2011. The new smaller doses of the drug are being offered to help reduce the rate of treatment discontinuation with use of the higher therapeutic dosing. The 250-mcg doses of roflumilast are not to be used as treatment for COPD.
“As the only once-daily tablet to provide enhanced protection against COPD exacerbations when added to current bronchodilator therapy, this is an important new dosing option to help patients start and stay on treatment. Exacerbations are associated with hospitalizations and an accelerated decline in lung function, and these patients living with COPD need effective treatment options,” Tosh Butt, vice president, respiratory, at AstraZeneca, said in the press release.
The approval of use of the 250-mcg doses was based on data from the OPTIMIZE study (Evaluation of Tolerability and Pharmacokinetics of Roflumilast trial, 250 mcg and 500 mcg, as an add-on to Standard COPD Treatment to Treat Severe COPD), according to the statement.
Over 12 weeks, the percentage of patients stopping treatment was significantly lower in those first given 250 mcg of roflumilast daily for 4 weeks, followed by 500 mcg once a week for 8 weeks (18.4%), compared with those given 500 mcg of roflumilast daily for 12 weeks (24.6%; odds ratio, 0.66; 95% confidence interval, 0.47-0.93; P = .017).
In eight controlled clinical trials, the most common adverse effects were diarrhea, weight loss, nausea, headache, back pain, influenza, insomnia, dizziness, and decreased appetite.
Shorter walk test predicts IPF outcomes
, based on data from 179 adults. The findings were presented at the CHEST annual meeting.
The 6-minute test is often used to evaluate functional capacity in IPF patients, but is not always practical in a busy clinic setting, according to Flavia S. Nunes, MD, of Inova Fairfax Hospital in Falls Church, VA, and colleagues.
“Among the clinical and physiologic predictors associated with survival in IPF, the 6MWT has been increasingly used over the past 5 years as a secondary endpoint in the efficacy analyses of potential therapies for IPF. Validation of shorter time of walking might make the test more feasible to be applied in routine clinical care,” she said.
To determine the predictive value of the first minute of the 6-minute test, the researchers reviewed data from 142 men and 37 women at a tertiary referral center between May 2010 and February 2017. The average age of the patients was 68 years, the average body mass index was 28.3 kg/m2, and 27% used oxygen supplementation during the walk test.
Overall, the mean distance for the 6-minute test was 372 m, and the average distance for the 1-minute test was 65 m. Study participants who achieved a 6-minute walk distance greater than 372 m were defined as high walkers, and those with a 6-minute walk distance less than 372 m were defined as low walkers. A strong correlation appeared between the 6-minute distance and 1-minute distance in terms of predicting survival, and 1-year transplant-free survival was significantly better in high walkers than in low walkers (27 months vs. 22 months; P = .015).
Dr. Nunes said she was not surprised by the results, in part because previous research has shown a strong correlation among 2-minute, 6-minute, and 12-minute walking tests.
Although more research is needed to validate the findings, the results suggest that the 1-minute test might be a practical substitute for the 6-minute test by providing similar prognostic information more quickly and easily than the 6-minute test, the researchers said.
“It is important for clinicians to know that the time chosen to assess exercise tolerance by walking tests might not be critical,” said Dr. Nunes. “Shorter walks are not only less time consuming, and easier for both patients and clinicians, but are also reproducible and discriminatory of survival.
“We need to validate the test performance characteristics and prognostic value of distance walked in a 1MWT compared to the standard 6MWT in an independent cohort of patients with IPF,” Dr. Nunes noted. “Additionally, the evaluation of alternate instruction, for example changing the wording from ‘walk as far’ to ‘walk as fast’ might facilitate a better effort, and a greater distance with improved reproducibility. Other novel parameters and modifications to the 6MWT or 1MWT might further improve the utility of these tests in the management of IPF and other patients,” she added.
The researchers had no financial conflicts to disclose.
FROM CHEST 2017
Analysis of Twitter lung cancer content reveals opportunity for clinicians
Social media communication around lung cancer is focused primarily on cancer treatment and use of pharmaceutical and research interventions, followed closely by awareness, prevention, and risk topics, according to an analysis of Twitter conversation over a 10-day period.
Although awareness and risk prevention tweets were likely to contain cues toward action, “messages focused on treatment, end of life ... were significantly less likely to integrate cues for personal activity,” the investigators wrote. The report was published in Journal of the American College of Radiology.
The investigators collected 1.3 million unique Twitter messages between Sept. 30 and Oct. 9, 2016, that contained at least one of six keywords commonly used to describe cancer: cancer, chemo, tumor, malignant, biopsy, and metastasis. They then drew a random, proportional stratified sample of 3,000 messages (12.5%) for manual coding from the 23,926 messages posted that included keywords related to lung cancer. Tweets were examined by user type (individuals, media, and organizations) to identify content and structural message features.
Message content was most frequently related to treatment (32.1%), followed by awareness (22.9%), end of life (15.5%), prevention and risk information (13.3%), active cancer-unknown phase (7.6%), diagnosis (6.1%), early detection (2.7%), and survivorship (1%), Dr. Sutton and her colleagues reported.
“The large volume of messages containing content about pharmaceuticals suggests that Twitter is also a forum for sharing information and discussing emerging treatments. Importantly, treatment messages were shared primarily by individuals, suggesting that this online user community jointly includes members of the public as well as medical practitioners and companies who have an awareness of emerging treatment approaches, suggesting an opportunity for online engagement between these various groups (e.g., Lung Cancer Social Media #LCSM community and related chats),” the investigators wrote.
The National Science Foundation supported parts of this research. None of the authors reported any conflicts of interest.
SOURCE: Sutton J. et al., J Am Coll Radiol. 2018 Jan. doi: 10.1016/j.jacr.2017.09.043
FROM JOURNAL OF THE AMERICAN COLLEGE OF RADIOLOGY
Key clinical point: In a random sample of Twitter conversation related to lung cancer, message content was most frequently related to treatment.
Major finding: Majority of tweets evaluated focused on lung cancer treatment and the use of pharmaceutical and research interventions, followed by awareness, prevention, and risk topics.
Study details: Random sample of 3,000 tweets posted in a 10-day period between Sept. 30 and Oct. 9, 2016. Lung cancer–specific tweets by user type (individuals, media, and organizations) were examined to identify content and structural message features.
Disclosures: The National Science Foundation supported parts of this research. None of the authors reported any conflicts of interest.
Source: Sutton J. et al., J Am Coll Radiol. 2018 Jan. doi: 10.1016/j.jacr.2017.09.043.
Influenza: All that and MI too
Myocardial infarction admissions were six times more likely to occur in the week after a positive test for influenza than in the year before or the 51 weeks after the infection, according to analysis of a Canadian cohort that links laboratories with administrative databases.
The investigators used this cohort data to define definitions of “risk interval” – the first 7 days after flu detection – and a combined “control interval” – 52 weeks before the flu detection and 51 weeks after the end of the risk interval.
Among the total of 364 hospital admissions for MI in patients with confirmed influenza, 20 occurred during the defined 1-week risk interval (20 admissions/week) and 344 occurred during the control interval (3.3 admissions/week), giving an incidence ratio (IR) of 6.05, Jeffrey C. Kwong, MD, of the University of Toronto and his associates reported in the New England Journal of Medicine.
There was little difference between days 1 and 3 after flu confirmation (IR, 6.3) and days 4-7 (IR, 5.8), but risk dropped off quickly after that, with IRs of 0.6 at days 8-14 and 0.75 at days 15-28. Risk was increased for older adults, those with influenza B infection, and those who had their first MI, the investigators said.
MI incidence also was elevated after infection with noninfluenza respiratory viruses, although to a lesser extent than with influenza, which suggests that “influenza is illustrative of the role that acute respiratory infections have in precipitating acute myocardial infarction,” Dr. Kwong and his associates wrote.
The study was supported by the Canadian Institutes of Health Research, by Public Health Ontario, and by the Institute for Clinical Evaluative Sciences. Dr. Kwong reported grants from Canadian Institutes of Health Research during the conduct of the study, as well as grants from Canadian Institutes of Health Research and University of Toronto.
SOURCE: Kwong JC et al. N Engl J Med. 2018. 378(4):345-53. doi: 10.1056/NEJMoa1702090.
FROM THE NEW ENGLAND JOURNAL OF MEDICINE
Beware the COPD exacerbation
A 70-year-old man with chronic obstructive pulmonary disease (COPD) is admitted with increased shortness of breath. His O2 saturation levels are usually 90%, but they’re now running 84%-88%. He has had increasing symptoms for the past 3 days.

What would be your next step?
A) Begin a 5-day course of corticosteroids.
B) Begin a 14-day course of corticosteroids.
C) Begin azithromycin.
D) Start BiPAP.
E) Obtain D-dimer.
This is a situation we face frequently. COPD exacerbations are a clinical diagnosis that is often jumped to as the diagnosis in patients with COPD who have increasing dyspnea. This diagnosis is frequently correct – but not always.
Patients with COPD also may be at risk for or have heart failure, which can present with identical symptoms, including widespread wheezing. We are currently in a severe influenza epidemic, and influenza can mimic a COPD exacerbation or be the trigger.
About 20 years ago, I was out of the country when one of my patients with COPD was admitted to the hospital with a COPD exacerbation. I saw him in follow-up a week after his hospitalization. He was very dyspneic and had a room air oxygen saturation of 75%. He told me his dyspnea started a few days after he had injured his leg on a wood pile in his yard.
On exam, his right leg had 3+ edema; left leg, no edema. He reported to me that he was treated for 5 days with steroids and nebulizers, with minimal change in his dyspnea. I reviewed the chart, and five physicians had seen him while he was in the hospital. Starting with the emergency department, the diagnosis was COPD exacerbation, with no differential diagnosis in any note.
The patient had multiple pulmonary emboli, and he eventually improved with anticoagulation.
In 2009, Jacques Rizkallah, MD, and his colleagues published a systematic review and meta-analysis of articles looking at the prevalence of pulmonary emboli (PE) in patients diagnosed/treated for a COPD exacerbation.1 They found five articles comprising a total of 550 patients who met inclusion criteria. The prevalence was 19.9% (P = .014). The prevalence was much higher (24.7%) for hospitalized patients than it was for outpatients (3.3%). A very important finding in this study: There was no difference in symptoms between patients who did and did not have a pulmonary embolus.
Evrim Eylem Akpinar, MD, and colleagues studied all admissions for acute exacerbations of COPD at one hospital in Turkey over a 2-year period.2 A total of 172 patients admitted for COPD exacerbations were studied. The prevalence of pulmonary embolus was 29%.
In this study, patients who were obese or immobile were more likely to have pulmonary emboli. Pleuritic chest pain and lower-limb asymmetry were signs and symptoms more commonly found in patients who had PE. Obesity was the highest independent predictor (odds ratio, 4.97) for pulmonary embolus.
Floor Aleva, MD, and colleagues recently completed a systematic review and meta-analysis on prevalence and localization of pulmonary embolus in patients with acute exacerbations of COPD.3 They found similar numbers to the previous meta-analysis (16.1%) in a total of 880 patients. They also looked at location in the lungs of the emboli and found that two-thirds of the patients had pulmonary emboli in locations that had clear indication for anticoagulation treatment.
This is important, because criticisms of earlier studies were that clinically insignificant pulmonary emboli might be being found in the studies and that they had little to do with the patients’ symptoms.
In the case presented, I think that getting a D-dimer test would be the next best step. Acute exacerbation of COPD still is the most likely diagnosis, but PE is a plausible diagnosis that should be evaluated. If the D-dimer is normal, workup for PE would be complete. If elevated, then given the 20% prevalence of PE, a CT angiography would be warranted.
Key pearl: Among patients hospitalized for COPD exacerbations, 16%-24% have pulmonary embolism.

Dr. Paauw is professor of medicine in the division of general internal medicine at the University of Washington, Seattle, and he serves as third-year medical student clerkship director at the University of Washington. Contact Dr. Paauw at [email protected].
References
1. Chest. 2009 Mar;135(3):786-93.
2. J Bras Pneumol. 2014 Jan-Feb;40(1):38-45.
3. Chest. 2017 Mar;151(3):544-54.
A 70-year-old man with chronic obstructive pulmonary disease (COPD) is admitted with increased shortness of breath. His O2 saturation levels are usually 90%, but they’re now running 84%-88%. He has had increasing symptoms for the past 3 days.
What would be your next step?
A) Begin a 5-day course of corticosteroids.
B) Begin a 14-day course of corticosteroids.
C) Begin azithromycin.
D) Start BiPAP.
E) Obtain D-dimer.
This is a situation we face frequently. COPD exacerbations are a clinical diagnosis that is often jumped to as the diagnosis in patients with COPD who have increasing dyspnea. This diagnosis is frequently correct – but not always.
Patients with COPD also may be at risk for or have heart failure, which can present with identical symptoms, including widespread wheezing. We are currently in a severe influenza epidemic, and influenza can mimic a COPD exacerbation or be the trigger.
About 20 years ago, I was out of the country when one of my patients with COPD was admitted to the hospital with a COPD exacerbation. I saw him in follow-up a week after his hospitalization. He was very dyspneic and had a room air oxygen saturation of 75%. He told me his dyspnea started a few days after he had injured his leg on a wood pile in his yard.
On exam, his right leg had 3+ edema; left leg, no edema. He reported to me that he was treated for 5 days with steroids and nebulizers, with minimal change in his dyspnea. I reviewed the chart, and five physicians had seen him while he was in the hospital. Starting with the emergency department, the diagnosis was COPD exacerbation, with no differential diagnosis in any note.
The patient had multiple pulmonary emboli, and he eventually improved with anticoagulation.
In 2009, Jacques Rizkallah, MD, and his colleagues published a systematic review and meta-analysis of articles looking at the prevalence of pulmonary emboli (PE) in patients diagnosed/treated for a COPD exacerbation.1 They found five articles comprising a total of 550 patients who met inclusion criteria. The prevalence was 19.9% (P = .014). The prevalence was much higher (24.7%) for hospitalized patients than it was for outpatients (3.3%). A very important finding in this study: There was no difference in symptoms between patients who did and did not have a pulmonary embolus.
Evrim Eylem Akpinar, MD, and colleagues studied all admissions for acute exacerbations of COPD at one hospital in Turkey over a 2-year period.2 A total of 172 patients admitted for COPD exacerbations were studied. The prevalence of pulmonary embolus was 29%.
In this study, patients who were obese or immobile were more likely to have pulmonary emboli. Pleuritic chest pain and lower-limb asymmetry were signs and symptoms more commonly found in patients who had PE. Obesity was the highest independent predictor (odds ratio, 4.97) for pulmonary embolus.
Floor Aleva, MD, and colleagues recently completed a systematic review and meta-analysis on prevalence and localization of pulmonary embolus in patients with acute exacerbations of COPD.3 They found similar numbers to the previous meta-analysis (16.1%) in a total of 880 patients. They also looked at location in the lungs of the emboli and found that two-thirds of the patients had pulmonary emboli in locations that had clear indication for anticoagulation treatment.
This is important, because criticisms of earlier studies were that clinically insignificant pulmonary emboli might be being found in the studies and that they had little to do with the patients’ symptoms.
In the case presented, I think that getting a D-dimer test would be the next best step. Acute exacerbation of COPD still is the most likely diagnosis, but PE is a plausible diagnosis that should be evaluated. If the D-dimer is normal, workup for PE would be complete. If elevated, then given the 20% prevalence of PE, a CT angiography would be warranted.
Key pearl: Among patients hospitalized for COPD exacerbations, 16%-24% have pulmonary embolism.
Dr. Paauw is professor of medicine in the division of general internal medicine at the University of Washington, Seattle, and he serves as third-year medical student clerkship director at the University of Washington. Contact Dr. Paauw at [email protected].
References
1. Chest. 2009 Mar;135(3):786-93.
2. J Bras Pneumol. 2014 Jan-Feb;40(1):38-45.
3. Chest. 2017 Mar;151(3):544-54.