User login
Bringing you the latest news, research and reviews, exclusive interviews, podcasts, quizzes, and more.
div[contains(@class, 'header__large-screen')]
div[contains(@class, 'read-next-article')]
div[contains(@class, 'nav-primary')]
nav[contains(@class, 'nav-primary')]
section[contains(@class, 'footer-nav-section-wrapper')]
footer[@id='footer']
div[contains(@class, 'main-prefix')]
section[contains(@class, 'nav-hidden')]
div[contains(@class, 'ce-card-content')]
nav[contains(@class, 'nav-ce-stack')]
Children and COVID: Weekly cases resume their climb
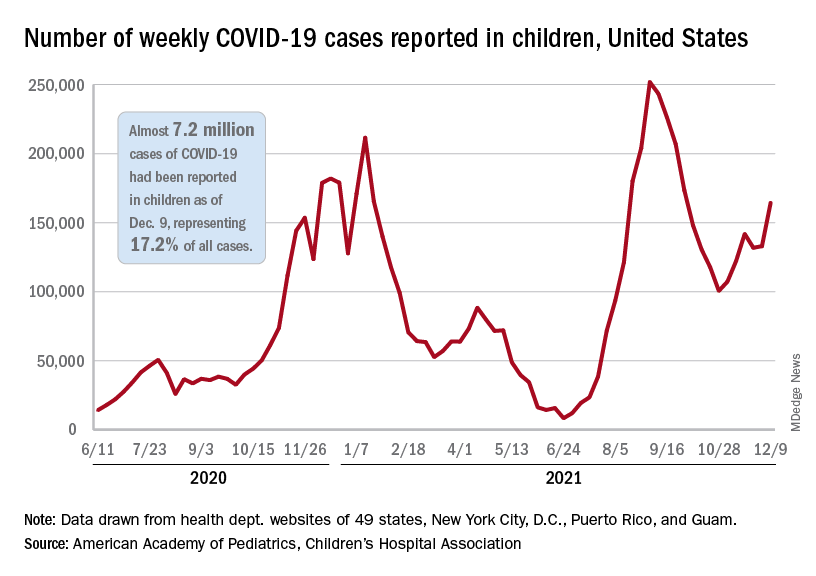
After a brief lull in activity, weekly COVID-19 cases in children returned to the upward trend that began in early November, based on data from the American Academy of Pediatrics and the Children’s Hospital Association.
according to the Centers for Disease Control and Prevention.
New COVID-19 cases were up by 23.5% for the week of Dec. 3-9, after a 2-week period that saw a drop and then just a slight increase, the AAP and CHA said in their latest weekly COVID report. There were 164,000 new cases from Dec. 3 to Dec. 9 in 46 states (Alabama, Nebraska, and Texas stopped reporting over the summer of 2021 and New York has never reported by age), the District of Columbia, New York City, Puerto Rico, and Guam.
The increase occurred across all four regions of the country, but the largest share came in the Midwest, with over 65,000 new cases, followed by the West (just over 35,000), the Northeast (just under 35,000), and the South (close to 28,000), the AAP/CHA data show.
The 7.2 million cumulative cases in children as of Dec. 9 represent 17.2% of all cases reported in the United States since the start of the pandemic, with available state reports showing that proportion ranges from 12.3% in Florida to 26.1% in Vermont. Alaska has the highest incidence of COVID at 19,000 cases per 100,000 children, and Hawaii has the lowest (5,300 per 100,000) among the states currently reporting, the AAP and CHA said.
State reporting on vaccinations shows that 37% of children aged 5-11 years in Massachusetts have received at least one dose, the highest of any state, while West Virginia is lowest at just 4%. The highest vaccination rate for children aged 12-17 goes to Massachusetts at 84%, with Wyoming lowest at 37%, the AAP said in a separate report.
Nationally, new vaccinations fell by a third during the week of Dec. 7-13, compared with the previous week, with the largest decline (34.7%) coming from the 5- to 11-year-olds, who still represented the majority (almost 84%) of the 430,000 new child vaccinations received, according to the CDC’s COVID Data Tracker. Corresponding declines for the last week were 27.5% for 12- to 15-year-olds and 22.7% for those aged 16-17.
Altogether, 21.2 million children aged 5-17 had received at least one dose and 16.0 million were fully vaccinated as of Dec. 13. By age group, 19.2% of children aged 5-11 years have gotten at least one dose and 9.6% are fully vaccinated, compared with 62.1% and 52.3%, respectively, among children aged 12-17, the CDC said.
Infant milk allergy guidelines promote overdiagnosis, study says
International guidelines developed to help nonspecialists diagnose cow’s milk allergy (CMA) lead providers to attribute normal infant symptoms to CMA and result in overdiagnosis, say authors of a study published online in Clinical & Experimental Allergy.
Lead author Rosie Vincent, MBChB, with Population Health Sciences at University of Bristol, United Kingdom, told this news organization their study shows that symptoms listed in the international Milk Allergy in Primary Care (iMAP) guidelines as indicative of non-immunoglobulin E (IgE)-mediated milk allergy are very common in a baby’s first year. Examples include vomiting, regurgitating milk, loose or more frequent stools, colic, and irritability.
Findings come from performing a secondary analysis of data from 1,303 infants from the EAT study, a population-based, randomized controlled trial in the U.K. that looked at whether introducing allergenic foods into an infant’s diet reduced the risk of developing an allergy to that food.
In an indication of how common the symptoms in the guidelines (published in 2017 and 2019) are found in all infants, nearly three-fourths (74%) of participants reported at least two mild-to-moderate symptoms, and 9% reported at least two severe symptoms in at least one month between 3 and 12 months of age. Data were not available for younger infants.
However, the prevalence of non–IgE-mediated CMA is thought to be less than 1% in infants in European countries, the study states.
In the study, two or more non-IgE CMA mild-to-moderate symptoms were reported by 25% of families, and 1.4% reported severe symptoms each month between ages 3 and 12 months.
“These symptoms peaked at 38%, with at least two mild-to-moderate symptoms and 4.3% with at least two severe symptoms at 3 months, when participants were not directly consuming cow’s milk,” Ms. Vincent said.
Researchers write that at 6 months there was no significant difference in the proportion of children with at least two symptoms between those consuming and not consuming cow’s milk.
Consequences of misdiagnosis
Overdiagnosing milk allergy can lead to additional costs, unnecessary tests, and less breastfeeding, she said.
Cow’s milk protein is commonly found in standard infant formula or in milk-containing foods.
The authors note that “small levels of lactoglobulin are found in breastmilk; however, the quantities are below the threshold likely to trigger a reaction in more than 99% of infants with IgE-mediated cow’s milk allergy.”
Misdiagnosis is likely to result in increasing prescriptions of unwarranted specialized formula, with increased cost to patients and health care systems, and use of unvalidated allergy tests, Ms. Vincent said.
Ms. Vincent added that even the suggestion that cow’s milk protein delivered through breast milk might be inducing symptoms could lead a mother to stop breastfeeding.
The authors also note that in reviewing recent CMA guidelines, “three of nine CMA guidelines were directly supported by formula manufacturers or marketing consultants, and 81% of all guideline authors reported a conflict of interest with formula manufacturers.”
Heather Cassell, MD, a pediatric allergy and immunology specialist with Banner Health and a clinical associate professor of pediatrics at the University of Arizona College of Medicine in Tucson, told this news organization the conflicts of interest in milk allergy research and guidelines have been a long-standing problem.
She said historically there has been a big push “that people who can afford formula should be paying for formula. That was 100% marketed by the formula companies.”
“We have formula companies bringing us samples to encourage pediatricians to use the formula early if we’re concerned about a milk protein allergy,” Dr. Cassell said.
As for the overdiagnosis of milk allergy, she said reintroduction of cow’s milk later is one way to improve diagnosis to see if the child no longer has a reaction. However, she points out that in this study, only 21% of parents reintroduced cow’s milk.
“Really, it should be closer to 100%, with the exception of the babies who are having severe symptoms,” Dr. Cassell said. “You don’t want to keep a baby from progressing with their diet.”
She said families and providers need to look at several contextual clues before they land on a milk allergy label.
“It’s not just about reflux, it’s not just about a baby spitting up. Happy babies spit up and there’s nothing that needs to be done because they will eventually grow out of it,” Dr. Cassell stressed.
She said significant irritability with blood in the stool might warrant more concern. “I think the [emphasis] needs to be on retrying the food another time,” she suggested.
Ms. Vincent pointed out that there is no quick or easy test to diagnose non–IgE-mediated cow’s milk allergy.
“We need further research to identify what symptoms are much more likely to point to a diagnosis,” she said.
Although the researchers used iMAP guidelines, they write that results are likely to apply to other CMA guidelines, because they list similar symptoms and signs.
The study was funded by the International Society of Atopic Dermatitis. Ms. Vincent reports receiving a 3-month research fellowship award from Pfizer and support from the NIHR School for Primary Care Research. Other authors’ financial disclosures are available with the full text. Dr. Cassell reports that the University of Arizona School of Medicine is a trial site for testing a patch to help with diagnosing milk protein allergy in infants.
A version of this article first appeared on Medscape.com.
FROM CLINICAL & EXPERIMENTAL ALLERGY
Physician gender pay gap isn’t news; health inequity is rampant
A recent study examined projected career earnings between the genders in a largely community-based physician population, finding a difference of about $2 million in career earnings. That a gender pay gap exists in medicine is not news – but the manner in which this study was done, the investigators’ ability to control for a number of confounding variables, and the size of the study group (over 80,000) are newsworthy.
Some of the key findings include that gender pay gaps start with your first job, and you never close the gap, even as you gain experience and efficiency. Also, the more highly remunerated your specialty, the larger the gap. The gender pay gap joins a growing list of inequities within health care. Although physician compensation is not the most important, given that nearly all physicians are well-paid, and we have much more significant inequities that lead to direct patient harm, the reasons for this discrepancy warrant further consideration.
When I was first being educated about social inequity as part of work in social determinants of health, I made the error of using “inequality” and “inequity” interchangeably. The subtle yet important difference between the two terms was quickly described to me. Inequality is a gastroenterologist getting paid more money to do a colonoscopy than a family physician. Inequity is a female gastroenterologist getting paid less than a male gastroenterologist. Global Health Europe boldly identifies that “inequity is the result of failure.” In looking at the inequity inherent in the gender pay gap, I consider what failed and why.
I’m currently making a major career change, leaving an executive leadership position to return to full-time clinical practice. There is a significant pay decrease that will accompany this change because I am in a primary care specialty. Beyond that, I am considering two employment contracts from different systems to do a similar clinical role.
One of the questions my husband asked was which will pay more over the long run. This is difficult to discern because the compensation formula each health system uses is different, even though they are based on standard national benchmarking data. It is possible that women, in general, are like I am and look for factors other than compensation to make a job decision – assuming, like I do, that it will be close enough to not matter or is generally fair. In fact, while compensation is most certainly a consideration for me, once I determined that it was likely to be in the same ballpark, I stopped comparing. Even as the sole breadwinner in our family, I take this (probably faulty) approach.
It’s time to reconsider how we pay physicians
Women may be more likely to gloss over compensation details that men evaluate and negotiate carefully. To change this, women must first take responsibility for being an active, informed, and engaged part of compensation negotiations. In addition, employers who value gender pay equity must negotiate in good faith, keeping in mind the well-described vulnerabilities in discussions about pay. Finally, male and female mentors and leaders should actively coach female physicians on how to approach these conversations with confidence and skill.
In primary care, female physicians spend, on average, about 15% more time with their patients during a visit. Despite spending as much time in clinic seeing patients per week, they see fewer patients, thereby generating less revenue. For compensation plans that are based on productivity, the extra time spent costs money. In this case, it costs the female physicians lost compensation.
The way in which women are more likely to practice medicine, which includes the amount of time they spend with patients, may affect clinical outcomes without directly increasing productivity. A 2017 study demonstrated that elderly patients had lower rates of mortality and readmission when cared for by a female rather than a male physician. These findings require health systems to critically evaluate what compensation plans value and to promote an appropriate balance between quality of care, quantity of care, and style of care.
Although I’ve seen gender pay inequity as blatant as two different salaries for physicians doing the same work – one male and one female – I think this is uncommon. Like many forms of inequity, the outputs are often related to a failed system rather than solely a series of individual failures. Making compensation formulas gender-blind is an important step – but it is only the first step, not the last. Recognizing that the structure of a compensation formula may be biased toward a style of medical practice more likely to be espoused by one gender is necessary as well.
The data, including the findings of this recent study, clearly identify the gender pay gap that exists in medicine, as it does in many other fields, and that it is not explainable solely by differences in specialties, work hours, family status, or title.
To address the inequity, it is imperative that women engage with employers and leaders to both understand and develop skills around effective and appropriate compensation negotiation. Recognizing that compensation plans, especially those built on productivity models, may fail to place adequate value on gender-specific practice styles.
Jennifer Frank is a family physician, physician leader, wife, and mother in Northeast Wisconsin.
A version of this article first appeared on Medscape.com.
Pollutants tied to changes in ratio of boys to girls born
The season of conception does not affect whether more boys than girls are born, nor do temperatures in the environment, a large study reveals. Similarly, researchers found no connection with a location’s violent crime level, unemployment rate, or major events like Hurricane Katrina.
But certain chemical pollutants were related to fewer boys being born compared to girls when researchers looked at data for more than 3 million newborns over 8 years in the U.S. and another 3 million born over 30 years in Sweden.
“With data on births in 150 million people in the U.S. over 8 years and 9 million Swedes over 9 years, this is almost surely the largest study to date on the question of environmental factors and their influence on sex ratio at birth,” says Shanna Swan, PhD, who was not affiliated with the research
Variations in the annual sex birth ratio (SRB) – the number of boys born compared to the total birth rate – are well-accepted. Less clear is what things drive these changes.
Although not the first study to look for connections between major events or pollutants in the air, water, and land and the SRB, it is the first to mine two very large electronic medical record databases for answers, senior study author Andrey Rzhetsky, PhD, a professor of medicine and human genetics at the University of Chicago, tells this news organization.
The findings were published Dec. 2, 2021, in PLOS Computational Biology.
And even though the SRB did not vary significantly after Hurricane Katrina in 2005, it did after the 2007 shooting at Virginia Tech, Dr. Rzhetsky and colleagues found. The SRB was lower than expected 34 weeks after the mass shooting.
Location, location, location
The researchers also found the levels of chemical pollutants “varied remarkably” across different regions of the country. For example, lead in the land was elevated in the Northeast, Southwest, and Mideastern U.S. but not in the South. Also, the highest levels of total mercury in water samples was found mostly in Eastern states, especially in the Northeast.
Dr. Rzhetsky and colleagues mapped these regional differences in many factors, including hydrazine. Hydrazine is a foaming agent used to make pharmaceuticals, agrochemicals, and as a propellant for spacecraft.
“Hydrazine appears to follow capricious, blotch-like shapes in the eastern U.S., each blotch likely centered at a factory emitting this pollutant,” the authors wrote.
To get a more complete picture, the investigators also compared changes in the SRB to data from the U.S. National Oceanic and Atmospheric Administration, U.S. Environmental Protection Agency, Swedish Meteorological and Hydrological Institute, and Statistics Sweden.
They found that aluminium in air, chromium in water, and total mercury levels drove the SRB up. By comparison, lead in soil and areas with a higher renter occupancy were linked to a lower SRB, or a higher proportion of girls being born.
Dr. Rzhetsky and colleagues also add to the evidence for a link between polychlorinated biphenyls (PCBs) and the SRB. Previous findings conflict, the authors noted.
“Since the sample sizes of the studies published thus far were very small, our PCBs result would have substantially larger statistical power,” they said.
Several pollutants had no significant link to SRB in the study, including levels of lead or chromium in the air, arsenic in the soil, and cadmium in the air or water.
Consistent findings
That said, the research had limits.
“The magnitude is new in terms of number of births, and the statistical methods are unusually sophisticated, but the conclusions don’t really differ from much of what has been published,” says Dr. Swan, a professor of environmental medicine and public health at the Icahn School of Medicine at Mount Sinai, New York.
“The takeaway message that many examined exposures are associated with lower – and some with higher – SRBs is not new but consistent with other, smaller studies,” says Dr. Swan, who co-authored a Sept. 2021 study evaluating endocrine-disrupting chemicals and lower birth rates in Asia.
The data on environmental exposures “is, however, quite uneven, and only known at the ecologic and not the individual level,” she says. “We learn, for example, that SRB was significantly reduced ... among families living in areas with the highest septile of lead exposure but also in those among the highest septile of percent renter occupancy.”
“Evaluating these as to mechanism and plausibility is difficult,” Dr. Swan says.
More research warranted
The mechanism remains unknown, but the investigators suggested that female embryo pregnancies may end early in development, driving the SRB up. Also, male embryo deaths are more common in the late second or third trimester, at which point they would drive the SRB down. A third factor, maternal hormone levels around the time of conception, could also alter the SRB.
The associations between individual factors and SRB changes are just that – associations – not intended to be interpreted as “sex-specific selection mechanisms” causing the differences at this point, the authors noted. Further studies to confirm the associations are needed.
The research is a good stepping off point for future studies to look closer at the contribution of pollutants like arsenic, lead, cadmium, and more, Dr. Rzhetsky says.
A version of this article first appeared on WebMD.com.
Booster recommendations for pregnant women, teens, and other groups explained

These recommendations have been widened because of the continued emergence of new variants of the virus and the wane of protection over time for both vaccinations and previous disease.
The new recommendations take away some of the questions surrounding eligibility for booster vaccinations while potentially leaving some additional questions. All in all, they provide flexibility for individuals to help protect themselves against the COVID-19 virus, as many are considering celebrating the holidays with friends and family.
The first item that has become clear is that all individuals over 18 are now not only eligible for a booster vaccination a certain time after they have completed their series, but have a recommendation for one.1
But what about a fourth dose? There is a possibility that some patients should be receiving one. For those who require a three-dose series due to a condition that makes them immunocompromised, they should receive their booster vaccination six months after completion of the three-dose series. This distinction may cause confusion for some, but is important for those immunocompromised.
Boosters in women who are pregnant
The recommendations also include specific comments about individuals who are pregnant. Although initial studies did not include pregnant individuals, there has been increasing real world data that vaccination against COVID, including booster vaccinations, is safe and recommended. As pregnancy increases the risk of severe disease if infected by COVID-19, both the CDC and the American College of Obstetricians and Gynecologists,2 along with other specialty organizations, such as the Royal College of Obstetricians and Gynaecologists, recommend vaccinations for pregnant individuals.
The CDC goes on to describe that there is no evidence of vaccination increasing the risk of infertility. The vaccine protects the pregnant individual and also provides protection to the baby once born. The same is true of breastfeeding individuals.3
I hope that this information allows physicians to feel comfortable recommending vaccinations and boosters to those who are pregnant and breast feeding.
Expanded recommendations for those aged 16-17 years
Recently, the CDC also expanded booster recommendations to include those aged 16-17 years, 6 months after completing their vaccine series.
Those under 18 are currently only able to receive the Pfizer-BioNtech vaccine. This new guidance has left some parents wondering if there will also be approval for booster vaccinations soon for those aged 12-16 who are approaching or have reached six months past the initial vaccine.1
Booster brand for those over 18 years?
Although the recommendation has been simplified for all over age 18 years, there is still a decision to be made about which vaccine to use as the booster.
The recommendations allow individuals to decide which brand of vaccine they would like to have as a booster. They may choose to be vaccinated with the same vaccine they originally received or with a different vaccine. This vaccine flexibility may cause confusion, but ultimately is a good thing as it allows individuals to receive whatever vaccine is available and most convenient. This also allows individuals who have been vaccinated outside of the United States by a different brand of vaccine to also receive a booster vaccination with one of the options available here.
Take home message
Overall, the expansion of booster recommendations will help everyone avoid severe disease from COVID-19 infections. Physicians now have more clarity on who should be receiving these vaccines. Along with testing, masking, and appropriate distancing, these recommendations should help prevent severe disease and death from COVID-19.
Dr. Wheat is a family physician at Erie Family Health Center in Chicago. She is program director of Northwestern’s McGaw Family Medicine residency program, also in Chicago. Dr. Wheat serves on the editorial advisory board of Family Practice News. You can contact her at [email protected].
References
1. COVID-19 Vaccine Booster Shots. Centers for Disease Control and Prevention. 2021 Dec 9.
2. COVID-19 Vaccines and Pregnancy: Conversation Guide. American College of Obstetricians and Gynecologists. 2021 November.
3. COVID-19 Vaccines While Pregnant or Breastfeeding. Centers for Disease Control and Prevention. 2021 Dec 6.
12 state boards have disciplined docs for COVID misinformation
, according to a new survey from the Federation of State Medical Boards (FSMB).
The FSMB reports that in its 2021 annual survey two-thirds of its 71 member boards (which includes the United States, its territories, and Washington, DC) reported an increase in complaints about doctors spreading false or misleading information.
“The staggering number of state medical boards that have seen an increase in COVID-19 disinformation complaints is a sign of how widespread the issue has become,” said Humayun J. Chaudhry, DO, MACP, president and CEO of the FSMB, in a statement.
The FSMB board of directors warned physicians in July that they risked disciplinary action if they spread COVID-19 vaccine misinformation or disinformation.
The organization said 15 state boards have now adopted similar statements.
Dr. Chaudhry said the FSMB was “encouraged by the number of boards that have already taken action to combat COVID-19 disinformation by disciplining physicians who engage in that behavior and by reminding all physicians that their words and actions matter, and they should think twice before spreading disinformation that may harm patients.”
This news organization asked the FSMB for further comment on why more physicians have not been disciplined, but did not receive a response before publication.
Misinformation policies a new battleground
The FSMB and member board policies on COVID-19 around the country have become a new front in the war against mandates and restrictions.
The Tennessee Board of Medical Examiners voted just recently to remove its statement of policy against the spread of misinformation from its website after a Republican lawmaker allegedly threatened to dissolve the board.
The vote came just a few months after the board had approved the policy. The board did not rescind the policy, however, according to a report by the Associated Press.
In California, the president of the state’s medical board tweeted on December 8 about what she said was an incident of harassment by a group that has promoted “fake COVID-19 treatments.”Ms. Kristina Lawson said she observed four men sitting in front of her house in a truck. They flew a drone over her residence, and then followed her to work, parking nose-to-nose with her vehicle.
Ms. Lawson claimed that when she went to drive home the four men ambushed her in what was by then a dark parking garage. She said her “concern turned to terror” as they jumped out, cameras and recording equipment in hand.
The men told law enforcement called to the scene that they were just trying to interview her, according to a statement emailed by Ms. Lawson.
They had not made such a request to the California Medical Board.
Ms. Lawson tweeted that she would continue to volunteer for the board. “That means protecting Californians from bad doctors, and ensuring disinformation and misinformation do not detract from our work to protect patients and consumers,” she wrote.
The men who ambushed Ms. Larson allegedly identified themselves and were wearing clothing emblazoned with the logo of “America’s Frontline Doctors,” an organization that has trafficked in COVID-19 conspiracy theories and promoted unproven treatments like hydroxychloroquine and ivermectin, according to Time. It is led by Simone Gold, MD, who was arrested for breaching the U.S. Capitol on January 6.
Despite her activities, on November 30, the California Medical Board renewed Ms. Gold’s 2-year license to practice.
Who’s being disciplined, who’s not
Dr. Gold is not alone. An investigation by NPRin September found that 15 of 16 physicians who have spread false information in a high-profile manner have medical licenses in good standing.
Sherri Tenpenny, DO, who has claimed that COVID-19 vaccines magnetize people and “interface” with 5G cell phone towers, was able to renew her license with the Ohio State Medical Board on October 1, according to the Cincinnati Enquirer.
Some boards have acted. The Oregon Medical Board revoked the license of Steven LaTulippe, MD, and fined him $10,000 for spreading misinformation about masks and overprescribing opioids.
In August, Rhode Island’s Board of Medical Licensure suspended Mark Brody’s license for 5 years after finding that the doctor spread falsehoods about COVID-19 vaccines, according to board documents.
Maine physician Paul Gosselin, DO, is on temporary suspension until a February hearing, while the osteopathic board investigates his issuance of vaccine exemption letters and the promotion of unproven COVID-19 therapies.
The board found that Gosselin had “engaged in conduct that constitutes fraud or deceit,” according to official documents.
The Washington State Medical Board has opened an investigation into Ryan N. Cole, MD, a physician who has claimed that COVID vaccines are “fake,” and was appointed to a regional health board in Idaho in September, according to the Washington Post.
The Idaho Capital Sun reported that Dr. Cole claims he is licensed in 11 states, including Washington. The Idaho Medical Association has also filed a complaint about Dr. Cole with the Idaho Board of Medicine, according to the paper.
New FSMB guidance coming
The FSMB said it expects more disciplinary actions as investigations continue to unfold.
The organization is drafting a new policy document that will include further guidelines and recommendations for state medical boards “to help address the spread of disinformation,” it said. The final document would be released in April 2022.
In the meantime, some states, like Tennessee and others, are trying to find ways to counter the current policy — a development the FSMB called “troubling.”
“The FSMB strongly opposes any effort to restrict a board’s authority to evaluate the standard of care and assess risk for patient harm,” the organization said in its statement.
A version of this article was first published on Medscape.com.
Major COVID-19 case growth expected in coming weeks
by the PolicyLab at Children’s Hospital of Philadelphia.

Large metropolitan areas, especially those in the Northeast, are already seeing a major increase in cases following Thanksgiving, and that trend is expected to continue.
“Why? Simply stated, the large amount of Thanksgiving travel and gatherings undermined the nation’s pandemic footing and has elevated disease burden in areas of the country that were fortunate to have lower case rates before the holidays,” the forecasters wrote.
Case numbers in New York City are expected to double throughout December, the forecasters said. Similar growth could happen across Boston, Philadelphia, and Baltimore.
Overall, COVID-19 cases, hospitalizations, and deaths are rising across the United States but remain below levels seen during the summer and last winter’s surges, according to the New York Times. The increase is still being driven by the Delta variant, though it remains unclear how the Omicron variant, which has been detected in 27 states, could affect the trends in the coming weeks.
During the past week, the United States has reported an average of more than 120,000 new cases each day, the newspaper reported, which is an increase of 38% from two weeks ago.
The daily average of COVID-19 hospitalizations is around 64,000, which marks an increase of 22% from two weeks ago. More than 1,300 deaths are being reported each day, which is up 26%.
Numerous states are reporting double the cases from two weeks ago, stretching across the country from states in the Northeast such as Connecticut and Rhode Island to southern states such as North Carolina and Texas and western states such as California.
The Great Lakes region and the Northeast are seeing some of the most severe increases, the newspaper reported. New Hampshire leads the United States in recent cases per capita, and Maine has reported more cases in the past week than in any other seven-day period during the pandemic.
Michigan has the country’s highest hospitalization rate, and federal medical teams have been sent to the state to help with the surge in patients, according to The Detroit News. Michigan’s top public health officials described the surge as a “critical” and “deeply concerning” situation on Dec. 10, and they requested 200 more ventilators from the Strategic National Stockpile.
Indiana, Maine, and New York have also requested aid from the National Guard, according to USA Today. Health officials in those states urged residents to get vaccines or booster shots and wear masks in indoor public settings.
The Omicron variant can evade some vaccine protection, but booster shots can increase efficacy and offer more coverage, Anthony Fauci, MD, director of the National Institute of Allergy and Infectious Diseases, said Dec. 12.
“If you want to be optimally protected, absolutely get a booster,” he said on ABC’s “This Week.”
In addition, New York Gov. Kathy Hochul has announced a statewide mask mandate, which will take effect Dec. 13. Masks will be required in all indoor public spaces and businesses, unless the location implements a vaccine requirement instead, the news outlet reported.
A version of this article first appeared on WebMD.com.
by the PolicyLab at Children’s Hospital of Philadelphia.
Large metropolitan areas, especially those in the Northeast, are already seeing a major increase in cases following Thanksgiving, and that trend is expected to continue.
“Why? Simply stated, the large amount of Thanksgiving travel and gatherings undermined the nation’s pandemic footing and has elevated disease burden in areas of the country that were fortunate to have lower case rates before the holidays,” the forecasters wrote.
Case numbers in New York City are expected to double throughout December, the forecasters said. Similar growth could happen across Boston, Philadelphia, and Baltimore.
Overall, COVID-19 cases, hospitalizations, and deaths are rising across the United States but remain below levels seen during the summer and last winter’s surges, according to the New York Times. The increase is still being driven by the Delta variant, though it remains unclear how the Omicron variant, which has been detected in 27 states, could affect the trends in the coming weeks.
During the past week, the United States has reported an average of more than 120,000 new cases each day, the newspaper reported, which is an increase of 38% from two weeks ago.
The daily average of COVID-19 hospitalizations is around 64,000, which marks an increase of 22% from two weeks ago. More than 1,300 deaths are being reported each day, which is up 26%.
Numerous states are reporting double the cases from two weeks ago, stretching across the country from states in the Northeast such as Connecticut and Rhode Island to southern states such as North Carolina and Texas and western states such as California.
The Great Lakes region and the Northeast are seeing some of the most severe increases, the newspaper reported. New Hampshire leads the United States in recent cases per capita, and Maine has reported more cases in the past week than in any other seven-day period during the pandemic.
Michigan has the country’s highest hospitalization rate, and federal medical teams have been sent to the state to help with the surge in patients, according to The Detroit News. Michigan’s top public health officials described the surge as a “critical” and “deeply concerning” situation on Dec. 10, and they requested 200 more ventilators from the Strategic National Stockpile.
Indiana, Maine, and New York have also requested aid from the National Guard, according to USA Today. Health officials in those states urged residents to get vaccines or booster shots and wear masks in indoor public settings.
The Omicron variant can evade some vaccine protection, but booster shots can increase efficacy and offer more coverage, Anthony Fauci, MD, director of the National Institute of Allergy and Infectious Diseases, said Dec. 12.
“If you want to be optimally protected, absolutely get a booster,” he said on ABC’s “This Week.”
In addition, New York Gov. Kathy Hochul has announced a statewide mask mandate, which will take effect Dec. 13. Masks will be required in all indoor public spaces and businesses, unless the location implements a vaccine requirement instead, the news outlet reported.
A version of this article first appeared on WebMD.com.
Beta-thalassemia gene therapy achieves lasting transfusion independence
, an investigator reported at the annual meeting of the American Society of Hematology.

Among patients who received betibeglogene autotemcel (beti-cel) in a phase 3 trial and enrolled in a long-term follow-up study, nearly 90% achieved durable transfusion independence, according to Alexis A. Thompson, MD, MPH, of the hematology section at the Ann & Robert H. Lurie Children’s Hospital of Chicago.
The median duration of ongoing transfusion independence was nearly 3 years as of this report, which Dr. Thompson described in a press conference at the meeting.
In a subanalysis of this international study, Dr. Thompson and co-investigators reported that in patients who achieve transfusion independence, chelation reduced iron, and iron markers stabilized even after chelation was stopped.
Beyond 2 years post-infusion, no adverse events related to the drug product were seen. This suggested that the therapy has a favorable long-term safety profile, according to Dr. Thompson.
“At this point, we believe that beti-cel is potentially curative for patients with TDT [transfusion-dependent beta-thalassemia],” Dr. Thompson said in the press conference.
This study answers one of the major outstanding questions about beti-cel and iron metabolism, according to Arielle L. Langer, MD, MPH, an instructor in medicine at Harvard Medical School and attending physician for adult thalassemia patients at Brigham and Women’s and Dana Farber Cancer Institute, both in Boston.
“Seeing the restoration of iron metabolism, it really takes us a step closer to really thinking the term ‘cure’ might truly apply,” Dr. Langer said in an interview.
Dr. Langer said she looks forward to “very long-term outcomes” of beti-cel-treated patients to see whether endocrinopathies and other long-term sequelae of TDT are also abated.
“This [study] is a great intermediate point, but really, when we think about how thalassemia harms and kills our patients, we really sometimes measure that in decades,” she said.
Beta-thalassemia is caused by mutations in the beta-globin gene, resulting in reduced levels of hemoglobin. Patients with TDT, the most serious form of the disease, have severe anemia and are often dependent on red blood cell transfusions from infancy onward, Dr. Thompson said.
With chronic transfusions needed to maintain hemoglobin levels, TDT patients inevitably experience iron overload, which can lead to organ damage and can be fatal. Consequently, patients will require lifelong iron chelation therapy, she added.
Beti-cel, an investigational ex vivo gene addition therapy currently under review by the U.S. Food and Drug Administration, involves adding functional copies of a modified form of the beta-globin gene into a patient’s own hematopoietic stem cells. Once those cells are reinfused, patients may produce adult hemoglobin at levels that eliminate the need for transfusions, according to Dr. Thompson.
At the meeting, Dr. Thompson reported on patients from two phase 1/2 and two phase 3 beti-cel clinical trials who subsequently enrolled in LTF-303, a 13-year follow-up study of the gene therapy’s safety and efficacy.
A total of 57 patients were included in this report, making it the largest gene therapy program to date in any blood disorder, according to Dr. Thompson. Before receiving beti-cel, the patients, who had a broad range of thalassemia genotypes, were receiving between 10 and almost 40 red blood cell transfusions per year, she reported.
Patients ranged in age from 5 to 35 years. The median age in the phase 1/2 studies was 20 years, while in the phase 3 studies it was 15 years.
“The early experience in the phase 1/2 trials allowed us to be more comfortable with enrolling more children, and that has actually helped us to understand safety and efficacy and children in the phase 3 setting,” Dr. Thompson said.
Fertility preservation measures had been undertaken by about 59% of patients from the phase 1/2 studies and 71% of patients from the phase 3 studies, the data show.
Among patients from the phase 3 beti-cel studies who could be evaluated, 31 out of 35 (or 89%) achieved durable transfusion independence, according to the investigator.
The median duration of ongoing transfusion independence was 32 months, with a range of about 18 to 49 months, she added.
Dr. Thompson also reported a subanalysis intended to assess iron status in 16 patients who restarted and then stopped chelation. That subanalysis demonstrated iron reduction in response to chelation, and then stabilization of iron markers after chelation was stopped. Post-gene therapy chelation led to reductions in liver iron concentration and serum ferritin that remained relatively stable after chelation was stopped, she said.
Serious adverse events occurred in eight patients in the long-term follow-up study. However, adverse events related to beti-cel have been absent beyond 2 years post-infusion, according to Dr. Thompson, who added that there have been no reported cases of replication-competent lentivirus, no clonal expansion, no insertional oncogenesis, and no malignancies observed.
“Very reassuringly, there have been 2 male patients, one of whom underwent fertility preservation, who report having healthy children with their partners,” she added.
Dr. Thompson provided disclosures related to Baxalta, Biomarin, bluebird bio, Inc., Celgene/BMS, CRISPR Therapeutics, Vertex, Editas, Graphite Bio, Novartis, Agios, Beam, and Global Blood Therapeutics.
, an investigator reported at the annual meeting of the American Society of Hematology.
Among patients who received betibeglogene autotemcel (beti-cel) in a phase 3 trial and enrolled in a long-term follow-up study, nearly 90% achieved durable transfusion independence, according to Alexis A. Thompson, MD, MPH, of the hematology section at the Ann & Robert H. Lurie Children’s Hospital of Chicago.
The median duration of ongoing transfusion independence was nearly 3 years as of this report, which Dr. Thompson described in a press conference at the meeting.
In a subanalysis of this international study, Dr. Thompson and co-investigators reported that in patients who achieve transfusion independence, chelation reduced iron, and iron markers stabilized even after chelation was stopped.
Beyond 2 years post-infusion, no adverse events related to the drug product were seen. This suggested that the therapy has a favorable long-term safety profile, according to Dr. Thompson.
“At this point, we believe that beti-cel is potentially curative for patients with TDT [transfusion-dependent beta-thalassemia],” Dr. Thompson said in the press conference.
This study answers one of the major outstanding questions about beti-cel and iron metabolism, according to Arielle L. Langer, MD, MPH, an instructor in medicine at Harvard Medical School and attending physician for adult thalassemia patients at Brigham and Women’s and Dana Farber Cancer Institute, both in Boston.
“Seeing the restoration of iron metabolism, it really takes us a step closer to really thinking the term ‘cure’ might truly apply,” Dr. Langer said in an interview.
Dr. Langer said she looks forward to “very long-term outcomes” of beti-cel-treated patients to see whether endocrinopathies and other long-term sequelae of TDT are also abated.
“This [study] is a great intermediate point, but really, when we think about how thalassemia harms and kills our patients, we really sometimes measure that in decades,” she said.
Beta-thalassemia is caused by mutations in the beta-globin gene, resulting in reduced levels of hemoglobin. Patients with TDT, the most serious form of the disease, have severe anemia and are often dependent on red blood cell transfusions from infancy onward, Dr. Thompson said.
With chronic transfusions needed to maintain hemoglobin levels, TDT patients inevitably experience iron overload, which can lead to organ damage and can be fatal. Consequently, patients will require lifelong iron chelation therapy, she added.
Beti-cel, an investigational ex vivo gene addition therapy currently under review by the U.S. Food and Drug Administration, involves adding functional copies of a modified form of the beta-globin gene into a patient’s own hematopoietic stem cells. Once those cells are reinfused, patients may produce adult hemoglobin at levels that eliminate the need for transfusions, according to Dr. Thompson.
At the meeting, Dr. Thompson reported on patients from two phase 1/2 and two phase 3 beti-cel clinical trials who subsequently enrolled in LTF-303, a 13-year follow-up study of the gene therapy’s safety and efficacy.
A total of 57 patients were included in this report, making it the largest gene therapy program to date in any blood disorder, according to Dr. Thompson. Before receiving beti-cel, the patients, who had a broad range of thalassemia genotypes, were receiving between 10 and almost 40 red blood cell transfusions per year, she reported.
Patients ranged in age from 5 to 35 years. The median age in the phase 1/2 studies was 20 years, while in the phase 3 studies it was 15 years.
“The early experience in the phase 1/2 trials allowed us to be more comfortable with enrolling more children, and that has actually helped us to understand safety and efficacy and children in the phase 3 setting,” Dr. Thompson said.
Fertility preservation measures had been undertaken by about 59% of patients from the phase 1/2 studies and 71% of patients from the phase 3 studies, the data show.
Among patients from the phase 3 beti-cel studies who could be evaluated, 31 out of 35 (or 89%) achieved durable transfusion independence, according to the investigator.
The median duration of ongoing transfusion independence was 32 months, with a range of about 18 to 49 months, she added.
Dr. Thompson also reported a subanalysis intended to assess iron status in 16 patients who restarted and then stopped chelation. That subanalysis demonstrated iron reduction in response to chelation, and then stabilization of iron markers after chelation was stopped. Post-gene therapy chelation led to reductions in liver iron concentration and serum ferritin that remained relatively stable after chelation was stopped, she said.
Serious adverse events occurred in eight patients in the long-term follow-up study. However, adverse events related to beti-cel have been absent beyond 2 years post-infusion, according to Dr. Thompson, who added that there have been no reported cases of replication-competent lentivirus, no clonal expansion, no insertional oncogenesis, and no malignancies observed.
“Very reassuringly, there have been 2 male patients, one of whom underwent fertility preservation, who report having healthy children with their partners,” she added.
Dr. Thompson provided disclosures related to Baxalta, Biomarin, bluebird bio, Inc., Celgene/BMS, CRISPR Therapeutics, Vertex, Editas, Graphite Bio, Novartis, Agios, Beam, and Global Blood Therapeutics.
FROM ASH 2021
What is the diagnosis?
As the lesion was growing, getting more violaceous and indurated, a biopsy was performed. The biopsy showed multiple discrete lobules of dermal capillaries with slight extension into the superficial subcutis. Capillary lobules demonstrate the “cannonball-like” architecture often associated with tufted angioma, and some lobules showed bulging into adjacent thin-walled vessels. Spindled endothelial cells lining slit-like vessels were present in the mid dermis, although this comprises a minority of the lesion. The majority of the subcutis was uninvolved. The findings are overall most consistent with a tufted angioma.
Kaposiform hemangioendothelioma (KHE) has been considered given the presence of occasional slit-like vascular spaces; however, the lesion is predominantly superficial and therefore the lesion is best classified as tufted angioma. GLUT–1 staining was negative.
At the time of biopsy, blood work was ordered, which showed a normal complete blood count with normal number of platelets, slightly elevated D-dimer, and slightly low fibrinogen. Several repeat blood counts and coagulation tests once a week for a few weeks revealed no changes.
The patient was started on aspirin at a dose of 5 mg/kg per day. After a week on the medication the lesion was starting to get smaller and less red.
Tufted angiomas are a rare type of vascular tumor within the spectrum of kaposiform hemangioendotheliomas. Most cases present within the first year of life; some occur at birth. They usually present as papules, plaques, or erythematous, violaceous indurated nodules on the face, neck, trunk, and extremities. The lesions can also be present with hyperhidrosis and hypertrichosis. Clinically, the lesions will have to be differentiated from other vascular tumors such as infantile hemangiomas, congenital hemangiomas, and Kaposi’s sarcoma, as well as subcutaneous fat necrosis of the newborn, cellulitis, and nonaccidental trauma.
Pathogenesis of tufted angiomas is poorly understood. A recent case report found a somatic mutation on GNA14.This protein regulates Ras activity and modulates endothelial cell permeability and migration in response to FGF2 and VEGFA. The p.205L mutation causes activation of GNA14, which upregulates pERK-MAPK pathway, suggesting MAPK inhibition as a potential target for therapy. Clinically, tufted angioma can present in three patterns: uncomplicated tufted angioma (most common type); tufted angioma without thrombocytopenia but with chronic coagulopathy, as it was seen in our patient; and tufted angioma associated with Kasabach-Merritt phenomenon (KMP). KMP is characterized by thrombocytopenia in association with microangiopathic hemolytic anemia, consumptive coagulopathy, and enlarging vascular tumor. Treatment of uncomplicated tufted angioma will depend on symptomatology, size, and location of the lesion. Smaller lesions in noncosmetically sensitive areas can be treated with surgical excision. Cases that are not amenable to excision can be treated with aspirin. There are also reports of response to topical modalities including tacrolimus and timolol. For complicated cases associated with KMP, sirolimus, systemic corticosteroids, ticlopidine, interferon, or vincristine are recommended. Some lesions may demonstrate spontaneous regression.
Dr. Matiz is a pediatric dermatologist at Southern California Permanente Medical Group, San Diego.
References
Cohen S et al. Dermatol Online J. 2019 Sep 15;25(9):13030/qt6pv254mc.
Lim YH et al. Pediatr Dermatol. 2019 Nov;36(6):963-4.
Prasuna A, Rao PN. Indian Dermatol Online J. 2015;6:266-8.
A 35-day-old female was referred to our pediatric dermatology clinic for evaluation of a red lesion on the right arm. The lesion presented at about 4 days of life as a red plaque (image 1 at 8 days of life).

On the following days, the lesion started growing but it didn't seem to be tender or bothersome to the patient (image 2, at 35 days of life).
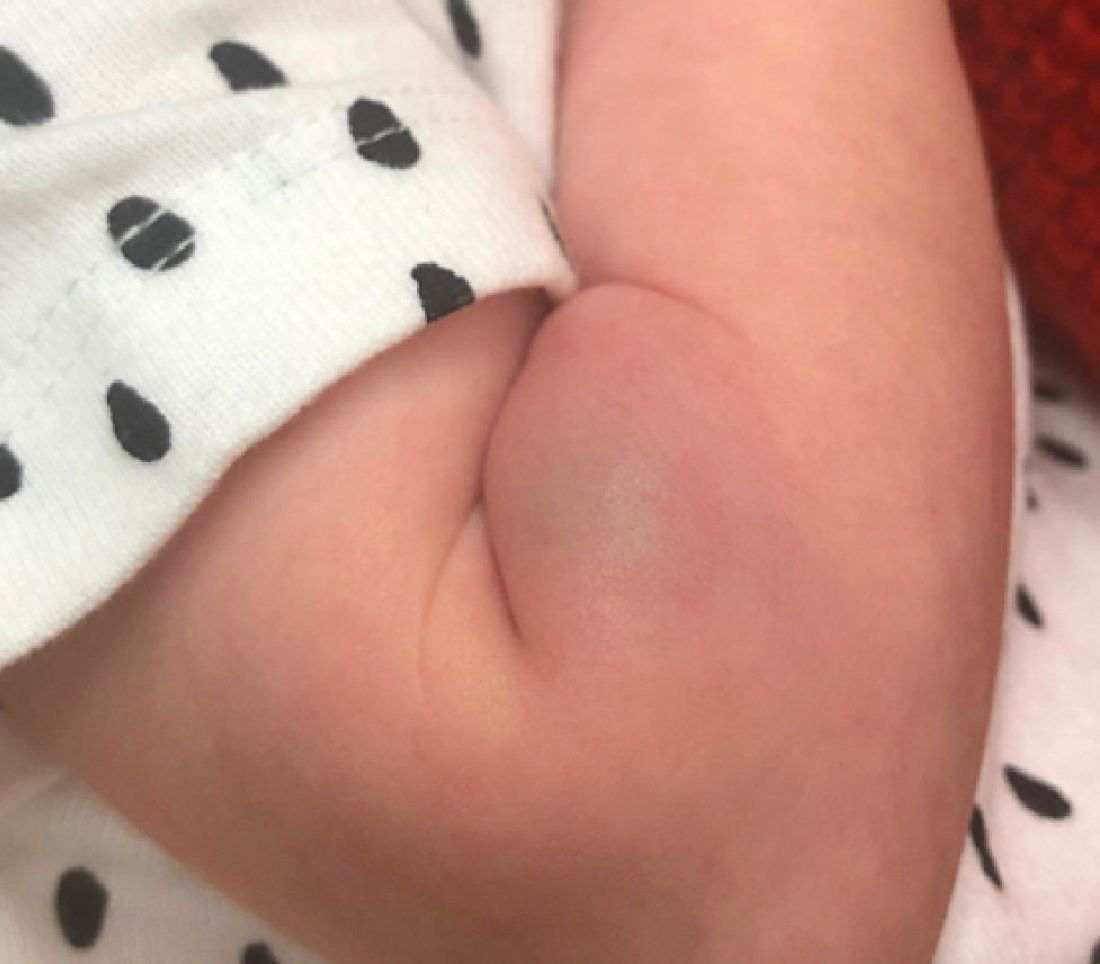
At a 2-week follow up the lesion was getting fuller and more violaceous. There was no history of fever and the lesion didn't appear tender to the touch.
She was born via normal spontaneous vaginal delivery. There were no complications and the mother received prenatal care.
On exam she had a red to violaceous nodule on the right arm (image 3 at 45 days of life).

IDF Atlas: 1 in 10 adults worldwide now has diabetes
One in 10 adults worldwide currently has diabetes, accounting for an estimated global health expenditure of $966 billion in U.S. dollars in 2021, according to the new International Diabetes Federation Diabetes Atlas.
The IDF Atlas, 10th edition, was published online Dec. 6, 2021.
Highlights from it were presented during two sessions at the IDF Virtual Congress 2021, covering global diabetes incidence and prevalence, mortality, and costs, as well as new sections in this edition devoted to adult-onset type 1 diabetes, childhood-onset type 2 diabetes, and the interactions between diabetes and COVID-19.
More detailed data from some of the Atlas chapters were also published Dec. 6, 2021, in separate papers in the IDF journal Diabetes Research and Clinical Practice, with more publications planned.
Information for the Atlas comes from peer-reviewed literature, unpublished reports, and national registries. This latest edition includes 219 data sources from 144 countries, with figures for other countries extrapolated.
Atlas cochair Dianna Magliano, PhD, reviewed some of the highlights. Half of those currently with diabetes, or about 240 million adults, are undiagnosed, and another 319 million have impaired fasting glucose. Over three-quarters of all adults with diabetes now live in low- and middle-income countries. And about 6.7 million deaths in 2021 can be attributed to diabetes.
The Atlas also predicts increases in these numbers over the coming decades if current trends continue.
“Our data and projections tell a sobering story. Diabetes prevalence is expected to increase globally. The number of adults with diabetes will rise from 537 million in 2021 to 786 million ... by the year 2045, an increase of 46%. Rises are expected in every region of the world, with the largest increases expected to occur in the regions of Africa, the Middle East, and Southeast Asia,” said Dr. Magliano, head of diabetes and population health at the Baker Heart and Diabetes Institute, Melbourne.
Since 2019, when the last Atlas was published, the 2021 numbers represent increases of 73.6 million more adults with diabetes including 7.8 million more undiagnosed, 2.5 million more deaths attributed to diabetes, and an additional global expenditure of $206 billion.
Increases have also occurred in the number of people with prediabetes, children with type 1 diabetes, and pregnancies affected by diabetes, Dr. Magliano reported.
“There is a strong need for effective intervention strategies and policies to stall the increase in the number of people developing diabetes across the world,” she added.
Projected rise in expenditures for diabetes will be ‘unsustainable’
The current $966 billion global health expenditure caused by diabetes represents a 316% increase from the $232 billion reported in 2006, according to William H. Herman, MD, professor of internal medicine and epidemiology at the University of Michigan, Ann Arbor.
By region, 43% of current diabetes-related global expenditures are in North America, 25% in the Western Pacific, and 20% in Europe, while 12% are from the regions of South and Central America, North Africa, Africa, and Southeast Asia combined, Herman said.
The direct costs of diabetes are projected to grow to $1054 billion in 2045, an increase of just 9% over 25 years. The reason for the far lower increase going forward, compared with the tripling in the 15 years prior, is because of the anticipated diabetes rise in regions of the world where per-person spending on diabetes is low, a situation Dr. Herman called “unsustainable.”
“The keys to controlling the global costs of diabetes care are diabetes prevention and providing effective care to the largest number of people at the lowest possible cost,” he said.
Diabetes-related mortality: Some shifts since 2019
One third of the current 6.7 million diabetes-related deaths in 2021 were in people younger than 60 years, said Elbert S. Huang, MD, professor of medicine and public health sciences at the University of Chicago.
Overall, diabetes accounted for 11.8% of total global deaths in people younger than 60 years, but that varied widely, from 24.5% in the Middle East/North Africa to just 6.9% in Southeast Asia.
The regions with the highest number of diabetes-related deaths in people younger than 60 years in 2021 were the Western Pacific and the Middle East/North Africa, a major change from just 2 years ago, when Southeast Asia and Africa saw the greatest numbers of diabetes-related deaths in working-age adults.
“These findings mirror recent reports on inadequate uptake of diabetes prevention programs as well as stagnant quality of care trends for the past decade and reemphasize the need to address noncommunicable diseases across the globe,” Dr. Huang said.
Diabetes and COVID-19: Other factors partly explain the increased risk
Gillian Booth, MD, summarized the current literature on COVID-19 and diabetes including a meta-analysis her group conducted of 300 studies from around the world, with 58% from high-income countries.
The risk for increased COVID-19 severity in people with diabetes could be at least partly explained by factors such as age, sex, and comorbidities, said Dr. Booth, professor in the department of medicine and the Institute of Health Policy, Management, and Evaluation at the University of Toronto.
For example, the unadjusted pooled odds of hospitalization with COVID-19 in patients with diabetes, compared with those without diabetes, was 3.69, but dropped to 1.73 after adjustment for age, sex, and having one or more comorbidities. For COVID-19–related death, those odds ratios were 2.32 unadjusted versus 1.59 adjusted. In both cases, the values were still significant after adjustment, she emphasized.
Overall, hyperglycemia and hemoglobin A1c at admission emerged as significant independent predictors of severe outcomes.
“Further research is needed to understand the interplay between COVID-19 and diabetes and how best to address the disproportionate burden of COVID-19 among people living with diabetes,” she stressed.
Adult-onset type 1 diabetes: Growing recognition of the burden
Ascertainment of data for both adult-onset type 1 and type 2 diabetes in youth was subject to significant limitations.
For adult-onset type 1 diabetes, Jessica Harding, PhD, pointed to the fact that the epidemiology of adult-onset type 1 diabetes hasn’t been well characterized because of the historical focus on children, the difficulty of distinguishing it from type 2 diabetes in adults, and that many registries simply don’t include incident data across the lifespan for type 1 diabetes.
Nonetheless, she said, “there is growing recognition of the burden of adult-onset type 1,” noting that the American Diabetes Association and European Association for the Study of Diabetes just published a consensus statement addressing the topic.
A systematic review of 46 studies representing 32 countries or regions revealed that countries with the highest incidence of type 1 diabetes onset per population of 100,000 ages 20 or above were Eritrea, at 46.2, followed by Sweden and Ireland, both at 30.6, and Finland, at 0. The lowest rates were in Asian countries.
While the Nordic countries (Finland, Sweden, and Norway) are among the top for incidence of both childhood-onset (0-14 years) and adult-onset type 1 diabetes, Eritrea isn’t even among the top 10 for childhood onset.
The unusual situation in Eritrea is the subject of current study but the reasons aren’t yet clear, noted Dr. Magliano, of Emory University, Atlanta, during the question-and-answer period.
And only seven studies, 15%, used biomarkers to determine type 1 diabetes status, suggesting “there is a pressing need to improve the quality and quantity of information on adult-onset type 1 diabetes, particularly in those low- and middle-income countries,” Dr. Harding said.
Type 2 diabetes in youth: A call for better data
When presenting the data for childhood-onset type 2 diabetes, Andrea Luk, MD, noted: “The onset of advanced complications during the most productive time of life has significant impact on individuals, communities, and health economies.”
In 19 studies, the highest reported prevalence of type 2 diabetes in youth was in Brazil, Mexico, indigenous populations of the United States and Canada, and the Black population in the United States, with rates ranging from 160 per 100,000 to 3300 per 100,000. The lowest prevalence rates of 0.6 per 100,000 to 2.7 per 100,000 were reported in Europe. Incidence data were similar, with the highest rates from 31 per 100,000 to 94 per 100,000 and the lowest 0.1 per 100,000 to 0.8 per 100,000 per year.
Of note, Dr. Luk pointed out that childhood obesity is an important factor but not the only one.
“Some populations that have a low prevalence of obesity, such as East Asians, reported higher incidence rates of youth-onset type 2 diabetes than populations with a greater burden of childhood obesity.”
There was variability in incidence rates for youth of similar ethnic background but from different countries. “Apart from genetic predisposition and background obesogenic environment, disparity in socioeconomic status, access to health care, and cultural practices are other contributors to differences in risk of type 2 diabetes in youth,” noted Dr. Luk, associate professor in the division of endocrinology, Department of Medicine and Therapeutics, Chinese University of Hong Kong.
She also noted that the incidence of type 2 diabetes was extremely low in prepubertal children and rises gradually during puberty, and that the incidence is higher in girls than boys but that reverses in adulthood.
Compared with adults with type 2 diabetes, youth with type 2 diabetes had a more adverse glycemic trajectory and higher rates of metformin failure.
And compared with youth with type 1 diabetes, those with type 2 diabetes had more adverse metabolic profiles and higher rates of vascular complications.
“A strong call must be made for the collection of trend data to assess global burden of type 2 diabetes in youth,” she concluded.
Dr. Luk reported serving as an advisory panel member for and/or receiving research support from Amgen, AstraZeneca, Boehringer Ingelheim, Sanofi, the Asia Diabetes Foundation, Bayer, Lee’s Pharmaceutical, MSD, Novo Nordisk, Roche, Sugardown, and Takeda. The other authors reported no relevant financial relationships.
A version of this article first appeared on Medscape.com.