User login
News and Views that Matter to Pediatricians
The leading independent newspaper covering news and commentary in pediatrics.
Which specialties get the biggest markups over Medicare rates?
Anesthesiologists charge private insurers more than 300% above Medicare rates, a markup that is higher than that of 16 other specialties, according to a study released by the Urban Institute.
The Washington-based nonprofit institute found that the lowest markups were in psychiatry, ophthalmology, ob.gyn., family medicine, gastroenterology, and internal medicine, at 110%-120% of Medicare rates. .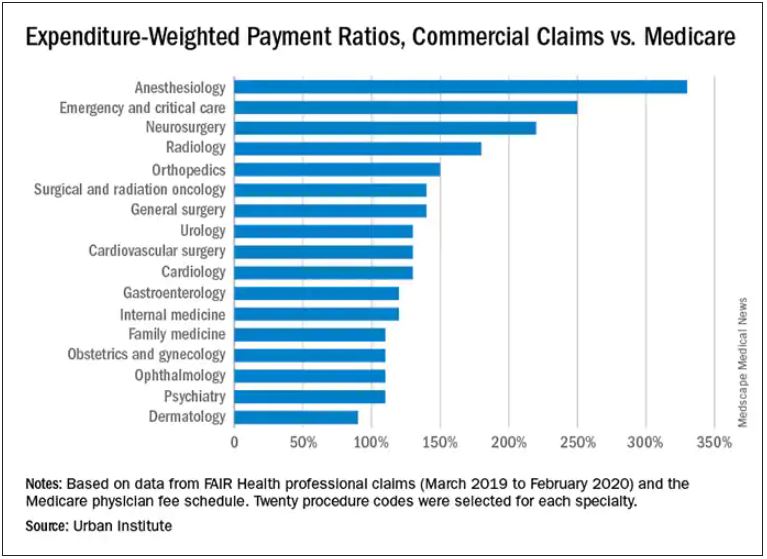
In the middle are cardiology and cardiovascular surgery (130%), urology (130%), general surgery, surgical and radiation oncology (all at 140%), and orthopedics (150%).
At the top end were radiology (180%), neurosurgery (220%), emergency and critical care (250%), and anesthesiology (330%).
The wide variation in payments could be cited in support of the idea of applying Medicare rates across all physician specialties, say the study authors. Although lowering practitioner payments might lead to savings, it “will also create more pushback from providers, especially if these rates are introduced in the employer market,” write researchers Stacey McMorrow, PhD, Robert A. Berenson, MD, and John Holahan, PhD.
It is not known whether lowering commercial payment rates might decrease patient access, they write.
The authors also note that specialties in which the potential for a fee reduction was greatest were also the specialties for which baseline compensation was highest – from $350,000 annually for emergency physicians to $800,000 a year for neurosurgeons. Annual compensation for ob.gyns., dermatologists, and opthalmologists is about $350,000 a year, which suggests that “these specialties are similarly well compensated by both Medicare and commercial insurers,” the authors write.
The investigators assessed the top 20 procedure codes by expenditure in each of 17 physician specialties. They estimated the commercial-to-Medicare payment ratio for each service and constructed weighted averages across services for each specialty at the national level and for 12 states for which data for all the specialties and services were available.
The researchers analyzed claims from the FAIR Health database between March 2019 and March 2020. That database represents 60 insurers covering 150 million people.
Pediatric and geriatric specialties, nonphysician practitioners, out-of-network clinicians, and ambulatory surgery center claims were excluded. Codes with modifiers, J codes, and clinical laboratory services were also not included.
The charges used in the study were not the actual contracted rates. The authors instead used “imputed allowed amounts” for each claim line. That method was used to protect the confidentiality of the negotiated rates.
With regard to all specialties, the lowest compensated services were procedures, evaluation and management, and tests, which received 140%-150% of the Medicare rate. Treatments and imaging were marked up 160%. Anesthesia was reimbursed at a rate 330% higher than the rate Medicare would pay.
The authors also assessed geographic variation for the 12 states for which they had data.
Similar to findings in other studies, the researchers found that the markup was lowest in Pennsylvania (120%) and highest in Wisconsin (260%). The U.S. average was 160%. California and Missouri were at 150%; Michigan was right at the average.
For physicians in Illinois, Louisiana, Colorado, Texas, and New York, markups were 170%-180% over the Medicare rate. Markups for clinicians in New Jersey (190%) and Arizona (200%) were closest to the Wisconsin rate.
The authors note some study limitations, including the fact that they excluded out-of-network practitioners, “and such payments may disproportionately affect certain specialties.”
A version of this article first appeared on Medscape.com.
Autism prevalence in children as high as 10% in some New Jersey communities
Investigators found that up to 10% of children in some of the state’s school districts have an ASD diagnosis vs. the national average of just under 2%.
School districts with higher ASD prevalence in the study have expansive health and educational programs in place to diagnose and support children with ASD, which likely contributed to the higher caseloads, senior investigator Walter Zahorodny, PhD, associate professor of pediatrics at New Jersey Medical School in Newark, said in an interview.
“When you have those players on the ground, it’s likely we’re going to be finding more, if not almost all, of the children with autism in a given district,” said Dr. Zahorodny, director of the New Jersey Autism Study for the Centers for Disease Control and Prevention.
The study was published online Oct. 21 in the journal Autism Research.
Local analysis
Researchers used the Autism and Developmental Disabilities Monitoring (ADDM) Network, a surveillance method developed by the CDC that includes data collected from health and special education records of children living in 11 communities across the United States. New Jersey is one of the ADDM participating sites.
National data are important, but Dr. Zahorodny and colleagues wanted to examine ASD prevalence at a more granular level, comparing prevalence district by district.
They examined data from 5,453 children who were 8 years old in 2016 and attended public school in Essex, Hudson, Ocean, and Union counties.
The prevalence of ASD was 36 children per 1,000 overall. Hudson County reported the lowest rate, at 31 cases per 1,000 children, and Ocean County reported the highest, at 54 cases per 1,000 children.
Across the region, ASD prevalence was four times higher in boys vs. girls, mirroring national statistics.
High ASD prevalence was more likely in mid-socioeconomic status districts (prevalence ratio [PR], 1.2; P = .01) and in larger school districts (PR, 1.3; P = .004).
Hispanic children had significantly lower ASD prevalence overall compared with White children (PR, 0.6; P < .001). In fact, prevalence was 30%-60% lower among Hispanic children in three of four counties compared with White children.
Another study is underway to better understand why autism rates were lower in specific districts and Hispanic children overall, but Dr. Zahorodny said one possibility is a lack of resources in those districts.
Will new methodology miss cases?
The study’s methodology was used by the CDC from 2000 to 2016 and includes assessment of children who have an ASD diagnosis, and children who haven’t received a diagnosis but have documented behaviors consistent with ASD.
In 2018, it was replaced with a less comprehensive approach that relies only on children with an ASD diagnosis. Data using this new methodology have not yet been reported.
In the new study from New Jersey, 767 children with autism were diagnosed by a pediatrician, neurologist, or other community provider. The remaining 175 children with autism, 18.6% of the total cohort, did not have an ASD diagnosis but met the ADDM case definition.
Under the new methodology, those children would not be counted.
“Something could be lost in the new methodology in terms of usefulness of the information because when the estimates are incomplete or low, that might lead people to make the wrong judgments when they make decisions about resources,” Dr. Zahorodny said.
The study was funded by the Centers for Disease Control and Prevention and the National Institutes of Health. The study authors report no relevant financial relationships.
A version of this article first appeared on Medscape.com.
Ohio records more deaths than births for first time
In 2020, around 143,661 Ohioans died and 129,313 Ohioans were born, according to The Columbus Dispatch. The trend appears to have continued so far this year, with 107,462 deaths and 100,781 births reported to date.
Deaths haven’t surpassed births in the 112 years since the state began compiling data in 1909, the newspaper reported. The state’s birth rate has been declining for years while the number of deaths has risen, though data shows that the COVID-19 pandemic accelerated the shift.
“It doesn’t surprise me at all,” Joseph Gastaldo, MD, the medical director of infectious diseases for OhioHealth, told the newspaper.
Ohio’s birth rate fell by 4% in 2020, which defied public expectations about a pandemic birth boom. In addition, the state reported 13,927 COVID-19 deaths throughout the year.
“It’s COVID, clearly,” he noted.
Alabama also recorded more deaths than births for the first time last year, according to The New York Times. The state reported 64,714 deaths and 57,641 births in 2020.
“Our state literally shrunk in 2020,” Scott Harris, MD, the state health officer for Alabama, said at a news conference in September.
The state had never recorded a gap that large, even during World War I, World War II, and the 1918 flu pandemic, he said. Alabama has kept records on the numbers since 1900.
“We’ve never had a time when deaths exceeded births,” Dr. Harris said.
In fact, about half of U.S. states reported death rates higher than birth rates in 2020, according to a recent study from researchers at the University of New Hampshire. In 2019, only five states --Maine, New Hampshire, Rhode Island, Vermont, and West Virginia -- reported more deaths than births.
In 2020, the United States reported a record of nearly 3.4 million deaths, which was 18% more than in 2019, the researchers found. COVID-19 was the primary reason for the increase in deaths, accounting for about 11% of total deaths. Meanwhile, births dropped by 4% to about 3.6 million.
The surplus of births over deaths added 229,000 people to the U.S. population in 2020, as compared to 892,000 in 2019, which means the country’s population growth slowed last year. The decline, paired with lower immigration rates during the pandemic, led to the smallest annual percentage population gain in at least 100 years.
“Deaths will likely exceed births again in many states in 2021,” Kenneth Johnson, PhD, a senior demographer and study author, wrote in a statement.
“How large or protracted these fertility declines and mortality increases will be remains to be seen, but they have already dramatically reduced population growth in the United States,” he said.
A version of this article first appeared on WebMD.com.
Hot temperatures in outdoor lockboxes increase sample errors
, according to results from a recent study published in the American Journal of Clinical Pathology.
“Our findings indicate that samples (centrifuged or not centrifuged) were impacted by extreme summer temperatures when stored for short periods of time inside commonly used steel lockboxes,” Joseph R. Wiencek, PhD, medical director of clinical chemistry, Vanderbilt University School of Medicine Core Laboratory in Nashville, said in an interview.
Dr. Wiencek and colleagues picked two dates during the summer of 2019 in a mid-Atlantic state to place two courier lockboxes (LabLocker-KF300) outside in hot temperatures (32º C) starting at 11 a.m., with one lockbox containing two 24-oz cold packs (Nordic NI24) and the other containing no cold packs. The researchers monitored the temperatures of each lockbox over the course of 4 hours.
Overall, eight participants had seven samples in lithium heparin drawn for two studies evaluating centrifuged or not centrifuged samples. In the first study, four participants had seven samples drawn, with one centrifuged sample serving as a control for each patient. The other six samples were wrapped in paper towels, placed in resealable plastic bags, and distributed evenly in the warm and cold lockboxes. The samples did not directly touch the cold packs in the cold lockbox. At 1 hour, 2 hours, and 4 hours, a participant’s sample was removed from each lockbox and centrifuged.
In the second study, another four participants had seven samples drawn. As in the first study, all samples were centrifuged and placed in the lockboxes. For both studies, when samples were centrifuged, plasma from samples was left on the gel barrier when analyzed for concentrations of C-reactive protein, a comprehensive metabolic panel, lactate dehydrogenase (LDH), a lipid panel, magnesium, and phosphorus (Abbott Architect c16000).
In the study of uncentrifuged samples, Dr. Wiencek and colleagues found that when the temperature outside ranged from 28.2º to 44.0º C (mean 40.4º C), the temperature of the cold lockbox was between 16.5º to 22.3º C (mean 22.3º C). The temperature ranged between 34.4º to 46.9º C (mean 42.6º C) in the warm lockbox. For centrifuged samples, the cold lockbox temperature was between 12.2º to 23.0º C (mean 18.0º C) and the warm lockbox was between 25. to 40.8º C (mean 35.2º C) when the outdoor temperature ranged from 27.2º to 46.3º C (mean 37.9º C).
The researchers also calculated the significant change limit (SCL) for each analyte in each sample, finding that aspartate aminotransferase, glucose, LDH, and potassium significantly exceeded the SCL in both the centrifuged and uncentrifuged samples, with the greatest changes seen at the 4-hour timepoint for samples in the warm lockbox (P < .05 for all).
Lockbox instructions are “consistently inconsistent”
In viewing instructions for lockboxes across institutions, Dr. Wiencek said the “outdoor courier lockbox instructions among private, academic and reference laboratories were consistently inconsistent.” For example, no laboratories cited time restrictions for samples in lockboxes, and their descriptions on the number of cold packs a laboratory should use and where the lockbox should be placed varied. The inconsistencies “highlighted the emergent need for standardization and guidance documents for institutions to implement,” Dr. Wiencek said.
One unanswered question is how widespread the problem is. It is unclear how many outdoor courier lockboxes are currently in use in the United States or globally; however, experts agreed it was a common occurrence, with some of the largest laboratory service providers offering outdoor courier lockboxes to their clients.
“Courier lockboxes are everywhere. All you need to do is walk around your clinics that are at your hospitals or clinics located around your grocery store to find them,” Dr. Wiencek said. “Some hang on doors, while others can be found on the ground in direct sunlight on a hot summer day.”
What’s more, institutions may not realize how leaving samples outdoors for extended periods can affect results. “Care teams are commonly unaware that samples placed in these poorly designed lockboxes can experience extreme summer or winter temperatures that may lead to incorrect results,” Dr. Wiencek said. “Healthcare providers need to understand the hidden dangers courier lockboxes have on the quality of their patient’s test results.”
Amy L. Pyle-Eilola, PhD, clinical chemistry director at Nationwide Children’s Hospital in Columbus, Ohio, said a major strength of the study by Dr. Wiencek and colleagues “is just that it was done at all.”
“I appreciate the real-world nature of this study and that it provides a snapshot of what conditions are really like in a lockbox in the summer,” she said in an interview.
In the clinical lab, receiving samples that had been sitting in a courier lockbox “is not uncommon,” Dr. Pyle-Eilola said.
“When I have encountered these situations, I have struggled to decide if it is still appropriate to run the tests. I always look to the medical literature for assistance with these situations, but there has been a paucity of information available on the impact of lockbox storage,” she explained.
The study by Dr. Wiencek and colleagues “provides some much-needed evidence for what is acceptable for lockbox storage conditions,” she said.
Areas of future research
Rodney E. Rohde, PhD, university distinguished chair and professor of the Clinical Laboratory Science (CLS) Program at Texas State University in San Marcos, said in an interview that the study “does a nice job of looking at multiple analytes and controlling for several variables,” but the sample size is small and the results may be difficult to generalize.
Dr. Pyle-Eilola highlighted another limitation — “a common shortcoming of these kinds of studies” — in the use of healthy donors for patient samples, which narrows the range of assay results.
“It is possible that more significant variation in results may be observed in additional analytes if the samples had higher concentrations of those analytes,” she said. “Moreover, this is clinically relevant as the samples stored in such lockboxes are not always from healthy individuals and have abnormal concentrations of analytes.”
Mario Plebani, MD, professor of clinical biochemistry and clinical molecular biology and chief of the department of laboratory medicine at University Hospital of Padova in Padova, Italy, agreed with that assessment.
“[T]he risks for errors and patient safety are higher for values near to the upper or lower reference value, and in general for samples collected in patients with particular diseases and clinical conditions,” he said in an interview.
“This paper deserves a commenting editorial to better highlight the urgent need for further studies on the same issue and in general on the risk in the pre-pre-analytical phase, including sample storage and transportation,” he noted.
Another area of future research is studying patient samples exposed to hotter or colder temperatures in outdoor courier lockboxes outside the mid-Atlantic area. “Here in Texas, temperatures can reach extreme heat levels,” Dr. Rohde said, who added that use of outdoor lockboxes is “very common in my region.”
Dr. Wiencek disclosed he has been a consultant on this research topic for Roche Diagnostics and received an honorarium for speaking on the subject from the American Association for Clinical Chemistry and American Society of Clinical Pathology. The other authors have no relevant conflict of interest. Dr. Pyle-Eilola, Dr. Rohde, and Dr. Plebani have disclosed no relevant financial relationships.
A version of this article first appeared on Medscape.com.
FDA panel votes to approve Pfizer’s vaccine for children
Seventeen of the 18 members of the Vaccines and Related Biological Products Advisory Committee (VRBPAC) on Oct. 26 voted to recommend the 10-microgram shot for kids, which is one-third the dose given to adults.
One member, Michael Kurilla, MD, director of the division of clinical innovation at the National Institutes of Health, Bethesda, Md., abstained from voting.
If the FDA follows the recommendation, as it typically does, and issues an Emergency Use Authorization for the vaccine, the shots could be available within days.
After the FDA’s final decision, the Centers for Disease Control and Prevention’s Advisory Committee on Immunization Practices will meet to make specific recommendations for its use. The CDC committee must stick closely to the conditions for use spelled out in the EUA, so their recommendations are likely to be similar to those made by the FDA. Their next meeting is scheduled for Nov. 2 and 3.
In the end, some on the panel felt uneasy with their decision.
“I voted yes primarily because I wanted to make sure that children who really need this vaccine, the Black and brown children of our country, get the vaccine,” said James Hildreth, MD, PhD, president and CEO of Meharry Medical College in Nashville.
“But to be honest, the best way to protect the health of some children will be to do nothing because they will be just fine,” he said.
Others said they were surprised by how difficult the decision had been.
“This is a much tougher one than we had expected going into it,” said committee member Eric Rubin, MD, editor and chief of the New England Journal of Medicine, during the FDA advisory committee’s meeting.
Ahead of the vote, the committee heard presentations outlining the expected benefits of vaccinating children along with potential risks.
“Children have been greatly impacted by the pandemic,” said Fiona Havers, MD, a medical officer with the CDC in Atlanta who reviewed the epidemiology of COVID-19 in kids.
In the second year of the pandemic, as more seniors have been vaccinated against the virus, COVID cases have largely shifted from older to younger age groups.
So far, there have been more than 1.9 million COVID-19 cases in children ages 5 through 11 in the United States.. Cases in kids saw a big jump in July and August with summer travel, schools reopening, and the dominance of the Delta variant.
And those are just the cases reported to the CDC. Regular testing of anonymous blood samples collected at sites across the United States indicates that 6 times as many kids have had COVID than what is reflected in official counts.
Last winter, blood sample testing showed about 13% of children had antibodies against the virus, suggesting they’d been infected. By this summer, that number had risen to 42%.
That figure clearly made an impression on many members of the committee who asked the FDA’s vaccine reviewers if they had tried to account for immunity from past infections in their modeling. They had not.
Some felt that even with a highly effective vaccine — new data presented by Pfizer showed the children’s dose was 90% effective at preventing symptomatic infections in kids — caution was warranted as much is still unknown about myocarditis, a rare side effect of the mRNA vaccines.
Myocarditis has been more common in younger age groups. It usually goes away over time but requires hospital care. It’s not known if myocarditis could have lingering effects for those who experience it.
There were no cases of myocarditis seen in Pfizer’s studies of the vaccine in children, and no other serious events were seen. Vaccine side effects reported in the Pfizer studies were mostly mild and included fatigue, headache, and pain at the injection site.
“We think we have optimized the immune response and minimized our reactions,” said William Gruber, MD, senior vice president vaccine research and clinical development at Pfizer.
But the studies didn’t include enough participants to pick up rare, but serious adverse events like myocarditis.
“We’re worried about a side effect that we can’t measure yet, but it’s probably real, and we see a benefit that isn’t the same as it is in older age groups,” said Dr. Rubin.
Benefits vs. risks
FDA modeled the benefits and risks for children under a variety of scenarios. The benefits of the vaccines to children very much depend on the amount of transmission in the community.
When transmission is high, the benefits to children — in terms of infections, hospitalizations, ICU admissions — clearly outweigh its risks.
But when COVID-19 rates are low in the community, as they were in June, FDA analysts predicted the vaccines might send more children to the hospital for myocarditis than the virus would.
The FDA noted that kids who are hospitalized for myocarditis tend not to be as ill as children with COVID-19, however.
“If the trends continue the way they are going, the emergency for children is not what we might think it would be. That was my concern,” Dr. Hildreth said.
But others warned against complacency.
“Thinking that this is going to be the end of the wave permanently may be a little overly optimistic,” said committee chairman Arnold Monto, MD, a professor of public health and epidemiology at the University of Michigan, Ann Arbor.
The majority of COVID-19 cases in children are mild. Only about 1% of kids are hospitalized for their infections, according to CDC data. But the rates of hospitalizations in kids are about 3 times higher for people of color — including Blacks, Hispanics, and Native Americans, as compared to Whites and Asian Americans.
Since the start of the pandemic, 94 children ages 5 to 11 have died, making it the eighth leading cause of death for kids this age last year.
More than 5,200 children have developed a delayed complication from their infections called Multi-System Inflammatory Syndrome (MIS-C).
MIS-C can be severe and require hospital care and can lead to myocarditis. Children ages 5 to 11 are the age group at greatest risk for this complication.
Kids can also get long COVID. There’s not a lot of data on how often this happens, though it appears to be less frequent in children than in adults.
But a survey in the United Kingdom found that 7%-8% of kids have symptoms from their infections that last longer than 12 weeks, Dr. Havers said. Symptoms that can linger for kids include fatigue, cough, muscle and joint pain, headaches, and insomnia.
More than 1 million children have been impacted by school closures so far this year, and quarantines have had lasting impacts on learning, social development, and mental health.
Even though kids aren’t usually COVID superspreaders, they can still pass the infection on to others.
“What is clear is that secondary transmission from children, both to other children and to adults, does occur,” Dr. Havers said.
For that reason, they can continue the spread of the virus and give it opportunities to mutate and become more dangerous.
Safety monitoring to continue
Some committee members referenced thousands of letters they had received within the past few days urging them to vote against the vaccine.
Jay Portnoy, MD, a professor of pediatrics at Children’s Mercy Hospital in Kansas City, Mo., said he had personally received about 4,000 emails.
“But I feel like I need to also represent the consumers, the parents that I see every day in the clinic who are terrified of sending their children to school because they’re not protected against COVID,” he said, explaining his vote to recommend authorization.
“Our kids are going to be dealing with this virus for many years to come. It’s going to come repeatedly. Getting this vaccine is just the first step that they can take to protect themselves from having bad outcomes,” Dr. Portnoy said.
Peter Marks, MD, PhD, director of the FDA’s Center for Biologics Evaluation and Research, reminded members of the committee that there were several government surveillance systems in place to catch any potential safety issues in near real time.
“I really appreciate very much the concern here. The safety monitoring of this vaccine will continue,” Dr. Marks said. “I do view this as one of our greatest responsibilities.”
“I really am so grateful that we had this discussion and voted to approve,” said Capt. Amanda Cohn, MD, chief medical officer at the National Center for Immunization and Respiratory Diseases.
“I think the benefits in this age group really are super important even if they are lower than for other age groups.”
This article was updated 10/27/21.
A version of this article first appeared on WebMD.com.
Pandemic exacerbates primary care practices’ financial struggles
according to experts and the results of recent surveys by the Primary Care Collaborative (PCC).

Fewer than 30% (26.4%) of primary care clinicians report that their practices are financially healthy, according to the latest results from a periodic survey by the PCC. An earlier survey by the PCC suggests clinicians’ confidence in the financial viability of their practices has significantly declined since last year, when compared with the new survey’s results. When the older survey was taken between Sept. 4 and Sept. 8 of 2020, only 35% of primary care clinicians said that revenue and pay were significantly lower than they were before the pandemic.
Submissions to the new PCC survey were collected between Aug. 13 and Aug. 17 of 2021 and included 1,263 respondents from 49 states, the District of Columbia, and two territories. The PCC and the Larry A. Green Center have been regularly surveying primary care clinicians to better understand the impact of COVID-19 throughout the pandemic.
PCC President and CEO Ann Greiner said in an interview that the drop over a year follows a trend.
Though primary care faced struggles before the pandemic, the COVID-19 effect has been striking and cumulative, she noted.
“[Primary care practices] were healthier prepandemic,” said Ms. Greiner. “The precipitous drop in revenue when stay-at-home orders went into effect had a very big effect though pay structure and lack of investment in primary care was a problem long before COVID-19.”
COVID-19 has exacerbated all that ails primary care, and has increased fears of viability of primary care offices, she said.
Ms. Greiner pointed to a report from Health Affairs, that projected in 2020 that primary care would lose $65,000 in revenue per full-time physician by the end of the year for a total shortfall of $15 billion, following steep drops in office visits and fees for services from March to May, 2020.
In July of this year, she said, PCC’s survey found that, “Four in 10 clinicians worry that primary care will be gone in 5 years and one-fifth of respondents expect to leave the profession within the next three.”
The July PCC survey also showed that 13% of primary care clinicians said they have discussed selling their practice and cite high-level burnout/exhaustion as a main challenge for the next 6 months.

Robert L. Phillips, MD, a Virginia-based physician who oversees research for the American Board of Family Medicine, said, “Practices in our national primary care practice registry (PRIME) saw visit volumes drop 40% in the 2-3 months around the start of the pandemic and had not seen them return to normal as of June of this year. This means most remain financially underwater.”
End to paycheck protection hurt practices
Conrad L. Flick, MD, managing partner of Family Medical Associates in Raleigh, N.C., said the end of the federal Paycheck Protection Program (PPP) at the end of 2020 caused further distress to primary care and could also help explain the drop in healthy practices that PCC’s survey from last year suggested.

“Many of us who struggled financially as the pandemic hit last year were really worried. PPP certainly shored that up for a lot of us. But now it’s no longer here,” he said.
Dr. Flick said his 10-clinician independent practice is financially sound and he credits that to having the PPP loan, shared savings from an accountable care organization, and holding some profit over from last year to this year.
His practice had to cut two nurse practitioners this year when volume did not return to prepandemic levels.
“The PPP loan let us keep [those NPs] employed through spring, but we were hoping the volume would come back. Come spring this year the volume hasn’t come back, and we couldn’t afford to keep the office at full staff,” he said.
The way primary care physicians are paid is what makes them so vulnerable in a pandemic, he explained.
“Our revenue is purely based on how many people I can get through my office at a given period of time. We don’t have ways to generate revenue and build a cushion.”
Family physician L. Allen Dobson, MD, said the survey results may have become even more grim in the last year, because primary care practices, especially small practices, have not recovered from the 2020 losses and effects have snowballed.

Even though primary care offices have largely reopened and many patients have returned to in-person visits, he said, physicians are dealing with uncertainties of COVID-19 surges and variants and are having trouble recruiting and maintaining staff.
Revenue that should have come to primary care practices in testing and distributing vaccines instead went elsewhere to larger vaccination sites and retail clinics, noted Dr. Dobson, who is chair of the board of managers of Community Care Physicians Network in Mount Pleasant, N.C., which provides assistance with administrative tasks to small and solo primary care practices.
COVID-19 brought ‘accelerated change’
COVID-19 brought “an accelerated change,” in decreasing revenue, Dr. Dobson said.
Small primary care practices have followed the rules of changing to electronic health records, getting patient-centered medical home certification, and documenting quality improvement measures, but they have not reaped the financial benefits from these changes, he explained.
A report commissioned by the Physician Advocacy Institute found that the pandemic accelerated a long national trend of hospitals and corporate entities acquiring physician practices and employing physicians.
From January 2019 to January 2021, these entities acquired 20,900 additional physician practices and 48,000 additional physicians left independent practice for employment by hospital systems or other corporate entities.
Further straining practices is a thinning workforce, with 21% or respondents to the most recent PCC survey having said they were unable to hire clinicians for open positions and 54% saying they are unable to hire staff for open positions.
One respondent to the PCC survey from Utah said, “We need more support. It’s a moral injury to have our pay cut and be severely understaffed. Most of the burden of educating patients and getting them vaccinated has fallen to primary care and we are already overwhelmed with taking care of patients with worsening mental and physical health.”
According to Bruce Landon, MD, MBA, professor of health care policy at the Harvard Medical School’s Center for Primary Care, Boston, another source of financial strain for primary care practices is that they are having difficulty attracting doctors, nurses, and administrators.

These practices often need to increase pay for those positions to recruit people, and they are leaving many positions unfilled, Dr. Landon explained.
Plus, COVID-19 introduced costs for personal protective equipment (PPE) and cleaning products, and those expenses generally have not been reimbursed, Dr. Landon said.
Uncertainty around telemedicine
A new risk for primary care is a decline in telemedicine payments at a time when practices are still relying on telemedicine for revenue.
In the most recent PCC report, 40% of clinicians said they use telemedicine for at least a fifth of all office visits.
Even though most practices have reopened there’s still a fair amount of telemedicine and that will continue, Dr. Landon said in an interview.
In March of 2020, the Centers for Medicare & Medicaid Services lifted restrictions and that helped physicians with getting reimbursed for the services as they would office visits. But some commercial payers are starting to back off full payment for telemedicine, Dr. Landon noted.
“At some point the feds will probably start to do that with Medicare. I think that’s a mistake. [Telemedicine] has been one of the silver linings of this cloud of the pandemic,” he said.
If prepandemic payment regulations are restored, 41% of clinicians said, in the most recent PCC survey, that they worry their practices will no longer be able to support telemedicine.
Possible safety nets
Dr. Landon said that one thing that’s also clear is that some form of primary care capitation payment is necessary, at least for some of the work in primary care.
The practices that had capitation as part of payment were the ones who were most easily able to handle the pandemic because they didn’t see the immediate drop in revenue that fee-for-service practices saw, he noted.
“If we have a next pandemic, having a steady revenue stream to support primary care is really important and having a different way to pay for primary care is probably the best way to do that,” he said. “These longer-term strategies are going to be really crucial if we want to have a primary care system 10 years from now.”
Ms. Greiner, Dr. Flick, Dr. Phillips, Dr. Dobson, and Dr. Landon report no relevant financial relationships.
according to experts and the results of recent surveys by the Primary Care Collaborative (PCC).
Fewer than 30% (26.4%) of primary care clinicians report that their practices are financially healthy, according to the latest results from a periodic survey by the PCC. An earlier survey by the PCC suggests clinicians’ confidence in the financial viability of their practices has significantly declined since last year, when compared with the new survey’s results. When the older survey was taken between Sept. 4 and Sept. 8 of 2020, only 35% of primary care clinicians said that revenue and pay were significantly lower than they were before the pandemic.
Submissions to the new PCC survey were collected between Aug. 13 and Aug. 17 of 2021 and included 1,263 respondents from 49 states, the District of Columbia, and two territories. The PCC and the Larry A. Green Center have been regularly surveying primary care clinicians to better understand the impact of COVID-19 throughout the pandemic.
PCC President and CEO Ann Greiner said in an interview that the drop over a year follows a trend.
Though primary care faced struggles before the pandemic, the COVID-19 effect has been striking and cumulative, she noted.
“[Primary care practices] were healthier prepandemic,” said Ms. Greiner. “The precipitous drop in revenue when stay-at-home orders went into effect had a very big effect though pay structure and lack of investment in primary care was a problem long before COVID-19.”
COVID-19 has exacerbated all that ails primary care, and has increased fears of viability of primary care offices, she said.
Ms. Greiner pointed to a report from Health Affairs, that projected in 2020 that primary care would lose $65,000 in revenue per full-time physician by the end of the year for a total shortfall of $15 billion, following steep drops in office visits and fees for services from March to May, 2020.
In July of this year, she said, PCC’s survey found that, “Four in 10 clinicians worry that primary care will be gone in 5 years and one-fifth of respondents expect to leave the profession within the next three.”
The July PCC survey also showed that 13% of primary care clinicians said they have discussed selling their practice and cite high-level burnout/exhaustion as a main challenge for the next 6 months.
Robert L. Phillips, MD, a Virginia-based physician who oversees research for the American Board of Family Medicine, said, “Practices in our national primary care practice registry (PRIME) saw visit volumes drop 40% in the 2-3 months around the start of the pandemic and had not seen them return to normal as of June of this year. This means most remain financially underwater.”
End to paycheck protection hurt practices
Conrad L. Flick, MD, managing partner of Family Medical Associates in Raleigh, N.C., said the end of the federal Paycheck Protection Program (PPP) at the end of 2020 caused further distress to primary care and could also help explain the drop in healthy practices that PCC’s survey from last year suggested.
“Many of us who struggled financially as the pandemic hit last year were really worried. PPP certainly shored that up for a lot of us. But now it’s no longer here,” he said.
Dr. Flick said his 10-clinician independent practice is financially sound and he credits that to having the PPP loan, shared savings from an accountable care organization, and holding some profit over from last year to this year.
His practice had to cut two nurse practitioners this year when volume did not return to prepandemic levels.
“The PPP loan let us keep [those NPs] employed through spring, but we were hoping the volume would come back. Come spring this year the volume hasn’t come back, and we couldn’t afford to keep the office at full staff,” he said.
The way primary care physicians are paid is what makes them so vulnerable in a pandemic, he explained.
“Our revenue is purely based on how many people I can get through my office at a given period of time. We don’t have ways to generate revenue and build a cushion.”
Family physician L. Allen Dobson, MD, said the survey results may have become even more grim in the last year, because primary care practices, especially small practices, have not recovered from the 2020 losses and effects have snowballed.
Even though primary care offices have largely reopened and many patients have returned to in-person visits, he said, physicians are dealing with uncertainties of COVID-19 surges and variants and are having trouble recruiting and maintaining staff.
Revenue that should have come to primary care practices in testing and distributing vaccines instead went elsewhere to larger vaccination sites and retail clinics, noted Dr. Dobson, who is chair of the board of managers of Community Care Physicians Network in Mount Pleasant, N.C., which provides assistance with administrative tasks to small and solo primary care practices.
COVID-19 brought ‘accelerated change’
COVID-19 brought “an accelerated change,” in decreasing revenue, Dr. Dobson said.
Small primary care practices have followed the rules of changing to electronic health records, getting patient-centered medical home certification, and documenting quality improvement measures, but they have not reaped the financial benefits from these changes, he explained.
A report commissioned by the Physician Advocacy Institute found that the pandemic accelerated a long national trend of hospitals and corporate entities acquiring physician practices and employing physicians.
From January 2019 to January 2021, these entities acquired 20,900 additional physician practices and 48,000 additional physicians left independent practice for employment by hospital systems or other corporate entities.
Further straining practices is a thinning workforce, with 21% or respondents to the most recent PCC survey having said they were unable to hire clinicians for open positions and 54% saying they are unable to hire staff for open positions.
One respondent to the PCC survey from Utah said, “We need more support. It’s a moral injury to have our pay cut and be severely understaffed. Most of the burden of educating patients and getting them vaccinated has fallen to primary care and we are already overwhelmed with taking care of patients with worsening mental and physical health.”
According to Bruce Landon, MD, MBA, professor of health care policy at the Harvard Medical School’s Center for Primary Care, Boston, another source of financial strain for primary care practices is that they are having difficulty attracting doctors, nurses, and administrators.
These practices often need to increase pay for those positions to recruit people, and they are leaving many positions unfilled, Dr. Landon explained.
Plus, COVID-19 introduced costs for personal protective equipment (PPE) and cleaning products, and those expenses generally have not been reimbursed, Dr. Landon said.
Uncertainty around telemedicine
A new risk for primary care is a decline in telemedicine payments at a time when practices are still relying on telemedicine for revenue.
In the most recent PCC report, 40% of clinicians said they use telemedicine for at least a fifth of all office visits.
Even though most practices have reopened there’s still a fair amount of telemedicine and that will continue, Dr. Landon said in an interview.
In March of 2020, the Centers for Medicare & Medicaid Services lifted restrictions and that helped physicians with getting reimbursed for the services as they would office visits. But some commercial payers are starting to back off full payment for telemedicine, Dr. Landon noted.
“At some point the feds will probably start to do that with Medicare. I think that’s a mistake. [Telemedicine] has been one of the silver linings of this cloud of the pandemic,” he said.
If prepandemic payment regulations are restored, 41% of clinicians said, in the most recent PCC survey, that they worry their practices will no longer be able to support telemedicine.
Possible safety nets
Dr. Landon said that one thing that’s also clear is that some form of primary care capitation payment is necessary, at least for some of the work in primary care.
The practices that had capitation as part of payment were the ones who were most easily able to handle the pandemic because they didn’t see the immediate drop in revenue that fee-for-service practices saw, he noted.
“If we have a next pandemic, having a steady revenue stream to support primary care is really important and having a different way to pay for primary care is probably the best way to do that,” he said. “These longer-term strategies are going to be really crucial if we want to have a primary care system 10 years from now.”
Ms. Greiner, Dr. Flick, Dr. Phillips, Dr. Dobson, and Dr. Landon report no relevant financial relationships.
Unvaccinated people likely to catch COVID repeatedly
according to a recent study published in The Lancet Microbe.
Since COVID-19 hasn’t existed for long enough to perform a long-term study, researchers at Yale University and the University of North Carolina at Charlotte looked at reinfection data for six other human-infecting coronaviruses, including SARS and MERS.
“Reinfection can reasonably happen in three months or less,” Jeffrey Townsend, PhD, lead study author and a biostatistics professor at the Yale School of Public Health, said in a statement.
“Therefore, those who have been naturally infected should get vaccinated,” he said. “Previous infection alone can offer very little long-term protection against subsequent infections.”
The research team looked at post-infection data for six coronaviruses between 1984-2020 and found reinfection ranged from 128 days to 28 years. They calculated that reinfection with COVID-19 would likely occur between 3 months to 5 years after peak antibody response, with an average of 16 months. This is less than half the duration seen for other coronaviruses that circulate among humans.
The risk of COVID-19 reinfection is about 5% at three months, which jumps to 50% after 17 months, the research team found. Reinfection could become increasingly common as immunity wanes and new variants develop, they said.
“We tend to think about immunity as being immune or not immune. Our study cautions that we instead should be more focused on the risk of reinfection through time,” Alex Dornburg, PhD, senior study author and assistant professor of bioinformatics and genomics at UNC, said in the statement.
“As new variants arise, previous immune responses become less effective at combating the virus,” he said. “Those who were naturally infected early in the pandemic are increasingly likely to become reinfected in the near future.”
Study estimates are based on average times of declining immunity across different coronaviruses, the researchers told the Yale Daily News. At the individual level, people have different levels of immunity, which can provide shorter or longer duration of protection based on immune status, immunity within a community, age, underlying health conditions, environmental exposure, and other factors.
The research team said that preventive health measures and global distribution of vaccines will be “critical” in minimizing reinfection and COVID-19 deaths. In areas with low vaccination rates, for instance, unvaccinated people should continue safety practices such as social distancing, wearing masks, and proper indoor ventilation to avoid reinfection.
“We need to be very aware of the fact that this disease is likely to be circulating over the long term and that we don’t have this long-term immunity that many people seem to be hoping to rely on in order to protect them from disease,” Dr. Townsend told the newspaper.
A version of this article first appeared on WebMD.com.
DMTs linked to better pediatric MS outcomes
An estimated 3%-10% of MS patients are diagnosed during childhood. These patients experience a higher relapse rate and have higher magnetic resonance imaging (MRI) activity than do adult-onset patients. They have a slower rate of progression, but they reach irreversible disability milestones at an early age, with more than 50% having secondary progressive disease by age 30.
Studies in adults suggest that use of high-efficacy DMTs is most effective when initiated during the early active phase of MS, but little is known about children. “Early recognition of predictors of faster disability in children is crucial for clinicians to make the treatment decisions at the earliest possible time,” Sifat Sharmin, PhD, said during her presentation of the study at the annual meeting of the European Committee for Treatment and Research in Multiple Sclerosis (ECTRIMS). Dr. Sharmin is a statistician and research fellow at the University of Melbourne.
‘Reassuring’ data
“I think the most important observation that was made here is the protective factor of use of high efficacy disease modifying therapies,” said Bruce Cree, MD, PhD, who was asked to comment on the study.
That result wasn’t unexpected, but it should provide reassurance. “For parents of children who are hesitant about use of high efficacy therapies, this study provides supporting evidence for use of these high efficacy therapies early on, to try and prevent irreversible disability from occurring,” said Dr. Cree, professor of clinical neurology and the George A. Zimmermann Endowed Professor in Multiple Sclerosis at the University of California at San Francisco UCSF Weill Institute for Neurosciences.
The study provides real-world data to back up findings from a phase 3 clinical trial that showed fewer relapses and fewer new lesions in pediatric patients with MS who were taking fingolimod versus interferon beta-1a.
“Given a large randomized, controlled trial, and now with this additional real-world data set showing the same thing, the only conclusion to reach is that if you’ve got a kid with MS, they should be treated with fingolimod,” said Dr. Cree. He noted that other DMTs such as natalizumab may also benefit pediatric patients, but fingolimod is the only drug that has been studied in randomized, controlled trials in children.
Real-world data
The researchers analyzed data from 672 patients drawn from the international MSBase Neuroimmunology Registry, who had undergone neurological assessment within 1 year of symptom onset and had at least two annual visits where the Expanded Disability Status Scale (EDSS) was recorded. They sought to identify predictors of Multiple Sclerosis Severity Score (MSSS). A secondary analysis looked at predictors of EDSS sustained worsening at 6 months, defined as an increase of 1.5 if EDSS baseline was 0, 1.0 or more if baseline EDSS was 1.0-5.5, or 0.5 if baseline EDSS was over 5.5.
The researchers also conducted a sensitivity analysis that looked at relapse phenotypes and relapse frequency in the first year, as well as a subgroup analysis of patients with available MRI data from the first year. The researchers adjusted for time on high-efficacy DMTs at each visit.
Among the study participants, 70% were female. The median age of onset was 16 years. The median EDSS score was 1.5 at inclusion, and the median score was 1.0 at follow-up of 3 years. At 6 months, 82 worsening events occurred in 57 patients.
A total of 76% of the patients were treated with DMTs. The most commonly prescribed DMTs were interferon beta (40.63%), natalizumab (8.48%), and fingolimod (6.40%). Seventy-eight percent of those who received DMTs started treatment before age 18. Twenty-seven percent received high-efficacy DMTs.
The analysis showed associations between disability and older age at onset [exp(beta), 1.09; 95% confidence interval, 1.03-1.16], maximum EDSS score during the first year of disease [exp(beta), 1.25; 95% CI, 1.13-1.36], or first-year pyramidal symptoms [exp(beta), 1.34; 95% CI, 1.13-1.58], visual symptoms [exp(beta), 1.28; 95% CI, 1.10-1.48], or cerebellum symptoms [exp(beta), 1.17; 95% CI, 1.00-1.39]. A greater amount of time on high-efficacy DMTs was associated with a lower probability of disability [exp(beta), 0.96; 95% CI, 0.93-0.99].
A complete recovery from the first relapse was associated with a lower probability of relapse, though this association did not reach statistical significance [exp(beta), 0.83; 95% CI, 0.68-1.03].
The secondary analyses found that the only predictor of 6-month EDSS worsening [exp(beta), 1.32; 95% CI, 1.21-1.45] was having a maximum EDSS score in the first year. Sensitivity analyses of complete and incomplete recovery from relapses found that a higher MSSS was associated incomplete recovery [exp(beta), 1.16; 95% CI, 1.02-1.32], and confirmed the primary finding that recovery from first relapse was associated with a lower probability of disability [exp(beta), 0.78; 95% CI, 0.63-0.96].
Among patients with MRI data, a new MRI lesion in year 1 was associated with a lower future MSSS score [exp(beta), 0.81; 95% CI, 0.66-0.99].
The study was funded by the National Health and Medical Research Council of Australia. The study authors disclosed ties with a wide range of pharmaceutical companies, including Biogen and Novartis. Dr. Cree has consulted for Biogen, Novartis, and other pharmaceutical companies.
FROM ECTRIMS 2021
Most infant formula trials lack transparency, carry high risk of bias: Systematic review
Baby formula trials are not reliable, and have an “almost universal lack of transparency” which could undermine breastfeeding, according to the results of a systematic review published in BMJ. The findings underscore the need for significant change in the way such trials are conducted and reported, concluded lead author Bartosz Helfer, PhD, of the National Heart and Lung Institute at Imperial College London and the University of Wroclaw (Poland) Institute of Psychology and his coauthors. Citing a high risk of bias, selective reporting, and “almost universally favourable conclusions,” the international team of investigators suggested “some trials might have a marketing aim and no robust scientific aim,” concluding “much of the recent information generated about formula products might be misleading.”
The review included a detailed evaluation of 125 trials published since 2015, that compared at least two formula products in 23,757 children less than 3 years of age. The trials were evaluated for how they were conducted and reported, with specific attention paid to their risk of bias and risk of undermining breastfeeding.
Using the Cochrane risk-of-bias assessment 2.0 (ROB2), the analysis found that risk of bias was high in 80% of trials “usually because of inappropriate exclusions of participants from the analysis, and selective reporting,” the investigators noted. “This lack of transparency was complemented by favourable conclusions in more than 90% of recent trials, and evidence of publication bias in recent superiority trials.”
When conflict of interest was assessed, the analysis showed 84% of the trials received support from the formula milk industry, and of these, 77% had at least one author affiliated with a formula company. Overall, only 14% of trials had a low level of conflicts of interest according to the investigators’ definition “that the main source of funding had no commercial interest in the outcome of the trial and all of the authors of the study declared no financial ties to an entity with a commercial interest in the outcome of the trial.”
The investigators also noted that, by providing free formula to parents of breastfed or mixed-fed infants, many of the trials may have contravened the International Code of Marketing of Breast-milk Substitutes – an international agreement used to protect breastfeeding and limit the marketing of formula. “Claims arising from formula trials can contribute to formula marketing by narrowing the perceived benefits of breast milk over formula for consumers,” they wrote, calling for “improved oversight, conduct, and reporting of formula trials to ensure they provide a rigorous evidence base to inform nutrition in infants and young children.”
Asked to comment, Jennifer L. Pomeranz, JD, MPH, who was not involved in the study, told this publication the findings are “very concerning.” Ms. Pomeranz of New York University’s School of Global Public Health, recently reported similar issues in an analysis of baby formula websites. “Infant formula labels in the U.S. are adorned with a plethora of unsupported health and nutrition-related claims, including unregulated structure/function claims and breast milk comparison claims,” she said. “Moreover, infant formula marketing uses these claims to convince new parents that infant formula is necessary and even better for their infants than breast milk. Our research indicates that parents believe the popular claims made by formula companies and some even believe that infant formula is better for their child’s development than breast milk. If these claims are based on trials with no robust scientific basis, as the study suggests might be the case, then they are certainly false, deceptive, unfair, and misleading.”
Ms. Pomeranz called for the Food and Drug Administration’s regulation of infant formula labels, adding that “Congress should grant the FDA the explicit authority to require evidence to support structure/function claims on infant formula and prohibit breast milk comparison claims. ... The Federal Trade Commission and state attorneys general should bring actions against infant formula manufacturers for false and deceptive claims made in marketing materials,” she added.
Jack Newman, MD, another expert not involved in the study told this publication that the findings show how most formula studies “are essentially another marketing tool of the formula companies and are aimed at a very susceptible audience – health care professionals.” According to Dr. Newman, chief pediatrician and founder of the Newman Breastfeeding Clinic in Toronto and a former UNICEF consultant for the Baby Friendly Hospital Initiative, “health care professionals often like to believe they are immune to formula company marketing – yet this study shows that, even if they believed they were relying on scientific evidence, they were in fact being influenced toward formula feeding by studies that are biased, unreliable, and designed to promote formula to begin with.”
However, Stewart Forsyth, MD, honorary professor in child health, at the University of Dundee (Scotland) and retired consultant pediatrician and medical director at NHS Tayside, Scotland, cautioned that this is a delicate issue on all sides of the debate. The possibility of bias “is a potential issue with all aspects of research but is heightened in relation to infant feeding research because of the longstanding conflict involving the World Health Organisation, breastfeeding activist groups, and the infant formula industry, and as a consequence, all three of these organisations frequently resort to overinterpreting the data to favour their arguments,” he told this publication. An example is the suggestion that formula trials might contravene the International Code of Marketing of Breastmilk Substitutes because they provide free formula to participants. “Since when do participants in a research study have to pay for the intervention that is being studied?” he asked.
Dr. Stewart advised three key considerations “to mitigate the damaging effects that this type of inappropriate and misleading information may have on policy, practice, and engagement with parents.” First, it must be acknowledged that there is need for “a product that will provide a safety net for infants who are not offered breast milk,” he said. “It has been argued that to determine optimum nutrient requirements in infants and young children collaboration with nutrition companies is required.” Second, “all researchers need to comply with regulations relating to scientific methods, ethical standards, and financial diligence.” And finally, “there needs to be more effective planning and coordination of research activities to ensure that lessons are learned from the many studies that have design and methodological deficiencies.”
The study was funded by Imperial Health Charity. Ms. Pomeranz and Dr. Newman reported no conflicts of interest. Dr. Forsyth has undertaken consultancy work with governments, health care institutions, academia, and industry and has received research grants and honoraria from governments, charitable organizations and industry, including infant formula companies.
Senior author Robert J. Boyle, MBChB, MRCP, PhD, received personal fees from Cochrane, DBV Technologies, and Prota Therapeutics, and from expert witness work in cases of food anaphylaxis and class actions related to infant formula health claims, outside the submitted work, and received personal fees from Public Health England as a member of the UK Nutrition and Health Claims Committee and the Maternal and Child Nutrition Subgroup of the Scientific Advisory Committee on Nutrition. Coauthor Jo Leonardi-Bee, MSc, PhD, received fees from Danone Nutricia Research and the Food Standards Agency, outside of the submitted work.
Social determinants of health may drive CVD risk in Black Americans
Investigators analyzed 20 years of data on over 50,500 U.S. adults drawn from the National Health and Nutrition Examination Surveys (NHANES) and found that, in the overall population, body mass index and hemoglobin A1c were significantly increased between 1999 and 2018, while serum total cholesterol and cigarette smoking were significantly decreased. Mean systolic blood pressure decreased between 1999 and 2010, but then increased after 2010.
The mean age- and sex-adjusted estimated 10-year risk for atherosclerotic cardiovascular disease (ASCVD) was consistently higher in Black participants vs. White participants, but the difference was attenuated after further adjusting for education, income, home ownership, employment, health insurance, and access to health care.
“These findings are helpful to guide the development of national public health policies for targeted interventions aimed at eliminating health disparities,” Jiang He, MD, PhD, Joseph S. Copes Chair and professor of epidemiology, Tulane University School of Public Health and Tropical Medicine, New Orleans, said in an interview.
“Interventions on social determinants of cardiovascular health should be tested in rigorous designed intervention trials,” said Dr. He, director of the Tulane University Translational Science Institute.
The study was published online Oct. 5 in JAMA.
‘Flattened’ CVD mortality?
Recent data show that the CVD mortality rate flattened, while the total number of cardiovascular deaths increased in the U.S. general population from 2010 to 2018, “but the reasons for this deceleration in the decline of CVD mortality are not entirely understood,” Dr. He said.
Moreover, “racial and ethnic differences in CVD mortality persist in the U.S. general population [but] the secular trends of cardiovascular risk factors among U.S. subpopulations with various racial and ethnic backgrounds and socioeconomic status are [also] not well understood,” he added. The effects of social determinants of health, such as education, income, home ownership, employment, health insurance, and access to health care on racial/ethnic differences in CVD risk, “are not well documented.”
To investigate these questions, the researchers drew on data from NHANES, a series of cross-sectional surveys in nationally representative samples of the U.S. population aged 20 years and older. The surveys are conducted in 2-year cycles and include data from 10 cycles conducted from 1999-2000 to 2017-2018 (n = 50,571, mean age 49.0-51.8 years; 48.2%-51.3% female).
Every 2 years, participants provided sociodemographic information, including age, race/ethnicity, sex, education, income, employment, housing, health insurance, and access to health care, as well as medical history and medication use. They underwent a physical examination that included weight and height, blood pressure, lipid levels, plasma glucose, and hemoglobin A1c.
Social determinants of health
Between 1999-2000 and 2017-2018, age- and sex-adjusted mean BMI and hemoglobin A1c increased, while mean serum total cholesterol and prevalence of smoking decreased (all P < .001).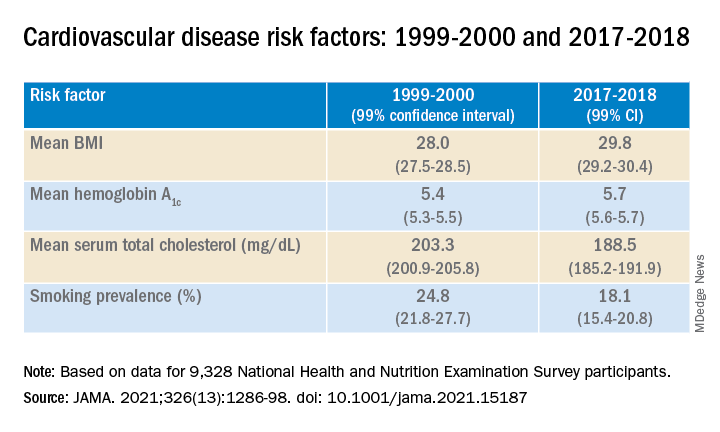
Age- and sex-adjusted 10-year atherosclerotic cardiovascular disease (ASCVD) risk decreased from 7.6% (6.9%-8.2%) in 1999-2000 to 6.5% (6.1%-6.8%) in 2011-2012, with no significant changes thereafter.
When the researchers looked at specific racial and ethnic groups, they found that age- and sex-adjusted BMI, systolic BP, and hemoglobin A1c were “consistently higher” in non-Hispanic Black participants compared with non-Hispanic White participants, but total cholesterol was lower (all P < .001).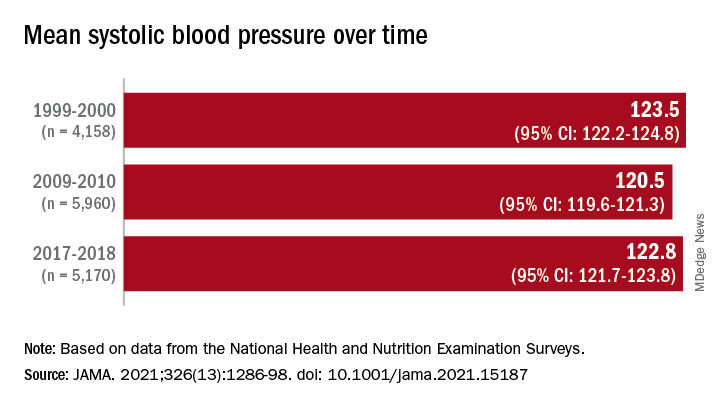
Participants with at least a college education or high family income had “consistently lower levels” of cardiovascular risk factors. And although the mean age- and sex-adjusted 10-year risk for ASCVD was significantly higher in non-Hispanic Black vs. non-Hispanic White participants (difference, 1.4% [1.0%-1.7%] in 1999-2008 and 2.0% [1.7%-2.4%] in 2009-2018), the difference was attenuated (by –0.3% in 1999-2008 and 0.7% in 2009-2018) after the researchers further adjusted for education, income, home ownership, employment, health insurance, and access to health care.
The differences in cardiovascular risk factors between Black and White participants “may have been moderated by social determinants of health,” the authors noted.
Provide appropriate education
Commenting on the study in an interview, Mary Ann McLaughlin, MD, MPH, associate professor of medicine, cardiology, Icahn School of Medicine at Mount Sinai, New York, pointed out that two important cardiovascular risk factors associated with being overweight – hypertension and diabetes – remained higher in the Black population compared with the White population in this analysis.
“Physicians and health care systems should provide appropriate education and resources regarding risk factor modification regarding diet, exercise, and blood pressure control,” advised Dr. McLaughlin, who was not involved with the study.
“Importantly, smoking rates and cholesterol levels are lower in the Black population, compared to the White population, when adjusted for many important socioeconomic factors,” she pointed out.
Dr. McLaughlin added that other “important social determinants of health, such as neighborhood and access to healthy food, were not measured and should be addressed by physicians when optimizing cardiovascular risk.”
The research reported in this publication was supported by the National Heart, Lung, and Blood Institute and by the National Institute of General Medical Sciences. One of the researchers, Joshua D. Bundy, PhD, was supported by a grant from the National Institutes of Health/Eunice Kennedy Shriver National Institute of Child Health and Human Development. Dr. He and the other coauthors and Dr. McLaughlin reported no relevant financial relationships.
A version of this article first appeared on Medscape.com.