User login
Late Discharges from a Medical Ward
In the past 2 decades, emergency department (ED) overcrowding has become an issue large enough to receive coverage in the popular press, and to spawn research around its causes and effects.116 At the same time, nurses and physicians on the inpatient wards have been urged to shorten the length of stay for patients as health system leaders face an aging population but limited capital to build new beds or hire additional clinical staff. Capacity managementencompassing the flow of patients from ED triage to inpatient dischargehas become a shared concern of clinicians and hospital administrators alike.
How to achieve the goals of diagnosing and healing while ushering patients ever more quickly through the modern hospital is not yet entirely clear. Past research and work by business groups suggests that demand for inpatient beds starts early in the day, but discharges typically occur in the late afternoon.17 This creates a potential bottleneck in patient flow. Many hospitals have implemented measures to improve patient throughput.1821 However, formal research has focused on factors leading to an additional inpatient day.2226 We have found no peer‐reviewed publications that address the problem of same‐day delays by describing hour of day for each step in the discharge process and variables associated with late‐day discharges. To fill this gap, we conducted a prospective cohort study of 209 consecutive discharges from a general medical ward to: (1) describe the natural history of hospital discharge, (2) measure time of day and duration for each step, and (3) identify factors associated with discharges that occur later in the day. We hypothesized that time and duration of discharge would be associated with 5 factors: patient demographics and clinical characteristics, departmental occupancy, type of inpatient testing done immediately prior to discharge, and discharge characteristics such as discharge to a location other than home.
Patients and Methods
Setting
The setting was the Hospitalist Unit of a single teaching hospital in Baltimore (The Johns Hopkins Hospital) from January 1, 2005 to April 30, 2005. Patients entered the cohort upon initiation of the discharge process by the hospitalist team on the Hospitalist Unit, and were followed until they were discharged alive from the hospital.
There were no published data on which to base firm a priori sample size calculations. Based on pilot data, we estimated that a sample size of about 170 would yield precise estimates for means and standard deviations, giving us 80% to 90% power to determine differences in time intervals across categories, with alpha set to 0.05. We estimated that we would need 4 months of data collection to achieve this sample size.
During the period of study, the 16‐bed unit was staffed with in‐house hospitalist attending physicians without house‐staff, from 7 AM (weekdays) or 8 AM (weekends) to 10 PM (Monday to Thursday) or 8 PM (Friday to Sunday). The hospitalist unit had 24‐hour physician coverage, but attending physicians provided overnight coverage from home (backed up by in‐house residents for patient care emergencies). Handoffs of patient care from one attending physician to another typically occurred on Friday afternoon or Monday morning. The unit had 1 dedicated social worker and a nurse clinician who provided part‐time assistance with discharge planning.
Outcome Measurements
We defined the start of the discharge process as the time the patient's last medically necessary test was needed by his or her attending physician. Specifically, physicians were asked when the results of this test first would have been useful in clearing the patient for discharge. In the remainder of this work, we will refer to the start of the discharge process as time decisive test needed.
The end of the discharge process was called the discharge time, and defined as the time the unit clerk saw the patient leave the unit. We defined early discharges as those occurring before the median hour of discharge (3:00 PM), and late discharges as those occurring at or after this hour.
A focus group composed of nurses, physicians, social worker, unit clerks, and support associates (group responsible for cleaning patient rooms) volunteered to map out the discharge process. Based on these discussions, durations in the discharge process were defined as follows: (1) duration 1: time decisive test needed, until time the attending physician was aware of test results; (2) duration 2: time the physician was aware of test results until discharge paperwork was complete; (3) duration 3: time discharge paperwork complete until patient leaves unit; and (4) total discharge duration: time decisive test needed until patient leaves unit.
Exposure Measurements
We categorized exposures into 5 groups: (1) demographics (age, gender, race, source of patient such as outside hospital versus emergency department versus other, and payer on discharge); (2) clinical characteristics (length of stay, any psychiatric diagnosis, any substance abuse diagnosis, and severity of illness); (3) system characteristics (departmental occupancy defined as proportion of hospital beds designated for Department of Medicine patients that were occupied on the day of discharge); (4) last test characteristics (physical exam, laboratory test, procedure, and consult); and (5) discharge characteristics (discharged to home versus not discharged to home, prescriptions filled in hospital pharmacy prior to discharge, and ambulance required for transport).
Psychiatric diagnosis was defined as the presence of any of the following International Classification of Diseases, Ninth Revision, Clinical Modification (ICD‐9‐CM) codes: 290319 (any fourth or fifth digits).27 Substance abuse diagnosis was defined as the presence of any of the following ICD‐9‐CM codes: 303305 (any fourth or fifth digits). Substance abuse codes encompassed drug dependence and abuse, including alcohol dependence and abuse.
The all patient refined diagnosis related group relative weight (APRDRGwt) is a unitless number that estimates the total cost of care for inpatients, based on clinical and demographic characteristics.28 A patient with a relative APRDRGwt of 1 is predicted to have the same cost of care as the national average for inpatients. A patient with a score of 2 is predicted to be twice as costly as the average. In this study, we used APRDRGwt as a gross proxy for severity of illness.
Adjusted length of stay was measured as length of stay minus discharge duration. This adjustment was made to avoid including the exposure (length of stay) in the outcome (discharge duration). Unadjusted length of stay was used when the outcome was discharge time.
Data Sources
We created a separate 4‐item to 9‐item paper questionnaire (included in the Appendix) for each of 4 functional groups participating directly in the discharge process: nurses, physicians, social worker, and unit clerks. Questions were based on staff feedback about the sequence of steps in the discharge process, and potential reasons for delay. The surveys were piloted for several weeks to further refine the wording of questions, and to ensure that the length and location of the surveys minimized workflow interruptions. The questionnaires captured information about the timing of routine events not recorded in existing databases.
Physicians were asked to identify the last test/procedure/consult needed prior to the patient being medically ready for discharge. They were asked when the test results first could have cleared the patient for discharge (time decisive test needed), and when they actually received the test results (time test results back). Nursing and social work surveys provided information on whether or not prescriptions were filled prior to discharge, and the type of transportation used on discharge. Unit clerks documented when the patient left the unit.
Response rates were: nurses (97%), physicians (97%), social worker (99%), and unit clerks (94%). All 4 surveys were completed for 88% of the 209 included patients (prior to 8 exclusions for missing data or extreme outlier observations). Group response rates were tallied at the end of each month and posted on the unit. We did not track how soon after discharge the surveys were completed. However, we reviewed survey responses frequently (often daily, at most every 4 days) and if surveys were incomplete we personally approached staff members to complete the survey.
We supplemented and cross‐checked data from the questionnaire with information from existing hospital databases. These databases were: (1) the patient's medical record for time patient arrived on the floor, and completion time for consults/procedures; (2) the Electronic Bedboard (EBB) for time patient left the unit (as recorded by unit clerk); (3) the Patient Order Entry System for time discharge papers were completed by the physician, and ordering time for select tests; (4) the Electronic Patient Record for demographic information and completion time for select tests; and (5) Datamart, the hospital's administrative/billing database, for information such as length of stay, diagnosis, patient demographics, and insurance status.
Cross‐checking of data and calculation of durations 1, 2, and 3 identified areas of disagreement that were addressed in the following way. Discharge time was provided by 3 sources: social worker and nurses as an ad hoc addition to each of their surveys, unit clerks as a mandatory question on their survey, and unit clerks as entered in the EBB. We used EBB data for discharge time, as this was the most complete and accurate single source of data. However, survey results and knowledge about the sequential process for discharge, suggested that in 20 cases EBB data did not provide the most accurate time. In these cases, discharge time was provided by the unit clerk survey (16 cases), the social work survey (3 cases), and the nursing survey (1 case).
In 28 cases (14%), discharge paperwork was completed before decisive test results were back. And in 8 cases (4%) test results were received earlier than needed. As these were a minority of cases, these negative durations were converted to zero for analysis.
Statistical Analysis
The unit of analysis was the unique hospital discharge. For patients who were discharged from the Hospitalist Unit more than once during the 4‐month study period, each discharge was treated as a separate unit of analysis.
We defined patients discharged before the median discharge time as early discharges, and all others as late discharges. We then categorized patients with discharge durations less than 24 hours as short discharges, and all others as long discharges.
We described the characteristics of 2 groups of patients: early and short discharges versus all others. We used the chi square statistic and Fisher's exact test (when frequency 5 in 1 or both groups) to test the null hypothesis that there was no association between the 2 groups and select patient characteristics. When comparing medians, we used the nonparametric equality of medians test.
For each step in the discharge process, we identified a median time of occurrence. For the first point in the processtime decisive test neededwe also used 1‐way analysis of variance and the F‐test to assess whether or not timing varied significantly by physician.
Because our primary goal was to quantify in hours the association between various factors and discharge time or duration, we used bivariate linear regression models to identify factors associated with time of discharge (primary analysis) and total duration of the discharge process (secondary analysis). We then used multivariate linear regression to identify factors associated with both outcomes. We used forward and backward selection methods to choose the final models for the multivariate analyses, after forcing in the variables for race, sex, and age. Both methods of selection produced identical results. We assessed for colinearity using variance inflation factors.29
Sensitivity Analyses
For both discharge time and discharge duration, we performed regression diagnostics including leverage, Studentized residuals, and influence. Excluding outliers for influence slightly altered the results of our multivariate analyses. However, all variables that were significant at the P < 0.05 level remained significant in the models without outliers.
We chose to include outliers for influence in our final data set after verifying the data as accurate. For discharge time, the number of outliers (3; 1.5%) for influence was in the range expected for a normally distributed data set.
We also tested for normality of the 2 outcome variables. Discharge time was normally distributed, but discharge duration was not. Because of this, we used 2 additional methods to assess the robustness of our results for discharge duration.
First, we log‐transformed the outcome and repeated the analysis. Variables significant in the non‐log‐transformed model remained significant after log‐transformation. Second, we applied bootstrapping30 with 1,000 repetitions for the bivariate and multivariate analyses. The 95% confidence intervals (CIs) (using the bias‐corrected confidence intervals) were modestly altered (some narrowed, some widened), but our conclusions remained the same except for a single variable with borderline significance (payer on discharge) in bivariate analysis. The final reported confidence intervals for discharge duration are based on our analysis without bootstrapping.
Results
Data were collected on 216 patients. Seven patients were excluded from the study, because they were discharged against medical advice. Since these patients left before their decisive test was completed, there was no way to assess duration of the discharge process. Of the remaining 209 patients, 6 patients lacked necessary data to complete analysis (5 without survey data; 1 without administrative data). Two additional patients were eliminated from the final analysis because they bypassed the normal discharge process and were extreme outliers in either discharge time (1 discharged at 1 AM), or discharge duration (1 with discharge duration of 400+ hours). A total of 201 patients were included in the final analyses.
The hospitalist program primarily serves an indigent, local adult population with general medical problems, and this is reflected in the patient characteristics (Table 1). We compared the characteristics of patients discharged early and quickly (discharged prior to median hour of 3:00 PM, and discharge process lasting less than 24 hours) to all other discharges, to identify factors associated with later and longer discharges.
| Early and Short Discharges (n = 75)* | All Other Discharges (n = 126) | P Value | |
|---|---|---|---|
| |||
| Demographics | |||
| Age (years) | |||
| Median | 55 | 55 | 0.73 |
| Range | (19, 94) | (20, 90) | |
| Gender (%) | |||
| Female | 61.3 | 61.1 | 0.98 |
| Race (%) | 0.08 | ||
| African American | 76.0 | 60.3 | |
| Caucasian | 21.3 | 34.9 | |
| Other | 2.7 | 4.8 | |
| Payor on discharge (%) | 0.29 | ||
| Medicaid | 32.0 | 20.6 | |
| Medicare | 32.0 | 38.9 | |
| Self‐pay | 12.0 | 16.7 | |
| Other | 24.0 | 23.8 | |
| Clinical characteristics | |||
| Adjusted length of stay (days) | |||
| Median | 3 | 3 | 0.19 |
| Range | (<1, 20) | (<1, 138) | |
| Substance abuse (%) | 41.3 | 37.3 | 0.57 |
| Psychiatric diagnosis (%) | 20.0 | 25.4 | 0.38 |
| Last test characteristics | |||
| Test type (%) | <0.001 | ||
| Exam | 42.7 | 26.2 | |
| Laboratory test | 38.7 | 13.5 | |
| Procedure | 10.7 | 35.7 | |
| Consult | 8.0 | 24.6 | |
| Discharge characteristics | |||
| Discharged to home (%) | 93.3 | 71.4 | <0.001 |
| Prescriptions filled prior to discharge (%) | 10.7 | 19.8 | 0.09 |
| Ambulance required for transport (%) | 8.0 | 21.4 | 0.01 |
Overall, 81% of patients were admitted from the ED, and 40% of all patients were insured by Medicaid or were self‐pay at time of discharge. Median expected charges were similar to the national average, as demonstrated by the median APRDRGwt of 1.0. Patients stayed an average of 6 days (median = 3 days). Patients with the longest adjusted lengths of stay (>20 days) were never early and short discharges. The most common discharge diagnoses were: congestive heart failure, chest pain or myocardial infarction, pneumonia, asthma/chronic obstructive pulmonary disease, and sickle‐cell disease. Thirty‐nine percent of all patients carried the diagnosis of alcohol or drug dependence or abuse, although for most this was not their discharge diagnosis. None of these demographic or clinical factors were associated with a late or long discharge.
The types of tests patients required on discharge were categorized into 4 groups: consults (18.4%), laboratory tests (22.9%), procedures (26.4%), and physical exam (32.3%). Distribution differed significantly between early and short discharges, and all other discharges (P < 0.001). Procedures and consults were less frequent among early and short discharges (procedures: 10.7% versus 35.7%; consults: 8.0% versus 24.6%).
For all patients, there was fragmentation within the consult and procedure categories. Within the consult group, there were 12 different types of consults ordered, with the dominant category (35.1%) being other. The next highest volume consult was physical/occupational therapy (27.0%). Within the procedure group, there were 11 different types of procedures, with the most common being stress echocardiograms (28.3%). Non‐MRI radiology procedures made up the next largest category (20.8%) and the third was other (18.9%).
Many patients had immediate postdischarge needs, as demonstrated by the 20% of patients not discharged home. The majority (66%) of those who were discharged to a facility required an ambulance. Early and short discharges were less likely to use an ambulance to leave the hospital (8.0% versus 21.4%; P = 0.01), and more likely to be discharged directly to home (99.3% versus 71.4%; P < 0.001).
Based on process mapping, we defined a 4‐step sequential discharge process for all patients (Figure 1). The first step was: decisive test needed by physician to discharge patient. Subgroup analysis demonstrated no significant difference in the timing of this step by individual physician (P = 0.44). The remaining 3 steps were as follows: physician aware of test results, discharge paperwork complete by physician, and patient leaves the unit. Each of the 4 steps showed wide variability in hour of occurrence.

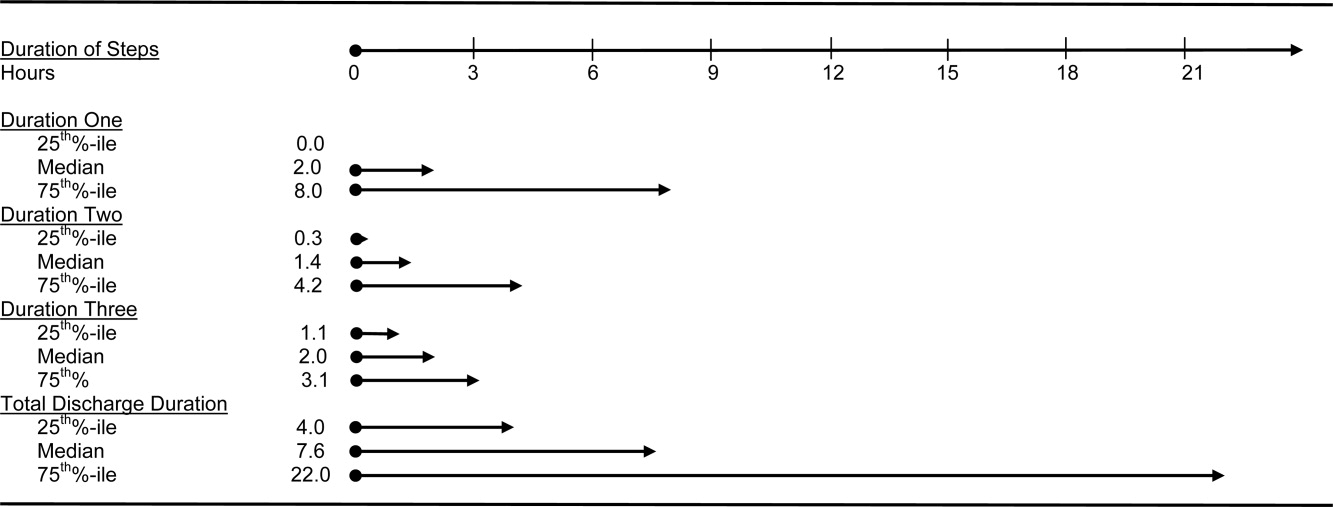
Total discharge duration showed even more variability than the time of day when steps were likely to occur (Figure 2). Median duration of the discharge process was 7.6 hours (25th% to 75th%: 4 to 22 hours). Median duration from decisive test needed until resulted (duration 1) was 2 hours (25th% to 75th%: 0 to 8 hours); between test resulted until discharge paperwork complete (duration 2) was 1.4 hours (25th% to 75th%: 0.3 to 4.2 hours); and between discharge paperwork complete and patient leaving the unit (duration 3) was 2.0 hours (25th% to 75th%: 1.1 to 3.1 hours). All durations were skewed to the right, with durations 1 and 2 each taking at least 24 hours to occur in 10% of patients.
The final multivariate model for time of discharge contained 6 covariates: age, sex, race, test type, prescriptions filled prior to discharge, and need for an ambulance on discharge (Table 2). Special discharge needs continued to be associated with later discharges. Those patients who required an ambulance for transport had mean discharge times that were later by 1.5 hours (95% CI, 0.42.5). If staff obtained discharge medications for patients, these patients left 1.4 hours later than those patients who filled their prescriptions on their own (95% CI, 0.32.4). Patients requiring a consult or procedure also had significantly later discharges (1.2 hours for consults, 95% CI, 0.12.4; 1.1 hours for procedures, 95% CI, 0.12.1) than those needing a bedside exam. Age, sex, and race remained insignificant at the P 0.05 level in the final multivariate model. Length of stay was significantly associated with discharge time in crude analysis, but this variable dropped out of the final multivariate model.
| Adjusted Coefficient, Discharge Time as Outcome in Hours (95% CI)* | P Value | Adjusted Coefficient, Discharge Duration as Outcome in Hours (95% CI) | P Value | |
|---|---|---|---|---|
| ||||
| Demographics | ||||
| Age in quartiles (years) | ||||
| 7294 | 0.5 (0.5, 1.6) | 0.33 | 0.6 (8.3, 7.2) | 0.88 |
| 5671 | 0.5 (0.6, 1.6) | 0.41 | 1.3 (9.2, 6.6) | 0.75 |
| 4455 | 0.2 (0.9, 1.3) | 0.74 | 1.2 (9.0, 6.5) | 0.76 |
| Male gender | 0.0 (0.8, 0.8) | 0.97 | 1.2 (6.8, 4.5) | 0.69 |
| African American race | 0.1 (0.7, 0.9) | 0.80 | 0.3 (5.6, 6.1) | 0.93 |
| Last test characteristics | ||||
| Test type | ||||
| Consult | 1.2 (0.1, 2.4) | 0.04 | 14.8 (6.5, 23.1) | 0.001 |
| Procedure | 1.1 (0.1, 2.1) | 0.03 | 13.4 (6.0, 20.7) | <0.001 |
| Laboratory test | 0.8 (1.8, 0.3) | 0.14 | 0.9 (8.4, 6.6) | 0.82 |
| Exam (reference) | ||||
| Discharge needs | ||||
| Prescriptions filled prior to discharge | 1.4 (0.3, 2.4) | 0.02 | ||
| Not discharged to home | 28.9 (21.9, 35.9) | <0.001 | ||
| Ambulance required for transport | 1.5 (0.4, 2.5) | 0.007 | ||
We used duration of discharge as a secondary outcome measure. The final multivariate model for discharge duration included: age, sex, race, test type, and discharge to a facility (Table 2). Those who went to a facility on average left 28.9 hours (95% CI, 21.935.9) later than those who went home. Test type continued to show a significant association with discharge duration, although the estimates were slightly lower in the adjusted model. Need for a consult was associated with a discharge that was on average 14.8 hours (95% CI, 6.523.1) longer than discharges contingent on a physical exam. Similarly, those patients who had procedures had discharges that were on average 13.4 hours (95% CI, 6.020.7) longer than those whose last test was an exam. Several factors that were significantly associated with discharge duration in unadjusted analyses dropped out of the final multivariate model. These included: need for an ambulance, length of stay, insurance status, and medical complexity as estimated by APRDRGwt.
Conclusions
We found that discharge time and duration had wide variability and that certain factors were associated with only one outcome variabledischarge time or duration. Two factorsneed for an ambulance and filling of prescriptions prior to dischargewere associated with later hour of discharge. Discharge to a location other than home was associated with prolonged discharge duration. Test characteristicsin particular need for a procedure and consultwere significantly associated with both longer and later discharges.
In bivariate analysis, several factors were not associated with discharge time or duration. These were: African‐American race, sex, age, Department of Medicine occupancy on day of discharge, source of admission, psychiatric comorbidity, and substance abuse comorbidity. We had expected higher occupancy to delay discharge as demand exceeded capacity for tests, consults, etc. Our findings suggest that even though our study was conducted during the winter months when hospital occupancy is typically at its peak, supply of staff was still adequate enough to meet high demand. We had also expected that psychiatric and substance abuse comorbidities would prolong discharge as prior studies have found some of these diagnoses to be associated with longer lengths of stay.3134 However, our results do not support such an association, and may reflect our decision to group all psychiatric diagnoses together due to limited sample size.
The main strength of our study is the use of 2 outcome variablestime and durationto define delayed discharges. Our findings demonstrate that few factors are associated with both later and longer discharges. In an era when avoiding emergency room walkouts through early morning hospital discharges can be as important as managing overall length of stay, identifying factors associated with both duration and timing of discharges addresses actual challenges faced by hospitals with limited resources. Prior studies have rarely addressed both outcomes. An additional strength of our study is our use of an interdisciplinary survey. The discharge process is a key component of the inpatient stay, but it is also one for which no group is entirely responsible. Through the development and administration of an interdisciplinary survey, our study adds detail to existing descriptions of this fragmented process, and identifies potential areas for improvement.
Several limitations of our study deserve comment. First, we examined patients discharged from a hospitalist unit without house‐staff at an urban tertiary care hospital. Our findings may need additional interpretation prior to their application in dissimilar settings such as: (1) resident‐covered units in which workflow is shaped by teaching rounds, and (2) nonacademic hospitals in which incentives to provide rapid consults and procedures may be different. Second, we relied on self‐reporting for certain variables such as time decisive test needed. This may be subject to recall bias, as we did not have staff to independently verify recalled times. However, since the discharge process is generally a linear one, we were able to verify the general scope of recalled times with times date‐stamped by the computer during the discharge process (eg, checking that time decisive test needed did not occur after the discharge worksheet had been finalized in the electronic order‐entry system). Third, our sample size was not large enough to control for disease‐specific quality measures. Of note, prior studies have not identified a consistently positive or negative relationship between quality of care and efficiency.3538
Past work has used administrative and survey data to analyze the effect of discharge planning interventions on financial or quality outcomes. Outcomes have included readmissions, mortality, patient satisfaction, length of stay, and inappropriate bed days.22, 3845 However, as capacity management has become a more pressing issue for hospitals, greater focus is being placed on the mismatch between supply and demand of patients at each hour of the day. The relevant unit of measure for efficient discharges has become hour of day, in addition to total length of stay. Some hospital improvement projects have already addressed this shift in thinking.20, 21 Our study adds to this work by formally describing the precise timing and duration of steps in the discharge process, and identifying factors associated with both time and duration.
We believe the results of our study have several implications for hospital administrators and patients interested in more timely care. First, the methods used provide a tangible framework for addressing problems that cross disciplines (eg, nursing, physician, social work) and departments (eg, medicine and radiology), and have a multitude of potential causes and confounders. The survey results offer guidance on where to focus resources, provide a shared baseline metric for improvement, and suggest the cross‐functional team that should be involved in change efforts. Such an approach may be useful for addressing common system‐based challenges in inpatient quality and safety.
Second, with specific regard to discharge planning, our study supports the notion that modifiable factors are associated with discharge time and duration. However, we also describe a fragmented discharge process, with no single bottleneck or department responsible for the majority of late and long discharges. Although procedures and consults were both associated with longer and later discharges, only 26% of patients required a procedure prior to discharge, and 18% required a consult. Moreover, among procedures, different people and events are needed to carry out the 2 most popular procedures: stress echocardiograms, and non‐MRI radiology procedures. Hospital leadership at the highest levels will be required to improve efficiency based on local usage patterns, and to increase coordination among the multiple interdepartmental processes that make up the more general categories of procedure and consult.
Acknowledgements
The authors thank the patients and staff of the Hospitalist Unit for their participation in this study. In addition, they sincerely thank Paul X. Allen, Richard O. Davis, Ronald R. Peterson, and Shuai Shao. They also thank the anonymous reviewers for their thoughtful comments.
- ,,,,.Emergency departments and crowding in United States teaching hospitals.Ann Emerg Med.1991;20:980–986.
- ,,,,,.A conceptual model of emergency department crowding.Ann Emerg Med.2003;42:173–180.
- ,,.Frequent overcrowding in U.S. emergency departments.Acad Emerg Med.2001;8:151–155.
- ,,,,.The effect of hospital occupancy on emergency department length of stay and patient disposition.Acad Emerg Med.2003;10:127–133.
- .Calculus, chaos, and other models of emergency department crowding.Ann Emerg Med.2003;42:181–184.
- ,.Increased health care costs associated with ED overcrowding.Am J Emerg Med.1994;12:265–266.
- ,,, et al.Decreased health care quality associated with emergency department overcrowding.Eur J Emerg Med.1999;6:105–107.
- ,,.Can good bed management solve the overcrowding in accident and emergency departments?Emerg Med J.2003;20:149–155.
- ,.Emergency department overcrowding in the United States: an emerging threat to patient safety and public health.Emerg Med J.2003;20:402–405.
- General Accounting Office. Hospital emergency departments: crowded conditions vary among hospitals and communities. 2003:GAO‐03–460. Available at: http://www.gao.gov/new.items/d03460.pdf. Accessed October.
- ,.Do you want to die?Time.1990;135:58–60+
- .The ER crisis.Ladies Home J.2001;118:70–79.
- .Placing emergency department crowding on the decision agenda.Nurs Econ.2005;23:14–24.
- .Crisis seen in nation's ER care. Washington Post. June 15,2006;A01.
- Committee on the Future of Emergency Care in the United States Health System.Hospital‐based Emergency Care: at the Breaking Point.Washington DC:National Academies Press;2006.
- ,,, et al.Waits to see an emergency department physician: U.S. trends and predictors, 1997–2004.Health Aff.2008;27:w84–w95.
- Advisory Board.Maximizing Hospital Capacity: Expediting Throughput in an Era of Shortage. Health Care Advisory Board research study.Washington DC:Advisory Board; September 12,2002.
- ,,,.Does U.S. hospital capacity need to be expanded?Health Aff.2003;22:40–54.
- Institute for Healthcare Improvement.Optimizing Patient Flow: Moving Patients Smoothly Through Acute Care Settings.Cambridge, MA:Institute for Healthcare Improvement;2003.
- ,. Leveraging six sigma to improve hospital bed availability. Available at: http://healthcare.isixsigma.com/library/content/c030708a.asp. Accessed October2008.
- University Health System Consortium. Managing patient flow implementation: 2005 benchmarking project field brief. Available at: http://www.musc.edu/medcenter/UHC‐CCP/PFMgmtFldBk.pdf.
- ,,,.Discharge planning from hospital to home.Cochrane Database Syst Rev.2004;1:CD000313.
- ,,, et al.Predictors of inappropriate hospital days in a department of internal medicine.Int J Epidemiol.1998;27:513–519.
- ,,.Utilisation of hospital beds by the elderly—a cohort study of admissions to a teaching hospital.Ir Med J.1995;88:124–126.
- ,,,,,.Demographic and clinical characteristics as predictors of length of hospitalization and readmission.J Clin Psychol.1977;33:1093–1099.
- ,,,.The epidemiology of delays in a teaching hospital: the development and use of a tool that detects unnecessary hospital days.Med Care.1989;27:112–129.
- American Medical Association.AMA Physician ICD‐9‐CM 2004, Vols 1 and 2.Eden Prairie, MN:Ingenix;2003.
- 3M Health Information Systems and the Maryland Health Care Payment System: frequently asked questions.2004. Available at: http://multimedia.mmm.com/mws/mediawebserver.dyn?6666660Zjcf6lVs6EVs66S7wwCOrrrrQ‐.
- .Statistics with STATA.Belmont, CA:Duxbury Press;2004.
- ,.Statistical data analysis in the computer age.Science.1991;253:390–395.
- ,,,,.Psychological comorbidity and length of stay in the general hospital.Am J Psychiatry.1991;148(3):324–329.
- ,,,,,.Psychiatric comorbidity and greater hospitalization risk, longer length of stay, and higher hospitalization costs in older adults with heart failure.J Am Geriatr Soc.2007;55:1585–1591.
- ,,,.Does psychiatric comorbidity increase the length of stay in general hospitals?Gen Hosp Psychiatry.2001;23:8–14.
- ,,.The impact of psychiatric comorbidity on length of stay of medical inpatients.Gen Hosp Psychiatry.2003;25:14–19.
- ,,,,,.The implications of regional variations in Medicare spending. Part 1: The content, quality, and accessibility of care.Ann Intern Med.2003;138:273–287.
- ,,,,,.The implications of regional variations in Medicare spending. Part 2: Health outcomes and satisfaction with care.Ann Intern Med.2003;138:288–298.
- ,,, et al.Is early too early? Effect of shorter stays after bypass surgery.Ann Thorac Surg.2007;83:100–107.
- ,.Excess length of stay, charges, and mortality attributable to medical injuries during hospitalization.JAMA.2003;290:1868–1874.
- ,,, et al.Comprehensive discharge planning and home follow‐up of hospitalized elders, a randomized clinical trial.JAMA.1999;281:613–620.
- ,,,,,.Comprehensive discharge planning for the hospitalized elderly, a randomized clinical trial.Ann Intern Med.1994;120:999–1006.
- ,.Evaluating hospital discharge planning: a randomized clinical trial.Med Care.1993;31:358–370.
- ,,,,.Does a dedicated discharge coordinator improve the quality of hospital discharge?Qual Health Care.1996;5:89–96.
- ,,, et al.The effect of a hospitalist service with nurse discharge planner on patient care in an academic teaching hospital.Am J Med.2001;111:627–632.
- ,,,,,.Comprehensive discharge planning with postdischarge support for older patients with congestive heart failure: a meta‐analysis.JAMA.2004;291:1358–1367.
- ,,.Does increased access to primary care reduce hospital readmissions?N Engl J Med.1996;334:1441–1447.
In the past 2 decades, emergency department (ED) overcrowding has become an issue large enough to receive coverage in the popular press, and to spawn research around its causes and effects.116 At the same time, nurses and physicians on the inpatient wards have been urged to shorten the length of stay for patients as health system leaders face an aging population but limited capital to build new beds or hire additional clinical staff. Capacity managementencompassing the flow of patients from ED triage to inpatient dischargehas become a shared concern of clinicians and hospital administrators alike.
How to achieve the goals of diagnosing and healing while ushering patients ever more quickly through the modern hospital is not yet entirely clear. Past research and work by business groups suggests that demand for inpatient beds starts early in the day, but discharges typically occur in the late afternoon.17 This creates a potential bottleneck in patient flow. Many hospitals have implemented measures to improve patient throughput.1821 However, formal research has focused on factors leading to an additional inpatient day.2226 We have found no peer‐reviewed publications that address the problem of same‐day delays by describing hour of day for each step in the discharge process and variables associated with late‐day discharges. To fill this gap, we conducted a prospective cohort study of 209 consecutive discharges from a general medical ward to: (1) describe the natural history of hospital discharge, (2) measure time of day and duration for each step, and (3) identify factors associated with discharges that occur later in the day. We hypothesized that time and duration of discharge would be associated with 5 factors: patient demographics and clinical characteristics, departmental occupancy, type of inpatient testing done immediately prior to discharge, and discharge characteristics such as discharge to a location other than home.
Patients and Methods
Setting
The setting was the Hospitalist Unit of a single teaching hospital in Baltimore (The Johns Hopkins Hospital) from January 1, 2005 to April 30, 2005. Patients entered the cohort upon initiation of the discharge process by the hospitalist team on the Hospitalist Unit, and were followed until they were discharged alive from the hospital.
There were no published data on which to base firm a priori sample size calculations. Based on pilot data, we estimated that a sample size of about 170 would yield precise estimates for means and standard deviations, giving us 80% to 90% power to determine differences in time intervals across categories, with alpha set to 0.05. We estimated that we would need 4 months of data collection to achieve this sample size.
During the period of study, the 16‐bed unit was staffed with in‐house hospitalist attending physicians without house‐staff, from 7 AM (weekdays) or 8 AM (weekends) to 10 PM (Monday to Thursday) or 8 PM (Friday to Sunday). The hospitalist unit had 24‐hour physician coverage, but attending physicians provided overnight coverage from home (backed up by in‐house residents for patient care emergencies). Handoffs of patient care from one attending physician to another typically occurred on Friday afternoon or Monday morning. The unit had 1 dedicated social worker and a nurse clinician who provided part‐time assistance with discharge planning.
Outcome Measurements
We defined the start of the discharge process as the time the patient's last medically necessary test was needed by his or her attending physician. Specifically, physicians were asked when the results of this test first would have been useful in clearing the patient for discharge. In the remainder of this work, we will refer to the start of the discharge process as time decisive test needed.
The end of the discharge process was called the discharge time, and defined as the time the unit clerk saw the patient leave the unit. We defined early discharges as those occurring before the median hour of discharge (3:00 PM), and late discharges as those occurring at or after this hour.
A focus group composed of nurses, physicians, social worker, unit clerks, and support associates (group responsible for cleaning patient rooms) volunteered to map out the discharge process. Based on these discussions, durations in the discharge process were defined as follows: (1) duration 1: time decisive test needed, until time the attending physician was aware of test results; (2) duration 2: time the physician was aware of test results until discharge paperwork was complete; (3) duration 3: time discharge paperwork complete until patient leaves unit; and (4) total discharge duration: time decisive test needed until patient leaves unit.
Exposure Measurements
We categorized exposures into 5 groups: (1) demographics (age, gender, race, source of patient such as outside hospital versus emergency department versus other, and payer on discharge); (2) clinical characteristics (length of stay, any psychiatric diagnosis, any substance abuse diagnosis, and severity of illness); (3) system characteristics (departmental occupancy defined as proportion of hospital beds designated for Department of Medicine patients that were occupied on the day of discharge); (4) last test characteristics (physical exam, laboratory test, procedure, and consult); and (5) discharge characteristics (discharged to home versus not discharged to home, prescriptions filled in hospital pharmacy prior to discharge, and ambulance required for transport).
Psychiatric diagnosis was defined as the presence of any of the following International Classification of Diseases, Ninth Revision, Clinical Modification (ICD‐9‐CM) codes: 290319 (any fourth or fifth digits).27 Substance abuse diagnosis was defined as the presence of any of the following ICD‐9‐CM codes: 303305 (any fourth or fifth digits). Substance abuse codes encompassed drug dependence and abuse, including alcohol dependence and abuse.
The all patient refined diagnosis related group relative weight (APRDRGwt) is a unitless number that estimates the total cost of care for inpatients, based on clinical and demographic characteristics.28 A patient with a relative APRDRGwt of 1 is predicted to have the same cost of care as the national average for inpatients. A patient with a score of 2 is predicted to be twice as costly as the average. In this study, we used APRDRGwt as a gross proxy for severity of illness.
Adjusted length of stay was measured as length of stay minus discharge duration. This adjustment was made to avoid including the exposure (length of stay) in the outcome (discharge duration). Unadjusted length of stay was used when the outcome was discharge time.
Data Sources
We created a separate 4‐item to 9‐item paper questionnaire (included in the Appendix) for each of 4 functional groups participating directly in the discharge process: nurses, physicians, social worker, and unit clerks. Questions were based on staff feedback about the sequence of steps in the discharge process, and potential reasons for delay. The surveys were piloted for several weeks to further refine the wording of questions, and to ensure that the length and location of the surveys minimized workflow interruptions. The questionnaires captured information about the timing of routine events not recorded in existing databases.
Physicians were asked to identify the last test/procedure/consult needed prior to the patient being medically ready for discharge. They were asked when the test results first could have cleared the patient for discharge (time decisive test needed), and when they actually received the test results (time test results back). Nursing and social work surveys provided information on whether or not prescriptions were filled prior to discharge, and the type of transportation used on discharge. Unit clerks documented when the patient left the unit.
Response rates were: nurses (97%), physicians (97%), social worker (99%), and unit clerks (94%). All 4 surveys were completed for 88% of the 209 included patients (prior to 8 exclusions for missing data or extreme outlier observations). Group response rates were tallied at the end of each month and posted on the unit. We did not track how soon after discharge the surveys were completed. However, we reviewed survey responses frequently (often daily, at most every 4 days) and if surveys were incomplete we personally approached staff members to complete the survey.
We supplemented and cross‐checked data from the questionnaire with information from existing hospital databases. These databases were: (1) the patient's medical record for time patient arrived on the floor, and completion time for consults/procedures; (2) the Electronic Bedboard (EBB) for time patient left the unit (as recorded by unit clerk); (3) the Patient Order Entry System for time discharge papers were completed by the physician, and ordering time for select tests; (4) the Electronic Patient Record for demographic information and completion time for select tests; and (5) Datamart, the hospital's administrative/billing database, for information such as length of stay, diagnosis, patient demographics, and insurance status.
Cross‐checking of data and calculation of durations 1, 2, and 3 identified areas of disagreement that were addressed in the following way. Discharge time was provided by 3 sources: social worker and nurses as an ad hoc addition to each of their surveys, unit clerks as a mandatory question on their survey, and unit clerks as entered in the EBB. We used EBB data for discharge time, as this was the most complete and accurate single source of data. However, survey results and knowledge about the sequential process for discharge, suggested that in 20 cases EBB data did not provide the most accurate time. In these cases, discharge time was provided by the unit clerk survey (16 cases), the social work survey (3 cases), and the nursing survey (1 case).
In 28 cases (14%), discharge paperwork was completed before decisive test results were back. And in 8 cases (4%) test results were received earlier than needed. As these were a minority of cases, these negative durations were converted to zero for analysis.
Statistical Analysis
The unit of analysis was the unique hospital discharge. For patients who were discharged from the Hospitalist Unit more than once during the 4‐month study period, each discharge was treated as a separate unit of analysis.
We defined patients discharged before the median discharge time as early discharges, and all others as late discharges. We then categorized patients with discharge durations less than 24 hours as short discharges, and all others as long discharges.
We described the characteristics of 2 groups of patients: early and short discharges versus all others. We used the chi square statistic and Fisher's exact test (when frequency 5 in 1 or both groups) to test the null hypothesis that there was no association between the 2 groups and select patient characteristics. When comparing medians, we used the nonparametric equality of medians test.
For each step in the discharge process, we identified a median time of occurrence. For the first point in the processtime decisive test neededwe also used 1‐way analysis of variance and the F‐test to assess whether or not timing varied significantly by physician.
Because our primary goal was to quantify in hours the association between various factors and discharge time or duration, we used bivariate linear regression models to identify factors associated with time of discharge (primary analysis) and total duration of the discharge process (secondary analysis). We then used multivariate linear regression to identify factors associated with both outcomes. We used forward and backward selection methods to choose the final models for the multivariate analyses, after forcing in the variables for race, sex, and age. Both methods of selection produced identical results. We assessed for colinearity using variance inflation factors.29
Sensitivity Analyses
For both discharge time and discharge duration, we performed regression diagnostics including leverage, Studentized residuals, and influence. Excluding outliers for influence slightly altered the results of our multivariate analyses. However, all variables that were significant at the P < 0.05 level remained significant in the models without outliers.
We chose to include outliers for influence in our final data set after verifying the data as accurate. For discharge time, the number of outliers (3; 1.5%) for influence was in the range expected for a normally distributed data set.
We also tested for normality of the 2 outcome variables. Discharge time was normally distributed, but discharge duration was not. Because of this, we used 2 additional methods to assess the robustness of our results for discharge duration.
First, we log‐transformed the outcome and repeated the analysis. Variables significant in the non‐log‐transformed model remained significant after log‐transformation. Second, we applied bootstrapping30 with 1,000 repetitions for the bivariate and multivariate analyses. The 95% confidence intervals (CIs) (using the bias‐corrected confidence intervals) were modestly altered (some narrowed, some widened), but our conclusions remained the same except for a single variable with borderline significance (payer on discharge) in bivariate analysis. The final reported confidence intervals for discharge duration are based on our analysis without bootstrapping.
Results
Data were collected on 216 patients. Seven patients were excluded from the study, because they were discharged against medical advice. Since these patients left before their decisive test was completed, there was no way to assess duration of the discharge process. Of the remaining 209 patients, 6 patients lacked necessary data to complete analysis (5 without survey data; 1 without administrative data). Two additional patients were eliminated from the final analysis because they bypassed the normal discharge process and were extreme outliers in either discharge time (1 discharged at 1 AM), or discharge duration (1 with discharge duration of 400+ hours). A total of 201 patients were included in the final analyses.
The hospitalist program primarily serves an indigent, local adult population with general medical problems, and this is reflected in the patient characteristics (Table 1). We compared the characteristics of patients discharged early and quickly (discharged prior to median hour of 3:00 PM, and discharge process lasting less than 24 hours) to all other discharges, to identify factors associated with later and longer discharges.
| Early and Short Discharges (n = 75)* | All Other Discharges (n = 126) | P Value | |
|---|---|---|---|
| |||
| Demographics | |||
| Age (years) | |||
| Median | 55 | 55 | 0.73 |
| Range | (19, 94) | (20, 90) | |
| Gender (%) | |||
| Female | 61.3 | 61.1 | 0.98 |
| Race (%) | 0.08 | ||
| African American | 76.0 | 60.3 | |
| Caucasian | 21.3 | 34.9 | |
| Other | 2.7 | 4.8 | |
| Payor on discharge (%) | 0.29 | ||
| Medicaid | 32.0 | 20.6 | |
| Medicare | 32.0 | 38.9 | |
| Self‐pay | 12.0 | 16.7 | |
| Other | 24.0 | 23.8 | |
| Clinical characteristics | |||
| Adjusted length of stay (days) | |||
| Median | 3 | 3 | 0.19 |
| Range | (<1, 20) | (<1, 138) | |
| Substance abuse (%) | 41.3 | 37.3 | 0.57 |
| Psychiatric diagnosis (%) | 20.0 | 25.4 | 0.38 |
| Last test characteristics | |||
| Test type (%) | <0.001 | ||
| Exam | 42.7 | 26.2 | |
| Laboratory test | 38.7 | 13.5 | |
| Procedure | 10.7 | 35.7 | |
| Consult | 8.0 | 24.6 | |
| Discharge characteristics | |||
| Discharged to home (%) | 93.3 | 71.4 | <0.001 |
| Prescriptions filled prior to discharge (%) | 10.7 | 19.8 | 0.09 |
| Ambulance required for transport (%) | 8.0 | 21.4 | 0.01 |
Overall, 81% of patients were admitted from the ED, and 40% of all patients were insured by Medicaid or were self‐pay at time of discharge. Median expected charges were similar to the national average, as demonstrated by the median APRDRGwt of 1.0. Patients stayed an average of 6 days (median = 3 days). Patients with the longest adjusted lengths of stay (>20 days) were never early and short discharges. The most common discharge diagnoses were: congestive heart failure, chest pain or myocardial infarction, pneumonia, asthma/chronic obstructive pulmonary disease, and sickle‐cell disease. Thirty‐nine percent of all patients carried the diagnosis of alcohol or drug dependence or abuse, although for most this was not their discharge diagnosis. None of these demographic or clinical factors were associated with a late or long discharge.
The types of tests patients required on discharge were categorized into 4 groups: consults (18.4%), laboratory tests (22.9%), procedures (26.4%), and physical exam (32.3%). Distribution differed significantly between early and short discharges, and all other discharges (P < 0.001). Procedures and consults were less frequent among early and short discharges (procedures: 10.7% versus 35.7%; consults: 8.0% versus 24.6%).
For all patients, there was fragmentation within the consult and procedure categories. Within the consult group, there were 12 different types of consults ordered, with the dominant category (35.1%) being other. The next highest volume consult was physical/occupational therapy (27.0%). Within the procedure group, there were 11 different types of procedures, with the most common being stress echocardiograms (28.3%). Non‐MRI radiology procedures made up the next largest category (20.8%) and the third was other (18.9%).
Many patients had immediate postdischarge needs, as demonstrated by the 20% of patients not discharged home. The majority (66%) of those who were discharged to a facility required an ambulance. Early and short discharges were less likely to use an ambulance to leave the hospital (8.0% versus 21.4%; P = 0.01), and more likely to be discharged directly to home (99.3% versus 71.4%; P < 0.001).
Based on process mapping, we defined a 4‐step sequential discharge process for all patients (Figure 1). The first step was: decisive test needed by physician to discharge patient. Subgroup analysis demonstrated no significant difference in the timing of this step by individual physician (P = 0.44). The remaining 3 steps were as follows: physician aware of test results, discharge paperwork complete by physician, and patient leaves the unit. Each of the 4 steps showed wide variability in hour of occurrence.
Total discharge duration showed even more variability than the time of day when steps were likely to occur (Figure 2). Median duration of the discharge process was 7.6 hours (25th% to 75th%: 4 to 22 hours). Median duration from decisive test needed until resulted (duration 1) was 2 hours (25th% to 75th%: 0 to 8 hours); between test resulted until discharge paperwork complete (duration 2) was 1.4 hours (25th% to 75th%: 0.3 to 4.2 hours); and between discharge paperwork complete and patient leaving the unit (duration 3) was 2.0 hours (25th% to 75th%: 1.1 to 3.1 hours). All durations were skewed to the right, with durations 1 and 2 each taking at least 24 hours to occur in 10% of patients.
The final multivariate model for time of discharge contained 6 covariates: age, sex, race, test type, prescriptions filled prior to discharge, and need for an ambulance on discharge (Table 2). Special discharge needs continued to be associated with later discharges. Those patients who required an ambulance for transport had mean discharge times that were later by 1.5 hours (95% CI, 0.42.5). If staff obtained discharge medications for patients, these patients left 1.4 hours later than those patients who filled their prescriptions on their own (95% CI, 0.32.4). Patients requiring a consult or procedure also had significantly later discharges (1.2 hours for consults, 95% CI, 0.12.4; 1.1 hours for procedures, 95% CI, 0.12.1) than those needing a bedside exam. Age, sex, and race remained insignificant at the P 0.05 level in the final multivariate model. Length of stay was significantly associated with discharge time in crude analysis, but this variable dropped out of the final multivariate model.
| Adjusted Coefficient, Discharge Time as Outcome in Hours (95% CI)* | P Value | Adjusted Coefficient, Discharge Duration as Outcome in Hours (95% CI) | P Value | |
|---|---|---|---|---|
| ||||
| Demographics | ||||
| Age in quartiles (years) | ||||
| 7294 | 0.5 (0.5, 1.6) | 0.33 | 0.6 (8.3, 7.2) | 0.88 |
| 5671 | 0.5 (0.6, 1.6) | 0.41 | 1.3 (9.2, 6.6) | 0.75 |
| 4455 | 0.2 (0.9, 1.3) | 0.74 | 1.2 (9.0, 6.5) | 0.76 |
| Male gender | 0.0 (0.8, 0.8) | 0.97 | 1.2 (6.8, 4.5) | 0.69 |
| African American race | 0.1 (0.7, 0.9) | 0.80 | 0.3 (5.6, 6.1) | 0.93 |
| Last test characteristics | ||||
| Test type | ||||
| Consult | 1.2 (0.1, 2.4) | 0.04 | 14.8 (6.5, 23.1) | 0.001 |
| Procedure | 1.1 (0.1, 2.1) | 0.03 | 13.4 (6.0, 20.7) | <0.001 |
| Laboratory test | 0.8 (1.8, 0.3) | 0.14 | 0.9 (8.4, 6.6) | 0.82 |
| Exam (reference) | ||||
| Discharge needs | ||||
| Prescriptions filled prior to discharge | 1.4 (0.3, 2.4) | 0.02 | ||
| Not discharged to home | 28.9 (21.9, 35.9) | <0.001 | ||
| Ambulance required for transport | 1.5 (0.4, 2.5) | 0.007 | ||
We used duration of discharge as a secondary outcome measure. The final multivariate model for discharge duration included: age, sex, race, test type, and discharge to a facility (Table 2). Those who went to a facility on average left 28.9 hours (95% CI, 21.935.9) later than those who went home. Test type continued to show a significant association with discharge duration, although the estimates were slightly lower in the adjusted model. Need for a consult was associated with a discharge that was on average 14.8 hours (95% CI, 6.523.1) longer than discharges contingent on a physical exam. Similarly, those patients who had procedures had discharges that were on average 13.4 hours (95% CI, 6.020.7) longer than those whose last test was an exam. Several factors that were significantly associated with discharge duration in unadjusted analyses dropped out of the final multivariate model. These included: need for an ambulance, length of stay, insurance status, and medical complexity as estimated by APRDRGwt.
Conclusions
We found that discharge time and duration had wide variability and that certain factors were associated with only one outcome variabledischarge time or duration. Two factorsneed for an ambulance and filling of prescriptions prior to dischargewere associated with later hour of discharge. Discharge to a location other than home was associated with prolonged discharge duration. Test characteristicsin particular need for a procedure and consultwere significantly associated with both longer and later discharges.
In bivariate analysis, several factors were not associated with discharge time or duration. These were: African‐American race, sex, age, Department of Medicine occupancy on day of discharge, source of admission, psychiatric comorbidity, and substance abuse comorbidity. We had expected higher occupancy to delay discharge as demand exceeded capacity for tests, consults, etc. Our findings suggest that even though our study was conducted during the winter months when hospital occupancy is typically at its peak, supply of staff was still adequate enough to meet high demand. We had also expected that psychiatric and substance abuse comorbidities would prolong discharge as prior studies have found some of these diagnoses to be associated with longer lengths of stay.3134 However, our results do not support such an association, and may reflect our decision to group all psychiatric diagnoses together due to limited sample size.
The main strength of our study is the use of 2 outcome variablestime and durationto define delayed discharges. Our findings demonstrate that few factors are associated with both later and longer discharges. In an era when avoiding emergency room walkouts through early morning hospital discharges can be as important as managing overall length of stay, identifying factors associated with both duration and timing of discharges addresses actual challenges faced by hospitals with limited resources. Prior studies have rarely addressed both outcomes. An additional strength of our study is our use of an interdisciplinary survey. The discharge process is a key component of the inpatient stay, but it is also one for which no group is entirely responsible. Through the development and administration of an interdisciplinary survey, our study adds detail to existing descriptions of this fragmented process, and identifies potential areas for improvement.
Several limitations of our study deserve comment. First, we examined patients discharged from a hospitalist unit without house‐staff at an urban tertiary care hospital. Our findings may need additional interpretation prior to their application in dissimilar settings such as: (1) resident‐covered units in which workflow is shaped by teaching rounds, and (2) nonacademic hospitals in which incentives to provide rapid consults and procedures may be different. Second, we relied on self‐reporting for certain variables such as time decisive test needed. This may be subject to recall bias, as we did not have staff to independently verify recalled times. However, since the discharge process is generally a linear one, we were able to verify the general scope of recalled times with times date‐stamped by the computer during the discharge process (eg, checking that time decisive test needed did not occur after the discharge worksheet had been finalized in the electronic order‐entry system). Third, our sample size was not large enough to control for disease‐specific quality measures. Of note, prior studies have not identified a consistently positive or negative relationship between quality of care and efficiency.3538
Past work has used administrative and survey data to analyze the effect of discharge planning interventions on financial or quality outcomes. Outcomes have included readmissions, mortality, patient satisfaction, length of stay, and inappropriate bed days.22, 3845 However, as capacity management has become a more pressing issue for hospitals, greater focus is being placed on the mismatch between supply and demand of patients at each hour of the day. The relevant unit of measure for efficient discharges has become hour of day, in addition to total length of stay. Some hospital improvement projects have already addressed this shift in thinking.20, 21 Our study adds to this work by formally describing the precise timing and duration of steps in the discharge process, and identifying factors associated with both time and duration.
We believe the results of our study have several implications for hospital administrators and patients interested in more timely care. First, the methods used provide a tangible framework for addressing problems that cross disciplines (eg, nursing, physician, social work) and departments (eg, medicine and radiology), and have a multitude of potential causes and confounders. The survey results offer guidance on where to focus resources, provide a shared baseline metric for improvement, and suggest the cross‐functional team that should be involved in change efforts. Such an approach may be useful for addressing common system‐based challenges in inpatient quality and safety.
Second, with specific regard to discharge planning, our study supports the notion that modifiable factors are associated with discharge time and duration. However, we also describe a fragmented discharge process, with no single bottleneck or department responsible for the majority of late and long discharges. Although procedures and consults were both associated with longer and later discharges, only 26% of patients required a procedure prior to discharge, and 18% required a consult. Moreover, among procedures, different people and events are needed to carry out the 2 most popular procedures: stress echocardiograms, and non‐MRI radiology procedures. Hospital leadership at the highest levels will be required to improve efficiency based on local usage patterns, and to increase coordination among the multiple interdepartmental processes that make up the more general categories of procedure and consult.
Acknowledgements
The authors thank the patients and staff of the Hospitalist Unit for their participation in this study. In addition, they sincerely thank Paul X. Allen, Richard O. Davis, Ronald R. Peterson, and Shuai Shao. They also thank the anonymous reviewers for their thoughtful comments.
- ,,,,.Emergency departments and crowding in United States teaching hospitals.Ann Emerg Med.1991;20:980–986.
- ,,,,,.A conceptual model of emergency department crowding.Ann Emerg Med.2003;42:173–180.
- ,,.Frequent overcrowding in U.S. emergency departments.Acad Emerg Med.2001;8:151–155.
- ,,,,.The effect of hospital occupancy on emergency department length of stay and patient disposition.Acad Emerg Med.2003;10:127–133.
- .Calculus, chaos, and other models of emergency department crowding.Ann Emerg Med.2003;42:181–184.
- ,.Increased health care costs associated with ED overcrowding.Am J Emerg Med.1994;12:265–266.
- ,,, et al.Decreased health care quality associated with emergency department overcrowding.Eur J Emerg Med.1999;6:105–107.
- ,,.Can good bed management solve the overcrowding in accident and emergency departments?Emerg Med J.2003;20:149–155.
- ,.Emergency department overcrowding in the United States: an emerging threat to patient safety and public health.Emerg Med J.2003;20:402–405.
- General Accounting Office. Hospital emergency departments: crowded conditions vary among hospitals and communities. 2003:GAO‐03–460. Available at: http://www.gao.gov/new.items/d03460.pdf. Accessed October.
- ,.Do you want to die?Time.1990;135:58–60+
- .The ER crisis.Ladies Home J.2001;118:70–79.
- .Placing emergency department crowding on the decision agenda.Nurs Econ.2005;23:14–24.
- .Crisis seen in nation's ER care. Washington Post. June 15,2006;A01.
- Committee on the Future of Emergency Care in the United States Health System.Hospital‐based Emergency Care: at the Breaking Point.Washington DC:National Academies Press;2006.
- ,,, et al.Waits to see an emergency department physician: U.S. trends and predictors, 1997–2004.Health Aff.2008;27:w84–w95.
- Advisory Board.Maximizing Hospital Capacity: Expediting Throughput in an Era of Shortage. Health Care Advisory Board research study.Washington DC:Advisory Board; September 12,2002.
- ,,,.Does U.S. hospital capacity need to be expanded?Health Aff.2003;22:40–54.
- Institute for Healthcare Improvement.Optimizing Patient Flow: Moving Patients Smoothly Through Acute Care Settings.Cambridge, MA:Institute for Healthcare Improvement;2003.
- ,. Leveraging six sigma to improve hospital bed availability. Available at: http://healthcare.isixsigma.com/library/content/c030708a.asp. Accessed October2008.
- University Health System Consortium. Managing patient flow implementation: 2005 benchmarking project field brief. Available at: http://www.musc.edu/medcenter/UHC‐CCP/PFMgmtFldBk.pdf.
- ,,,.Discharge planning from hospital to home.Cochrane Database Syst Rev.2004;1:CD000313.
- ,,, et al.Predictors of inappropriate hospital days in a department of internal medicine.Int J Epidemiol.1998;27:513–519.
- ,,.Utilisation of hospital beds by the elderly—a cohort study of admissions to a teaching hospital.Ir Med J.1995;88:124–126.
- ,,,,,.Demographic and clinical characteristics as predictors of length of hospitalization and readmission.J Clin Psychol.1977;33:1093–1099.
- ,,,.The epidemiology of delays in a teaching hospital: the development and use of a tool that detects unnecessary hospital days.Med Care.1989;27:112–129.
- American Medical Association.AMA Physician ICD‐9‐CM 2004, Vols 1 and 2.Eden Prairie, MN:Ingenix;2003.
- 3M Health Information Systems and the Maryland Health Care Payment System: frequently asked questions.2004. Available at: http://multimedia.mmm.com/mws/mediawebserver.dyn?6666660Zjcf6lVs6EVs66S7wwCOrrrrQ‐.
- .Statistics with STATA.Belmont, CA:Duxbury Press;2004.
- ,.Statistical data analysis in the computer age.Science.1991;253:390–395.
- ,,,,.Psychological comorbidity and length of stay in the general hospital.Am J Psychiatry.1991;148(3):324–329.
- ,,,,,.Psychiatric comorbidity and greater hospitalization risk, longer length of stay, and higher hospitalization costs in older adults with heart failure.J Am Geriatr Soc.2007;55:1585–1591.
- ,,,.Does psychiatric comorbidity increase the length of stay in general hospitals?Gen Hosp Psychiatry.2001;23:8–14.
- ,,.The impact of psychiatric comorbidity on length of stay of medical inpatients.Gen Hosp Psychiatry.2003;25:14–19.
- ,,,,,.The implications of regional variations in Medicare spending. Part 1: The content, quality, and accessibility of care.Ann Intern Med.2003;138:273–287.
- ,,,,,.The implications of regional variations in Medicare spending. Part 2: Health outcomes and satisfaction with care.Ann Intern Med.2003;138:288–298.
- ,,, et al.Is early too early? Effect of shorter stays after bypass surgery.Ann Thorac Surg.2007;83:100–107.
- ,.Excess length of stay, charges, and mortality attributable to medical injuries during hospitalization.JAMA.2003;290:1868–1874.
- ,,, et al.Comprehensive discharge planning and home follow‐up of hospitalized elders, a randomized clinical trial.JAMA.1999;281:613–620.
- ,,,,,.Comprehensive discharge planning for the hospitalized elderly, a randomized clinical trial.Ann Intern Med.1994;120:999–1006.
- ,.Evaluating hospital discharge planning: a randomized clinical trial.Med Care.1993;31:358–370.
- ,,,,.Does a dedicated discharge coordinator improve the quality of hospital discharge?Qual Health Care.1996;5:89–96.
- ,,, et al.The effect of a hospitalist service with nurse discharge planner on patient care in an academic teaching hospital.Am J Med.2001;111:627–632.
- ,,,,,.Comprehensive discharge planning with postdischarge support for older patients with congestive heart failure: a meta‐analysis.JAMA.2004;291:1358–1367.
- ,,.Does increased access to primary care reduce hospital readmissions?N Engl J Med.1996;334:1441–1447.
Copyright © 2009 Society of Hospital Medicine
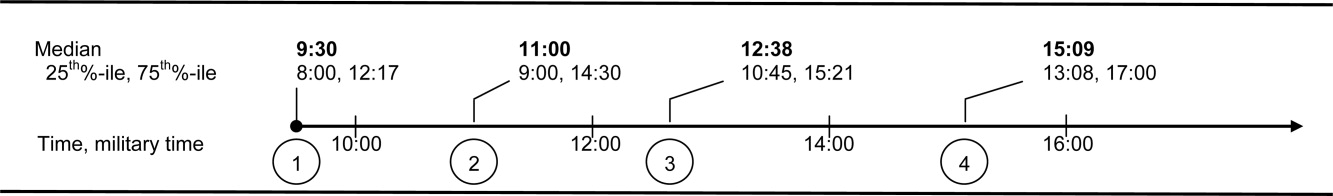
Caught in the Web: e‐Diagnosis
The approach to clinical conundrums by an expert clinician is revealed through the presentation of an actual patient's case in an approach typical of a morning report. Similarly to patient care, sequential pieces of information are provided to the clinician, who is unfamiliar with the case. The focus is on the thought processes of both the clinical team caring for the patient and the discussant.
A 52‐year‐old woman presented with a 3‐month history of progressive bilateral leg edema and dyspnea while climbing a flight of stairs or while walking up a steep slope. She also complained of a tingling sensation in both hands and fingers, which started about 2 months prior to the onset of edema. She did not describe sensory problems in the lower extremities and did not have any other neurological complaints. She denied fever, cough, chest pain, palpitations, orthopnea, paroxysmal nocturnal dyspnea, and dark stools. She had no history of hypertension, diabetes, dyslipidemia, or asthma and had never been hospitalized. She did not smoke or consume alcohol and used no medications, including over‐the‐counter drugs or dietary supplements. The patient was born in Japan and had not traveled outside the country since her birth. She was a homemaker and had worked occasionally as a manual laborer in sugar cane agriculture. A review of systems revealed no history of polydipsia, polyuria, or cold or heat intolerance but did identify new hair growth, especially on the extremities.
This middle‐aged woman shows progressive changes in her general health status that are characterized by edema and dyspnea on effort. The differential diagnosis of edema includes a broad spectrum of illnesses, such as cardiac, lung, renal, endocrine, and hepatic diseases. Because of the life‐threatening potential, my first concern is cardiac disease, although the patient is not experiencing typical symptoms of ischemic heart disease or congestive failure. Bilateral and distal distribution of neuropathic symptoms is likely due to diseases of peripheral nerves rather than those of the central nervous system. Her complaint of a bilateral tingling sensation in the hands may suggest carpal tunnel syndrome as a result of her long‐term agricultural work. Other possible causes include radiculopathy of the cervical spine or polyneuropathy. Clues in the physical examination may help narrow the differential diagnosis to a cardiac, hepatic, or endocrine disorder.
The patient appeared ill. Her weight had increased from 48 to 61 kg since she was last weighed 6 months previously. Her blood pressure was 140/78 mm Hg, her heart rate was 72 beats/minute with a regular rhythm, her respiratory rate was 18/minute, and her temperature was 37.5C. The jugular venous pressure was elevated at 10 cm above the sternal angle. A grade III/VI systolic ejection murmur was evident at the second interspace along the left sternal border. The second heart sound was fixed and split. There were decreased breath sounds and complete dullness to percussion over both lower lung fields. Shifting dullness was noted on abdominal examination. There was pitting edema from the feet to the thighs, with slow pit‐recovery time in both legs, and she exhibited generalized hirsutism on the face, body, and extremities. There was no lymphadenopathy. On neurological examination, her mental status was normal. The cranial nerves were normal, as was coordination. There was mild generalized distal‐dominant motor weakness with generalized hyporeflexia. Sensory testing demonstrated glove‐and‐stocking type loss of sensation to pinpricks as well as dysesthesia in all extremities. Phalen and Tinel tests were negative.
The elevated venous pressure and pitting edema with slow recovery suggest high venous pressure edema rather than hypoproteinemic edema. Complete bilateral dullness of the chest and shifting dullness of the abdomen indicate the presence of bilateral pleural effusion and ascites. Edema from high venous pressure is usually caused by right, left, or biventricular cardiac failure. A fixed splitting of the second heart sound suggests an atrial septal defect, which is a rare cause of progressive right heart failure in adults. I recommend checking the patient's thyroid function to investigate the possibility of hypothyroidism, which is a common illness among middle‐aged women and could contribute to her edema as well as hirsutism. The neurological findings suggest a generalized polyneuropathy. The unusual combination of high venous pressure edema and polyneuropathy may indicate a rare multisystem disorder such as amyloidosis. Alternatively, the patient might have developed multiple diseases during the same time period. For instance, diabetic polyneuropathy is the most common cause of polyneuropathy among the middle‐aged. Finally, the differential diagnosis of hirsutism includes ovarian, adrenal, or pituitary sources of hyperandrogenism in addition to hypothyroidism. I would first evaluate for diabetes, thyroid disease, and cardiac disease and would like to see the results of laboratory tests for thyrotropin and plasma glucose as well as chest radiography and electrocardiography.
The white‐cell count was 5400/mm3 with a normal differential. Hemoglobin was 10.7 g/dL with normal red‐cell indices, and the platelet count was 276,000/mm3. The erythrocyte sedimentation rate was 29 mm/hour. Other laboratory tests revealed the following values: total protein, 6.2 g/dL; albumin, 3.3 g/dL; blood urea nitrogen, 12 mg/dL; creatinine, 0.7 mg/dL; aspartate aminotransferase, 6 U/L; alanine aminotransferase, 2 U/L; lactate dehydrogenase, 96 U/L; alkaline phosphatase, 115 U/L; creatine phosphokinase, 60 U/L; total bilirubin, 0.9 mg/dL; glucose, 96 mg/dL; hemoglobin A1c, 4.6%; total cholesterol, 111 mg/dL; and thyrotropin, 6.32 mIU/mL (normal range, 0.50‐5.00 mIU/mL). Serum free thyroxine, triiodothyronine, and urine testosterone were normal. Serum dehydroepiandrosterone sulfate was mildly elevated for her age (864 ng/mL: normal range, 180‐750 ng/mL). Serological studies for human immunodeficiency virus, human T‐lymphotrophic virus type 1, and syphilis were negative. Urinalysis was weakly positive for protein but negative for casts and occult blood. The stool was negative for occult blood.
A chest radiograph showed bilateral pleural effusions. Computed tomography demonstrated bilateral pleural effusions, ascites, mild hepatomegaly, and small, multiple, mediastinal lymph nodes. Her electrocardiogram was normal. A transesophageal echocardiogram with agitated saline contrast demonstrated normal ventricular systolic and diastolic function and no atrial septal defect. The inferior vena cava did not collapse with inspiration, and there was no evidence of infiltrative cardiomyopathy.
These laboratory results rule out diabetes as the cause of the polyneuropathy. The subclinical hypothyroidism would not explain profound edema and hirsutism. A serum albumin level of 3.3 g/dL confirms high venous pressure edema rather than hypoproteinemic edema. Normochromic, normocytic anemia and a mildly elevated sedimentation rate point to a chronic illness or inflammatory state. The mediastinal lymphadenopathy may reflect congestion as a result of the high venous pressure or reflect a systemic disease involving lymph nodes. Normal ventricular function with high venous pressure is suggestive of heart failure from diastolic dysfunction, although the patient does not have risk factors for diastolic dysfunction, such as hypertension, and has no other echocardiographic features of diastolic impairment. The combination of hyperandrogenism and neuropathy points to a systemic process, such as a paraneoplastic syndrome. I would next investigate the source of the excess androgens.
Because serum dehydroepiandrosterone sulfate was mildly elevated, I‐131 aldosterol scintigraphy was performed, and it was negative. Electromyography showed a pattern of generalized sensorimotor polyneuropathy.
At this point, it appears that cardiac, endocrine, hepatic, and renal diseases have been largely ruled out as a cause of her symptoms. Reframing and unifying the important clinical problems for this patient may be useful in resolving this diagnostic puzzle. They include (1) systemic high venous pressure edema; (2) generalized sensorimotor polyneuropathy; (3) hirsutism; (4) normocytic, normochromic anemia; (5) an elevated erythrocyte sedimentation rate; (6) mediastinal lymphadenopathy; and (7) subclinical hypothyroidism. At this point, I cannot unify these pieces of information into a single diagnosis. I would search the medical literature, focusing on these terms.
A general internist consultant performed MEDLINE and Google Scholar searches using the key words edema, polyneuropathy, and hirsutism. This search suggested the diagnosis of Crow‐Fukase syndrome, also known as POEMS (polyneuropathy, organomegaly, endocrinopathy, M protein, and skin changes) syndrome. Subsequent evaluations were performed. First, serum protein electrophoresis revealed the presence of monoclonal proteins, although hypergammaglobulinemia was not present. Second, a bone marrow examination demonstrated increased abnormal plasma cell proliferation (7%), although a radiographic skeletal survey found no lesions suggestive of plasmacytoma. Third, cerebrospinal fluid analysis showed normal cell counts but increased protein concentration (202 mg/dL). Fourth, a blood sample referred to an outside laboratory demonstrated elevated levels of vascular endothelial growth factor (3902 pg/mL: normal range, 150‐500 pg/mL). On the basis of these findings, the diagnosis of POEMS syndrome was made. After oral prednisolone (40 mg/day) was initiated, the systemic edema improved gradually, and she did well during the 2‐year follow‐up period.
Commentary
POEMS syndrome, also known as Crow‐Fukase syndrome, is a rare multisystem disorder first described by Crow in 1956.1, 2 It is characterized by polyneuropathy, organomegaly, endocrinopathy, monoclonal gammopathy, and skin changes, as indicated by the acronym. The diagnosis of POEMS syndrome is difficult as this syndrome is rare and requires high clinical suspicion. According to a nationwide cross‐sectional survey in Japan, the prevalence of POEMS syndrome is very low (about 3 patients per 1,000,000 persons),3 and its prevalence in Western countries is considered even lower than that in Japan. The average age at onset is around 45 to 50 years old, and men are twice as likely to have this syndrome as women.46 Table 1 shows the diagnostic criteria of POEMS syndrome, based on research by Dispenzieri and others at the Mayo Clinic, and Table 2 presents the relative frequency of these clinical features.6, 7 The initial symptomatology generally includes polyneuropathy, skin changes, and generalized edema, which are nonspecific symptoms, as are other well‐recognized associated conditions such as clubbing, weight loss, thrombocytosis, polycythemia, and hyperhidrosis. Thus, it is important to consider this syndrome when one is facing an undiagnosed illness involving multiple organ systems and to distinguish it from other conditions such as multiple myeloma, amyloidosis, and monoclonal gammopathy of undetermined significance. Vascular endothelial growth factor is thought to be involved in the edema of POEMS syndrome, as massive release from aggregated platelets increases vascular permeability and venous pressure.710
| |
| Major criteria | Polyneuropathy |
| Monoclonal plasma cell‐proliferative disorder | |
| Minor criteria | Sclerotic bone lesions |
| Castleman disease | |
| Organomegaly (splenomegaly, hepatomegaly, or lymphadenopathy) | |
| Edema (peripheral edema, pleural effusion, or ascites) | |
| Endocrinopathy (adrenal, thyroid, pituitary, gonadal, parathyroid, or pancreatic) | |
| Skin changes (hyperpigmentation, hirsutism, plethora, hemangiomata, and white nails) | |
| Papilledema | |
| Characteristic | % |
|---|---|
| |
| Peripheral neuropathy | 100 |
| Monoclonal plasma cell dyscrasia | 100 |
| Sclerotic bone lesions | 97 |
| Endocrinopathy | 71 |
| Skin changes | 68 |
| Organomegaly | 46 |
| Extravascular volume overload | 39 |
| Papilledema | 29 |
| Castleman disease | 11 |
Data regarding treatment and survival are largely observational. Overall mean survival from diagnosis in the 2003 Dispenzieri cohort was 13.7 years, with death often due to infection or cardiorespiratory failure.6 When a solitary plasmacytoma or osteosclerotic myeloma is present, radiation to the lesion can often lead to clinical remission. Other treatment options include alkylating agents and/or high‐dose chemotherapy with peripheral stem‐cell transplantation, corticosteroids, and supportive care.7
Clinicians frequently use the internet to aid in the clinical decision process. In a survey of the Royal New Zealand College of General Practitioners,11 half reported that they used the Internet to search for clinical information. Two well‐known resources are MEDLINE, which contains over 11 million references dating back to the 1960s, and internet search engines such as Google (and a more recent product, Google Scholar, which attempts to sort search results by including factors such as the author, the publication in which the article appears, and how often the article has been cited).
MEDLINE searches a well‐defined set of journals and uses the Medical Subject Headings (MeSH) vocabulary, which consists of sets of descriptive terms organized in a hierarchical structure to allow searching with various levels of specificity. For instance, entering the term heart attack will map to the MeSH term myocardial infarction and will also include more specific terms such as myocardial stunning and cardiogenic shock.
Google, in comparison, explores resources beyond journals without any clear boundary to its scope, and its advanced search functions can be occasionally unreliable. For instance, search results are occasionally marred by outdated citation information and may include materials that are not truly scholarly. However, search engines can search through the actual text of manuscripts and access the gray literature, which includes open‐source material that is usually original but not widely distributed or often easily available, such as technical reports and dissertations. A direct study comparing the results of searches in PubMed (one of the MEDLINE search engines) and Google Scholar is difficult, but the critical characteristics of each can be compared and contrasted (Table 3).
| Google Scholar | PubMed |
|---|---|
| 1. Database selection is clumped under subject areas, and it cannot be searched with unique identifiers: Con | 1. It allows one to choose a database at the outset and can search with a unique identifier (PubMed identifier): Pro |
| 2. Results cannot be filtered (ie, it does not allow multiple article selection): Con | 2. The single citation matcher allows retrieval of articles with pieces of information: Pro |
| 3. A search for related articles or similar pages is not available: Con | 3. It allows article selection by checkbox to reduce the number of articles relevant to the search query and to append the filter to search box: Pro |
| 4. It allows one to search by without words to exclude unwanted and confusing retrieved data: Pro | 4. It provides unique identifier (PubMed identifier) for each retrieved article for easy communicability: Pro |
| 5. It allows one to search a single journal/publication of interest: Pro | 5. Search are limited to journals only; it does not include the grey area of literature: Con |
| 6. Initial search results are those articles that are most cited by journals that themselves are the most cited: Pro | 6. It lists search results in chronological order and not by relevance: Con |
Internet searches may also suggest diagnoses from a compilation of clinical features, such as in this case. To be successful, such a search must complement the cognitive process; a search engine cannot completely replace clinical judgment. Clinicians must be able to identify salient clinical features and generate high‐yield search terms and then exercise skill in sifting through the citations to arrive at the appropriate diagnosis. A recent study found that Google searches revealed the correct diagnosis in 58% of the case records of the New England Journal of Medicine,12 although each search query resulted in many results, which then had to be manually reviewed for appropriateness within the case's context.
Like a traditional diagnostic test, a search can be described by sensitivity, specificity, and the number of articles needed to read.13 For example, in a study comparing the performance of search strategies to identify clinical practice guidelines in Google Scholar and SUMSearch (another freely accessible search engine), using the term guideline yielded the highest sensitivity, and using the term practice guideline generated the highest specificity and the lowest number of articles needed to read (Table 4).14
| Search Strategy | Sensitivity (%) | Specificity (%) | NNR |
|---|---|---|---|
| |||
| SUMSearch | |||
| Guideline* | 81.51 (74.5388.49) | 74.29 (72.6475.94) | 8.18 (6.9010.05) |
| Recommendation* | 60.50 (51.7269.28) | 76.28 (74.6777.89) | 9.93 (8.1412.72) |
| Practice guideline* | 40.34 (31.5249.16) | 89.45 (88.2990.61) | 6.96 (5.529.43) |
| Google Scholar | |||
| Guideline/s | 31.93 (23.5640.30) | 78.05 (76.5079.60) | 16.67 (12.7624.04) |
| Recommendation/s | 8.40 (3.4213.38) | 92.11 (91.0993.13) | 22.42 (13.9756.82) |
| Practice guideline/s | 11.76 (5.9817.54) | 95.72 (94.9696.48) | 9.29 (6.2118.38) |
Although there are several other popular hosts of web‐based search engines, a more robust decision‐support program may help physicians more efficiently consider relevant diagnoses. One program, named Isabel, has been developed through the indexing of a database of more than 11,000 diseases according to word patterns in journal articles associated with each disease, and it is updated as new and relevant articles emerge. One recent study demonstrated that the correct diagnosis was made in 48 of 50 cases (96%) with specific, key findings as search terms but in only 37 of the same 50 cases (74%) if the entire case history was simply pasted in, again emphasizing the importance of specific search terms.15
POEMS syndrome is a rare entity occasionally seen in middle‐aged individuals and marked by a multitude of nonspecific findings, particularly polyneuropathy and plasma cell dyscrasia. In this case, the diagnostic test was an internet search based on the most prominent clinical symptoms. Such a strategy can provide a powerful addition to traditional literature and MEDLINE resources. However, the efficiency of this process is heavily dependent on the quality of the search strategy and, therefore, the cognitive faculties of the treating physician to avoid the predictable shortcoming of low specificity. Garbage in, garbage out still applies whether the computer in question is the human mind or the desktop PC.
Teaching Points
-
POEMS syndrome, also known as Crow‐Fukase syndrome, is a rare multisystem disorder characterized by polyneuropathy, organomegaly, endocrinopathy, monoclonal gammopathy, and skin changes.
-
Internet‐based searches, including Google and MEDLINE, are being used more frequently because they are widely available, quick, and freely accessed.
-
Internet searches appear most useful as adjuncts to PubMed and clinical reasoning in identifying case reports when a well‐constructed collection of symptoms and signs is used for searches.
- .Peripheral neuritis in myelomatosis.Br Med J.1956;2(4996):802–804.
- ,,,,,.Plasma cell dyscrasia with polyneuropathy, organomegaly, endocrinopathy, M protein, and skin changes: the POEMS syndrome. Report on two cases and a review of the literature.Medicine (Baltimore).1980;59(4):311–322.
- .Nationwide Epidemiologic Survey of Crow‐Fukase Syndrome in 2004.Tokyo, Japan:Japanese Ministry of Health and Welfare Government Report, 2004.
- ,,, et al.The Crow‐Fukase syndrome: a study of 102 cases in Japan.Neurology.1984;34(6):712–720.
- ,,.POEMS syndrome: a study of 25 cases and a review of the literature. French Study Group on POEMS Syndrome.Am J Med.1994;97(6):543–553.
- ,,, et al.POEMS syndrome: definitions and long‐term outcome.Blood.2003;101(7):2496–2506.
- .POEMS syndrome.Hematology.2005;1(1):360–367.
- ,,,,.Greatly raised vascular endothelial growth factor (VEGF) in POEMS syndrome.Lancet.1996;347(9002):702.
- ,.Assessment of hypoproteinaemic oedema: a simple physical sign.Br Med J.1978;1(6117):890–891.
- ,,, et al.Ratio of serum vascular endothelial growth factor to platelet count correlates with disease activity in a patient with POEMS syndrome.Eur J Intern Med.2002;13(1):70–74.
- .In search of evidence: family practitioners' use of the Internet for clinical information.J Med Libr Assoc.2002;90(4):370–379.
- ,.Googling for a diagnosis—use of Google as a diagnostic aid: internet based study.BMJ.2006;333(7579):1143–5114.
- ,,.The number needed to read—a new measure of journal value.Health Info Libr J.2005;22(2):81–82.
- ,,,.Developing search strategies for clinical practice guidelines in SUMSearch and Google Scholar and assessing their retrieval performance.BMC Med Res Methodol.2007;7:28.
- ,.Performance of a web‐based clinical diagnosis support system for internists.J Gen Intern Med.2008;23(suppl 1):37–40.
The approach to clinical conundrums by an expert clinician is revealed through the presentation of an actual patient's case in an approach typical of a morning report. Similarly to patient care, sequential pieces of information are provided to the clinician, who is unfamiliar with the case. The focus is on the thought processes of both the clinical team caring for the patient and the discussant.
A 52‐year‐old woman presented with a 3‐month history of progressive bilateral leg edema and dyspnea while climbing a flight of stairs or while walking up a steep slope. She also complained of a tingling sensation in both hands and fingers, which started about 2 months prior to the onset of edema. She did not describe sensory problems in the lower extremities and did not have any other neurological complaints. She denied fever, cough, chest pain, palpitations, orthopnea, paroxysmal nocturnal dyspnea, and dark stools. She had no history of hypertension, diabetes, dyslipidemia, or asthma and had never been hospitalized. She did not smoke or consume alcohol and used no medications, including over‐the‐counter drugs or dietary supplements. The patient was born in Japan and had not traveled outside the country since her birth. She was a homemaker and had worked occasionally as a manual laborer in sugar cane agriculture. A review of systems revealed no history of polydipsia, polyuria, or cold or heat intolerance but did identify new hair growth, especially on the extremities.
This middle‐aged woman shows progressive changes in her general health status that are characterized by edema and dyspnea on effort. The differential diagnosis of edema includes a broad spectrum of illnesses, such as cardiac, lung, renal, endocrine, and hepatic diseases. Because of the life‐threatening potential, my first concern is cardiac disease, although the patient is not experiencing typical symptoms of ischemic heart disease or congestive failure. Bilateral and distal distribution of neuropathic symptoms is likely due to diseases of peripheral nerves rather than those of the central nervous system. Her complaint of a bilateral tingling sensation in the hands may suggest carpal tunnel syndrome as a result of her long‐term agricultural work. Other possible causes include radiculopathy of the cervical spine or polyneuropathy. Clues in the physical examination may help narrow the differential diagnosis to a cardiac, hepatic, or endocrine disorder.
The patient appeared ill. Her weight had increased from 48 to 61 kg since she was last weighed 6 months previously. Her blood pressure was 140/78 mm Hg, her heart rate was 72 beats/minute with a regular rhythm, her respiratory rate was 18/minute, and her temperature was 37.5C. The jugular venous pressure was elevated at 10 cm above the sternal angle. A grade III/VI systolic ejection murmur was evident at the second interspace along the left sternal border. The second heart sound was fixed and split. There were decreased breath sounds and complete dullness to percussion over both lower lung fields. Shifting dullness was noted on abdominal examination. There was pitting edema from the feet to the thighs, with slow pit‐recovery time in both legs, and she exhibited generalized hirsutism on the face, body, and extremities. There was no lymphadenopathy. On neurological examination, her mental status was normal. The cranial nerves were normal, as was coordination. There was mild generalized distal‐dominant motor weakness with generalized hyporeflexia. Sensory testing demonstrated glove‐and‐stocking type loss of sensation to pinpricks as well as dysesthesia in all extremities. Phalen and Tinel tests were negative.
The elevated venous pressure and pitting edema with slow recovery suggest high venous pressure edema rather than hypoproteinemic edema. Complete bilateral dullness of the chest and shifting dullness of the abdomen indicate the presence of bilateral pleural effusion and ascites. Edema from high venous pressure is usually caused by right, left, or biventricular cardiac failure. A fixed splitting of the second heart sound suggests an atrial septal defect, which is a rare cause of progressive right heart failure in adults. I recommend checking the patient's thyroid function to investigate the possibility of hypothyroidism, which is a common illness among middle‐aged women and could contribute to her edema as well as hirsutism. The neurological findings suggest a generalized polyneuropathy. The unusual combination of high venous pressure edema and polyneuropathy may indicate a rare multisystem disorder such as amyloidosis. Alternatively, the patient might have developed multiple diseases during the same time period. For instance, diabetic polyneuropathy is the most common cause of polyneuropathy among the middle‐aged. Finally, the differential diagnosis of hirsutism includes ovarian, adrenal, or pituitary sources of hyperandrogenism in addition to hypothyroidism. I would first evaluate for diabetes, thyroid disease, and cardiac disease and would like to see the results of laboratory tests for thyrotropin and plasma glucose as well as chest radiography and electrocardiography.
The white‐cell count was 5400/mm3 with a normal differential. Hemoglobin was 10.7 g/dL with normal red‐cell indices, and the platelet count was 276,000/mm3. The erythrocyte sedimentation rate was 29 mm/hour. Other laboratory tests revealed the following values: total protein, 6.2 g/dL; albumin, 3.3 g/dL; blood urea nitrogen, 12 mg/dL; creatinine, 0.7 mg/dL; aspartate aminotransferase, 6 U/L; alanine aminotransferase, 2 U/L; lactate dehydrogenase, 96 U/L; alkaline phosphatase, 115 U/L; creatine phosphokinase, 60 U/L; total bilirubin, 0.9 mg/dL; glucose, 96 mg/dL; hemoglobin A1c, 4.6%; total cholesterol, 111 mg/dL; and thyrotropin, 6.32 mIU/mL (normal range, 0.50‐5.00 mIU/mL). Serum free thyroxine, triiodothyronine, and urine testosterone were normal. Serum dehydroepiandrosterone sulfate was mildly elevated for her age (864 ng/mL: normal range, 180‐750 ng/mL). Serological studies for human immunodeficiency virus, human T‐lymphotrophic virus type 1, and syphilis were negative. Urinalysis was weakly positive for protein but negative for casts and occult blood. The stool was negative for occult blood.
A chest radiograph showed bilateral pleural effusions. Computed tomography demonstrated bilateral pleural effusions, ascites, mild hepatomegaly, and small, multiple, mediastinal lymph nodes. Her electrocardiogram was normal. A transesophageal echocardiogram with agitated saline contrast demonstrated normal ventricular systolic and diastolic function and no atrial septal defect. The inferior vena cava did not collapse with inspiration, and there was no evidence of infiltrative cardiomyopathy.
These laboratory results rule out diabetes as the cause of the polyneuropathy. The subclinical hypothyroidism would not explain profound edema and hirsutism. A serum albumin level of 3.3 g/dL confirms high venous pressure edema rather than hypoproteinemic edema. Normochromic, normocytic anemia and a mildly elevated sedimentation rate point to a chronic illness or inflammatory state. The mediastinal lymphadenopathy may reflect congestion as a result of the high venous pressure or reflect a systemic disease involving lymph nodes. Normal ventricular function with high venous pressure is suggestive of heart failure from diastolic dysfunction, although the patient does not have risk factors for diastolic dysfunction, such as hypertension, and has no other echocardiographic features of diastolic impairment. The combination of hyperandrogenism and neuropathy points to a systemic process, such as a paraneoplastic syndrome. I would next investigate the source of the excess androgens.
Because serum dehydroepiandrosterone sulfate was mildly elevated, I‐131 aldosterol scintigraphy was performed, and it was negative. Electromyography showed a pattern of generalized sensorimotor polyneuropathy.
At this point, it appears that cardiac, endocrine, hepatic, and renal diseases have been largely ruled out as a cause of her symptoms. Reframing and unifying the important clinical problems for this patient may be useful in resolving this diagnostic puzzle. They include (1) systemic high venous pressure edema; (2) generalized sensorimotor polyneuropathy; (3) hirsutism; (4) normocytic, normochromic anemia; (5) an elevated erythrocyte sedimentation rate; (6) mediastinal lymphadenopathy; and (7) subclinical hypothyroidism. At this point, I cannot unify these pieces of information into a single diagnosis. I would search the medical literature, focusing on these terms.
A general internist consultant performed MEDLINE and Google Scholar searches using the key words edema, polyneuropathy, and hirsutism. This search suggested the diagnosis of Crow‐Fukase syndrome, also known as POEMS (polyneuropathy, organomegaly, endocrinopathy, M protein, and skin changes) syndrome. Subsequent evaluations were performed. First, serum protein electrophoresis revealed the presence of monoclonal proteins, although hypergammaglobulinemia was not present. Second, a bone marrow examination demonstrated increased abnormal plasma cell proliferation (7%), although a radiographic skeletal survey found no lesions suggestive of plasmacytoma. Third, cerebrospinal fluid analysis showed normal cell counts but increased protein concentration (202 mg/dL). Fourth, a blood sample referred to an outside laboratory demonstrated elevated levels of vascular endothelial growth factor (3902 pg/mL: normal range, 150‐500 pg/mL). On the basis of these findings, the diagnosis of POEMS syndrome was made. After oral prednisolone (40 mg/day) was initiated, the systemic edema improved gradually, and she did well during the 2‐year follow‐up period.
Commentary
POEMS syndrome, also known as Crow‐Fukase syndrome, is a rare multisystem disorder first described by Crow in 1956.1, 2 It is characterized by polyneuropathy, organomegaly, endocrinopathy, monoclonal gammopathy, and skin changes, as indicated by the acronym. The diagnosis of POEMS syndrome is difficult as this syndrome is rare and requires high clinical suspicion. According to a nationwide cross‐sectional survey in Japan, the prevalence of POEMS syndrome is very low (about 3 patients per 1,000,000 persons),3 and its prevalence in Western countries is considered even lower than that in Japan. The average age at onset is around 45 to 50 years old, and men are twice as likely to have this syndrome as women.46 Table 1 shows the diagnostic criteria of POEMS syndrome, based on research by Dispenzieri and others at the Mayo Clinic, and Table 2 presents the relative frequency of these clinical features.6, 7 The initial symptomatology generally includes polyneuropathy, skin changes, and generalized edema, which are nonspecific symptoms, as are other well‐recognized associated conditions such as clubbing, weight loss, thrombocytosis, polycythemia, and hyperhidrosis. Thus, it is important to consider this syndrome when one is facing an undiagnosed illness involving multiple organ systems and to distinguish it from other conditions such as multiple myeloma, amyloidosis, and monoclonal gammopathy of undetermined significance. Vascular endothelial growth factor is thought to be involved in the edema of POEMS syndrome, as massive release from aggregated platelets increases vascular permeability and venous pressure.710
| |
| Major criteria | Polyneuropathy |
| Monoclonal plasma cell‐proliferative disorder | |
| Minor criteria | Sclerotic bone lesions |
| Castleman disease | |
| Organomegaly (splenomegaly, hepatomegaly, or lymphadenopathy) | |
| Edema (peripheral edema, pleural effusion, or ascites) | |
| Endocrinopathy (adrenal, thyroid, pituitary, gonadal, parathyroid, or pancreatic) | |
| Skin changes (hyperpigmentation, hirsutism, plethora, hemangiomata, and white nails) | |
| Papilledema | |
| Characteristic | % |
|---|---|
| |
| Peripheral neuropathy | 100 |
| Monoclonal plasma cell dyscrasia | 100 |
| Sclerotic bone lesions | 97 |
| Endocrinopathy | 71 |
| Skin changes | 68 |
| Organomegaly | 46 |
| Extravascular volume overload | 39 |
| Papilledema | 29 |
| Castleman disease | 11 |
Data regarding treatment and survival are largely observational. Overall mean survival from diagnosis in the 2003 Dispenzieri cohort was 13.7 years, with death often due to infection or cardiorespiratory failure.6 When a solitary plasmacytoma or osteosclerotic myeloma is present, radiation to the lesion can often lead to clinical remission. Other treatment options include alkylating agents and/or high‐dose chemotherapy with peripheral stem‐cell transplantation, corticosteroids, and supportive care.7
Clinicians frequently use the internet to aid in the clinical decision process. In a survey of the Royal New Zealand College of General Practitioners,11 half reported that they used the Internet to search for clinical information. Two well‐known resources are MEDLINE, which contains over 11 million references dating back to the 1960s, and internet search engines such as Google (and a more recent product, Google Scholar, which attempts to sort search results by including factors such as the author, the publication in which the article appears, and how often the article has been cited).
MEDLINE searches a well‐defined set of journals and uses the Medical Subject Headings (MeSH) vocabulary, which consists of sets of descriptive terms organized in a hierarchical structure to allow searching with various levels of specificity. For instance, entering the term heart attack will map to the MeSH term myocardial infarction and will also include more specific terms such as myocardial stunning and cardiogenic shock.
Google, in comparison, explores resources beyond journals without any clear boundary to its scope, and its advanced search functions can be occasionally unreliable. For instance, search results are occasionally marred by outdated citation information and may include materials that are not truly scholarly. However, search engines can search through the actual text of manuscripts and access the gray literature, which includes open‐source material that is usually original but not widely distributed or often easily available, such as technical reports and dissertations. A direct study comparing the results of searches in PubMed (one of the MEDLINE search engines) and Google Scholar is difficult, but the critical characteristics of each can be compared and contrasted (Table 3).
| Google Scholar | PubMed |
|---|---|
| 1. Database selection is clumped under subject areas, and it cannot be searched with unique identifiers: Con | 1. It allows one to choose a database at the outset and can search with a unique identifier (PubMed identifier): Pro |
| 2. Results cannot be filtered (ie, it does not allow multiple article selection): Con | 2. The single citation matcher allows retrieval of articles with pieces of information: Pro |
| 3. A search for related articles or similar pages is not available: Con | 3. It allows article selection by checkbox to reduce the number of articles relevant to the search query and to append the filter to search box: Pro |
| 4. It allows one to search by without words to exclude unwanted and confusing retrieved data: Pro | 4. It provides unique identifier (PubMed identifier) for each retrieved article for easy communicability: Pro |
| 5. It allows one to search a single journal/publication of interest: Pro | 5. Search are limited to journals only; it does not include the grey area of literature: Con |
| 6. Initial search results are those articles that are most cited by journals that themselves are the most cited: Pro | 6. It lists search results in chronological order and not by relevance: Con |
Internet searches may also suggest diagnoses from a compilation of clinical features, such as in this case. To be successful, such a search must complement the cognitive process; a search engine cannot completely replace clinical judgment. Clinicians must be able to identify salient clinical features and generate high‐yield search terms and then exercise skill in sifting through the citations to arrive at the appropriate diagnosis. A recent study found that Google searches revealed the correct diagnosis in 58% of the case records of the New England Journal of Medicine,12 although each search query resulted in many results, which then had to be manually reviewed for appropriateness within the case's context.
Like a traditional diagnostic test, a search can be described by sensitivity, specificity, and the number of articles needed to read.13 For example, in a study comparing the performance of search strategies to identify clinical practice guidelines in Google Scholar and SUMSearch (another freely accessible search engine), using the term guideline yielded the highest sensitivity, and using the term practice guideline generated the highest specificity and the lowest number of articles needed to read (Table 4).14
| Search Strategy | Sensitivity (%) | Specificity (%) | NNR |
|---|---|---|---|
| |||
| SUMSearch | |||
| Guideline* | 81.51 (74.5388.49) | 74.29 (72.6475.94) | 8.18 (6.9010.05) |
| Recommendation* | 60.50 (51.7269.28) | 76.28 (74.6777.89) | 9.93 (8.1412.72) |
| Practice guideline* | 40.34 (31.5249.16) | 89.45 (88.2990.61) | 6.96 (5.529.43) |
| Google Scholar | |||
| Guideline/s | 31.93 (23.5640.30) | 78.05 (76.5079.60) | 16.67 (12.7624.04) |
| Recommendation/s | 8.40 (3.4213.38) | 92.11 (91.0993.13) | 22.42 (13.9756.82) |
| Practice guideline/s | 11.76 (5.9817.54) | 95.72 (94.9696.48) | 9.29 (6.2118.38) |
Although there are several other popular hosts of web‐based search engines, a more robust decision‐support program may help physicians more efficiently consider relevant diagnoses. One program, named Isabel, has been developed through the indexing of a database of more than 11,000 diseases according to word patterns in journal articles associated with each disease, and it is updated as new and relevant articles emerge. One recent study demonstrated that the correct diagnosis was made in 48 of 50 cases (96%) with specific, key findings as search terms but in only 37 of the same 50 cases (74%) if the entire case history was simply pasted in, again emphasizing the importance of specific search terms.15
POEMS syndrome is a rare entity occasionally seen in middle‐aged individuals and marked by a multitude of nonspecific findings, particularly polyneuropathy and plasma cell dyscrasia. In this case, the diagnostic test was an internet search based on the most prominent clinical symptoms. Such a strategy can provide a powerful addition to traditional literature and MEDLINE resources. However, the efficiency of this process is heavily dependent on the quality of the search strategy and, therefore, the cognitive faculties of the treating physician to avoid the predictable shortcoming of low specificity. Garbage in, garbage out still applies whether the computer in question is the human mind or the desktop PC.
Teaching Points
-
POEMS syndrome, also known as Crow‐Fukase syndrome, is a rare multisystem disorder characterized by polyneuropathy, organomegaly, endocrinopathy, monoclonal gammopathy, and skin changes.
-
Internet‐based searches, including Google and MEDLINE, are being used more frequently because they are widely available, quick, and freely accessed.
-
Internet searches appear most useful as adjuncts to PubMed and clinical reasoning in identifying case reports when a well‐constructed collection of symptoms and signs is used for searches.
- .Peripheral neuritis in myelomatosis.Br Med J.1956;2(4996):802–804.
- ,,,,,.Plasma cell dyscrasia with polyneuropathy, organomegaly, endocrinopathy, M protein, and skin changes: the POEMS syndrome. Report on two cases and a review of the literature.Medicine (Baltimore).1980;59(4):311–322.
- .Nationwide Epidemiologic Survey of Crow‐Fukase Syndrome in 2004.Tokyo, Japan:Japanese Ministry of Health and Welfare Government Report, 2004.
- ,,, et al.The Crow‐Fukase syndrome: a study of 102 cases in Japan.Neurology.1984;34(6):712–720.
- ,,.POEMS syndrome: a study of 25 cases and a review of the literature. French Study Group on POEMS Syndrome.Am J Med.1994;97(6):543–553.
- ,,, et al.POEMS syndrome: definitions and long‐term outcome.Blood.2003;101(7):2496–2506.
- .POEMS syndrome.Hematology.2005;1(1):360–367.
- ,,,,.Greatly raised vascular endothelial growth factor (VEGF) in POEMS syndrome.Lancet.1996;347(9002):702.
- ,.Assessment of hypoproteinaemic oedema: a simple physical sign.Br Med J.1978;1(6117):890–891.
- ,,, et al.Ratio of serum vascular endothelial growth factor to platelet count correlates with disease activity in a patient with POEMS syndrome.Eur J Intern Med.2002;13(1):70–74.
- .In search of evidence: family practitioners' use of the Internet for clinical information.J Med Libr Assoc.2002;90(4):370–379.
- ,.Googling for a diagnosis—use of Google as a diagnostic aid: internet based study.BMJ.2006;333(7579):1143–5114.
- ,,.The number needed to read—a new measure of journal value.Health Info Libr J.2005;22(2):81–82.
- ,,,.Developing search strategies for clinical practice guidelines in SUMSearch and Google Scholar and assessing their retrieval performance.BMC Med Res Methodol.2007;7:28.
- ,.Performance of a web‐based clinical diagnosis support system for internists.J Gen Intern Med.2008;23(suppl 1):37–40.
Genesis and exodus of the healthcare industry
He looked upon the earth so filled with misery and pox
On Cro‐Magnon Neurosurgeons taking tumors out with rocks
With the blood banks run by leeches and their pterodactyl nursing
And observed This can't be healthcare these mere creatures are rehearsing
What shall we do when their lifespan will exceed eleven years?
When they no longer drink from toilet pits or make hearts from used pig ears?
There will need to be a better way to care for newer ills
A time when broadband wireless will be cheaper than their pills
He came up with a brilliant plan to revolutionize the health
To advance all medical outcomes and thereby spread the wealth
But for some strange combination of wisdom, luck, and quirk
He devised sufficient stakeholders to ensure this could not work
So a King might hire a knight to wipe out enemies with his lance
Then buy a plan to pay the cost of repairing his chain mail pants
Then along will come men with crosses of Blue who can manage that so much smarter
By inventing rules that convert poor fools from heroic docs to martyrs
He made tiny things that hide in meat and cause nasty cramps and rashes
That leave only the fittest alive to run in the royal 50 yard dashes
He made plants with spikes and purple leaves that can make one very sick
Then companies who turn green goop to gold that can flow thru a needle stick
He made medical schools to teach more tools, taking 10 years from students' lives
Then ruined careers with malpractice fears if they forget to wash their knives.
He made men whose pockets are filled with stuff from frivolous medical suits
When the experts forget the proper dosing of Peruvian medicinal fruits
He made routine birth a hazardous game between midwife, mom, and fetus
He made people who dress in masks and gloves to bravely retrieve and greet us
Then if anything goes wrong because one more time he throws snake eyes on the dice
He made lawyers to ensure that at least someone benefits while everyone else paid the price
Then along came the buildings with gadgets and learning, to find things we can't hope to fix
And those who get paid to know how NOT to pay the providers of care to the sick
He made organized giants that make tablets and gizmos from the minds of the cream of the crop
And made multiple races with all different faces whose subjective complaints will not stop
But alas came the gadgets, the photons and diodes, the software, the web and the data
Then the standards, the knowledge bases, multiuser interfaces, all in perpetual BETA
To automate the arcane, declare real what is feigned, and make INPUT like losing a toe
Then the last fatal strawhe made privacy laws to ensure they can't share what they know
Oh what have I done, this is really no fun, they now live to one hundred and thirty
But there's no more MDs and the few with degrees refuse to get their hands dirty
Next time when I try to take research to practice I'll start with a real I.O.M.
Evidence galore, so when we screw up once more I can put all the blame right on them
Rapid Response: A QI Conundrum
Many in‐hospital cardiac arrests and other adverse events are heralded by warning signs that are evident in the preceding 6 to 8 hours.1 By promptly intervening before further deterioration occurs, rapid response teams (RRTs) are designed to decrease unexpected intensive care unit (ICU) transfers, cardiac arrests, and inpatient mortality. While implementing RRTs is 1 of the 6 initiatives recommended by the Institute for Healthcare Improvement,2 data supporting their effectiveness is equivocal.3, 4
In October 2006, at Denver Health Medical Center, an academic, safety net hospital, we initiated a rapid response systemclinical triggers program (RRS‐CTP).5 In our RRS‐CTP, an abrupt change in patient status (Figure 1) triggers a mandatory call by the patient's nurse to the primary team, which is then required to perform an immediate bedside evaluation. By incorporating the primary team into the RRT‐CTP, we sought to preserve as much continuity of care as possible. Also, since the same house staff compose our cardiopulmonary arrest or cor team, and staff the ICUs and non‐ICU hospital wards, we did not feel that creating a separate RRT was an efficient use of resources. Our nurses have undergone extensive education about the necessity of a prompt bedside evaluation and have been instructed and empowered to escalate concerns to senior physicians if needed. We present a case that illustrates challenges to both implementing an RRS and measuring its potential benefits.

Case
A 59‐year‐old woman with a history of bipolar mood disorder was admitted for altered mental status. At presentation, she had signs of acute mania with normal vital signs. After initial laboratory workup, her altered mental status was felt to be multifactorial due to urinary tract infection, hypernatremia (attributed to lithium‐induced nephrogenic diabetes insipidus), and acute mania (attributed to medication discontinuation). Because she was slow to recover from the acute mania, her hospital stay was prolonged. From admission, the patient was treated with heparin 5000 units subcutaneously twice daily for venous thromboembolism prophylaxis.
On hospital day 7, at 21:32, the patient was noted to have asymptomatic tachycardia at 149 beats per minute and a new oxygen requirement of 3 L/minute. The cross‐cover team was called; however, although criteria were met, the RRS‐CTP was not activated and a bedside evaluation was not performed. A chest X‐ray was found to be normal and, with the exception of the oxygen requirement, her vital signs normalized by 23:45. No further diagnostic testing was performed at the time.
The next morning, at 11:58, the patient was found to have a blood pressure of 60/40 mmHg and heart rate of 42 beats per minute. The RRS‐CTP was activated. The primary team arrived at the bedside at 12:00 and found the patient to be alert, oriented, and without complaints. Her respiratory rate was 30/minute, and her oxygen saturation was 86% on 3 L/minute. An arterial blood gas analysis demonstrated acute respiratory alkalosis with hypoxemia and an electrocardiogram showed sinus tachycardia with a new S1Q3T3 pattern. A computed tomography angiogram revealed a large, nearly occlusive pulmonary embolus (PE) filling an enlarged right pulmonary artery, as well as thrombus within the left main pulmonary artery. She was transferred to the medical ICU and alteplase was administered. The patient survived and was discharged in good clinical condition.
Discussion
Despite the strong theoretical benefit of the RRT concept, a recent review by Ranji et al.4 concluded that RRTs had not yet been shown to improve patient outcomes. In contrast to dedicated RRTs, this case illustrates a different type of RRS that was designed to address abrupt changes in patient status, while maintaining continuity of care and efficiently utilizing resources.
If one considers an RRS to have both afferent (criteria recognition) and efferent (RRT or primary team response) limbs, the afferent limb must be consistently activated in order to obtain the efferent limb's response.6 The greatest opportunities to improve RRSs are thought to lie in the afferent limb.3 Our RRS‐CTP was not triggered in 1 of 2 instances in which criteria for mandatory initiation of the system were met. This is consistent with the findings of the Medical Early Response Intervention and Therapy (MERIT) trial, in which RRTs were called in only 41% of the patients meeting criteria and subsequently having adverse events,7 and with the ongoing monitoring of the use of the system at our hospital. Had the cross‐covering team seen the patient at the bedside initially, the PE might have been diagnosed while the patient was hemodynamically stable, giving the patient nearly a 3‐fold lower relative mortality.8 When the RRS‐CTP was activated, a prompt bedside evaluation occurred, allowing for lytic therapy to be administered before cardiopulmonary arrest (attendant mortality of 90%).9
While rapid response criteria were originally based upon published sensitivity analyses, more recent studies suggest that these criteria lack diagnostic accuracy. As demonstrated by Cretikos et al,10 to reach a sensitivity of 70%, the corresponding specificity would be only 86%. Given that the prevalence of adverse events in the MERIT trial was only 0.6%, the resulting positive predictive value (PPV) of rapid response call criteria is 3%. Accordingly, 33 calls would be needed to prevent 1 unplanned ICU transfer, cardiac arrest, or death. Nurses' attempts to minimize false‐positive calls may help explain the low call rates for patients meeting RRT criteria. The 2 avenues to increase the PPV of criteria are:
-
Increase the prevalence of disease in the population screened by risk factor stratification.
-
Increase the specificity of the call criteria, which has been limited by the associated decrease in sensitivity.10
Regarding the efferent response limb of RRS, our case demonstrates that the primary team (rather than a separate group of caregivers), when alerted appropriately, can effectively respond to critical changes in patient status. Accordingly, our data show that since the inception of the program, cardiopulmonary arrests have decreased from a mean of 4.1 per month to 2.3 per month (P = 0.03).
Many clinical trials of RRTs would not capture the success demonstrated in this case. For example, due to the low prevalence of events, the MERIT trial used a composite endpoint that included unplanned ICU transfers, cardiac arrests, and mortality. Because our patient still required an unplanned ICU transfer after being evaluated by the responding team, she would have been counted as a system failure.
Conclusion
While local needs should inform the type of RRS implemented, this case illustrates one of the major obstacles ubiquitous to RRS implementation: failure of system activation. With appropriate activation, an RRS‐CTP can meet RRS goals while maintaining continuity of care and maximizing existing resources. This case also illustrates the difficulty of achieving a statistically relevant outcome, while demonstrating the potential benefits of evolving RRSs.
- ,,,,.Rapid response teams—do they make a difference.Dimens Crit Care Nurs.2007;26(6):253–260.
- Institute for Healthcare Improvement. 5 Million Lives Campaign. Available at: http://www.ihi.org/IHI/Programs/Campaign/Campaign.htm?TabId=1IHI. Accessed February2009.
- .The rapid response team paradox: why doesn't anyone call for help?Crit Care Med.2008;36(2):634–636.
- ,,,,.Effects of rapid response systems on clinical outcomes: review and meta‐analyses.J Hosp Med.2007;2:422–432.
- ,,.Clinical triggers and rapid response escalation criteria.Patient Saf Qual Healthc.2007;4(2):12–13. Available at: http://www.psqh.com/archives.html. Accessed February 2009.
- ,,, et al.Use of medical emergency team responses to reduce hospital cardiopulmonary arrest.Qual Saf Health Care.2004;13:251–254.
- MERIT Study Investigators.Introduction of the medical emergency team (MET) system: a cluster‐randomised controlled trial.Lancet.2005;365:2091–2097.
- ,,.Acute pulmonary embolism: clinical outcomes in the international cooperative pulmonary embolism registry (ICOPER).Lancet.1999;353(9162):1386–1389.
- ,,,.Early predictors of mortality for hospitalized patients suffering cardiopulmonary arrest.Chest.1990;97(2):413–419.
- ,,,,,.The objective medical emergency team activation criteria: a case–control study.Resuscitation.2007;73:62–72.
Many in‐hospital cardiac arrests and other adverse events are heralded by warning signs that are evident in the preceding 6 to 8 hours.1 By promptly intervening before further deterioration occurs, rapid response teams (RRTs) are designed to decrease unexpected intensive care unit (ICU) transfers, cardiac arrests, and inpatient mortality. While implementing RRTs is 1 of the 6 initiatives recommended by the Institute for Healthcare Improvement,2 data supporting their effectiveness is equivocal.3, 4
In October 2006, at Denver Health Medical Center, an academic, safety net hospital, we initiated a rapid response systemclinical triggers program (RRS‐CTP).5 In our RRS‐CTP, an abrupt change in patient status (Figure 1) triggers a mandatory call by the patient's nurse to the primary team, which is then required to perform an immediate bedside evaluation. By incorporating the primary team into the RRT‐CTP, we sought to preserve as much continuity of care as possible. Also, since the same house staff compose our cardiopulmonary arrest or cor team, and staff the ICUs and non‐ICU hospital wards, we did not feel that creating a separate RRT was an efficient use of resources. Our nurses have undergone extensive education about the necessity of a prompt bedside evaluation and have been instructed and empowered to escalate concerns to senior physicians if needed. We present a case that illustrates challenges to both implementing an RRS and measuring its potential benefits.
Case
A 59‐year‐old woman with a history of bipolar mood disorder was admitted for altered mental status. At presentation, she had signs of acute mania with normal vital signs. After initial laboratory workup, her altered mental status was felt to be multifactorial due to urinary tract infection, hypernatremia (attributed to lithium‐induced nephrogenic diabetes insipidus), and acute mania (attributed to medication discontinuation). Because she was slow to recover from the acute mania, her hospital stay was prolonged. From admission, the patient was treated with heparin 5000 units subcutaneously twice daily for venous thromboembolism prophylaxis.
On hospital day 7, at 21:32, the patient was noted to have asymptomatic tachycardia at 149 beats per minute and a new oxygen requirement of 3 L/minute. The cross‐cover team was called; however, although criteria were met, the RRS‐CTP was not activated and a bedside evaluation was not performed. A chest X‐ray was found to be normal and, with the exception of the oxygen requirement, her vital signs normalized by 23:45. No further diagnostic testing was performed at the time.
The next morning, at 11:58, the patient was found to have a blood pressure of 60/40 mmHg and heart rate of 42 beats per minute. The RRS‐CTP was activated. The primary team arrived at the bedside at 12:00 and found the patient to be alert, oriented, and without complaints. Her respiratory rate was 30/minute, and her oxygen saturation was 86% on 3 L/minute. An arterial blood gas analysis demonstrated acute respiratory alkalosis with hypoxemia and an electrocardiogram showed sinus tachycardia with a new S1Q3T3 pattern. A computed tomography angiogram revealed a large, nearly occlusive pulmonary embolus (PE) filling an enlarged right pulmonary artery, as well as thrombus within the left main pulmonary artery. She was transferred to the medical ICU and alteplase was administered. The patient survived and was discharged in good clinical condition.
Discussion
Despite the strong theoretical benefit of the RRT concept, a recent review by Ranji et al.4 concluded that RRTs had not yet been shown to improve patient outcomes. In contrast to dedicated RRTs, this case illustrates a different type of RRS that was designed to address abrupt changes in patient status, while maintaining continuity of care and efficiently utilizing resources.
If one considers an RRS to have both afferent (criteria recognition) and efferent (RRT or primary team response) limbs, the afferent limb must be consistently activated in order to obtain the efferent limb's response.6 The greatest opportunities to improve RRSs are thought to lie in the afferent limb.3 Our RRS‐CTP was not triggered in 1 of 2 instances in which criteria for mandatory initiation of the system were met. This is consistent with the findings of the Medical Early Response Intervention and Therapy (MERIT) trial, in which RRTs were called in only 41% of the patients meeting criteria and subsequently having adverse events,7 and with the ongoing monitoring of the use of the system at our hospital. Had the cross‐covering team seen the patient at the bedside initially, the PE might have been diagnosed while the patient was hemodynamically stable, giving the patient nearly a 3‐fold lower relative mortality.8 When the RRS‐CTP was activated, a prompt bedside evaluation occurred, allowing for lytic therapy to be administered before cardiopulmonary arrest (attendant mortality of 90%).9
While rapid response criteria were originally based upon published sensitivity analyses, more recent studies suggest that these criteria lack diagnostic accuracy. As demonstrated by Cretikos et al,10 to reach a sensitivity of 70%, the corresponding specificity would be only 86%. Given that the prevalence of adverse events in the MERIT trial was only 0.6%, the resulting positive predictive value (PPV) of rapid response call criteria is 3%. Accordingly, 33 calls would be needed to prevent 1 unplanned ICU transfer, cardiac arrest, or death. Nurses' attempts to minimize false‐positive calls may help explain the low call rates for patients meeting RRT criteria. The 2 avenues to increase the PPV of criteria are:
-
Increase the prevalence of disease in the population screened by risk factor stratification.
-
Increase the specificity of the call criteria, which has been limited by the associated decrease in sensitivity.10
Regarding the efferent response limb of RRS, our case demonstrates that the primary team (rather than a separate group of caregivers), when alerted appropriately, can effectively respond to critical changes in patient status. Accordingly, our data show that since the inception of the program, cardiopulmonary arrests have decreased from a mean of 4.1 per month to 2.3 per month (P = 0.03).
Many clinical trials of RRTs would not capture the success demonstrated in this case. For example, due to the low prevalence of events, the MERIT trial used a composite endpoint that included unplanned ICU transfers, cardiac arrests, and mortality. Because our patient still required an unplanned ICU transfer after being evaluated by the responding team, she would have been counted as a system failure.
Conclusion
While local needs should inform the type of RRS implemented, this case illustrates one of the major obstacles ubiquitous to RRS implementation: failure of system activation. With appropriate activation, an RRS‐CTP can meet RRS goals while maintaining continuity of care and maximizing existing resources. This case also illustrates the difficulty of achieving a statistically relevant outcome, while demonstrating the potential benefits of evolving RRSs.
- ,,,,.Rapid response teams—do they make a difference.Dimens Crit Care Nurs.2007;26(6):253–260.
- Institute for Healthcare Improvement. 5 Million Lives Campaign. Available at: http://www.ihi.org/IHI/Programs/Campaign/Campaign.htm?TabId=1IHI. Accessed February2009.
- .The rapid response team paradox: why doesn't anyone call for help?Crit Care Med.2008;36(2):634–636.
- ,,,,.Effects of rapid response systems on clinical outcomes: review and meta‐analyses.J Hosp Med.2007;2:422–432.
- ,,.Clinical triggers and rapid response escalation criteria.Patient Saf Qual Healthc.2007;4(2):12–13. Available at: http://www.psqh.com/archives.html. Accessed February 2009.
- ,,, et al.Use of medical emergency team responses to reduce hospital cardiopulmonary arrest.Qual Saf Health Care.2004;13:251–254.
- MERIT Study Investigators.Introduction of the medical emergency team (MET) system: a cluster‐randomised controlled trial.Lancet.2005;365:2091–2097.
- ,,.Acute pulmonary embolism: clinical outcomes in the international cooperative pulmonary embolism registry (ICOPER).Lancet.1999;353(9162):1386–1389.
- ,,,.Early predictors of mortality for hospitalized patients suffering cardiopulmonary arrest.Chest.1990;97(2):413–419.
- ,,,,,.The objective medical emergency team activation criteria: a case–control study.Resuscitation.2007;73:62–72.
The Accidental Hospitalist
David Yu, MD, learned early on the value of being flexible. While attending Washington University in St. Louis, he found his calling when he changed his major from economics to biology. When the malpractice insurance crisis forced him to close his private practice, he embraced an opportunity to launch a program devoted to the “newfangled concept” of hospital medicine.
“I’m kind of like the accidental tourist,” says Dr. Yu, medical director of hospitalist services at the 372-bed Decatur Memorial Hospital in Decatur, Ill., and clinical assistant professor of family and community medicine at Southern Illinois University School of Medicine in Carbondale. “I didn’t really go to college with the mind-set of being a doctor, and when I became a doctor, there was no such thing as a hospitalist. … I went where the current took me and, fortunately, here I am.”
Question: What prompted the switch from economics to pre-med/biology?
Answer: When I got to the upper-level econ classes, I realized why the economy is the way it is: because nobody can understand how it works. My sister was in medical school. She really liked it and she talked me into it.
Q: You spent nine years in traditional practice. Why did you become a hospitalist?
A: In 2004, my malpractice insurance rate shot up 400% without any active lawsuits, so I had to close my practice. I had the choice of joining another traditional group, or Decatur (Memorial Hospital) was starting a new hospitalist program. To quote “The Godfather,” they made me an offer I couldn’t refuse.
Q: How did your experience in traditional practice prepare you for your role as a hospitalist?
A: I had been surrounded by incredible specialists. I saw how they interacted with me and how they treated my patients. As hospitalists, we are serving our patients, but really our clientele is the physicians we admit for. When I made the switch, I really had an idea of how a hospitalist should serve traditional practice.
Q: What is that service model?
A: It comes down to what I call the three A’s: You have to be available, you have to be able, and you have to be amicable. One of the problems in our field is a lot of hospitalists complain they’re treated like residents. They say they don’t get respect. They feel mistreated. That’s the wrong attitude. You can’t just ask for respect or demand it. You have to develop relationships.
Q: When Decatur’s hospitalist program started, you were on your own. Now there are seven physicians, two physician assistants, and a practice manager. How rewarding has it been to see it grow?
We have to find ways to help hospitalists take more ownership in their patients and their program. ... With our schedule, you can’t pawn off your responsibility to the nocturnist or the weekend guy.
—David Yu, MD, Decatur (Ill.)
Memorial Hospital
A: It’s been very rewarding. I’m honored to have been chosen as a member of Team Hospitalist, and I’m honored to be a committee member for SHM’s Non-Physician Provider Committee. Those are personal honors, but they are reflections on the success of the program. It’s an honor for the entire Decatur Memorial Hospital, and the administration, that a program started four and a half years ago, indirectly, has received national recognition.
Q: You implemented a one-week-on, one-week-off schedule for your hospitalists as a way to decrease signouts. How did that come about?
A: Signouts have been the bane of medical mistakes. Instead of having signouts twice a day, we have one physician on call for that entire week for his or her patients. It’s patient-centric versus schedule-centric. Physicians leave the hospital when their work is done, instead of looking at the clock and waiting to sign out at a certain time like a factory worker. It treats hospitalists not as shift workers but as attending physicians. It gives them due respect that they can manage their own patients responsibly.
Q: Do you think the schedule improves the quality of patient care?
A: The continuity of care is incredible. If you are admitted and discharged between Mondays, you have one hospitalist in charge of your entire case, instead of multiple physicians being on call for you. That increases patient satisfaction, reduces medical errors, and eliminates the need for unnecessary tests when new physicians take over. I’m also a huge believer that scheduling brings out the best and worst in hospitalists.
Q: How does it bring out the best in them?
A: As medical directors, we have to find ways to help hospitalists take more ownership in their patients and their program. If they’re thinking, “My shift is ending and I’m going to be off and I can hand this issue off to the next doctor,” that can have a tremendous effect on the quality of care and the way a hospitalist delivers medicine. With our schedule, you can’t pawn off your responsibility to the nocturnist or the weekend guy. … If something goes wrong or if the ball gets dropped, there’s no one else to blame it on.
Q: You developed a system at Decatur through which patient discharge summaries are sent electronically to primary-care physicians, often before the patient leaves the hospital. Have the primaries been receptive?
A: Absolutely. Communication is the mother’s milk of hospitalists. Some hospitalist programs are very large, they’re very busy, or there’s no incentive for them to do this because they’re the only game in town. But I practice in a mid-size community and I know all of these doctors. My reputation is my bond. I have to provide good service.
Q: What do you enjoy most about your role as a hospitalist?
A: I love solving problems for a patient. I also love how the relationship builds. You introduce yourself to a patient and their family as a hospitalist and they’re thinking, “Who the heck are you?” For a few seconds, it’s like meeting someone on a blind date. And when they’re discharged, they tell you they had a pleasant experience and they appreciate your help. It’s a courtship at a rapid pace.
Q: What do you consider to be your biggest challenge?
A: Recruitment; the administration asking us to take on more responsibilities; burnout. … We’re a typical hospitalist program; I think the problems are pretty universal.
Q: How do you address those challenges?
A: As medical director, you’re always navigating political and personal minefields. It comes back to developing relationships. The only way to earn goodwill is to give and provide service. That’s a problem some hospitalist programs run into. They want to instantly demand respect. You can’t demand it; you have to earn it. Sometimes hospitalists feel dumped on. Those are opportunities … to provide service in a willing and positive way instead of complaining. I’m not saying you have to be a whipping boy, but there are times when you have to give a little to get a little. That’s where the wisdom of the medical director comes in and sets the whole tone.
Q: What’s ahead for the academic side of your career?
A: We’re considering the possibility of starting a family practice fellowship program for attending residents who finish but want to go into the field of hospital medicine and want additional training. It’s not a done deal, but it’s an exciting possibility.
Q: How so?
A: Every medical director says they have a hard time recruiting. One way we can help solve the problem is by producing more hospitalists. We can’t just complain. We have to increase the pool of professionals interested in our model, train them, and get them integrated into our system.
Q: What advice would you give a student who is considering going that route?
A: You have to be a good communicator, you have to enjoy taking care of very sick people, and you have to enjoy solving very complex problems. You can’t just do it for the lifestyle. If you do, you won’t be happy in the long run. If I ask a medical student or resident why they want to be a hospitalist and they say, “I like the one-week-on, one-week-off schedule,” I tell them, “If that’s the reason you’re considering it, you really should reconsider.” TH
Mark Leiser is a freelance writer in New Jersey.
Palliative-Care Payment
Many hospitalists provide palliative-care services to patients at the request of physicians within their own groups or from other specialists. Varying factors affect how hospitalists report these services—namely, the nature of the request and the type of service provided. Palliative-care programs can be quite costly as they involve several team members and a substantial amount of time delivering these services. Capturing services appropriately and obtaining reimbursement to help continue program initiatives is pertinent.
Nature of the Request
Members of a palliative-care team often are called on to provide management options to assist in reducing pain and suffering associated with both terminal and nonterminal disease, thereby improving a patient’s quality of life. When a palliative-care specialist is asked to provide an opinion or advice, the initial service could qualify as a consultation. However, all requirements must be met in order to report the service as an inpatient consultation (codes 99251-99255).
There must be a written request from a qualified healthcare provider involved in the patient’s care (e.g., a physician, resident, or nurse practitioner). In the inpatient setting, this request can be documented as a physician order or in the assessment of the requesting provider’s progress note. Standing orders for consultation are not permitted. Ideally, the requesting provider should identify the reason for a consult to support the medical necessity of the service.
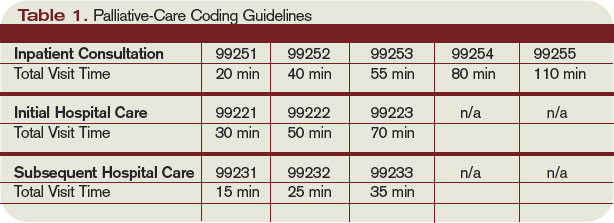
Additionally, the palliative-care physician renders and documents the service, then reports findings to the requesting physician. The consultant’s required written report does not have to be sent separately to the requesting physician. Because the requesting physician and the consultant share a common medical record in an inpatient setting, the consultant’s inpatient progress note suffices the “written report” requirement.
One concern about billing consultations involves the nature of the request. If the requesting physician documents the need for an opinion or advice from the palliative-care specialist, the service can be reported as a consultation. If, however, the request states consult for “medical management” or “palliative management,” it’s less likely that payors will consider the service a consultation. In the latter situation, it appears as if the requesting physician is not seeking an opinion or advice from the consultant to incorporate into his own plan of care for the patient and would rather the consultant take over that portion of patient care.
Recently revised billing policies prevent the consultant from billing consults under these circumstances. Without a sufficient request for consultation, the palliative-care specialist can only report “subsequent” hospital care services.1 Language that better supports the consultative nature of the request is:
- Consult for an opinion or advice on palliative measures;
- Consult for evaluation of palliative options; and
- Consult palliative care for treatment options.
Proper Documentation
The requesting physician can be in the same or different provider group as the consultant. The consultant must possess expertise in an area beyond that of the requesting provider. Because the specialty designation for most hospitalists is internal medicine, palliative-care claims could be scrutinized more closely. This does not necessarily occur when the requesting provider has a different two-digit specialty designation (e.g., internal medicine and gastroenterology).2 Scrutiny is more likely to occur when the requesting provider has the same internal-medicine designation as the palliative-care consultant, even if they are in different provider groups.
Payor concern escalates when physicians of the same designated specialty submit claims for the same patient on the same date. Having different primary diagnosis codes attached to each visit level does not necessarily help. The payor is likely to deny the second claim received, pending a review of documentation. If this happens, the provider who received the denial should submit a copy of both progress notes for the date in question. Hopefully, the distinction between the services is demonstrated in the documentation.
Service Type
Palliative services might involve obtaining and documenting the standard key components for visit-level selection: history, exam, and medical decision-making.3 However, the palliative-care specialist might spend more time providing counseling or coordination of care for a patient and family. When this occurs, the palliative-care specialist should not forget about the guidelines for reporting time-based services.4 Inpatient services may be reported on the basis of time, as long as a face-to-face service between the provider and the patient occurs. Consider the total time spent face to face with the patient, and the time spent obtaining, discussing, and coordinating patient care, while you are in the patient’s unit or floor.
As a reminder, document the total time, the amount of time spent counseling, and the details of discussion and coordination. The physician may count the time spent counseling the patient’s family regarding the treatment and care, as long as the focus is not emotional support for the family, the meeting takes place in the patient’s unit or floor, and the patient is present, unless there is medically supported reason for which the patient is unable to participate (e.g., cognitive impairment). The palliative-care specialist can then select the visit level based on time.5 (See Table 1, above.) TH
Carol Pohlig is a billing and coding expert with the University of Pennsylvania Medical Center, Philadelphia. She is on the faculty of SHM’s inpatient coding course.
References
1. Centers for Medicare and Medicaid Services. Medicare Claims Processing Manual: Chapter 12, Section 30.6.10. CMS Web site. Available at: www.cms.hhs.gov/manuals/downloads/clm104c12.pdf. Accessed Jan. 30, 2009.
2. Centers for Medicare and Medicaid Services. Medicare Claims Processing Manual: Chapter 26, Section 10.8. CMS Web site. Available at: www.cms.hhs.gov/manuals/downloads/clm104c26.pdf. Accessed Jan. 30, 2009.
3. Centers for Medicare and Medicaid Services. Documentation Guidelines for Evaluation and Management Services. CMS Web site. Available at: www.cms.hhs.gov/MLNEdWebGuide/25_EMDOC.asp. Accessed Jan. 30, 2009.
4. Centers for Medicare and Medicaid Services. Medicare Claims Processing Manual: Chapter 12, Section 30.6.1B. CMS Web site. Available at: www.cms.hhs.gov/manuals/downloads/clm104c12.pdf. Accessed Jan. 30, 2009.
5. Beebe M, Dalton J, Espronceda M, Evans D, Glenn R. Current Procedural Terminology Professional Edition. Chicago: American Medical Association Press; 2008.
Many hospitalists provide palliative-care services to patients at the request of physicians within their own groups or from other specialists. Varying factors affect how hospitalists report these services—namely, the nature of the request and the type of service provided. Palliative-care programs can be quite costly as they involve several team members and a substantial amount of time delivering these services. Capturing services appropriately and obtaining reimbursement to help continue program initiatives is pertinent.
Nature of the Request
Members of a palliative-care team often are called on to provide management options to assist in reducing pain and suffering associated with both terminal and nonterminal disease, thereby improving a patient’s quality of life. When a palliative-care specialist is asked to provide an opinion or advice, the initial service could qualify as a consultation. However, all requirements must be met in order to report the service as an inpatient consultation (codes 99251-99255).
There must be a written request from a qualified healthcare provider involved in the patient’s care (e.g., a physician, resident, or nurse practitioner). In the inpatient setting, this request can be documented as a physician order or in the assessment of the requesting provider’s progress note. Standing orders for consultation are not permitted. Ideally, the requesting provider should identify the reason for a consult to support the medical necessity of the service.
Additionally, the palliative-care physician renders and documents the service, then reports findings to the requesting physician. The consultant’s required written report does not have to be sent separately to the requesting physician. Because the requesting physician and the consultant share a common medical record in an inpatient setting, the consultant’s inpatient progress note suffices the “written report” requirement.
One concern about billing consultations involves the nature of the request. If the requesting physician documents the need for an opinion or advice from the palliative-care specialist, the service can be reported as a consultation. If, however, the request states consult for “medical management” or “palliative management,” it’s less likely that payors will consider the service a consultation. In the latter situation, it appears as if the requesting physician is not seeking an opinion or advice from the consultant to incorporate into his own plan of care for the patient and would rather the consultant take over that portion of patient care.
Recently revised billing policies prevent the consultant from billing consults under these circumstances. Without a sufficient request for consultation, the palliative-care specialist can only report “subsequent” hospital care services.1 Language that better supports the consultative nature of the request is:
- Consult for an opinion or advice on palliative measures;
- Consult for evaluation of palliative options; and
- Consult palliative care for treatment options.
Proper Documentation
The requesting physician can be in the same or different provider group as the consultant. The consultant must possess expertise in an area beyond that of the requesting provider. Because the specialty designation for most hospitalists is internal medicine, palliative-care claims could be scrutinized more closely. This does not necessarily occur when the requesting provider has a different two-digit specialty designation (e.g., internal medicine and gastroenterology).2 Scrutiny is more likely to occur when the requesting provider has the same internal-medicine designation as the palliative-care consultant, even if they are in different provider groups.
Payor concern escalates when physicians of the same designated specialty submit claims for the same patient on the same date. Having different primary diagnosis codes attached to each visit level does not necessarily help. The payor is likely to deny the second claim received, pending a review of documentation. If this happens, the provider who received the denial should submit a copy of both progress notes for the date in question. Hopefully, the distinction between the services is demonstrated in the documentation.
Service Type
Palliative services might involve obtaining and documenting the standard key components for visit-level selection: history, exam, and medical decision-making.3 However, the palliative-care specialist might spend more time providing counseling or coordination of care for a patient and family. When this occurs, the palliative-care specialist should not forget about the guidelines for reporting time-based services.4 Inpatient services may be reported on the basis of time, as long as a face-to-face service between the provider and the patient occurs. Consider the total time spent face to face with the patient, and the time spent obtaining, discussing, and coordinating patient care, while you are in the patient’s unit or floor.
As a reminder, document the total time, the amount of time spent counseling, and the details of discussion and coordination. The physician may count the time spent counseling the patient’s family regarding the treatment and care, as long as the focus is not emotional support for the family, the meeting takes place in the patient’s unit or floor, and the patient is present, unless there is medically supported reason for which the patient is unable to participate (e.g., cognitive impairment). The palliative-care specialist can then select the visit level based on time.5 (See Table 1, above.) TH
Carol Pohlig is a billing and coding expert with the University of Pennsylvania Medical Center, Philadelphia. She is on the faculty of SHM’s inpatient coding course.
References
1. Centers for Medicare and Medicaid Services. Medicare Claims Processing Manual: Chapter 12, Section 30.6.10. CMS Web site. Available at: www.cms.hhs.gov/manuals/downloads/clm104c12.pdf. Accessed Jan. 30, 2009.
2. Centers for Medicare and Medicaid Services. Medicare Claims Processing Manual: Chapter 26, Section 10.8. CMS Web site. Available at: www.cms.hhs.gov/manuals/downloads/clm104c26.pdf. Accessed Jan. 30, 2009.
3. Centers for Medicare and Medicaid Services. Documentation Guidelines for Evaluation and Management Services. CMS Web site. Available at: www.cms.hhs.gov/MLNEdWebGuide/25_EMDOC.asp. Accessed Jan. 30, 2009.
4. Centers for Medicare and Medicaid Services. Medicare Claims Processing Manual: Chapter 12, Section 30.6.1B. CMS Web site. Available at: www.cms.hhs.gov/manuals/downloads/clm104c12.pdf. Accessed Jan. 30, 2009.
5. Beebe M, Dalton J, Espronceda M, Evans D, Glenn R. Current Procedural Terminology Professional Edition. Chicago: American Medical Association Press; 2008.
A Pivotal Year for Policy
Change is in the air. With a new ad-ministration promising to be a change agent, an overhauled Congress, and a seemingly unanimous national interest in tackling healthcare reform, what changes can hospital medicine expect in 2009?
“I think there’s certainly the political will and interest now,” says Eric Siegal, MD, chair of SHM’s Public Policy Committee. “We haven’t had enough political will to ‘go big’ until recently. Now that we have it, the trillion-dollar question is where the money will come from.”
With that in mind, let’s explore three of the hottest healthcare issues:
Comprehensive Healthcare Reform
Providing healthcare coverage to all or most Americans was a centerpiece of President Obama’s campaign and a significant part of a proposal published by Senate Finance Committee Chairman Max Baucus (D-Mont.). Any actual reform will come through legislation, which will have to spell out who is covered and how, and where the money will come from. Any legislation will have to pass both the House and the Senate before Obama can sign it into law.
“The Democrats have certainly said [healthcare reform] is going to happen. Obama has talked about it … but how bipartisan will the effort be?” Dr. Siegal says. “This is too big and important for unilateral action; any durable healthcare reform must have bipartisan support. I do think that everyone can agree that the healthcare system is going to bankrupt itself if we don’t make changes.”
Dr. Siegal is skeptical that a major reform bill of any stripe will be passed anytime soon. “Given the depth of the recession and the projected cost of the stimulus package, my guess is that we will not see significant healthcare reform legislation passed in 2009,” he predicts. “However, I think that 2009 is still going to be an important year in that Congress will lay much of the foundation for new legislation. My guess is that 2010 is the year to look for major healthcare reform. And we want to make sure that the reform that happens is in the best interests of healthcare and of hospitalists.”
Less encompassing aspects of healthcare reform, the “easy stuff,” should have enough votes to pass in 2009, Dr. Siegal says. A good example is the State Children’s Health Insurance Program (SCHIP), which was passed the first week of February and increases the number of children eligible for free medical coverage from 7 million to 11 million. “SCHIP was as close to a slam dunk as possible.”
Major overhauls to the system, such as the healthcare exchange outlined in Sen. Baucus’ proposal or a major reworking of Medicare, may come about further down the road. “Those are going to take a lot of time, energy, and money,” Dr. Siegal says, “and I think that Congress has bigger fish to fry right now.”
Physician Fee Schedule
Last summer, physician fees paid by Medicare were slashed by 10.6% and then restored—with a 1.1% increase—when Congress overrode a presidential veto. SHM members were among the many physicians who fought the fee cut with letters and e-mails to Congress. However, the current fee schedule is short-lived: A 20% fee cut is scheduled for 2010. Will hospitalists and others have to go through the same battle all over again to maintain their Medicare payments?
Bradley Flansbaum, DO, MPH, chief of the hospitalist section at Lenox Hill Hospital in New York City and a member of SHM’s Public Policy Committee, points out “there are some proposals to modify the SGR [sustainable growth rate] formula, so this may not be the hot issue it was in 2008.” The SGR is used to set reimbursement rates for specific services and have been targeted by numerous stakeholders as flawed.
Regardless of the reimbursement formula, the Centers for Medicare and Medicaid Services (CMS) physician fee schedule might become less crucial to hospitalists’ income. “In the context of healthcare reform, you have to wonder if fee-for-service is even going to be relevant,” Dr. Flansbaum explains. “I think that Congress and MedPAC will think things through and admit that we can’t keep Band-Aiding a broken system.”
A major system overhaul might be looming. “This may not happen this year,” he says, “but I think that if Congress needs to avert the pay cut, then they will say they’re doing this one more time, with the caveat that payment will be drastically different” in the near future.
Delivery System Reform
A third hot topic for 2009 is legislation and consideration of changes in the healthcare delivery system, including payment reform, healthcare information technology, and improving care coordination.
“We think that payment reform is central to reshaping the healthcare system,” Dr. Siegal says.
As for moving toward a fee-for-quality system: “Well, there’s politics and there’s policy,” Dr. Flansbaum says. “Politics says we need to reward quality. However, the policy is that the methods of measuring quality haven’t evolved to the point where we can go forward. Everything is in beta-testing right now; we’re not ready to make any sweeping decisions. The delivery system has to be well-thought-out. It’s complicated.”
For example, in 2008, the CMS published a proposed inpatient prospective payment system rule, which included additional categories of hospital-acquired conditions that would no longer carry higher Medicare payments. The list caused industry alarm because some of the conditions—including Clostridium difficile-associated disease (see “Clostridium Difficile Infection: Are We Doing Enough,” p. 12)—were seen as only partially preventable in hospitalized patients or not entirely hospital-acquired.
The lesson learned? Any reform to healthcare delivery must be carefully considered, along with input from the medical community. “Healthcare is 16% of the gross domestic product. You don’t take that and spin it around in one day,” Dr. Flansbaum says. “It’s best to approach reform slowly and really think it through.”
Even so, there is no guarantee that reform legislation will make it through Congress.
“Another aspect to consider is that there are ideological differences between Democrats and Republicans,” Dr. Flansbaum adds. “ … Many Republicans are miles away from [Democrats] ideologically. Further still, with Daschle’s exit, it is unclear how his replacement will approach any overhaul.”
Of course, nobody has a crystal ball. This year may bring forth less drastic changes than hospital medicine is predicting. Then again, considering the economic and political climate, reform could take place faster than seems possible.
Only time will tell. TH
Jane Jerrard is a medical writer based in Chicago.
Appearance Counts
Your physical appearance—the image and demeanor you present in your work environment—plays an important role in your career. If you aspire to a leadership position or are looking for a new job, be sure to examine your outward style as carefully as you craft your curriculum vitae.
“This is a huge, woefully unexplored way that physicians relate to the world,” says Mary Frances Lyons, MD, an executive search consultant with Witt/Kiefer in St. Louis. “Let’s call it body language. It’s the attitude or deportment you show. If you’re not the most corporate person in the world, you can still appear to be open, enthusiastic about your work, and have integrity.”
Kindergarten Revisited
Dr. Lyons frequently coaches physician executives before job interviews. She instructs many of them in the basics: standing up straight, making eye contact, smiling, and having a firm handshake. “This is literally your chance to connect with other people,” she says. “Send a signal that you want to connect, that you’re open, and you’ll bring that out in them as well.”
Her advice may seem simplistic, and she agrees. “You can literally learn this stuff in kindergarten—but many physicians don’t do it,” she says. “Their currency of credibility is how smart they are, and they rely on that. The truth is that no one in medical school ever teaches physicians that a large part of their medical success is how they interact with and relate to others—including patients, their boss, payers, and colleagues.” As a clinician, you can get by with minimal social skills or attention to your demeanor, but Dr. Lyons warns, “If you want to move up the food chain, this is professionally important.”
Typically, hospitalists are insulated from the traditional office dress code (i.e., suits and ties and heels), but doctors are not immune to the basic standards of workplace appearance. “For better or for worse, hospital medicine groups are not corporate,” Dr. Lyons points out. “The question is, how do you become corporate enough to get the job offer or the promotion?”
Look the Part
If you want a higher-level position, whether you’re aiming for a promotion, interviewing for an important committee position, or seeking a new job, consider the impression you make before you open your mouth.
“Your style and attitude is more important than how you dress,” Dr. Lyons says. “However, appearance-wise, you want to look professional and serious … not somber. Be appropriate and nondescript; you don’t want interesting clothes or clothes that make a statement. You want people to think, ‘What a professional person,’ not ‘Wow, I really love those earrings.’ ”
When you have an important interview or meeting, wear a dark business suit. Pantsuits are fine for women, Dr. Lyons says. “You can never, ever go wrong with a suit,” she says. “You don’t want the people interviewing you to be better dressed than you. Your appearance signals how you’ll present yourself to patients.”
Ultimately, a physician’s behavior and professional interactions are significant considerations in the hiring process, says Kenneth Simone, DO, owner of Hospitalist and Practice Solutions in Veazie, Maine, and author of the upcoming book “Hospitalist Recruitment and Retention: Building a Hospital Medicine Program.” “It will affect relationships with all stakeholders in the healthcare system. Furthermore, if the hospitalist’s professional relationship with the nursing staff and other hospital staff disintegrates, it can affect patient care.”
Listen Up
During a job interview, promotional interview, or committee chair interview, the balance between how much you say and when you stop talking can reveal much about your attitude. Hiring managers look for leaders who can listen as well as they direct. “Doctors have no idea how to listen,” Dr. Lyons says. “I sometimes recommend that a client limit himself or herself to three sentences to answer a question.” Dr. Simone agrees. “A job candidate should discuss their professional and personal interests when queried but should refrain from dominating the discussion. It should be an interactive exchange,” he says.
Dr. Lyons recommends preparing for an interview by putting together a three- to five-minute presentation about who you are as a professional. Your interviewers will already have your resume, so avoid recounting what they already know. “If you’re having trouble with these things, put on your interview suit, then videotape yourself giving your presentation,” Dr. Lyons says. “Watch it and ask yourself, ‘Would I hire this person?’ It’s a grim exercise, but it’s effective.”
Consider your demeanor and make changes that allow you to show off your personal strengths and your ability to connect. Simple changes—upgrades, if you will—can lift you above your competition. “If concerns arise with one candidate, the rule of thumb is to avoid taking a chance on hiring a potential problem physician,” Dr. Simone says. “Recruitment is expensive. It has been estimated that making an incorrect [hire] can cost a program up to $100,000, when you consider expenses such as headhunter fees, sign-on bonus, moving expenses, and advertising, in addition to lost revenues for the program while staff participate in the recruitment process and lost productivity when the program is down one provider.”
A good attitude, openness to others, and a professional demeanor can bolster your career path. As Dr. Lyons points out, “If you don’t interview well, other people will make all the major decisions for your career. Physicians have not been taught to interview well. The good news is, it’s not that hard.” TH
Jane Jerrard is a medical writer based in Chicago. She also writes “Public Policy” for The Hospitalist.
C. Difficile Infection: Are We Doing Enough?
The worst of the nationwide Clostri-dium difficile epidemic is yet to come. The current, highly virulent NAP1/027 strain has reached all 50 states and Canada, with a total burden estimated at more than 500,000 annual cases.1
The economic burden associated with managing C. difficile-associated disease (CDAD) in Massachusetts hospitals over a two-year period was estimated at $51.2 million and associated with 55,380 inpatient days.2 A retrospective review (n=3,692) identified a mean cost per stay for a first hospitalization with a primary CDAD diagnosis at $10,212. This was associated with a mean length of stay (LOS) of 6.4 days. For patients with a secondary CDAD diagnosis, the LOS was estimated at 15.7 days, most likely due to time spent in the intensive-care unit (ICU) and not likely related to CDAD management. The CDAD-related increased LOS in these patients was estimated to be an additional 2.95 days, with an additional cost of $13,675.
More recently, CDAD-associated costs were noted to be more than $7,000 per case, according to data from 439 cases evaluated by two statistical methods.3
Bacillus Background
C. difficile is a spore-forming, gram-positive, anaerobic bacillus that has become one of the most significant causes of hospitalization-associated diarrhea in adults.4 The number of infections occurring with the more virulent strain is disquieting. It is associated with a spectrum of illnesses, which include uncomplicated diarrhea presenting as mild, watery stools, life-threatening pseudomembranous colitis, and toxic megacolon, leading to sepsis and death.
CDAD might be an unrecognized and under-reported cause of death in the U.S.5 From 1999 to 2004, CDAD was reported as a cause of death for 24,642 people and an underlying cause of death for an additional 12,264 people.6 The median patient age was 82.
As an aside, CDAD is the older terminology for what is now being referred to as C. difficile infection (CDI).
CDI is predominantly seen as a nosocomial or long-term-care facility concern, although community-acquired infections have been reported.7 Risk factors include previous antimicrobial use, particularly with clindamycin, fluoroquinolones, cephalosporins, ampicillin, or ß-lactams. Other risk factors include use of immunosuppressants or chemotherapeutic agents, advanced age, surgery, exposure to gastric acid suppressants, host immunity, and serious underlying illnesses or comorbidities.8,9 Gastric acid suppressant use outside a healthcare facility might be a significant risk factor for outpatient CDI.
Prevention
Healthcare-facility-based CDI prevention strategies include discontinuing any suspected antibiotic, as this alone has been known to resolve CDI in up to 25% of patients. C. difficile spores are resistant to bactericidal effects of alcohol and most hospital disinfectants. Therefore, additional prevention measures should include:
- Meticulous and proper hand hygiene for healthcare workers, patients, and visitors;
- Utilizing soap and water and avoiding alcohol-based rubs that are not sporicidal;
- Environmental cleaning with sporicidal cleaning agents;
- Placing patients under contact isolation infection control procedures until resolution of the diarrhea; and
- Adopting antibiotic restriction policies to limit excessive antimicrobial use.
Two additional principles include not giving prophylactic antimicrobials for patients at high risk of developing CDI and not treating or attempting to decolonize asymptomatic C. difficile carriers. The Centers for Disease Control recently developed a patient-safety initiative to assist healthcare facilities in dealing with multidrug-resistant organisms (MDRO) and CDAD.10
Management
General management strategies for CDI patients include:
- Discontinuing all unnecessary antimicrobials or utilizing lower-risk agents when able;
- Monitoring volume status and electrolytes and appropriately replete when necessary;
- Avoiding anti-diarrheal agents, such as loperamide, atropine, or diphenoxylate, as these agents do not allow the toxin to be excreted and can worsen symptoms and lead to serious complications;
- Encouraging patient hand hygiene through use of soap and water;
- Possibly avoiding the use of lactose-containing foods;
- Possibly discontinuing proton pump inhibitors and other acid suppressants; and
- Administering specific anti-Clostridial antibiotics, if necessary, based on infection severity.
Severe CDI causes volume depletion, electrolyte imbalances, and hypotension, as well as renal impairment, hemodynamic instability, leukocytosis, toxic megacolon, and death. Severe diarrhea associated with this form of CDI might include 10 or more loose stools per day. A surgical consultation should be obtained for a complete evaluation in the most severe cases, as patients may require colectomy.
Recent reports suggest oral (OP) vancomycin be considered as first-line therapy for severe CDI. Intravenous (IV) vancomycin should not be used, because it does not reach high enough stool levels to treat the infection. Vancomycin should be dosed at 500 mg four times daily for 10 to 14 days (severe CDI) and 125 mg four times daily for 10 to 14 days in cases of mild to moderate CDI; alternatively, the duration of treatment can be extended for several days after the diarrhea resolves. This usually occurs within a few days after commencing treatment.
The treatment of choice for mild to moderate CDI is metronidazole. It is dosed at either 500 mg PO three times daily or 250 mg PO four times daily. Oral metronidazole achieves higher stool concentrations than IV metronidazole, so it is the preferred route for CDI management.
Metronidazole can cause nausea and a metallic taste. It also interacts with warfarin, so the international normalized ratio (INR) must be followed. Concomitant administration of alcohol can lead to a reaction similar to that associated with use of Antabuse. The drug should not be used in pregnant women or children. Metronidazole and vancomycin usually are equally effective for treating mild to moderate CDI, but some resistance has been noted. Vancomycin PO currently is available only as a branded drug with a high cost, but this may soon change.11
Recurrence
Recurrence can occur in approximately 20% of patients within 60 days, and these patients can be treated with the same antibiotics as were previously utilized. Subsequent recurrences can be managed with pulse dosing, or by tapering the dose at the end of therapy. Due to a lack of controlled studies, the use of probiotics, such as Lactobacillus, in the prevention of CDI cannot be routinely recommended.12 However, Lactobacillus-containing products generally are considered safe in immunocompetent individuals.
The Future
Generic oral vancomycin is on the horizon and a number of agents are currently undergoing phase 3 clinical trials for CDI management. These include rifaximin, nitazoxanide, and rifampin in combination with current agents.13-16 For now, prevention is key. Utilize some of the measures noted above to prevent this potentially serious, nosocomial infection. For infected patients, current treatments are effective and new ones will be here soon. TH
Michele B. Kaufman, PharmD, BSc, RPh, is a freelance medical writer based in New York City.
References
1.Walker EP. ICAAC-IDSA: C. difficile epidemic continues to worsen. MedPage Web site. Available at: www.medpagetoday.com/MeetingCoverage/ ICAAC/11518. Accessed Jan. 13, 2009.
2.O’Brien JA, Lahue BJ, Caro JJ, Davidson DM. The emerging infectious challenge of Clostridium difficile-associated disease in Massachusetts hospitals: clinical and economic consequences. Infect Control Hosp Epidemiol. 2007;28:1219-1227.
3.Dubberke ER, Reske RA, Olsen MA, McDonald C, Fraser VJ. Short- and long-term attributable costs of Clostridium difficile-associated disease in nonsurgical patients. Clin Infect Dis. 2008;46:497-504.
4.Jodlowski TZ, Oehler R, Kam LW, Melnychuk I. Emerging therapies in the treatment of Clostridium difficile-associated disease. Ann Pharmacother. 2006;40:2164-2169.
5.Redelings MD, Sorvillo F, Mascola L. Increase in Clostridium difficile-related mortality rates, United States, 1999-2004. Emerg Infect Dis. 2007;13:1417-1419.
6.The national healthcare safety network protocol multi-drug-resistant organism and Clostridium difficile-associated disease module version 4.1. CDC Web site. Available at: www.cdc.gov/ncidod/dhqp/ pdf/nhsn/MDRO_CDADprotocolv41Dec08final.pdf. Accessed Jan. 14, 2009.
7.Severe Clostridium difficile-associated disease in populations previously at low risk—four states, 2005. CDC Web site. Available at www.cdc.gov/mmwr/preview/mmwrhtml/mm5447a1.htm. Accessed Jan. 14, 2009.
8.Lawrence SJ. Contemporary management of Clostridium difficile-associated disease. IDSE Web site. Available at: www.idse.net/download/079idse0907WM.pdf. Accessed Jan. 14, 2009.
9.Dubberke ER, Gerding DN, Classen D, et al. Strategies to prevent Clostridium difficile infections in acute care hospitals. Infect Control Hosp Epidemiol. 2008;29:S81-S92.
10.Multidrug-resistant organisms (MDRO) and Clostridium difficile-associated disease (CDAD) module. CDC Web site. Available at: www.cdc.gov/ncidod/dhqp/nhsn_MDRO_CDAD.html. Accessed Jan. 14, 2009.
11.ViroPharma files FOIA complaint seeking administrative record for vancocin. ViroPharma Inc. Web site. Available at: phx.corporateir.net/phoenix.zhtml?c=92320&p=irol-newsArticle&ID=1237649. Published Dec. 18, 2008. Accessed Jan. 14, 2009.
12.Hickson M, D’Souza AL, Muthu N, et al. Use of probiotic Lactobacillus preparation to prevent diarrhoea associated with antibiotics: randomised double blind placebo controlled trial. BMJ. 2007;6. Available at: www.bmj.com/cgi/reprint/bmj.39231.599815.55v1. Accessed Jan. 14, 2009.
13. A trial to compare xifaxan to vancomycin for the treatment of Clostridium difficile-associated diarrhea (CDAD). National Institutes of Health Web site. Available at: www.clinicaltrials.gov/ct2/show/ NCT00269399?term=rifaximin+and+clostridium&rank=1. Accessed Jan. 10, 2009.
14. Efficacy of metronidazole versus metronidazole and rifampin in CDAD treatment. National Institutes of Health Web site. Available at www.clinicaltrials.gov/ct2/show/NCT00182429?term=rifampin+and+cdad&rank=1. Accessed Jan. 10, 2009.
15. Compassionate use of nitazoxanide for the treatment of Clostridium difficile infection. National Institutes of Health Web site. Available at: www.clinicaltrials.gov/ct2/show/NCT00304356?term=Nitazoxanide+and+clostridium&rank=2. Accessed Jan. 10, 2009.
16. Vancomycin vs. nitazoxanide to treat recurrent C. difficile colitis. National Institutes of Health Web site. Available at: www.clinicaltrials.gov/ct2/show/NCT00304889?term=Nitazoxanide+and+vancomycin&rank=2. Accessed Jan. 10, 2009.
SHM National Conference Expands to Four Days

With the total number of hospitalists in the U.S. nearing 28,000 and hospitalists now working in four out of every five large hospitals, the issues affecting hospitalists continue to expand and become more complex.
That’s the rationale behind expanding SHM’s national conference, “Hospital Medicine 2009,” to a four-day schedule. Previous SHM annual conferences were limited to three days; HM09 runs May 14-17 in Chicago.
“Hospitalists are continually looking for opportunities for professional development, and we’re expecting another record-breaking attendance,” says Todd Von Deak, SHM’s vice president for membership and marketing. “We’re thrilled that we can offer additional courses and still give attendees plenty of time for other sessions and networking with thousands of hospitalists and colleagues. Ultimately, the expansion makes it easier for hospitalists to bring best practices back to their hospitals and patients.”
HM09 will feature keynotes from a pair of leaders in healthcare quality:
- Mark R. Chassin, MD, MPP, MPH, president of The Joint Commission and an expert on improving the safety and quality of healthcare; and
- Robert M. Wachter, MD, professor and chief of the division of hospital medicine at the University of California San Francisco, a former SHM president, and author of the blog “Wachter’s World”.