User login
Retrievable Vena Cava Filters
Vena cava filters were introduced in the 1960s as a mechanical means to prevent pulmonary embolism (PE).1 Since that time, the number of filters placed has grown steadily, to over 49,000 annually in the United States alone.2 However, patients with vena cava filters can develop complications from the filter itself, which can lead to significant morbidity and, rarely, mortality. In particular, the interruption of venous flow caused by the filter can precipitate lower extremity deep vein thrombosis (DVT),3 as well as vena caval thrombosis involving the filter itself. This has led some experts to recommend indefinite anticoagulation in patients with vena caval filters,4, 5 potentially exposing many patients to the risks of anticoagulation. Given these long‐term safety concerns, there has been recent enthusiasm for the development of optional filters. Optional vena cava filters can be classified into 2 types: temporary and retrievable. Temporary filters, which are not currently available in the United States, are held in place by a tether or catheter5 and cannot be used as permanent devices. Retrievable filters, on the other hand, maintain their position by hooks, radial pressure, or barbs and can either be removed within a prescribed time period after placement or remain in place permanently. In this way, optional filters offer the possibility of avoiding long‐term filter complications in patients with temporary contraindications to anticoagulation. Not surprisingly, the use of retrievable filters has increased dramatically, with many filters being placed for prophylactic indications in patients without known venous thromboembolism (VTE).6 In this work we review the different types of retrievable vena cava filters, current indications for placement, complications, and areas for future research.
Filter Design and Efficacy
Currently, there are 5 U.S. Food and Drug Administration (FDA)‐approved filters in the United States that can be used as retrievable filters: ALN (ALN Implants Chirurgicaux, Ghisonaccia, France); Celect (Cook Medical Incorporated, Bloomington, IN); Gunther‐Tulip (Cook Medical Incorporated, Bloomington, IN); G2 (Bard Peripheral Vascular, Tempe, AZ); and OptEase (Cordis Corporation, Miami Lakes, FL) (Table 1). Three more devices are in U.S. clinical trials: SafeFlo (Rafael Medical Technologies, Hasselt, Belgium); Crux (Crux Biomedical, Portola Valley, CA); and Option (Rex Medical, Conshohocken, PA). Filters are constructed from magnetic resonance imaging (MRI)‐compatible, nonferromagnetic alloys and are produced in either a hexagonal or conical shape. There are potential advantages and disadvantages to both designs. A hexagonal design is thought to be better for trapping small thrombi, but conical filters may have a decreased propensity toward thrombosis.7 When a hexagonal filter becomes partially occluded in vitro, flow disturbances can lead to turbulence, stasis, and progressive clot formation.7 Some clinical studies have demonstrated an increased incidence of thrombosis with hexagonal filters,8 but further investigation is needed to determine if a true correlation exists. Comparisons of the 2 types of filter design are limited but have shown no difference in their efficacy in the prevention of PE.9 Therefore, filter choice is usually dependent upon the physician performing the procedure, although other factors, such as caval size, clot extent, available venous access, and route of retrieval also may affect this decision. Furthermore, retrospective reviews have shown no difference in efficacy between retrievable and permanent filters.10
| Filter | Image | Insertion Site | Retrieval Site | Maximum Successful Documented Dwell Time |
|---|---|---|---|---|
| Gunther‐Tulip (photo courtesy of Cook Medical Incorporated, Bloomington, IN) | Femoral or jugular | Jugular | 204 days42 | |
| Optease (photo courtesy of Cordis Corporation, Miami Lakes, FL) | Femoral or jugular | Femoral | 48 days43 | |
| ALN (photo courtesy of ALN Implants Chirurgicaux, Ghisonaccia, France) | Femoral, jugular, or brachial | Jugular | 352 days44 | |
| Celect (photo courtesy of Cook Medical Incorporated, Bloomington, IN) | Femoral or jugular | Jugular | 357 days45 | |
| G2 (photo courtesy of Bard Peripheral Vascular, Tempe, AZ) | Femoral or jugular | Jugular | 300 days46 |
Insertion of filters is typically performed under fluoroscopy in the operating room or interventional radiology suite. Placement can also occur at the bedside using intravascular ultrasound. This option is particularly useful for critically ill patients who are not stable enough to leave the intensive care unit (ICU) for insertion. The safety of this approach has been documented for both retrievable and permanent filters.11, 12 Duplex ultrasonography has been used to allow bedside placement of permanent filters, but published experience with this modality in placement of retrievable filters is lacking.13, 14
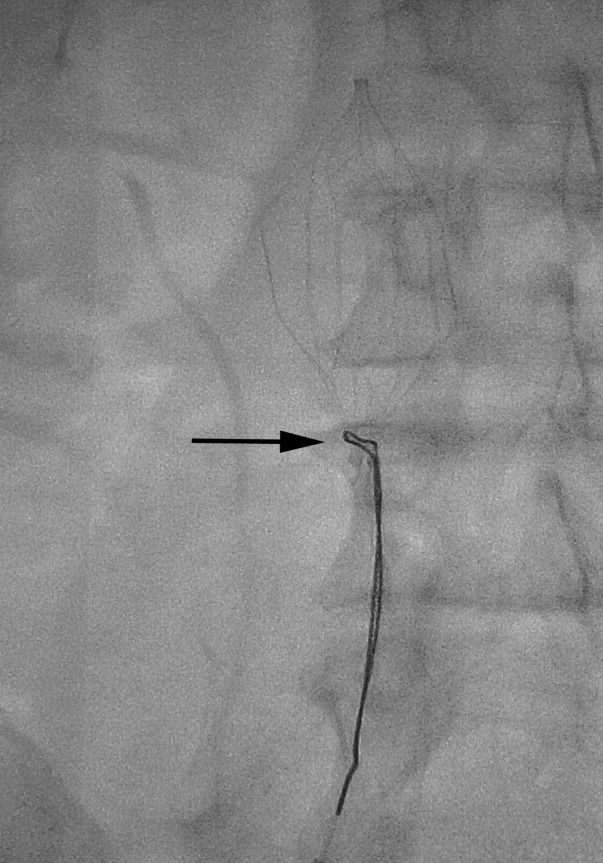
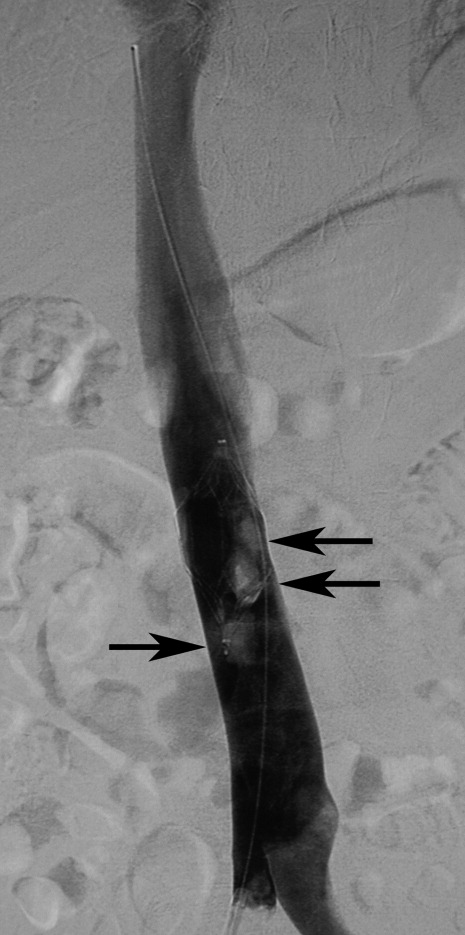
There are no set time limits for retrieving filters, although the retrieval success rate decreases as the time postplacement increases. Rather, the decision to remove them is based on the clinical situation. Table 1 shows data on some of the longest documented successful dwell times for the various retrievable filters. Prior to filter retrieval, a venogram is performed to ensure that there is no clot in the inferior vena cava (IVC) or common iliac veins (Figure 1). Removal of a retrievable filter involves snaring one end of the filter with a hook and then slipping a sheath over the filter, which retracts the filter from the vessel wall as it is being pulled into the sheath (Figure 2). Retrieval rates from various studies are listed in Table 2. Common reasons for nonretrieval include loss to follow up,15 ongoing contraindications to anticoagulation,11, 1618 presence of large thrombi in the filter,16, 1820 poor patient prognosis,16, 18 unrelated death,1618 and filter tilting or embedment.19, 21

| Study | Total Number of Patients | Study Type | Filter Type | Follow‐Up Duration (months) | PE [number (%)] | IVC Thrombosis [number (%)] | DVT [number (%)] | Retrieval Attempted/ Successful Retrieval [number (%)] | Mean Duration Between Filter Placement and Retrieval (days) |
|---|---|---|---|---|---|---|---|---|---|
| |||||||||
| Millward et al., 200116 | 90 | RO/PO | G | 3.4 | 0 | 1/39 (2.6) | 1/39 (2.6) | 53 (59)/52 (98) | 9 |
| de Gregorio et al., 200319 | 87 | RO | G | N/R | 0 | 0 | 0 | 69 (79)/68 (99) | 13 |
| Wicky et al., 200317 | 71 | RO | G | 30 | 0 | 0 | 0 | 47 (66)/33 (70) | 8.2 |
| Rosenthal et al., 200411 | 94 | PO | O | N/R | 0 | 0 | 1 (1.1) | 34 (36)/31 (91) | 19 |
| Grande et al., 200515 | 106 | RO | R | N/R | 3 (2.8) | 0 | 0 | 15 (14)/14 (93) | 150 |
| Oliva et al., 200547 | 27 | PO | O | N/R | 0 | 0 | 1/27 (3.7) | 21 (78)/21 (100) | 11.1 |
| Hoppe et al., 200618 | 41 | PO | G | 3 | 1 (2.4) | 1 (2.4) | 1 (2.4) | 23 (57)/23 (100) | 11.1 |
| Kalva et al., 200648 | 96 | RO | R | 5.3 | 1 (1.0) | 0 | 10/53 (18) | 11 (12)/9 (82) | 117 |
| Meier et al., 200635 | 37 | PO | O | 5 | 0 | 1/5 (20) | 1/5 (20) | 32 (86)/32 (100) | 16 |
| Ray et al., 200649 | 197 | RO | G, R | N/R | 1 (0.5)‐G | 2 (1.0)‐G | 0 | 94 (48)/80 (85) | 11 (G)/28 (R) |
| Rosenthal et al., 200650 | 127 | RO | G, R, O | N/R | 0 | 0 | 0 | 70 (52)/66 (94) | 71 |
| Looby et al., 200721 | 147 | RO | G | N/R | 1 (0.7) | 0 | 0 | 45 (31)/36 (80) | 33.6 |
| Yamagami et al., 200751 | 86 | RO | G | N/R | 0 | N/R | N/R | 80 (93)/77 (96) | 13.4 |
| Kim et al, 200852 | 427 | RO | G, P, R, G2 | 10.4 | 20 (4.7) | 2 (0.5) | 54 (12.6) | 60 (15.5)/46 (69.7) | 20.4 |
Indications for Filter Placement
Patients with Known VTE
Suggested indications for the use of vena cava filters in patients with proven VTE are listed in Table 3. For patients at risk for either recurrent or severe bleeding (eg, multiple falls, recurrent gastrointestinal or intracranial hemorrhage) or most patients who have failed treatment with therapeutic anticoagulation, a permanent filter is usually the preferred mechanical option. However, for certain conditions (such as Trousseau's syndrome, heparin‐induced thrombocytopenia, antiphospholipid syndrome, or anatomic abnormalities such as thoracic outlet syndrome‐Paget‐von Schroetter syndrome, or May‐Thurner syndrome‐iliac vein compression syndrome), vena cava filters have been shown either to be ineffective or to worsen thrombosis. In these cases, alternative therapies must be used, based on the underlying disorder and the clinical situation.
| Anticipated Transient Need for Anticoagulation | Anticipated Long‐Term Need for Anticoagulation* | |
|---|---|---|
| ||
| Transient bleeding risk in a patient at high risk for recurrent thromboembolism | Retrievable filter appropriate | Retrievable filter appropriate |
| Permanent, or likely recurrent, bleeding risk | Retrievable filter with extended dwell time | Permanent filter appropriate |
| No unusual bleeding risk | No filter indicated | No filter indicated |
A retrievable filter should only be considered in patients who have a transient contraindication to anticoagulation (Table 5). Such contraindications include isolated but treatable episodes of hemorrhage, urgent surgeries, or procedures associated with a high risk of bleeding, and trauma. The risk of recurrent VTE in the absence of anticoagulation has been estimated at 40% in the first month after VTE and then 10% during the second and third months.22 Therefore, it is reasonable to place a retrievable filter in perioperative patients who cannot be treated with therapeutic anticoagulation during the first 30 days after an acute VTE. If more than 30 days have passed since the thrombotic event, a filter is probably not necessary for patients who will have temporary interruptions in anticoagulation therapy. Instead, bridging anticoagulation (eg, unfractionated heparin [UFH] or low molecular weight heparin [LMWH]) can be given while warfarin is being held prior to surgery. Then, the patient can be transitioned back to warfarin therapy with prophylactic and then therapeutic LMWH or UFH in the postoperative period.
|
| Recurrent VTE |
| Idiopathic VTE |
| Near‐fatal thrombosis |
| Thrombosis at an unusual site (eg, mesenteric vein) |
| VTE in high‐risk thrombophilic disorders: |
| Antiphospholipid antibody syndrome |
| Protein C or S deficiency |
| Antithrombin III deficiency |
| Heterozygous mutations for both the Factor V Leiden and the Prothrombin gene mutation (compound heterozygosity) |
| Homozygous Factor V Leiden mutation |
| Cancer‐associated VTE |
| Major trauma |
| Peripartum |
| Isolated and treatable causes of hemorrhage (eg, peptic ulcer) |
| Bleeding complications after procedures or surgeries53 |
| Liver or kidney biopsy |
| Urgent surgery associated with a high bleeding risk54 |
| Cardiac (coronary artery bypass or valve replacement) |
| Vascular (aortic aneurysm repair, peripheral artery bypass) |
| Neurosurgical (intracranial or spinal) |
| Urologic (prostate and bladder) |
| Major cancer surgery |
Controversy remains regarding the use of retrievable filters in patients with calf vein DVT. It also exists for patients with massive or submassive PE who are receiving anticoagulation therapy but are at high risk for poor outcomes should another PEeven if smalloccur while they are on anticoagulation therapy. Vena cava filters are generally not recommended for patients with distal VTE unless they have a persistent contraindication to anticoagulation therapy and have shown clot propagation on serial duplex studies. At least 1 institution, however, has noted an increased use of filter placement in this population since the advent of retrievable filters.23 Randomized controlled trials and practice guidelines are still lacking in this area. Therefore, there is currently insufficient evidence to recommend retrievable filters for distal VTE.
There is also insufficient evidence to recommend filters for patients with massive or submassive PE who can tolerate anticoagulation therapy. Only 1 registry study has compared patients with massive PE (defined by a systolic blood pressure 90 mmHg at presentation) who were treated with vena cava filters to those who were not.24 Though there was a reduction in recurrent PE and mortality at 90 days in patients who received filters, this result requires further confirmation due to the small number of patients who received filters (11 patients) and a possible selection bias (patients who received filters were, on average, 16 years younger than those who did not). More evidence will be needed to weigh not only the cost but the risks of filter insertion (such as insertion site hematoma, increased incidence of DVT, or contrast nephropathy) against any benefit. Until then, routine filter use in patients with massive or submassive PE cannot be routinely recommended, but may be considered in those with massive PE and impending hemodynamic collapse.
Prophylaxis in High‐Risk Patients
Controversy also exists in the use of retrievable filters in patients without VTE who are at high risk for thromboembolic events. Currently, there are no randomized controlled trials that have established the efficacy of retrievable filters as prophylaxis in these patients. However, there are a number of prospective and retrospective studies that examine this topic, particularly in trauma patients.
Trauma
The Eastern Association for the Surgery of Trauma currently recommends that prophylactic filters be considered in trauma patients who are at increased risk for bleeding and prolonged immobilization (level III).25 These patients include those with severe closed head injury, incomplete spinal cord injury with paraplegia or quadriplegia, multiple long bone fractures, and complex pelvic fractures with multiple long bone fractures. The largest study to date on retrievable filters in trauma patients was done by the American Association for the Surgery of Trauma.26 The incidence of new PE after filter placement was 0.5%, which compares favorably with permanent filter recipients (PE 0.7%) and historical controls (2.1%).27 OptEase filters were more commonly associated with caval thrombosis. The majority of filters (78%) were not retrieved, primarily because patients were lost to follow up. Failure to retrieve filters has become a major issue as these devices grow in popularity.28, 29 In this situation, the benefit of using retrievable filters could be mitigated by the same long‐term complications associated with permanent filters. Therefore, well‐coordinated patient follow‐up is essential to ensure optimal use of retrievable filters. Furthermore, randomized studies of retrievable filters are urgently needed to confirm that vena cava filters are associated with net benefit compared with conventional approaches to VTE prophylaxis (enoxaparin, sequential compression devices) in trauma patients.
Other High‐Risk Situations
The use of permanent filters has been studied in neurosurgical, bariatric, orthopedic, and pregnant patients. However, there are very few studies that look at the use of retrievable filters specifically in these populations. One such study was done in obese (body mass index [BMI] > 55 kg/m2) patients undergoing gastric bypass surgery.30 Filter retrieval rates were high (87%), and there were no DVTs or PEs prior to or after removal. The authors attributed their high removal rates to a dedicated follow‐up program and close collaboration with the interventional radiologists. More research needs to be done comparing outcomes with filters to conventional pharmacologic VTE prophylaxis before these devices can be recommended in these patients.
Filter Complications
During Filter Placement
Complications related to both retrievable and nonretrievable filter placement are rare but have been documented in several studies. Failure of the filter to deploy properly has been reported.21 The same study also noted pneumothorax as a complication in some patients whose filters were inserted via the jugular vein.21 Therefore, location of access and retrieval should be an important consideration for patients with significant underlying pulmonary disease. Insertion site thrombosis and arteriovenous fistula formation have been reported primarily with permanent filters31, 32; that risk could be extrapolated to retrievable filters given that the method of placement is the same. Iodine contrast‐induced nephropathy is of concern for high‐risk patients, although the procedure can be performed using gadolinium‐based contrast, carbon dioxide contrast, or without contrast (under ultrasound guidance).
During Filter Retrieval
Filter tilting and clot trapping under the filter that occurs during the filter removal process are infrequent causes of non‐retrieval. Tilting of the filter sometimes can pose problems, but if this occurs, the filter can be repositioned so that the degree of tilt no longer precludes removal. Severe cases of tilting that lead to nonretrieval are very rare. When thrombus is trapped in the filter (Figure 3), retrieval often depends on the amount of thrombus. A visual scale to assist in judgment of thrombus volume has been developed to assist in retrieval decision‐making.33 In some cases, catheter‐directed thrombolysis has been used to facilitate thrombus dissolution.34
VTE After Placement
Table 2 lists the incidence of VTE after retrievable filter placement. The overall incidence of PE is low, but that of DVT varies widely. These data raise the possibility that some filters may not be removed due to the occurrence of a new DVT, thereby becoming permanent filters with the associated risks of recurrent DVT, caval thrombosis, and PE. Only a few studies have investigated the differences in the rate of PE between permanent and retrievable filters and have shown no differences.29 The long‐term complication rates of retrievable filters and how they may differ from permanent filters warrants further investigation.
Some studies have also noted the development of PE after filter retrieval.35, 36 It is possible that a subclinical DVT was present at the time of removal or that the filter was retrieved before the risk of thrombosis had resolved. Therefore, consideration should be given to the use of duplex ultrasound evaluation for DVT prior to filter removal to ensure that patients with active thrombosis receive therapeutic anticoagulation for an appropriate duration.
Because of the concern for DVT and PE associated with retrievable filters, anticoagulation should ideally occur before and after retrieval, once the bleeding risk has become acceptable. Consensus guidelines support this practice,5, 37 though one systematic review has found insufficient evidence regarding the use of anticoagulation in patients with vena cava filters.4 Retrospective reviews have shown that filters can be both placed and removed without bleeding complications, even in patients who are therapeutically anticoagulated with warfarin and/or LMWH.38, 39 Further investigation would be useful to confirm whether this is an effective approach to VTE prevention at the time of retrieval.
Other Adverse Events
Other complications that have been associated with retrievable filters include migration, fracture, infection, and perforation. It may be difficult to estimate the true incidence of these complications, as most of the literature on this topic comes from case reports. Vena cava perforation with hooks may be not uncommon but in most cases is not clinically significant.40 Filter fracture is more common but rarely reported. Filter migration toward the heart is a very rare but potentially life‐threatening complication. The Recovery filter was taken off the market due in part to concerns about migration.26 As the use of retrievable filters increases, complications related to filters will need to be monitored.
Ongoing and Future Research
Other types of removable filters are currently in development. Convertible filters that can be converted into a stent once they are no longer needed are under investigation. Other devices, such as absorbable or drug‐eluting filters, are also being studied.5 In addition, there is ongoing research to better characterize the safety and efficacy of available filters. The Prevention du Risque d'Embolie Pulmonaire par Interruption Cave (PREPIC) 2 will assess their use in the first prospective, randomized, controlled trial of retrievable filters in patients with acute VTE receiving anticoagulation (
Conclusions
There is growing concern over the increased use of vena caval filters for the prevention of PE.41 Retrievable filters offer the possibility of protection without the risk of long‐term complications attributable to permanent filters. The advent of these devices has lead to an increase in overall filter use but also could result in filter placement without adequate consideration of the potential complications or consequences of nonretrieval. More evidence is needed in order to establish best practice guidelines for retrievable filter use. Until these data are available, these devices should be used only in patients with acute VTE who are at risk for recurrent thromboembolism and have a transient risk for bleeding.
- ,,, et al.A vena caval filter for the prevention of pulmonary embolus.Surg Forum.1967;18.
- ,,.Twenty‐one‐year trends in the use of inferior vena cava filters.Arch Intern Med.2004;164:1541–1545.
- ,,, et al.A clinical trial of vena caval filters in the prevention of pulmonary embolism in patients with proximal deep‐vein thrombosis. Prevention du Risque d'Embolie Pulmonaire par Interruption Cave Study Group.N Engl J Med.1998;338:409–415.
- ,.The need for anticoagulation following inferior vena cava filter placement: systematic review.Cardiovasc Intervent Radiol.2008;31:316–324.
- ,,, et al.Guidelines for the use of retrievable and convertible vena cava filters: report from the Society of Interventional Radiology multidisciplinary consensus conference.J Vasc Interv Radiol.2006;17:449–459.
- ,,, et al.Changing patterns in the use of inferior vena cava filters: review of a single center experience.J Am Coll Surg.2007;205:564–569.
- ,,.Hemodynamic effects of clot entrapment in the TrapEase inferior vena cava filter.J Vasc Interv Radiol.2004;15:485–490.
- ,,, et al.Vena cava filters and inferior vena cava thrombosis.J Vasc Surg.2007;45:789–794.
- ,,, et al.Clinical comparison of two optional vena cava filters.J Vasc Interv Radiol.2007;18:505–511.
- ,,, et al.Use of retrievable compared to permanent inferior vena cava filters: a single‐institution experience.Cardiovasc Intervent Radiol.2008;31:308–315.
- ,,, et al.Role of prophylactic temporary inferior vena cava filters placed at the ICU bedside under intravascular ultrasound guidance in patients with multiple trauma.J Vasc Surg.2004;40:958–964.
- ,,.Bedside vena cava filter placement with intravascular ultrasound: a simple, accurate, single venous access method.J Vasc Surg.2007;46:1284–1286.
- ,,.The bedside insertion of inferior vena cava filters using ultrasound guidance.Perspect Vasc Surg Endovasc Ther.2007;19:78–84.
- ,,, et al.Comparison of bedside transabdominal duplex ultrasound versus contrast venography for inferior vena cava filter placement: what is the best imaging modality?Ann Vasc Surg.2005;19:229–234.
- ,,, et al.Experience with the recovery filter as a retrievable inferior vena cava filter.J Vasc Interv Radiol.2005;16:1189–1193.
- ,,, et al.Gunther Tulip retrievable vena cava filter: results from the Registry of the Canadian Interventional Radiology Association.J Vasc Interv Radiol.2001;12:1053–1058.
- ,,, et al.Clinical experience with retrievable Gunther Tulip vena cava filters.J Endovasc Ther.2003;10:994–1000.
- ,,, et al.Gunther Tulip filter retrievability multicenter study including CT follow‐up: final report.J Vasc Interv Radiol.2006;17:1017–1023.
- ,,, et al.The Gunther Tulip retrievable filter: prolonged temporary filtration by repositioning within the inferior vena cava.J Vasc Interv Radiol.2003;14:1259–1265.
- ,,, et al.Retrievable inferior vena cava filters: early clinical experience.J Cardiovasc Surg (Torino).2005;46:163–169.
- ,,, et al.Gunther Tulip retrievable inferior vena caval filters: indications, efficacy, retrieval, and complications.Cardiovasc Intervent Radiol.2007;30:59–65.
- ,.Management of anticoagulation before and after elective surgery.N Engl J Med.1997;336:1506–1511.
- ,,, et al.Changes in inferior vena cava filter placement over the past decade at a large community‐based academic health center.J Vasc Surg.2008;47:157–165.
- ,,, et al.Massive pulmonary embolism.Circulation.2006;113:577–582.
- ,,, et al.Practice management guidelines for the prevention of venous thromboembolism in trauma patients: the EAST practice management guidelines work group.J Trauma.2002;53:142–164.
- ,,, et al.Practice patterns and outcomes of retrievable vena cava filters in trauma patients: an AAST multicenter study.J Trauma.2007;62:17–24; discussion 24‐25.
- ,.Inferior vena cava interruption. In: Crowther M, et al., eds.Evidence‐Based Hematology.West Sussex, UK:Wiley‐Blackwell Publishing;2008:99–109.
- ,,, et al.Are temporary inferior vena cava filters really temporary?Am J Surg.2005;190:858–863.
- ,,, et al.Retrievable vena cava filters for preventing pulmonary embolism in trauma patients: a cautionary tale.J Trauma.2006;60:35–40.
- ,,, et al.Safety, feasibility, and outcome of retrievable vena cava filters in high‐risk surgical patients.J Vasc Surg.2007;45:784–788; discussion 788.
- ,,, et al.Femoral arteriovenous fistula after placement of a Kimray‐Greenfield filter.AJR Am J Roentgenol.1988;151:681–682.
- ,,, et al.Prophylactic Greenfield filters: acute complications and long‐term follow‐up.J Trauma.1996;41:231–236; discussion 236‐237.
- ,,.Estimation of trapped thrombus volumes in retrievable inferior vena cava filters: a visual scale.J Vasc Interv Radiol.2007;18:273–276.
- ,,, et al.Endovascular recanalization of the thrombosed filter‐bearing inferior vena cava.J Vasc Interv Radiol.2003;14:893–903.
- ,,, et al.Early experience with the retrievable OptEase vena cava filter in high‐risk trauma patients.Eur J Vasc Endovasc Surg.2006;32:589–595.
- ,,, et al.Current trends in vena caval filtration with the introduction of a retrievable filter at a level I trauma center.J Trauma.2004;57:32–36.
- ,,, et al.Antithrombotic therapy for venous thromboembolic disease: the Seventh ACCP Conference on Antithrombotic and Thrombolytic Therapy.Chest.2004;126:401S–428S.
- ,,, et al.Safety of inferior vena cava filter retrieval in anticoagulated patients.Chest.2007;132:31–36.
- ,,, et al.Should anticoagulant therapy be stopped or reversed before venous intervention?Can Assoc Radiol J.1999;50:306–309.
- ,,.Retrievable vena cava filters: clinical experience.Curr Opin Pulm Med.2006;12:304–309.
- .Use of emboli‐blocking filters increases, but rigorous data are lacking.JAMA.2006;295:989–990.
- ,,, et al.Extended interval for retrieval of vena cava filters is safe and may maximize protection against pulmonary embolism.Am J Surg.2006;192:789–794.
- ,,, et al.Long‐term retrievability of IVC filters: should we abandon permanent devices?Cardiovasc Intervent Radiol.2007;30:820–827.
- ,,, et al.A prospective long‐term study of 220 patients with a retrievable vena cava filter for secondary prevention of venous thromboembolism.Chest.2007;131:223–229.
- ,,, et al.The Cook Celect filter: the UK and global experience so far. In:European Congress of Radiology.2008;European Society of Radiology:Vienna, Austria.
- ,,, et al.Multicenter retrievability trial of the recovery G2 filter.J Vasc Interv Radiol.2008;19:S28.
- ,,, et al.The Jonas study: evaluation of the retrievability of the Cordis OptEase inferior vena cava filter.J Vasc Interv Radiol.2005;16:1439–1445.
- ,,, et al.“Recovery” vena cava filter: experience in 96 patients.Cardiovasc Intervent Radiol.2006;29:559–564.
- ,,, et al.Outcomes with retrievable inferior vena cava filters: a multicenter study.J Vasc Interv Radiol.2006;17:1595–1604.
- ,,, et al.Retrievable inferior vena cava filters: initial clinical results.Ann Vasc Surg.2006;20:157–165.
- ,,, et al.Evaluation of retrievability of the Günther Tulip vena cava filter.Cardiovasc Intervent Radiol.2007;30:226–231.
- ,,, et al.A comparison of clinical outcomes with retrievable and permanent inferior vena cava filters.J Vasc Interv Radiol.2008;19:393–399.
- .The management of anticoagulation before and after procedures.Med Clin North Am.2001;85:1109–1116.
- ,,, et al.The perioperative management of antithrombotic therapy: American College of Chest Physicians Evidence‐Based Clinical Practice Guidelines, 8th ed.Chest.2008;133:299S–339S.
Vena cava filters were introduced in the 1960s as a mechanical means to prevent pulmonary embolism (PE).1 Since that time, the number of filters placed has grown steadily, to over 49,000 annually in the United States alone.2 However, patients with vena cava filters can develop complications from the filter itself, which can lead to significant morbidity and, rarely, mortality. In particular, the interruption of venous flow caused by the filter can precipitate lower extremity deep vein thrombosis (DVT),3 as well as vena caval thrombosis involving the filter itself. This has led some experts to recommend indefinite anticoagulation in patients with vena caval filters,4, 5 potentially exposing many patients to the risks of anticoagulation. Given these long‐term safety concerns, there has been recent enthusiasm for the development of optional filters. Optional vena cava filters can be classified into 2 types: temporary and retrievable. Temporary filters, which are not currently available in the United States, are held in place by a tether or catheter5 and cannot be used as permanent devices. Retrievable filters, on the other hand, maintain their position by hooks, radial pressure, or barbs and can either be removed within a prescribed time period after placement or remain in place permanently. In this way, optional filters offer the possibility of avoiding long‐term filter complications in patients with temporary contraindications to anticoagulation. Not surprisingly, the use of retrievable filters has increased dramatically, with many filters being placed for prophylactic indications in patients without known venous thromboembolism (VTE).6 In this work we review the different types of retrievable vena cava filters, current indications for placement, complications, and areas for future research.
Filter Design and Efficacy
Currently, there are 5 U.S. Food and Drug Administration (FDA)‐approved filters in the United States that can be used as retrievable filters: ALN (ALN Implants Chirurgicaux, Ghisonaccia, France); Celect (Cook Medical Incorporated, Bloomington, IN); Gunther‐Tulip (Cook Medical Incorporated, Bloomington, IN); G2 (Bard Peripheral Vascular, Tempe, AZ); and OptEase (Cordis Corporation, Miami Lakes, FL) (Table 1). Three more devices are in U.S. clinical trials: SafeFlo (Rafael Medical Technologies, Hasselt, Belgium); Crux (Crux Biomedical, Portola Valley, CA); and Option (Rex Medical, Conshohocken, PA). Filters are constructed from magnetic resonance imaging (MRI)‐compatible, nonferromagnetic alloys and are produced in either a hexagonal or conical shape. There are potential advantages and disadvantages to both designs. A hexagonal design is thought to be better for trapping small thrombi, but conical filters may have a decreased propensity toward thrombosis.7 When a hexagonal filter becomes partially occluded in vitro, flow disturbances can lead to turbulence, stasis, and progressive clot formation.7 Some clinical studies have demonstrated an increased incidence of thrombosis with hexagonal filters,8 but further investigation is needed to determine if a true correlation exists. Comparisons of the 2 types of filter design are limited but have shown no difference in their efficacy in the prevention of PE.9 Therefore, filter choice is usually dependent upon the physician performing the procedure, although other factors, such as caval size, clot extent, available venous access, and route of retrieval also may affect this decision. Furthermore, retrospective reviews have shown no difference in efficacy between retrievable and permanent filters.10
| Filter | Image | Insertion Site | Retrieval Site | Maximum Successful Documented Dwell Time |
|---|---|---|---|---|
| Gunther‐Tulip (photo courtesy of Cook Medical Incorporated, Bloomington, IN) | Femoral or jugular | Jugular | 204 days42 | |
| Optease (photo courtesy of Cordis Corporation, Miami Lakes, FL) | Femoral or jugular | Femoral | 48 days43 | |
| ALN (photo courtesy of ALN Implants Chirurgicaux, Ghisonaccia, France) | Femoral, jugular, or brachial | Jugular | 352 days44 | |
| Celect (photo courtesy of Cook Medical Incorporated, Bloomington, IN) | Femoral or jugular | Jugular | 357 days45 | |
| G2 (photo courtesy of Bard Peripheral Vascular, Tempe, AZ) | Femoral or jugular | Jugular | 300 days46 |
Insertion of filters is typically performed under fluoroscopy in the operating room or interventional radiology suite. Placement can also occur at the bedside using intravascular ultrasound. This option is particularly useful for critically ill patients who are not stable enough to leave the intensive care unit (ICU) for insertion. The safety of this approach has been documented for both retrievable and permanent filters.11, 12 Duplex ultrasonography has been used to allow bedside placement of permanent filters, but published experience with this modality in placement of retrievable filters is lacking.13, 14
There are no set time limits for retrieving filters, although the retrieval success rate decreases as the time postplacement increases. Rather, the decision to remove them is based on the clinical situation. Table 1 shows data on some of the longest documented successful dwell times for the various retrievable filters. Prior to filter retrieval, a venogram is performed to ensure that there is no clot in the inferior vena cava (IVC) or common iliac veins (Figure 1). Removal of a retrievable filter involves snaring one end of the filter with a hook and then slipping a sheath over the filter, which retracts the filter from the vessel wall as it is being pulled into the sheath (Figure 2). Retrieval rates from various studies are listed in Table 2. Common reasons for nonretrieval include loss to follow up,15 ongoing contraindications to anticoagulation,11, 1618 presence of large thrombi in the filter,16, 1820 poor patient prognosis,16, 18 unrelated death,1618 and filter tilting or embedment.19, 21
| Study | Total Number of Patients | Study Type | Filter Type | Follow‐Up Duration (months) | PE [number (%)] | IVC Thrombosis [number (%)] | DVT [number (%)] | Retrieval Attempted/ Successful Retrieval [number (%)] | Mean Duration Between Filter Placement and Retrieval (days) |
|---|---|---|---|---|---|---|---|---|---|
| |||||||||
| Millward et al., 200116 | 90 | RO/PO | G | 3.4 | 0 | 1/39 (2.6) | 1/39 (2.6) | 53 (59)/52 (98) | 9 |
| de Gregorio et al., 200319 | 87 | RO | G | N/R | 0 | 0 | 0 | 69 (79)/68 (99) | 13 |
| Wicky et al., 200317 | 71 | RO | G | 30 | 0 | 0 | 0 | 47 (66)/33 (70) | 8.2 |
| Rosenthal et al., 200411 | 94 | PO | O | N/R | 0 | 0 | 1 (1.1) | 34 (36)/31 (91) | 19 |
| Grande et al., 200515 | 106 | RO | R | N/R | 3 (2.8) | 0 | 0 | 15 (14)/14 (93) | 150 |
| Oliva et al., 200547 | 27 | PO | O | N/R | 0 | 0 | 1/27 (3.7) | 21 (78)/21 (100) | 11.1 |
| Hoppe et al., 200618 | 41 | PO | G | 3 | 1 (2.4) | 1 (2.4) | 1 (2.4) | 23 (57)/23 (100) | 11.1 |
| Kalva et al., 200648 | 96 | RO | R | 5.3 | 1 (1.0) | 0 | 10/53 (18) | 11 (12)/9 (82) | 117 |
| Meier et al., 200635 | 37 | PO | O | 5 | 0 | 1/5 (20) | 1/5 (20) | 32 (86)/32 (100) | 16 |
| Ray et al., 200649 | 197 | RO | G, R | N/R | 1 (0.5)‐G | 2 (1.0)‐G | 0 | 94 (48)/80 (85) | 11 (G)/28 (R) |
| Rosenthal et al., 200650 | 127 | RO | G, R, O | N/R | 0 | 0 | 0 | 70 (52)/66 (94) | 71 |
| Looby et al., 200721 | 147 | RO | G | N/R | 1 (0.7) | 0 | 0 | 45 (31)/36 (80) | 33.6 |
| Yamagami et al., 200751 | 86 | RO | G | N/R | 0 | N/R | N/R | 80 (93)/77 (96) | 13.4 |
| Kim et al, 200852 | 427 | RO | G, P, R, G2 | 10.4 | 20 (4.7) | 2 (0.5) | 54 (12.6) | 60 (15.5)/46 (69.7) | 20.4 |
Indications for Filter Placement
Patients with Known VTE
Suggested indications for the use of vena cava filters in patients with proven VTE are listed in Table 3. For patients at risk for either recurrent or severe bleeding (eg, multiple falls, recurrent gastrointestinal or intracranial hemorrhage) or most patients who have failed treatment with therapeutic anticoagulation, a permanent filter is usually the preferred mechanical option. However, for certain conditions (such as Trousseau's syndrome, heparin‐induced thrombocytopenia, antiphospholipid syndrome, or anatomic abnormalities such as thoracic outlet syndrome‐Paget‐von Schroetter syndrome, or May‐Thurner syndrome‐iliac vein compression syndrome), vena cava filters have been shown either to be ineffective or to worsen thrombosis. In these cases, alternative therapies must be used, based on the underlying disorder and the clinical situation.
| Anticipated Transient Need for Anticoagulation | Anticipated Long‐Term Need for Anticoagulation* | |
|---|---|---|
| ||
| Transient bleeding risk in a patient at high risk for recurrent thromboembolism | Retrievable filter appropriate | Retrievable filter appropriate |
| Permanent, or likely recurrent, bleeding risk | Retrievable filter with extended dwell time | Permanent filter appropriate |
| No unusual bleeding risk | No filter indicated | No filter indicated |
A retrievable filter should only be considered in patients who have a transient contraindication to anticoagulation (Table 5). Such contraindications include isolated but treatable episodes of hemorrhage, urgent surgeries, or procedures associated with a high risk of bleeding, and trauma. The risk of recurrent VTE in the absence of anticoagulation has been estimated at 40% in the first month after VTE and then 10% during the second and third months.22 Therefore, it is reasonable to place a retrievable filter in perioperative patients who cannot be treated with therapeutic anticoagulation during the first 30 days after an acute VTE. If more than 30 days have passed since the thrombotic event, a filter is probably not necessary for patients who will have temporary interruptions in anticoagulation therapy. Instead, bridging anticoagulation (eg, unfractionated heparin [UFH] or low molecular weight heparin [LMWH]) can be given while warfarin is being held prior to surgery. Then, the patient can be transitioned back to warfarin therapy with prophylactic and then therapeutic LMWH or UFH in the postoperative period.
|
| Recurrent VTE |
| Idiopathic VTE |
| Near‐fatal thrombosis |
| Thrombosis at an unusual site (eg, mesenteric vein) |
| VTE in high‐risk thrombophilic disorders: |
| Antiphospholipid antibody syndrome |
| Protein C or S deficiency |
| Antithrombin III deficiency |
| Heterozygous mutations for both the Factor V Leiden and the Prothrombin gene mutation (compound heterozygosity) |
| Homozygous Factor V Leiden mutation |
| Cancer‐associated VTE |
| Major trauma |
| Peripartum |
| Isolated and treatable causes of hemorrhage (eg, peptic ulcer) |
| Bleeding complications after procedures or surgeries53 |
| Liver or kidney biopsy |
| Urgent surgery associated with a high bleeding risk54 |
| Cardiac (coronary artery bypass or valve replacement) |
| Vascular (aortic aneurysm repair, peripheral artery bypass) |
| Neurosurgical (intracranial or spinal) |
| Urologic (prostate and bladder) |
| Major cancer surgery |
Controversy remains regarding the use of retrievable filters in patients with calf vein DVT. It also exists for patients with massive or submassive PE who are receiving anticoagulation therapy but are at high risk for poor outcomes should another PEeven if smalloccur while they are on anticoagulation therapy. Vena cava filters are generally not recommended for patients with distal VTE unless they have a persistent contraindication to anticoagulation therapy and have shown clot propagation on serial duplex studies. At least 1 institution, however, has noted an increased use of filter placement in this population since the advent of retrievable filters.23 Randomized controlled trials and practice guidelines are still lacking in this area. Therefore, there is currently insufficient evidence to recommend retrievable filters for distal VTE.
There is also insufficient evidence to recommend filters for patients with massive or submassive PE who can tolerate anticoagulation therapy. Only 1 registry study has compared patients with massive PE (defined by a systolic blood pressure 90 mmHg at presentation) who were treated with vena cava filters to those who were not.24 Though there was a reduction in recurrent PE and mortality at 90 days in patients who received filters, this result requires further confirmation due to the small number of patients who received filters (11 patients) and a possible selection bias (patients who received filters were, on average, 16 years younger than those who did not). More evidence will be needed to weigh not only the cost but the risks of filter insertion (such as insertion site hematoma, increased incidence of DVT, or contrast nephropathy) against any benefit. Until then, routine filter use in patients with massive or submassive PE cannot be routinely recommended, but may be considered in those with massive PE and impending hemodynamic collapse.
Prophylaxis in High‐Risk Patients
Controversy also exists in the use of retrievable filters in patients without VTE who are at high risk for thromboembolic events. Currently, there are no randomized controlled trials that have established the efficacy of retrievable filters as prophylaxis in these patients. However, there are a number of prospective and retrospective studies that examine this topic, particularly in trauma patients.
Trauma
The Eastern Association for the Surgery of Trauma currently recommends that prophylactic filters be considered in trauma patients who are at increased risk for bleeding and prolonged immobilization (level III).25 These patients include those with severe closed head injury, incomplete spinal cord injury with paraplegia or quadriplegia, multiple long bone fractures, and complex pelvic fractures with multiple long bone fractures. The largest study to date on retrievable filters in trauma patients was done by the American Association for the Surgery of Trauma.26 The incidence of new PE after filter placement was 0.5%, which compares favorably with permanent filter recipients (PE 0.7%) and historical controls (2.1%).27 OptEase filters were more commonly associated with caval thrombosis. The majority of filters (78%) were not retrieved, primarily because patients were lost to follow up. Failure to retrieve filters has become a major issue as these devices grow in popularity.28, 29 In this situation, the benefit of using retrievable filters could be mitigated by the same long‐term complications associated with permanent filters. Therefore, well‐coordinated patient follow‐up is essential to ensure optimal use of retrievable filters. Furthermore, randomized studies of retrievable filters are urgently needed to confirm that vena cava filters are associated with net benefit compared with conventional approaches to VTE prophylaxis (enoxaparin, sequential compression devices) in trauma patients.
Other High‐Risk Situations
The use of permanent filters has been studied in neurosurgical, bariatric, orthopedic, and pregnant patients. However, there are very few studies that look at the use of retrievable filters specifically in these populations. One such study was done in obese (body mass index [BMI] > 55 kg/m2) patients undergoing gastric bypass surgery.30 Filter retrieval rates were high (87%), and there were no DVTs or PEs prior to or after removal. The authors attributed their high removal rates to a dedicated follow‐up program and close collaboration with the interventional radiologists. More research needs to be done comparing outcomes with filters to conventional pharmacologic VTE prophylaxis before these devices can be recommended in these patients.
Filter Complications
During Filter Placement
Complications related to both retrievable and nonretrievable filter placement are rare but have been documented in several studies. Failure of the filter to deploy properly has been reported.21 The same study also noted pneumothorax as a complication in some patients whose filters were inserted via the jugular vein.21 Therefore, location of access and retrieval should be an important consideration for patients with significant underlying pulmonary disease. Insertion site thrombosis and arteriovenous fistula formation have been reported primarily with permanent filters31, 32; that risk could be extrapolated to retrievable filters given that the method of placement is the same. Iodine contrast‐induced nephropathy is of concern for high‐risk patients, although the procedure can be performed using gadolinium‐based contrast, carbon dioxide contrast, or without contrast (under ultrasound guidance).
During Filter Retrieval
Filter tilting and clot trapping under the filter that occurs during the filter removal process are infrequent causes of non‐retrieval. Tilting of the filter sometimes can pose problems, but if this occurs, the filter can be repositioned so that the degree of tilt no longer precludes removal. Severe cases of tilting that lead to nonretrieval are very rare. When thrombus is trapped in the filter (Figure 3), retrieval often depends on the amount of thrombus. A visual scale to assist in judgment of thrombus volume has been developed to assist in retrieval decision‐making.33 In some cases, catheter‐directed thrombolysis has been used to facilitate thrombus dissolution.34
VTE After Placement
Table 2 lists the incidence of VTE after retrievable filter placement. The overall incidence of PE is low, but that of DVT varies widely. These data raise the possibility that some filters may not be removed due to the occurrence of a new DVT, thereby becoming permanent filters with the associated risks of recurrent DVT, caval thrombosis, and PE. Only a few studies have investigated the differences in the rate of PE between permanent and retrievable filters and have shown no differences.29 The long‐term complication rates of retrievable filters and how they may differ from permanent filters warrants further investigation.
Some studies have also noted the development of PE after filter retrieval.35, 36 It is possible that a subclinical DVT was present at the time of removal or that the filter was retrieved before the risk of thrombosis had resolved. Therefore, consideration should be given to the use of duplex ultrasound evaluation for DVT prior to filter removal to ensure that patients with active thrombosis receive therapeutic anticoagulation for an appropriate duration.
Because of the concern for DVT and PE associated with retrievable filters, anticoagulation should ideally occur before and after retrieval, once the bleeding risk has become acceptable. Consensus guidelines support this practice,5, 37 though one systematic review has found insufficient evidence regarding the use of anticoagulation in patients with vena cava filters.4 Retrospective reviews have shown that filters can be both placed and removed without bleeding complications, even in patients who are therapeutically anticoagulated with warfarin and/or LMWH.38, 39 Further investigation would be useful to confirm whether this is an effective approach to VTE prevention at the time of retrieval.
Other Adverse Events
Other complications that have been associated with retrievable filters include migration, fracture, infection, and perforation. It may be difficult to estimate the true incidence of these complications, as most of the literature on this topic comes from case reports. Vena cava perforation with hooks may be not uncommon but in most cases is not clinically significant.40 Filter fracture is more common but rarely reported. Filter migration toward the heart is a very rare but potentially life‐threatening complication. The Recovery filter was taken off the market due in part to concerns about migration.26 As the use of retrievable filters increases, complications related to filters will need to be monitored.
Ongoing and Future Research
Other types of removable filters are currently in development. Convertible filters that can be converted into a stent once they are no longer needed are under investigation. Other devices, such as absorbable or drug‐eluting filters, are also being studied.5 In addition, there is ongoing research to better characterize the safety and efficacy of available filters. The Prevention du Risque d'Embolie Pulmonaire par Interruption Cave (PREPIC) 2 will assess their use in the first prospective, randomized, controlled trial of retrievable filters in patients with acute VTE receiving anticoagulation (
Conclusions
There is growing concern over the increased use of vena caval filters for the prevention of PE.41 Retrievable filters offer the possibility of protection without the risk of long‐term complications attributable to permanent filters. The advent of these devices has lead to an increase in overall filter use but also could result in filter placement without adequate consideration of the potential complications or consequences of nonretrieval. More evidence is needed in order to establish best practice guidelines for retrievable filter use. Until these data are available, these devices should be used only in patients with acute VTE who are at risk for recurrent thromboembolism and have a transient risk for bleeding.
- ,,, et al.A vena caval filter for the prevention of pulmonary embolus.Surg Forum.1967;18.
- ,,.Twenty‐one‐year trends in the use of inferior vena cava filters.Arch Intern Med.2004;164:1541–1545.
- ,,, et al.A clinical trial of vena caval filters in the prevention of pulmonary embolism in patients with proximal deep‐vein thrombosis. Prevention du Risque d'Embolie Pulmonaire par Interruption Cave Study Group.N Engl J Med.1998;338:409–415.
- ,.The need for anticoagulation following inferior vena cava filter placement: systematic review.Cardiovasc Intervent Radiol.2008;31:316–324.
- ,,, et al.Guidelines for the use of retrievable and convertible vena cava filters: report from the Society of Interventional Radiology multidisciplinary consensus conference.J Vasc Interv Radiol.2006;17:449–459.
- ,,, et al.Changing patterns in the use of inferior vena cava filters: review of a single center experience.J Am Coll Surg.2007;205:564–569.
- ,,.Hemodynamic effects of clot entrapment in the TrapEase inferior vena cava filter.J Vasc Interv Radiol.2004;15:485–490.
- ,,, et al.Vena cava filters and inferior vena cava thrombosis.J Vasc Surg.2007;45:789–794.
- ,,, et al.Clinical comparison of two optional vena cava filters.J Vasc Interv Radiol.2007;18:505–511.
- ,,, et al.Use of retrievable compared to permanent inferior vena cava filters: a single‐institution experience.Cardiovasc Intervent Radiol.2008;31:308–315.
- ,,, et al.Role of prophylactic temporary inferior vena cava filters placed at the ICU bedside under intravascular ultrasound guidance in patients with multiple trauma.J Vasc Surg.2004;40:958–964.
- ,,.Bedside vena cava filter placement with intravascular ultrasound: a simple, accurate, single venous access method.J Vasc Surg.2007;46:1284–1286.
- ,,.The bedside insertion of inferior vena cava filters using ultrasound guidance.Perspect Vasc Surg Endovasc Ther.2007;19:78–84.
- ,,, et al.Comparison of bedside transabdominal duplex ultrasound versus contrast venography for inferior vena cava filter placement: what is the best imaging modality?Ann Vasc Surg.2005;19:229–234.
- ,,, et al.Experience with the recovery filter as a retrievable inferior vena cava filter.J Vasc Interv Radiol.2005;16:1189–1193.
- ,,, et al.Gunther Tulip retrievable vena cava filter: results from the Registry of the Canadian Interventional Radiology Association.J Vasc Interv Radiol.2001;12:1053–1058.
- ,,, et al.Clinical experience with retrievable Gunther Tulip vena cava filters.J Endovasc Ther.2003;10:994–1000.
- ,,, et al.Gunther Tulip filter retrievability multicenter study including CT follow‐up: final report.J Vasc Interv Radiol.2006;17:1017–1023.
- ,,, et al.The Gunther Tulip retrievable filter: prolonged temporary filtration by repositioning within the inferior vena cava.J Vasc Interv Radiol.2003;14:1259–1265.
- ,,, et al.Retrievable inferior vena cava filters: early clinical experience.J Cardiovasc Surg (Torino).2005;46:163–169.
- ,,, et al.Gunther Tulip retrievable inferior vena caval filters: indications, efficacy, retrieval, and complications.Cardiovasc Intervent Radiol.2007;30:59–65.
- ,.Management of anticoagulation before and after elective surgery.N Engl J Med.1997;336:1506–1511.
- ,,, et al.Changes in inferior vena cava filter placement over the past decade at a large community‐based academic health center.J Vasc Surg.2008;47:157–165.
- ,,, et al.Massive pulmonary embolism.Circulation.2006;113:577–582.
- ,,, et al.Practice management guidelines for the prevention of venous thromboembolism in trauma patients: the EAST practice management guidelines work group.J Trauma.2002;53:142–164.
- ,,, et al.Practice patterns and outcomes of retrievable vena cava filters in trauma patients: an AAST multicenter study.J Trauma.2007;62:17–24; discussion 24‐25.
- ,.Inferior vena cava interruption. In: Crowther M, et al., eds.Evidence‐Based Hematology.West Sussex, UK:Wiley‐Blackwell Publishing;2008:99–109.
- ,,, et al.Are temporary inferior vena cava filters really temporary?Am J Surg.2005;190:858–863.
- ,,, et al.Retrievable vena cava filters for preventing pulmonary embolism in trauma patients: a cautionary tale.J Trauma.2006;60:35–40.
- ,,, et al.Safety, feasibility, and outcome of retrievable vena cava filters in high‐risk surgical patients.J Vasc Surg.2007;45:784–788; discussion 788.
- ,,, et al.Femoral arteriovenous fistula after placement of a Kimray‐Greenfield filter.AJR Am J Roentgenol.1988;151:681–682.
- ,,, et al.Prophylactic Greenfield filters: acute complications and long‐term follow‐up.J Trauma.1996;41:231–236; discussion 236‐237.
- ,,.Estimation of trapped thrombus volumes in retrievable inferior vena cava filters: a visual scale.J Vasc Interv Radiol.2007;18:273–276.
- ,,, et al.Endovascular recanalization of the thrombosed filter‐bearing inferior vena cava.J Vasc Interv Radiol.2003;14:893–903.
- ,,, et al.Early experience with the retrievable OptEase vena cava filter in high‐risk trauma patients.Eur J Vasc Endovasc Surg.2006;32:589–595.
- ,,, et al.Current trends in vena caval filtration with the introduction of a retrievable filter at a level I trauma center.J Trauma.2004;57:32–36.
- ,,, et al.Antithrombotic therapy for venous thromboembolic disease: the Seventh ACCP Conference on Antithrombotic and Thrombolytic Therapy.Chest.2004;126:401S–428S.
- ,,, et al.Safety of inferior vena cava filter retrieval in anticoagulated patients.Chest.2007;132:31–36.
- ,,, et al.Should anticoagulant therapy be stopped or reversed before venous intervention?Can Assoc Radiol J.1999;50:306–309.
- ,,.Retrievable vena cava filters: clinical experience.Curr Opin Pulm Med.2006;12:304–309.
- .Use of emboli‐blocking filters increases, but rigorous data are lacking.JAMA.2006;295:989–990.
- ,,, et al.Extended interval for retrieval of vena cava filters is safe and may maximize protection against pulmonary embolism.Am J Surg.2006;192:789–794.
- ,,, et al.Long‐term retrievability of IVC filters: should we abandon permanent devices?Cardiovasc Intervent Radiol.2007;30:820–827.
- ,,, et al.A prospective long‐term study of 220 patients with a retrievable vena cava filter for secondary prevention of venous thromboembolism.Chest.2007;131:223–229.
- ,,, et al.The Cook Celect filter: the UK and global experience so far. In:European Congress of Radiology.2008;European Society of Radiology:Vienna, Austria.
- ,,, et al.Multicenter retrievability trial of the recovery G2 filter.J Vasc Interv Radiol.2008;19:S28.
- ,,, et al.The Jonas study: evaluation of the retrievability of the Cordis OptEase inferior vena cava filter.J Vasc Interv Radiol.2005;16:1439–1445.
- ,,, et al.“Recovery” vena cava filter: experience in 96 patients.Cardiovasc Intervent Radiol.2006;29:559–564.
- ,,, et al.Outcomes with retrievable inferior vena cava filters: a multicenter study.J Vasc Interv Radiol.2006;17:1595–1604.
- ,,, et al.Retrievable inferior vena cava filters: initial clinical results.Ann Vasc Surg.2006;20:157–165.
- ,,, et al.Evaluation of retrievability of the Günther Tulip vena cava filter.Cardiovasc Intervent Radiol.2007;30:226–231.
- ,,, et al.A comparison of clinical outcomes with retrievable and permanent inferior vena cava filters.J Vasc Interv Radiol.2008;19:393–399.
- .The management of anticoagulation before and after procedures.Med Clin North Am.2001;85:1109–1116.
- ,,, et al.The perioperative management of antithrombotic therapy: American College of Chest Physicians Evidence‐Based Clinical Practice Guidelines, 8th ed.Chest.2008;133:299S–339S.

Asking for Help
There is little scientific evidence about professional help‐seeking behavior among resident physicians. Although junior physicians have many sources of information available to them in the course of clinical practiceprint materials, internet resources, curbside consultations, and advice from senior residents and facultywe have little empirical knowledge about when, why, and how physician trainees ask for help.
To study this phenomenon, we examined the use of a medical procedure service (MPS) by resident physicians. The MPS is an inpatient service at a Boston teaching hospital that provides education, supervision, and evaluation of internal medicine residents who perform common bedside procedures; it has been described previously.1 Residents who call the MPS review an online curriculum with self‐assessment quizzes, perform procedures with faculty supervision and feedback, and assess their own performance using online checklists. This program has been available to internal medicine residents since 2002. In a previous study, we found that residents reported greater comfort performing bedside procedures when they used the procedure service, when the operator was a postgraduate year (PGY)2 or PGY3 resident (compared to PGY1 residents), and while placing central venous catheters (CVCs) (compared to thoracenteses).2
The goal of the current study was to examine help‐seeking behavior among resident physicians as they placed CVCs and performed thoracenteses. We interpreted the decision to use the MPS to indicate that the resident successfully sought and received assistance from pulmonary attending physicians or interventional pulmonary fellows. We hypothesized that: (1) residents earlier in their training would choose to use the procedure service due to their relative lack of experience; (2) they would seek consultation when the procedure was performed in high‐risk patients, as indicated by the number of comorbidities, presence of medications that increase the risk of bleeding, and treatment in an intensive care unit; and (3) residents would be less likely to call the MPS for urgent or emergent situations, when timely assistance may be difficult to obtain. To examine the potentially confounding influence of procedures supervised by non‐MPS physicians, we also investigated differences between informally supervised procedures (i.e. by a non‐MPS attending or fellow) and unsupervised procedures (i.e. no attending or fellow supervision) to determine whether any significant differences in their characteristics existed.
Methods
Study Site
We studied CVC placement and thoracenteses performed by internal medicine residents at a 556‐bed Boston teaching hospital in 2003‐2004. During the 9‐month study period, 63 PGY1 residents (16 in a 1‐year preliminary program) and 95 PGY2 and PGY3 residents were enrolled in the program.
The MPS was staffed by hospitalists and pulmonologists skilled in teaching and performing 4 common inpatient procedures: CVC placement, thoracentesis, lumbar puncture, and paracentesis. We chose to study only the first 2 procedures because supervision of CVCs and thoracenteses by pulmonologists was available 24 hours a day in this initial year of the MPS. The other procedures were supervised by hospitalists during business hours only at the time. Ultrasound guidance was available for all procedures, supervised or not. At the time of the study, the residency program recommended consulting the MPS for procedures, but this was not mandatory. A resident electing to use the MPS to supervise a procedure on her own patient would page the MPS physician. If she were performing a procedure for the first time, she was required to review an online multimedia curriculum and complete a 5‐question cognitive test. She would then perform the procedure while supervised by the MPS physician, who would complete a checklist evaluation of the resident's performance online. All residents performing procedures, regardless of use of the MPS, would also complete procedure logs online to document procedural experience for the American Board of Internal Medicine requirements.
Study Design and Data Sources
We prospectively collected data from resident procedure logs from July 2003 through April 2004. We elicited the following information from the residents for each procedure: name of operator, year of training, date of procedure, patient's medical record number, name of attending or fellow supervisor, procedure, immediate complications (pneumothorax, bleeding, other, or none), self‐reported level of urgency (emergent, urgent, elective), time of day, procedure location, and the number of such procedures completed previously. We categorized level of supervision as: (1) MPS‐supervised if a pulmonary attending or interventional pulmonary fellow were listed as the supervisor (entailing formal faculty development as MPS faculty, resident use of the curriculum, and completion of faculty evaluations with structured feedback); (2) informally supervised if nonpulmonary attendings or fellows were involved (who may not supervise the entire procedure and would not complete a faculty evaluation); and (3) unsupervised if a resident physician or no supervisor was identified. Faculty development involved a single training session with the interventional pulmonary fellows and attendings and focused on optimal procedural teaching. During the session, we described the structure of the MPS, provided the curricular materials available to the residents, and reviewed the faculty evaluation forms in depth.
We abstracted patient characteristics (age, race/ethnicity, type of insurance, length of stay) from the electronic medical record. We performed retrospective chart reviews to record patient comorbidities (as defined by modified Deyo criteria3), to determine the number of medications associated with the risk of bleeding (such as anticoagulants and antiplatelet agents), and to discover complications that arose after the procedure was logged, including delayed bleeding, pneumothorax, or infection (localized site infection or line‐related bloodstream infection).
Data Analyses
We tabulated characteristics of residents (training level, gender, and self‐reported number of procedures), procedures (procedure type, procedure location, level of urgency, time of day), and patients (number of comorbidities and number of medications that promote bleeding) by use of the MPS. We combined resident‐reported (ie, immediate) complications and delayed complications (identified on retrospective chart review), stratified by use of the MPS. We also performed a subgroup analysis of non‐MPS procedures by comparing resident, procedure, and patient characteristics by presence or absence of informal supervision.
We created a univariable logistic regression model to examine factors associated with elective use of the MPS. We dichotomized the following independent variables: resident characteristics (PGY status, female gender, first time performing the procedure), patient characteristics (nonwhite race, female gender, Medicaid recipient, 3 or more comorbidities, any bleeding medication), and procedure characteristics (intensive care unit procedures, nonelective procedures, procedures performed between 11 PM and 8 AM). We also included 2 patient‐related interval variables (age and length of stay) in the univariable logistic regression model. We created a multivariable logistic regression model with backward elimination (P < 0.05) using the same independent variables as in the univariable analyses, to identify factors associated with use of the MPS, clustering by resident. We repeated this method to create a multivariable model to examine factors associated with the use of informal supervision among non‐MPS procedures. Analyses used Stata 7.0 (StataCorp, College Station, TX).
The study protocol was approved in advance by the hospital investigational review board.
Results
Resident Characteristics
Sixty‐nine residents reported procedures during the 9‐month study period (Table 1). Thirty (43%) residents were PGY1 and 36 (52%) were female. Twelve (17%) residents performed the procedure for the first time.
| Total residents, n (%) | 69 (100) |
|---|---|
| |
| Training year, n (%) | |
| PGY1 | 30 (43) |
| PGY2 | 23 (33) |
| PGY3 | 16 (23) |
| Gender, n (%) | |
| Female | 36 (52) |
| Male | 33 (48) |
| Self‐reported number of prior procedures, n (%)* | |
| 0 | 12 (17) |
| 1‐5 | 26 (38) |
| >6 | 31 (45) |
Patient Characteristics
The 134 patients in the study had a mean age of 65.6 years. One‐half of patients were female, and 34% were nonwhite. The principal insurer was Medicare (57%); 24% were privately insured, and 17% received Medicaid. The mean length of stay was 18.4 days (range, 0‐98 days).
MPS and Non‐MPS Procedures
As detailed in the bivariate analyses in Table 2, residents performed 191 procedures (156 CVCs and 35 thoracenteses). PGY1 residents performed approximately one‐half of the 79 MPS procedures. Fifty‐one (65%) of the 79 MPS procedures were CVC placements and 28 (35%) were thoracenteses (P < 0.001). MPS procedures were less often performed in the emergency department than non‐MPS procedures (1% versus 21%, P < 0.001). There was no significant difference in the percentage of MPS and non‐MPS procedures by time of day. Patients whose procedures were supervised by the MPS had on average 3.0 comorbidities, while patients who underwent non‐MPS procedures had 2.6 comorbidities (P = 0.02). Complications occurred in 11 (14%) of MPS and 22 (20%) of non‐MPS procedures, a statistically nonsignificant difference.
| MPS | No MPS | P Value* | |
|---|---|---|---|
| |||
| Total procedures, n (%) | 79 (100) | 112 (100) | |
| Resident characteristics | |||
| Resident level, n (%) | 0.77 | ||
| PGY1 | 42 (53) | 60 (54) | |
| PGY2 | 22 (28) | 34 (30) | |
| PGY3 | 15 (19) | 18 (16) | |
| Gender, n (%) | 0.50 | ||
| Female | 42 (53) | 54 (48) | |
| Male | 37 (47) | 58 (52) | |
| Self‐reported number of prior procedures, n (%) | 0.11 | ||
| 0 | 14 (18) | 13 (12) | |
| 1‐5 | 40 (51) | 47 (42) | |
| >6 | 25 (32) | 52 (46) | |
| Procedure characteristics | |||
| Procedure, n (%) | 0.001 | ||
| Central venous catheter | 51 (65) | 105 (94) | |
| Thoracentesis | 28 (35) | 7 (6) | |
| Location, n (%) | 0.001 | ||
| Ward | 18 (23) | 17 (15) | |
| Emergency department | 1 (1) | 23 (21) | |
| Intensive care unit | 53 (67) | 71 (63) | |
| Other | 7 (9) | 1 (1) | |
| Urgency, n (%) | 0.001 | ||
| Elective | 32 (41) | 22 (20) | |
| Urgent | 42 (53) | 78 (70) | |
| Emergent | 5 (6) | 12 (11) | |
| Time of day, n (%) | 0.33 | ||
| 8 AM to 5 PM | 50 (63) | 65 (58) | |
| 5 PM to 11 PM | 15 (19) | 20 (18) | |
| 11 PM to 8 AM | 14 (18) | 27 (24) | |
| Complications or problems, n (%) | 0.54 | ||
| Bleeding | 1 (1) | 6 (5) | |
| Pneumothorax | 1 (1) | 2 (2) | |
| Infection | 5 (6) | 5 (4) | |
| Other∥ | 4 (5) | 9 (8) | |
| None | 68 (86) | 90 (80) | |
| Patient characteristics | |||
| Number of comorbidities, mean (SD, range) | 3.0 (1.4, 0‐7) | 2.6 (1.6, 0‐7) | 0.02 |
| Number of medications associated with bleeding risk, mean (SD, range)# | 1.1 (1.0, 0‐3) | 1.1 (0.9, 0‐3) | 0.90 |
In the univariable analysis, the only variable associated with elective use of the MPS was the presence of 3 or more comorbidities (oodds ratio [OR], 2.3; 95% confidence interval [CI], 1.2‐4.1). In the multivariable analysis, residents were more likely to use the MPS when patients had 3 or more comorbidities (OR, 2.1; 95% CI, 1.2‐3.5) and less likely to use the MPS when procedures were either urgent or emergent (OR, 0.4; 95% CI, 0.2‐0.8).
Unsupervised and Informally Supervised Procedures
Table 3 shows the results of the bivariate analyses of the characteristics of the 112 procedures that were unsupervised or supervised by non‐MPS physicians. Twenty‐seven (24%) were informally supervised by nonpulmonary attendings. Residents who had performed more than 6 procedures previously were more likely to be informally supervised than not supervised at all (P = 0.001). More informally supervised procedures were performed in the emergency department (41%) than in other settings (P = 0.01). There were no significant differences in year of training, gender, urgency, time of day, complications, comorbidities, or bleeding medications.
| Informal Supervision | No Supervision | P Value* | |
|---|---|---|---|
| |||
| Total procedures, n (%) | 27 (100) | 85 (100) | |
| Resident characteristics | |||
| Resident level, n (%) | 0.13 | ||
| PGY1 | 10 (37) | 50 (59) | |
| PGY2 | 12 (44) | 22 (26) | |
| PGY3 | 5 (19) | 13 (15) | |
| Gender, n (%) | 0.99 | ||
| Female | 13 (48) | 41 (48) | |
| Male | 14 (52) | 44 (52) | |
| Self‐reported number of prior procedures, n (%) | 0.001 | ||
| 0 | 2 (7) | 11 (13) | |
| 1‐5 | 4 (15) | 43 (51) | |
| >6 | 21 (78) | 31 (36) | |
| Procedure characteristics | |||
| Procedure, n (%) | 0.53 | ||
| Central venous catheter | 26 (96) | 79 (93) | |
| Thoracentesis | 1 (4) | 6 (7) | |
| Location, n (%) | 0.01 | ||
| Ward | 1 (4) | 16 (19) | |
| Emergency department | 11 (41) | 12 (14) | |
| Intensive care unit | 15 (56) | 56 (66) | |
| Other | 0 (0) | 1 (1) | |
| Urgency, n (%) | 0.33 | ||
| Elective | 4 (15) | 18 (21) | |
| Urgent | 19 (70) | 59 (69) | |
| Emergent | 4 (15) | 8 (9) | |
| Time of Day, n (%) | 0.11 | ||
| 8 AM to 5 PM | 13 (48) | 52 (61) | |
| 5 PM to 11 PM | 4 (15) | 16 (19) | |
| 11 PM to 8 AM | 10 (37) | 17 (20) | |
| Complications or problems, n (%) | 0.45 | ||
| Bleeding | 0 (0) | 6 (7) | |
| Pneumothorax | 0 (0) | 2 (2) | |
| Infection | 0 (0) | 5 (6) | |
| Other∥ | 2 (7) | 7 (8) | |
| None | 25 (93) | 65 (76) | |
| Patient characteristics | |||
| Number of comorbidities, mean (SD, range) | 2.2 (1.3, 1‐5) | 2.7 (1.7, 0‐7) | 0.22 |
| Number of medications associated with bleeding risk, mean (SD, range)# | 0.9 (.93, 0‐3) | 1.1 (0.9, 0‐3) | 0.24 |
In the multivariable analysis, the only factor associated with the use of informal supervision (rather than absent supervision) was patient gender; informal supervision was less likely with female patients (OR, 0.3; 95% CI, 0.1‐0.8).
Discussion
To understand professional help‐seeking behavior by internal medicine resident physicians, we studied factors associated with the use of a MPS for performing 2 common bedside procedures. We found that residents used the MPS more often when they performed procedures on patients with more comorbidities and less often during urgent or emergent procedures.
These results are consistent with our hypothesis that residents use formal supervision when caring for high‐risk patients. We had also hypothesized that they would seek the MPS for patients on medications that increase the risk of bleeding, but this was not borne out. One possible explanation is that invasive procedures on anticoagulated patients may be deferred or avoided. Additionally, we did not collect prothrombin times nor platelet count, which may represent better proxies for coagulopathy. Our hypothesis that residents would not seek the MPS for urgent and emergent procedures was confirmed; the time delay between contacting the faculty member and performing the procedure may have inhibited or obviated consultation of the MPS. We hypothesized that interns would use the MPS preferentially; we found instead that level of training did not influence use of the MPS. A resident early in training may struggle with the balance between autonomy and supervision, wanting instead to establish himself as able to solve clinical problems independently and by seeking consultation only as a last resort. Alternatively, interns may be primarily supervised by their residents and may seek expert assistance only for particularly challenging or high‐risk cases. Additionally, as newcomers to the training program, they may not be well acquainted with the role and availability of the service (although periodic announcements were made throughout the year). Our examination of procedures not supervised by the MPS showed that informally supervised and unsupervised procedures are quite similar to each other; the inverse relationship between informal supervision and patient gender is difficult to explain and may be spurious.
To our knowledge, only 1 author has postulated a theoretical foundation for help‐seeking in trainees, depicted in the context of the patient‐resident‐attending triadic relationship.4 The mature help‐seeker, whether patient, resident, or attending, is willing to confront problems, receptive to new information, able to acknowledge dependence on expertise, and able to apply new input with self‐reliance. However, little is known about how this model manifests itself empirically in professional help‐seeking or what the optimal conditions of faculty supervision are. One observational study suggested that faculty who spent more time on hospital floors created environments with higher resident satisfaction scores, higher perceived quality of patient care, and, paradoxically, increased perceptions of autonomy.5 These results are consistent with our previous work showing that residents' comfort with bedside procedures increased with use of the MPS.2 In the related field of consultation medicine, 2 studies6, 7 showed that family practitioners prefer to consult internal medicine subspecialists over general internists. One of these studies7 demonstrated that the primary need was for a consultant with technical (ie, procedural) skills. Our use of MPS faculty who are specifically skilled in performing medical procedures appears to be consistent with this observation that specific technical expertise is valued over general supervision or guidance.
How can we best design formal procedural supervision programs that allow residents to obtain help when they need it? In addition to fostering mature help‐seeking behavior, help‐giving requires: (1) an environment that encourages help‐seeking; (2) a mechanism to provide assistance when and where it is needed; (3) supervisors with technical expertise; and (4) supervision that supports learning, skill acquisition, and graduated autonomy. It is difficult to devise mechanisms that include all of these elements. For instance, 24‐hour per day faculty coverage may be logistically challenging and expensive. Physicians with technical expertise may not be good teachers despite faculty development on procedural teaching. Obstacles to successful help‐seeking may include differences in residents' and supervisors' perceptions about the need for supervision. For example, a supervisor may be available and willing to assist, but the resident may feel capable of performing independently. When assistance is provided, residents and supervisors may differ in their perceptions of the quality of supervision.8 Ultimately, any educational intervention to increase supervision must confront a cultural norm of self‐sufficiency among many residency programs, in which managing a situation without assistance is equated with competence. To address this issue, our hospital has mandated the use of the MPS for all bedside procedures since 2005 and staffed the program 24 hours a day, in recognition of the potential risk of procedural complications9, 10 among inexperienced trainees.
This study has several limitations. We had a small number of thoracenteses. The study was not designed or powered to examine differences in complication rates among MPS and non‐MPS procedures. Because we represent a single institution, our findings may not be generalizable to other teaching hospitals or nonteaching settings. Our data on procedure characteristics were ascertained through resident self‐reports and, though typically submitted in a timely way, are subject to recall bias. In particular, discrepancies in the reported level of urgency may have affected our results about the time‐dependent nature of help‐seeking. Additionally, our findings about the types of patients about which residents seek consultation are somewhat at odds; use of the modified Deyo criteria to adjust for clinical severity weighs chronic conditions heavily and may translate into complication risk, but the level of urgency may better reflect the acuity of the clinical presentation. We could not distinguish between resident‐supervised procedures and those performed without supervision because of limited data. We also acknowledge the possibility that some non‐MPS faculty (classified for the study as informal supervisors) may serendipitously provide an equal quality of supervision that our MPS faculty did, by being present throughout the procedure and giving structured and valuable feedback.
Nevertheless, our results suggest that many residents do seek formal help appropriately when they perform procedures on the sickest patients, recognizing the risk and technical difficulty associated with bedside procedures in these patients. Our results also point to a greater area of inquiry: how do we optimally address the help‐seeking needs among trainee physicians? How do we create an environment in which help‐seeking is encouraged? How do we overcome the logistical barriers of providing timely assistance to residents, particularly at times of greatest need (urgent or emergent procedures)? How do we confront a longstanding culture in which independence is equated with competence, especially as it relates to procedural skills? A better understanding of how the widespread availability of programs like our MPS would affect the residents' use of supervision in general may guide the design of resident curricula and the development of mechanisms to ensure safe and effective clinical care.
- ,,, et al.Creation of an innovative inpatient medical procedure service and a method to evaluate house staff competency.J Gen Intern Med.2004;19:510–513.
- ,,, et al.Beyond the comfort zone: residents assess their comfort performing inpatient medical procedures.Am J Med.2006;119:71.e17–e24.
- ,,.Adapting a clinical comorbidity index for use with ICD‐9‐CM administrative databases.J Clin Epidemiol.1992;45:613–619.
- .Parallel process in the family medicine system: issues and challenges for resident training.Fam Med.1990;22:312–319.
- ,,,,.Increased faculty presence on inpatient teaching services.Mayo Clin Proc.2004;79:332–336.
- ,,,.Principles of effective consultation: an update for the 21st‐century consultant.Arch Intern Med.2007;167:271–275.
- ,.Family physician consultation/referral patterns.J Am Board Fam Pract.1988;1:106–111.
- ,,, et al.Operating room teamwork among physicians and nurses: teamwork in the eye of the beholder.J Am Coll Surg.2006;202:746–752.
- ,,, et al.The nature of adverse events in hospitalized patients. Results of the Harvard Medical Practice Study II.N Engl J Med.1991;324:377–384.
- ,,,.Impact of procedure‐related complications on patient outcome on a general medicine service.J Gen Intern Med.1994;9:66–70.
There is little scientific evidence about professional help‐seeking behavior among resident physicians. Although junior physicians have many sources of information available to them in the course of clinical practiceprint materials, internet resources, curbside consultations, and advice from senior residents and facultywe have little empirical knowledge about when, why, and how physician trainees ask for help.
To study this phenomenon, we examined the use of a medical procedure service (MPS) by resident physicians. The MPS is an inpatient service at a Boston teaching hospital that provides education, supervision, and evaluation of internal medicine residents who perform common bedside procedures; it has been described previously.1 Residents who call the MPS review an online curriculum with self‐assessment quizzes, perform procedures with faculty supervision and feedback, and assess their own performance using online checklists. This program has been available to internal medicine residents since 2002. In a previous study, we found that residents reported greater comfort performing bedside procedures when they used the procedure service, when the operator was a postgraduate year (PGY)2 or PGY3 resident (compared to PGY1 residents), and while placing central venous catheters (CVCs) (compared to thoracenteses).2
The goal of the current study was to examine help‐seeking behavior among resident physicians as they placed CVCs and performed thoracenteses. We interpreted the decision to use the MPS to indicate that the resident successfully sought and received assistance from pulmonary attending physicians or interventional pulmonary fellows. We hypothesized that: (1) residents earlier in their training would choose to use the procedure service due to their relative lack of experience; (2) they would seek consultation when the procedure was performed in high‐risk patients, as indicated by the number of comorbidities, presence of medications that increase the risk of bleeding, and treatment in an intensive care unit; and (3) residents would be less likely to call the MPS for urgent or emergent situations, when timely assistance may be difficult to obtain. To examine the potentially confounding influence of procedures supervised by non‐MPS physicians, we also investigated differences between informally supervised procedures (i.e. by a non‐MPS attending or fellow) and unsupervised procedures (i.e. no attending or fellow supervision) to determine whether any significant differences in their characteristics existed.
Methods
Study Site
We studied CVC placement and thoracenteses performed by internal medicine residents at a 556‐bed Boston teaching hospital in 2003‐2004. During the 9‐month study period, 63 PGY1 residents (16 in a 1‐year preliminary program) and 95 PGY2 and PGY3 residents were enrolled in the program.
The MPS was staffed by hospitalists and pulmonologists skilled in teaching and performing 4 common inpatient procedures: CVC placement, thoracentesis, lumbar puncture, and paracentesis. We chose to study only the first 2 procedures because supervision of CVCs and thoracenteses by pulmonologists was available 24 hours a day in this initial year of the MPS. The other procedures were supervised by hospitalists during business hours only at the time. Ultrasound guidance was available for all procedures, supervised or not. At the time of the study, the residency program recommended consulting the MPS for procedures, but this was not mandatory. A resident electing to use the MPS to supervise a procedure on her own patient would page the MPS physician. If she were performing a procedure for the first time, she was required to review an online multimedia curriculum and complete a 5‐question cognitive test. She would then perform the procedure while supervised by the MPS physician, who would complete a checklist evaluation of the resident's performance online. All residents performing procedures, regardless of use of the MPS, would also complete procedure logs online to document procedural experience for the American Board of Internal Medicine requirements.
Study Design and Data Sources
We prospectively collected data from resident procedure logs from July 2003 through April 2004. We elicited the following information from the residents for each procedure: name of operator, year of training, date of procedure, patient's medical record number, name of attending or fellow supervisor, procedure, immediate complications (pneumothorax, bleeding, other, or none), self‐reported level of urgency (emergent, urgent, elective), time of day, procedure location, and the number of such procedures completed previously. We categorized level of supervision as: (1) MPS‐supervised if a pulmonary attending or interventional pulmonary fellow were listed as the supervisor (entailing formal faculty development as MPS faculty, resident use of the curriculum, and completion of faculty evaluations with structured feedback); (2) informally supervised if nonpulmonary attendings or fellows were involved (who may not supervise the entire procedure and would not complete a faculty evaluation); and (3) unsupervised if a resident physician or no supervisor was identified. Faculty development involved a single training session with the interventional pulmonary fellows and attendings and focused on optimal procedural teaching. During the session, we described the structure of the MPS, provided the curricular materials available to the residents, and reviewed the faculty evaluation forms in depth.
We abstracted patient characteristics (age, race/ethnicity, type of insurance, length of stay) from the electronic medical record. We performed retrospective chart reviews to record patient comorbidities (as defined by modified Deyo criteria3), to determine the number of medications associated with the risk of bleeding (such as anticoagulants and antiplatelet agents), and to discover complications that arose after the procedure was logged, including delayed bleeding, pneumothorax, or infection (localized site infection or line‐related bloodstream infection).
Data Analyses
We tabulated characteristics of residents (training level, gender, and self‐reported number of procedures), procedures (procedure type, procedure location, level of urgency, time of day), and patients (number of comorbidities and number of medications that promote bleeding) by use of the MPS. We combined resident‐reported (ie, immediate) complications and delayed complications (identified on retrospective chart review), stratified by use of the MPS. We also performed a subgroup analysis of non‐MPS procedures by comparing resident, procedure, and patient characteristics by presence or absence of informal supervision.
We created a univariable logistic regression model to examine factors associated with elective use of the MPS. We dichotomized the following independent variables: resident characteristics (PGY status, female gender, first time performing the procedure), patient characteristics (nonwhite race, female gender, Medicaid recipient, 3 or more comorbidities, any bleeding medication), and procedure characteristics (intensive care unit procedures, nonelective procedures, procedures performed between 11 PM and 8 AM). We also included 2 patient‐related interval variables (age and length of stay) in the univariable logistic regression model. We created a multivariable logistic regression model with backward elimination (P < 0.05) using the same independent variables as in the univariable analyses, to identify factors associated with use of the MPS, clustering by resident. We repeated this method to create a multivariable model to examine factors associated with the use of informal supervision among non‐MPS procedures. Analyses used Stata 7.0 (StataCorp, College Station, TX).
The study protocol was approved in advance by the hospital investigational review board.
Results
Resident Characteristics
Sixty‐nine residents reported procedures during the 9‐month study period (Table 1). Thirty (43%) residents were PGY1 and 36 (52%) were female. Twelve (17%) residents performed the procedure for the first time.
| Total residents, n (%) | 69 (100) |
|---|---|
| |
| Training year, n (%) | |
| PGY1 | 30 (43) |
| PGY2 | 23 (33) |
| PGY3 | 16 (23) |
| Gender, n (%) | |
| Female | 36 (52) |
| Male | 33 (48) |
| Self‐reported number of prior procedures, n (%)* | |
| 0 | 12 (17) |
| 1‐5 | 26 (38) |
| >6 | 31 (45) |
Patient Characteristics
The 134 patients in the study had a mean age of 65.6 years. One‐half of patients were female, and 34% were nonwhite. The principal insurer was Medicare (57%); 24% were privately insured, and 17% received Medicaid. The mean length of stay was 18.4 days (range, 0‐98 days).
MPS and Non‐MPS Procedures
As detailed in the bivariate analyses in Table 2, residents performed 191 procedures (156 CVCs and 35 thoracenteses). PGY1 residents performed approximately one‐half of the 79 MPS procedures. Fifty‐one (65%) of the 79 MPS procedures were CVC placements and 28 (35%) were thoracenteses (P < 0.001). MPS procedures were less often performed in the emergency department than non‐MPS procedures (1% versus 21%, P < 0.001). There was no significant difference in the percentage of MPS and non‐MPS procedures by time of day. Patients whose procedures were supervised by the MPS had on average 3.0 comorbidities, while patients who underwent non‐MPS procedures had 2.6 comorbidities (P = 0.02). Complications occurred in 11 (14%) of MPS and 22 (20%) of non‐MPS procedures, a statistically nonsignificant difference.
| MPS | No MPS | P Value* | |
|---|---|---|---|
| |||
| Total procedures, n (%) | 79 (100) | 112 (100) | |
| Resident characteristics | |||
| Resident level, n (%) | 0.77 | ||
| PGY1 | 42 (53) | 60 (54) | |
| PGY2 | 22 (28) | 34 (30) | |
| PGY3 | 15 (19) | 18 (16) | |
| Gender, n (%) | 0.50 | ||
| Female | 42 (53) | 54 (48) | |
| Male | 37 (47) | 58 (52) | |
| Self‐reported number of prior procedures, n (%) | 0.11 | ||
| 0 | 14 (18) | 13 (12) | |
| 1‐5 | 40 (51) | 47 (42) | |
| >6 | 25 (32) | 52 (46) | |
| Procedure characteristics | |||
| Procedure, n (%) | 0.001 | ||
| Central venous catheter | 51 (65) | 105 (94) | |
| Thoracentesis | 28 (35) | 7 (6) | |
| Location, n (%) | 0.001 | ||
| Ward | 18 (23) | 17 (15) | |
| Emergency department | 1 (1) | 23 (21) | |
| Intensive care unit | 53 (67) | 71 (63) | |
| Other | 7 (9) | 1 (1) | |
| Urgency, n (%) | 0.001 | ||
| Elective | 32 (41) | 22 (20) | |
| Urgent | 42 (53) | 78 (70) | |
| Emergent | 5 (6) | 12 (11) | |
| Time of day, n (%) | 0.33 | ||
| 8 AM to 5 PM | 50 (63) | 65 (58) | |
| 5 PM to 11 PM | 15 (19) | 20 (18) | |
| 11 PM to 8 AM | 14 (18) | 27 (24) | |
| Complications or problems, n (%) | 0.54 | ||
| Bleeding | 1 (1) | 6 (5) | |
| Pneumothorax | 1 (1) | 2 (2) | |
| Infection | 5 (6) | 5 (4) | |
| Other∥ | 4 (5) | 9 (8) | |
| None | 68 (86) | 90 (80) | |
| Patient characteristics | |||
| Number of comorbidities, mean (SD, range) | 3.0 (1.4, 0‐7) | 2.6 (1.6, 0‐7) | 0.02 |
| Number of medications associated with bleeding risk, mean (SD, range)# | 1.1 (1.0, 0‐3) | 1.1 (0.9, 0‐3) | 0.90 |
In the univariable analysis, the only variable associated with elective use of the MPS was the presence of 3 or more comorbidities (oodds ratio [OR], 2.3; 95% confidence interval [CI], 1.2‐4.1). In the multivariable analysis, residents were more likely to use the MPS when patients had 3 or more comorbidities (OR, 2.1; 95% CI, 1.2‐3.5) and less likely to use the MPS when procedures were either urgent or emergent (OR, 0.4; 95% CI, 0.2‐0.8).
Unsupervised and Informally Supervised Procedures
Table 3 shows the results of the bivariate analyses of the characteristics of the 112 procedures that were unsupervised or supervised by non‐MPS physicians. Twenty‐seven (24%) were informally supervised by nonpulmonary attendings. Residents who had performed more than 6 procedures previously were more likely to be informally supervised than not supervised at all (P = 0.001). More informally supervised procedures were performed in the emergency department (41%) than in other settings (P = 0.01). There were no significant differences in year of training, gender, urgency, time of day, complications, comorbidities, or bleeding medications.
| Informal Supervision | No Supervision | P Value* | |
|---|---|---|---|
| |||
| Total procedures, n (%) | 27 (100) | 85 (100) | |
| Resident characteristics | |||
| Resident level, n (%) | 0.13 | ||
| PGY1 | 10 (37) | 50 (59) | |
| PGY2 | 12 (44) | 22 (26) | |
| PGY3 | 5 (19) | 13 (15) | |
| Gender, n (%) | 0.99 | ||
| Female | 13 (48) | 41 (48) | |
| Male | 14 (52) | 44 (52) | |
| Self‐reported number of prior procedures, n (%) | 0.001 | ||
| 0 | 2 (7) | 11 (13) | |
| 1‐5 | 4 (15) | 43 (51) | |
| >6 | 21 (78) | 31 (36) | |
| Procedure characteristics | |||
| Procedure, n (%) | 0.53 | ||
| Central venous catheter | 26 (96) | 79 (93) | |
| Thoracentesis | 1 (4) | 6 (7) | |
| Location, n (%) | 0.01 | ||
| Ward | 1 (4) | 16 (19) | |
| Emergency department | 11 (41) | 12 (14) | |
| Intensive care unit | 15 (56) | 56 (66) | |
| Other | 0 (0) | 1 (1) | |
| Urgency, n (%) | 0.33 | ||
| Elective | 4 (15) | 18 (21) | |
| Urgent | 19 (70) | 59 (69) | |
| Emergent | 4 (15) | 8 (9) | |
| Time of Day, n (%) | 0.11 | ||
| 8 AM to 5 PM | 13 (48) | 52 (61) | |
| 5 PM to 11 PM | 4 (15) | 16 (19) | |
| 11 PM to 8 AM | 10 (37) | 17 (20) | |
| Complications or problems, n (%) | 0.45 | ||
| Bleeding | 0 (0) | 6 (7) | |
| Pneumothorax | 0 (0) | 2 (2) | |
| Infection | 0 (0) | 5 (6) | |
| Other∥ | 2 (7) | 7 (8) | |
| None | 25 (93) | 65 (76) | |
| Patient characteristics | |||
| Number of comorbidities, mean (SD, range) | 2.2 (1.3, 1‐5) | 2.7 (1.7, 0‐7) | 0.22 |
| Number of medications associated with bleeding risk, mean (SD, range)# | 0.9 (.93, 0‐3) | 1.1 (0.9, 0‐3) | 0.24 |
In the multivariable analysis, the only factor associated with the use of informal supervision (rather than absent supervision) was patient gender; informal supervision was less likely with female patients (OR, 0.3; 95% CI, 0.1‐0.8).
Discussion
To understand professional help‐seeking behavior by internal medicine resident physicians, we studied factors associated with the use of a MPS for performing 2 common bedside procedures. We found that residents used the MPS more often when they performed procedures on patients with more comorbidities and less often during urgent or emergent procedures.
These results are consistent with our hypothesis that residents use formal supervision when caring for high‐risk patients. We had also hypothesized that they would seek the MPS for patients on medications that increase the risk of bleeding, but this was not borne out. One possible explanation is that invasive procedures on anticoagulated patients may be deferred or avoided. Additionally, we did not collect prothrombin times nor platelet count, which may represent better proxies for coagulopathy. Our hypothesis that residents would not seek the MPS for urgent and emergent procedures was confirmed; the time delay between contacting the faculty member and performing the procedure may have inhibited or obviated consultation of the MPS. We hypothesized that interns would use the MPS preferentially; we found instead that level of training did not influence use of the MPS. A resident early in training may struggle with the balance between autonomy and supervision, wanting instead to establish himself as able to solve clinical problems independently and by seeking consultation only as a last resort. Alternatively, interns may be primarily supervised by their residents and may seek expert assistance only for particularly challenging or high‐risk cases. Additionally, as newcomers to the training program, they may not be well acquainted with the role and availability of the service (although periodic announcements were made throughout the year). Our examination of procedures not supervised by the MPS showed that informally supervised and unsupervised procedures are quite similar to each other; the inverse relationship between informal supervision and patient gender is difficult to explain and may be spurious.
To our knowledge, only 1 author has postulated a theoretical foundation for help‐seeking in trainees, depicted in the context of the patient‐resident‐attending triadic relationship.4 The mature help‐seeker, whether patient, resident, or attending, is willing to confront problems, receptive to new information, able to acknowledge dependence on expertise, and able to apply new input with self‐reliance. However, little is known about how this model manifests itself empirically in professional help‐seeking or what the optimal conditions of faculty supervision are. One observational study suggested that faculty who spent more time on hospital floors created environments with higher resident satisfaction scores, higher perceived quality of patient care, and, paradoxically, increased perceptions of autonomy.5 These results are consistent with our previous work showing that residents' comfort with bedside procedures increased with use of the MPS.2 In the related field of consultation medicine, 2 studies6, 7 showed that family practitioners prefer to consult internal medicine subspecialists over general internists. One of these studies7 demonstrated that the primary need was for a consultant with technical (ie, procedural) skills. Our use of MPS faculty who are specifically skilled in performing medical procedures appears to be consistent with this observation that specific technical expertise is valued over general supervision or guidance.
How can we best design formal procedural supervision programs that allow residents to obtain help when they need it? In addition to fostering mature help‐seeking behavior, help‐giving requires: (1) an environment that encourages help‐seeking; (2) a mechanism to provide assistance when and where it is needed; (3) supervisors with technical expertise; and (4) supervision that supports learning, skill acquisition, and graduated autonomy. It is difficult to devise mechanisms that include all of these elements. For instance, 24‐hour per day faculty coverage may be logistically challenging and expensive. Physicians with technical expertise may not be good teachers despite faculty development on procedural teaching. Obstacles to successful help‐seeking may include differences in residents' and supervisors' perceptions about the need for supervision. For example, a supervisor may be available and willing to assist, but the resident may feel capable of performing independently. When assistance is provided, residents and supervisors may differ in their perceptions of the quality of supervision.8 Ultimately, any educational intervention to increase supervision must confront a cultural norm of self‐sufficiency among many residency programs, in which managing a situation without assistance is equated with competence. To address this issue, our hospital has mandated the use of the MPS for all bedside procedures since 2005 and staffed the program 24 hours a day, in recognition of the potential risk of procedural complications9, 10 among inexperienced trainees.
This study has several limitations. We had a small number of thoracenteses. The study was not designed or powered to examine differences in complication rates among MPS and non‐MPS procedures. Because we represent a single institution, our findings may not be generalizable to other teaching hospitals or nonteaching settings. Our data on procedure characteristics were ascertained through resident self‐reports and, though typically submitted in a timely way, are subject to recall bias. In particular, discrepancies in the reported level of urgency may have affected our results about the time‐dependent nature of help‐seeking. Additionally, our findings about the types of patients about which residents seek consultation are somewhat at odds; use of the modified Deyo criteria to adjust for clinical severity weighs chronic conditions heavily and may translate into complication risk, but the level of urgency may better reflect the acuity of the clinical presentation. We could not distinguish between resident‐supervised procedures and those performed without supervision because of limited data. We also acknowledge the possibility that some non‐MPS faculty (classified for the study as informal supervisors) may serendipitously provide an equal quality of supervision that our MPS faculty did, by being present throughout the procedure and giving structured and valuable feedback.
Nevertheless, our results suggest that many residents do seek formal help appropriately when they perform procedures on the sickest patients, recognizing the risk and technical difficulty associated with bedside procedures in these patients. Our results also point to a greater area of inquiry: how do we optimally address the help‐seeking needs among trainee physicians? How do we create an environment in which help‐seeking is encouraged? How do we overcome the logistical barriers of providing timely assistance to residents, particularly at times of greatest need (urgent or emergent procedures)? How do we confront a longstanding culture in which independence is equated with competence, especially as it relates to procedural skills? A better understanding of how the widespread availability of programs like our MPS would affect the residents' use of supervision in general may guide the design of resident curricula and the development of mechanisms to ensure safe and effective clinical care.
- ,,, et al.Creation of an innovative inpatient medical procedure service and a method to evaluate house staff competency.J Gen Intern Med.2004;19:510–513.
- ,,, et al.Beyond the comfort zone: residents assess their comfort performing inpatient medical procedures.Am J Med.2006;119:71.e17–e24.
- ,,.Adapting a clinical comorbidity index for use with ICD‐9‐CM administrative databases.J Clin Epidemiol.1992;45:613–619.
- .Parallel process in the family medicine system: issues and challenges for resident training.Fam Med.1990;22:312–319.
- ,,,,.Increased faculty presence on inpatient teaching services.Mayo Clin Proc.2004;79:332–336.
- ,,,.Principles of effective consultation: an update for the 21st‐century consultant.Arch Intern Med.2007;167:271–275.
- ,.Family physician consultation/referral patterns.J Am Board Fam Pract.1988;1:106–111.
- ,,, et al.Operating room teamwork among physicians and nurses: teamwork in the eye of the beholder.J Am Coll Surg.2006;202:746–752.
- ,,, et al.The nature of adverse events in hospitalized patients. Results of the Harvard Medical Practice Study II.N Engl J Med.1991;324:377–384.
- ,,,.Impact of procedure‐related complications on patient outcome on a general medicine service.J Gen Intern Med.1994;9:66–70.
Copyright © 2009 Society of Hospital Medicine
Central Line Insertion Using Simulators
The Accreditation Council for Graduate Medical Education mandates that internal medicine residents develop technical proficiency in performing central venous catheterization (CVC).1 Likewise in Canada, technical expertise in performing CVC is a specific competency requirement in the training objectives in internal medicine by the Royal College of Physicians and Surgeons of Canada.2 For certification in Internal Medicine, the American Board of Internal Medicine expects its candidates to be competent with respect to knowledge and understanding of the indications, contraindications, recognition, and management of complications of CVC.3 Despite the importance of procedural teaching in medical education, most internal medicine residency programs do not have formal procedural teaching.4 A number of potential barriers to teaching CVC exist. A recent study by the American College of Physicians found that fewer general internists perform procedures, compared with internists in the 1980s.5 With fewer internists performing procedures, there may be fewer educators with adequate confidence in teaching these procedures.6 Second, with increasing recognition of patient safety, there is a growing reluctance of patients to be used as teaching subjects for those who are learning CVC.7 Not surprisingly, residents report low comfort in performing CVC.8
Teaching procedures on simulators offers the benefits of allowing both teaching and evaluation of procedures without jeopardizing patient safety9 and is a welcomed variation from the traditional see 1, do 1, teach 1 approach.10 Despite the theoretical benefits of the use of simulators in medical education, the efficacy of their use in teaching internal medicine residents remains understudied.
The purpose of our study was to evaluate the benefits of using simulator models in teaching CVC to internal medicine residents. We hypothesized that participation in a simulator‐based teaching session on CVC would result in improved knowledge and performance of the procedure and confidence.
Methods
Participants
The study was approved by our university and hospital ethics review board. All first‐year internal medicine residents in a single academic institution, who provided written informed consent, were included and enrolled in a simulator curriculum on CVC.
Intervention
All participants completed a baseline multiple choice knowledge test on anatomy, procedural technique, and complications of CVC, as well as a self‐assessment questionnaire on confidence and prior experience of CVC. Upon completion of these, participants were provided access to Internet links of multimedia educational materials on CVC, including references for suggested reading.11, 12 One week later, participants, in small groups of 3 to 5 subjects, attended a 2‐hour simulation session on CVC. For each participant, the baseline performance of an internal jugular CVC on a simulator (Laerdal IV Torso; Laerdal Medical Corp, Wappingers Falls, NY) was videotaped in a blinded fashion. Blinding was done by assigning participants study numbers. No personal identifying information was recorded, as only gowned and gloved hands, arms, and parts of the simulator were recorded. A faculty member and a senior medical resident then demonstrated to each participant the proper CVC techniques on the simulator, which was followed by an 1‐hour practice session with the simulator. Feedback was provided by the supervising faculty member and senior resident during the practice session. Ultrasound‐guided CVC was demonstrated during the session, but not included for evaluation. postsession, each participant's repeat performance of an internal jugular CVC was videotaped in a blinded fashion, similar to that previously described. All participants then repeated the multiple‐choice knowledge assessment 1 week after the simulation session. For assessment of knowledge retention and confidence, all participants were invited to complete the multiple‐choice knowledge assessment at 18 months after training on simulation.
Measurements and Outcomes
We assessed knowledge on CVC based on performance on a 20‐item multiple‐choice test (scored out of 20, presented as a percentage). Questions were constructed based on information from published literature,11 covering areas of anatomy, procedural technique, and complications of CVC. Procedural skills were assessed by 2 raters using a previously validated modified global rating scale (5‐point Likert scale design)13, 14 during review of videotaped performances (Appendix A). Our primary outcome was an overall global rating score. Review was done by 2 independent, blinded raters who were not aware of whether the performances were recorded presimulation or postsimulation training sessions. Weighted Kappa scores for interobserver agreement between video reviewers ranged between 0.35 (95% confidence interval, 0.250.60) for the global average rating score to 0.43 (95% confidence interval, 0.170.53) for the procedural checklist. These Kappa scores indicate fair to moderate agreement, respectively.15
Secondary outcomes included other domains on the global rating scale such as: time and motion, instrument handling, flow of operation, knowledge of instruments,13, 14 checklist score, number of attempts to locate vein and insert catheter, time to complete the procedure, and self‐reported confidence. The criteria of this checklist score were based on a previously published 14‐item checklist,16 assessing for objective completion of specific tasks (Appendix B). Participants were scored based on 10 items, as the remaining 4 items on the original checklist were not applicable to our simulation session (that is, the items on site selection, catheter selection, Trendelenburg positioning, and sterile sealing of site). In our study, all participants were asked to complete an internal jugular catheterization with a standard kit provided, without the need to dress the site after line insertion. Confidence was assessed by self‐report on a 6‐point Likert scale ranging from none to complete.
Statistical Analysis
Comparisons between pretraining and posttraining were made with the use of McNemar's test for paired data and Wilcoxon signed‐rank test where appropriate. Usual descriptive statistics using mean standard deviation (SD), median and interquartile range (IQR) are reported. Comparisons between presession, postsession, and 18‐month data were analyzed using 1‐way analysis of variance (ANOVA), repeated measures design. Homogeneity of covariance assumption test indicated no evidence of nonsphericity in data (Mauchly's criterion; P = 0.53). All reported P values are 2‐sided. Analyses were conducted using the SAS version 9.1 (SAS Institute, Cary, NC).
Results
Of the 33 residents in the first‐year internal medicine program, all consented to participate. Thirty participants (91%) completed the study protocol between January and June 2007. The remaining three residents completed the presession assessments and the simulation session, but did not complete the postsession assessments. These were excluded from our analysis. At baseline, 20 participants had rotated through a previous 1‐month intensive care unit (ICU) block, 8 residents had no prior ICU training, and 2 residents had 2 months of ICU training. Table 1 summarizes the residents' baseline CVC experience prior to the simulation training. In general, participants had limited experience with CVC at baseline, having placed very few internal jugular CVCs (median = 4).
| Femoral Lines | Internal Jugular Lines | Subclavian Lines | |
|---|---|---|---|
| |||
| Number observed (IQR) | 4 (25) | 5 (37) | 2 (13) |
| Number attempted or performed (IQR) | 3 (15) | 4 (28) | 0 (02) |
| Number performed successfully without assistance (IQR) | 2 (03) | 4 (15) | 0 (01) |
Simulation training was associated with an increase in knowledge. Mean scores on multiple‐choice tests increased from 65.7 11.9% to 81.2 10.7 (P < 0.001). Furthermore, simulation training was associated with improvement in CVC performance. Median global average rating score increased from 3.5 (IQR = 34) to 4.5 (IQR = 44.5) (P < 0.001).
The procedural checklist median score increased from 9 (IQR = 69.5) to 9.5 (IQR = 99.5) (P <.001), median time required for completion of CVC decreased from 8 minutes 22 seconds (IQR = 7 minutes 37 seconds to 12 minutes 1 second) to 6 minutes 43 seconds (IQR = 6 minutes to 7 minutes 25 seconds) (P = 0.002). Other performance measures are summarized in Table 2. Last, simulation training was associated with an increase in self‐rated confidence. The median confidence rating (0 lowest, 5 highest) increased from 3 (moderate, IQR = 23) to 4 (good, IQR = 34) (P < 0.001). The overall satisfaction with the CVC simulation course was good (Table 3) and all 30 participants felt this course should continue to be offered.
| Pre | Post | P Value | |
|---|---|---|---|
| |||
| Number of attempts to locate vein; n (%) | 0.01 | ||
| 1 | 16 | 26 | |
| 2 | 14 | 4 | |
| Number of attempts to insert catheter; n (%) | 0.32 | ||
| 1 | 27 | 29 | |
| >1 | 3 | 1 | |
| Median time and motion score (IQR) | 4 (34) | 5 (45) | <0.001 |
| Median instrument handling score (IQR) | 4 (34) | 5 (45) | <0.001 |
| Median flow of operation score (IQR) | 4 (35) | 5 (45) | <0.001 |
| Median knowledge of instruments score (IQR) | 4 (35) | 5 (45) | 0.004 |
| Agree Strongly | Agree | Neutral | Disagree | Disagree Strongly | |
|---|---|---|---|---|---|
| |||||
| Course improved technical ability to insert central lines | 3 | 21 | 6 | 0 | 0 |
| Course decreased anxiety related to line placement | 6 | 22 | 2 | 0 | 0 |
| Course improved ability to deliver patient care | 6 | 22 | 2 | 0 | 0 |
Knowledge Retention
Sixteen participants completed the knowledge‐retention multiple‐choice tests. No significant differences in baseline characteristics were found between those who completed the knowledge retention tests (n = 16) vs. those who did not (n = 17) in baseline knowledge scores, previous ICU training, gender, and baseline self‐rated confidence.
Mean baseline multiple‐choice test score in the 16 participants who completed the knowledge retention tests was 65.3% 10.6%. Mean score 1 week posttraining was 80.3 9.4%. Mean score at 18 months was 78.4 9.6%. Results from 1‐way ANOVA, repeated‐measures design showed a significant improvement in knowledge scores, F(2, 30) = 14.83, P < 0.0001. Contrasts showed that scores at 1 week were significantly higher than baseline scores (P < 0.0001), and improvement in scores at 18 months was retained, remaining significantly higher than baseline scores (P = 0.002). Median confidence level increased from 3 (moderate) at baseline, to 4 (good) at 1‐week posttraining. Confidence level remained 4 (good) at 18 months (P < 0.0001).
Discussion
CVC is an important procedural competency for internists to master. Indications for CVC range from measuring of central venous pressure to administration of specific medications or solutions such as inotropic agents and total parental nutrition. Its use is important in the care of those who are acutely or critically ill and those who are chronically ill. CVC is associated with a number of potentially serious mechanical complications, including arterial puncture, pneumothorax, and death.11, 17 Proficiency in CVC insertion is found to be closely related to operator experience: catheter insertion by physicians who have performed 50 or more CVC are one‐half as likely to sustain complications as catheter insertion by less experienced physicians.18 Furthermore, training has been found to be associated with a decrease in risk for catheter associated infection19 and pneumothorax.20 Therefore, cumulative experience from repeated clinical encounters and education on CVC play an important role in optimizing patient safety and reducing potential errors associated with CVC. It is well‐documented that patients are generally reluctant to allow medical trainees to learn or practice procedures on them,7 especially in the early phases of training. Indeed, close to 50% of internal medicine residents in 1 study reported poor comfort in performing CVCs.8
Deficiencies in procedural teaching in internal medicine residency curriculum have long been recognized.4 Over the past 20 years, there has been a decrease in the percentage of internists who place central lines in practice.5 In the United States, more than 5 million central venous catheters are inserted every year.21 Presumably, concurrent with this trend is an increasing reliance on other specialists such as radiologists or surgical colleagues in the placement of CVCs. Without a concerted effort for medical educators in improving the quality of procedural teaching, this alarming trend is unlikely to be halted.
With the advance of modern technology and medical education, patient simulation offers a new platform for procedural teaching to take place: a way for trainees to practice without jeopardizing patient safety, as well as an opportunity for formal teaching and supervision to occur,9, 22 serving as a welcomed departure from the traditional see 1, do 1, teach 1 model to procedural teaching. While there is data to support the role of simulation teaching in the surgical training programs,16, 23 less objective evidence exists to support its use in internal medicine residency training programs.
Our study supports the use of simulation in training first‐year internal medicine residents in CVC. Our formal curriculum on CVC involving simulation was associated with an increase in knowledge of the procedure, observed procedural performance, and subjective confidence. Furthermore, this improvement in knowledge and confidence was maintained at 18 months. Our study has several limitations, such as those inherent to all studies using the prestudy and poststudy design. Improvement in performance under study may be a result of the Hawthorne effect. We are not able to isolate the effect of self‐directed learning from the benefits from training using simulators. Furthermore, improvement in knowledge and confidence may be a function of time rather than training. However, by not comparing our results to that from a historical cohort, we hope to minimize confounders by having participants serve as their own control. Results from our study would be strengthened by the introduction of a control group and a randomized design. Future study should include a randomized, controlled crossover educational trial. The second limitation of our study is the low interobserver agreement between video raters, indicating only fair to moderate agreement. Although our video raters were trained senior medical residents and faculty members who frequently supervise and evaluate procedures, we did not specifically train them for the purposes of scoring videotaped performances. Further faculty development is needed. Overall, the magnitudes of the interobserver differences were small (mean global rating scale between raters differed by 1 0.9), and may not translate into clinically important differences. Third, competence on performing CVC on simulators has not been directly correlated with clinical competence on real‐life patients, although a previous study on surgical interns suggested that simulator training was associated with clinical competence on real patients.16 Future studies are warranted to investigate the association between educational benefits from simulation and actual error reductions from CVC during patient encounters. Fourth, our study did not examine residents in the use of ultrasound during simulator training. Use of ultrasound devices has been shown to decrease complication rates of CVC insertion24 and increase rates of success,25 and is recommended as the preferred method for insertion of elective internal jugular CVCs.26 However, because our course was introduced during first‐year residency, when majority of the residents have performed fewer than 5 internal jugular CVCs prior to their simulation training session, the objective of our introductory course was to first ensure technical competency by landmark techniques. Once learners have mastered the technical aspect of line insertion, ultrasound‐guided techniques were introduced later in the residency training curriculum. Fifth, only 48% of participants completed the knowledge assessment at 18 months. Selection bias may be present in our long‐term data. However, baseline comparisons between those who completed the 18 month assessment vs. those who did not demonstrated no obvious differences between the 2 groups. Performance was not examined in our long‐term data. Demonstration of retention of psychomotor skills would be reassuring. However, by 18 months, many of our learners had completed a number of procedurally‐intensive rotations. Therefore, because retention of skills could not be reliably attributed to our initial training in the simulator laboratory, the participants were not retested in their performance of the CVC. Future study should include a control group that undergoes delayed training at 18 months to best assess the effect of simulation training on performance. Sixth, only overall confidence in performing CVC was captured. Confidence in each venous access site pretraining and posttraining was not assessed and warrants further study. Last, our study did not document overall costs of delivering the program, including cost of the simulator, facility, supplies, and stipends for teaching faculty. One full‐time equivalent (FTE) staff has previously been estimated to be a requirement for the success of the program.9 Our program required 3 medical educators, all of whom are clinical faculty members, as well as the help of 4 chief medical residents.
Despite our study's limitations, our study has a number of strengths. To our knowledge, our study is the first of its kind examining the use of simulators on CVC procedural performance, with the use of video‐recording, in an independent and blinded manner. Blinding should minimize bias associated with assessments of resident competency by evaluators who may be aware of residents' previous experience. Second, we were able to recruit all of our first‐year residents for our pretests and posttests, although 3 did not complete the study in its entirety due to on‐call or post‐call schedules. We were able to obtain detailed assessment of knowledge, performance, and subjective confidence before and after the simulation training on our cohort of residents and were able to demonstrate an improvement in knowledge, skills, and confidence. Furthermore, we were able to demonstrate that benefits in knowledge and confidence were retained at 18 months. Last, we readily implemented our formal CVC curriculum into the existing residency training schedule. It requires a single, 2‐hour session in addition to brief pretest and posttest surveys. It requires minimal equipment, using only 2 CVC mannequins, 4 to 6 central line kits, and an ultrasound machine. The simulation training adheres to and incorporates key elements that have been previously identified as effective teaching tools for simulators: feedback, repetitive practice, and curriculum integration.27 With increasing interest in the use of medical simulation for training and competency assessment in medical education,10 our study provides evidence in support of its use in improving knowledge, skills, and confidence. One of the most important goals of using simulators as an educational tool is to improve patient safety. While assessing for whether or not training on simulators lead to improved patient outcomes is beyond the scope of our study, this question merits further study and should be the focus of future studies.
Conclusions
Training on CVC simulators was associated with an improvement in performance, and increase in knowledge assessment scores and self‐reported confidence in internal medicine residents. Improvement in knowledge and confidence was maintained at 18 months.
Acknowledgements
The authors acknowledge the help of Dr. Valentyna Koval and the staff at the Center of Excellence in Surgical Education and Innovations, as well as Drs. Matt Bernard, Raheem B. Kherani, John Staples, Hin Hin Ko, and Dan Renouf for their help on reviewing of videotapes and simulation teaching.
Appendix
Modified Global Rating Scale
Appendix
Procedural Checklist
- Accreditation Council of Graduate Medical Education. ACGME Program Requirements for Residency Education in Internal Medicine Available at: http://www.acgme.org/acWebsite/downloads/RRC_progReq/140_im_07012007. pdf. Accessed June2009.
- The Royal College of Physicians and Surgeons of Canada. Objectives of training in internal medicine. Available at: http://rcpsc.medical.org/information/index.php?specialty=13615(6):432–433.
- ,.The declining number and variety of procedures done by general internists: a resurvey of members of the American College of Physicians.Ann Intern Med.2007;146(5):355–360.
- ,,, et al.Confidence of academic general internists and family physicians to teach ambulatory procedures.J Gen Intern Med.2000;15(6):353–360.
- ,,,.Patients' willingness to allow residents to learn to practice medical procedures.Acad Med.2004;79(2):144–147.
- ,,, et al.Beyond the comfort zone: residents assess their comfort performing inpatient medical procedures.Am J Med.2006;119(1):71.e17–e24.
- ,,,,.Clinical simulation: importance to the internal medicine educational mission.Am J Med.2007;120(9):820–824.
- ,,.Simulation technology for skills training and competency assessment in medical education.J Gen Intern Med.2008;23(suppl 1):46–49.
- ,.Preventing complications of central venous catheterization.N Engl J Med.2003;348(12):1123–1133.
- ,,,,.Videos in clinical medicine. Central venous catheterization.N Engl J Med.2007;356(21):e21.
- ,,,,.Testing technical skill via an innovative “bench station” examination.Am J Surg.1997;173(3):226–230.
- ,,,.Objective assessment of technical skills in surgery.BMJ.2003;327(7422):1032–1037.
- ,,,.Diagnosis. Measuring agreement beyond chance. In: Guyatt G, Rennie D, eds.User's Guides to the Medical Literature: A Manual for Evidence‐Based Clinical Practice.Chicago:American Medical Association Press;2002:461–470.
- ,,, et al.Cognitive task analysis for teaching technical skills in an inanimate surgical skills laboratory.Am J Surg.2004;187(1):114–119.
- ,.Central venous catheterization.Crit Care Med.2007;35(5):1390–1396.
- ,,,,.Central vein catheterization. Failure and complication rates by three percutaneous approaches.Arch Intern Med.1986;146(2):259–261.
- ,,, et al.Education of physicians‐in‐training can decrease the risk for vascular catheter infection.Ann Intern Med.2000;132(8):641–648.
- ,,,.Training fourth‐year medical students in critical invasive skills improves subsequent patient safety.Am Surg.2003;69(5):437–440.
- .Intravascular‐catheter‐related infections.Lancet.1998;351(9106):893–898.
- ,.Procedural simulation's developing role in medicine.Lancet.2007;369(9574):1671–1673.
- ,.Teaching surgical skills—changes in the wind.N Engl J Med.2006;355(25):2664–2669.
- ,,,,.Effect of the implementation of NICE guidelines for ultrasound guidance on the complication rates associated with central venous catheter placement in patients presenting for routine surgery in a tertiary referral centre.Br J Anaesth.2007;99(5):662–665.
- ,,, et al.Ultrasonic locating devices for central venous cannulation: meta‐analysis.BMJ.2003;327(7411):361.
- National Institute for Clinical Excellence. Guidance on the use of ultrasound locating devices for placing central venous catheters. Available at: http://www.nice.org.uk/Guidance/TA49/Guidance/pdf/English. Accessed June2009.
- ,,,,.Features and uses of high‐fidelity medical simulations that lead to effective learning: a BEME systematic review.Med Teach.2005;27(1):10–28.
The Accreditation Council for Graduate Medical Education mandates that internal medicine residents develop technical proficiency in performing central venous catheterization (CVC).1 Likewise in Canada, technical expertise in performing CVC is a specific competency requirement in the training objectives in internal medicine by the Royal College of Physicians and Surgeons of Canada.2 For certification in Internal Medicine, the American Board of Internal Medicine expects its candidates to be competent with respect to knowledge and understanding of the indications, contraindications, recognition, and management of complications of CVC.3 Despite the importance of procedural teaching in medical education, most internal medicine residency programs do not have formal procedural teaching.4 A number of potential barriers to teaching CVC exist. A recent study by the American College of Physicians found that fewer general internists perform procedures, compared with internists in the 1980s.5 With fewer internists performing procedures, there may be fewer educators with adequate confidence in teaching these procedures.6 Second, with increasing recognition of patient safety, there is a growing reluctance of patients to be used as teaching subjects for those who are learning CVC.7 Not surprisingly, residents report low comfort in performing CVC.8
Teaching procedures on simulators offers the benefits of allowing both teaching and evaluation of procedures without jeopardizing patient safety9 and is a welcomed variation from the traditional see 1, do 1, teach 1 approach.10 Despite the theoretical benefits of the use of simulators in medical education, the efficacy of their use in teaching internal medicine residents remains understudied.
The purpose of our study was to evaluate the benefits of using simulator models in teaching CVC to internal medicine residents. We hypothesized that participation in a simulator‐based teaching session on CVC would result in improved knowledge and performance of the procedure and confidence.
Methods
Participants
The study was approved by our university and hospital ethics review board. All first‐year internal medicine residents in a single academic institution, who provided written informed consent, were included and enrolled in a simulator curriculum on CVC.
Intervention
All participants completed a baseline multiple choice knowledge test on anatomy, procedural technique, and complications of CVC, as well as a self‐assessment questionnaire on confidence and prior experience of CVC. Upon completion of these, participants were provided access to Internet links of multimedia educational materials on CVC, including references for suggested reading.11, 12 One week later, participants, in small groups of 3 to 5 subjects, attended a 2‐hour simulation session on CVC. For each participant, the baseline performance of an internal jugular CVC on a simulator (Laerdal IV Torso; Laerdal Medical Corp, Wappingers Falls, NY) was videotaped in a blinded fashion. Blinding was done by assigning participants study numbers. No personal identifying information was recorded, as only gowned and gloved hands, arms, and parts of the simulator were recorded. A faculty member and a senior medical resident then demonstrated to each participant the proper CVC techniques on the simulator, which was followed by an 1‐hour practice session with the simulator. Feedback was provided by the supervising faculty member and senior resident during the practice session. Ultrasound‐guided CVC was demonstrated during the session, but not included for evaluation. postsession, each participant's repeat performance of an internal jugular CVC was videotaped in a blinded fashion, similar to that previously described. All participants then repeated the multiple‐choice knowledge assessment 1 week after the simulation session. For assessment of knowledge retention and confidence, all participants were invited to complete the multiple‐choice knowledge assessment at 18 months after training on simulation.
Measurements and Outcomes
We assessed knowledge on CVC based on performance on a 20‐item multiple‐choice test (scored out of 20, presented as a percentage). Questions were constructed based on information from published literature,11 covering areas of anatomy, procedural technique, and complications of CVC. Procedural skills were assessed by 2 raters using a previously validated modified global rating scale (5‐point Likert scale design)13, 14 during review of videotaped performances (Appendix A). Our primary outcome was an overall global rating score. Review was done by 2 independent, blinded raters who were not aware of whether the performances were recorded presimulation or postsimulation training sessions. Weighted Kappa scores for interobserver agreement between video reviewers ranged between 0.35 (95% confidence interval, 0.250.60) for the global average rating score to 0.43 (95% confidence interval, 0.170.53) for the procedural checklist. These Kappa scores indicate fair to moderate agreement, respectively.15
Secondary outcomes included other domains on the global rating scale such as: time and motion, instrument handling, flow of operation, knowledge of instruments,13, 14 checklist score, number of attempts to locate vein and insert catheter, time to complete the procedure, and self‐reported confidence. The criteria of this checklist score were based on a previously published 14‐item checklist,16 assessing for objective completion of specific tasks (Appendix B). Participants were scored based on 10 items, as the remaining 4 items on the original checklist were not applicable to our simulation session (that is, the items on site selection, catheter selection, Trendelenburg positioning, and sterile sealing of site). In our study, all participants were asked to complete an internal jugular catheterization with a standard kit provided, without the need to dress the site after line insertion. Confidence was assessed by self‐report on a 6‐point Likert scale ranging from none to complete.
Statistical Analysis
Comparisons between pretraining and posttraining were made with the use of McNemar's test for paired data and Wilcoxon signed‐rank test where appropriate. Usual descriptive statistics using mean standard deviation (SD), median and interquartile range (IQR) are reported. Comparisons between presession, postsession, and 18‐month data were analyzed using 1‐way analysis of variance (ANOVA), repeated measures design. Homogeneity of covariance assumption test indicated no evidence of nonsphericity in data (Mauchly's criterion; P = 0.53). All reported P values are 2‐sided. Analyses were conducted using the SAS version 9.1 (SAS Institute, Cary, NC).
Results
Of the 33 residents in the first‐year internal medicine program, all consented to participate. Thirty participants (91%) completed the study protocol between January and June 2007. The remaining three residents completed the presession assessments and the simulation session, but did not complete the postsession assessments. These were excluded from our analysis. At baseline, 20 participants had rotated through a previous 1‐month intensive care unit (ICU) block, 8 residents had no prior ICU training, and 2 residents had 2 months of ICU training. Table 1 summarizes the residents' baseline CVC experience prior to the simulation training. In general, participants had limited experience with CVC at baseline, having placed very few internal jugular CVCs (median = 4).
| Femoral Lines | Internal Jugular Lines | Subclavian Lines | |
|---|---|---|---|
| |||
| Number observed (IQR) | 4 (25) | 5 (37) | 2 (13) |
| Number attempted or performed (IQR) | 3 (15) | 4 (28) | 0 (02) |
| Number performed successfully without assistance (IQR) | 2 (03) | 4 (15) | 0 (01) |
Simulation training was associated with an increase in knowledge. Mean scores on multiple‐choice tests increased from 65.7 11.9% to 81.2 10.7 (P < 0.001). Furthermore, simulation training was associated with improvement in CVC performance. Median global average rating score increased from 3.5 (IQR = 34) to 4.5 (IQR = 44.5) (P < 0.001).
The procedural checklist median score increased from 9 (IQR = 69.5) to 9.5 (IQR = 99.5) (P <.001), median time required for completion of CVC decreased from 8 minutes 22 seconds (IQR = 7 minutes 37 seconds to 12 minutes 1 second) to 6 minutes 43 seconds (IQR = 6 minutes to 7 minutes 25 seconds) (P = 0.002). Other performance measures are summarized in Table 2. Last, simulation training was associated with an increase in self‐rated confidence. The median confidence rating (0 lowest, 5 highest) increased from 3 (moderate, IQR = 23) to 4 (good, IQR = 34) (P < 0.001). The overall satisfaction with the CVC simulation course was good (Table 3) and all 30 participants felt this course should continue to be offered.
| Pre | Post | P Value | |
|---|---|---|---|
| |||
| Number of attempts to locate vein; n (%) | 0.01 | ||
| 1 | 16 | 26 | |
| 2 | 14 | 4 | |
| Number of attempts to insert catheter; n (%) | 0.32 | ||
| 1 | 27 | 29 | |
| >1 | 3 | 1 | |
| Median time and motion score (IQR) | 4 (34) | 5 (45) | <0.001 |
| Median instrument handling score (IQR) | 4 (34) | 5 (45) | <0.001 |
| Median flow of operation score (IQR) | 4 (35) | 5 (45) | <0.001 |
| Median knowledge of instruments score (IQR) | 4 (35) | 5 (45) | 0.004 |
| Agree Strongly | Agree | Neutral | Disagree | Disagree Strongly | |
|---|---|---|---|---|---|
| |||||
| Course improved technical ability to insert central lines | 3 | 21 | 6 | 0 | 0 |
| Course decreased anxiety related to line placement | 6 | 22 | 2 | 0 | 0 |
| Course improved ability to deliver patient care | 6 | 22 | 2 | 0 | 0 |
Knowledge Retention
Sixteen participants completed the knowledge‐retention multiple‐choice tests. No significant differences in baseline characteristics were found between those who completed the knowledge retention tests (n = 16) vs. those who did not (n = 17) in baseline knowledge scores, previous ICU training, gender, and baseline self‐rated confidence.
Mean baseline multiple‐choice test score in the 16 participants who completed the knowledge retention tests was 65.3% 10.6%. Mean score 1 week posttraining was 80.3 9.4%. Mean score at 18 months was 78.4 9.6%. Results from 1‐way ANOVA, repeated‐measures design showed a significant improvement in knowledge scores, F(2, 30) = 14.83, P < 0.0001. Contrasts showed that scores at 1 week were significantly higher than baseline scores (P < 0.0001), and improvement in scores at 18 months was retained, remaining significantly higher than baseline scores (P = 0.002). Median confidence level increased from 3 (moderate) at baseline, to 4 (good) at 1‐week posttraining. Confidence level remained 4 (good) at 18 months (P < 0.0001).
Discussion
CVC is an important procedural competency for internists to master. Indications for CVC range from measuring of central venous pressure to administration of specific medications or solutions such as inotropic agents and total parental nutrition. Its use is important in the care of those who are acutely or critically ill and those who are chronically ill. CVC is associated with a number of potentially serious mechanical complications, including arterial puncture, pneumothorax, and death.11, 17 Proficiency in CVC insertion is found to be closely related to operator experience: catheter insertion by physicians who have performed 50 or more CVC are one‐half as likely to sustain complications as catheter insertion by less experienced physicians.18 Furthermore, training has been found to be associated with a decrease in risk for catheter associated infection19 and pneumothorax.20 Therefore, cumulative experience from repeated clinical encounters and education on CVC play an important role in optimizing patient safety and reducing potential errors associated with CVC. It is well‐documented that patients are generally reluctant to allow medical trainees to learn or practice procedures on them,7 especially in the early phases of training. Indeed, close to 50% of internal medicine residents in 1 study reported poor comfort in performing CVCs.8
Deficiencies in procedural teaching in internal medicine residency curriculum have long been recognized.4 Over the past 20 years, there has been a decrease in the percentage of internists who place central lines in practice.5 In the United States, more than 5 million central venous catheters are inserted every year.21 Presumably, concurrent with this trend is an increasing reliance on other specialists such as radiologists or surgical colleagues in the placement of CVCs. Without a concerted effort for medical educators in improving the quality of procedural teaching, this alarming trend is unlikely to be halted.
With the advance of modern technology and medical education, patient simulation offers a new platform for procedural teaching to take place: a way for trainees to practice without jeopardizing patient safety, as well as an opportunity for formal teaching and supervision to occur,9, 22 serving as a welcomed departure from the traditional see 1, do 1, teach 1 model to procedural teaching. While there is data to support the role of simulation teaching in the surgical training programs,16, 23 less objective evidence exists to support its use in internal medicine residency training programs.
Our study supports the use of simulation in training first‐year internal medicine residents in CVC. Our formal curriculum on CVC involving simulation was associated with an increase in knowledge of the procedure, observed procedural performance, and subjective confidence. Furthermore, this improvement in knowledge and confidence was maintained at 18 months. Our study has several limitations, such as those inherent to all studies using the prestudy and poststudy design. Improvement in performance under study may be a result of the Hawthorne effect. We are not able to isolate the effect of self‐directed learning from the benefits from training using simulators. Furthermore, improvement in knowledge and confidence may be a function of time rather than training. However, by not comparing our results to that from a historical cohort, we hope to minimize confounders by having participants serve as their own control. Results from our study would be strengthened by the introduction of a control group and a randomized design. Future study should include a randomized, controlled crossover educational trial. The second limitation of our study is the low interobserver agreement between video raters, indicating only fair to moderate agreement. Although our video raters were trained senior medical residents and faculty members who frequently supervise and evaluate procedures, we did not specifically train them for the purposes of scoring videotaped performances. Further faculty development is needed. Overall, the magnitudes of the interobserver differences were small (mean global rating scale between raters differed by 1 0.9), and may not translate into clinically important differences. Third, competence on performing CVC on simulators has not been directly correlated with clinical competence on real‐life patients, although a previous study on surgical interns suggested that simulator training was associated with clinical competence on real patients.16 Future studies are warranted to investigate the association between educational benefits from simulation and actual error reductions from CVC during patient encounters. Fourth, our study did not examine residents in the use of ultrasound during simulator training. Use of ultrasound devices has been shown to decrease complication rates of CVC insertion24 and increase rates of success,25 and is recommended as the preferred method for insertion of elective internal jugular CVCs.26 However, because our course was introduced during first‐year residency, when majority of the residents have performed fewer than 5 internal jugular CVCs prior to their simulation training session, the objective of our introductory course was to first ensure technical competency by landmark techniques. Once learners have mastered the technical aspect of line insertion, ultrasound‐guided techniques were introduced later in the residency training curriculum. Fifth, only 48% of participants completed the knowledge assessment at 18 months. Selection bias may be present in our long‐term data. However, baseline comparisons between those who completed the 18 month assessment vs. those who did not demonstrated no obvious differences between the 2 groups. Performance was not examined in our long‐term data. Demonstration of retention of psychomotor skills would be reassuring. However, by 18 months, many of our learners had completed a number of procedurally‐intensive rotations. Therefore, because retention of skills could not be reliably attributed to our initial training in the simulator laboratory, the participants were not retested in their performance of the CVC. Future study should include a control group that undergoes delayed training at 18 months to best assess the effect of simulation training on performance. Sixth, only overall confidence in performing CVC was captured. Confidence in each venous access site pretraining and posttraining was not assessed and warrants further study. Last, our study did not document overall costs of delivering the program, including cost of the simulator, facility, supplies, and stipends for teaching faculty. One full‐time equivalent (FTE) staff has previously been estimated to be a requirement for the success of the program.9 Our program required 3 medical educators, all of whom are clinical faculty members, as well as the help of 4 chief medical residents.
Despite our study's limitations, our study has a number of strengths. To our knowledge, our study is the first of its kind examining the use of simulators on CVC procedural performance, with the use of video‐recording, in an independent and blinded manner. Blinding should minimize bias associated with assessments of resident competency by evaluators who may be aware of residents' previous experience. Second, we were able to recruit all of our first‐year residents for our pretests and posttests, although 3 did not complete the study in its entirety due to on‐call or post‐call schedules. We were able to obtain detailed assessment of knowledge, performance, and subjective confidence before and after the simulation training on our cohort of residents and were able to demonstrate an improvement in knowledge, skills, and confidence. Furthermore, we were able to demonstrate that benefits in knowledge and confidence were retained at 18 months. Last, we readily implemented our formal CVC curriculum into the existing residency training schedule. It requires a single, 2‐hour session in addition to brief pretest and posttest surveys. It requires minimal equipment, using only 2 CVC mannequins, 4 to 6 central line kits, and an ultrasound machine. The simulation training adheres to and incorporates key elements that have been previously identified as effective teaching tools for simulators: feedback, repetitive practice, and curriculum integration.27 With increasing interest in the use of medical simulation for training and competency assessment in medical education,10 our study provides evidence in support of its use in improving knowledge, skills, and confidence. One of the most important goals of using simulators as an educational tool is to improve patient safety. While assessing for whether or not training on simulators lead to improved patient outcomes is beyond the scope of our study, this question merits further study and should be the focus of future studies.
Conclusions
Training on CVC simulators was associated with an improvement in performance, and increase in knowledge assessment scores and self‐reported confidence in internal medicine residents. Improvement in knowledge and confidence was maintained at 18 months.
Acknowledgements
The authors acknowledge the help of Dr. Valentyna Koval and the staff at the Center of Excellence in Surgical Education and Innovations, as well as Drs. Matt Bernard, Raheem B. Kherani, John Staples, Hin Hin Ko, and Dan Renouf for their help on reviewing of videotapes and simulation teaching.
Appendix
Modified Global Rating Scale
Appendix
Procedural Checklist
- Accreditation Council of Graduate Medical Education. ACGME Program Requirements for Residency Education in Internal Medicine Available at: http://www.acgme.org/acWebsite/downloads/RRC_progReq/140_im_07012007. pdf. Accessed June2009.
- The Royal College of Physicians and Surgeons of Canada. Objectives of training in internal medicine. Available at: http://rcpsc.medical.org/information/index.php?specialty=13615(6):432–433.
- ,.The declining number and variety of procedures done by general internists: a resurvey of members of the American College of Physicians.Ann Intern Med.2007;146(5):355–360.
- ,,, et al.Confidence of academic general internists and family physicians to teach ambulatory procedures.J Gen Intern Med.2000;15(6):353–360.
- ,,,.Patients' willingness to allow residents to learn to practice medical procedures.Acad Med.2004;79(2):144–147.
- ,,, et al.Beyond the comfort zone: residents assess their comfort performing inpatient medical procedures.Am J Med.2006;119(1):71.e17–e24.
- ,,,,.Clinical simulation: importance to the internal medicine educational mission.Am J Med.2007;120(9):820–824.
- ,,.Simulation technology for skills training and competency assessment in medical education.J Gen Intern Med.2008;23(suppl 1):46–49.
- ,.Preventing complications of central venous catheterization.N Engl J Med.2003;348(12):1123–1133.
- ,,,,.Videos in clinical medicine. Central venous catheterization.N Engl J Med.2007;356(21):e21.
- ,,,,.Testing technical skill via an innovative “bench station” examination.Am J Surg.1997;173(3):226–230.
- ,,,.Objective assessment of technical skills in surgery.BMJ.2003;327(7422):1032–1037.
- ,,,.Diagnosis. Measuring agreement beyond chance. In: Guyatt G, Rennie D, eds.User's Guides to the Medical Literature: A Manual for Evidence‐Based Clinical Practice.Chicago:American Medical Association Press;2002:461–470.
- ,,, et al.Cognitive task analysis for teaching technical skills in an inanimate surgical skills laboratory.Am J Surg.2004;187(1):114–119.
- ,.Central venous catheterization.Crit Care Med.2007;35(5):1390–1396.
- ,,,,.Central vein catheterization. Failure and complication rates by three percutaneous approaches.Arch Intern Med.1986;146(2):259–261.
- ,,, et al.Education of physicians‐in‐training can decrease the risk for vascular catheter infection.Ann Intern Med.2000;132(8):641–648.
- ,,,.Training fourth‐year medical students in critical invasive skills improves subsequent patient safety.Am Surg.2003;69(5):437–440.
- .Intravascular‐catheter‐related infections.Lancet.1998;351(9106):893–898.
- ,.Procedural simulation's developing role in medicine.Lancet.2007;369(9574):1671–1673.
- ,.Teaching surgical skills—changes in the wind.N Engl J Med.2006;355(25):2664–2669.
- ,,,,.Effect of the implementation of NICE guidelines for ultrasound guidance on the complication rates associated with central venous catheter placement in patients presenting for routine surgery in a tertiary referral centre.Br J Anaesth.2007;99(5):662–665.
- ,,, et al.Ultrasonic locating devices for central venous cannulation: meta‐analysis.BMJ.2003;327(7411):361.
- National Institute for Clinical Excellence. Guidance on the use of ultrasound locating devices for placing central venous catheters. Available at: http://www.nice.org.uk/Guidance/TA49/Guidance/pdf/English. Accessed June2009.
- ,,,,.Features and uses of high‐fidelity medical simulations that lead to effective learning: a BEME systematic review.Med Teach.2005;27(1):10–28.
Copyright © 2009 Society of Hospital Medicine
Improving Insulin Ordering Safely
The benefits of glycemic control include decreased patient morbidity, mortality, length of stay, and reduced hospital costs. In 2004, the American College of Endocrinology (ACE) issued glycemic guidelines for non‐critical‐care units (fasting glucose 110 mg/dL, nonfasting glucose 180 mg/dL).1 A comprehensive review of inpatient glycemic management called for development and evaluation of inpatient programs and tools.2 The 2006 ACE/American Diabetes Association (ADA) Statement on Inpatient Diabetes and Glycemic Control identified key components of an inpatient glycemic control program as: (1) solid administrative support; (2) a multidisciplinary committee; (3) assessment of current processes, care, and barriers; (4) development and implementation of order sets, protocols, policies, and educational efforts; and (5) metrics for evaluation.3
In 2003, Harborview Medical Center (HMC) formed a multidisciplinary committee to institute a Glycemic Control Program. The early goals were to decrease the use of sliding‐scale insulin, increase the appropriate use of basal and prandial insulin, and to avoid hypoglycemia. Here we report our program design and trends in physician insulin ordering from 2003 through 2006.
Patients and Methods
Setting
Seattle's HMC is a 400‐bed level‐1 regional trauma center managed by the University of Washington. The hospital's mission includes serving at‐risk populations. Based on illness, the University HealthSystem Consortium (UHC) assigns HMC the highest predicted mortality among its 131 affiliated hospitals nationwide.4
Patients
We included all patients hospitalized in non‐critical‐care wardsmedical, surgical, and psychiatric. Patients were categorized as dysglycemic if they: (1) received subcutaneous insulin or oral diabetic medications; or (2) had any single glucose level outside the normal range of 125 mg/dL or 60 mg/dL. Patients not meeting these criteria were classified as euglycemic. Approval was obtained from the University of Washington Human Subjects Review Committee.
Program Description
Since 2003, the multidisciplinary committeephysicians, nurses, pharmacy representatives, and dietary and administrative representativeshas directed the development of the Glycemic Control Program with support from hospital administration and the Department of Quality Improvement. Funding for this program has been provided by the hospital based on the prominence of glycemic control among quality and safety measures, a projected decrease in costs, and the high incidence of diabetes in our patient population. Figure 1 outlines the program's key interventions.

First, a Subcutaneous Insulin Order Form was released for elective use in May 2004 (Figure 2). This form incorporated the 3 components of quality insulin ordering (basal, scheduled prandial, and prandial correction dosing) and provides prompts and education. A Diabetes Nurse Specialist trained nursing staff on the use of the form.
Second, we developed an automated daily data report identifying patients with out‐of‐range glucose levels defined as having any single glucose readings 60 mg/dL or any 2 readings 180 mg/dL within the prior 24 hours. In February 2006, this daily report became available to the clinicians on the committee.
Third, the Glycemic Control Program recruited a full‐time clinical Advanced Registered Nurse Practitioner (ARNP) and part‐time supervising physician to provide directed intervention and education for patients and medical personnel. Since August 2006, the ARNP has reviewed the out‐of‐range report daily, performs assessments, refines insulin orders, and educates clinicians. The assessments include chart review (of history and glycemic control), discussion with primary physician and nurse (and often the dietician), and interview of the patient and/or family. This leads to development and implementation of a glycemic control plan. Clinician education is performed both as direct education of the primary physician at the time of intervention and as didactic sessions.
Outcomes
Physician Insulin Ordering
The numbers of patients receiving basal and short‐acting insulin were identified from the electronic medication record. Basal insulin included glargine and neutral protamine Hagerdorn (NPH). Short‐acting insulin (lispro or regular) could be ordered as scheduled prandial, prandial correction, or sliding scale. The distinction between prandial correction and sliding scale is that correction precedes meals exclusively and is not intended for use without food; in contrast, sliding scale is given regardless of food being consumed and is considered substandard. Quality insulin ordering is defined as having basal, prandial scheduled, and prandial correction doses.
In the electronic record, however, we were unable to distinguish the intent of short‐acting insulin orders in the larger data set. Thus, we reviewed a subset of 100 randomly selected charts (25 from each year from 2003 through 2006) to differentiate scheduled prandial, prandial correction, and sliding scale.
Hyperglycemia
Hyperglycemia was defined as glucose 180 mg/dL. The proportion of dysglycemic patients with hyperglycemia was calculated daily as the percent of dysglycemic patients with any 2 glucose levels 180 mg/dL. Daily values were averaged for quarterly measures.
Hypoglycemia
Hypoglycemia was defined as glucose 60 mg/dL. The proportion of all dysglycemic patients with hypoglycemia was calculated daily as the percent of dysglycemic patients with a single glucose level of 60 mg/dL. Daily values were averaged for quarterly measures.
Data Collection
Data were retrieved from electronic medical records, hospital administrative decision support, and risk‐adjusted5 UHC clinical database information. Glucose data were obtained from laboratory records (venous) and nursing data from bedside chemsticks (capillary).
Statistical Analyses
Data were analyzed using SAS 9.1 (SAS Institute, Cary, NC) and SPSS 13.0 (SPSS, Chicago, IL). The mean and standard deviation (SD) for continuous variables and proportions for categorical variables were calculated. Data were examined, plotted, and trended over time. Where applicable, linear regression trend lines were fitted and tested for statistical significance (P value 0.05).
Results
Patients
In total, 44,225 patients were identified from January 1, 2003 through December 31, 2006; 18,087 patients (41%) were classified as dysglycemic as defined by either: (1) receiving insulin or oral diabetic medicine; or (2) having a glucose level 125 mg/dL or 60 mg/dL. Characteristics of the population are outlined in Table 1. Both groups shared similar ethnic distributions. Across all 4 years, dysglycemic patients tended to be older and have a higher severity of illness. As an additional descriptor of severity of illness, UHC mean expected length of stay (LOS) and mean expected mortality (risk‐adjusted5) were higher for dysglycemic patients.
| Dysglycemic | Euglycemic | |
|---|---|---|
| ||
| Number of patients | 18,088 | 26,144 |
| Age (years, mean SD) | 48.4 20.3 | 41.3 18.3 |
| Gender, male (%) | 64.7 | 62.7 |
| Ethnicity (%) | ||
| Caucasian | 68.2 | 70.1 |
| African‐American/Black | 11.0 | 12.0 |
| Hispanic | 6.8 | 6.2 |
| Native American | 1.8 | 18 |
| Asian | 7.9 | 5.5 |
| Unknown | 4.3 | 4.4 |
| UHC severity of illness index (%) | ||
| Minor | 18.3 | 38.8 |
| Moderate | 35.4 | 40.8 |
| Major | 29.5 | 16.7 |
| Extreme | 16.9 | 3.6 |
| UHC expected LOS (days, mean SD)* | 7.8 6.9 | 5.2 4.1 |
| UHC expected mortality (mean SD)* | 0.06 0.13 | 0.01 0.06 |
Physician Insulin Ordering
Ordering of both short‐acting and basal insulin increased (Figure 3). The ratio of short‐acting to basal orders decreased from 3.36 (1668/496) in 2003 to 1.97 (2226/1128) in 2006.
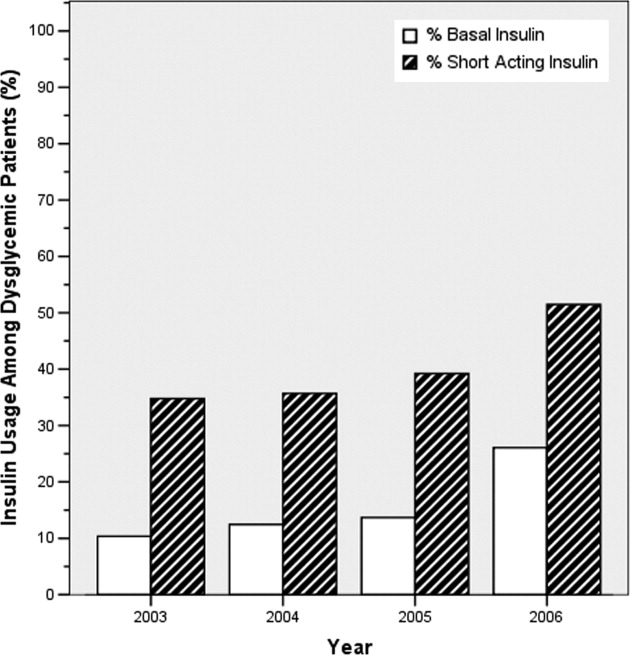
Chart review of the 100 randomly selected dysglycemic patients revealed increased ordering of prandial correction dosing from 8% of patients in 2003 to 32% in 2006. Yet, only 1 patient in 2003 and only 2 in 2006 had scheduled prandial. Ordering of sliding scale insulin fell from 16% in 2003 to 4% in 2006.
Glycemic Control Outcomes
The percentage of dysglycemic patients with hyperglycemia ranged from 19 to 24 without significant decline over the 4 years (Figure 4A). The percentage of hypoglycemic dysglycemic patients was increasing from 2003 to 2004, but in the years following the interventions (2005 through 2006) this declined significantly (P = 0.003; Figure 4B). On average, the observed LOS was higher for dysglycemic vs. euglycemic patients (mean SD days: 9.4 12.2 and 5.8 8.5, respectively). The mean observed to expected mortality ratio was 0.45 0.08 and 0.44 0.17 for the dysglycemic and euglycemic patients, respectively. Over the 4 years no statistically significant change in observed LOS or adjusted mortality was found (data not shown).
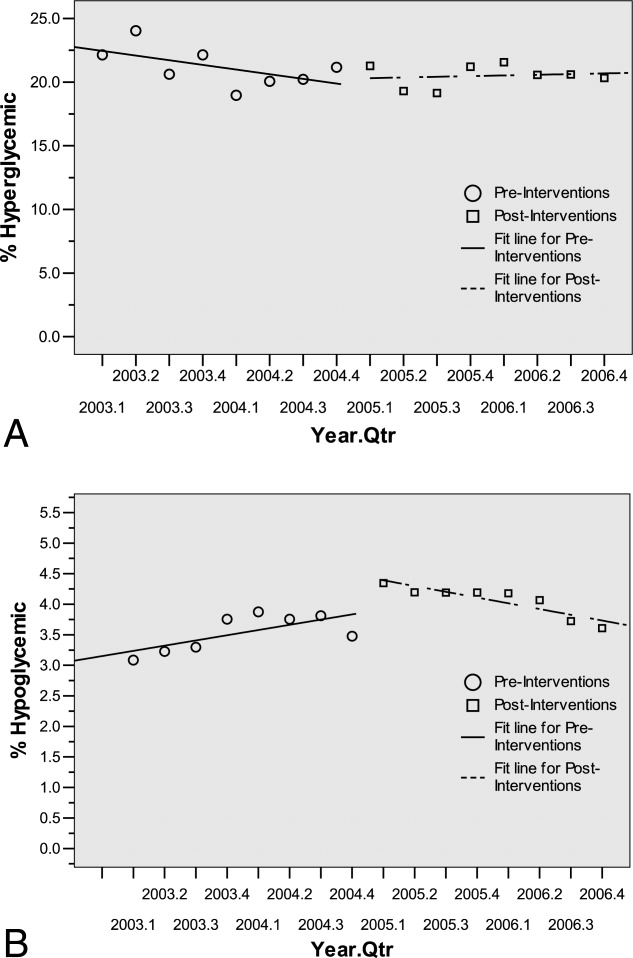
Conclusions
HMC, a safety net hospital with the highest UHC expected mortality of 131 hospitals nationwide, has demonstrated early successes in building its Glycemic Control Program, including: (1) decreased prescription of sliding scale; (2) a marked increase in prescription of basal insulin; and (3) significantly decreasing hypoglycemic events subsequent to the interventions. The decreased sliding scale and increased overall ordering of insulin could reflect increased awareness brought internationally through the literature and locally through our program. Two distinctive aspects of HMC's Glycemic Control Program, when compared to others,68 include: (1) the daily use of real‐time data to identify and target patients with out‐of‐range glucose levels; and (2) the coverage of all non‐critical‐care floors with a single clinician.
In 2003 and 2004, the increasing hypoglycemia we observed paralleled the international focus on aggressively treating hyperglycemia in the acute care setting. We observed a significant decrease in hypoglycemia in 2005 and 2006 that could be attributed to the education provided by the Glycemic Control Program and 2 features on the subcutaneous insulin order set: the prominent hypoglycemia protocol and the order hold prandial insulin if the patient cannot eat. These are similar features identified in a report on preventing hospital hypoglycemia.9 Additionally, hypoglycemia may have decreased secondary to the emphasis on not using short‐acting insulin at bedtime.
Despite increased and improved insulin ordering, we did not observe a significant change in the percent of dysglycemic patients with 2 glucose levels 180 mg/dL. In our program patients are identified for intervention after their glucose levels are out‐of‐range. To better evaluate the impact of our interventions on the glycemic control of each patient, we plan to analyze the glucose levels in the days following identification of patients. Alternatively, we could provide intervention to all patients with dysglycemia rather than waiting for glucoses to be out‐of‐range. Though this approach would require greater resources than the single clinician we currently employ.
Our early experience highlights areas for future evaluation and intervention. First, the lack of scheduled prandial insulin and that less than one‐third of dysglycemic patients have basal insulin ordered underscore a continued need to target quality insulin ordering to include all componentsbasal, scheduled prandial, and prandial correction. Second, while the daily report is a good rudimentary identification tool for at‐risk patients, it offers limited information as to the impact of our clinical intervention. Thus, refined evaluative metrics need be developed to prospectively assess the course of glycemic control for patients.
We acknowledge the limitations of this study. First, our most involved interventionthe addition of the clinical intervention teamcame only 6 months before the end of the study period. Second, this is an observational retrospective analysis and cannot distinguish confounders, such as physician preferences and decisions, that not easily quantified or controlled for. Third, our definition of dysglycemic incorporated 41% of non‐critical‐care patients, possibly reflecting too broad a definition.
In summary, we have described an inpatient Glycemic Control Program that relies on real‐time data to identify patients in need of intervention. Early in our program we observed improved insulin ordering quality and decreased rates of hypoglycemia. Future steps include evaluating the impact of our clinical intervention team and further refining glycemic control metrics to prospectively identify patients at risk for hyper‐ and hypoglycemia.
Acknowledgements
The authors thank Sofia Medvedev (UHC) and Derk B. Adams (HMC QI). The information contained in this article was based in part on the Clinical Data Products Data Base maintained by the UHC.
- ,,, et al.American College of Endocrinology position statement on inpatient diabetes and metabolic control.Endocr Pract.2004;10(suppl 2):4–9.
- ,,, et al.Management of diabetes and hyperglycemia in hospitals.Diabetes Care.2004;27:553–591.
- American College of Endocrinology and American Diabetes Association Consensus statement on inpatient diabetes and glycemic control.Diabetes Care.2006;29:1955–1962.
- University HealthSystem Consortium Mortality. Confidential Clinical Outcomes Report. Available at: http://www.uhc.edu. Accessed August2009 (Access with UHC permission only).
- Mortality risk adjustment for University HealthSystem Consortium's Clinical database. Available at: http://www.ahrq.gov/qual/mortality/Meurer.pdf. Accessed August2009.
- ,,, et al.Inpatient management of hyperglycemia: the Northwestern experience.Endocr Pract.2006;12:491–505.
- ,,,,.Evolution of a diabetes inpatient safety committee.Endocr Pract.2006;12(suppl 3):91–99.
- ,.Financial implications of glycemic control: results of an inpatient diabetes management program.Endocr Pract.2006;12(suppl 3):43–48.
- ,,, et al.Hospital hypoglycemia: not only treatment but also prevention.Endocr Pract.2004;10(suppl 2):89–99.
The benefits of glycemic control include decreased patient morbidity, mortality, length of stay, and reduced hospital costs. In 2004, the American College of Endocrinology (ACE) issued glycemic guidelines for non‐critical‐care units (fasting glucose 110 mg/dL, nonfasting glucose 180 mg/dL).1 A comprehensive review of inpatient glycemic management called for development and evaluation of inpatient programs and tools.2 The 2006 ACE/American Diabetes Association (ADA) Statement on Inpatient Diabetes and Glycemic Control identified key components of an inpatient glycemic control program as: (1) solid administrative support; (2) a multidisciplinary committee; (3) assessment of current processes, care, and barriers; (4) development and implementation of order sets, protocols, policies, and educational efforts; and (5) metrics for evaluation.3
In 2003, Harborview Medical Center (HMC) formed a multidisciplinary committee to institute a Glycemic Control Program. The early goals were to decrease the use of sliding‐scale insulin, increase the appropriate use of basal and prandial insulin, and to avoid hypoglycemia. Here we report our program design and trends in physician insulin ordering from 2003 through 2006.
Patients and Methods
Setting
Seattle's HMC is a 400‐bed level‐1 regional trauma center managed by the University of Washington. The hospital's mission includes serving at‐risk populations. Based on illness, the University HealthSystem Consortium (UHC) assigns HMC the highest predicted mortality among its 131 affiliated hospitals nationwide.4
Patients
We included all patients hospitalized in non‐critical‐care wardsmedical, surgical, and psychiatric. Patients were categorized as dysglycemic if they: (1) received subcutaneous insulin or oral diabetic medications; or (2) had any single glucose level outside the normal range of 125 mg/dL or 60 mg/dL. Patients not meeting these criteria were classified as euglycemic. Approval was obtained from the University of Washington Human Subjects Review Committee.
Program Description
Since 2003, the multidisciplinary committeephysicians, nurses, pharmacy representatives, and dietary and administrative representativeshas directed the development of the Glycemic Control Program with support from hospital administration and the Department of Quality Improvement. Funding for this program has been provided by the hospital based on the prominence of glycemic control among quality and safety measures, a projected decrease in costs, and the high incidence of diabetes in our patient population. Figure 1 outlines the program's key interventions.
First, a Subcutaneous Insulin Order Form was released for elective use in May 2004 (Figure 2). This form incorporated the 3 components of quality insulin ordering (basal, scheduled prandial, and prandial correction dosing) and provides prompts and education. A Diabetes Nurse Specialist trained nursing staff on the use of the form.
Second, we developed an automated daily data report identifying patients with out‐of‐range glucose levels defined as having any single glucose readings 60 mg/dL or any 2 readings 180 mg/dL within the prior 24 hours. In February 2006, this daily report became available to the clinicians on the committee.
Third, the Glycemic Control Program recruited a full‐time clinical Advanced Registered Nurse Practitioner (ARNP) and part‐time supervising physician to provide directed intervention and education for patients and medical personnel. Since August 2006, the ARNP has reviewed the out‐of‐range report daily, performs assessments, refines insulin orders, and educates clinicians. The assessments include chart review (of history and glycemic control), discussion with primary physician and nurse (and often the dietician), and interview of the patient and/or family. This leads to development and implementation of a glycemic control plan. Clinician education is performed both as direct education of the primary physician at the time of intervention and as didactic sessions.
Outcomes
Physician Insulin Ordering
The numbers of patients receiving basal and short‐acting insulin were identified from the electronic medication record. Basal insulin included glargine and neutral protamine Hagerdorn (NPH). Short‐acting insulin (lispro or regular) could be ordered as scheduled prandial, prandial correction, or sliding scale. The distinction between prandial correction and sliding scale is that correction precedes meals exclusively and is not intended for use without food; in contrast, sliding scale is given regardless of food being consumed and is considered substandard. Quality insulin ordering is defined as having basal, prandial scheduled, and prandial correction doses.
In the electronic record, however, we were unable to distinguish the intent of short‐acting insulin orders in the larger data set. Thus, we reviewed a subset of 100 randomly selected charts (25 from each year from 2003 through 2006) to differentiate scheduled prandial, prandial correction, and sliding scale.
Hyperglycemia
Hyperglycemia was defined as glucose 180 mg/dL. The proportion of dysglycemic patients with hyperglycemia was calculated daily as the percent of dysglycemic patients with any 2 glucose levels 180 mg/dL. Daily values were averaged for quarterly measures.
Hypoglycemia
Hypoglycemia was defined as glucose 60 mg/dL. The proportion of all dysglycemic patients with hypoglycemia was calculated daily as the percent of dysglycemic patients with a single glucose level of 60 mg/dL. Daily values were averaged for quarterly measures.
Data Collection
Data were retrieved from electronic medical records, hospital administrative decision support, and risk‐adjusted5 UHC clinical database information. Glucose data were obtained from laboratory records (venous) and nursing data from bedside chemsticks (capillary).
Statistical Analyses
Data were analyzed using SAS 9.1 (SAS Institute, Cary, NC) and SPSS 13.0 (SPSS, Chicago, IL). The mean and standard deviation (SD) for continuous variables and proportions for categorical variables were calculated. Data were examined, plotted, and trended over time. Where applicable, linear regression trend lines were fitted and tested for statistical significance (P value 0.05).
Results
Patients
In total, 44,225 patients were identified from January 1, 2003 through December 31, 2006; 18,087 patients (41%) were classified as dysglycemic as defined by either: (1) receiving insulin or oral diabetic medicine; or (2) having a glucose level 125 mg/dL or 60 mg/dL. Characteristics of the population are outlined in Table 1. Both groups shared similar ethnic distributions. Across all 4 years, dysglycemic patients tended to be older and have a higher severity of illness. As an additional descriptor of severity of illness, UHC mean expected length of stay (LOS) and mean expected mortality (risk‐adjusted5) were higher for dysglycemic patients.
| Dysglycemic | Euglycemic | |
|---|---|---|
| ||
| Number of patients | 18,088 | 26,144 |
| Age (years, mean SD) | 48.4 20.3 | 41.3 18.3 |
| Gender, male (%) | 64.7 | 62.7 |
| Ethnicity (%) | ||
| Caucasian | 68.2 | 70.1 |
| African‐American/Black | 11.0 | 12.0 |
| Hispanic | 6.8 | 6.2 |
| Native American | 1.8 | 18 |
| Asian | 7.9 | 5.5 |
| Unknown | 4.3 | 4.4 |
| UHC severity of illness index (%) | ||
| Minor | 18.3 | 38.8 |
| Moderate | 35.4 | 40.8 |
| Major | 29.5 | 16.7 |
| Extreme | 16.9 | 3.6 |
| UHC expected LOS (days, mean SD)* | 7.8 6.9 | 5.2 4.1 |
| UHC expected mortality (mean SD)* | 0.06 0.13 | 0.01 0.06 |
Physician Insulin Ordering
Ordering of both short‐acting and basal insulin increased (Figure 3). The ratio of short‐acting to basal orders decreased from 3.36 (1668/496) in 2003 to 1.97 (2226/1128) in 2006.
Chart review of the 100 randomly selected dysglycemic patients revealed increased ordering of prandial correction dosing from 8% of patients in 2003 to 32% in 2006. Yet, only 1 patient in 2003 and only 2 in 2006 had scheduled prandial. Ordering of sliding scale insulin fell from 16% in 2003 to 4% in 2006.
Glycemic Control Outcomes
The percentage of dysglycemic patients with hyperglycemia ranged from 19 to 24 without significant decline over the 4 years (Figure 4A). The percentage of hypoglycemic dysglycemic patients was increasing from 2003 to 2004, but in the years following the interventions (2005 through 2006) this declined significantly (P = 0.003; Figure 4B). On average, the observed LOS was higher for dysglycemic vs. euglycemic patients (mean SD days: 9.4 12.2 and 5.8 8.5, respectively). The mean observed to expected mortality ratio was 0.45 0.08 and 0.44 0.17 for the dysglycemic and euglycemic patients, respectively. Over the 4 years no statistically significant change in observed LOS or adjusted mortality was found (data not shown).
Conclusions
HMC, a safety net hospital with the highest UHC expected mortality of 131 hospitals nationwide, has demonstrated early successes in building its Glycemic Control Program, including: (1) decreased prescription of sliding scale; (2) a marked increase in prescription of basal insulin; and (3) significantly decreasing hypoglycemic events subsequent to the interventions. The decreased sliding scale and increased overall ordering of insulin could reflect increased awareness brought internationally through the literature and locally through our program. Two distinctive aspects of HMC's Glycemic Control Program, when compared to others,68 include: (1) the daily use of real‐time data to identify and target patients with out‐of‐range glucose levels; and (2) the coverage of all non‐critical‐care floors with a single clinician.
In 2003 and 2004, the increasing hypoglycemia we observed paralleled the international focus on aggressively treating hyperglycemia in the acute care setting. We observed a significant decrease in hypoglycemia in 2005 and 2006 that could be attributed to the education provided by the Glycemic Control Program and 2 features on the subcutaneous insulin order set: the prominent hypoglycemia protocol and the order hold prandial insulin if the patient cannot eat. These are similar features identified in a report on preventing hospital hypoglycemia.9 Additionally, hypoglycemia may have decreased secondary to the emphasis on not using short‐acting insulin at bedtime.
Despite increased and improved insulin ordering, we did not observe a significant change in the percent of dysglycemic patients with 2 glucose levels 180 mg/dL. In our program patients are identified for intervention after their glucose levels are out‐of‐range. To better evaluate the impact of our interventions on the glycemic control of each patient, we plan to analyze the glucose levels in the days following identification of patients. Alternatively, we could provide intervention to all patients with dysglycemia rather than waiting for glucoses to be out‐of‐range. Though this approach would require greater resources than the single clinician we currently employ.
Our early experience highlights areas for future evaluation and intervention. First, the lack of scheduled prandial insulin and that less than one‐third of dysglycemic patients have basal insulin ordered underscore a continued need to target quality insulin ordering to include all componentsbasal, scheduled prandial, and prandial correction. Second, while the daily report is a good rudimentary identification tool for at‐risk patients, it offers limited information as to the impact of our clinical intervention. Thus, refined evaluative metrics need be developed to prospectively assess the course of glycemic control for patients.
We acknowledge the limitations of this study. First, our most involved interventionthe addition of the clinical intervention teamcame only 6 months before the end of the study period. Second, this is an observational retrospective analysis and cannot distinguish confounders, such as physician preferences and decisions, that not easily quantified or controlled for. Third, our definition of dysglycemic incorporated 41% of non‐critical‐care patients, possibly reflecting too broad a definition.
In summary, we have described an inpatient Glycemic Control Program that relies on real‐time data to identify patients in need of intervention. Early in our program we observed improved insulin ordering quality and decreased rates of hypoglycemia. Future steps include evaluating the impact of our clinical intervention team and further refining glycemic control metrics to prospectively identify patients at risk for hyper‐ and hypoglycemia.
Acknowledgements
The authors thank Sofia Medvedev (UHC) and Derk B. Adams (HMC QI). The information contained in this article was based in part on the Clinical Data Products Data Base maintained by the UHC.
- ,,, et al.American College of Endocrinology position statement on inpatient diabetes and metabolic control.Endocr Pract.2004;10(suppl 2):4–9.
- ,,, et al.Management of diabetes and hyperglycemia in hospitals.Diabetes Care.2004;27:553–591.
- American College of Endocrinology and American Diabetes Association Consensus statement on inpatient diabetes and glycemic control.Diabetes Care.2006;29:1955–1962.
- University HealthSystem Consortium Mortality. Confidential Clinical Outcomes Report. Available at: http://www.uhc.edu. Accessed August2009 (Access with UHC permission only).
- Mortality risk adjustment for University HealthSystem Consortium's Clinical database. Available at: http://www.ahrq.gov/qual/mortality/Meurer.pdf. Accessed August2009.
- ,,, et al.Inpatient management of hyperglycemia: the Northwestern experience.Endocr Pract.2006;12:491–505.
- ,,,,.Evolution of a diabetes inpatient safety committee.Endocr Pract.2006;12(suppl 3):91–99.
- ,.Financial implications of glycemic control: results of an inpatient diabetes management program.Endocr Pract.2006;12(suppl 3):43–48.
- ,,, et al.Hospital hypoglycemia: not only treatment but also prevention.Endocr Pract.2004;10(suppl 2):89–99.
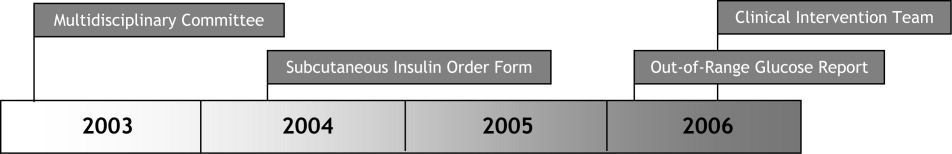
Knowledge of Selected Medical Procedures
Medical procedures, an essential and highly valued part of medical education, are often undertaught and inconsistently evaluated. Hospitalists play an increasingly important role in developing the skills of resident‐learners. Alumni rate procedure skills as some of the most important skills learned during residency training,1, 2 but frequently identify training in procedural skills as having been insufficient.3, 4 For certification in internal medicine, the American Board of Internal Medicine (ABIM) has identified a limited set of procedures in which it expects all candidates to be cognitively competent with regard to their knowledge of these procedures. Although active participation in procedures is recommended for certification in internal medicine, the demonstration of procedural proficiency is not required.5
Resident competence in performing procedures remains highly variable and procedural complications can be a source of morbidity and mortality.2, 6, 7 A validated tool for the assessment of procedure related knowledge is currently lacking. In existing standardized tests, including the in‐training examination (ITE) and ABIM certification examination, only a fraction of questions pertain to medical procedures. The necessity for a specifically designed, standardized instrument that can objectively measure procedure related knowledge has been highlighted by studies that have demonstrated that there is little correlation between the rate of procedure‐related complications and ABIM/ITE scores.8 A validated tool to assess the knowledge of residents in selected medical procedures could serve to assess the readiness of residents to begin supervised practice and form part of a proficiency assessment.
In this study we aimed to develop a valid and reliable test of procedural knowledge in 3 procedures associated with potentially serious complications.
Methods
Placement of an arterial line, central venous catheter and thoracentesis were selected as the focus for test development. Using the National Board of Medical Examiners question development guidelines, multiple‐choice questions were developed to test residents on specific points of a prepared curriculum. Questions were designed to test the essential cognitive aspects of medical procedures, including indications, contraindications, and the management of complications, with an emphasis on the elements that were considered by a panel of experts to be frequently misunderstood. Questions were written by faculty trained in question writing (G.M.) and assessed for clarity by other members of faculty. Content evidence of the 36‐item examination (12 questions per procedure) was established by a panel of 4 critical care specialists with expertise in medical education. The study was approved by the Institutional Review Board at all sites.
Item performance characteristics were evaluated by administering the test online to a series of 30 trainees and specialty clinicians. Postadministration interviews with the critical care experts were performed to determine whether test questions were clear and appropriate for residents. Following initial testing, 4 test items with the lowest discrimination according to a point‐biserial correlation (Integrity; Castle Rock Research, Canada) were deleted from the test. The resulting 32‐item test contained items of varying difficulty to allow for effective discrimination between examinees (Appendix 1).
The test was then administered to residents beginning rotations in either the medical intensive care unit or in the coronary care unit at 4 medical centers in Massachusetts (Brigham and Women's Hospital; Massachusetts General Hospital; Faulkner Hospital; and North Shore Medical Center). In addition to completing the on‐line, self‐administered examination, participants provided baseline data including year of residency training, anticipated career path, and the number of prior procedures performed. On a 5‐point Likert scale participants estimated their self‐perceived confidence at performing the procedure (with and without supervision) and supervising each of the procedures. Residents were invited to complete a second test before the end of their rotation (2‐4 weeks after the initial test) in order to assess test‐retest reliability. Answers were made available only after the conclusion of the study.
Reliability of the 32‐item instrument was measured by Cronbach's analysis; a value of 0.6 is considered adequate and values of 0.7 or higher indicate good reliability. Pearson's correlation (Pearson's r) was used to compute test‐retest reliability. Univariate analyses were used to assess the association of the demographic variables with the test scores. Comparison of test scores between groups was made using a t test/Wilcoxon rank sum (2 groups) and analysis of variance (ANOVA)/Kruskal‐Wallis (3 or more groups). The associations of number of prior procedures attempted and self‐reported confidence with test scores was explored using Spearman's correlation. Inferences were made at the 0.05 level of significance, using 2‐tailed tests. Statistical analyses were performed using SPSS 15.0 (SPSS, Inc., Chicago, IL).
Results
Of the 192 internal medicine residents who consented to participate in the study between February and June 2006, 188 completed the initial and repeat test. Subject characteristics are detailed in Table 1.
| Number (%) | |
|---|---|
| Total residents | 192 |
| Males | 113 (59) |
| Year of residency training | |
| First | 101 (52) |
| Second | 64 (33) |
| Third/fourth | 27 (14) |
| Anticipated career path | |
| General medicine/primary care | 26 (14) |
| Critical care | 47 (24) |
| Medical subspecialties | 54 (28) |
| Undecided/other | 65 (34) |
Reliability of the 32‐item instrument measured by Cronbach's was 0.79 and its test‐retest reliability was 0.82. The items difficulty mean was 0.52 with a corrected point biserial correlation mean of 0.26. The test was of high difficulty, with a mean overall score of 50% (median 53%, interquartile range 44‐59%). Baseline scores differed significantly by residency program (P = 0.03). Residents with anticipated careers in critical care had significantly higher scores than those with anticipated careers in primary care (median scores critical care 56%, primary care and other nonprocedural medical subspecialties 50%, P = 0.01).
Residents in their final year reported performing a median of 13 arterial lines, 14 central venous lines, and 3 thoracenteses over the course of their residency training (Table 2). Increase in the number of performed procedures (central lines, arterial lines, and thoracenteses) was associated with an increase in test score (Spearman's correlation coefficient 0.35, P < 0.001). Residents in the highest and lowest decile of procedures performed had median scores of 56% and 43%, respectively (P < 0.001). Increasing seniority in residency was associated with an increase in overall test scores (median score by program year 49%, 54%, 50%, and 64%, P = 0.02).
| Year of Residency Training | Median Number of Procedures (Interquartile Range) | ||
|---|---|---|---|
| Arterial Line Insertion | Central Venous Line Insertion | Thoracentesis | |
| First | 1 (03) | 1 (04) | 0 (01) |
| Second | 8.5 (618) | 10 (518) | 2 (04) |
| Third/fourth | 13 (820) | 14 (1027) | 3 (26) |
Increase in self‐reported confidence was significantly associated with an increase in the number of performed procedures (Spearman's correlation coefficients for central line 0.83, arterial lines 0.76, and thoracentesis 0.78, all P < 0.001) and increasing seniority (0.66, 0.59, and 0.52, respectively, all P < 0.001).
Discussion
The determination of procedural competence has long been a challenge for trainers and internal medicine programs; methods for measuring procedural skills have not been rigorously studied. Procedural competence requires a combination of theoretical knowledge and practical skill. However, given the declining number of procedures performed by internists,4 the new ABIM guidelines mandate cognitive competence in contrast to the demonstration of hands‐on procedural proficiency.
We therefore sought to develop and validate the results of an examination of the theoretical knowledge necessary to perform 3 procedures associated with potentially serious complications. Following establishment of content evidence, item performance characteristics and postadministration interviews were used to develop a 32‐item test. We confirmed the test's internal structure by assessment of reliability and assessed the association of test scores with other variables for which correlation would be expected.
We found that residents performed poorly on test content considered to be important by procedure specialists. These findings highlight the limitations in current procedure training that is frequently sporadic and often variable. The numbers of procedures reported over the duration of residency by residents at these centers were low. It is unclear if the low number of procedures performed was due to limitations in resident content knowledge or if it reflects the increasing use of interventional services with fewer opportunities for experiential learning. Nevertheless, an increasing number of prior procedures was associated with higher self‐reported confidence for all procedures and translated to higher test scores.
This study was limited to 4 teaching hospitals and further studies may be needed to investigate the wider generalizability of the study instrument. However, participants were from 3 distinct internal medicine residency programs that included both community and university hospitals. We relied on resident self‐reports and did not independently verify the number of prior procedures performed. However, similar assumptions have been made in prior studies that physicians who rarely perform procedures are able to provide reasonable estimates of the total number performed.3
The reliability of the 32‐item test (Cronbach's = 0.79) is in the expected range for this length of test and indicates good reliability.9, 10 Given the potential complications associated with advanced medical procedures, there is increasing need to establish criteria for competence. Although we have not established a score threshold, the development of this validated tool to assess procedural knowledge is an important step toward establishing such a goal.
This test may facilitate efforts by hospitalists and others to evaluate the efficacy and refine existing methods of procedure training. Feedback to educators using this assessment tool may assist in the improvement of teaching strategies. In addition, the assessment of cognitive competence in procedure‐related knowledge using a rigorous and reliable means of assessment such as outlined in this study may help identify residents who need further training. Recognition for the necessity for additional training and oversight are likely to be especially important if residents are expected to perform procedures safely yet have fewer opportunities for practice.
Acknowledgements
The authors thank Dr. Stephen Wright, Haley Hamlin, and Matt Johnston for their contributions to the data collection and analysis.
- ,,, et al.Altering residency curriculum in response to a changing practice environment: use of the Mayo internal medicine residency alumni survey.Mayo Clin Proc.1990;65(6):809–817.
- ,,,,,.Preparation for practice in internal medicine. A study of ten years of residency graduates.Arch Intern Med.1988;148(4):853–856.
- ,,,,,.Procedural experience and comfort level in internal medicine trainees.J Gen Intern Med.2000;15(10):716–722.
- .Training internists in procedural skills.Ann Intern Med.1992;116(12 Pt 2):1091–1093.
- ABIM. Policies and Procedures for Certification in Internal Medicine2008. Available at: http://www.abim.org/certification/policies/imss/im.aspx. Accessed August 2009.
- ,,, et al.Confidence of graduating internal medicine residents to perform ambulatory procedures.J Gen Intern Med.2000;15(6):361–365.
- ,,.The lasting value of clinical skills.JAMA.1985;254(1):70–76.
- ,,.Are commonly used resident measurements associated with procedural skills in internal medicine residency training?J Gen Intern Med.2007;22(3):357–361.
- .Psychometric Theory.New York:McGraw Hill;1978.
- .Coefficient alpha and the internal structure of tests.Psychometrika.1951;16:297–334.
Medical procedures, an essential and highly valued part of medical education, are often undertaught and inconsistently evaluated. Hospitalists play an increasingly important role in developing the skills of resident‐learners. Alumni rate procedure skills as some of the most important skills learned during residency training,1, 2 but frequently identify training in procedural skills as having been insufficient.3, 4 For certification in internal medicine, the American Board of Internal Medicine (ABIM) has identified a limited set of procedures in which it expects all candidates to be cognitively competent with regard to their knowledge of these procedures. Although active participation in procedures is recommended for certification in internal medicine, the demonstration of procedural proficiency is not required.5
Resident competence in performing procedures remains highly variable and procedural complications can be a source of morbidity and mortality.2, 6, 7 A validated tool for the assessment of procedure related knowledge is currently lacking. In existing standardized tests, including the in‐training examination (ITE) and ABIM certification examination, only a fraction of questions pertain to medical procedures. The necessity for a specifically designed, standardized instrument that can objectively measure procedure related knowledge has been highlighted by studies that have demonstrated that there is little correlation between the rate of procedure‐related complications and ABIM/ITE scores.8 A validated tool to assess the knowledge of residents in selected medical procedures could serve to assess the readiness of residents to begin supervised practice and form part of a proficiency assessment.
In this study we aimed to develop a valid and reliable test of procedural knowledge in 3 procedures associated with potentially serious complications.
Methods
Placement of an arterial line, central venous catheter and thoracentesis were selected as the focus for test development. Using the National Board of Medical Examiners question development guidelines, multiple‐choice questions were developed to test residents on specific points of a prepared curriculum. Questions were designed to test the essential cognitive aspects of medical procedures, including indications, contraindications, and the management of complications, with an emphasis on the elements that were considered by a panel of experts to be frequently misunderstood. Questions were written by faculty trained in question writing (G.M.) and assessed for clarity by other members of faculty. Content evidence of the 36‐item examination (12 questions per procedure) was established by a panel of 4 critical care specialists with expertise in medical education. The study was approved by the Institutional Review Board at all sites.
Item performance characteristics were evaluated by administering the test online to a series of 30 trainees and specialty clinicians. Postadministration interviews with the critical care experts were performed to determine whether test questions were clear and appropriate for residents. Following initial testing, 4 test items with the lowest discrimination according to a point‐biserial correlation (Integrity; Castle Rock Research, Canada) were deleted from the test. The resulting 32‐item test contained items of varying difficulty to allow for effective discrimination between examinees (Appendix 1).
The test was then administered to residents beginning rotations in either the medical intensive care unit or in the coronary care unit at 4 medical centers in Massachusetts (Brigham and Women's Hospital; Massachusetts General Hospital; Faulkner Hospital; and North Shore Medical Center). In addition to completing the on‐line, self‐administered examination, participants provided baseline data including year of residency training, anticipated career path, and the number of prior procedures performed. On a 5‐point Likert scale participants estimated their self‐perceived confidence at performing the procedure (with and without supervision) and supervising each of the procedures. Residents were invited to complete a second test before the end of their rotation (2‐4 weeks after the initial test) in order to assess test‐retest reliability. Answers were made available only after the conclusion of the study.
Reliability of the 32‐item instrument was measured by Cronbach's analysis; a value of 0.6 is considered adequate and values of 0.7 or higher indicate good reliability. Pearson's correlation (Pearson's r) was used to compute test‐retest reliability. Univariate analyses were used to assess the association of the demographic variables with the test scores. Comparison of test scores between groups was made using a t test/Wilcoxon rank sum (2 groups) and analysis of variance (ANOVA)/Kruskal‐Wallis (3 or more groups). The associations of number of prior procedures attempted and self‐reported confidence with test scores was explored using Spearman's correlation. Inferences were made at the 0.05 level of significance, using 2‐tailed tests. Statistical analyses were performed using SPSS 15.0 (SPSS, Inc., Chicago, IL).
Results
Of the 192 internal medicine residents who consented to participate in the study between February and June 2006, 188 completed the initial and repeat test. Subject characteristics are detailed in Table 1.
| Number (%) | |
|---|---|
| Total residents | 192 |
| Males | 113 (59) |
| Year of residency training | |
| First | 101 (52) |
| Second | 64 (33) |
| Third/fourth | 27 (14) |
| Anticipated career path | |
| General medicine/primary care | 26 (14) |
| Critical care | 47 (24) |
| Medical subspecialties | 54 (28) |
| Undecided/other | 65 (34) |
Reliability of the 32‐item instrument measured by Cronbach's was 0.79 and its test‐retest reliability was 0.82. The items difficulty mean was 0.52 with a corrected point biserial correlation mean of 0.26. The test was of high difficulty, with a mean overall score of 50% (median 53%, interquartile range 44‐59%). Baseline scores differed significantly by residency program (P = 0.03). Residents with anticipated careers in critical care had significantly higher scores than those with anticipated careers in primary care (median scores critical care 56%, primary care and other nonprocedural medical subspecialties 50%, P = 0.01).
Residents in their final year reported performing a median of 13 arterial lines, 14 central venous lines, and 3 thoracenteses over the course of their residency training (Table 2). Increase in the number of performed procedures (central lines, arterial lines, and thoracenteses) was associated with an increase in test score (Spearman's correlation coefficient 0.35, P < 0.001). Residents in the highest and lowest decile of procedures performed had median scores of 56% and 43%, respectively (P < 0.001). Increasing seniority in residency was associated with an increase in overall test scores (median score by program year 49%, 54%, 50%, and 64%, P = 0.02).
| Year of Residency Training | Median Number of Procedures (Interquartile Range) | ||
|---|---|---|---|
| Arterial Line Insertion | Central Venous Line Insertion | Thoracentesis | |
| First | 1 (03) | 1 (04) | 0 (01) |
| Second | 8.5 (618) | 10 (518) | 2 (04) |
| Third/fourth | 13 (820) | 14 (1027) | 3 (26) |
Increase in self‐reported confidence was significantly associated with an increase in the number of performed procedures (Spearman's correlation coefficients for central line 0.83, arterial lines 0.76, and thoracentesis 0.78, all P < 0.001) and increasing seniority (0.66, 0.59, and 0.52, respectively, all P < 0.001).
Discussion
The determination of procedural competence has long been a challenge for trainers and internal medicine programs; methods for measuring procedural skills have not been rigorously studied. Procedural competence requires a combination of theoretical knowledge and practical skill. However, given the declining number of procedures performed by internists,4 the new ABIM guidelines mandate cognitive competence in contrast to the demonstration of hands‐on procedural proficiency.
We therefore sought to develop and validate the results of an examination of the theoretical knowledge necessary to perform 3 procedures associated with potentially serious complications. Following establishment of content evidence, item performance characteristics and postadministration interviews were used to develop a 32‐item test. We confirmed the test's internal structure by assessment of reliability and assessed the association of test scores with other variables for which correlation would be expected.
We found that residents performed poorly on test content considered to be important by procedure specialists. These findings highlight the limitations in current procedure training that is frequently sporadic and often variable. The numbers of procedures reported over the duration of residency by residents at these centers were low. It is unclear if the low number of procedures performed was due to limitations in resident content knowledge or if it reflects the increasing use of interventional services with fewer opportunities for experiential learning. Nevertheless, an increasing number of prior procedures was associated with higher self‐reported confidence for all procedures and translated to higher test scores.
This study was limited to 4 teaching hospitals and further studies may be needed to investigate the wider generalizability of the study instrument. However, participants were from 3 distinct internal medicine residency programs that included both community and university hospitals. We relied on resident self‐reports and did not independently verify the number of prior procedures performed. However, similar assumptions have been made in prior studies that physicians who rarely perform procedures are able to provide reasonable estimates of the total number performed.3
The reliability of the 32‐item test (Cronbach's = 0.79) is in the expected range for this length of test and indicates good reliability.9, 10 Given the potential complications associated with advanced medical procedures, there is increasing need to establish criteria for competence. Although we have not established a score threshold, the development of this validated tool to assess procedural knowledge is an important step toward establishing such a goal.
This test may facilitate efforts by hospitalists and others to evaluate the efficacy and refine existing methods of procedure training. Feedback to educators using this assessment tool may assist in the improvement of teaching strategies. In addition, the assessment of cognitive competence in procedure‐related knowledge using a rigorous and reliable means of assessment such as outlined in this study may help identify residents who need further training. Recognition for the necessity for additional training and oversight are likely to be especially important if residents are expected to perform procedures safely yet have fewer opportunities for practice.
Acknowledgements
The authors thank Dr. Stephen Wright, Haley Hamlin, and Matt Johnston for their contributions to the data collection and analysis.
- ,,, et al.Altering residency curriculum in response to a changing practice environment: use of the Mayo internal medicine residency alumni survey.Mayo Clin Proc.1990;65(6):809–817.
- ,,,,,.Preparation for practice in internal medicine. A study of ten years of residency graduates.Arch Intern Med.1988;148(4):853–856.
- ,,,,,.Procedural experience and comfort level in internal medicine trainees.J Gen Intern Med.2000;15(10):716–722.
- .Training internists in procedural skills.Ann Intern Med.1992;116(12 Pt 2):1091–1093.
- ABIM. Policies and Procedures for Certification in Internal Medicine2008. Available at: http://www.abim.org/certification/policies/imss/im.aspx. Accessed August 2009.
- ,,, et al.Confidence of graduating internal medicine residents to perform ambulatory procedures.J Gen Intern Med.2000;15(6):361–365.
- ,,.The lasting value of clinical skills.JAMA.1985;254(1):70–76.
- ,,.Are commonly used resident measurements associated with procedural skills in internal medicine residency training?J Gen Intern Med.2007;22(3):357–361.
- .Psychometric Theory.New York:McGraw Hill;1978.
- .Coefficient alpha and the internal structure of tests.Psychometrika.1951;16:297–334.
Copyright © 2009 Society of Hospital Medicine
Recommendations for Hospitalist Handoffs
Handoffs during hospitalization from one provider to another represent critical transition points in patient care.1 In‐hospital handoffs are a frequent occurrence, with 1 teaching hospital reporting 4000 handoffs daily for a total of 1.6 million per year.2
Incomplete or poor‐quality handoffs have been implicated as a source of adverse events and near misses in hospitalized patients.35 Standardizing the handoff process may improve patient safety during care transitions.6 In 2006, the Joint Commission issued a National Patient Safety Goal that requires care providers to adopt a standardized approach for handoff communications, including an opportunity to ask and respond to questions about a patient's care.7 The reductions in resident work hours by the Accreditation Council for Graduate Medical Education (ACGME) has also resulted in a greater number and greater scrutiny of handoffs in teaching hospitals.8, 9
In response to these issues, and because handoffs are a core competency for hospitalists, the Society of Hospital Medicine (SHM)convened a task force.10 Our goal was to develop a set of recommendations for handoffs that would be applicable in both community and academic settings; among physicians (hospitalists, internists, subspecialists, residents), nurse practitioners, and physicians assistants; and across roles including serving as the primary provider of hospital care, comanager, or consultant. This work focuses on handoffs that occur at shift change and service change.11 Shift changes are transitions of care between an outgoing provider and an incoming provider that occur at the end of the outgoing provider's continuous on‐duty period. Service changesa special type of shift changeare transitions of care between an outgoing provider and an incoming provider that occur when an outgoing provider is leaving a rotation or period of consecutive daily care for patients on the same service.
For this initiative, transfers of care in which the patient is moving from one patient area to another (eg, Emergency Department to inpatient floor, or floor to intensive care unit [ICU]) were excluded since they likely require unique consideration given their cross‐disciplinary and multispecialty nature. Likewise, transitions of care at hospital admission and discharge were also excluded because recommendations for discharge are already summarized in 2 complementary reports.12, 13
To develop recommendations for handoffs at routine shift change and service changes, the Handoff Task Force performed a systematic review of the literature to develop initial recommendations, obtained feedback from hospital‐based clinicians in addition to a panel of handoff experts, and finalized handoff recommendations, as well as a proposed research agenda, for the SHM.
Methods
The SHM Healthcare Quality and Patient Safety (HQPS) Committee convened the Handoff Task Force, which was comprised of 6 geographically diverse, predominantly academic hospitalists with backgrounds in education, patient safety, health communication, evidence‐based medicine, and handoffs. The Task Force then engaged a panel of 4 content experts selected for their work on handoffs in the fields of nursing, information technology, human factors engineering, and hospital medicine. Similar to clinical guideline development by professional societies, the Task Force used a combination of evidence‐based review and expert opinions to propose recommendations.
Literature Review
A PubMed search was performed for English language articles published from January 1975 to January 2007, using the following keywords: handover or handoff or hand‐off or shift change or signout or sign‐out. Articles were eligible if they presented results from a controlled intervention to improve handoffs at shift change or service change, by any health profession. Articles that appeared potentially relevant based on their title were retrieved for full‐text review and included if deemed eligible by at least 2 reviewers. Additional studies were obtained through the Agency for Healthcare Research and Quality (AHRQ) Patient Safety Network,14 using the category Safety target and subcategory Discontinuities, gaps, and hand‐off problems. Finally, the expert panel reviewed the results of the literature review and suggested additional articles.
Eligible studies were abstracted by individual members of the Handoff Task Force using a structured form (Appendix Figure 1), and abstractions were verified by a second member. Handoff‐related outcome measures were categorized as referring to (1) patient outcomes, (2) staff outcomes, or (3) system outcomes. Because studies included those from nursing and other industries, interventions were evaluated by abstractors for their applicability to routine hospitalist handoffs. The literature review was supplemented by review of expert consensus or policy white papers that described recommendations for handoffs. The list of white papers was generated utilizing a common internet search engine (Google;
Peer and Expert Panel Review
The Task Force generated draft recommendations, which were revised through interactive discussions until consensus was achieved. These recommendations were then presented at a workshop to an audience of approximately 300 hospitalists, case managers, nurses, and pharmacists at the 2007 SHM Annual Meeting.
During the workshop, participants were asked to cast up to 3 votes for recommendations that should be removed. Those recommendations that received more than 20 votes for removal were then discussed. Participants also had the opportunity to anonymously suggest new recommendations or revisions using index cards, which were reviewed by 2 workshop faculty, assembled into themes, and immediately presented to the group. Through group discussion of prevalent themes, additional recommendations were developed.
Four content experts were then asked to review a draft paper that summarized the literature review, discussion at the SHM meeting, and handoff recommendations. Their input regarding the process, potential gaps in the literature, and additional items of relevance, was incorporated into this final manuscript.
Final Review by SHM Board and Rating each Recommendation
A working paper was reviewed and approved by the Board of the SHM in early January 2008. With Board input, the Task Force adopted the American College of Cardiology/American Heart Association (ACC/AHA) framework to rate each recommendation because of its appropriateness, ease of use, and familiarity to hospital‐based physicians.15 Recommendations are rated as Class I (effective), IIa (conflicting findings but weight of evidence supports use), IIb (conflicting findings but weight of evidence does not support use), or III (not effective). The Level of Evidence behind each recommendation is graded as A (from multiple large randomized controlled trials), B (from smaller or limited randomized trials, or nonrandomized studies), or C (based primarily on expert consensus). A recommendation with Level of Evidence B or C should not imply that the recommendation is not supported.15
Results
Literature Review
Of the 374 articles identified by the electronic search of PubMed and the AHRQ Patient Safety Network, 109 were retrieved for detailed review, and 10 of these met the criteria for inclusion (Figure 1). Of these studies, 3 were derived from nursing literature and the remaining were tests of technology solutions or structured templates (Table 1).1618, 20, 22, 3842 No studies examined hospitalist handoffs. All eligible studies concerned shift change. There were no studies of service change. Only 1 study was a randomized controlled trial; the rest were pre‐post studies with historical controls or a controlled simulation. All reports were single‐site studies. Most outcomes were staff‐related or system‐related, with only 2 studies using patient outcomes.
| Author (Year) | Study Design | Intervention | Setting and Study Population | Target | Outcomes |
|---|---|---|---|---|---|
| |||||
| Nursing | |||||
| Kelly22 (2005) | Pre‐post | Change to walk‐round handover (at bedside) from baseline (control) | 12‐bed rehab unit with 18 nurses and 10 patients | Staff, patient | 11/18 nurses felt more or much more informed and involved; 8/10 patients felt more involved |
| Pothier et al.20 (2005) | Controlled simulation | Compared pure verbal to verbal with note‐taking to verbal plus typed content | Handover of 12 simulated patients over 5 cycles | System (data loss) | Minimal data loss with typed content, compared to 31% data retained with note‐taking, and no data retained with verbal only |
| Wallum38 (1995) | Pre‐post | Change from oral handover (baseline) to written template read with exchange | 20 nurses in a geriatric dementia ward | Staff | 83% of nurses felt care plans followed better; 88% knew care plans better |
| Technology or structured template | |||||
| Cheah et al.39 (2005) | Pre‐post | Electronic template with free‐text entry compared to baseline | 14 UK Surgery residents | Staff | 100% (14) of residents rated electronic system as desirable, but 7 (50%) reported that information was not updated |
| Lee et al.40 (1996) | Pre‐post | Standardized signout card for interns to transmit information during handoffs compared to handwritten (baseline) | Inpatient cardiology service at IM residency program in Minnesota with 19 new interns over a 3‐month period | Staff | Intervention interns (n = 10) reported poor sign‐out less often than controls (n = 9) [intervention 8 nights (5.8%) vs. control 17 nights (14.9%); P = 0.016] |
| Kannry and Moore18 (1999) | Pre‐post | Compared web‐based signout program to usual system (baseline) | An academic teaching hospital in New York (34 patients admitted in 1997; 40 patients admitted in 1998) | System | Improved provider identification (86% web signout vs. 57% hospital census) |
| Petersen et al.17 (1998) | Pre‐post | 4 months of computerized signouts compared to baseline period (control) | 3747 patients admitted to the medical service at an academic teaching hospital | Patient | Preventable adverse events (ADE) decreased (1.7% to 1.2%, P 0.10); risk of cross‐cover physician for ADE eliminated |
| Ram and Block41 (1993) | Pre‐post | Compared handwritten (baseline) to computer‐generated | Family medicine residents at 2 academic teaching hospitals [Buffalo (n = 16) and Pittsburgh (n = 16)] | Staff | Higher satisfaction after electronic signout, but complaints with burden of data entry and need to keep information updated |
| Van Eaton et al.42 (2004) | Pre‐post | Use of UW Cores links sign‐out to list for rounds and IS data | 28 surgical and medical residents at 2 teaching hospitals | System | At 6 months, 66% of patients entered in system (adoption) |
| Van Eaton et al.16 (2005) | Prospective, randomized, crossover study. | Compared UW Cores* integrated system compared to usual system | 14 inpatient resident teams (6 surgery, 8 IM) at 2 teaching hospitals for 5 months | Staff, system | 50% reduction in the perceived time spent copying data [from 24% to 12% (P 0.0001)] and number of patients missed on rounds (2.5 vs. 5 patients/team/month, P = 0.0001); improved signout quality (69.6% agree or strongly agree); and improved continuity of care (66.1% agree or strongly agree) |

Overall, the literature presented supports the use of a verbal handoff supplemented with written documentation in a structured format or technology solution. The 2 most rigorous studies were led by Van Eaton et al.16 and Petersen et al.17 and focused on evaluating technology solutions. Van Eaton et al.16 performed a randomized controlled trial of a locally created rounding template with 161 surgical residents. This template downloads certain information (lab values and recent vital signs) from the hospital system into a sign‐out sheet and allows residents to enter notes about diagnoses, allergies, medications and to‐do items. When implemented, the investigators found the number of patients missed on rounds decreased by 50%. Residents reported an increase of 40% in the amount of time available to pre‐round, due largely to not having to copy data such as vital signs. They reported a decrease in rounding time by 3 hours per week, and this was perceived as helping them meet the ACGME 80 hours work rules. Lastly, the residents reported a higher quality of sign‐outs from their peers and perceived an overall improvement in continuity of care. Petersen and colleagues implemented a computerized sign‐out (auto‐imported medications, name, room number) in an internal medicine residency to improve continuity of care during cross‐coverage and decrease adverse events.17 Prior to the intervention, the frequency of preventable adverse events was 1.7% and it was significantly associated with cross‐coverage. Preventable adverse events were identified using a confidential self‐report system that was also validated by clinician review. After the intervention, the frequency of preventable adverse events dropped to 1.2% (P 0.1), and cross‐coverage was no longer associated with preventable adverse events. In other studies, technological solutions also improved provider identification and staff communication.18, 19 Together, these technology‐based intervention studies suggest that a computerized sign‐out with auto‐imported fields has the ability to improve physician efficiency and also improve inpatient care (reduction in number of patients missed on rounds, decrease in preventable adverse events).
Studies from nursing demonstrated that supplementing a verbal exchange with written information improved transfer of information, compared to verbal exchange alone.20 One of these studies rated the transfer of information using videotaped simulated handoff cases.21 Last, 1 nursing study that more directly involved patients in the handoff process resulted in improved nursing knowledge and greater patient empowerment (Table 1).22
White papers or consensus statements originated from international and national consortia in patient safety including the Australian Council for Safety and Quality in Healthcare,23 the Junior Doctors Committee of the British Medical Association,24 University Health Consortium,25 the Department of Defense Patient Safety Program,26 and The Joint Commission.27 Several common themes were prevalent in all white papers. First, there exists a need to train new personnel on how to perform an effective handoff. Second, efforts should be undertaken to ensure adequate time for handoffs and reduce interruptions during handoffs. Third, several of the papers supported verbal exchange that facilitates interactive questioning, focuses on ill patients, and delineates actions to be taken. Lastly, content should be updated to ensure transfer of the latest clinical information.
Peer Review at SHM Meeting of Preliminary Handoff Recommendations
In the presentation of preliminary handoff recommendations to over 300 attendees at the SHM Annual Meeting in 2007, 2 recommendations were supported unanimously: (1) a formal recognized handoff plan should be instituted at end of shift or change in service; and (2) ill patients should be given priority during verbal exchange.
During the workshop, discussion focused on three recommendations of concern, or those that received greater than 20 negative votes by participants. The proposed recommendation that raised the most objections (48 negative votes) was that interruptions be limited. Audience members expressed that it was hard to expect that interruptions would be limited given the busy workplace in the absence of endorsing a separate room and time. This recommendation was ultimately deleted.
The 2 other debated recommendations, which were retained after discussion, were ensuring adequate time for handoffs and using an interactive process during verbal communication. Several attendees stated that ensuring adequate time for handoffs may be difficult without setting a specific time. Others questioned the need for interactive verbal communication, and endorsed leaving a handoff by voicemail with a phone number or pager to answer questions. However, this type of asynchronous communication (senders and receivers not present at the same time) was not desirable or consistent with the Joint Commission's National Patient Safety Goal.
Two new recommendations were proposed from anonymous input and incorporated in the final recommendations, including (a) all patients should be on the sign‐out, and (b) sign‐outs should be accessible from a centralized location. Another recommendation proposed at the Annual Meeting was to institute feedback for poor sign‐outs, but this was not added to the final recommendations after discussion at the meeting and with content experts about the difficulty of maintaining anonymity in small hospitalist groups. Nevertheless, this should not preclude informal feedback among practitioners.
Anonymous commentary also yielded several major themes regarding handoff improvements and areas of uncertainty that merit future work. Several hospitalists described the need to delineate specific content domains for handoffs including, for example, code status, allergies, discharge plan, and parental contact information in the case of pediatric care. However, due to the variability in hospitalist programs and health systems and the general lack of evidence in this area, the Task Force opted to avoid recommending specific content domains which may have limited applicability in certain settings and little support from the literature. Several questions were raised regarding the legal status of written sign‐outs, and whether sign‐outs, especially those that are web‐based, are compliant with the Healthcare Information Portability and Accountability Act (HIPAA). Hospitalists also questioned the appropriate number of patients to be handed off safely. Promoting efficient technology solutions that reduce documentation burden, such as linking the most current progress note to the sign‐out, was also proposed. Concerns were also raised about promoting safe handoffs when using moonlighting or rotating physicians, who may be less invested in the continuity of the patients' overall care.
Expert Panel Review
The final version of the Task Force recommendations incorporates feedback provided by the expert panel. In particular, the expert panel favored the use of the term, recommendations, rather than standards, minimum acceptable practices, or best practices. While the distinction may appear semantic, the Task Force and expert panel acknowledge that the current state of scientific knowledge regarding hospital handoffs is limited. Although an evidence‐based process informed the development of these recommendations, they are not a legal standard for practice. Additional research may allow for refinement of recommendations and development of more formal handoff standards.
The expert panel also highlighted the need to provide tools to hospitalist programs to facilitate the adoption of these recommendations. For example, recommendations for content exchange are difficult to adopt if groups do not already use a written template. The panel also commented on the need to consider the possible consequences if efforts are undertaken to include handoff documents (whether paper or electronic) as part of the medical record. While formalizing handoff documents may raise their quality, it is also possible that handoff documents become less helpful by either excluding the most candid impression regarding a patient's status or by encouraging hospitalists to provide too much detail. Privacy and confidentiality of paper‐based systems, in particular, were also questioned.
Additional Recommendations for Service Change
Patient handoffs during a change of service are a routine part of hospitalist care. Since service change is a type of shift change, the handoff recommendations for shift change do apply. Unlike shift change, service changes involve a more significant transfer of responsibility. Therefore, the Task Force recommends also that the incoming hospitalist be readily identified in the medical record or chart as the new provider, so that relevant clinical information can be communicated to the correct physician. This program‐level recommendation can be met by an electronic or paper‐based system that correctly identifies the current primary inpatient physician.
Final Handoff Recommendations
The final handoff recommendations are shown in Figure 2. The recommendations were designed to be consistent with the overall finding of the literature review, which supports the use of a verbal handoff supplemented with written documentation or a technological solution in a structured format. With the exception of 1 recommendation that is specific to service changes, all recommendations are designed to refer to shift changes and service changes. One overarching recommendation refers to the need for a formally recognized handoff plan at a shift change or change of service. The remaining 12 recommendations are divided into 4 that refer to hospitalist groups or programs, 3 that refer to verbal exchange, and 5 that refer to content exchange. The distinction is an important one because program‐level recommendations require organizational support and buy‐in to promote clinician participation and adherence. The 4 program recommendations also form the necessary framework for the remaining recommendations. For example, the second program recommendation describes the need for a standardized template or technology solution for accessing and recording patient information during the handoff. After a program adopts such a mechanism for exchanging patient information, the specific details for use and maintenance are outlined in greater detail in content exchange recommendations.
Because of the limited trials of handoff strategies, none of the recommendations are supported with level of evidence A (multiple numerous randomized controlled trials). In fact, with the exception of using a template or technology solution which was supported with level of evidence B, all handoff recommendations were supported with C level of evidence. The recommendations, however, were rated as Class I (effective) because there were no conflicting expert opinions or studies (Figure 2).
Discussion
In summary, our review of the literature supports the use of face‐to‐face verbal handoffs that are aided by the use of structured template to guide exchange of information. Furthermore, the development of these recommendations is the first effort of its kind for hospitalist handoffs and a movement towards standardizing the handoff process. While these recommendations are meant to provide structure to the hospitalist handoff process, the use and implementation by individual hospitalist programs may require more specific detail than these recommendations provide. Local modifications can allow for improved acceptance and adoption by practicing hospitalists. These recommendations can also help guide teaching efforts for academic hospitalists who are responsible for supervising residents.
The limitations of these recommendations related to lack of evidence in this field. Studies suffered from small size, poor description of methods, and a paucity of controlled interventions. The described technology solutions are not standardized or commercially available. Only 1 study included patient outcomes.28 There are no multicenter studies, studies of hospitalist handoffs, or studies to guide inclusion of specific content. Randomized controlled trials, interrupted time series analyses, and other rigorous study designs are needed in both teaching and non‐teaching settings to evaluate these recommendations and other approaches to improving handoffs. Ideally, these studies would occur through multicenter collaboratives and with human factors researchers familiar with mixed methods approaches to evaluate how and why interventions work.29 Efforts should focus on developing surrogate measures that are sensitive to handoff quality and related to important patient outcomes. The results of future studies should be used to refine the present recommendations. Locating new literature could be facilitated through the introduction of Medical Subject Heading for the term handoff by the National Library of Medicine. After completing this systematic review and developing the handoff recommendations described here, a few other noteworthy articles have been published on this topic, to which we refer interested readers. Several of these studies demonstrate that standardizing content and process during medical or surgical intern sign‐out improves resident confidence with handoffs,30 resident perceptions of accuracy and completeness of signout,31 and perceptions of patient safety.32 Another prospective audiotape study of 12 days of resident signout of clinical information demonstrated that poor quality oral sign‐outs was associated with an increased risk of post‐call resident reported signout‐related problems.5 Lastly, 1 nursing study demonstrated improved staff reports of safety, efficiency, and teamwork after a change from verbal reporting in an isolated room to bedside handover.33 Overall, these additional studies continue to support the current recommendations presented in this paper and do not significantly impact the conclusions of our literature review.
While lacking specific content domain recommendations, this report can be used as a starting point to guide development of self and peer assessment of hospitalist handoff quality. Development and validation of such assessments is especially important and can be incorporated into efforts to certify hospitalists through the recently approved certificate of focused practice in hospital medicine by the American Board of Internal Medicine (ABIM). Initiatives by several related organizations may help guide these effortsThe Joint Commission, the ABIM's Stepping Up to the Plate (SUTTP) Alliance, the Institute for Healthcare Improvement, the Information Transfer and Communication Practices (ITCP) Project for surgical care transitions, and the Hospital at Night (H@N) Program sponsored by the United Kingdom's National Health Service.3437 Professional medical organizations can also serve as powerful mediators of change in this area, not only by raising the visibility of handoffs, but also by mobilizing research funding. Patients and their caregivers may also play an important role in increasing awareness and education in this area. Future efforts should target handoffs not addressed in this initiative, such as transfers from emergency departments to inpatient care units, or between ICUs and the medical floor.
Conclusion
With the growth of hospital medicine and the increased acuity of inpatients, improving handoffs becomes an important part of ensuring patient safety. The goal of the SHM Handoffs Task Force was to begin to standardize handoffs at change of shift and change of servicea fundamental activity of hospitalists. These recommendations build on the limited literature in surgery, nursing, and medical informatics and provide a starting point for promoting safe and seamless in‐hospital handoffs for practitioners of Hospital Medicine.
Acknowledgements
The authors also acknowledge Tina Budnitz and the Healthcare Quality and Safety Committee of the Society of Hospital Medicine. Last, they are indebted to the staff support provided by Shannon Roach from the Society of Hospital Medicine.
- ,,,.Lost in translation: challenges and opportunities in physician‐to‐physician communication during patient handoffs.Acad Med.2005;80(12):1094–1099.
- ... AHRQ WebM167(19):2030–2036.
- ,,,,.Communication failures in patient signout and suggestions for improvement: a critical incident analysis.Qual Saf Health Care.2005;14:401–407.
- ,,,,.Consequences of inadequate sign‐out for patient care.Arch Intern Med.2008;168(16):1755–1760.
- ,,, et al.Handoff strategies in settings with high consequences for failure: lessons for health care operations.Int J Qual Health Care.2004;16:125–132.
- Joint Commission. 2006 Critical Access Hospital and Hospital National Patient Safety Goals. Available at: http://www.jointcommission.org/PatientSafety/NationalPatientSafetyGoals/06_npsg_cah.htm. Accessed June2009.
- ,,,.Transfers of patient care between house staff on internal medicine wards: a national survey.Arch Intern Med.2006;166(11):1173–1177.
- ,.Re‐framing continuity of care for this century.Qual Saf Health Care.2005;14(6):394–396.
- ,,,,.Core competencies in hospital medicine: development and methodology.J Hosp Med.2006;1(suppl 1):48–56.
- ,,, et al.Managing discontinuity in academic medical centers: strategies for a safe and effective resident sign‐out.J Hosp Med.2006;1(4):257–266.
- ,,, et al.Deficits in communication and information transfer between hospital‐based and primary‐care physicians: implications for patient safety and continuity of care.JAMA.2007;297(8):831–841.
- ,,, et al.Transition of care for hospitalized elderly patients: development of a discharge checklist for hospitalists.J Hosp Med.2006;1(6):354–360.
- Discontinuities, Gaps, and Hand‐Off Problems. AHRQ PSNet Patient Safety Network. Available at: http://www.psnet.ahrq.gov/content.aspx?taxonomyID=412. Accessed June2009.
- Manual for ACC/AHA Guideline Writing Committees. Methodologies and Policies from the ACC/AHA Task Force on Practice Guidelines. Available at: http://circ.ahajournals.org/manual/manual_IIstep6.shtml. Accessed June2009.
- ,,,,.A randomized, controlled trial evaluating the impact of a computerized rounding and sign‐out system on continuity of care and resident work hours.J Am Coll Surg.2005;200(4):538–545.
- ,,,,.Using a computerized sign‐out program to improve continuity of inpatient care and prevent adverse events.Jt Comm J Qual Improv.1998;24(2):77–87.
- ,.MediSign: using a web‐based SignOut System to improve provider identification.Proc AMIA Symp.1999:550–554.
- ,.Using a computerized sign‐out system to improve physician‐nurse communication.Jt Comm J Qual Patient Saf.2006;32(1):32–36.
- ,,,.Pilot study to show the loss of important data in nursing handover.Br J Nurs.2005;14(20):1090–1093.
- .Using care plans to replace the handover.Nurs Stand.1995;9(32):24–26.
- .Change from an office‐based to a walk‐around handover system.Nurs Times.2005;101(10):34–35.
- Clinical Handover and Patient Safety. Literature review report. Australian Council for Safety and Quality in Health Care. Available at: http://www.health.gov.au/internet/safety/publishing.nsf/Content/AA1369AD4AC5FC2ACA2571BF0081CD95/$File/clinhovrlitrev.pdf. Accessed June2009.
- Safe Handover: Safe Patients. Guidance on clinical handover for clinicians and managers. Junior Doctors Committee, British Medical Association. Available at: http://www.bma.org.uk/ap.nsf/AttachmentsByTitle/PDFsafehandover/$FILE/safehandover.pdf. Accessed June2009.
- University HealthSystem Consortium (UHC).UHC Best Practice Recommendation: Patient Hand Off Communication White Paper, May 2006.Oak Brook, IL:University HealthSystem Consortium;2006.
- Healthcare Communications Toolkit to Improve Transitions in Care. Department of Defense Patient Safety Program. Available at: http://dodpatientsafety.usuhs.mil/files/Handoff_Toolkit.pdf. Accessed June2009.
- Joint Commission on Accreditation of Healthcare Organizations. Joint Commission announces 2006 national patient safety goals for ambulatory care and office‐based surgery organizations. Available at: http://www.jcaho.org/news+room/news+release+archives/06_npsg_amb_obs.htm. Accessed June2009.
- ,,,,.Does housestaff discontinuity of care increase the risk for preventable adverse events?Ann Intern Med.1994;121(11):866–872.
- .Communication strategies from high‐reliability organizations: translation is hard work.Ann Surg.2007;245(2):170–172.
- ,,, et al.A structured handoff program for interns.Acad Med.2009;84(3):347–352.
- ,,, et al.Simple standardized patient handoff system that increases accuracy and completeness.J Surg Educ.2008;65(6):476–485.
- ,,.Standardized sign‐out reduces intern perception of medical errors on the general internal medicine ward.Teach Learn Med.2009;21(2):121–126.
- ,,,,,.Bedside handover: quality improvement strategy to “transform care at the bedside”.J Nurs Care Qual.2009;24(2):136–142.
- Pillow M, ed.Improving Handoff Communications.Chicago:Joint Commission Resources;2007.
- American Board of Internal Medicine Foundation. Step Up To The Plate. Available at: http://www.abimfoundation.org/quality/suttp.shtm. Accessed June2009.
- ,,, et al.Surgeon information transfer and communication: factors affecting quality and efficiency of inpatient care.Ann Surg.2007;245(2):159–169.
- Hospital at Night. Available at: http://www.healthcareworkforce.nhs.uk/hospitalatnight.html. Accessed June2009.
- .Using care plans to replace the handover.Nurs Stand.1995;9(32):24–26.
- ,,,.Electronic medical handover: towards safer medical care.Med J Aust.2005;183(7):369–372.
- ,,.Utility of a standardized sign‐out card for new medical interns.J Gen Intern Med.1996;11(12):753–755.
- ,.Signing out patients for off‐hours coverage: comparison of manual and computer‐aided methods.Proc Annu Symp Comput Appl Med Care.1992:114–118.
- ,,,.Organizing the transfer of patient care information: the development of a computerized resident sign‐out system.Surgery.2004;136(1):5–13.
Handoffs during hospitalization from one provider to another represent critical transition points in patient care.1 In‐hospital handoffs are a frequent occurrence, with 1 teaching hospital reporting 4000 handoffs daily for a total of 1.6 million per year.2
Incomplete or poor‐quality handoffs have been implicated as a source of adverse events and near misses in hospitalized patients.35 Standardizing the handoff process may improve patient safety during care transitions.6 In 2006, the Joint Commission issued a National Patient Safety Goal that requires care providers to adopt a standardized approach for handoff communications, including an opportunity to ask and respond to questions about a patient's care.7 The reductions in resident work hours by the Accreditation Council for Graduate Medical Education (ACGME) has also resulted in a greater number and greater scrutiny of handoffs in teaching hospitals.8, 9
In response to these issues, and because handoffs are a core competency for hospitalists, the Society of Hospital Medicine (SHM)convened a task force.10 Our goal was to develop a set of recommendations for handoffs that would be applicable in both community and academic settings; among physicians (hospitalists, internists, subspecialists, residents), nurse practitioners, and physicians assistants; and across roles including serving as the primary provider of hospital care, comanager, or consultant. This work focuses on handoffs that occur at shift change and service change.11 Shift changes are transitions of care between an outgoing provider and an incoming provider that occur at the end of the outgoing provider's continuous on‐duty period. Service changesa special type of shift changeare transitions of care between an outgoing provider and an incoming provider that occur when an outgoing provider is leaving a rotation or period of consecutive daily care for patients on the same service.
For this initiative, transfers of care in which the patient is moving from one patient area to another (eg, Emergency Department to inpatient floor, or floor to intensive care unit [ICU]) were excluded since they likely require unique consideration given their cross‐disciplinary and multispecialty nature. Likewise, transitions of care at hospital admission and discharge were also excluded because recommendations for discharge are already summarized in 2 complementary reports.12, 13
To develop recommendations for handoffs at routine shift change and service changes, the Handoff Task Force performed a systematic review of the literature to develop initial recommendations, obtained feedback from hospital‐based clinicians in addition to a panel of handoff experts, and finalized handoff recommendations, as well as a proposed research agenda, for the SHM.
Methods
The SHM Healthcare Quality and Patient Safety (HQPS) Committee convened the Handoff Task Force, which was comprised of 6 geographically diverse, predominantly academic hospitalists with backgrounds in education, patient safety, health communication, evidence‐based medicine, and handoffs. The Task Force then engaged a panel of 4 content experts selected for their work on handoffs in the fields of nursing, information technology, human factors engineering, and hospital medicine. Similar to clinical guideline development by professional societies, the Task Force used a combination of evidence‐based review and expert opinions to propose recommendations.
Literature Review
A PubMed search was performed for English language articles published from January 1975 to January 2007, using the following keywords: handover or handoff or hand‐off or shift change or signout or sign‐out. Articles were eligible if they presented results from a controlled intervention to improve handoffs at shift change or service change, by any health profession. Articles that appeared potentially relevant based on their title were retrieved for full‐text review and included if deemed eligible by at least 2 reviewers. Additional studies were obtained through the Agency for Healthcare Research and Quality (AHRQ) Patient Safety Network,14 using the category Safety target and subcategory Discontinuities, gaps, and hand‐off problems. Finally, the expert panel reviewed the results of the literature review and suggested additional articles.
Eligible studies were abstracted by individual members of the Handoff Task Force using a structured form (Appendix Figure 1), and abstractions were verified by a second member. Handoff‐related outcome measures were categorized as referring to (1) patient outcomes, (2) staff outcomes, or (3) system outcomes. Because studies included those from nursing and other industries, interventions were evaluated by abstractors for their applicability to routine hospitalist handoffs. The literature review was supplemented by review of expert consensus or policy white papers that described recommendations for handoffs. The list of white papers was generated utilizing a common internet search engine (Google;
Peer and Expert Panel Review
The Task Force generated draft recommendations, which were revised through interactive discussions until consensus was achieved. These recommendations were then presented at a workshop to an audience of approximately 300 hospitalists, case managers, nurses, and pharmacists at the 2007 SHM Annual Meeting.
During the workshop, participants were asked to cast up to 3 votes for recommendations that should be removed. Those recommendations that received more than 20 votes for removal were then discussed. Participants also had the opportunity to anonymously suggest new recommendations or revisions using index cards, which were reviewed by 2 workshop faculty, assembled into themes, and immediately presented to the group. Through group discussion of prevalent themes, additional recommendations were developed.
Four content experts were then asked to review a draft paper that summarized the literature review, discussion at the SHM meeting, and handoff recommendations. Their input regarding the process, potential gaps in the literature, and additional items of relevance, was incorporated into this final manuscript.
Final Review by SHM Board and Rating each Recommendation
A working paper was reviewed and approved by the Board of the SHM in early January 2008. With Board input, the Task Force adopted the American College of Cardiology/American Heart Association (ACC/AHA) framework to rate each recommendation because of its appropriateness, ease of use, and familiarity to hospital‐based physicians.15 Recommendations are rated as Class I (effective), IIa (conflicting findings but weight of evidence supports use), IIb (conflicting findings but weight of evidence does not support use), or III (not effective). The Level of Evidence behind each recommendation is graded as A (from multiple large randomized controlled trials), B (from smaller or limited randomized trials, or nonrandomized studies), or C (based primarily on expert consensus). A recommendation with Level of Evidence B or C should not imply that the recommendation is not supported.15
Results
Literature Review
Of the 374 articles identified by the electronic search of PubMed and the AHRQ Patient Safety Network, 109 were retrieved for detailed review, and 10 of these met the criteria for inclusion (Figure 1). Of these studies, 3 were derived from nursing literature and the remaining were tests of technology solutions or structured templates (Table 1).1618, 20, 22, 3842 No studies examined hospitalist handoffs. All eligible studies concerned shift change. There were no studies of service change. Only 1 study was a randomized controlled trial; the rest were pre‐post studies with historical controls or a controlled simulation. All reports were single‐site studies. Most outcomes were staff‐related or system‐related, with only 2 studies using patient outcomes.
| Author (Year) | Study Design | Intervention | Setting and Study Population | Target | Outcomes |
|---|---|---|---|---|---|
| |||||
| Nursing | |||||
| Kelly22 (2005) | Pre‐post | Change to walk‐round handover (at bedside) from baseline (control) | 12‐bed rehab unit with 18 nurses and 10 patients | Staff, patient | 11/18 nurses felt more or much more informed and involved; 8/10 patients felt more involved |
| Pothier et al.20 (2005) | Controlled simulation | Compared pure verbal to verbal with note‐taking to verbal plus typed content | Handover of 12 simulated patients over 5 cycles | System (data loss) | Minimal data loss with typed content, compared to 31% data retained with note‐taking, and no data retained with verbal only |
| Wallum38 (1995) | Pre‐post | Change from oral handover (baseline) to written template read with exchange | 20 nurses in a geriatric dementia ward | Staff | 83% of nurses felt care plans followed better; 88% knew care plans better |
| Technology or structured template | |||||
| Cheah et al.39 (2005) | Pre‐post | Electronic template with free‐text entry compared to baseline | 14 UK Surgery residents | Staff | 100% (14) of residents rated electronic system as desirable, but 7 (50%) reported that information was not updated |
| Lee et al.40 (1996) | Pre‐post | Standardized signout card for interns to transmit information during handoffs compared to handwritten (baseline) | Inpatient cardiology service at IM residency program in Minnesota with 19 new interns over a 3‐month period | Staff | Intervention interns (n = 10) reported poor sign‐out less often than controls (n = 9) [intervention 8 nights (5.8%) vs. control 17 nights (14.9%); P = 0.016] |
| Kannry and Moore18 (1999) | Pre‐post | Compared web‐based signout program to usual system (baseline) | An academic teaching hospital in New York (34 patients admitted in 1997; 40 patients admitted in 1998) | System | Improved provider identification (86% web signout vs. 57% hospital census) |
| Petersen et al.17 (1998) | Pre‐post | 4 months of computerized signouts compared to baseline period (control) | 3747 patients admitted to the medical service at an academic teaching hospital | Patient | Preventable adverse events (ADE) decreased (1.7% to 1.2%, P 0.10); risk of cross‐cover physician for ADE eliminated |
| Ram and Block41 (1993) | Pre‐post | Compared handwritten (baseline) to computer‐generated | Family medicine residents at 2 academic teaching hospitals [Buffalo (n = 16) and Pittsburgh (n = 16)] | Staff | Higher satisfaction after electronic signout, but complaints with burden of data entry and need to keep information updated |
| Van Eaton et al.42 (2004) | Pre‐post | Use of UW Cores links sign‐out to list for rounds and IS data | 28 surgical and medical residents at 2 teaching hospitals | System | At 6 months, 66% of patients entered in system (adoption) |
| Van Eaton et al.16 (2005) | Prospective, randomized, crossover study. | Compared UW Cores* integrated system compared to usual system | 14 inpatient resident teams (6 surgery, 8 IM) at 2 teaching hospitals for 5 months | Staff, system | 50% reduction in the perceived time spent copying data [from 24% to 12% (P 0.0001)] and number of patients missed on rounds (2.5 vs. 5 patients/team/month, P = 0.0001); improved signout quality (69.6% agree or strongly agree); and improved continuity of care (66.1% agree or strongly agree) |
Overall, the literature presented supports the use of a verbal handoff supplemented with written documentation in a structured format or technology solution. The 2 most rigorous studies were led by Van Eaton et al.16 and Petersen et al.17 and focused on evaluating technology solutions. Van Eaton et al.16 performed a randomized controlled trial of a locally created rounding template with 161 surgical residents. This template downloads certain information (lab values and recent vital signs) from the hospital system into a sign‐out sheet and allows residents to enter notes about diagnoses, allergies, medications and to‐do items. When implemented, the investigators found the number of patients missed on rounds decreased by 50%. Residents reported an increase of 40% in the amount of time available to pre‐round, due largely to not having to copy data such as vital signs. They reported a decrease in rounding time by 3 hours per week, and this was perceived as helping them meet the ACGME 80 hours work rules. Lastly, the residents reported a higher quality of sign‐outs from their peers and perceived an overall improvement in continuity of care. Petersen and colleagues implemented a computerized sign‐out (auto‐imported medications, name, room number) in an internal medicine residency to improve continuity of care during cross‐coverage and decrease adverse events.17 Prior to the intervention, the frequency of preventable adverse events was 1.7% and it was significantly associated with cross‐coverage. Preventable adverse events were identified using a confidential self‐report system that was also validated by clinician review. After the intervention, the frequency of preventable adverse events dropped to 1.2% (P 0.1), and cross‐coverage was no longer associated with preventable adverse events. In other studies, technological solutions also improved provider identification and staff communication.18, 19 Together, these technology‐based intervention studies suggest that a computerized sign‐out with auto‐imported fields has the ability to improve physician efficiency and also improve inpatient care (reduction in number of patients missed on rounds, decrease in preventable adverse events).
Studies from nursing demonstrated that supplementing a verbal exchange with written information improved transfer of information, compared to verbal exchange alone.20 One of these studies rated the transfer of information using videotaped simulated handoff cases.21 Last, 1 nursing study that more directly involved patients in the handoff process resulted in improved nursing knowledge and greater patient empowerment (Table 1).22
White papers or consensus statements originated from international and national consortia in patient safety including the Australian Council for Safety and Quality in Healthcare,23 the Junior Doctors Committee of the British Medical Association,24 University Health Consortium,25 the Department of Defense Patient Safety Program,26 and The Joint Commission.27 Several common themes were prevalent in all white papers. First, there exists a need to train new personnel on how to perform an effective handoff. Second, efforts should be undertaken to ensure adequate time for handoffs and reduce interruptions during handoffs. Third, several of the papers supported verbal exchange that facilitates interactive questioning, focuses on ill patients, and delineates actions to be taken. Lastly, content should be updated to ensure transfer of the latest clinical information.
Peer Review at SHM Meeting of Preliminary Handoff Recommendations
In the presentation of preliminary handoff recommendations to over 300 attendees at the SHM Annual Meeting in 2007, 2 recommendations were supported unanimously: (1) a formal recognized handoff plan should be instituted at end of shift or change in service; and (2) ill patients should be given priority during verbal exchange.
During the workshop, discussion focused on three recommendations of concern, or those that received greater than 20 negative votes by participants. The proposed recommendation that raised the most objections (48 negative votes) was that interruptions be limited. Audience members expressed that it was hard to expect that interruptions would be limited given the busy workplace in the absence of endorsing a separate room and time. This recommendation was ultimately deleted.
The 2 other debated recommendations, which were retained after discussion, were ensuring adequate time for handoffs and using an interactive process during verbal communication. Several attendees stated that ensuring adequate time for handoffs may be difficult without setting a specific time. Others questioned the need for interactive verbal communication, and endorsed leaving a handoff by voicemail with a phone number or pager to answer questions. However, this type of asynchronous communication (senders and receivers not present at the same time) was not desirable or consistent with the Joint Commission's National Patient Safety Goal.
Two new recommendations were proposed from anonymous input and incorporated in the final recommendations, including (a) all patients should be on the sign‐out, and (b) sign‐outs should be accessible from a centralized location. Another recommendation proposed at the Annual Meeting was to institute feedback for poor sign‐outs, but this was not added to the final recommendations after discussion at the meeting and with content experts about the difficulty of maintaining anonymity in small hospitalist groups. Nevertheless, this should not preclude informal feedback among practitioners.
Anonymous commentary also yielded several major themes regarding handoff improvements and areas of uncertainty that merit future work. Several hospitalists described the need to delineate specific content domains for handoffs including, for example, code status, allergies, discharge plan, and parental contact information in the case of pediatric care. However, due to the variability in hospitalist programs and health systems and the general lack of evidence in this area, the Task Force opted to avoid recommending specific content domains which may have limited applicability in certain settings and little support from the literature. Several questions were raised regarding the legal status of written sign‐outs, and whether sign‐outs, especially those that are web‐based, are compliant with the Healthcare Information Portability and Accountability Act (HIPAA). Hospitalists also questioned the appropriate number of patients to be handed off safely. Promoting efficient technology solutions that reduce documentation burden, such as linking the most current progress note to the sign‐out, was also proposed. Concerns were also raised about promoting safe handoffs when using moonlighting or rotating physicians, who may be less invested in the continuity of the patients' overall care.
Expert Panel Review
The final version of the Task Force recommendations incorporates feedback provided by the expert panel. In particular, the expert panel favored the use of the term, recommendations, rather than standards, minimum acceptable practices, or best practices. While the distinction may appear semantic, the Task Force and expert panel acknowledge that the current state of scientific knowledge regarding hospital handoffs is limited. Although an evidence‐based process informed the development of these recommendations, they are not a legal standard for practice. Additional research may allow for refinement of recommendations and development of more formal handoff standards.
The expert panel also highlighted the need to provide tools to hospitalist programs to facilitate the adoption of these recommendations. For example, recommendations for content exchange are difficult to adopt if groups do not already use a written template. The panel also commented on the need to consider the possible consequences if efforts are undertaken to include handoff documents (whether paper or electronic) as part of the medical record. While formalizing handoff documents may raise their quality, it is also possible that handoff documents become less helpful by either excluding the most candid impression regarding a patient's status or by encouraging hospitalists to provide too much detail. Privacy and confidentiality of paper‐based systems, in particular, were also questioned.
Additional Recommendations for Service Change
Patient handoffs during a change of service are a routine part of hospitalist care. Since service change is a type of shift change, the handoff recommendations for shift change do apply. Unlike shift change, service changes involve a more significant transfer of responsibility. Therefore, the Task Force recommends also that the incoming hospitalist be readily identified in the medical record or chart as the new provider, so that relevant clinical information can be communicated to the correct physician. This program‐level recommendation can be met by an electronic or paper‐based system that correctly identifies the current primary inpatient physician.
Final Handoff Recommendations
The final handoff recommendations are shown in Figure 2. The recommendations were designed to be consistent with the overall finding of the literature review, which supports the use of a verbal handoff supplemented with written documentation or a technological solution in a structured format. With the exception of 1 recommendation that is specific to service changes, all recommendations are designed to refer to shift changes and service changes. One overarching recommendation refers to the need for a formally recognized handoff plan at a shift change or change of service. The remaining 12 recommendations are divided into 4 that refer to hospitalist groups or programs, 3 that refer to verbal exchange, and 5 that refer to content exchange. The distinction is an important one because program‐level recommendations require organizational support and buy‐in to promote clinician participation and adherence. The 4 program recommendations also form the necessary framework for the remaining recommendations. For example, the second program recommendation describes the need for a standardized template or technology solution for accessing and recording patient information during the handoff. After a program adopts such a mechanism for exchanging patient information, the specific details for use and maintenance are outlined in greater detail in content exchange recommendations.
Because of the limited trials of handoff strategies, none of the recommendations are supported with level of evidence A (multiple numerous randomized controlled trials). In fact, with the exception of using a template or technology solution which was supported with level of evidence B, all handoff recommendations were supported with C level of evidence. The recommendations, however, were rated as Class I (effective) because there were no conflicting expert opinions or studies (Figure 2).
Discussion
In summary, our review of the literature supports the use of face‐to‐face verbal handoffs that are aided by the use of structured template to guide exchange of information. Furthermore, the development of these recommendations is the first effort of its kind for hospitalist handoffs and a movement towards standardizing the handoff process. While these recommendations are meant to provide structure to the hospitalist handoff process, the use and implementation by individual hospitalist programs may require more specific detail than these recommendations provide. Local modifications can allow for improved acceptance and adoption by practicing hospitalists. These recommendations can also help guide teaching efforts for academic hospitalists who are responsible for supervising residents.
The limitations of these recommendations related to lack of evidence in this field. Studies suffered from small size, poor description of methods, and a paucity of controlled interventions. The described technology solutions are not standardized or commercially available. Only 1 study included patient outcomes.28 There are no multicenter studies, studies of hospitalist handoffs, or studies to guide inclusion of specific content. Randomized controlled trials, interrupted time series analyses, and other rigorous study designs are needed in both teaching and non‐teaching settings to evaluate these recommendations and other approaches to improving handoffs. Ideally, these studies would occur through multicenter collaboratives and with human factors researchers familiar with mixed methods approaches to evaluate how and why interventions work.29 Efforts should focus on developing surrogate measures that are sensitive to handoff quality and related to important patient outcomes. The results of future studies should be used to refine the present recommendations. Locating new literature could be facilitated through the introduction of Medical Subject Heading for the term handoff by the National Library of Medicine. After completing this systematic review and developing the handoff recommendations described here, a few other noteworthy articles have been published on this topic, to which we refer interested readers. Several of these studies demonstrate that standardizing content and process during medical or surgical intern sign‐out improves resident confidence with handoffs,30 resident perceptions of accuracy and completeness of signout,31 and perceptions of patient safety.32 Another prospective audiotape study of 12 days of resident signout of clinical information demonstrated that poor quality oral sign‐outs was associated with an increased risk of post‐call resident reported signout‐related problems.5 Lastly, 1 nursing study demonstrated improved staff reports of safety, efficiency, and teamwork after a change from verbal reporting in an isolated room to bedside handover.33 Overall, these additional studies continue to support the current recommendations presented in this paper and do not significantly impact the conclusions of our literature review.
While lacking specific content domain recommendations, this report can be used as a starting point to guide development of self and peer assessment of hospitalist handoff quality. Development and validation of such assessments is especially important and can be incorporated into efforts to certify hospitalists through the recently approved certificate of focused practice in hospital medicine by the American Board of Internal Medicine (ABIM). Initiatives by several related organizations may help guide these effortsThe Joint Commission, the ABIM's Stepping Up to the Plate (SUTTP) Alliance, the Institute for Healthcare Improvement, the Information Transfer and Communication Practices (ITCP) Project for surgical care transitions, and the Hospital at Night (H@N) Program sponsored by the United Kingdom's National Health Service.3437 Professional medical organizations can also serve as powerful mediators of change in this area, not only by raising the visibility of handoffs, but also by mobilizing research funding. Patients and their caregivers may also play an important role in increasing awareness and education in this area. Future efforts should target handoffs not addressed in this initiative, such as transfers from emergency departments to inpatient care units, or between ICUs and the medical floor.
Conclusion
With the growth of hospital medicine and the increased acuity of inpatients, improving handoffs becomes an important part of ensuring patient safety. The goal of the SHM Handoffs Task Force was to begin to standardize handoffs at change of shift and change of servicea fundamental activity of hospitalists. These recommendations build on the limited literature in surgery, nursing, and medical informatics and provide a starting point for promoting safe and seamless in‐hospital handoffs for practitioners of Hospital Medicine.
Acknowledgements
The authors also acknowledge Tina Budnitz and the Healthcare Quality and Safety Committee of the Society of Hospital Medicine. Last, they are indebted to the staff support provided by Shannon Roach from the Society of Hospital Medicine.
- ,,,.Lost in translation: challenges and opportunities in physician‐to‐physician communication during patient handoffs.Acad Med.2005;80(12):1094–1099.
- ... AHRQ WebM167(19):2030–2036.
- ,,,,.Communication failures in patient signout and suggestions for improvement: a critical incident analysis.Qual Saf Health Care.2005;14:401–407.
- ,,,,.Consequences of inadequate sign‐out for patient care.Arch Intern Med.2008;168(16):1755–1760.
- ,,, et al.Handoff strategies in settings with high consequences for failure: lessons for health care operations.Int J Qual Health Care.2004;16:125–132.
- Joint Commission. 2006 Critical Access Hospital and Hospital National Patient Safety Goals. Available at: http://www.jointcommission.org/PatientSafety/NationalPatientSafetyGoals/06_npsg_cah.htm. Accessed June2009.
- ,,,.Transfers of patient care between house staff on internal medicine wards: a national survey.Arch Intern Med.2006;166(11):1173–1177.
- ,.Re‐framing continuity of care for this century.Qual Saf Health Care.2005;14(6):394–396.
- ,,,,.Core competencies in hospital medicine: development and methodology.J Hosp Med.2006;1(suppl 1):48–56.
- ,,, et al.Managing discontinuity in academic medical centers: strategies for a safe and effective resident sign‐out.J Hosp Med.2006;1(4):257–266.
- ,,, et al.Deficits in communication and information transfer between hospital‐based and primary‐care physicians: implications for patient safety and continuity of care.JAMA.2007;297(8):831–841.
- ,,, et al.Transition of care for hospitalized elderly patients: development of a discharge checklist for hospitalists.J Hosp Med.2006;1(6):354–360.
- Discontinuities, Gaps, and Hand‐Off Problems. AHRQ PSNet Patient Safety Network. Available at: http://www.psnet.ahrq.gov/content.aspx?taxonomyID=412. Accessed June2009.
- Manual for ACC/AHA Guideline Writing Committees. Methodologies and Policies from the ACC/AHA Task Force on Practice Guidelines. Available at: http://circ.ahajournals.org/manual/manual_IIstep6.shtml. Accessed June2009.
- ,,,,.A randomized, controlled trial evaluating the impact of a computerized rounding and sign‐out system on continuity of care and resident work hours.J Am Coll Surg.2005;200(4):538–545.
- ,,,,.Using a computerized sign‐out program to improve continuity of inpatient care and prevent adverse events.Jt Comm J Qual Improv.1998;24(2):77–87.
- ,.MediSign: using a web‐based SignOut System to improve provider identification.Proc AMIA Symp.1999:550–554.
- ,.Using a computerized sign‐out system to improve physician‐nurse communication.Jt Comm J Qual Patient Saf.2006;32(1):32–36.
- ,,,.Pilot study to show the loss of important data in nursing handover.Br J Nurs.2005;14(20):1090–1093.
- .Using care plans to replace the handover.Nurs Stand.1995;9(32):24–26.
- .Change from an office‐based to a walk‐around handover system.Nurs Times.2005;101(10):34–35.
- Clinical Handover and Patient Safety. Literature review report. Australian Council for Safety and Quality in Health Care. Available at: http://www.health.gov.au/internet/safety/publishing.nsf/Content/AA1369AD4AC5FC2ACA2571BF0081CD95/$File/clinhovrlitrev.pdf. Accessed June2009.
- Safe Handover: Safe Patients. Guidance on clinical handover for clinicians and managers. Junior Doctors Committee, British Medical Association. Available at: http://www.bma.org.uk/ap.nsf/AttachmentsByTitle/PDFsafehandover/$FILE/safehandover.pdf. Accessed June2009.
- University HealthSystem Consortium (UHC).UHC Best Practice Recommendation: Patient Hand Off Communication White Paper, May 2006.Oak Brook, IL:University HealthSystem Consortium;2006.
- Healthcare Communications Toolkit to Improve Transitions in Care. Department of Defense Patient Safety Program. Available at: http://dodpatientsafety.usuhs.mil/files/Handoff_Toolkit.pdf. Accessed June2009.
- Joint Commission on Accreditation of Healthcare Organizations. Joint Commission announces 2006 national patient safety goals for ambulatory care and office‐based surgery organizations. Available at: http://www.jcaho.org/news+room/news+release+archives/06_npsg_amb_obs.htm. Accessed June2009.
- ,,,,.Does housestaff discontinuity of care increase the risk for preventable adverse events?Ann Intern Med.1994;121(11):866–872.
- .Communication strategies from high‐reliability organizations: translation is hard work.Ann Surg.2007;245(2):170–172.
- ,,, et al.A structured handoff program for interns.Acad Med.2009;84(3):347–352.
- ,,, et al.Simple standardized patient handoff system that increases accuracy and completeness.J Surg Educ.2008;65(6):476–485.
- ,,.Standardized sign‐out reduces intern perception of medical errors on the general internal medicine ward.Teach Learn Med.2009;21(2):121–126.
- ,,,,,.Bedside handover: quality improvement strategy to “transform care at the bedside”.J Nurs Care Qual.2009;24(2):136–142.
- Pillow M, ed.Improving Handoff Communications.Chicago:Joint Commission Resources;2007.
- American Board of Internal Medicine Foundation. Step Up To The Plate. Available at: http://www.abimfoundation.org/quality/suttp.shtm. Accessed June2009.
- ,,, et al.Surgeon information transfer and communication: factors affecting quality and efficiency of inpatient care.Ann Surg.2007;245(2):159–169.
- Hospital at Night. Available at: http://www.healthcareworkforce.nhs.uk/hospitalatnight.html. Accessed June2009.
- .Using care plans to replace the handover.Nurs Stand.1995;9(32):24–26.
- ,,,.Electronic medical handover: towards safer medical care.Med J Aust.2005;183(7):369–372.
- ,,.Utility of a standardized sign‐out card for new medical interns.J Gen Intern Med.1996;11(12):753–755.
- ,.Signing out patients for off‐hours coverage: comparison of manual and computer‐aided methods.Proc Annu Symp Comput Appl Med Care.1992:114–118.
- ,,,.Organizing the transfer of patient care information: the development of a computerized resident sign‐out system.Surgery.2004;136(1):5–13.
Enhanced End‐of‐Life Care and RRTs
In 2007, the Joint Commission for Accreditation of Healthcare Organizations (JCAHO) recommended deployment of rapid response teams (RRTs) in U.S. hospitals to hasten identification and treatment of physiologically unstable hospitalized patients.1 Clinical studies that have focused on whether RRTs improve restorative care outcomes, frequency of cardiac arrest, and critical care utilization have yielded mixed results.2‐11 One study suggested that RRTs might provide an opportunity to enhance palliative care of hospitalized patients.11 In this study, RRT personnel felt that prior do‐not‐resuscitate orders would have been appropriate in nearly a quarter of cases. However, no previous study has examined whether the RRT might be deployed to identify acutely decompensating patients who either do not want or would not benefit from a trial of aggressive restorative treatments. We hypothesized that actuation of an RRT in our hospital would expedite identification of patients not likely to benefit from restorative care and would promote more timely commencement of end‐of‐life comfort care, thereby improving their quality of death (QOD).12‐16
Materials and Methods
Study Design and Settings
This retrospective cohort study was approved by the Institutional Review Board (IRB) of and conducted at Bridgeport Hospital, a 425‐bed community teaching hospital. In October 2006, the hospital deployed its RRT, which includes a critical care nurse, respiratory therapist, and second‐year Medicine resident. Nurses on the hospital wards received educational in‐service training instructing them to request an RRT evaluation for: airway incompetence, oxygen desaturation despite fraction of inspired oxygen (FiO2) 60%, respiratory frequency 8 or >30/minute, heart rate 50 or >110/minute, systolic pressure 90 or >180 mmHg, acute significant bleeding, sudden neurologic changes, or patient changes that troubled the nurse. The critical care nurse and respiratory therapist responded to all calls. If assessment suggested a severe problem that required immediate physician supervision, the resident was summoned immediately. Otherwise, the nurse assessed the patient and suggested to the patient's primary doctor of record a trial of therapies. If ratified, the therapies were provided by the nurse and respiratory therapist until symptoms/signs resolved or failed to improve, in which case the resident‐physician was summoned. The resident‐physician would assess, attempt further relieving therapies, and, if appropriate, arrange for transfer to critical care units (in which case the case was presented to the staff intensivist who supervised care) after discussion with the patient and attending physician. No organizational changes in the administration or education of palliative care were implemented during the study period.
Data Extraction and Analysis
All patients dying in the hospital during the first 8 months of RRT activity (October 1, 2006 to May 31, 2007) and during the same months in the year prior to RRT were eligible for the study. Patients were excluded if they died in areas of the hospital not covered by the RRT, such as intensive care units, operating rooms, emergency department, recovery areas, or pediatric floors, or if they had been admitted or transferred to hospital wards with palliative care/end‐of‐life orders.
Physiologic data, including blood pressures (lowest), heart rate (highest), and respiratory rate (highest), were extracted from records of the 48 hours before and until resolution of the RRT assessment, or prior to death for those without RRT care. Outcomes were defined by World Health Organization (WHO) domains of palliative care (symptoms, social, and spiritual).14 The symptom domain was measured using patients' pain scores, 24 hours prior to death (0‐10). Subjective reports of healthcare providers recorded in hospital records, including the terms suffering, pain, anxiety, or distress were also extracted from notes 24 hours prior to patients' deaths. Administration of opioids in the 24 hours prior to death was also recorded. Social and spiritual domains were measured by documentation of presence of the family and chaplain, respectively, at the bedside in the 24 hours prior to death.
Analysis was performed using SPSS software (SPSS Inc., Chicago, IL). Categorical variables, described as proportions, were compared with chi‐square tests. Continuous variables are reported as means standard errors, or as medians with the interquartile ranges. Means were compared using Student t test if a normal distribution was detected. Nonparametric variables were compared with Wilcoxon rank sum tests. To adjust for confounding and assess possible effect modification, multiple logistic regression, multiple linear regression, and stratified analyses were performed when appropriate. Domains of the QOD were compared between patients who died in the pre‐RRT and post‐RRT epochs. Patients who died on hospital wards without RRT evaluation in the post‐RRT epoch were compared to those who died following RRT care. Unadjusted in‐hospital mortality, frequency of cardiopulmonary resuscitation, frequency of transfer from wards to critical care, and QOD were compiled and compared. A P value of 0.05 was considered statistically significant.
Results
A total of 394 patients died on the hospital wards and were not admitted with palliative, end‐of‐life medical therapies. The combined (pre‐RRT and post‐RRT epochs) cohort had a mean age of 77.2 13.2 years. A total of 48% were male, 79% White, 12% Black, and 8% Hispanic. A total of 128 patients (33%) were admitted to the hospital from a skilled nursing facility and 135 (35%) had written advance directives.
A total of 197 patients met the inclusion criteria during the pre‐RRT (October 1, 2005 to May 31, 2006) and 197 during the post‐RRT epochs (October 1, 2006 to May 31, 2007). There were no differences in age, sex, advance directives, ethnicity, or religion between the groups (Table 1). Primary admission diagnoses were significantly different; pre‐RRT patients were 9% more likely to die with malignancy compared to post‐RRT patients and less likely to come from nursing homes (38% vs. 27%; P = 0.02).
| Total | Pre‐RRT | Post‐RRT | P value | |
|---|---|---|---|---|
| ||||
| Total admissions | 25,943 | 12,926 | 13,017 | |
| Number of deaths | 394 | 197 | 197 | NS |
| Age (years) | 77.5 13.2 | 77.1 13.36 | 77.9 13.13 | 0.5 |
| Male gender | 190 (48%) | 99 (51%) | 91 (46%) | 0.4 |
| From SNF | 128 (32%) | 54 (27%) | 74 (38%) | 0.02 |
| Living will | 135 (34%) | 66 (33%) | 69 (35%) | 0.8 |
| Race | 0.3 | |||
| White | 314 (80%) | 163 (83%) | 151 (77%) | |
| Hispanic | 32 (8%) | 14 (7%) | 18 (9%) | |
| Black | 47 (12%) | 19 (10%) | 28 (14%) | |
| Other | 1 (1%) | 1 (1%) | 0 | |
| Religion (%) | 0.8 | |||
| Christian | 357 (91%) | 177 (90%) | 180 (91%) | |
| Non‐Christian | 37 (9%) | 20 (10%) | 17 (9%) | |
| Admission diagnosis | 0.01 | |||
| Malignancy | 96 (24%) | 56 (28%) | 40 (20%) | * |
| Sepsis | 44 (11%) | 21 (11%) | 23 (12%) | |
| Respiratory | 98 (25%) | 53 (27%) | 45 (23%) | * |
| Stroke | 31 (8%) | 16 (8%) | 15 (8%) | |
| Cardiac | 66 (17%) | 37 (19%) | 29 (15%) | * |
| Hepatic failure | 9 (2%) | 4 (2%) | 5 (2%) | |
| Surgical | 17 (5%) | 6 (3%) | 11 (5%) | |
| Others | 33 (8%) | 4 (2%) | 29 (15%) | * |
| Team | 0.01 | |||
| Medicine | 155 (39%) | 64 (32%) | 94 (47%) | |
| MICU | 44 (11%) | 3 (2%) | 41 (21%) | * |
| Surgery | 12 (3%) | 9 (5%) | 3 (1%) | |
| Restorative outcomes | ||||
| Mortality/1000 | 27/1000 | 30/1000 | 0.9 | |
| Unexpected ICU transfers/1000 | 17/1000 | 19/1000 | 0.8 | |
| CPR/1000 | 3/1000 | 2.5/1000 | 0.9 | |
Restorative Care Outcomes
Crude, unadjusted, in‐hospital mortality (27 vs. 30/1000 admissions), unexpected transfers to intensive care (17 vs. 19/1000 admissions), or cardiac arrests (3 vs. 2.5/1000 admissions) were similar in pre‐RRT and post‐RRT periods (all P > 0.05).
End‐of‐Life Care
At the time of death, 133 patients (68%) who died during the post‐RRT epoch had comfort care only orders whereas 90 (46%) had these orders in the pre‐RRT group (P = 0.0001; Table 2a). Post‐RRT patients were more likely than pre‐RRT patients to receive opioids prior to death (68% vs. 43%, respectively; P = 0.001) and had lower maximum pain scores in their last 24 hours (3.0 3.5 vs. 3.7 3.2; respectively; P = 0.045). Mention of patient distress by nurses in the hospital record following RRT deployment was less than one‐half of that recorded in the pre‐RRT period (26% vs. 62%; P = 0.0001). A chaplain visited post‐RRT patients in the 24 hours prior to death more frequently than in the pre‐RRT period (72% vs. 60%; P = 0.02). The frequency of family at the bedside was similar between epochs (61% post‐RRT vs. 58% pre‐RRT; P = 0.6). These findings were consistent across common primary diagnoses and origins (home vs. nursing home).
| a. Prior to RRT vs. During RRT Deployment | |||
|---|---|---|---|
| Pre‐RRT (n = 197) | Post‐RRT (n = 197) | P Value | |
| Comfort care only | 90 (46%) | 133 (68%) | 0.0001 |
| Pain score (0‐10) | 3.7 3.3 | 3.0 3.5 | 0.045 |
| Opioids administered | 84 (43%) | 134 (68%) | 0.0001 |
| Subjective suffering | 122 (62%) | 52 (26%) | 0.0001 |
| Family present | 115 (58%) | 120 (61%) | 0.6 |
| Chaplain present | 119 (60%) | 142 (72%) | 0.02 |
| b. During RRT Deployment: Those Dying with RRT Assessment vs. Those Dying Without | |||
| Post‐RRT RRT Care (n = 61) | Post‐RRT No RRT Care (n = 136) | P Value | |
| Comfort care only | 46 (75%) | 87 (64%) | 0.1 |
| Pain score (0‐10) | 3.0 3.5 | 3.0 3.5 | 0.9 |
| Opioids administered | 42 (69%) | 92 (67%) | 0.8 |
| Subjective suffering | 18 (29%) | 34 (25%) | 0.9 |
| Family present | 43 (71%) | 77 (57%) | 0.06 |
| Chaplain present | 49 (80%) | 93 (68%) | 0.0001 |
| c. Comparing Before and During RRT Deployment: Those Dying Without RRT Assessment | |||
| Pre‐RRT (n = 197) | Post‐RRT No RRT Care (n = 136) | P Value | |
| Comfort care (only) | 90 (46%) | 87 (64%) | 0.0001 |
| Pain score (0‐10) | 3.7 3.3 | 3.0 3.5 | 0.06 |
| Opioids administered | 84 (43%) | 92 (67%) | 0.0001 |
| Subjective suffering | 122 (62%) | 34 (25%) | 0.0001 |
| Family present | 115 (58%) | 77 (56.6%) | 0.8 |
| Chaplain present | 119 (60) | 74 (54.4%) | 0.2 |
Adjusting for age, gender, and race, the odds ratio (OR) of patients receiving formal end‐of‐life medical orders in post‐RRT was 2.5 that of pre‐RRT (95% confidence interval [CI], 1.7‐3.8), and odds of receiving opioids prior to death were nearly 3 times pre‐RRT (OR, 2.8; 95% CI, 1.9‐4.3). The odds of written mention of post‐RRT patients' suffering in the medical record was less than one‐fourth that of pre‐RRT patients (OR, 0.23; 95% CI, 0.2‐0.4).
To examine whether temporal trends might account for observed differences, patients in the post‐RRT period who received RRT care were compared to those who did not. Sixty‐one patients died with RRT assessments, whereas 136 died without RRT evaluations. End‐of‐life care outcomes were similar for these 2 groups, except more patients with RRT care had chaplain visits proximate to the time of death (80% vs. 68%; P = 0.0001; Table 2b). Outcomes (including comfort care orders, opioid administration, and suffering) of dying patients not cared for by the RRT (after deployment) were superior to those of pre‐RRT dying patients (Table 2c).
Discussion
This pilot study hypothesizes that our RRT impacted patients' QOD. Deployment of the RRT in our hospital was associated with improvement in both symptom and psychospiritual domains of care. Theoretically, RRTs should improve quality‐of‐care via early identification/reversal of physiologic decompensation. By either reversing acute diatheses with an expeditious trial of therapy or failing to reverse with early actuation of palliative therapies, the duration and magnitude of human suffering should be reduced. Attenuation of both duration and magnitude of suffering is the ultimate goal of both restorative and palliative care and is as important an outcome as mortality or length of stay. Previous studies of RRTs have focused on efficacy in reversing the decompensation: preventing cardiopulmonary arrest, avoiding the need for invasive, expensive, labor‐intensive interventions. Our RRT, like others, had no demonstrable impact on restorative outcomes. However, deployment of the RRT was highly associated with improved QOD of our patients. The impact was significant across WHO‐specified domains: pain scores decreased by 19%; (documentation of) patients' distress decreased by 50%; and chaplains' visits were more often documented in the 24 hours prior to death. These relationships held across common disease diagnoses, so the association is unlikely to be spurious.
Outcomes were similarly improved in patients who did not receive RRT care in the post‐RRT epoch. Our hospital did not have a palliative care service in either time period. No new educational efforts among physicians or nurses accounted for this observation. While it is possible that temporal effects accounted for our observation, an equally plausible explanation is that staff observed RRT interventions and applied them to dying patients not seen by the RRT. Our hospital educated caregivers regarding the RRT triggers, and simply making hospital personnel more vigilant for signs of suffering and/or observing the RRT approach may have contributed to enhanced end‐of‐life care for non‐RRT patients.
There are a number of limitations in this study. First, the sample size was relatively small compared to other published studies,2‐11 promoting the possibility that either epoch was not representative of pre‐RRT and post‐RRT parent populations. Another weakness is that QOD was measured using surrogate endpoints. The dead cannot be interviewed to definitively examine QOD; indices of cardiopulmonary distress and psychosocial measures (eg, religious preparations, family involvement) are endpoints suggested by palliative care investigators12, 13 and the World Health Organization.14 While some validated tools17 and consensus measures18 exist for critically ill patients, they do not readily apply to RRT patients. Retrospective records reviews raise the possibility of bias in extracting objective and subjective data. While we attempted to control for this by creating uniform a priori rules for data acquisition (ie, at what intervals and in which parts of the record they could be extracted), we cannot discount the possibility that bias affected the observed results. Finally, improvements in end‐of‐life care could have resulted from temporal trends. This retrospective study cannot prove a causeeffect relationship; a prospective randomized trial would be required to answer the question definitively. Based on the available data suggesting some benefit in restorative outcomes2‐8 and pressure from federal regulators to deploy RRTs regardless,1 a retrospective cohort design may provide the only realistic means of addressing this question.
In conclusion, this is the first (pilot) study to examine end‐of‐life outcomes associated with deployment of an RRT. While the limitations of these observations preclude firm conclusions, the plausibility of the hypothesis, coupled with our observations, suggests that this is a fertile area for future research. While RRTs may enhance restorative outcomes, to the extent that they hasten identification of candidates for palliative end‐of‐life‐care, before administration of invasive modalities that some patients do not want, these teams may simultaneously serve patients and reduce hospital resource utilization.
Addendum
Prior to publication, a contemporaneous study was published that concluded: These findings suggest that rapid response teams may not be decreasing code rates as much as catalyzing a compassionate dialogue of end‐of‐life care among terminally ill patients. This ability to improve end‐of‐life care may be an important benefit of rapid response teams, particularly given the difficulties in prior trials to increase rates of DNR status among seriously ill inpatients and potential decreases in resource use. Chan PS, Khalid A, Longmore LS, Berg RA, Midhail Kosiborod M, Spertus JA. Hospital‐wide code rates and mortality before and after implementation of a rapid response team. JAMA 2008;300: 25062513.
- Joint Commission on the Accreditation of Healthcare Organizations. The Joint Commission 2007 National Patient Safety Goals. Available at: http://www.jointcommission.org/NR/rdonlyres/BD4D59E0‐6D53‐404C‐8507‐883AF3BBC50A/0/audio_conference_091307.pdf. Accessed February2009.
- ,,, et al.Introducing critical care outreach: a ward‐randomised trial of phased introduction in a general hospital.Intensive Care Med.2004;30:1398–1404.
- ,,, et al.The effect of a MET team on postoperative morbidity and mortality rates.Crit Care Med.2004;32:916–921.
- ,,,,,.Effects of a medical emergency team on reduction of incidence of and mortality from unexpected cardiac arrests in hospital: a preliminary study.BMJ.2002;324:1–5.
- ,,, et al.Long‐term effect of a medical emergency team on mortality in a teaching hospital.Resuscitation.2007;74:235–241.
- ,,, et al.Use of medical emergency team responses to reduce hospital cardiopulmonary arrests.Qual Saf Health Care.2004;13:251–254.
- ,,, et al.Long‐term effect of a rapid response team on cardiac arrests in a teaching hospital.Crit Care.2005;R808–R815.
- ,,, et al.The effect of a rapid response team on major clinical outcome measures in a community teaching hospital.Crit Care Med.2007;35:2076–2082.
- ,,, et al.Introduction of a rapid response team (RRT) system: a cluster‐randomised trail.Lancet.2005;365:2901–2907.
- ,,, et al.Effect of a rapid response team on hospital‐wide mortality and code rates outside the ICU in a children's hospital.JAMA.2007;298:2267–2274.
- ,,,,.The medical emergency team: 12 month analysis of reasons for activation, immediate outcome and not‐for‐resuscitation orders.Resuscitation.2001;50:39–44.
- ,,.Evaluating the quality of dying and death.J Pain Symptom Manage.2001;22:717–726.
- ,.Measuring success of interventions to improve the quality of end‐of‐life care in the intensive care unit.Crit Care Med.2006;34:S341–S347.
- World Health Organization. WHO definition of palliative care. Available at: http://www.who.int/cancer/palliative/definition/en. Accessed February 2009.
- .Does a living will equal a DNR? Are living wills compromising patient safety?J Emerg Med.2007;33:299–305.
- ,,,,,.Quality of dying and death in two medical ICUs.Chest.2005;127:1775–1783.
- ,,,.Using the medical record to evaluate the quality of end‐of‐life care in the intensive care unit.Crit Care Med.2008;36:1138–1146.
- ,,, et al.Proposed quality of measures for palliative care in the critically ill: a consensus from the Robert Wood Johnson Foundation Critical Care Workgroup.Crit Care Med.2006;34:S404–S411.
In 2007, the Joint Commission for Accreditation of Healthcare Organizations (JCAHO) recommended deployment of rapid response teams (RRTs) in U.S. hospitals to hasten identification and treatment of physiologically unstable hospitalized patients.1 Clinical studies that have focused on whether RRTs improve restorative care outcomes, frequency of cardiac arrest, and critical care utilization have yielded mixed results.2‐11 One study suggested that RRTs might provide an opportunity to enhance palliative care of hospitalized patients.11 In this study, RRT personnel felt that prior do‐not‐resuscitate orders would have been appropriate in nearly a quarter of cases. However, no previous study has examined whether the RRT might be deployed to identify acutely decompensating patients who either do not want or would not benefit from a trial of aggressive restorative treatments. We hypothesized that actuation of an RRT in our hospital would expedite identification of patients not likely to benefit from restorative care and would promote more timely commencement of end‐of‐life comfort care, thereby improving their quality of death (QOD).12‐16
Materials and Methods
Study Design and Settings
This retrospective cohort study was approved by the Institutional Review Board (IRB) of and conducted at Bridgeport Hospital, a 425‐bed community teaching hospital. In October 2006, the hospital deployed its RRT, which includes a critical care nurse, respiratory therapist, and second‐year Medicine resident. Nurses on the hospital wards received educational in‐service training instructing them to request an RRT evaluation for: airway incompetence, oxygen desaturation despite fraction of inspired oxygen (FiO2) 60%, respiratory frequency 8 or >30/minute, heart rate 50 or >110/minute, systolic pressure 90 or >180 mmHg, acute significant bleeding, sudden neurologic changes, or patient changes that troubled the nurse. The critical care nurse and respiratory therapist responded to all calls. If assessment suggested a severe problem that required immediate physician supervision, the resident was summoned immediately. Otherwise, the nurse assessed the patient and suggested to the patient's primary doctor of record a trial of therapies. If ratified, the therapies were provided by the nurse and respiratory therapist until symptoms/signs resolved or failed to improve, in which case the resident‐physician was summoned. The resident‐physician would assess, attempt further relieving therapies, and, if appropriate, arrange for transfer to critical care units (in which case the case was presented to the staff intensivist who supervised care) after discussion with the patient and attending physician. No organizational changes in the administration or education of palliative care were implemented during the study period.
Data Extraction and Analysis
All patients dying in the hospital during the first 8 months of RRT activity (October 1, 2006 to May 31, 2007) and during the same months in the year prior to RRT were eligible for the study. Patients were excluded if they died in areas of the hospital not covered by the RRT, such as intensive care units, operating rooms, emergency department, recovery areas, or pediatric floors, or if they had been admitted or transferred to hospital wards with palliative care/end‐of‐life orders.
Physiologic data, including blood pressures (lowest), heart rate (highest), and respiratory rate (highest), were extracted from records of the 48 hours before and until resolution of the RRT assessment, or prior to death for those without RRT care. Outcomes were defined by World Health Organization (WHO) domains of palliative care (symptoms, social, and spiritual).14 The symptom domain was measured using patients' pain scores, 24 hours prior to death (0‐10). Subjective reports of healthcare providers recorded in hospital records, including the terms suffering, pain, anxiety, or distress were also extracted from notes 24 hours prior to patients' deaths. Administration of opioids in the 24 hours prior to death was also recorded. Social and spiritual domains were measured by documentation of presence of the family and chaplain, respectively, at the bedside in the 24 hours prior to death.
Analysis was performed using SPSS software (SPSS Inc., Chicago, IL). Categorical variables, described as proportions, were compared with chi‐square tests. Continuous variables are reported as means standard errors, or as medians with the interquartile ranges. Means were compared using Student t test if a normal distribution was detected. Nonparametric variables were compared with Wilcoxon rank sum tests. To adjust for confounding and assess possible effect modification, multiple logistic regression, multiple linear regression, and stratified analyses were performed when appropriate. Domains of the QOD were compared between patients who died in the pre‐RRT and post‐RRT epochs. Patients who died on hospital wards without RRT evaluation in the post‐RRT epoch were compared to those who died following RRT care. Unadjusted in‐hospital mortality, frequency of cardiopulmonary resuscitation, frequency of transfer from wards to critical care, and QOD were compiled and compared. A P value of 0.05 was considered statistically significant.
Results
A total of 394 patients died on the hospital wards and were not admitted with palliative, end‐of‐life medical therapies. The combined (pre‐RRT and post‐RRT epochs) cohort had a mean age of 77.2 13.2 years. A total of 48% were male, 79% White, 12% Black, and 8% Hispanic. A total of 128 patients (33%) were admitted to the hospital from a skilled nursing facility and 135 (35%) had written advance directives.
A total of 197 patients met the inclusion criteria during the pre‐RRT (October 1, 2005 to May 31, 2006) and 197 during the post‐RRT epochs (October 1, 2006 to May 31, 2007). There were no differences in age, sex, advance directives, ethnicity, or religion between the groups (Table 1). Primary admission diagnoses were significantly different; pre‐RRT patients were 9% more likely to die with malignancy compared to post‐RRT patients and less likely to come from nursing homes (38% vs. 27%; P = 0.02).
| Total | Pre‐RRT | Post‐RRT | P value | |
|---|---|---|---|---|
| ||||
| Total admissions | 25,943 | 12,926 | 13,017 | |
| Number of deaths | 394 | 197 | 197 | NS |
| Age (years) | 77.5 13.2 | 77.1 13.36 | 77.9 13.13 | 0.5 |
| Male gender | 190 (48%) | 99 (51%) | 91 (46%) | 0.4 |
| From SNF | 128 (32%) | 54 (27%) | 74 (38%) | 0.02 |
| Living will | 135 (34%) | 66 (33%) | 69 (35%) | 0.8 |
| Race | 0.3 | |||
| White | 314 (80%) | 163 (83%) | 151 (77%) | |
| Hispanic | 32 (8%) | 14 (7%) | 18 (9%) | |
| Black | 47 (12%) | 19 (10%) | 28 (14%) | |
| Other | 1 (1%) | 1 (1%) | 0 | |
| Religion (%) | 0.8 | |||
| Christian | 357 (91%) | 177 (90%) | 180 (91%) | |
| Non‐Christian | 37 (9%) | 20 (10%) | 17 (9%) | |
| Admission diagnosis | 0.01 | |||
| Malignancy | 96 (24%) | 56 (28%) | 40 (20%) | * |
| Sepsis | 44 (11%) | 21 (11%) | 23 (12%) | |
| Respiratory | 98 (25%) | 53 (27%) | 45 (23%) | * |
| Stroke | 31 (8%) | 16 (8%) | 15 (8%) | |
| Cardiac | 66 (17%) | 37 (19%) | 29 (15%) | * |
| Hepatic failure | 9 (2%) | 4 (2%) | 5 (2%) | |
| Surgical | 17 (5%) | 6 (3%) | 11 (5%) | |
| Others | 33 (8%) | 4 (2%) | 29 (15%) | * |
| Team | 0.01 | |||
| Medicine | 155 (39%) | 64 (32%) | 94 (47%) | |
| MICU | 44 (11%) | 3 (2%) | 41 (21%) | * |
| Surgery | 12 (3%) | 9 (5%) | 3 (1%) | |
| Restorative outcomes | ||||
| Mortality/1000 | 27/1000 | 30/1000 | 0.9 | |
| Unexpected ICU transfers/1000 | 17/1000 | 19/1000 | 0.8 | |
| CPR/1000 | 3/1000 | 2.5/1000 | 0.9 | |
Restorative Care Outcomes
Crude, unadjusted, in‐hospital mortality (27 vs. 30/1000 admissions), unexpected transfers to intensive care (17 vs. 19/1000 admissions), or cardiac arrests (3 vs. 2.5/1000 admissions) were similar in pre‐RRT and post‐RRT periods (all P > 0.05).
End‐of‐Life Care
At the time of death, 133 patients (68%) who died during the post‐RRT epoch had comfort care only orders whereas 90 (46%) had these orders in the pre‐RRT group (P = 0.0001; Table 2a). Post‐RRT patients were more likely than pre‐RRT patients to receive opioids prior to death (68% vs. 43%, respectively; P = 0.001) and had lower maximum pain scores in their last 24 hours (3.0 3.5 vs. 3.7 3.2; respectively; P = 0.045). Mention of patient distress by nurses in the hospital record following RRT deployment was less than one‐half of that recorded in the pre‐RRT period (26% vs. 62%; P = 0.0001). A chaplain visited post‐RRT patients in the 24 hours prior to death more frequently than in the pre‐RRT period (72% vs. 60%; P = 0.02). The frequency of family at the bedside was similar between epochs (61% post‐RRT vs. 58% pre‐RRT; P = 0.6). These findings were consistent across common primary diagnoses and origins (home vs. nursing home).
| a. Prior to RRT vs. During RRT Deployment | |||
|---|---|---|---|
| Pre‐RRT (n = 197) | Post‐RRT (n = 197) | P Value | |
| Comfort care only | 90 (46%) | 133 (68%) | 0.0001 |
| Pain score (0‐10) | 3.7 3.3 | 3.0 3.5 | 0.045 |
| Opioids administered | 84 (43%) | 134 (68%) | 0.0001 |
| Subjective suffering | 122 (62%) | 52 (26%) | 0.0001 |
| Family present | 115 (58%) | 120 (61%) | 0.6 |
| Chaplain present | 119 (60%) | 142 (72%) | 0.02 |
| b. During RRT Deployment: Those Dying with RRT Assessment vs. Those Dying Without | |||
| Post‐RRT RRT Care (n = 61) | Post‐RRT No RRT Care (n = 136) | P Value | |
| Comfort care only | 46 (75%) | 87 (64%) | 0.1 |
| Pain score (0‐10) | 3.0 3.5 | 3.0 3.5 | 0.9 |
| Opioids administered | 42 (69%) | 92 (67%) | 0.8 |
| Subjective suffering | 18 (29%) | 34 (25%) | 0.9 |
| Family present | 43 (71%) | 77 (57%) | 0.06 |
| Chaplain present | 49 (80%) | 93 (68%) | 0.0001 |
| c. Comparing Before and During RRT Deployment: Those Dying Without RRT Assessment | |||
| Pre‐RRT (n = 197) | Post‐RRT No RRT Care (n = 136) | P Value | |
| Comfort care (only) | 90 (46%) | 87 (64%) | 0.0001 |
| Pain score (0‐10) | 3.7 3.3 | 3.0 3.5 | 0.06 |
| Opioids administered | 84 (43%) | 92 (67%) | 0.0001 |
| Subjective suffering | 122 (62%) | 34 (25%) | 0.0001 |
| Family present | 115 (58%) | 77 (56.6%) | 0.8 |
| Chaplain present | 119 (60) | 74 (54.4%) | 0.2 |
Adjusting for age, gender, and race, the odds ratio (OR) of patients receiving formal end‐of‐life medical orders in post‐RRT was 2.5 that of pre‐RRT (95% confidence interval [CI], 1.7‐3.8), and odds of receiving opioids prior to death were nearly 3 times pre‐RRT (OR, 2.8; 95% CI, 1.9‐4.3). The odds of written mention of post‐RRT patients' suffering in the medical record was less than one‐fourth that of pre‐RRT patients (OR, 0.23; 95% CI, 0.2‐0.4).
To examine whether temporal trends might account for observed differences, patients in the post‐RRT period who received RRT care were compared to those who did not. Sixty‐one patients died with RRT assessments, whereas 136 died without RRT evaluations. End‐of‐life care outcomes were similar for these 2 groups, except more patients with RRT care had chaplain visits proximate to the time of death (80% vs. 68%; P = 0.0001; Table 2b). Outcomes (including comfort care orders, opioid administration, and suffering) of dying patients not cared for by the RRT (after deployment) were superior to those of pre‐RRT dying patients (Table 2c).
Discussion
This pilot study hypothesizes that our RRT impacted patients' QOD. Deployment of the RRT in our hospital was associated with improvement in both symptom and psychospiritual domains of care. Theoretically, RRTs should improve quality‐of‐care via early identification/reversal of physiologic decompensation. By either reversing acute diatheses with an expeditious trial of therapy or failing to reverse with early actuation of palliative therapies, the duration and magnitude of human suffering should be reduced. Attenuation of both duration and magnitude of suffering is the ultimate goal of both restorative and palliative care and is as important an outcome as mortality or length of stay. Previous studies of RRTs have focused on efficacy in reversing the decompensation: preventing cardiopulmonary arrest, avoiding the need for invasive, expensive, labor‐intensive interventions. Our RRT, like others, had no demonstrable impact on restorative outcomes. However, deployment of the RRT was highly associated with improved QOD of our patients. The impact was significant across WHO‐specified domains: pain scores decreased by 19%; (documentation of) patients' distress decreased by 50%; and chaplains' visits were more often documented in the 24 hours prior to death. These relationships held across common disease diagnoses, so the association is unlikely to be spurious.
Outcomes were similarly improved in patients who did not receive RRT care in the post‐RRT epoch. Our hospital did not have a palliative care service in either time period. No new educational efforts among physicians or nurses accounted for this observation. While it is possible that temporal effects accounted for our observation, an equally plausible explanation is that staff observed RRT interventions and applied them to dying patients not seen by the RRT. Our hospital educated caregivers regarding the RRT triggers, and simply making hospital personnel more vigilant for signs of suffering and/or observing the RRT approach may have contributed to enhanced end‐of‐life care for non‐RRT patients.
There are a number of limitations in this study. First, the sample size was relatively small compared to other published studies,2‐11 promoting the possibility that either epoch was not representative of pre‐RRT and post‐RRT parent populations. Another weakness is that QOD was measured using surrogate endpoints. The dead cannot be interviewed to definitively examine QOD; indices of cardiopulmonary distress and psychosocial measures (eg, religious preparations, family involvement) are endpoints suggested by palliative care investigators12, 13 and the World Health Organization.14 While some validated tools17 and consensus measures18 exist for critically ill patients, they do not readily apply to RRT patients. Retrospective records reviews raise the possibility of bias in extracting objective and subjective data. While we attempted to control for this by creating uniform a priori rules for data acquisition (ie, at what intervals and in which parts of the record they could be extracted), we cannot discount the possibility that bias affected the observed results. Finally, improvements in end‐of‐life care could have resulted from temporal trends. This retrospective study cannot prove a causeeffect relationship; a prospective randomized trial would be required to answer the question definitively. Based on the available data suggesting some benefit in restorative outcomes2‐8 and pressure from federal regulators to deploy RRTs regardless,1 a retrospective cohort design may provide the only realistic means of addressing this question.
In conclusion, this is the first (pilot) study to examine end‐of‐life outcomes associated with deployment of an RRT. While the limitations of these observations preclude firm conclusions, the plausibility of the hypothesis, coupled with our observations, suggests that this is a fertile area for future research. While RRTs may enhance restorative outcomes, to the extent that they hasten identification of candidates for palliative end‐of‐life‐care, before administration of invasive modalities that some patients do not want, these teams may simultaneously serve patients and reduce hospital resource utilization.
Addendum
Prior to publication, a contemporaneous study was published that concluded: These findings suggest that rapid response teams may not be decreasing code rates as much as catalyzing a compassionate dialogue of end‐of‐life care among terminally ill patients. This ability to improve end‐of‐life care may be an important benefit of rapid response teams, particularly given the difficulties in prior trials to increase rates of DNR status among seriously ill inpatients and potential decreases in resource use. Chan PS, Khalid A, Longmore LS, Berg RA, Midhail Kosiborod M, Spertus JA. Hospital‐wide code rates and mortality before and after implementation of a rapid response team. JAMA 2008;300: 25062513.
- Joint Commission on the Accreditation of Healthcare Organizations. The Joint Commission 2007 National Patient Safety Goals. Available at: http://www.jointcommission.org/NR/rdonlyres/BD4D59E0‐6D53‐404C‐8507‐883AF3BBC50A/0/audio_conference_091307.pdf. Accessed February2009.
- ,,, et al.Introducing critical care outreach: a ward‐randomised trial of phased introduction in a general hospital.Intensive Care Med.2004;30:1398–1404.
- ,,, et al.The effect of a MET team on postoperative morbidity and mortality rates.Crit Care Med.2004;32:916–921.
- ,,,,,.Effects of a medical emergency team on reduction of incidence of and mortality from unexpected cardiac arrests in hospital: a preliminary study.BMJ.2002;324:1–5.
- ,,, et al.Long‐term effect of a medical emergency team on mortality in a teaching hospital.Resuscitation.2007;74:235–241.
- ,,, et al.Use of medical emergency team responses to reduce hospital cardiopulmonary arrests.Qual Saf Health Care.2004;13:251–254.
- ,,, et al.Long‐term effect of a rapid response team on cardiac arrests in a teaching hospital.Crit Care.2005;R808–R815.
- ,,, et al.The effect of a rapid response team on major clinical outcome measures in a community teaching hospital.Crit Care Med.2007;35:2076–2082.
- ,,, et al.Introduction of a rapid response team (RRT) system: a cluster‐randomised trail.Lancet.2005;365:2901–2907.
- ,,, et al.Effect of a rapid response team on hospital‐wide mortality and code rates outside the ICU in a children's hospital.JAMA.2007;298:2267–2274.
- ,,,,.The medical emergency team: 12 month analysis of reasons for activation, immediate outcome and not‐for‐resuscitation orders.Resuscitation.2001;50:39–44.
- ,,.Evaluating the quality of dying and death.J Pain Symptom Manage.2001;22:717–726.
- ,.Measuring success of interventions to improve the quality of end‐of‐life care in the intensive care unit.Crit Care Med.2006;34:S341–S347.
- World Health Organization. WHO definition of palliative care. Available at: http://www.who.int/cancer/palliative/definition/en. Accessed February 2009.
- .Does a living will equal a DNR? Are living wills compromising patient safety?J Emerg Med.2007;33:299–305.
- ,,,,,.Quality of dying and death in two medical ICUs.Chest.2005;127:1775–1783.
- ,,,.Using the medical record to evaluate the quality of end‐of‐life care in the intensive care unit.Crit Care Med.2008;36:1138–1146.
- ,,, et al.Proposed quality of measures for palliative care in the critically ill: a consensus from the Robert Wood Johnson Foundation Critical Care Workgroup.Crit Care Med.2006;34:S404–S411.
Pleural Effusion with IFNα for HCV
Case Report
A 52‐year‐old woman with chronic hepatitis C was admitted with complaints of dry cough, shortness of breath, and fever. Four days prior to admission, she had successfully finished a 44‐week course of pegylated interferon (IFN) alpha and ribavirin with undetectable viral load on completion of treatment. At 30 weeks, she had developed a dry cough, which she initially ignored. Three weeks later, as a result of a violent coughing episode, she sustained a spontaneous uncomplicated fracture of the left sixth rib. Chest x‐ray at that time did not show an infiltrate or opacity. She continued treatment, and over the next 6 weeks developed progressive dyspnea on exertion. Five days prior to admission, she had developed fever of 101F. Repeat chest x‐ray revealed a left lingular infiltrate and she was prescribed levofloxacin. Her symptoms failed to improve and she was admitted to the hospital.
On admission, she denied expectoration, sore throat, night sweats, or rashes. She also denied tobacco use, pets at home, or recent travel outside the Midwest. Examination revealed a temperature of 99.4F and decreased breath sounds over the left lower chest. Chest x‐ray revealed left‐sided pleural effusion. D‐dimer was negative. Computed tomography (CT) scan of the chest showed a left lingular infiltrate, right lower lobe ground‐glass opacity, and a moderately‐sized left pleural effusion. Azithromycin, piperacillin/tazobactam, and vancomycin were empirically started. Over the next 36 hours, she became increasingly tachypneic and short of breath. A diagnostic and therapeutic thoracentesis with aspiration of 800 mL of light‐yellow‐colored fluid brought symptomatic relief. Pleural fluid analysis revealed an exudative effusion with 3.8 gm/dL of protein (serum protein = 6.2 gm/dL), lactic dehydrogenase (LDH) of 998 IU/L (serum LDH = 293 IU/L), and normal adenosine deaminase. The cell count was 362 per mm3 with 37% lymphocytes, 32% macrophages, 26% neutrophils, and 1% eosinophils. There were no atypical or malignant cells. Bacterial, fungal, viral, acid‐fast stains and cultures, and polymerase chain reaction (PCR) for Mycobacterium tuberculosis were all negative. An echocardiogram and plasma B‐type natriuretic peptide were normal.
Serum antinuclear and antineutrophilic cytoplasmic antibodies, Bordetella pertussis PCR, serologies for Mycoplasma, Chlamydia, Coxiella, and urinary antigens for Legionella and Blastomyces were all negative. Bronchoscopy with bronchoalveolar lavage (BAL) was performed on hospital day 5. BAL stains and cultures for bacteria, fungi, acid‐fast organisms, Cytomegalovirus, Herpes simplex virus, Legionella, and Pneumocystis were negative. Cytology revealed mild acute inflammation with macrophage predominance and no malignant cells.
Repeat CT scan of the chest on day 6 showed bilateral ground‐glass infiltrates and persistent left pleural effusion (Figure 1). In the absence of an identifiable cause, the patient was diagnosed with interstitial pneumonitis and pleural effusion secondary to pegylated IFN alpha and ribavirin. Treatment with steroids was considered, but was not used due to recent successful suppression of hepatitis C. She was discharged with continued close follow‐up. Her fever gradually subsided over the next 2 weeks and her cough continued to improve over the next 6 weeks. Follow‐up CT scan of the chest 3 months after discharge showed complete resolution of the left pleural effusion and near‐resolution of the bilateral basal infiltrates.
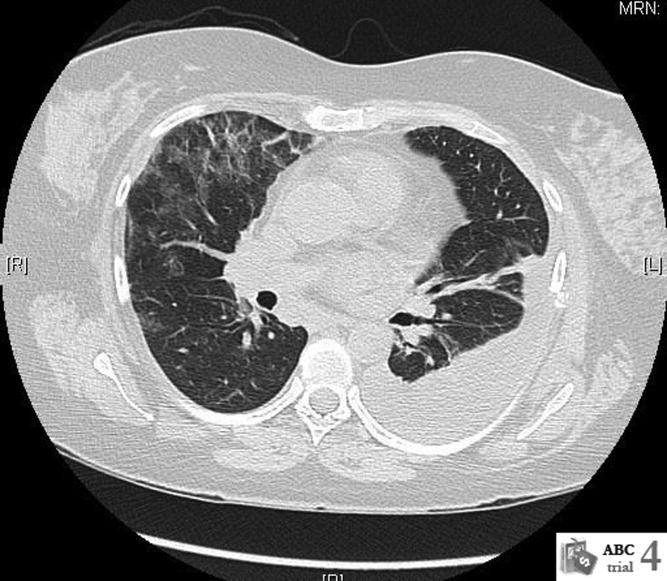
Discussion
Use of IFN alpha has been associated with multiple forms of lung toxicity, of which interstitial pneumonitis and granulomatous inflammation resembling sarcoidosis are the most common. Unusual forms include isolated nonproductive cough, exacerbation of asthma, organizing pneumonia, pleural effusion, adult respiratory distress syndrome, and exacerbation of vasculitis.1 Reports of adverse pulmonary effects of ribavirin are sparse, and it has not been implicated as a sole etiologic agent in causing lung toxicity. It is therefore likely that pulmonary toxicity observed in patients with hepatitis C virus (HCV) infection undergoing IFN alpha and ribavirin therapy is due to the IFN.
Pleural effusion may accompany the IFN‐induced capillary leak syndrome.2
There have been only 2 other cases of pleural effusion during treatment with IFN alpha described to date.3, 4 Takeda et al.3 described a 54‐year‐old male who was accidentally detected to have a moderate‐sized right pleural effusion on magnetic resonance imaging (MRI) of the abdomen, 14 days after therapy with recombinant IFN alpha was initiated. The pleural fluid was a lymphocyte‐predominant exudate and resolved approximately 4 months after discontinuation of IFN treatment. Tsushima et al.4 reported bilateral pleural effusions and ground‐glass opacities in a patient treated with IFN for metastatic renal cell cancer that resolved following a course of steroids.
IFN‐related pulmonary toxicity has been reported to typically develop between 2 and 16 weeks of treatment. Our patient had a delayed onset of symptoms at 30 weeks and progressed on to develop left pleural effusion and pulmonary infiltrates by the time she finished 44 weeks of treatment. We ruled out infectious, malignant, cardiac, and autoimmune causes, which often present in a similar fashion.
BAL fluid cytology in our patient revealed predominant macrophages. Yamaguchi et al., in their analysis of BAL fluid in patients with hepatitis C, demonstrated increased macrophages (76% and 77.5%) and lymphocytes (19.8% and 18.8%) before and after treatment with IFN alpha, respectively.
The cornerstone of management of lung toxicity due to IFN is to diminish or stop use of the offending agent. Our patient demonstrated complete recovery of symptoms and radiological resolution within 3 months of completion of IFN therapy, without corticosteroid therapy. Although corticosteroid regimes of 6 to 12 months have been used to manage IFN related lung toxicity, most patients recover without them.6 Moreover, corticosteroids have been implicated in the recurrence of hepatitis C.
We believe that our patient's pathology is most consistent with lung and pleural toxicity temporally related to IFN treatment. Through our case report, we bring to attention this infrequent complication, and emphasize its self‐limited course upon withdrawal of the offending agent.
Acknowledgements
The authors thank Dr. Philippe Camus, Hpital Le Bocage, Dijon, France, for his invaluable suggestions and for reviewing this case report prior to submission.
- ,.Groupe d'Etudes de la Pathologie Pulmonaire Iatrogène (GEPPI). Pneumotox Online. The drug‐induced lung diseases. Available at: http://www.pneumotox.com. Accessed February 2009.
- ,,, et al.Fatality and interferon alpha for malignant melanoma.Lancet.1998;352(9138):1443–1444.
- ,,, et al.Pleural effusion during interferon treatment for chronic hepatitis C.Hepatogastroenterology.2000;47(35):1431–1435.
- ,,, et al.A case of renal cell carcinoma complicated with interstitial pneumonitis, complete A‐V block and pleural effusion during interferon‐alpha therapy.Nihon Kokyuki Gakkai Zasshi.2001;39:893–898.
- ,,, et al.Analysis of bronchoalveolar lavage fluid of patients with chronic hepatitis c before and after treatment with interferon alpha.Thorax.1997;52:33–37.
- ,,, et al.Spectrum of pulmonary toxicity associated with the use of interferon therapy for hepatitis C: case report and review of the literature.Clin Infect Dis.2004;39:1724–1729.
Case Report
A 52‐year‐old woman with chronic hepatitis C was admitted with complaints of dry cough, shortness of breath, and fever. Four days prior to admission, she had successfully finished a 44‐week course of pegylated interferon (IFN) alpha and ribavirin with undetectable viral load on completion of treatment. At 30 weeks, she had developed a dry cough, which she initially ignored. Three weeks later, as a result of a violent coughing episode, she sustained a spontaneous uncomplicated fracture of the left sixth rib. Chest x‐ray at that time did not show an infiltrate or opacity. She continued treatment, and over the next 6 weeks developed progressive dyspnea on exertion. Five days prior to admission, she had developed fever of 101F. Repeat chest x‐ray revealed a left lingular infiltrate and she was prescribed levofloxacin. Her symptoms failed to improve and she was admitted to the hospital.
On admission, she denied expectoration, sore throat, night sweats, or rashes. She also denied tobacco use, pets at home, or recent travel outside the Midwest. Examination revealed a temperature of 99.4F and decreased breath sounds over the left lower chest. Chest x‐ray revealed left‐sided pleural effusion. D‐dimer was negative. Computed tomography (CT) scan of the chest showed a left lingular infiltrate, right lower lobe ground‐glass opacity, and a moderately‐sized left pleural effusion. Azithromycin, piperacillin/tazobactam, and vancomycin were empirically started. Over the next 36 hours, she became increasingly tachypneic and short of breath. A diagnostic and therapeutic thoracentesis with aspiration of 800 mL of light‐yellow‐colored fluid brought symptomatic relief. Pleural fluid analysis revealed an exudative effusion with 3.8 gm/dL of protein (serum protein = 6.2 gm/dL), lactic dehydrogenase (LDH) of 998 IU/L (serum LDH = 293 IU/L), and normal adenosine deaminase. The cell count was 362 per mm3 with 37% lymphocytes, 32% macrophages, 26% neutrophils, and 1% eosinophils. There were no atypical or malignant cells. Bacterial, fungal, viral, acid‐fast stains and cultures, and polymerase chain reaction (PCR) for Mycobacterium tuberculosis were all negative. An echocardiogram and plasma B‐type natriuretic peptide were normal.
Serum antinuclear and antineutrophilic cytoplasmic antibodies, Bordetella pertussis PCR, serologies for Mycoplasma, Chlamydia, Coxiella, and urinary antigens for Legionella and Blastomyces were all negative. Bronchoscopy with bronchoalveolar lavage (BAL) was performed on hospital day 5. BAL stains and cultures for bacteria, fungi, acid‐fast organisms, Cytomegalovirus, Herpes simplex virus, Legionella, and Pneumocystis were negative. Cytology revealed mild acute inflammation with macrophage predominance and no malignant cells.
Repeat CT scan of the chest on day 6 showed bilateral ground‐glass infiltrates and persistent left pleural effusion (Figure 1). In the absence of an identifiable cause, the patient was diagnosed with interstitial pneumonitis and pleural effusion secondary to pegylated IFN alpha and ribavirin. Treatment with steroids was considered, but was not used due to recent successful suppression of hepatitis C. She was discharged with continued close follow‐up. Her fever gradually subsided over the next 2 weeks and her cough continued to improve over the next 6 weeks. Follow‐up CT scan of the chest 3 months after discharge showed complete resolution of the left pleural effusion and near‐resolution of the bilateral basal infiltrates.
Discussion
Use of IFN alpha has been associated with multiple forms of lung toxicity, of which interstitial pneumonitis and granulomatous inflammation resembling sarcoidosis are the most common. Unusual forms include isolated nonproductive cough, exacerbation of asthma, organizing pneumonia, pleural effusion, adult respiratory distress syndrome, and exacerbation of vasculitis.1 Reports of adverse pulmonary effects of ribavirin are sparse, and it has not been implicated as a sole etiologic agent in causing lung toxicity. It is therefore likely that pulmonary toxicity observed in patients with hepatitis C virus (HCV) infection undergoing IFN alpha and ribavirin therapy is due to the IFN.
Pleural effusion may accompany the IFN‐induced capillary leak syndrome.2
There have been only 2 other cases of pleural effusion during treatment with IFN alpha described to date.3, 4 Takeda et al.3 described a 54‐year‐old male who was accidentally detected to have a moderate‐sized right pleural effusion on magnetic resonance imaging (MRI) of the abdomen, 14 days after therapy with recombinant IFN alpha was initiated. The pleural fluid was a lymphocyte‐predominant exudate and resolved approximately 4 months after discontinuation of IFN treatment. Tsushima et al.4 reported bilateral pleural effusions and ground‐glass opacities in a patient treated with IFN for metastatic renal cell cancer that resolved following a course of steroids.
IFN‐related pulmonary toxicity has been reported to typically develop between 2 and 16 weeks of treatment. Our patient had a delayed onset of symptoms at 30 weeks and progressed on to develop left pleural effusion and pulmonary infiltrates by the time she finished 44 weeks of treatment. We ruled out infectious, malignant, cardiac, and autoimmune causes, which often present in a similar fashion.
BAL fluid cytology in our patient revealed predominant macrophages. Yamaguchi et al., in their analysis of BAL fluid in patients with hepatitis C, demonstrated increased macrophages (76% and 77.5%) and lymphocytes (19.8% and 18.8%) before and after treatment with IFN alpha, respectively.
The cornerstone of management of lung toxicity due to IFN is to diminish or stop use of the offending agent. Our patient demonstrated complete recovery of symptoms and radiological resolution within 3 months of completion of IFN therapy, without corticosteroid therapy. Although corticosteroid regimes of 6 to 12 months have been used to manage IFN related lung toxicity, most patients recover without them.6 Moreover, corticosteroids have been implicated in the recurrence of hepatitis C.
We believe that our patient's pathology is most consistent with lung and pleural toxicity temporally related to IFN treatment. Through our case report, we bring to attention this infrequent complication, and emphasize its self‐limited course upon withdrawal of the offending agent.
Acknowledgements
The authors thank Dr. Philippe Camus, Hpital Le Bocage, Dijon, France, for his invaluable suggestions and for reviewing this case report prior to submission.
- ,.Groupe d'Etudes de la Pathologie Pulmonaire Iatrogène (GEPPI). Pneumotox Online. The drug‐induced lung diseases. Available at: http://www.pneumotox.com. Accessed February 2009.
- ,,, et al.Fatality and interferon alpha for malignant melanoma.Lancet.1998;352(9138):1443–1444.
- ,,, et al.Pleural effusion during interferon treatment for chronic hepatitis C.Hepatogastroenterology.2000;47(35):1431–1435.
- ,,, et al.A case of renal cell carcinoma complicated with interstitial pneumonitis, complete A‐V block and pleural effusion during interferon‐alpha therapy.Nihon Kokyuki Gakkai Zasshi.2001;39:893–898.
- ,,, et al.Analysis of bronchoalveolar lavage fluid of patients with chronic hepatitis c before and after treatment with interferon alpha.Thorax.1997;52:33–37.
- ,,, et al.Spectrum of pulmonary toxicity associated with the use of interferon therapy for hepatitis C: case report and review of the literature.Clin Infect Dis.2004;39:1724–1729.

Trends in Catheter Ablation for AF
Atrial fibrillation (AF), the most common clinically significant cardiac arrhythmia, affects over 2.3 million people in the United States.1 AF is associated with an increased risk of stroke and heart failure and independently increases the risk of all cause mortality.26 As such, AF confers a staggering healthcare cost burden.7, 8 Pharmacologic treatments to restore sinus rhythm in patients with AF are associated with a considerable relapse rate911 and the development of nonpharmacologic treatments for AF, such as catheter ablation procedures,1214 may be significantly more successful in restoring and maintaining sinus rhythm.15, 16 Despite relatively poor results from early catheter ablation techniques, the practice has evolved and boasts short‐term success rates as high as 73% to 91% depending on the specific type of procedure.17
In light of the success of ablative therapy, this approach, which was once used primarily in younger patients with structurally intact hearts, has been expanded to include more medically complex patients, including elderly patients, those with cardiomyopathy, and those with implanted devices.16, 18 At the same time, catheter ablation is not without complications, with major complications observed in up to 6% of cases,19 and significant costs.20 Moreover, while the most optimistic randomized control data demonstrate the ability of catheter ablation to prevent the recurrence of AF at 1 year,12, 21, 22 long‐term outcome data are lacking, particularly in patients older than 65 years or those with heart failure.17, 23
The encouraging results supporting catheter ablation continue to stimulate the utilization of catheter ablation practices and spur innovations in ablation techniques.24 The American College of Cardiology/American Heart Association/European Society of Cardiology consensus guidelines recommend consideration of ablative therapy in many instances of AF.17 AF is primarily a disease of older adults25 and although most studies have focused on younger individuals,26 it is possible that increasing numbers of older patients are receiving ablation therapy.16 Although single center studies are available,16 there are few data about the characteristics of patients undergoing ablative therapy on a national level. In order to better understand the current use of catheter ablation treatment for AF, we analyzed data from the National Hospital Discharge Survey (NHDS) to explore trends in patient characteristics and rates of ablation procedures in hospitalized patients with AF from the years 1990 to 2005.
Methods
The NHDS is a nationally representative study of hospitalized patients conducted annually by the National Center for Health Statistics,27 which collects data from approximately 270,000 inpatient records using a representative sample of about 500 short‐stay nonfederal hospitals in the United States. Data for each patient are obtained for age, sex, hospital geographic region (Northeast, Midwest, South, West), and hospital bed size, as well as up to 7 diagnostic codes and 4 procedural codes using the International Classification of Diseases, 9th Revision, Clinical Modification (ICD‐9‐CM). Of note, data on race/ethnicity were not consistently coded in the NHDS and are therefore not included in this analysis.
We searched for all patients age 18 years or older who had an ICD‐9‐CM diagnosis of AF (427.31). Of these patients, we then identified those who had a procedure code for nonsurgical ablation of lesions or tissues of the heart via peripherally‐inserted catheter or an endovascular approach (37.34). We also searched for specific ICD‐9‐CM‐coded diagnoses corresponding to higher stroke risk according to the (CHADS2) risk index,28 where 1 point is assigned for congestive heart failure, hypertension, age >75 years, or diabetes mellitus, and 2 points for prior stroke or transient ischemic attack. We calculated a CHADS2 score for each patient.
Statistical Analysis
Ablation rates were calculated as the number of patients with a diagnosis of AF and a code for catheter ablation divided by all patients with AF. The change in ablation rate over time was determined using simple logistic regression. Differences in ablation rates by patient and hospital characteristics were tested using chi‐square tests for categorical variables and t‐tests for continuous variables. All variables that were tested in univariate analysis (age, sex, insurance status, year of procedure, hospital region, hospital bed‐size, and CHADS2 score) were forced into the final multivariable model examining predictors of ablation. The fit of the final model was tested using the Hosmer‐Lemeshow test for goodness‐of‐fit. Nationally representative estimates were calculated from the sample weights provided by the NHDS to account for the complex sampling design of the survey. All analyses were conducted using SAS Version 9.1 (SAS Institute, Inc., Cary, NC).
Results
From 1990 to 2005, we identified 269,471 hospitalizations in the NHDS with a diagnosis of AF, of which 1,144 (0.42%) had a procedure code for catheter ablation. When extrapolated to national estimates, this corresponds to 32 million hospitalizations of patients with AF in the United States during the time period, of which 133,003 underwent ablation. The proportion of patients with AF who had ablation increased significantly over time, from 0.06% in 1990 to 0.79% in 2005 (P < 0.001 for trend; Figure 1).
On univariate analysis, people with AF undergoing ablation were on average younger and more likely to be male than those who did not have ablation (Table 1). The rate of catheter ablation was higher in patients younger than 50 years (1.75%) compared to 0.55% in patients aged 50 to 79 years, and 0.16% in patients aged 80 years or older. However, ablation rates increased significantly in all age groups over time, with no one age group increasing at a significantly faster rate than the others (P value for interaction between age categories and hospitalization year = 0.7; Figure 2). People undergoing ablation tended to have lower CHADS2 stroke risk scores and fewer risk factors for stroke, including heart failure, coronary artery disease, and diabetes mellitus (Table 1).
| Characteristic | Ablation (n = 1,144) | No Ablation (n = 268,327) | P Value |
|---|---|---|---|
| |||
| Age (years), mean (95% CI) | 66.0 (65.2‐66.8) | 75.9 (75.8‐75.9) | <0.001 |
| Male (%) | 56.6 | 43.4 | <0.001 |
| Insurance (%) | <0.001 | ||
| Private | 22.1 | 10.9 | |
| Medicare | 56.5 | 78.2 | |
| Medicaid | 2.2 | 2.5 | |
| Self‐pay | 0.7 | 1.2 | |
| Other/unknown | 18.5 | 7.2 | |
| Region (%) | <0.001 | ||
| West | 14.5 | 11.8 | |
| Midwest | 23.4 | 31.6 | |
| Northeast | 23.7 | 25.4 | |
| South | 39.3 | 31.2 | |
| Hospital bed size (%) | <0.001 | ||
| 6‐99 | 1.2 | 12.7 | |
| 100‐199 | 6.6 | 22.3 | |
| 200‐299 | 17.4 | 23.8 | |
| 300‐499 | 35.5 | 29.3 | |
| 500+ | 39.3 | 12.0 | |
| CHADS2 score, mean (95% CI) | 1.0 (0.9‐1.0) | 1.5 (1.5‐1.5) | <0.001 |
| CHADS2 = 0 (%) | 36.5 | 15.7 | <0.001 |
| Comorbid conditions | |||
| Heart failure (%) | 26.8 | 38.2 | <0.001 |
| Coronary artery disease (%) | 25.4 | 32.7 | <0.001 |
| Hypertension (%) | 30.8 | 29.2 | 0.24 |
| Diabetes mellitus (%) | 11.4 | 14.5 | 0.003 |
| Length of stay (days), mean (95% CI) | 5.1 (4.7‐5.5) | 7.4 (7.3‐7.4) | <0.001 |
| Discharge status (%) | <0.001 | ||
| Home | 88.8 | 58.7 | |
| Short‐term skilled facility | 0.8 | 4.06 | |
| Long‐term skilled facility | 4.0 | 18.3 | |
| Inpatient death | 1.0 | 6.7 | |
| Alive but status unknown | 5.0 | 10.9 | |
People who underwent ablation were more likely to have private insurance as their primary source of payment and less likely to have Medicare (Table 1). Ablation rates were higher among patients with AF hospitalized in the Western and Southern regions of the United States (0.52% and 0.53%, respectively), compared to rates in the Midwest (0.30%) and Northeast (0.40%). Hospital bed‐size was significantly related to the frequency of ablation, with the overall rate of ablation in patients with AF being 0.04% in hospitals with 6 to 99 beds compared to 1.37% in hospitals with at least 500 beds (P < 0.001). Length of stay was shorter in patients with ablations compared to patients without ablation therapy, and patients with ablation were more likely to be discharged home (Table 1). The inpatient mortality rate in patients undergoing ablation was quite low (0.96%).
In multivariate analysis, the likelihood of ablation therapy in a hospitalized patient with AF increased by 15% per year (95% confidence interval [CI], 13%‐16%) over the time period, adjusted for clinical and hospital characteristics. The likelihood of ablation decreased with older age (adjusted odds ratio [aOR], 0.7 [95% CI, 0.6‐0.7] for each decade of age over 50 years) and for each 1‐point increase in CHADS2 score (aOR, 0.7 [95% CI, 0.7‐0.8]). Ablation was significantly more likely to be performed in hospitals with larger bed‐sizes (aOR, 27.4 [95% CI, 16.1‐46.6] comparing bed‐size of 500+ to bed‐size of 6 to 99) and in patients with private insurance (aOR, 1.4 [95% CI, 1.2‐1.6]; Table 2). The goodness‐of‐fit of the model was appropriate, with a nonsignificant Hosmer‐Lemeshow test P value of 0.13.
| Characteristic | Adjusted Odds Ratio (95 % CI) | |
|---|---|---|
| All Patients (n = 269,471) | Subset* (n = 246,402) | |
| ||
| Age (per decade over 50 years) | 0.67 (0.64‐0.71) | 0.69 (0.64‐0.74) |
| Male | 1.0 (0.91‐1.2) | 0.88 (0.75‐1.0) |
| Insurance | ||
| Private | Ref | Ref |
| Not private | 0.73 (0.63‐0.85) | 0.70 (0.58‐0.86) |
| Other/unknown | 0.71 (0.38‐1.4) | 0.93 (0.45‐1.9) |
| Region | ||
| Northeast | Ref | Ref |
| West | 1.4 (1.2‐1.8) | 1.2 (0.95‐1.6) |
| Midwest | 0.84 (0.71‐1.0) | 0.81 (0.65‐1.0) |
| South | 1.3 (1.1‐1.5) | 1.1 (0.94‐1.4) |
| Hospital bed size | ||
| 6‐99 | Ref | Ref |
| 100‐199 | 2.8 (1.6‐4.9) | 5.0 (2.1‐11.5) |
| 200‐299 | 6.8 (4.0‐11.7) | 10.2 (4.5‐21.1) |
| 300‐499 | 11.1 (6.5‐19.0) | 16.6 (7.4‐37.3) |
| 500+ | 26.1 (15.3‐44.5) | 40.2 (17.9‐90.4) |
| CHADS2 score (per point increase) | 0.74 (0.69‐0.79) | 0.77 (0.71‐0.85) |
To account for the possibility that the ablation procedure was not specifically for AF, we performed a subgroup analysis that excluded all patients who also had diagnostic codes for supraventricular or ventricular tachycardias (427.0, 427.1, 427.2, and 427.4), or atrial flutter (427.32). Of the 269,471 hospitalizations with AF, 23,069 (8.6%) had a code for an arrhythmia in addition to AF. When we excluded patients with other arrhythmias, we identified 691 patients who underwent ablation and who only had a diagnosis of AF. An analysis of this subset yielded results similar to the full analysis (Table 2). The likelihood of ablation therapy in this subset of patients with only AF increased by 14% per year (95% CI, 11%‐16%), adjusting for patient age, sex, insurance status, CHADS2 score, hospital region, and hospital bed‐size.
Discussion
The proportion of hospitalized patients with AF who undergo ablation therapy in the United States has been increasing by approximately 15% per year over the last 15 years. Patients receiving ablation therapy are more likely to be younger, have private insurance, and have fewer stroke risk factors. These demographics likely reflect the fact that these ablations are elective procedures that are preferentially performed in healthier, lower‐risk patients. Despite these preferences, the rate of ablation therapy has been increasing significantly across all age groups, even in the oldest patients.
Though limited by relatively short follow‐up data, published studies of ablation therapies for AF show promising results,17, 26 and initial cost analyses suggest possible fiscal benefits of ablation for AF.20 Despite a paucity of randomized clinical trials comparing ablation to pharmacologic rhythm and rate control, studies suggest that quality of life may be significantly improved with ablation as compared to antiarrhythmic drugs.21 This may be because ablation may reduce AF‐related symptoms.12 As ablation becomes more widespread and recommended, physicians, including hospitalists, may be increasingly likely to refer their patients for ablation, even for patient subgroups who were not well‐represented in clinical trial settings.
The inpatient mortality rate in patients undergoing ablation therapy was quite low in our study, although ablation is not without some risk of procedure‐related stroke and other complications.19 An analysis of the compiled studies on ablation for AF estimates that major complication such as cardiac tamponade or thromboembolism occur in as many as 7% of patients.26 Patients are at highest risk for embolic events, such as transient ischemic attacks or ischemic strokes, in the immediate hours to weeks after ablation. An estimated 5% to 25% of patients will develop a new arrhythmia at some point in the postablation period and other complications, including esophageal injury, phrenic nerve injury, groin hematoma, and retroperitoneal bleed, have been observed.26 Increasing comanagement of postablation patients will necessitate that hospitalists understand the potential complications of ablation as well as current strategies for bridging anticoagulation therapy.
Few data are available about the safety and efficacy of catheter ablation for patients over the age of 65 years. In fact, the mean age of patients enrolled in most clinical trials of catheter ablation was younger than 60 years.26, 29 There are also limited data about the long‐term efficacy of ablation therapy in patients with structural heart disease30; despite this, our study shows that a quarter of patients with AF undergoing ablation therapy in the United States have diagnosed heart failure. As always, the optimistic introduction of new technologies to unstudied patient populations carries the risk of unintended harm. Hospitalists are well situated to collect and analyze outcome data for older patients with multiple comorbidities and to provide real‐time monitoring of potential complications.
Few studies have focused on the demographic and comorbid characteristics of patients undergoing ablation for AF on a national level. One study examined characteristics of patients referred to a single academic center for AF ablation from 1999 to 2005 and found that referred patients have, over time, been older (mean age 47 years in 1999 versus 56 years in 2005), have more persistent AF, larger atria, and were more likely to have had a history of cardiomyopathy (0% in 1999 versus 16% in 2006).16 This study also reported that men were consistently more likely to be referred for ablation than women. These results are generally consistent with our findings.
Our study has several limitations. The exact indication and specific type of ablation were not available in the NHDS, and it is possible that the ablation procedure was for an arrhythmia other than AF. However, our analysis of the subset of patients who only had AF as a diagnosis yielded results similar to the full analysis. We were unable to assess specific efficacy or complication data, but mortality was low and patients tended to have short hospital stays. Because the NHDS samples random hospitalizations, it is possible that some patients were overrepresented in the database if they were repeatedly hospitalized in a single year. This could potentially bias our results toward an overestimate of the number of patients who receive ablation.
It remains unclear what proportion of AF ablation procedures occur in the outpatient versus inpatient setting. Inpatient versus outpatient status is not specified in the few single‐center ablation experiences reported in the literature,16 and the few trials reported are not reliable for determining practice in a nonstudy setting. The most recent (2006) Heart Rhythm Society/European Heart Rhythm Association/European Cardiac Arrhythmia Society Expert Consensus Statement on Catheter and Surgical Ablation of AF recommends aggressive anticoagulation in the periprocedure period with either heparin or low‐molecular‐weight heparins, followed by a bridge to warfarin.17 It makes intuitive sense that patients undergoing ablation for AF would be admitted at least overnight to bridge anticoagulation therapy and monitor for complications, but widespread use of low‐molecular‐weight heparin may make hospitalization less necessary. The observation that patients undergoing ablation had shorter hospital stays does not necessarily imply that ablation procedures shorten hospital stays. Rather, the data almost certainly reflect the fact that ablations are mostly elective procedures performed in the setting of planned short‐term admissions.
Our study provides important epidemiologic data about national trends in the use of ablation therapy in hospitalized patients with AF. We find that the rate of catheter ablation in patients with AF has been increasing significantly over time and across all age groups, including the oldest patients. As the proportion of patients with AF who receive ablation therapy continues to increase over time, comprehensive long‐term outcome data and cost‐effectiveness analyses will be important.
- ,,, et al.Prevalence of diagnosed atrial fibrillation in adults: national implications for rhythm management and stroke prevention: the AnTicoagulation and Risk Factors in Atrial Fibrillation (ATRIA) Study.JAMA.2001;285(18):2370–2375.
- Atrial Fibrillation Investigators.Risk factors for stroke and efficacy of antithrombotic therapy in atrial fibrillation. Analysis of pooled data from five randomized controlled trials.Arch Intern Med.1994;154(13):1449–1457.
- ,,,.A population‐based study of the long‐term risks associated with atrial fibrillation: 20‐year follow‐up of the Renfrew/Paisley study.Am J Med.2002;113(5):359–364.
- ,,,,.The natural history of atrial fibrillation: incidence, risk factors, and prognosis in the Manitoba Follow‐Up Study.Am J Med.1995;98(5):476–484.
- ,,, et al.Comparison of carvedilol and metoprolol on clinical outcomes in patients with chronic heart failure in the Carvedilol Or Metoprolol European Trial (COMET): randomized controlled trial.Lancet.2003;362(9377):7–13.
- ,,, et al.Valsartan reduces the incidence of atrial fibrillation in patients with heart failure: results from the Valsartan Heart Failure Trial (Val‐HeFT).Am Heart J.2005;149(3):548–557.
- ,,,,.Impact of atrial fibrillation on mortality, stroke, and medical costs.Arch Intern Med.1998;158(3):229–234.
- ,,, et al.Cost of care distribution in atrial fibrillation patients: the COCAF study.Am Heart J.2004;147(1):121–126.
- ,,,,,.Serial antiarrhythmic drug treatment to maintain sinus rhythm after electrical cardioversion for chronic atrial fibrillation or atrial flutter.Am J Cardiol.1991;68(4):335–341.
- ,,, et al.Amiodarone to prevent recurrence of atrial fibrillation. Canadian Trial of Atrial Fibrillation Investigators.N Engl J Med.2000;342(13):913–920.
- ,,, et al.Chronic atrial fibrillation. Success of serial cardioversion therapy and safety of oral anticoagulation.Arch Intern Med.1996;156(22):2585–2592.
- ,,, et al.Circumferential pulmonary‐vein ablation for chronic atrial fibrillation.N Engl J Med.2006;354(9):934–941.
- ,.Atrial fibrillation: catheter ablation.J Interv Card Electrophysiol.2006;16(1):15–26.
- ,,.Progress in nonpharmacologic therapy of atrial fibrillation.J Cardiovasc Electrophysiol.2003;14(12 Suppl):S296–S309.
- ,,,,,.Survey of physician experience, trends and outcomes with atrial fibrillation ablation.J Interv Card Electrophysiol.2005;12(3):213–220.
- ,,, et al.Characteristics of patients undergoing atrial fibrillation ablation: trends over a seven‐year period 1999–2005.J Cardiovasc Electrophysiol.2007;18(1):23–28.
- ,,, et al.ACC/AHA/ESC 2006 Guidelines for the management of patients with atrial fibrillation: a report of the American College of Cardiology/American Heart Association Task Force on Practice Guidelines and the European Society of Cardiology Committee for Practice Guidelines (Writing Committee to Revise the 2001 Guidelines for the Management of Patients With Atrial Fibrillation): developed in collaboration with the European Heart Rhythm Association and the Heart Rhythm Society.Circulation.2006;114(7):e257–e354.
- ,,, et al.Safety and efficacy of radiofrequency energy catheter ablation of atrial fibrillation in patients with pacemakers and implantable cardiac defibrillators.Heart Rhythm.2005;2(12):1309–1316.
- ,,, et al.Worldwide survey on the methods, efficacy, and safety of catheter ablation for human atrial fibrillation.Circulation.2005;111(9):1100–1105.
- ,,,,,.Cost comparison of catheter ablation and medical therapy in atrial fibrillation.J Cardiovasc Electrophysiol.2007;18(9):907–913.
- ,,, et al.Radiofrequency ablation vs antiarrhythmic drugs as first‐line treatment of symptomatic atrial fibrillation: a randomized trial.JAMA.2005;293(21):2634–2640.
- ,,, et al.A randomized trial of circumferential pulmonary vein ablation versus antiarrhythmic drug therapy in paroxysmal atrial fibrillation: the APAF Study.J Am Coll Cardiol.2006;48(11):2340–2347.
- ,,.Atrial fibrillation in the elderly.Am J Med.2007;120(6):481–487.
- ,,,,,,.Catheter ablation for atrial fibrillation.Circulation.2007;116(13):1515–1523.
- ,,,,,.Prevalence of atrial fibrillation in elderly subjects (the Cardiovascular Health Study).Am J Cardiol.1994;74(3):236–241.
- ,,, et al.HRS/EHRA/ECAS Expert Consensus Statement on catheter and surgical ablation of atrial fibrillation: recommendations for personnel, policy, procedures and follow‐up. A report of the Heart Rhythm Society (HRS) Task Force on Catheter and Surgical Ablation of Atrial Fibrillation. European Heart Rhythm Association (EHRA), European Cardiac Arrhythmia Scoiety (ECAS), American College of Cardiology (ACC), American Heart Association (AHA), Society of Thoracic Surgeons (STS).Heart Rhythm.2007;4(6):816–861.
- U.S. Department of Health and Human Services, Public Health Service, National Center for Health Statistics National Hospital Discharge Survey 1990–2005. Multi‐Year Public‐Use Data File Documentation. Available at: http://www.cdc.gov/nchs/about/major/hdasd/nhds.htm. Accessed December2008.
- ,,,,,.Validation of clinical classification schemes for predicting stroke: results from the National Registry of Atrial Fibrillation.JAMA.2001;285(22):2864–2870.
- ,,,.Clinical outcomes after ablation and pacing therapy for atrial fibrillation: a meta‐analysis.Circulation.2000;101(10):1138–1144.
- ,,, et al.Catheter ablation for atrial fibrillation in congestive heart failure.N Engl J Med.2004;351(23):2373–2383.
Atrial fibrillation (AF), the most common clinically significant cardiac arrhythmia, affects over 2.3 million people in the United States.1 AF is associated with an increased risk of stroke and heart failure and independently increases the risk of all cause mortality.26 As such, AF confers a staggering healthcare cost burden.7, 8 Pharmacologic treatments to restore sinus rhythm in patients with AF are associated with a considerable relapse rate911 and the development of nonpharmacologic treatments for AF, such as catheter ablation procedures,1214 may be significantly more successful in restoring and maintaining sinus rhythm.15, 16 Despite relatively poor results from early catheter ablation techniques, the practice has evolved and boasts short‐term success rates as high as 73% to 91% depending on the specific type of procedure.17
In light of the success of ablative therapy, this approach, which was once used primarily in younger patients with structurally intact hearts, has been expanded to include more medically complex patients, including elderly patients, those with cardiomyopathy, and those with implanted devices.16, 18 At the same time, catheter ablation is not without complications, with major complications observed in up to 6% of cases,19 and significant costs.20 Moreover, while the most optimistic randomized control data demonstrate the ability of catheter ablation to prevent the recurrence of AF at 1 year,12, 21, 22 long‐term outcome data are lacking, particularly in patients older than 65 years or those with heart failure.17, 23
The encouraging results supporting catheter ablation continue to stimulate the utilization of catheter ablation practices and spur innovations in ablation techniques.24 The American College of Cardiology/American Heart Association/European Society of Cardiology consensus guidelines recommend consideration of ablative therapy in many instances of AF.17 AF is primarily a disease of older adults25 and although most studies have focused on younger individuals,26 it is possible that increasing numbers of older patients are receiving ablation therapy.16 Although single center studies are available,16 there are few data about the characteristics of patients undergoing ablative therapy on a national level. In order to better understand the current use of catheter ablation treatment for AF, we analyzed data from the National Hospital Discharge Survey (NHDS) to explore trends in patient characteristics and rates of ablation procedures in hospitalized patients with AF from the years 1990 to 2005.
Methods
The NHDS is a nationally representative study of hospitalized patients conducted annually by the National Center for Health Statistics,27 which collects data from approximately 270,000 inpatient records using a representative sample of about 500 short‐stay nonfederal hospitals in the United States. Data for each patient are obtained for age, sex, hospital geographic region (Northeast, Midwest, South, West), and hospital bed size, as well as up to 7 diagnostic codes and 4 procedural codes using the International Classification of Diseases, 9th Revision, Clinical Modification (ICD‐9‐CM). Of note, data on race/ethnicity were not consistently coded in the NHDS and are therefore not included in this analysis.
We searched for all patients age 18 years or older who had an ICD‐9‐CM diagnosis of AF (427.31). Of these patients, we then identified those who had a procedure code for nonsurgical ablation of lesions or tissues of the heart via peripherally‐inserted catheter or an endovascular approach (37.34). We also searched for specific ICD‐9‐CM‐coded diagnoses corresponding to higher stroke risk according to the (CHADS2) risk index,28 where 1 point is assigned for congestive heart failure, hypertension, age >75 years, or diabetes mellitus, and 2 points for prior stroke or transient ischemic attack. We calculated a CHADS2 score for each patient.
Statistical Analysis
Ablation rates were calculated as the number of patients with a diagnosis of AF and a code for catheter ablation divided by all patients with AF. The change in ablation rate over time was determined using simple logistic regression. Differences in ablation rates by patient and hospital characteristics were tested using chi‐square tests for categorical variables and t‐tests for continuous variables. All variables that were tested in univariate analysis (age, sex, insurance status, year of procedure, hospital region, hospital bed‐size, and CHADS2 score) were forced into the final multivariable model examining predictors of ablation. The fit of the final model was tested using the Hosmer‐Lemeshow test for goodness‐of‐fit. Nationally representative estimates were calculated from the sample weights provided by the NHDS to account for the complex sampling design of the survey. All analyses were conducted using SAS Version 9.1 (SAS Institute, Inc., Cary, NC).
Results
From 1990 to 2005, we identified 269,471 hospitalizations in the NHDS with a diagnosis of AF, of which 1,144 (0.42%) had a procedure code for catheter ablation. When extrapolated to national estimates, this corresponds to 32 million hospitalizations of patients with AF in the United States during the time period, of which 133,003 underwent ablation. The proportion of patients with AF who had ablation increased significantly over time, from 0.06% in 1990 to 0.79% in 2005 (P < 0.001 for trend; Figure 1).
On univariate analysis, people with AF undergoing ablation were on average younger and more likely to be male than those who did not have ablation (Table 1). The rate of catheter ablation was higher in patients younger than 50 years (1.75%) compared to 0.55% in patients aged 50 to 79 years, and 0.16% in patients aged 80 years or older. However, ablation rates increased significantly in all age groups over time, with no one age group increasing at a significantly faster rate than the others (P value for interaction between age categories and hospitalization year = 0.7; Figure 2). People undergoing ablation tended to have lower CHADS2 stroke risk scores and fewer risk factors for stroke, including heart failure, coronary artery disease, and diabetes mellitus (Table 1).
| Characteristic | Ablation (n = 1,144) | No Ablation (n = 268,327) | P Value |
|---|---|---|---|
| |||
| Age (years), mean (95% CI) | 66.0 (65.2‐66.8) | 75.9 (75.8‐75.9) | <0.001 |
| Male (%) | 56.6 | 43.4 | <0.001 |
| Insurance (%) | <0.001 | ||
| Private | 22.1 | 10.9 | |
| Medicare | 56.5 | 78.2 | |
| Medicaid | 2.2 | 2.5 | |
| Self‐pay | 0.7 | 1.2 | |
| Other/unknown | 18.5 | 7.2 | |
| Region (%) | <0.001 | ||
| West | 14.5 | 11.8 | |
| Midwest | 23.4 | 31.6 | |
| Northeast | 23.7 | 25.4 | |
| South | 39.3 | 31.2 | |
| Hospital bed size (%) | <0.001 | ||
| 6‐99 | 1.2 | 12.7 | |
| 100‐199 | 6.6 | 22.3 | |
| 200‐299 | 17.4 | 23.8 | |
| 300‐499 | 35.5 | 29.3 | |
| 500+ | 39.3 | 12.0 | |
| CHADS2 score, mean (95% CI) | 1.0 (0.9‐1.0) | 1.5 (1.5‐1.5) | <0.001 |
| CHADS2 = 0 (%) | 36.5 | 15.7 | <0.001 |
| Comorbid conditions | |||
| Heart failure (%) | 26.8 | 38.2 | <0.001 |
| Coronary artery disease (%) | 25.4 | 32.7 | <0.001 |
| Hypertension (%) | 30.8 | 29.2 | 0.24 |
| Diabetes mellitus (%) | 11.4 | 14.5 | 0.003 |
| Length of stay (days), mean (95% CI) | 5.1 (4.7‐5.5) | 7.4 (7.3‐7.4) | <0.001 |
| Discharge status (%) | <0.001 | ||
| Home | 88.8 | 58.7 | |
| Short‐term skilled facility | 0.8 | 4.06 | |
| Long‐term skilled facility | 4.0 | 18.3 | |
| Inpatient death | 1.0 | 6.7 | |
| Alive but status unknown | 5.0 | 10.9 | |
People who underwent ablation were more likely to have private insurance as their primary source of payment and less likely to have Medicare (Table 1). Ablation rates were higher among patients with AF hospitalized in the Western and Southern regions of the United States (0.52% and 0.53%, respectively), compared to rates in the Midwest (0.30%) and Northeast (0.40%). Hospital bed‐size was significantly related to the frequency of ablation, with the overall rate of ablation in patients with AF being 0.04% in hospitals with 6 to 99 beds compared to 1.37% in hospitals with at least 500 beds (P < 0.001). Length of stay was shorter in patients with ablations compared to patients without ablation therapy, and patients with ablation were more likely to be discharged home (Table 1). The inpatient mortality rate in patients undergoing ablation was quite low (0.96%).
In multivariate analysis, the likelihood of ablation therapy in a hospitalized patient with AF increased by 15% per year (95% confidence interval [CI], 13%‐16%) over the time period, adjusted for clinical and hospital characteristics. The likelihood of ablation decreased with older age (adjusted odds ratio [aOR], 0.7 [95% CI, 0.6‐0.7] for each decade of age over 50 years) and for each 1‐point increase in CHADS2 score (aOR, 0.7 [95% CI, 0.7‐0.8]). Ablation was significantly more likely to be performed in hospitals with larger bed‐sizes (aOR, 27.4 [95% CI, 16.1‐46.6] comparing bed‐size of 500+ to bed‐size of 6 to 99) and in patients with private insurance (aOR, 1.4 [95% CI, 1.2‐1.6]; Table 2). The goodness‐of‐fit of the model was appropriate, with a nonsignificant Hosmer‐Lemeshow test P value of 0.13.
| Characteristic | Adjusted Odds Ratio (95 % CI) | |
|---|---|---|
| All Patients (n = 269,471) | Subset* (n = 246,402) | |
| ||
| Age (per decade over 50 years) | 0.67 (0.64‐0.71) | 0.69 (0.64‐0.74) |
| Male | 1.0 (0.91‐1.2) | 0.88 (0.75‐1.0) |
| Insurance | ||
| Private | Ref | Ref |
| Not private | 0.73 (0.63‐0.85) | 0.70 (0.58‐0.86) |
| Other/unknown | 0.71 (0.38‐1.4) | 0.93 (0.45‐1.9) |
| Region | ||
| Northeast | Ref | Ref |
| West | 1.4 (1.2‐1.8) | 1.2 (0.95‐1.6) |
| Midwest | 0.84 (0.71‐1.0) | 0.81 (0.65‐1.0) |
| South | 1.3 (1.1‐1.5) | 1.1 (0.94‐1.4) |
| Hospital bed size | ||
| 6‐99 | Ref | Ref |
| 100‐199 | 2.8 (1.6‐4.9) | 5.0 (2.1‐11.5) |
| 200‐299 | 6.8 (4.0‐11.7) | 10.2 (4.5‐21.1) |
| 300‐499 | 11.1 (6.5‐19.0) | 16.6 (7.4‐37.3) |
| 500+ | 26.1 (15.3‐44.5) | 40.2 (17.9‐90.4) |
| CHADS2 score (per point increase) | 0.74 (0.69‐0.79) | 0.77 (0.71‐0.85) |
To account for the possibility that the ablation procedure was not specifically for AF, we performed a subgroup analysis that excluded all patients who also had diagnostic codes for supraventricular or ventricular tachycardias (427.0, 427.1, 427.2, and 427.4), or atrial flutter (427.32). Of the 269,471 hospitalizations with AF, 23,069 (8.6%) had a code for an arrhythmia in addition to AF. When we excluded patients with other arrhythmias, we identified 691 patients who underwent ablation and who only had a diagnosis of AF. An analysis of this subset yielded results similar to the full analysis (Table 2). The likelihood of ablation therapy in this subset of patients with only AF increased by 14% per year (95% CI, 11%‐16%), adjusting for patient age, sex, insurance status, CHADS2 score, hospital region, and hospital bed‐size.
Discussion
The proportion of hospitalized patients with AF who undergo ablation therapy in the United States has been increasing by approximately 15% per year over the last 15 years. Patients receiving ablation therapy are more likely to be younger, have private insurance, and have fewer stroke risk factors. These demographics likely reflect the fact that these ablations are elective procedures that are preferentially performed in healthier, lower‐risk patients. Despite these preferences, the rate of ablation therapy has been increasing significantly across all age groups, even in the oldest patients.
Though limited by relatively short follow‐up data, published studies of ablation therapies for AF show promising results,17, 26 and initial cost analyses suggest possible fiscal benefits of ablation for AF.20 Despite a paucity of randomized clinical trials comparing ablation to pharmacologic rhythm and rate control, studies suggest that quality of life may be significantly improved with ablation as compared to antiarrhythmic drugs.21 This may be because ablation may reduce AF‐related symptoms.12 As ablation becomes more widespread and recommended, physicians, including hospitalists, may be increasingly likely to refer their patients for ablation, even for patient subgroups who were not well‐represented in clinical trial settings.
The inpatient mortality rate in patients undergoing ablation therapy was quite low in our study, although ablation is not without some risk of procedure‐related stroke and other complications.19 An analysis of the compiled studies on ablation for AF estimates that major complication such as cardiac tamponade or thromboembolism occur in as many as 7% of patients.26 Patients are at highest risk for embolic events, such as transient ischemic attacks or ischemic strokes, in the immediate hours to weeks after ablation. An estimated 5% to 25% of patients will develop a new arrhythmia at some point in the postablation period and other complications, including esophageal injury, phrenic nerve injury, groin hematoma, and retroperitoneal bleed, have been observed.26 Increasing comanagement of postablation patients will necessitate that hospitalists understand the potential complications of ablation as well as current strategies for bridging anticoagulation therapy.
Few data are available about the safety and efficacy of catheter ablation for patients over the age of 65 years. In fact, the mean age of patients enrolled in most clinical trials of catheter ablation was younger than 60 years.26, 29 There are also limited data about the long‐term efficacy of ablation therapy in patients with structural heart disease30; despite this, our study shows that a quarter of patients with AF undergoing ablation therapy in the United States have diagnosed heart failure. As always, the optimistic introduction of new technologies to unstudied patient populations carries the risk of unintended harm. Hospitalists are well situated to collect and analyze outcome data for older patients with multiple comorbidities and to provide real‐time monitoring of potential complications.
Few studies have focused on the demographic and comorbid characteristics of patients undergoing ablation for AF on a national level. One study examined characteristics of patients referred to a single academic center for AF ablation from 1999 to 2005 and found that referred patients have, over time, been older (mean age 47 years in 1999 versus 56 years in 2005), have more persistent AF, larger atria, and were more likely to have had a history of cardiomyopathy (0% in 1999 versus 16% in 2006).16 This study also reported that men were consistently more likely to be referred for ablation than women. These results are generally consistent with our findings.
Our study has several limitations. The exact indication and specific type of ablation were not available in the NHDS, and it is possible that the ablation procedure was for an arrhythmia other than AF. However, our analysis of the subset of patients who only had AF as a diagnosis yielded results similar to the full analysis. We were unable to assess specific efficacy or complication data, but mortality was low and patients tended to have short hospital stays. Because the NHDS samples random hospitalizations, it is possible that some patients were overrepresented in the database if they were repeatedly hospitalized in a single year. This could potentially bias our results toward an overestimate of the number of patients who receive ablation.
It remains unclear what proportion of AF ablation procedures occur in the outpatient versus inpatient setting. Inpatient versus outpatient status is not specified in the few single‐center ablation experiences reported in the literature,16 and the few trials reported are not reliable for determining practice in a nonstudy setting. The most recent (2006) Heart Rhythm Society/European Heart Rhythm Association/European Cardiac Arrhythmia Society Expert Consensus Statement on Catheter and Surgical Ablation of AF recommends aggressive anticoagulation in the periprocedure period with either heparin or low‐molecular‐weight heparins, followed by a bridge to warfarin.17 It makes intuitive sense that patients undergoing ablation for AF would be admitted at least overnight to bridge anticoagulation therapy and monitor for complications, but widespread use of low‐molecular‐weight heparin may make hospitalization less necessary. The observation that patients undergoing ablation had shorter hospital stays does not necessarily imply that ablation procedures shorten hospital stays. Rather, the data almost certainly reflect the fact that ablations are mostly elective procedures performed in the setting of planned short‐term admissions.
Our study provides important epidemiologic data about national trends in the use of ablation therapy in hospitalized patients with AF. We find that the rate of catheter ablation in patients with AF has been increasing significantly over time and across all age groups, including the oldest patients. As the proportion of patients with AF who receive ablation therapy continues to increase over time, comprehensive long‐term outcome data and cost‐effectiveness analyses will be important.
- ,,, et al.Prevalence of diagnosed atrial fibrillation in adults: national implications for rhythm management and stroke prevention: the AnTicoagulation and Risk Factors in Atrial Fibrillation (ATRIA) Study.JAMA.2001;285(18):2370–2375.
- Atrial Fibrillation Investigators.Risk factors for stroke and efficacy of antithrombotic therapy in atrial fibrillation. Analysis of pooled data from five randomized controlled trials.Arch Intern Med.1994;154(13):1449–1457.
- ,,,.A population‐based study of the long‐term risks associated with atrial fibrillation: 20‐year follow‐up of the Renfrew/Paisley study.Am J Med.2002;113(5):359–364.
- ,,,,.The natural history of atrial fibrillation: incidence, risk factors, and prognosis in the Manitoba Follow‐Up Study.Am J Med.1995;98(5):476–484.
- ,,, et al.Comparison of carvedilol and metoprolol on clinical outcomes in patients with chronic heart failure in the Carvedilol Or Metoprolol European Trial (COMET): randomized controlled trial.Lancet.2003;362(9377):7–13.
- ,,, et al.Valsartan reduces the incidence of atrial fibrillation in patients with heart failure: results from the Valsartan Heart Failure Trial (Val‐HeFT).Am Heart J.2005;149(3):548–557.
- ,,,,.Impact of atrial fibrillation on mortality, stroke, and medical costs.Arch Intern Med.1998;158(3):229–234.
- ,,, et al.Cost of care distribution in atrial fibrillation patients: the COCAF study.Am Heart J.2004;147(1):121–126.
- ,,,,,.Serial antiarrhythmic drug treatment to maintain sinus rhythm after electrical cardioversion for chronic atrial fibrillation or atrial flutter.Am J Cardiol.1991;68(4):335–341.
- ,,, et al.Amiodarone to prevent recurrence of atrial fibrillation. Canadian Trial of Atrial Fibrillation Investigators.N Engl J Med.2000;342(13):913–920.
- ,,, et al.Chronic atrial fibrillation. Success of serial cardioversion therapy and safety of oral anticoagulation.Arch Intern Med.1996;156(22):2585–2592.
- ,,, et al.Circumferential pulmonary‐vein ablation for chronic atrial fibrillation.N Engl J Med.2006;354(9):934–941.
- ,.Atrial fibrillation: catheter ablation.J Interv Card Electrophysiol.2006;16(1):15–26.
- ,,.Progress in nonpharmacologic therapy of atrial fibrillation.J Cardiovasc Electrophysiol.2003;14(12 Suppl):S296–S309.
- ,,,,,.Survey of physician experience, trends and outcomes with atrial fibrillation ablation.J Interv Card Electrophysiol.2005;12(3):213–220.
- ,,, et al.Characteristics of patients undergoing atrial fibrillation ablation: trends over a seven‐year period 1999–2005.J Cardiovasc Electrophysiol.2007;18(1):23–28.
- ,,, et al.ACC/AHA/ESC 2006 Guidelines for the management of patients with atrial fibrillation: a report of the American College of Cardiology/American Heart Association Task Force on Practice Guidelines and the European Society of Cardiology Committee for Practice Guidelines (Writing Committee to Revise the 2001 Guidelines for the Management of Patients With Atrial Fibrillation): developed in collaboration with the European Heart Rhythm Association and the Heart Rhythm Society.Circulation.2006;114(7):e257–e354.
- ,,, et al.Safety and efficacy of radiofrequency energy catheter ablation of atrial fibrillation in patients with pacemakers and implantable cardiac defibrillators.Heart Rhythm.2005;2(12):1309–1316.
- ,,, et al.Worldwide survey on the methods, efficacy, and safety of catheter ablation for human atrial fibrillation.Circulation.2005;111(9):1100–1105.
- ,,,,,.Cost comparison of catheter ablation and medical therapy in atrial fibrillation.J Cardiovasc Electrophysiol.2007;18(9):907–913.
- ,,, et al.Radiofrequency ablation vs antiarrhythmic drugs as first‐line treatment of symptomatic atrial fibrillation: a randomized trial.JAMA.2005;293(21):2634–2640.
- ,,, et al.A randomized trial of circumferential pulmonary vein ablation versus antiarrhythmic drug therapy in paroxysmal atrial fibrillation: the APAF Study.J Am Coll Cardiol.2006;48(11):2340–2347.
- ,,.Atrial fibrillation in the elderly.Am J Med.2007;120(6):481–487.
- ,,,,,,.Catheter ablation for atrial fibrillation.Circulation.2007;116(13):1515–1523.
- ,,,,,.Prevalence of atrial fibrillation in elderly subjects (the Cardiovascular Health Study).Am J Cardiol.1994;74(3):236–241.
- ,,, et al.HRS/EHRA/ECAS Expert Consensus Statement on catheter and surgical ablation of atrial fibrillation: recommendations for personnel, policy, procedures and follow‐up. A report of the Heart Rhythm Society (HRS) Task Force on Catheter and Surgical Ablation of Atrial Fibrillation. European Heart Rhythm Association (EHRA), European Cardiac Arrhythmia Scoiety (ECAS), American College of Cardiology (ACC), American Heart Association (AHA), Society of Thoracic Surgeons (STS).Heart Rhythm.2007;4(6):816–861.
- U.S. Department of Health and Human Services, Public Health Service, National Center for Health Statistics National Hospital Discharge Survey 1990–2005. Multi‐Year Public‐Use Data File Documentation. Available at: http://www.cdc.gov/nchs/about/major/hdasd/nhds.htm. Accessed December2008.
- ,,,,,.Validation of clinical classification schemes for predicting stroke: results from the National Registry of Atrial Fibrillation.JAMA.2001;285(22):2864–2870.
- ,,,.Clinical outcomes after ablation and pacing therapy for atrial fibrillation: a meta‐analysis.Circulation.2000;101(10):1138–1144.
- ,,, et al.Catheter ablation for atrial fibrillation in congestive heart failure.N Engl J Med.2004;351(23):2373–2383.
Copyright © 2009 Society of Hospital Medicine

HbA1c Levels in Spine Surgery
Diabetes mellitus (DM) is a common chronic disease with a long downward course and serious systemic consequences. The percentage of the population with diagnosed diabetes continues to rise. In 2007, more than 246 million people had diabetes worldwide.1 In the United States, the diabetes rate was 5.8% in 2007, and is estimated to rise to 12% by 2050.2, 3 Many factors may contribute to this rise in the prevalence of diabetes, including higher prevalence of overweight and obesity, unhealthy diet, sedentary lifestyle, changes in diagnostic criteria, improved detection methods, decreasing mortality, a growing elderly population, and growth in minority populations with predisposition to diabetes; (ie, African Americans, Hispanics, and Native Americans).1, 4, 5 This is consistent with the thrifty genotype hypothesis, which explains the morbid prevalence of obesity, diabetes, and atherosclerosis‐related complications in modern times.6
The total estimated cost of diabetes in 2007 was $174 billion, including $116 billion in excess medical expenditures ($27 billion for direct diabetes care, $58 billion for treatment of diabetes‐related chronic complications, and $31 billion in excess general medical costs) and $58 billion in reduced national productivity.7 The largest component of medical expenditures that is attributed to diabetes has been hospital inpatient care (50% of total cost).8
Spine surgery is expensive and any factor that influences cost of surgery merits meticulous study, especially with the financial difficulties that the healthcare system is facing. Diabetic patients are known to be more vulnerable to postoperative complications such as fever, wound infection, foot drop, and nonunion than their nondiabetic peers.9‐13 In diabetic spine surgery patients, a negative correlation was reported between the recovery rate and the preoperative glycosylated hemoglobin (HbA1c) level.14 However, the potential impact of undiagnosed diabetes on these variables have not yet been extensively studied. In order to determine the prevalence of explicit DM and undiagnosed elevation of HBA1c among spine surgery patients and its impact on healthcare cost, we conducted the following study.
Patients and Methods
We retrospectively reviewed the charts of 556 spine surgery patients who were operated on between 2005 and 2007 and had 1 of 3 types of surgery: lumbar microdiscectomy (LMD), anterior cervical decompression and fusion (ACDF), and lumbar decompression and fusion (LDF). Information was collected about their diabetes history, HbA1c level, age, race, body mass index (BMI), comorbidities, length of stay (LOS), and total cost (hospital and physician). Due to the high percentage of glucose metabolism disturbance in the population and the many reports of increased postoperative complications related to diabetes, patients are routinely seen by an internist on the preoperative visit and they undergo electrocardiography and laboratory testing, including HbA1c. Hence HbA1c was recorded for 456 patients. We used 6.1% as a screening cutpoint for high HbA1c and classified patients to 4 groups according to their DM‐HbA1c status:15
Those with history of DM and HbA1c 6.1% (DM);
Those without history of DM and HbA1c 6.1% (subclinical HbA1c elevation);
Those with history of DM and HbA1c < 6.1% (well‐controlled DM);
Those without history of DM and HbA1c < 6.1% (no DM).
The second group was our main group of interest (subclinical, previously unknown HbA1c elevation). The third group (patients with well‐controlled DM, which is uncommon) was excluded (n = 14). To prevent confusion in the coming text, mentioning elevation of HbA1c will imply the second group, while the term diabetes will refer to the first group.
We calculated the percentages of nondiabetic patients, those with subclinical HbA1c elevation, and those with already known DM. We computed the mean (m) and standard deviation (SD) for cost, age, and BMI. Using SPSS v.16 (SPSS, Chicago, IL) we applied the analysis of covariance (ANCOVA) to determine the impact of DM‐HbA1c on total healthcare cost after controlling for type of surgery. We used analysis of variance (ANOVA) and post hoc Scheffe test to check for any significant differences in healthcare cost (hospital and surgery costs), age, gender, race, and BMI between the three DM‐HbA1c groups. Finally, we applied regression analysis to figure out significant factors/predictors of total cost in spine surgery patients beside type of surgery.
Results
After excluding the third group, we had 442 spine surgery patients, 26.7% LMD, 49.1% ACDF, and 24.2% LDF. They were 21‐92 years of age (over 60 years old = 41%), and nearly equally divided according to gender (48.2% males). They were mostly Caucasian (78.3% Caucasians and 21% African Americans). There were no Hispanics in the sample, which may be due to the small proportion of the Latino population living in Macon, GA.
Calculations showed that 72.4% of the above patients were nondiabetic, 14.3% were subclinical patients with elevated HbA1c, and 13.3% were already known, confirmed DM patients. Results showed that elevation of HbA1c was highest and diabetes was lowest in the LDF group, 16% and 10%, respectively. On the contrary, elevation of HbA1c was lowest and diabetes was highest in the LMD group, 13% and 20%, respectively (Figure 1).

While analyzing the data, we took into consideration that the main cost‐determining factor was type of surgery (P < 0.001), so the pure impact of the DM‐HbA1c status on total cost was elicited by using ANCOVA and including type of surgery as a covariate. Table 1 shows the total cost for spine surgery patients per type of surgery and DM‐HbA1c status.
| LMD | ACDF | LDF | |||||||
|---|---|---|---|---|---|---|---|---|---|
| No DM | HbA1c | DM | No DM | HbA1c | DM | No DM | HbA1c | DM | |
| |||||||||
| LOS (days) | 2.75 4.318 | 2.48 2.926 | 2.48 1.904 | 1.42 1.984 | 1.43 1.165 | 2.52 3.991 | 4.68 2.509 | 6.96 5.897 | 5.55 3.616 |
| Cost (dollars) | 23115 14608 | 22306 7702 | 23644 7068 | 28363 7673 | 29420 6130 | 36748 31970 | 54914 14034 | 65974 18341 | 61536 14527 |
As evident in Table 1 and confirmed by statistical analysis, DM‐HbA1c status was a very significant determinant (P < 0.01) of total cost. We performed ANOVA in each surgical category to determine the significance of differences in total cost between DM‐HbA1c status groups. There were significant differences in the LDF group between the no DM and subclinical groups (P < 0.05) in terms of cost and LOS, and in the ACDF group between patients without DM and those with already known DM in cost (P < 0.05). Figures 2 and 3 summarize the results mentioned above.
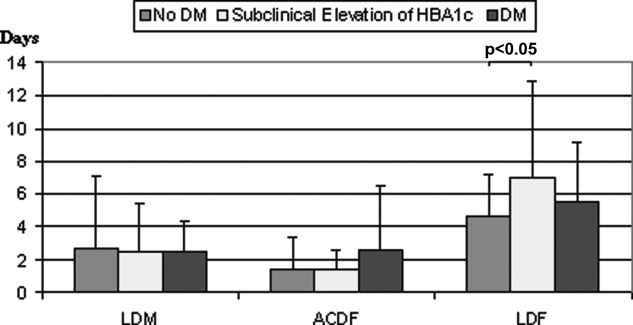
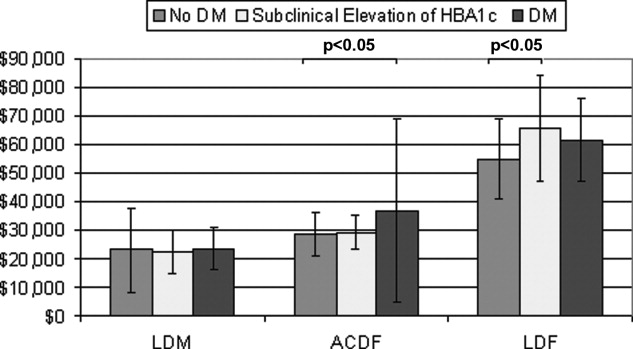
As expected, age (P < 0.001) and BMI (P 0.01) were significantly different between DM‐HbA1c groups. Scheffe test showed significant difference between no DM and DM (P < 0.001) groups and between subclinical and DM groups (P < 0.01) regarding age and between no DM and DM groups (P < 0.05) regarding BMI. There was no difference (P > 0.05) between the three DM‐HbA1c groups regarding type of surgery. The subclinical patients with HbA1c elevation appeared to be as old as nondiabetic patients (P = 0.669) but as heavy as diabetic patients (P = 1.000).
The range of BMI in the sample was 17 to 52 with 36% over 30; (ie, obese) (Table 2). Regression analysis showed that type of surgery, age, and BMI were very significant predictors of total cost in spine surgery patients (P 0.001). In our study, total cost was not dependent on sex or race. Repeating analysis with age, BMI, or both as covariates (ANCOVA) deprives DM‐HbA1c status of statistical significance (P > 0.05).
| LMD | ACDF | LDF | |||||||
|---|---|---|---|---|---|---|---|---|---|
| No DM | HbA1c | DM | No DM | HbA1c | DM | No DM | HbA1c | DM | |
| |||||||||
| Age (years) | 60 14 | 59 11 | 69 9 | 52 10 | 58 9 | 60 10 | 55 13 | 54 10 | 59 7 |
| BMI (kg/m2) | 30 7 | 33 7 | 30 6 | 29 5 | 31 5 | 32 5 | 30 6 | 33 9 | 36 9 |
Concerning comorbidities that could affect HbA1c level, only 1.4% of patients had a history of advanced or chronic renal disease and none had hemoglobinopathy.
Discussion
According to the Centers for Disease Control and Prevention (CDC), approximately 54 million people in the United States have prediabetes and nearly 21 million have diabetes.3 This places almost 25% of the population at risk for diabetic complications. Prediabetes is a term used to distinguish people who are at increased risk of developing diabetes. People with prediabetes have impaired fasting glucose (100‐125 mg/dL), impaired glucose tolerance (140‐199 mg/dL at 2 hours), or both.16 The actual national burden of diabetes most likely exceeds the $174 billion estimate because of excess medical costs associated with prediabetic patients.
Due to the impracticality of the 2 tests mentioned above as screening methods for diabetes and prediabetes, we used HbA1c to screen for glucose metabolism disturbance. This marker does not need overnight fasting or a 2‐hour glucose loading test. The HbA1c level gives an average of glycemic control over the previous 120 days, as red blood cells have a lifespan of 120 days. Although the use of HbA1c for the diagnosis of diabetes is not yet established, its availability at the time when the patient is seen (point‐of‐care testing) is a great advantage over fasting glucose and glucose tolerance tests.17, 18 The normal range for a person without diabetes is 4.3% to 5.9%.19 For most people with diabetes the American Diabetes Association recommends targeting an HbA1c of 7% or less. If HbA1c is 8% or higher, it means that the patient's blood glucose is not well‐controlled and he/she is at increased risk for developing diabetic complications. In this case, the patient needs modifications in his/her diet, physical activity, oral hypoglycemic medications, or insulin. It is uncommon to have patients with a history of diabetes and HbA1c < 6.1%. Our patient sample confirms this fact (n = 14). Therefore, it was not included in the statistical analysis.
The cutpoint 6.1% (2 SD above the mean) was the recommended cutoff point for HbA1c in most reviewed studies.15, 20 At the Diabetes Control and Complications Trial and Prospective Diabetes Study, the sensitivity of this cutpoint in detecting diabetes was 78% to 81% and specificity was 79% to 84%.15 HbA1c was shown to have less intraindividual variation and better predicts both microvascular and macrovascular complications.15 Although the current cost of HbA1c is higher than fasting plasma glucose, its feasibility as a screening tool for DM and as a predictor of its costly preventable complications may make it a cost‐effective choice.
Unrecognized glycometabolic disturbance as measured by HbA1c have recently been associated with poor outcomes, for example, after acute myocardial infarction.21 Postoperative complications in diabetic patients have been attributed to impairments in the immune system and microangiopathy. Patients with poorly regulated glucose levels are at an increased risk for developing infections. Once a person with diabetes has developed an infection, the body is less capable of fighting it off because high glucose levels interfere with the normal function of white blood cells. Moreover, dysfunction in the immune system impairs the inflammatory reaction in local tissues, which is further aggravated by the reduced blood supply due to diabetic microangiopathy. This results in considerable increase in the risk of soft‐tissue complications and significant delays in wound and bone healing.22
Our patient sample was classified according to chart and laboratory findings. The two criteria we used to classify them were a history of diabetes and HbA1c level 6.1%. Results show that patients unaware about their elevated HbA1c level are almost equal to the percentage of patients with history of diabetes. Combined, they make slightly more than 25% of spine surgery patients. These results are consistent with the CDC's estimate of the percentage of diabetes and prediabetes in the general population.3 Further analysis shows that age and BMI are significantly different between DM‐HbA1c groups, which is unsurprising since the correlation of diabetes with age and BMI is well‐established.23 Interestingly, the subclinical patients with elevated HbA1c appear to be as old as nondiabetic patients but as heavy as their diabetic peers. This is a remarkable finding that reflects the transitional status of these patients between non‐diabetes and diabetes. In addition, age and BMI were found to be very significant determinants of total cost in spine surgery patients. Actually, they were the reasons behind the statistical significance shown by the DM‐HbA1c status regarding cost as exposed by the ANCOVA.
This middle category of spine surgery patients with subclinical glucose metabolism disturbance seems to have important economic implications in terms of LOS and total cost in the LDF group. This may be due to the larger share of this middle subgroup in the LDF group of patients, as shown above. Besides, LDF patients stay longer and cost more than other spine surgery patients and consequently statistical differences between DM‐HbA1c subgroups are more evident. LDF is major surgery, with extensive dissection, greater blood loss, and longer operative time than other types of spine surgery and the patients are older and sicker. That may be why there was a more pronounced difference in LOS and cost between its 3 subgroups.
Overall, this work expands upon our understanding of the importance of diabetes and undiagnosed elevation of HbA1c in affecting cost following surgery. However, the study has several limitations that should be taken into consideration. Potential underreporting of diabetes in the patient's chart could skew the results, although this was unlikely due to the repetitive interview of patients on multiple occasions. In addition, HbA1c level could be affected by prescribed medications, which were not included in our inquiries. LOS and cost could also be influenced by non‐diabetes‐related factors that were not considered in the study. Finally, a bigger sample would have given more power to the results, although 556 patients is, without a doubt, not a small group.
Conclusions
There is a significant segment of spine surgery patients who learn of their disturbed glucose metabolism status for the first time on their preoperative visit. These patients require further investigation, with a fasting glucose test to confirm their diabetes status, and they need to start treatment early to prevent future complications.
HbA1c testing should be considered in the routine preoperative workup of spine surgery patients. This is a simple point‐of‐care test and its results can be obtained without delay. This will help improve early diagnosis of prediabetes and diabetes and may prevent the onset of type 2 diabetes, thus improving the patient's health and final outcome.
We need continuing research into the healthcare costs of diabetic patients in different medical specialties, as this will improve awareness about the economic impact and cost‐effectiveness issues related to this prevalent disease.
- International Diabetes Federation. Diabetes Prevalence. Available at: http://www.idf.org/home/index.cfm?node=264. Accessed April 2009.
- ,,,,.Impact of recent increase in incidence on future diabetes burden.Diabetes Care.2006;29:2114–2116.
- Centers for Disease Control and Prevention. Diabetes: Disabling Disease to Double by 2050. Available at: http://www.cdc.gov/nccdphp/publications/aag/ddt.htm. Accessed April 2009.
- American Diabetes Association. American Diabetes Month and World Diabetes Day Fact Sheet. Nov 2007. Available at: http://www.diabetes.org/uedocuments/adm‐full‐eMedia‐kit‐2007.pdf. Accessed April 2009.
- The Diabetes Epidemic Among Hispanics/Latinos. National Diabetes Education Program. Available at: http://ndep.nih.gov/diabetes/pubs/FS_HispLatino_Eng.pdf. Accessed April 2009.
- ,.Eating, exercise, and “thrifty” genotypes: connecting the dots toward an evolutionary understanding of modern chronic diseases.J Appl Physiol.2004;96(1):3–10.
- American Diabetes Association. Direct and Indirect Costs of Diabetes in the United States. Available at: http://www.diabetes.org/diabetes‐statistics/cost‐of‐diabetes‐in‐us.jsp. Accessed April 2009.
- American Diabetes Association.Economic costs of diabetes in the U.S. in 2007.Diabetes Care.2008;31(3):596–615.
- ,,,,.Causes and risk factors for postoperative fever in spine surgery patients.South Med J.2009;102(3):283–286.
- ,,, et al.Risk factors for surgical site infection following orthopaedic spinal operations.J Bone Joint Surg Am.2008;90(1):62–69.
- ,,,,.Diabetes and early postoperative outcomes following lumbar fusion.Spine.2007;32(20):2214–2219.
- ,,,,.The relationship between postoperative complications and outcomes after hip fracture surgery.Ann Acad Med Singapore.2005;34(2):163–168.
- ,,,,.Perioperative complications of lumbar instrumentation and fusion in patients with diabetes mellitus.Spine J.2003;3(6):496–501.
- ,,,,.Surgical outcome of cervical expansive laminoplasty in patients with diabetes mellitus.Spine.2000;25(5):551–555.
- ,,.HbA(1c) as a screening tool for detection of Type 2 diabetes: a systematic review.Diabet Med.2007;24(4):333–343.
- Centers for Disease Control and Prevention. National Diabetes Fact Sheet. Available at: http://www.cdc.gov/diabetes/pubs/general.htm#impaired. Accessed April 2009.
- American Diabetes Association.Standards of medical care in diabetes—2007. Diabetes Care.2007;30(suppl 1):S4–S41.
- ,,, et al.Rapid A1c availability improves clinical decision‐making in an urban primary care clinic.Diabetes Care.2003;26:1158–2116.
- Diabetes Monitor. What does my HbA1c result really mean? Available at: http://www.diabetesmonitor.com/m35.htm. Accessed April 2009.
- ,,,,.Utility of hemoglobin A1c in predicting diabetes risk.J Gen Intern Med.2004;19(12):1175–1180.
- ,,, et al.Unrecognized glycometabolic disturbance as measured by hemoglobin A1c is associated with a poor outcome after acute myocardial infarction.Am Heart J.2007;154:470–2116.
- ,,, et al.Complications of ankle fracture in patients with diabetes.J Am Acad Orthop Surg.2008;16(3):159–170.
- ,,.The influence of age and body mass index on the metabolic syndrome and its components.Diabetes Obes Metab.2008;10(3):246–250.
Diabetes mellitus (DM) is a common chronic disease with a long downward course and serious systemic consequences. The percentage of the population with diagnosed diabetes continues to rise. In 2007, more than 246 million people had diabetes worldwide.1 In the United States, the diabetes rate was 5.8% in 2007, and is estimated to rise to 12% by 2050.2, 3 Many factors may contribute to this rise in the prevalence of diabetes, including higher prevalence of overweight and obesity, unhealthy diet, sedentary lifestyle, changes in diagnostic criteria, improved detection methods, decreasing mortality, a growing elderly population, and growth in minority populations with predisposition to diabetes; (ie, African Americans, Hispanics, and Native Americans).1, 4, 5 This is consistent with the thrifty genotype hypothesis, which explains the morbid prevalence of obesity, diabetes, and atherosclerosis‐related complications in modern times.6
The total estimated cost of diabetes in 2007 was $174 billion, including $116 billion in excess medical expenditures ($27 billion for direct diabetes care, $58 billion for treatment of diabetes‐related chronic complications, and $31 billion in excess general medical costs) and $58 billion in reduced national productivity.7 The largest component of medical expenditures that is attributed to diabetes has been hospital inpatient care (50% of total cost).8
Spine surgery is expensive and any factor that influences cost of surgery merits meticulous study, especially with the financial difficulties that the healthcare system is facing. Diabetic patients are known to be more vulnerable to postoperative complications such as fever, wound infection, foot drop, and nonunion than their nondiabetic peers.9‐13 In diabetic spine surgery patients, a negative correlation was reported between the recovery rate and the preoperative glycosylated hemoglobin (HbA1c) level.14 However, the potential impact of undiagnosed diabetes on these variables have not yet been extensively studied. In order to determine the prevalence of explicit DM and undiagnosed elevation of HBA1c among spine surgery patients and its impact on healthcare cost, we conducted the following study.
Patients and Methods
We retrospectively reviewed the charts of 556 spine surgery patients who were operated on between 2005 and 2007 and had 1 of 3 types of surgery: lumbar microdiscectomy (LMD), anterior cervical decompression and fusion (ACDF), and lumbar decompression and fusion (LDF). Information was collected about their diabetes history, HbA1c level, age, race, body mass index (BMI), comorbidities, length of stay (LOS), and total cost (hospital and physician). Due to the high percentage of glucose metabolism disturbance in the population and the many reports of increased postoperative complications related to diabetes, patients are routinely seen by an internist on the preoperative visit and they undergo electrocardiography and laboratory testing, including HbA1c. Hence HbA1c was recorded for 456 patients. We used 6.1% as a screening cutpoint for high HbA1c and classified patients to 4 groups according to their DM‐HbA1c status:15
Those with history of DM and HbA1c 6.1% (DM);
Those without history of DM and HbA1c 6.1% (subclinical HbA1c elevation);
Those with history of DM and HbA1c < 6.1% (well‐controlled DM);
Those without history of DM and HbA1c < 6.1% (no DM).
The second group was our main group of interest (subclinical, previously unknown HbA1c elevation). The third group (patients with well‐controlled DM, which is uncommon) was excluded (n = 14). To prevent confusion in the coming text, mentioning elevation of HbA1c will imply the second group, while the term diabetes will refer to the first group.
We calculated the percentages of nondiabetic patients, those with subclinical HbA1c elevation, and those with already known DM. We computed the mean (m) and standard deviation (SD) for cost, age, and BMI. Using SPSS v.16 (SPSS, Chicago, IL) we applied the analysis of covariance (ANCOVA) to determine the impact of DM‐HbA1c on total healthcare cost after controlling for type of surgery. We used analysis of variance (ANOVA) and post hoc Scheffe test to check for any significant differences in healthcare cost (hospital and surgery costs), age, gender, race, and BMI between the three DM‐HbA1c groups. Finally, we applied regression analysis to figure out significant factors/predictors of total cost in spine surgery patients beside type of surgery.
Results
After excluding the third group, we had 442 spine surgery patients, 26.7% LMD, 49.1% ACDF, and 24.2% LDF. They were 21‐92 years of age (over 60 years old = 41%), and nearly equally divided according to gender (48.2% males). They were mostly Caucasian (78.3% Caucasians and 21% African Americans). There were no Hispanics in the sample, which may be due to the small proportion of the Latino population living in Macon, GA.
Calculations showed that 72.4% of the above patients were nondiabetic, 14.3% were subclinical patients with elevated HbA1c, and 13.3% were already known, confirmed DM patients. Results showed that elevation of HbA1c was highest and diabetes was lowest in the LDF group, 16% and 10%, respectively. On the contrary, elevation of HbA1c was lowest and diabetes was highest in the LMD group, 13% and 20%, respectively (Figure 1).
While analyzing the data, we took into consideration that the main cost‐determining factor was type of surgery (P < 0.001), so the pure impact of the DM‐HbA1c status on total cost was elicited by using ANCOVA and including type of surgery as a covariate. Table 1 shows the total cost for spine surgery patients per type of surgery and DM‐HbA1c status.
| LMD | ACDF | LDF | |||||||
|---|---|---|---|---|---|---|---|---|---|
| No DM | HbA1c | DM | No DM | HbA1c | DM | No DM | HbA1c | DM | |
| |||||||||
| LOS (days) | 2.75 4.318 | 2.48 2.926 | 2.48 1.904 | 1.42 1.984 | 1.43 1.165 | 2.52 3.991 | 4.68 2.509 | 6.96 5.897 | 5.55 3.616 |
| Cost (dollars) | 23115 14608 | 22306 7702 | 23644 7068 | 28363 7673 | 29420 6130 | 36748 31970 | 54914 14034 | 65974 18341 | 61536 14527 |
As evident in Table 1 and confirmed by statistical analysis, DM‐HbA1c status was a very significant determinant (P < 0.01) of total cost. We performed ANOVA in each surgical category to determine the significance of differences in total cost between DM‐HbA1c status groups. There were significant differences in the LDF group between the no DM and subclinical groups (P < 0.05) in terms of cost and LOS, and in the ACDF group between patients without DM and those with already known DM in cost (P < 0.05). Figures 2 and 3 summarize the results mentioned above.
As expected, age (P < 0.001) and BMI (P 0.01) were significantly different between DM‐HbA1c groups. Scheffe test showed significant difference between no DM and DM (P < 0.001) groups and between subclinical and DM groups (P < 0.01) regarding age and between no DM and DM groups (P < 0.05) regarding BMI. There was no difference (P > 0.05) between the three DM‐HbA1c groups regarding type of surgery. The subclinical patients with HbA1c elevation appeared to be as old as nondiabetic patients (P = 0.669) but as heavy as diabetic patients (P = 1.000).
The range of BMI in the sample was 17 to 52 with 36% over 30; (ie, obese) (Table 2). Regression analysis showed that type of surgery, age, and BMI were very significant predictors of total cost in spine surgery patients (P 0.001). In our study, total cost was not dependent on sex or race. Repeating analysis with age, BMI, or both as covariates (ANCOVA) deprives DM‐HbA1c status of statistical significance (P > 0.05).
| LMD | ACDF | LDF | |||||||
|---|---|---|---|---|---|---|---|---|---|
| No DM | HbA1c | DM | No DM | HbA1c | DM | No DM | HbA1c | DM | |
| |||||||||
| Age (years) | 60 14 | 59 11 | 69 9 | 52 10 | 58 9 | 60 10 | 55 13 | 54 10 | 59 7 |
| BMI (kg/m2) | 30 7 | 33 7 | 30 6 | 29 5 | 31 5 | 32 5 | 30 6 | 33 9 | 36 9 |
Concerning comorbidities that could affect HbA1c level, only 1.4% of patients had a history of advanced or chronic renal disease and none had hemoglobinopathy.
Discussion
According to the Centers for Disease Control and Prevention (CDC), approximately 54 million people in the United States have prediabetes and nearly 21 million have diabetes.3 This places almost 25% of the population at risk for diabetic complications. Prediabetes is a term used to distinguish people who are at increased risk of developing diabetes. People with prediabetes have impaired fasting glucose (100‐125 mg/dL), impaired glucose tolerance (140‐199 mg/dL at 2 hours), or both.16 The actual national burden of diabetes most likely exceeds the $174 billion estimate because of excess medical costs associated with prediabetic patients.
Due to the impracticality of the 2 tests mentioned above as screening methods for diabetes and prediabetes, we used HbA1c to screen for glucose metabolism disturbance. This marker does not need overnight fasting or a 2‐hour glucose loading test. The HbA1c level gives an average of glycemic control over the previous 120 days, as red blood cells have a lifespan of 120 days. Although the use of HbA1c for the diagnosis of diabetes is not yet established, its availability at the time when the patient is seen (point‐of‐care testing) is a great advantage over fasting glucose and glucose tolerance tests.17, 18 The normal range for a person without diabetes is 4.3% to 5.9%.19 For most people with diabetes the American Diabetes Association recommends targeting an HbA1c of 7% or less. If HbA1c is 8% or higher, it means that the patient's blood glucose is not well‐controlled and he/she is at increased risk for developing diabetic complications. In this case, the patient needs modifications in his/her diet, physical activity, oral hypoglycemic medications, or insulin. It is uncommon to have patients with a history of diabetes and HbA1c < 6.1%. Our patient sample confirms this fact (n = 14). Therefore, it was not included in the statistical analysis.
The cutpoint 6.1% (2 SD above the mean) was the recommended cutoff point for HbA1c in most reviewed studies.15, 20 At the Diabetes Control and Complications Trial and Prospective Diabetes Study, the sensitivity of this cutpoint in detecting diabetes was 78% to 81% and specificity was 79% to 84%.15 HbA1c was shown to have less intraindividual variation and better predicts both microvascular and macrovascular complications.15 Although the current cost of HbA1c is higher than fasting plasma glucose, its feasibility as a screening tool for DM and as a predictor of its costly preventable complications may make it a cost‐effective choice.
Unrecognized glycometabolic disturbance as measured by HbA1c have recently been associated with poor outcomes, for example, after acute myocardial infarction.21 Postoperative complications in diabetic patients have been attributed to impairments in the immune system and microangiopathy. Patients with poorly regulated glucose levels are at an increased risk for developing infections. Once a person with diabetes has developed an infection, the body is less capable of fighting it off because high glucose levels interfere with the normal function of white blood cells. Moreover, dysfunction in the immune system impairs the inflammatory reaction in local tissues, which is further aggravated by the reduced blood supply due to diabetic microangiopathy. This results in considerable increase in the risk of soft‐tissue complications and significant delays in wound and bone healing.22
Our patient sample was classified according to chart and laboratory findings. The two criteria we used to classify them were a history of diabetes and HbA1c level 6.1%. Results show that patients unaware about their elevated HbA1c level are almost equal to the percentage of patients with history of diabetes. Combined, they make slightly more than 25% of spine surgery patients. These results are consistent with the CDC's estimate of the percentage of diabetes and prediabetes in the general population.3 Further analysis shows that age and BMI are significantly different between DM‐HbA1c groups, which is unsurprising since the correlation of diabetes with age and BMI is well‐established.23 Interestingly, the subclinical patients with elevated HbA1c appear to be as old as nondiabetic patients but as heavy as their diabetic peers. This is a remarkable finding that reflects the transitional status of these patients between non‐diabetes and diabetes. In addition, age and BMI were found to be very significant determinants of total cost in spine surgery patients. Actually, they were the reasons behind the statistical significance shown by the DM‐HbA1c status regarding cost as exposed by the ANCOVA.
This middle category of spine surgery patients with subclinical glucose metabolism disturbance seems to have important economic implications in terms of LOS and total cost in the LDF group. This may be due to the larger share of this middle subgroup in the LDF group of patients, as shown above. Besides, LDF patients stay longer and cost more than other spine surgery patients and consequently statistical differences between DM‐HbA1c subgroups are more evident. LDF is major surgery, with extensive dissection, greater blood loss, and longer operative time than other types of spine surgery and the patients are older and sicker. That may be why there was a more pronounced difference in LOS and cost between its 3 subgroups.
Overall, this work expands upon our understanding of the importance of diabetes and undiagnosed elevation of HbA1c in affecting cost following surgery. However, the study has several limitations that should be taken into consideration. Potential underreporting of diabetes in the patient's chart could skew the results, although this was unlikely due to the repetitive interview of patients on multiple occasions. In addition, HbA1c level could be affected by prescribed medications, which were not included in our inquiries. LOS and cost could also be influenced by non‐diabetes‐related factors that were not considered in the study. Finally, a bigger sample would have given more power to the results, although 556 patients is, without a doubt, not a small group.
Conclusions
There is a significant segment of spine surgery patients who learn of their disturbed glucose metabolism status for the first time on their preoperative visit. These patients require further investigation, with a fasting glucose test to confirm their diabetes status, and they need to start treatment early to prevent future complications.
HbA1c testing should be considered in the routine preoperative workup of spine surgery patients. This is a simple point‐of‐care test and its results can be obtained without delay. This will help improve early diagnosis of prediabetes and diabetes and may prevent the onset of type 2 diabetes, thus improving the patient's health and final outcome.
We need continuing research into the healthcare costs of diabetic patients in different medical specialties, as this will improve awareness about the economic impact and cost‐effectiveness issues related to this prevalent disease.
- International Diabetes Federation. Diabetes Prevalence. Available at: http://www.idf.org/home/index.cfm?node=264. Accessed April 2009.
- ,,,,.Impact of recent increase in incidence on future diabetes burden.Diabetes Care.2006;29:2114–2116.
- Centers for Disease Control and Prevention. Diabetes: Disabling Disease to Double by 2050. Available at: http://www.cdc.gov/nccdphp/publications/aag/ddt.htm. Accessed April 2009.
- American Diabetes Association. American Diabetes Month and World Diabetes Day Fact Sheet. Nov 2007. Available at: http://www.diabetes.org/uedocuments/adm‐full‐eMedia‐kit‐2007.pdf. Accessed April 2009.
- The Diabetes Epidemic Among Hispanics/Latinos. National Diabetes Education Program. Available at: http://ndep.nih.gov/diabetes/pubs/FS_HispLatino_Eng.pdf. Accessed April 2009.
- ,.Eating, exercise, and “thrifty” genotypes: connecting the dots toward an evolutionary understanding of modern chronic diseases.J Appl Physiol.2004;96(1):3–10.
- American Diabetes Association. Direct and Indirect Costs of Diabetes in the United States. Available at: http://www.diabetes.org/diabetes‐statistics/cost‐of‐diabetes‐in‐us.jsp. Accessed April 2009.
- American Diabetes Association.Economic costs of diabetes in the U.S. in 2007.Diabetes Care.2008;31(3):596–615.
- ,,,,.Causes and risk factors for postoperative fever in spine surgery patients.South Med J.2009;102(3):283–286.
- ,,, et al.Risk factors for surgical site infection following orthopaedic spinal operations.J Bone Joint Surg Am.2008;90(1):62–69.
- ,,,,.Diabetes and early postoperative outcomes following lumbar fusion.Spine.2007;32(20):2214–2219.
- ,,,,.The relationship between postoperative complications and outcomes after hip fracture surgery.Ann Acad Med Singapore.2005;34(2):163–168.
- ,,,,.Perioperative complications of lumbar instrumentation and fusion in patients with diabetes mellitus.Spine J.2003;3(6):496–501.
- ,,,,.Surgical outcome of cervical expansive laminoplasty in patients with diabetes mellitus.Spine.2000;25(5):551–555.
- ,,.HbA(1c) as a screening tool for detection of Type 2 diabetes: a systematic review.Diabet Med.2007;24(4):333–343.
- Centers for Disease Control and Prevention. National Diabetes Fact Sheet. Available at: http://www.cdc.gov/diabetes/pubs/general.htm#impaired. Accessed April 2009.
- American Diabetes Association.Standards of medical care in diabetes—2007. Diabetes Care.2007;30(suppl 1):S4–S41.
- ,,, et al.Rapid A1c availability improves clinical decision‐making in an urban primary care clinic.Diabetes Care.2003;26:1158–2116.
- Diabetes Monitor. What does my HbA1c result really mean? Available at: http://www.diabetesmonitor.com/m35.htm. Accessed April 2009.
- ,,,,.Utility of hemoglobin A1c in predicting diabetes risk.J Gen Intern Med.2004;19(12):1175–1180.
- ,,, et al.Unrecognized glycometabolic disturbance as measured by hemoglobin A1c is associated with a poor outcome after acute myocardial infarction.Am Heart J.2007;154:470–2116.
- ,,, et al.Complications of ankle fracture in patients with diabetes.J Am Acad Orthop Surg.2008;16(3):159–170.
- ,,.The influence of age and body mass index on the metabolic syndrome and its components.Diabetes Obes Metab.2008;10(3):246–250.
Copyright © 2010 Society of Hospital Medicine
