User login
Superficial Plantar Fibromatosis

PSA screening: The USPSTF got it wrong

Prostate cancer is an important disease. It is the second leading cause of cancer death in men who don’t smoke, and in many cases it is detectable early and curable. The rates of both diagnosis and death from prostate cancer in men are similar to the rates of breast cancer in women.1
The current practical screening test for prostate cancer is the prostate specific antigen (PSA). Making routine use of it, as we know, however, is controversial. The false positive rate for PSA testing is high, for example, in men with chronic prostatitis and benign prostatic hypertrophy.2 In addition, many prostate cancers are diagnosed that will never harm the patient. Treatment for prostate cancer may result in complications, such as incontinence and impotence. Because of these facts, the US Preventive Services Task Force (USPSTF) has recommended against routine screening.2
The PSA test itself never hurt anyone
It is just a lab value, a piece of information. What doctors do with the information is the issue. Physicians may cause more harm than good by being overly aggressive with elevated PSA levels and indolent or low-grade prostate cancer—and 75% of prostate cancer is considered indolent (Gleason score of 6 on biopsy).3 Patients with such a finding can be watched, using active surveillance. The majority will never need treatment.3
Common sense tells us we must screen for prostate cancer. Not doing so on the basis of evidence-based medicine is not a defense when advanced cancer is diagnosed and screening was not offered to the patient.4 Rather than using the data from past physician behavior and recommending against screening with PSA, the USPSTF should have criticized the response to PSA test results and recommended a better way. I see this change rapidly becoming current practice.
PSA testing saves lives
Since the early 1990s, when PSA testing became widespread, there has been a 40% decline in prostate cancer mortality.5 A randomized trial in 7 countries in Europe clearly showed a survival benefit from screening for prostate cancer.6 Clinical trials in the United States have been ambiguous.
Not screening for prostate cancer with PSA is unacceptable to many physicians and patients. Most physicians have seen preventable prostate cancer deaths. Two patients in my practice illustrate this point. The PSA of one of them—a 62-year-old man—went from 2.4 to 24 in 2 years. The PSA of another, age 56, went from 2.6 to 34 in one year. Both men had no symptoms, and their prostate cancer was found on routine screening. Both had a high Gleason score and locally invasive prostate cancer. Now, years after undergoing cancer treatment, both have undetectable PSA levels and full function. They think the USPSTF’s recommendation not to screen is evidence of the government’s attempt to save money, reinforcing the notion that the government cannot be trusted.
Patients are increasingly savvy
With all the controversy around prostate cancer screening and the adverse effects of treatment, patients are getting savvier. Shared decision making between doctor and patient is becoming the standard of care, and physicians can meet their professional obligations by offering screening and answering any questions the patient may have. I find that most men with low-grade disease are happy to avoid surgery and radiation if active surveillance is offered and explained.
The American Academy of Family Physicians adopted the recommendation of the USPSTF to advise against screening for prostate cancer.7 The American College of Physicians recommends that men ages 50 to 69 be given the opportunity for informed decision making before screening.8 The American Urological Association recently recommended that men ages 55 to 69 be offered screening, with a discussion about the risks and benefits9; and the American Cancer Society recommends screening starting at age 50, and earlier for high-risk men.10
Not satisfied that any of these organizations really knows what is best and aware that the data are confusing and evolving, I continue to follow my overall practice approach: Start routine cancer screening at age 50 in the general population and at age 40 for high-risk groups. This works for colon, breast, and prostate cancer, the big 3 that are common, sometimes fatal, and often curable with early detection.
Men in my practice are offered a PSA test starting at age 50, and every one to 2 years thereafter based on both patient preference and the results. Black men and those with a family history of prostate cancer before age 60 are offered screening starting at age 40. I suggest that screening be stopped at age 80, or earlier if the patient has a serious chronic illness with a life expectancy of less than 10 years.
Active surveillance for low-grade disease
What is done with elevated or rising PSA levels is most controversial, with lots of room for doing harm. Dramatic rises in PSA, like those of the patients I described earlier, are easy: Go right to biopsy and usually, treatment. Gleason 6 prostate cancer is likely to remain localized and indolent, and not threaten life. I work with urologists who are not aggressive and are willing to follow patients with PSA levels up to 10. Noninvasive options are available, such as fractionating the PSA (free and total) and imaging such as MRI. Genetic testing is available and can add to the evaluation of the patient’s risk.
Active surveillance has become a standard of care in monitoring patients with low-grade disease. The outcomes for survival with active surveillance are as good as radical prostatectomy.11 The goal is to be aggressive in treatment only with patients who have life-threatening disease. A collaboration among the patient, the primary care physician, and the urologist is crucial to optimizing patient outcomes.
Recommending against screening for prostate cancer is not tenable. The responsible approach is to continuously improve cancer detection and therapy to maximize good and minimize harm. This approach is available today.
1. Jemal A, Siegel R, Xu J, et al. Cancer statistics, 2010. CA Cancer J Clin. 2010;60:277-300.
2. US Preventive Services Task Force. Screening for prostate cancer: Ann Int Med. 2008;149:185-191.
3. Klotz L. Active surveillance: current and future directions. Curr Opin Urol. 2013;23:237-238.
4. Merenstein D. A piece of my mind: Winners and losers. JAMA. 2004;291:15-16.
5. Siegel R, DeSantis C, Virgo K, et al. Cancer treatment and survivorship statistics, 2012. CA Cancer J Clin. 2012;64:220-241.
6. Schroder FH, et al; ERSPC investigators. Screening and prostate cancer mortality in a randomized European study. N Engl J Med. 2009;360:1320-1328.
7. American Academy of Family Physicians Web site. Prostate cancer. Available at: http://www.aafp.org/patient-care/clinical-recommendations/all/prostate-cancer.html. Accessed October 16, 2013.
8. Qaseem A, Barry MJ, Denberg TD, et al. Screening for prostate cancer: a guideline statement from the clinical guidelines of the American College of Physicians. Ann Int Med. 2013;158:761-769.
9. Carter HB, Albertsen PC, Barry MJ, et al. Early detection of prostate cancer: AUA guideline. American Urological Association. 2013;1-28. Available at: http://www.auanet.org/common/pdf/education/clinical-guidance/Prostate-Cancer-Detection.pdf. Accessed October 16, 2013.
10. Wolf AM, Wender RC, Etzioni RB, et al. American Cancer Society guideline for the early detection of prostate cancer: update 2010. CA Cancer J Clin. 2010;60:70-98.
11. Wilt TJ, Brawer MK, Jones KM, et al. Radical prostatectomy versus observation for localized prostate cancer. N Engl J Med. 2012;367:203-213.
Prostate cancer is an important disease. It is the second leading cause of cancer death in men who don’t smoke, and in many cases it is detectable early and curable. The rates of both diagnosis and death from prostate cancer in men are similar to the rates of breast cancer in women.1
The current practical screening test for prostate cancer is the prostate specific antigen (PSA). Making routine use of it, as we know, however, is controversial. The false positive rate for PSA testing is high, for example, in men with chronic prostatitis and benign prostatic hypertrophy.2 In addition, many prostate cancers are diagnosed that will never harm the patient. Treatment for prostate cancer may result in complications, such as incontinence and impotence. Because of these facts, the US Preventive Services Task Force (USPSTF) has recommended against routine screening.2
The PSA test itself never hurt anyone
It is just a lab value, a piece of information. What doctors do with the information is the issue. Physicians may cause more harm than good by being overly aggressive with elevated PSA levels and indolent or low-grade prostate cancer—and 75% of prostate cancer is considered indolent (Gleason score of 6 on biopsy).3 Patients with such a finding can be watched, using active surveillance. The majority will never need treatment.3
Common sense tells us we must screen for prostate cancer. Not doing so on the basis of evidence-based medicine is not a defense when advanced cancer is diagnosed and screening was not offered to the patient.4 Rather than using the data from past physician behavior and recommending against screening with PSA, the USPSTF should have criticized the response to PSA test results and recommended a better way. I see this change rapidly becoming current practice.
PSA testing saves lives
Since the early 1990s, when PSA testing became widespread, there has been a 40% decline in prostate cancer mortality.5 A randomized trial in 7 countries in Europe clearly showed a survival benefit from screening for prostate cancer.6 Clinical trials in the United States have been ambiguous.
Not screening for prostate cancer with PSA is unacceptable to many physicians and patients. Most physicians have seen preventable prostate cancer deaths. Two patients in my practice illustrate this point. The PSA of one of them—a 62-year-old man—went from 2.4 to 24 in 2 years. The PSA of another, age 56, went from 2.6 to 34 in one year. Both men had no symptoms, and their prostate cancer was found on routine screening. Both had a high Gleason score and locally invasive prostate cancer. Now, years after undergoing cancer treatment, both have undetectable PSA levels and full function. They think the USPSTF’s recommendation not to screen is evidence of the government’s attempt to save money, reinforcing the notion that the government cannot be trusted.
Patients are increasingly savvy
With all the controversy around prostate cancer screening and the adverse effects of treatment, patients are getting savvier. Shared decision making between doctor and patient is becoming the standard of care, and physicians can meet their professional obligations by offering screening and answering any questions the patient may have. I find that most men with low-grade disease are happy to avoid surgery and radiation if active surveillance is offered and explained.
The American Academy of Family Physicians adopted the recommendation of the USPSTF to advise against screening for prostate cancer.7 The American College of Physicians recommends that men ages 50 to 69 be given the opportunity for informed decision making before screening.8 The American Urological Association recently recommended that men ages 55 to 69 be offered screening, with a discussion about the risks and benefits9; and the American Cancer Society recommends screening starting at age 50, and earlier for high-risk men.10
Not satisfied that any of these organizations really knows what is best and aware that the data are confusing and evolving, I continue to follow my overall practice approach: Start routine cancer screening at age 50 in the general population and at age 40 for high-risk groups. This works for colon, breast, and prostate cancer, the big 3 that are common, sometimes fatal, and often curable with early detection.
Men in my practice are offered a PSA test starting at age 50, and every one to 2 years thereafter based on both patient preference and the results. Black men and those with a family history of prostate cancer before age 60 are offered screening starting at age 40. I suggest that screening be stopped at age 80, or earlier if the patient has a serious chronic illness with a life expectancy of less than 10 years.
Active surveillance for low-grade disease
What is done with elevated or rising PSA levels is most controversial, with lots of room for doing harm. Dramatic rises in PSA, like those of the patients I described earlier, are easy: Go right to biopsy and usually, treatment. Gleason 6 prostate cancer is likely to remain localized and indolent, and not threaten life. I work with urologists who are not aggressive and are willing to follow patients with PSA levels up to 10. Noninvasive options are available, such as fractionating the PSA (free and total) and imaging such as MRI. Genetic testing is available and can add to the evaluation of the patient’s risk.
Active surveillance has become a standard of care in monitoring patients with low-grade disease. The outcomes for survival with active surveillance are as good as radical prostatectomy.11 The goal is to be aggressive in treatment only with patients who have life-threatening disease. A collaboration among the patient, the primary care physician, and the urologist is crucial to optimizing patient outcomes.
Recommending against screening for prostate cancer is not tenable. The responsible approach is to continuously improve cancer detection and therapy to maximize good and minimize harm. This approach is available today.
1. Jemal A, Siegel R, Xu J, et al. Cancer statistics, 2010. CA Cancer J Clin. 2010;60:277-300.
2. US Preventive Services Task Force. Screening for prostate cancer: Ann Int Med. 2008;149:185-191.
3. Klotz L. Active surveillance: current and future directions. Curr Opin Urol. 2013;23:237-238.
4. Merenstein D. A piece of my mind: Winners and losers. JAMA. 2004;291:15-16.
5. Siegel R, DeSantis C, Virgo K, et al. Cancer treatment and survivorship statistics, 2012. CA Cancer J Clin. 2012;64:220-241.
6. Schroder FH, et al; ERSPC investigators. Screening and prostate cancer mortality in a randomized European study. N Engl J Med. 2009;360:1320-1328.
7. American Academy of Family Physicians Web site. Prostate cancer. Available at: http://www.aafp.org/patient-care/clinical-recommendations/all/prostate-cancer.html. Accessed October 16, 2013.
8. Qaseem A, Barry MJ, Denberg TD, et al. Screening for prostate cancer: a guideline statement from the clinical guidelines of the American College of Physicians. Ann Int Med. 2013;158:761-769.
9. Carter HB, Albertsen PC, Barry MJ, et al. Early detection of prostate cancer: AUA guideline. American Urological Association. 2013;1-28. Available at: http://www.auanet.org/common/pdf/education/clinical-guidance/Prostate-Cancer-Detection.pdf. Accessed October 16, 2013.
10. Wolf AM, Wender RC, Etzioni RB, et al. American Cancer Society guideline for the early detection of prostate cancer: update 2010. CA Cancer J Clin. 2010;60:70-98.
11. Wilt TJ, Brawer MK, Jones KM, et al. Radical prostatectomy versus observation for localized prostate cancer. N Engl J Med. 2012;367:203-213.
Construction Worker Falls From Scaffolding
ANSWER
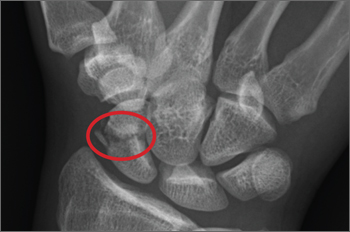
The radiograph shows an acute, comminuted fracture of the scaphoid bone. The patient was placed in a thumb spica splint and sling. He was instructed to follow up in one to two days with the hand surgeon who was on call, with anticipation of subsequent open reduction and internal fixation.
ANSWER
The radiograph shows an acute, comminuted fracture of the scaphoid bone. The patient was placed in a thumb spica splint and sling. He was instructed to follow up in one to two days with the hand surgeon who was on call, with anticipation of subsequent open reduction and internal fixation.
ANSWER
The radiograph shows an acute, comminuted fracture of the scaphoid bone. The patient was placed in a thumb spica splint and sling. He was instructed to follow up in one to two days with the hand surgeon who was on call, with anticipation of subsequent open reduction and internal fixation.

A 45-year-old construction worker is brought to your facility for evaluation following a fall. He was at a job site, standing on scaffolding approximately 20 feet above the ground, when he accidentally fell. He does not remember for sure, but he thinks he landed on his face. He did briefly lose consciousness. He is complaining of right-side facial pain and right wrist pain. His medical history is unremarkable. The physical exam reveals stable vital signs. The patient appears somewhat uncomfortable but is in no obvious distress. There is a moderate amount of periorbital soft-tissue swelling around his right eye, with moderate associated tenderness. Pupils are equal and react well bilaterally. Examination of the right wrist shows a moderate amount of soft-tissue swelling. The patient is unable to flex or extend his wrist due to pain. Good pulses and capillary refill of the nail beds are noted. There is also moderate tenderness along the base of the first metacarpal. Radiograph of the right wrist is shown. What is your impression?

Now Insured, Patient Wants to “Get Checked Out”
ANSWER
There are three findings on this ECG: unusual P waves consistent with a possible ectopic atrial rhythm, a prolonged QT interval, and T-wave abnormalities in the lateral leads.
Note that the P waves are negative in leads I and II, as well as in all chest leads. This is highly suggestive of an ectopic atrial rhythm originating low in the atria, conducting retrograde into the atria, and overriding the sinoatrial node. Limb lead reversal would result in negative P waves in lead I, but not in other leads.
A prolonged QT interval is determined by consulting any of the standard charts that correlate maximum heart rates with QT intervals and gender. In men, the QT interval is considered “prolonged” when it exceeds 440 ms, unless the heart rate is extremely slow.
Finally, T-wave inversions are present in the lateral leads (V5, V6). Although this may be an indication of lateral ischemia, there is no clinical correlation in this patient.

A 37-year-old man presents to your office to establish care. After being unemployed for two years, he recently obtained a position with a local manufacturing company and, as a result, has health benefits. He wants to “get checked out.” He has not seen a health care provider since having his tonsils removed at age 14. He says he is rarely ill, aside from an occasional cold. Besides the tonsillectomy, medical history is positive for a right clavicular fracture at age 6 and a left inguinal hernia repair at age 9. He had chickenpox and recalls that his immunizations were up to date until he graduated high school. His only medication is ibuprofen as needed for aches and pains. He has no known drug allergies. He uses two herbal supplements, fenugreek seed and horny goat weed, daily. He admits to recreational marijuana use. Family history is remarkable for coronary artery disease (father), diabetes (mother), and depression (sister). He consumes one six-pack of beer weekly and has smoked one pack of cigarettes per day for the past 23 years. He isn’t interested in quitting smoking. The patient is divorced, without children. He has been collecting unemployment since his last position was terminated due to budget constraints. A 20-point comprehensive review of systems is negative, with the exception of occasional palpitations and a productive morning smoker’s cough that quickly resolves. He states he’s “as healthy as a horse.” The physical exam reveals a thin, healthy-appearing middle-aged male. He is 72 in tall and weighs 167 lb. His blood pressure is 108/66 mm Hg; pulse, 70 beats/min and regular; respiratory rate, 14 breaths/min-1; and temperature, 98.4°F. The head, eyes, ears, nose, and throat (HEENT) exam is remarkable for poor dentition, with multiple caries readily visible. The tonsils are absent. Coarse expiratory crackles are present in both bases and clear with vigorous coughing. The abdominal exam is positive for a well-healed scar in the left inguinal crease. The remainder of the physical exam is normal. As part of a new patient visit, a chest x-ray and ECG are obtained. The ECG shows the following: a ventricular rate of 69 beats/min; PR interval, 178 ms; QRS duration, 90ms; QT/QTc interval, 442/473 ms; P axis, 231°; R axis, 84°; and T axis, 93°. What is your interpretation of this ECG?

A Purplish Rash on the Instep
ANSWER
The correct answer is lichen planus (choice “d”), an inflammatory condition marked by pathognomic histologic changes such as those described. Hardly on the tip of most primary care providers’ tongues, lichen planus is nonetheless quite commonly occuring.
Tinea pedis (choice “a”) certainly belongs in the differential, but it would be unusual in a woman of this age. The biopsy effectively ruled it out, as it did psoriasis (choice “b”) and contact dermatitis (choice “c”).
DISCUSSION
Lichen planus (LP) is the prototypical lichenoid interface dermatitis; an inflammatory infiltrate erases the normally well-defined dermoepidermal junction, replacing it with a jagged “sawtooth” band of lymphocytes. In the process, the cells it kills off (keratinocytes) collect at this interface and are incorporated as necrotic keratinocytes into the papillary dermis.
Classically, the recognition of LP is taught with “The Ps.” LP is said to be:
• Papular
• Planar
• Purple
• Polygonal
• Pruritic
• Plaquish
• Penile
• Puzzling
The word “puzzling” may sound nebulous, but it is actually quite useful for dermatology providers. It comes into play whenever a condition stumps us—as in, “What in the world is this?” This puzzlement causes us to at least consider LP.
LP is often papular, and these papules often have flat (planar) tops. The purple color is more striking in lighter-skinned patients. (Almost all inflammatory conditions are more difficult to diagnose in those with darker skin.) More typically, LP lesions are multi-angular or polygonal, often plaquish, and almost invariably pruritic.
LP is common on the legs and/or trunk, favoring the sacral area. It can affect the scalp (being in the differential for hair loss), can cause nail dystrophy, and is relatively common in the mouth, where it presents as a lacy, reticular, slightly erosive process, usually affecting the buccal mucosae. It may be found on the penis, where it is usually confined to the distal shaft and proximal coronal areas.
Like many otherwise benign conditions, LP can present with bullae. In anterior tibial areas, especially on darker-skinned persons, it can be remarkably hypertrophic.
The cause is usually unknown, although certain drugs—especially the antimalarials, gold salts, and penicillamine—have been known to cause LP-like eruptions. It’s been my observation that flares of LP are prompted by stress (certainly present in this patient’s case). LP may have a connection to hepatitis, although no convincing connection has been established.
TREATMENT
This patient’s condition was treated with topical class I corticosteroid ointment (halobetasol). For her, having a certain diagnosis was almost as important as successful treatment.

Several months ago, an itchy rash appeared on the foot of this 61-year-old African-American woman. She tried using a variety of OTC and prescription products, including tolnaftate cream, hydrocortisone 1% cream, and triamcinolone cream, but the rash persisted. She reports that the triamcinolone cream did relieve the itching for a few minutes after application, but the symptoms always returned. The rash has gradually grown. The patient, a retired schoolteacher, denies any other skin problems. She does have several relatively minor health problems, including hypertension (well controlled with metoprolol) and mild reactive airway disease (related to a 20-year history of smoking). The rash manifested around the time she was forced to retire in an unforeseen downsizing effort by her school district. As a result, she lost her health care coverage and could not afford private insurance for herself and her husband (neither of whom are old enough to qualify for Medicare). The rash, which covers a roughly 12 × 8–cm area, begins on her left instep and spills onto the lower ankle. It is quite dark, as would be expected in a person with type V skin, but there is a slightly purplish tinge to it. The surface of the affected area is a bit shiny and atrophic, and the margins are well defined and annular. There is almost no scaling, and the rest of the skin on her feet and legs is well within normal limits. A 4-mm punch biopsy is performed on the lesion. The pathology report shows obliteration of the dermoepidermal junction by a bandlike lymphocytic infiltrate in the papillary dermis, associated with vacuolar changes and the accumulation of necrotic keratinocytes in the basal layer.

Renal risk stratification with the new oral anticoagulants
To the Editor: I read with interest the review of the new oral anticoagulants by Fawole et al1 and agree with their comments on the prevention of bleeding and the importance of monitoring renal function in managing patients on the new classes of oral anticoagulants. However, no specifics were given on how to proceed. Thus, I recommend that renal risk stratification be done before and 1 week after starting these new drugs.
Originally, the US Food and Drug Administration approved dabigatran (Pradaxa) at a dose of 150 mg orally twice daily in patients with a creatinine clearance of 15 to 30 mL/min/1.73 m2. This dosing corresponded to the estimated glomerular filtration rate (eGFR) in patients with stage 4 chronic kidney disease, but this dosing is contraindicated in other guidelines worldwide (Canada, Europe, the United Kingdom, Japan, Australia, and New Zealand).2 Not unexpectedly, 3,781 serious adverse effects were noted in the 2011 US postmarketing experience with dabigatran. These included death (542 cases), hemorrhage (2,367 cases), acute renal failure (291 cases), stroke (644 cases), and suspected liver failure (15 cases).3 Thirteen months after dabigatran’s approval in the United States, Boehringer Ingelheim changed the dosage and product guidelines.2–4 The new dosage4 is 75 mg twice daily for patients with a creatinine clearance of 15 to 30 mL/min/1.73 m2.
Therefore, I suggest a nephrologic “way out”5 when using the new oral anticoagulants to avoid the problems with dabigatran noted above.
First, if these drugs are to be used in nonvalvular atrial fibrillation, risk factors should be determined using the CHADS2 or the CHADS2-VASc score. Special attention should be given to patients age 75 and older, women, and patients with a history of stroke, transient ischemic attack, or systemic embolism. All of these have been noted to be major risk factors.6,7
Second, renal risk stratification8 should be done using a comprehensive metabolic panel before and 1 week after starting new oral anticoagulants, or if there is a change in the patient’s clinical condition. Most US laboratories now provide an eGFR and the stage of chronic kidney disease.3,5 For example (Table 1), if dabigatran is used, one should follow current dosing guidelines for chronic kidney disease stages 1 through 3, ie, 150 mg twice daily. If stage 4 chronic kidney disease is detected (creatinine clearance 15–29 mL/min/1.73 m2), the updated recommended dosage is 75 mg twice daily. If stage 5 is noted (eGFR ≤ 15 mL/min/1.73 m2), dabigatran is not indicated. Similar steps can be done using current guidelines for the other new oral anticoagulants.
This simple renal risk stratification guideline should help avoid some of the problems noted in the dabigatran postmarketing experience, which were aggravated by the lack of approval of a 110-mg dose and by misleading advertising, claiming that no blood monitoring was required.2–5 Thus, the new oral anticoagulants should be a welcome addition to our armamentarium in patients who need them, and we hope to avoid the risks, morbidity, mortality, and expense of trying to reverse adverse effects.
- Fawole A, Daw HA, Crowther MA. Practical management of bleeding due to the anticoagulants, dabigatran, rivaroxaban, and apixaban. Cleve Clin J Med 2013, 80:443–451.
- Pazmiño PA. Dabigatran associated acute renal failure (DAARF). El Paso Physician 2011; 34:7–9.
- Pazmiño PA. Adverse effects of dabigatran (Letter). Ann Intern Med 2012; 157:916.
- Pradaxa (prescribing information). Ridgefield, CT. Boehringer Ingelheim Pharmaceuticals 2011.
- Pazmiño PA. Dabigatran: a nephrological way out. Am J Med 2013; 126;e21–e22.
- Lip GY, Nieuwlaat R, Pisters R, Lane DA, Crijns HJ. Refining clinical risk stratification for predicting stroke and thromboembolism in atrial fibrillation using a novel risk factor-based approach. The Euro Heart Survey on Atrial Fibrillation. Chest 2010; 137:263–272.
- Reinecke H, Brand E, Mesters R, et al. Dilemmas in the management of atrial fibrillation in chronic kidney disease. J Am Soc Nephrol 2009; 20:705–711.
- National Kidney Foundation. K/DOQI clinical practice guidelines for chronic disease: evaluation, classification and stratification. Am J Kidney Dis 2002; 39(suppl 1):S1–S266.
To the Editor: I read with interest the review of the new oral anticoagulants by Fawole et al1 and agree with their comments on the prevention of bleeding and the importance of monitoring renal function in managing patients on the new classes of oral anticoagulants. However, no specifics were given on how to proceed. Thus, I recommend that renal risk stratification be done before and 1 week after starting these new drugs.
Originally, the US Food and Drug Administration approved dabigatran (Pradaxa) at a dose of 150 mg orally twice daily in patients with a creatinine clearance of 15 to 30 mL/min/1.73 m2. This dosing corresponded to the estimated glomerular filtration rate (eGFR) in patients with stage 4 chronic kidney disease, but this dosing is contraindicated in other guidelines worldwide (Canada, Europe, the United Kingdom, Japan, Australia, and New Zealand).2 Not unexpectedly, 3,781 serious adverse effects were noted in the 2011 US postmarketing experience with dabigatran. These included death (542 cases), hemorrhage (2,367 cases), acute renal failure (291 cases), stroke (644 cases), and suspected liver failure (15 cases).3 Thirteen months after dabigatran’s approval in the United States, Boehringer Ingelheim changed the dosage and product guidelines.2–4 The new dosage4 is 75 mg twice daily for patients with a creatinine clearance of 15 to 30 mL/min/1.73 m2.
Therefore, I suggest a nephrologic “way out”5 when using the new oral anticoagulants to avoid the problems with dabigatran noted above.
First, if these drugs are to be used in nonvalvular atrial fibrillation, risk factors should be determined using the CHADS2 or the CHADS2-VASc score. Special attention should be given to patients age 75 and older, women, and patients with a history of stroke, transient ischemic attack, or systemic embolism. All of these have been noted to be major risk factors.6,7
Second, renal risk stratification8 should be done using a comprehensive metabolic panel before and 1 week after starting new oral anticoagulants, or if there is a change in the patient’s clinical condition. Most US laboratories now provide an eGFR and the stage of chronic kidney disease.3,5 For example (Table 1), if dabigatran is used, one should follow current dosing guidelines for chronic kidney disease stages 1 through 3, ie, 150 mg twice daily. If stage 4 chronic kidney disease is detected (creatinine clearance 15–29 mL/min/1.73 m2), the updated recommended dosage is 75 mg twice daily. If stage 5 is noted (eGFR ≤ 15 mL/min/1.73 m2), dabigatran is not indicated. Similar steps can be done using current guidelines for the other new oral anticoagulants.
This simple renal risk stratification guideline should help avoid some of the problems noted in the dabigatran postmarketing experience, which were aggravated by the lack of approval of a 110-mg dose and by misleading advertising, claiming that no blood monitoring was required.2–5 Thus, the new oral anticoagulants should be a welcome addition to our armamentarium in patients who need them, and we hope to avoid the risks, morbidity, mortality, and expense of trying to reverse adverse effects.
- Fawole A, Daw HA, Crowther MA. Practical management of bleeding due to the anticoagulants, dabigatran, rivaroxaban, and apixaban. Cleve Clin J Med 2013, 80:443–451.
- Pazmiño PA. Dabigatran associated acute renal failure (DAARF). El Paso Physician 2011; 34:7–9.
- Pazmiño PA. Adverse effects of dabigatran (Letter). Ann Intern Med 2012; 157:916.
- Pradaxa (prescribing information). Ridgefield, CT. Boehringer Ingelheim Pharmaceuticals 2011.
- Pazmiño PA. Dabigatran: a nephrological way out. Am J Med 2013; 126;e21–e22.
- Lip GY, Nieuwlaat R, Pisters R, Lane DA, Crijns HJ. Refining clinical risk stratification for predicting stroke and thromboembolism in atrial fibrillation using a novel risk factor-based approach. The Euro Heart Survey on Atrial Fibrillation. Chest 2010; 137:263–272.
- Reinecke H, Brand E, Mesters R, et al. Dilemmas in the management of atrial fibrillation in chronic kidney disease. J Am Soc Nephrol 2009; 20:705–711.
- National Kidney Foundation. K/DOQI clinical practice guidelines for chronic disease: evaluation, classification and stratification. Am J Kidney Dis 2002; 39(suppl 1):S1–S266.
In reply: Renal risk stratification with the new oral anticoagulants
In Reply: We agree with the comments of Dr. Pazmiño regarding specifics of renal risk stratification in patients taking the new oral anticoagulants. In order to reduce the bleeding risks associated with these agents, they should be prescribed on the basis of the individual patient’s clinical characteristics. We did not discuss this since the focus of our article was management of bleeding that resulted from use of these drugs. We appreciate the recommendations of Dr. Pazmiño.
In Reply: We agree with the comments of Dr. Pazmiño regarding specifics of renal risk stratification in patients taking the new oral anticoagulants. In order to reduce the bleeding risks associated with these agents, they should be prescribed on the basis of the individual patient’s clinical characteristics. We did not discuss this since the focus of our article was management of bleeding that resulted from use of these drugs. We appreciate the recommendations of Dr. Pazmiño.
In Reply: We agree with the comments of Dr. Pazmiño regarding specifics of renal risk stratification in patients taking the new oral anticoagulants. In order to reduce the bleeding risks associated with these agents, they should be prescribed on the basis of the individual patient’s clinical characteristics. We did not discuss this since the focus of our article was management of bleeding that resulted from use of these drugs. We appreciate the recommendations of Dr. Pazmiño.
Not all joint pain is arthritis
To the Editor: I was somewhat confused by the Clinical Picture case in the May 2013 issue.1 The caption for Figure 1 stated that the MRI showed erosions and marrow edema, which were “asymmetrical compared with the other wrist, a finding highly suggestive of rheumatoid arthritis.” However, rheumatoid arthritis is generally considered to be symmetrical.2 Was this a typographical error, or did I miss a crucial concept somewhere?
- Kochhar GS, Rizk M, Patil DT. Not all joint pain is arthritis. Cleve Clin J Med 2013; 80:272–273.
- Bukhari M, Lunt M, Harrison BJ, Scott DG, Symmons DP, Silman AJ. Erosions in inflammatory polyarthritis are symmetrical regardless of rheumatoid factor status: results from a primary care-based inception cohort of patients. Rheumatology 2002; 41:246–252.
To the Editor: I was somewhat confused by the Clinical Picture case in the May 2013 issue.1 The caption for Figure 1 stated that the MRI showed erosions and marrow edema, which were “asymmetrical compared with the other wrist, a finding highly suggestive of rheumatoid arthritis.” However, rheumatoid arthritis is generally considered to be symmetrical.2 Was this a typographical error, or did I miss a crucial concept somewhere?
To the Editor: I was somewhat confused by the Clinical Picture case in the May 2013 issue.1 The caption for Figure 1 stated that the MRI showed erosions and marrow edema, which were “asymmetrical compared with the other wrist, a finding highly suggestive of rheumatoid arthritis.” However, rheumatoid arthritis is generally considered to be symmetrical.2 Was this a typographical error, or did I miss a crucial concept somewhere?
- Kochhar GS, Rizk M, Patil DT. Not all joint pain is arthritis. Cleve Clin J Med 2013; 80:272–273.
- Bukhari M, Lunt M, Harrison BJ, Scott DG, Symmons DP, Silman AJ. Erosions in inflammatory polyarthritis are symmetrical regardless of rheumatoid factor status: results from a primary care-based inception cohort of patients. Rheumatology 2002; 41:246–252.
In reply: Not all joint pain is arthritis
In Reply: We apologize for the confusion. We wanted to convey that, in that patient at that time, synovitis with erosions and edema indicating inflammation (greater on the right than on the left left) was suggestive of rheumatoid arthritis despite the asymmetry seen (findings greater in the right wrist than in the left). Given the patient’s clinical findings at that time and the above imaging findings, the initial diagnosis of rheumatoid arthritis was correct. But since the patient was not responding to therapy and since the abdominal pain was worsening, we probed further. Subsequently, the patient was diagnosed with Whipple disease. The fact that inflammatory arthritis can occur in other conditions that are not rheumatologic is a primary reason we found this case worth sharing.
In Reply: We apologize for the confusion. We wanted to convey that, in that patient at that time, synovitis with erosions and edema indicating inflammation (greater on the right than on the left left) was suggestive of rheumatoid arthritis despite the asymmetry seen (findings greater in the right wrist than in the left). Given the patient’s clinical findings at that time and the above imaging findings, the initial diagnosis of rheumatoid arthritis was correct. But since the patient was not responding to therapy and since the abdominal pain was worsening, we probed further. Subsequently, the patient was diagnosed with Whipple disease. The fact that inflammatory arthritis can occur in other conditions that are not rheumatologic is a primary reason we found this case worth sharing.
In Reply: We apologize for the confusion. We wanted to convey that, in that patient at that time, synovitis with erosions and edema indicating inflammation (greater on the right than on the left left) was suggestive of rheumatoid arthritis despite the asymmetry seen (findings greater in the right wrist than in the left). Given the patient’s clinical findings at that time and the above imaging findings, the initial diagnosis of rheumatoid arthritis was correct. But since the patient was not responding to therapy and since the abdominal pain was worsening, we probed further. Subsequently, the patient was diagnosed with Whipple disease. The fact that inflammatory arthritis can occur in other conditions that are not rheumatologic is a primary reason we found this case worth sharing.
Ponatinib sales and marketing suspended
After follow-up data from the phase 2 PACE trial revealed that ponatinib-treated patients experienced an increase in arterial and venous thrombotic events, the FDA decided to investigate the drug’s safety.
The agency placed current ponatinib trials on partial clinical hold and asked the drug’s makers, Ariad Pharmaceuticals, to end the phase 3 EPIC trial.
Now, the FDA has asked Ariad to temporarily suspend marketing and sales of ponatinib while the agency further evaluates the drug.
Ponatinib is approved in the US and the European Union to treat adults with chronic myeloid leukemia or Philadelphia chromosome-positive acute lymphoblastic leukemia that is resistant to or intolerant of other tyrosine kinase inhibitors.
Recommendations for ponatinib use
Until its safety evaluation is complete, the FDA is recommending that healthcare professionals reconsider the use of ponatinib.
For patients who are taking ponatinib but not responding, immediately discontinue their treatment and discuss alternative treatment options.
For patients who are currently taking ponatinib and responding, determine whether the potential benefits of the therapy outweigh the risks. If they do, these patients should be treated under a single-patient investigational new drug (IND) application or expanded access registry program while the FDA’s safety investigation continues.
Do not start treating new patients with ponatinib unless no other treatment options are available and all other available therapies have failed. Patients who meet these criteria can be considered for treatment under an IND or expanded access registry program.
For more information on obtaining access to treatment for your patient under an IND, please refer to the following website: Physician Request for an Individual Patient IND under Expanded Access for Non-emergency or Emergency Use.
Ponatinib safety data
Thus far, the FDA’s investigation of ponatinib has revealed an increased frequency of arterial and venous thrombotic events since the drug was approved in December 2012.
In clinical trials conducted before the drug’s approval, serious arterial thrombosis occurred in 8% of ponatinib-treated patients, and venous thromboembolism occurred in 3%. In the most recent clinical trial data, at least 20% of all participants treated with ponatinib have developed thrombosis or arteriosclerosis.
Serious adverse vascular events have occurred in about 24% of patients in the phase 2 trial of ponatinib (median treatment duration of 1.3 years) and about 48% of patients in the phase 1 trial (median treatment duration of 2.7 years).
These included fatal and life-threatening heart attack, stroke, loss of blood flow to the extremities resulting in tissue death, and severe narrowing of blood vessels in the extremities, heart, and brain requiring urgent surgical procedures to restore blood flow.
In the phase 2 trial, adverse events affecting the blood vessels that supply the heart, brain, and extremities were observed in 12%, 6%, and 8% of patients, respectively. Patients with and without cardiovascular risk factors, including patients in their 20s, have experienced these events.
Serious adverse reactions involving the eyes, which led to blindness or blurred vision, occurred in ponatinib-treated patients. High blood pressure occurred in 67% of patients treated with ponatinib in the trials. Heart failure, including fatalities, occurred in 8% of patients who received the drug.
In some patients, fatal and serious adverse events have occurred as early as 2 weeks after starting ponatinib therapy.
The phase 1 and 2 trials did not include a control group, so it is not possible to determine the relationship of these adverse events to ponatinib. However, the increasing rate and pattern of the events strongly suggests that many are drug-related, according to the FDA.
The agency said it cannot currently identify a dose level or exposure duration of ponatinib that is safe. Prior to the issues with adverse events, the recommended dose of ponatinib was a 45 mg tablet taken once daily.
The FDA said it plans to continue its investigation and will notify healthcare professionals and patients as more information becomes available. ![]()