User login
Atrial fibrillation: The unknown known
For a problem that has been on the back burner for decades, the treatment of atrial fibrillation has suddenly become a "marquis" diagnosis.
Age and technology have led to an explosion of interest in this arcane cardiac problem. Advertisements for new anticoagulants and thrombin inhibitors for "A Fib" have become almost as common as those for male impotency. The aging of the world population certainly has been a major factor in its increased incidence. New technology and pharmacology has driven the increase in clinical interest and has advanced our knowledge about the disease. Epidemiology data have provided important information about the natural history of paroxysmal atrial fibrillation (AF), and its relationship to chronic AF and its adverse effects on long-term mortality.
The importance of anticoagulant therapy for the prevention of systemic emboli and stroke has been the mainstay of therapy for almost 50 years. Although we have struggled with a variety of antiarrhythmic drugs, their shortcomings have been more than apparent. Most of us now use a rate-control strategy to control the tachycardia inherent in AF. The development of new factor Xa and direct thrombin inhibitor drugs have made the logistics of providing adequate thrombus prevention much simpler, if somewhat more expensive.
The elephant in the room is the increasing use of radiofrequency catheter ablation technology that has had some success in the prevention of AF arising from the tissue in the pulmonary vein–atrial interface. Numerous small studies have reported that this technology surpasses rhythm control with antiarrhythmic agents, a hurdle not too difficult to beat. The best results have been observed in patients with recurrent paroxysmal AF where maintenance of regular sinus rhythm has been the primary outcome measurement (JAMA 2014;311:692-700). Even here, recurrence after ablation has been common. The benefit of ablation therapy in patients with initial paroxysmal AF (N. Engl. J. Med. 2012;367:1587-95) or chronic persistent AF has been uncertain at best. As a result, the AHA/ACC/HRS (American Heart Association/American College of Cardiology/Heart Rhythm Society) guidelines have given a class I (evidence level A) recommendation for ablation therapy for symptomatic paroxysmal AF and class IIa (evidence level A) and IIb (evidence level B) for symptomatic recurrent paroxysmal and longstanding persistent AF when balanced against drug tolerability, respectively (J. Am. Coll. Cardiol. 2014 [doi:10.1016/j.jacc.2014.03.021]).
All of these clinical data are exciting and have led to enthusiasm for ablation technology despite the potential for nonfatal and rare fatal complication, based almost entirely on its ability to improve upon the dismal benefits of antiarrhythmic rhythm control. Even as we consider the benefit of ablation therapy, new techniques are being developed. The lack of mortality and morbidity data is a result of the short follow-up, usually limited to a year or two, and small sample size. This lack of long-term outcome data for ablation therapy should be of some concern to clinicians who have lived through the last few years. Many of my readers had not been born when we embarked on the ineffective and dangerous pharmacologic prevention of sudden death by pharmacologic suppression of ambient ventricular premature beats. Numerous surrogate measures of clinical benefit of a variety of therapeutic interventions have been disproven and disposed of in the subsequent years. The use of surrogate measures like the partial suppression of AF rather than morbidity and mortality outcomes to establish clinical benefit, have been largely discarded as a dead end.
The Catheter Ablation Versus Anti-arrhythmic Drug Therapy for Atrial Fibrillation Trial (CABANA), which is beginning to recruit more than 2,000 patients with new-onset or undertreated paroxysmal, persistent, or longstanding AF to be followed for over 4 years may answer the question of whether radiofrequency ablation therapy, rate control, or rhythm control provides the best clinical treatment of atrial fibrillation. The primary outcome will be the composite endpoint of total mortality, disabling stroke or serious bleeding, or cardiac arrest. An important secondary endpoint will be total mortality. Until its conclusion, we should proceed cautiously with expanding radiofrequency ablation therapy for the treatment of AF.
Dr. Goldstein, medical editor of Cardiology News, is professor of medicine at Wayne State University and division head emeritus of cardiovascular medicine at Henry Ford Hospital, both in Detroit. He is on data safety monitoring committees for the National Institutes of Health and several pharmaceutical companies.

Punctate Depigmented Macules
The Diagnosis: Blaschkoid Punctate Vitiligo
Based on the patient’s clinical appearance as well as the histologic findings, the diagnosis of vitiligo was made. Although vitiligo is certainly not uncommon and punctate vitiligo is a known clinical presentation,1 punctate vitiliginous depigmentation conforming to lines of Blaschko is unique. Follicular repigmentation in a patch of vitiligo potentially could lead to this “spotty” appearance, but our patient maintained that the band was never confluently depigmented and that small macules arose within normally pigmented skin. The patient’s adult age at onset makes this case even more unusual.
Follicular repigmentation in vitiligo is fairly well understood, as the perifollicular pigment is formed by upward migration of activated melanoblasts in the outer root sheath.2 Follicular depigmentation as well as selective or initial loss of melanocytes around hair follicles in early vitiligo has not been described. It is unclear if the seemingly folliculocentric nature of the patient’s vitiliginous macules was a false observation, coincidental, or actually related to selective melanocyte loss around follicles.
Blaschkoid distribution has been described in numerous skin disorders and is known to be based on genetic mosaicism.3 Most of these disorders are X-linked and/or congenital. However, many acquired skin conditions have been described exhibiting blaschkoid distribution, such as vitiligo, psoriasis, lichen planus, atopic dermatitis, and mycosis fungoides.4,5
Confettilike depigmentation has been described as an unusual clinical variant of vitiligo.1 It also has been reported after psoralen plus UVA therapy in patients with more classic vitiligo,6 numerous domestic chemicals,7 and in association with mycosis fungoides.8 In these cases, punctate lesions were disseminated, symmetric on extremities, or limited to areas exposed to chemicals.
1. Ortonne J-P. Vitiligo and other disorders of hypopigmentation. In: Bolognia JL, Jorizzo JL, Rapini RP, eds. Dermatology. Vol 1. 2nd ed. St. Louis, MO: Mosby; 2003:913-938.
2. Cui J, Shen LY, Wang GC. Role of hair follicles in the repigmentation of vitiligo. J Invest Dermatol. 1991;97:410-416.
3. Happle R. X-chromosome inactivation: role in skin disease expression. Acta Paediatr Suppl. 2006;95:16-23.
4. Taieb A. Linear atopic dermatitis (“naevus atopicus”): a pathogenetic clue? Br J Dermatol. 1994;131:134-135.
5. Bolognia JL, Orlow SJ, Glick SA. Lines of Blaschko. J Am Acad Dermatol. 1994;31:157-190.
6. Falabella R, Escobar CE, Carrascal E, et al. Leukoderma punctata. J Am Acad Dermatol. 1988;18:485-494.
7. Ghosh S, Mukhopadhyay S. Chemical leucoderma: a clinico-aetiological study of 864 cases in the perspective of a developing country. Br J Dermatol. 2009;160:40-47.
8. Loquai C, Metza D, Nashan D, et al. Confetti-like lesions with hyperkeratosis: a novel ultraviolet-induced hypomelanotic disorder? Br J Dermatol. 2005;153:190-193.
The Diagnosis: Blaschkoid Punctate Vitiligo
Based on the patient’s clinical appearance as well as the histologic findings, the diagnosis of vitiligo was made. Although vitiligo is certainly not uncommon and punctate vitiligo is a known clinical presentation,1 punctate vitiliginous depigmentation conforming to lines of Blaschko is unique. Follicular repigmentation in a patch of vitiligo potentially could lead to this “spotty” appearance, but our patient maintained that the band was never confluently depigmented and that small macules arose within normally pigmented skin. The patient’s adult age at onset makes this case even more unusual.
Follicular repigmentation in vitiligo is fairly well understood, as the perifollicular pigment is formed by upward migration of activated melanoblasts in the outer root sheath.2 Follicular depigmentation as well as selective or initial loss of melanocytes around hair follicles in early vitiligo has not been described. It is unclear if the seemingly folliculocentric nature of the patient’s vitiliginous macules was a false observation, coincidental, or actually related to selective melanocyte loss around follicles.
Blaschkoid distribution has been described in numerous skin disorders and is known to be based on genetic mosaicism.3 Most of these disorders are X-linked and/or congenital. However, many acquired skin conditions have been described exhibiting blaschkoid distribution, such as vitiligo, psoriasis, lichen planus, atopic dermatitis, and mycosis fungoides.4,5
Confettilike depigmentation has been described as an unusual clinical variant of vitiligo.1 It also has been reported after psoralen plus UVA therapy in patients with more classic vitiligo,6 numerous domestic chemicals,7 and in association with mycosis fungoides.8 In these cases, punctate lesions were disseminated, symmetric on extremities, or limited to areas exposed to chemicals.
1. Ortonne J-P. Vitiligo and other disorders of hypopigmentation. In: Bolognia JL, Jorizzo JL, Rapini RP, eds. Dermatology. Vol 1. 2nd ed. St. Louis, MO: Mosby; 2003:913-938.
2. Cui J, Shen LY, Wang GC. Role of hair follicles in the repigmentation of vitiligo. J Invest Dermatol. 1991;97:410-416.
3. Happle R. X-chromosome inactivation: role in skin disease expression. Acta Paediatr Suppl. 2006;95:16-23.
4. Taieb A. Linear atopic dermatitis (“naevus atopicus”): a pathogenetic clue? Br J Dermatol. 1994;131:134-135.
5. Bolognia JL, Orlow SJ, Glick SA. Lines of Blaschko. J Am Acad Dermatol. 1994;31:157-190.
6. Falabella R, Escobar CE, Carrascal E, et al. Leukoderma punctata. J Am Acad Dermatol. 1988;18:485-494.
7. Ghosh S, Mukhopadhyay S. Chemical leucoderma: a clinico-aetiological study of 864 cases in the perspective of a developing country. Br J Dermatol. 2009;160:40-47.
8. Loquai C, Metza D, Nashan D, et al. Confetti-like lesions with hyperkeratosis: a novel ultraviolet-induced hypomelanotic disorder? Br J Dermatol. 2005;153:190-193.
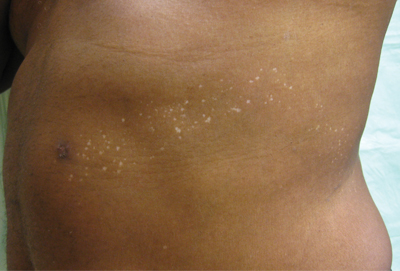
An otherwise healthy 54-year-old black man presented with a 10-year history of spotty pigmentary loss in a band on the left side of the abdomen, flank, and back. He denied a history of rash or inflammation in the area and had not experienced confluent depigmentation. He reported that initially he had only a few “white dots,” and over the next 5 to 7 years, he developed more of them confined within the same area. On presentation, he stated new areas of depigmentation had not developed in several years. The band was completely asymptomatic and had not been treated with any prescription or over-the-counter medications. On examination he had multiple 2- to 3-mm confettilike depigmented macules that seemed to be centered around follicles in a band with blaschkoid distribution extending across the left side of the abdomen, flank, and back. The band did not cross the midline and similar lesions were not present elsewhere. A punch biopsy of one of the depigmented macules revealed a markedly diminished number of melanocytes along the junction as well as a decrease in melanin, which was confirmed by Melan-A and Fontana stains, respectively.

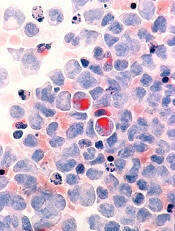
Team identifies mechanism of resistance in AML
Credit: Lance Liotta
New research has revealed a mechanism of drug resistance in acute myeloid leukemia (AML) that may also occur in other cancers.
Investigators found evidence suggesting that glioma-associated protein 1 (GLI1) and the UDP glucuronosyltransferase (UGT1A) family of enzymes drive resistance to 2 drugs—ribavirin and cytarabine—in AML.
But the researchers were able to overcome this resistance by genetic or pharmacologic inhibition of GLI1.
They described this research in a letter to Nature.
“By studying drug-resistant cancer cells from AML patients and head and neck tumors, we found that a gene called GLI1 is dramatically overactive in these cells,” said study author Hiba Zahreddine, a doctoral student at the University of Montreal in Canada.
“[W[e were then able to show that this results in a specific chemical change to the drugs that prevents their toxicity toward the cancer cells,” said author Kathy Borden, PhD, of the University of Montreal’s Institute for Research in Immunology and Cancer.
Specifically, the investigators found that UGT1A enzymes add glucuronic acid to the drugs, thereby modifying their activity. And GLI1 alone is sufficient to drive UGT1A-dependent glucuronidation of ribavirin and cytarabine, which fuels drug resistance.
Fortunately, the researchers found that inhibiting GLI1, either genetically or with pharmacologic inhibitors, could force cancer cells to revert to a treatment-sensitive state.
The team therefore hopes that using GLI1 inhibitors in combination with ribavirin, cytarabine, or other therapies can overcome treatment resistance in patients with AML. The investigators have received approval from Health Canada to conduct a new clinical trial to test this theory.
“If this new approach is successful, it could have very broad applications, since the mode of action of ribavirin suggests that it could be effective against up to 30% of all cancers, including some types of breast, prostate, colon, stomach, and head and neck cancers, in addition to AML,” said Morris Goodman, co-founder and Chairman of the Board of Pharmascience Inc., the company that manufactured the ribavirin for this research. ![]()
Tests may help before liver transplant, not after
CHICAGO – Two laboratory measurements that are commonly used to assess the cause of symptomatic ascites before liver transplant may be deceptive when used to assess posttransplant ascites, a retrospective study of 15 patients suggested.
Before liver transplant, a serum-ascites albumin gradient (SAAG) greater than 1.1 g/dL differentiates ascites due to portal hypertension rather than other causes 97% of the time. An ascites total protein (aTP) measurement has a lower accuracy for portal hypertension of 57%, but when used in conjunction with SAAG, an aTP of 2.5 g/dL or greater suggests that the cause is cardiac ascites, tuberculous ascites, or peritoneal carcinomatosis, Dr. Jeffrey LaFond explained at the annual Digestive Disease Week.

He and his associates studied the records of 15 patients who developed symptomatic post-transplant ascites that had enough volume to require therapeutic paracentesis. The ascites occurred a mean of 515 days after transplantation (ranging from 14 to 2,744 days). In the work-up for ascites, the sensitivity of SAAG for portal hypertension was 82% and the sensitivity of aTP for portal hypertension was 50%.
Three of 12 patients who had a posttransplant SAAG had a gradient below 1.1 g/dL even though other tests found no evidence of another cause for ascites besides portal hypertension, and two of those three patients had confirmed portal hypertension, he reported. Five of 10 patients with an aTP had a value greater than 2.5 g/dL, even though they had confirmed portal hypertension and normal cardiac function, he reported.
"Assessment of ascites due to portal hypertension and/or vascular stricture in the posttransplant period using SAAG and aTP can be deceiving and cannot be relied upon to make diagnostic interventional decisions," said Dr. LaFond of the University of Virginia, Charlottesville. "A hepatic venogram should be performed early on in patients with posttransplant ascites to evaluate for strictures and portal hypertension.
Records showed that all patients in the study had ascites confirmed by imaging and/or paracenteses and had diagnostic studies to rule out heart failure, opportunistic infection, or malignancy as the source of ascites. Suspected portal hypertension was confirmed by pressure measurements or the presence of vascular strictures on venogram, with portal hypertension defined as a sinusoidal or portosystemic gradient greater than 5 or the presence of a stricture with a gradient of at least 3.
An estimated 3%-7% of patients develop ascites after liver transplant, which has been associated with an increased risk of renal impairment, prolonged hospitalization, and abdominal infections, he said.
Dr. LaFond reported having no financial disclosures.
On Twitter @sherryboschert
*This story was updated 6/3/2014.
CHICAGO – Two laboratory measurements that are commonly used to assess the cause of symptomatic ascites before liver transplant may be deceptive when used to assess posttransplant ascites, a retrospective study of 15 patients suggested.
Before liver transplant, a serum-ascites albumin gradient (SAAG) greater than 1.1 g/dL differentiates ascites due to portal hypertension rather than other causes 97% of the time. An ascites total protein (aTP) measurement has a lower accuracy for portal hypertension of 57%, but when used in conjunction with SAAG, an aTP of 2.5 g/dL or greater suggests that the cause is cardiac ascites, tuberculous ascites, or peritoneal carcinomatosis, Dr. Jeffrey LaFond explained at the annual Digestive Disease Week.
He and his associates studied the records of 15 patients who developed symptomatic post-transplant ascites that had enough volume to require therapeutic paracentesis. The ascites occurred a mean of 515 days after transplantation (ranging from 14 to 2,744 days). In the work-up for ascites, the sensitivity of SAAG for portal hypertension was 82% and the sensitivity of aTP for portal hypertension was 50%.
Three of 12 patients who had a posttransplant SAAG had a gradient below 1.1 g/dL even though other tests found no evidence of another cause for ascites besides portal hypertension, and two of those three patients had confirmed portal hypertension, he reported. Five of 10 patients with an aTP had a value greater than 2.5 g/dL, even though they had confirmed portal hypertension and normal cardiac function, he reported.
"Assessment of ascites due to portal hypertension and/or vascular stricture in the posttransplant period using SAAG and aTP can be deceiving and cannot be relied upon to make diagnostic interventional decisions," said Dr. LaFond of the University of Virginia, Charlottesville. "A hepatic venogram should be performed early on in patients with posttransplant ascites to evaluate for strictures and portal hypertension.
Records showed that all patients in the study had ascites confirmed by imaging and/or paracenteses and had diagnostic studies to rule out heart failure, opportunistic infection, or malignancy as the source of ascites. Suspected portal hypertension was confirmed by pressure measurements or the presence of vascular strictures on venogram, with portal hypertension defined as a sinusoidal or portosystemic gradient greater than 5 or the presence of a stricture with a gradient of at least 3.
An estimated 3%-7% of patients develop ascites after liver transplant, which has been associated with an increased risk of renal impairment, prolonged hospitalization, and abdominal infections, he said.
Dr. LaFond reported having no financial disclosures.
On Twitter @sherryboschert
*This story was updated 6/3/2014.
AT DDW 2014
Key clinical point: Serum-ascites albumin gradient and ascites total protein cannot be relied upon to differentiate the cause of ascites after liver transplant.
Major finding: The sensitivity for portal hypertension as the cause of ascites after liver transplant was 82% for SAAG and 50% for aTP.
Data source: A retrospective study of 15 patients who developed symptomatic ascites after liver transplantation that required intervention.
Disclosures: Dr. LaFond reported having no financial disclosures.

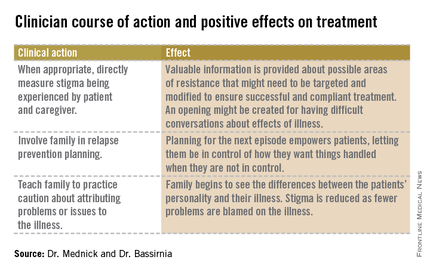
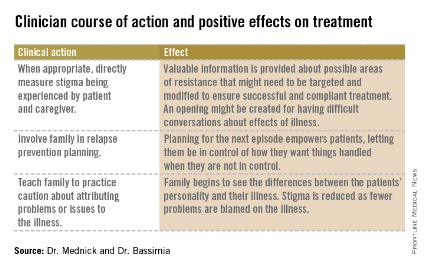
Four questions address stigma
Naomi is a 61-year-old woman who has lived with bipolar disorder and its stigma for 30 years. After a major manic episode and hospitalization, she entered into family treatment at the urging of her three daughters. Previously, her husband had been the primary force in guiding her psychiatric care, and she had been in treatment with a psychiatrist who is his professional colleague.
The patient’s first depressive episode began in the postpartum period, but she did not seek help at that time because she thought that her feelings were normal for a new mother. She did not receive any psychiatric attention until she cycled into mania and called the police for fear her child was being poisoned by neighbors. Her most recent manic episode occurred after she stopped her medications because of concerns about side effects. She was too embarrassed to tell her husband or doctor. She routinely fails to tell her other medical doctors that she is on mood stabilizers, because she does not want them to know she has bipolar disorder.
As Naomi recovers from the most recent manic episode and settles into family treatment, she is struggling with the consequences of her actions to her family. In family therapy in the past, her husband has revealed his belief that he has been protecting the family from Naomi’s mania and protecting Naomi from "embarrassing herself." This is difficult for Naomi to hear as she has always prided herself on being a good mother and protecting her daughters. Naomi’s situation illustrates the difficulty of coping with a diagnosis of bipolar disorder, the consequences of the illness on the family, and the importance of addressing stigma.
How stigma gets in the way
As discussed previously by Dr. Alison M. Heru ("Mental illness stigma is a family affair," Clinical Psychiatry News, April 2014, p. 8), stigma, when internalized or self-directed, can lead to psychological distress, decreased self-esteem and life satisfaction, and increased depression and suicidality (Compr. Psychiatry 2010;51:603-6). Close family members of those with mental disorders are affected by stigma, commonly referred to as "stigma by association" or "courtesy stigma."
Up to 92% of caregivers of people with psychiatric disorders have reported internalized stigma (J. Psychiatr. Ment. Health Nurs. 2012;19:665-71). These family members become distant and avoidant, resulting in a reduced quality of life and an impaired ability to provide critical support for their loved ones. Caregiver anxiety is inversely related to patient anxiety, stigma, and poor alliance (J. Nerv. Ment. Disease 2011;199:18-24).
As a result of these factors, while people with psychiatric disorders have to cope with their own mental illness as well as the public and self-stigma that alienate them from society, they also are at risk of losing their family connections.
In order to confront stigma, the Family Center for Bipolar Disorder in New York City, for example, uses a Family Inclusive Treatment (FIT) model. The FIT model includes an engagement period at the initiation of treatment that is focused on psychoeducation and relapse prevention planning. FIT is unique in that every patient is required to sign a release of information giving permission for full, open communication at all times between the patient’s clinician and a treatment partner of their choice. After the initial engagement period, there are quarterly family visits to supplement regular individual treatment sessions. FIT treatment promotes open communication about symptoms and medications. FIT strives to minimize patient isolation from families; they can talk openly with one another and their clinician.

After seeing many families enter treatment, FIT staff noticed the prominence of stigma.
We have begun to ask about stigma directly. Do people with more stigma do worse in treatment? Do they adhere more poorly to treatment? Do their families tend to become less involved over time? To begin, Dr. Mednick and staff examined demographic data looking for factors that might predispose a person to experience increased stigma.
In terms of diagnosis, people with more internalizing disorders such as depression and anxiety disorders tend to experience more stigma. Distress is experienced internally. As Dr. Bassirnia and her colleagues wrote in a poster presented at the recent American Psychiatric Association meeting, people with externalizing disorders, such as substance abuse and antisocial disorders, are more likely to express their distress outwardly and are less likely to suffer from stigma ("The relationship between personality traits and perceived internalized stigma in bipolar patients and their caregivers," 2014).
Meanwhile, two systematic review studies have reported moderate to high levels of internalized stigma in people with bipolar disorder. In these studies, a higher level of internalized stigma had a negative correlation with self-esteem, social adjustment, and perceived social support, and positive correlation with severity of symptoms, functional impairment, and rehospitalization. In spite of having more severe symptoms; people with higher levels of self-stigma are less likely to seek professional help and adhere to their treatment. Stigma by association and its negative consequences in caregivers of people with mental disorders also have been reported (J. Affect. Disord. 2013;150:181-91).
A useful and easy to administer scale that helps to identify stigma is the "Perceived Criticism Scale" (J. Abnorm. Psychol. 1989;98:225-35). By asking four questions, the clinician can get a good sense of family dynamics and can monitor the progress and change over time. The questions rate perception on a scale of 1-10, where "X" is the other person involved in treatment, either patient or caregiver. Here are the questions:
1. How critical do you think you are of X?
2. How critical do you think X is of you?
3. When X criticizes you, how upset do you get?
4. When you criticize X, how upset does he/she get?
For families with high scores, follow-up is needed. The Internalized Stigma of Mental Illness (ISMI) scale (Psychiatry Res. 2003;121:31-49) can be used. The ISMI scale makes statements about stigma for which participants rate their agreement on a Likert scale, such as:
• I don’t talk about myself much because I don’t want to burden others with my mental illness.
• Being around people who don’t have a mental illness makes me feel out of place or inadequate.
• People can tell that I have a mental illness by the way I look.
• Mentally ill people tend to be violent.
• I feel out of place in the world because I have a mental illness.
The ISMI scale contains 29 short, simple statements like the ones above and can be completed in less than 10 minutes. The statements are designed to avoid hypothetical situations, stay focused in the present, and address the participant’s own identity and experience.
Using the tools in practice
Naomi entered family treatment with her husband and daughters. Using the ISMI to measure the stigma of mental illness that each family member was experiencing, Naomi was shocked to see that her daughters felt far less stigma about having a mother with mental illness than she had assumed. In turn, her daughters were shocked at how much stigma Naomi was experiencing. Naomi’s husband scored between them. This data paved the way for an open family conversation about how Naomi’s illness had affected their lives, and especially how Naomi’s husband and his perceptions of her illness had affected her treatment course.
Caregivers play a very important role in bipolar disorder. After all, the illness can lead to difficulty functioning and can threaten the family’s stability. Sometimes caregivers can serve as a source of strength and a beacon of stability in the occasional storm. It is hard for the family between the storms, when the same flashing beacon can be a constant reminder to the patient of their illness. Often, well intentioned concerns become constant checking up, making the patient feel stigmatized and expected to fail.
"Good" caregivers will be aware of the stigma and the impact it has on their loved one and on themselves, without becoming a source of stigma.
Dr. Mednick is an attending psychiatrist at the Family Center for Bipolar at Mount Sinai Beth Israel in New York City. Dr. Bassirnia is a second-year psychiatry resident at Mount Sinai Beth Israel. Scan the QR code to read more Families in Psychiatry columns at clinicalpsychiatrynews.com.
Naomi is a 61-year-old woman who has lived with bipolar disorder and its stigma for 30 years. After a major manic episode and hospitalization, she entered into family treatment at the urging of her three daughters. Previously, her husband had been the primary force in guiding her psychiatric care, and she had been in treatment with a psychiatrist who is his professional colleague.
The patient’s first depressive episode began in the postpartum period, but she did not seek help at that time because she thought that her feelings were normal for a new mother. She did not receive any psychiatric attention until she cycled into mania and called the police for fear her child was being poisoned by neighbors. Her most recent manic episode occurred after she stopped her medications because of concerns about side effects. She was too embarrassed to tell her husband or doctor. She routinely fails to tell her other medical doctors that she is on mood stabilizers, because she does not want them to know she has bipolar disorder.
As Naomi recovers from the most recent manic episode and settles into family treatment, she is struggling with the consequences of her actions to her family. In family therapy in the past, her husband has revealed his belief that he has been protecting the family from Naomi’s mania and protecting Naomi from "embarrassing herself." This is difficult for Naomi to hear as she has always prided herself on being a good mother and protecting her daughters. Naomi’s situation illustrates the difficulty of coping with a diagnosis of bipolar disorder, the consequences of the illness on the family, and the importance of addressing stigma.
How stigma gets in the way
As discussed previously by Dr. Alison M. Heru ("Mental illness stigma is a family affair," Clinical Psychiatry News, April 2014, p. 8), stigma, when internalized or self-directed, can lead to psychological distress, decreased self-esteem and life satisfaction, and increased depression and suicidality (Compr. Psychiatry 2010;51:603-6). Close family members of those with mental disorders are affected by stigma, commonly referred to as "stigma by association" or "courtesy stigma."
Up to 92% of caregivers of people with psychiatric disorders have reported internalized stigma (J. Psychiatr. Ment. Health Nurs. 2012;19:665-71). These family members become distant and avoidant, resulting in a reduced quality of life and an impaired ability to provide critical support for their loved ones. Caregiver anxiety is inversely related to patient anxiety, stigma, and poor alliance (J. Nerv. Ment. Disease 2011;199:18-24).
As a result of these factors, while people with psychiatric disorders have to cope with their own mental illness as well as the public and self-stigma that alienate them from society, they also are at risk of losing their family connections.
In order to confront stigma, the Family Center for Bipolar Disorder in New York City, for example, uses a Family Inclusive Treatment (FIT) model. The FIT model includes an engagement period at the initiation of treatment that is focused on psychoeducation and relapse prevention planning. FIT is unique in that every patient is required to sign a release of information giving permission for full, open communication at all times between the patient’s clinician and a treatment partner of their choice. After the initial engagement period, there are quarterly family visits to supplement regular individual treatment sessions. FIT treatment promotes open communication about symptoms and medications. FIT strives to minimize patient isolation from families; they can talk openly with one another and their clinician.
After seeing many families enter treatment, FIT staff noticed the prominence of stigma.
We have begun to ask about stigma directly. Do people with more stigma do worse in treatment? Do they adhere more poorly to treatment? Do their families tend to become less involved over time? To begin, Dr. Mednick and staff examined demographic data looking for factors that might predispose a person to experience increased stigma.
In terms of diagnosis, people with more internalizing disorders such as depression and anxiety disorders tend to experience more stigma. Distress is experienced internally. As Dr. Bassirnia and her colleagues wrote in a poster presented at the recent American Psychiatric Association meeting, people with externalizing disorders, such as substance abuse and antisocial disorders, are more likely to express their distress outwardly and are less likely to suffer from stigma ("The relationship between personality traits and perceived internalized stigma in bipolar patients and their caregivers," 2014).
Meanwhile, two systematic review studies have reported moderate to high levels of internalized stigma in people with bipolar disorder. In these studies, a higher level of internalized stigma had a negative correlation with self-esteem, social adjustment, and perceived social support, and positive correlation with severity of symptoms, functional impairment, and rehospitalization. In spite of having more severe symptoms; people with higher levels of self-stigma are less likely to seek professional help and adhere to their treatment. Stigma by association and its negative consequences in caregivers of people with mental disorders also have been reported (J. Affect. Disord. 2013;150:181-91).
A useful and easy to administer scale that helps to identify stigma is the "Perceived Criticism Scale" (J. Abnorm. Psychol. 1989;98:225-35). By asking four questions, the clinician can get a good sense of family dynamics and can monitor the progress and change over time. The questions rate perception on a scale of 1-10, where "X" is the other person involved in treatment, either patient or caregiver. Here are the questions:
1. How critical do you think you are of X?
2. How critical do you think X is of you?
3. When X criticizes you, how upset do you get?
4. When you criticize X, how upset does he/she get?
For families with high scores, follow-up is needed. The Internalized Stigma of Mental Illness (ISMI) scale (Psychiatry Res. 2003;121:31-49) can be used. The ISMI scale makes statements about stigma for which participants rate their agreement on a Likert scale, such as:
• I don’t talk about myself much because I don’t want to burden others with my mental illness.
• Being around people who don’t have a mental illness makes me feel out of place or inadequate.
• People can tell that I have a mental illness by the way I look.
• Mentally ill people tend to be violent.
• I feel out of place in the world because I have a mental illness.
The ISMI scale contains 29 short, simple statements like the ones above and can be completed in less than 10 minutes. The statements are designed to avoid hypothetical situations, stay focused in the present, and address the participant’s own identity and experience.
Using the tools in practice
Naomi entered family treatment with her husband and daughters. Using the ISMI to measure the stigma of mental illness that each family member was experiencing, Naomi was shocked to see that her daughters felt far less stigma about having a mother with mental illness than she had assumed. In turn, her daughters were shocked at how much stigma Naomi was experiencing. Naomi’s husband scored between them. This data paved the way for an open family conversation about how Naomi’s illness had affected their lives, and especially how Naomi’s husband and his perceptions of her illness had affected her treatment course.
Caregivers play a very important role in bipolar disorder. After all, the illness can lead to difficulty functioning and can threaten the family’s stability. Sometimes caregivers can serve as a source of strength and a beacon of stability in the occasional storm. It is hard for the family between the storms, when the same flashing beacon can be a constant reminder to the patient of their illness. Often, well intentioned concerns become constant checking up, making the patient feel stigmatized and expected to fail.
"Good" caregivers will be aware of the stigma and the impact it has on their loved one and on themselves, without becoming a source of stigma.
Dr. Mednick is an attending psychiatrist at the Family Center for Bipolar at Mount Sinai Beth Israel in New York City. Dr. Bassirnia is a second-year psychiatry resident at Mount Sinai Beth Israel. Scan the QR code to read more Families in Psychiatry columns at clinicalpsychiatrynews.com.
Scientists’ success in job market is predictable, study suggests

Credit: Rhoda Baer
A scientist’s chances of landing a faculty position at an academic institution are predictable based solely on his or her publication record, according to a study published in Current Biology.
Chances depend mostly on the number of publications the scientist has, the impact factor of the journals in which those papers are published, and the number of papers that receive more citations than expected based on the journal in which they were published, the researchers said.
“We’d like to start a discussion on what factors are taken into account when people are selected to become a principal investigator,” said study author David van Dijk, PhD, of the Weizmann Institute of Science in Rehovot, Israel.
“On the one hand, these results are encouraging, because they suggest that people are promoted based on merit. On the other hand, many of the most groundbreaking papers were not published in high-impact-factor journals and did not initially receive a high number of citations. This filtering method will certainly miss some phenomenal and ahead-of-their time scientists.”
Dr Van Dijk said he and his colleagues were motivated by endless conversations with fellow graduate students and post docs, who were dreaming of their first paper in a prestigious journal. There was the sense that those publications were the tickets to success.
So Dr van Dijk and his colleagues wanted to see if they could find evidence to that effect. And, indeed, they could.
The researchers generated publication record data for more than 25,000 scientists and used a machine-learning approach to generate a model of each individual’s chances of moving from the first-author position, typically reserved for trainees, to the last-author position, a place most often held by principal investigators (PIs).
“We find that whether or not a scientist becomes a PI is largely predictable by their publication record, even taking into account only the first few years of publication,” the researchers reported. “Our model is able to predict with relatively high accuracy who becomes a PI and is also able to predict how long this will take.”
To calculate your own likelihood of success using this model, visit: http://www.pipredictor.com.
Dr Van Dijk said the study results suggest the current system is working. Understanding how it works might be useful for those thinking through their careers or for those on hiring committees who might like to allow factors outside of the publication record to factor more significantly in hiring decisions.
The authors don’t recommend that scientists make decisions about their futures based solely on their PI prediction scores, of course. There are surely plenty of other harder-to-quantify factors that can also play a role. And there is some hopeful news for those who are persistent, even if they haven’t landed that stellar paper just yet.
“There is an element of luck in getting a paper in Nature, Cell, or Science, so it can be frustrating if you think you are a good scientist and want to succeed, but that high-impact-factor paper just doesn’t happen,” Dr van Dijk said.
“It’s encouraging that we find that doing good-quality science on a consistent basis—as evidenced by multiple first-author papers of reasonable impact factor—does seem to be rewarded in the end.” ![]()
Impact of Pocket Ultrasound Use
Applications of point‐of‐care ultrasonography (POC‐US) have grown rapidly over the past 20 years. POC‐US training is required by the Accreditation Council for Graduate Medical Education for several graduate medical education training programs, including emergency medicine residency and pulmonary/critical care fellowships.[1] Recent efforts have examined the utility of ultrasound in the education of medical students[2] and the diagnostic and procedural applications performed by residents.[3] One powerful application of POC‐US is the use of lung ultrasound to diagnose causes of respiratory failure at the bedside.[4] Although lung ultrasound has been shown to have superior diagnostic accuracy to chest x‐rays,[5] limited availability of expert physicians and ultrasound equipment have presented barriers to wider application. The advent of lower cost pocket ultrasounds may present a solution given the early reports of similar efficacy to traditional devices in the assessment of left ventricular dysfunction, acute decompensated heart failure,[6] and focused assessment with sonography for trauma.[7] We assessed the feasibility and diagnostic accuracy of residents trained in lung ultrasound with a pocket device for evaluating patients with dyspnea.
MATERIALS AND METHODS
Study Design
We performed a prospective, observational study of internal medicine residents performing lung ultrasound with a pocket ultrasound from September 2012 to August 2013 at Beth Israel Medical Center, an 856‐bed teaching hospital in New York City. This study was approved by the Committee of Scientific Affairs of Beth Israel Medical Center, which waived the requirement for informed consent (institutional review board #016‐10). Ten pocket ultrasounds (Vscan; GE Vingmed Ultrasound, Horten, Norway) were acquired through an educational grant from General Electric Company. Grant sponsors were not involved in any aspect of the study.
Recruitment and Training
One hundred nineteen internal medicine residents were offered training on lung ultrasound in return for participating in the study. Initially, 10 residents from 3 postgraduate years with no previous lung ultrasound experience volunteered for the study and received a pocket ultrasound along with either focused or extended training. Focused and extended training groups both received 2 sessions of 90 minutes that included didactics covering image creation of the 5 main diagnostic lung ultrasound patterns and their pathological correlates. Sessions also included training in the operation of a pocket ultrasound along with bedside instruction in image acquisition using an 8‐point exam protocol (Figure 1A). All residents were required to demonstrate competency in this 8‐point protocol with proper image acquisition and interpretation of 3 lung ultrasound exams under direct supervision by an expert practitioner (P.K.). Only 5 residents completed the training due mostly to other commitments. Two extended training residents, both authors of this article, who plan to continue training in pulmonary and critical care medicine, volunteered for an additional 2‐week general critical care ultrasound elective. This elective included daily bedside supervised performance and interpretation of lung ultrasound patterns on at least 15 patients admitted during intensive care unit rounds.
Patient Selection
Patients admitted to a resident's service were considered for inclusion at their convenience if the patient reported a chief complaint of dyspnea.
Diagnostic Protocol
Upon admission, residents recorded a clinical diagnosis of dyspnea based on a standard diagnostic evaluation including complete history, physical exam, and all relevant laboratory and imaging studies, including chest x‐ray and computed tomography (CT) scans. A diagnosis of dyspnea after lung ultrasound was then recorded based on the lung ultrasound findings and integrated with all other clinical information available. Standard lung ultrasound patterns and diagnostic correlates are shown in Figure 1. Diagnoses of dyspnea were recorded as one of 7 possibilities; 1) exacerbation of chronic obstructive pulmonary disease or asthma (COPD/asthma), 2) acute pulmonary edema (APE), 3) pneumonia (PNA), 4) pulmonary embolus (PE), 5) pneumothorax (PTX), 6) pleural effusion (PLEFF), and 7) other (OTH), namely anemia, ascites, and dehydration.
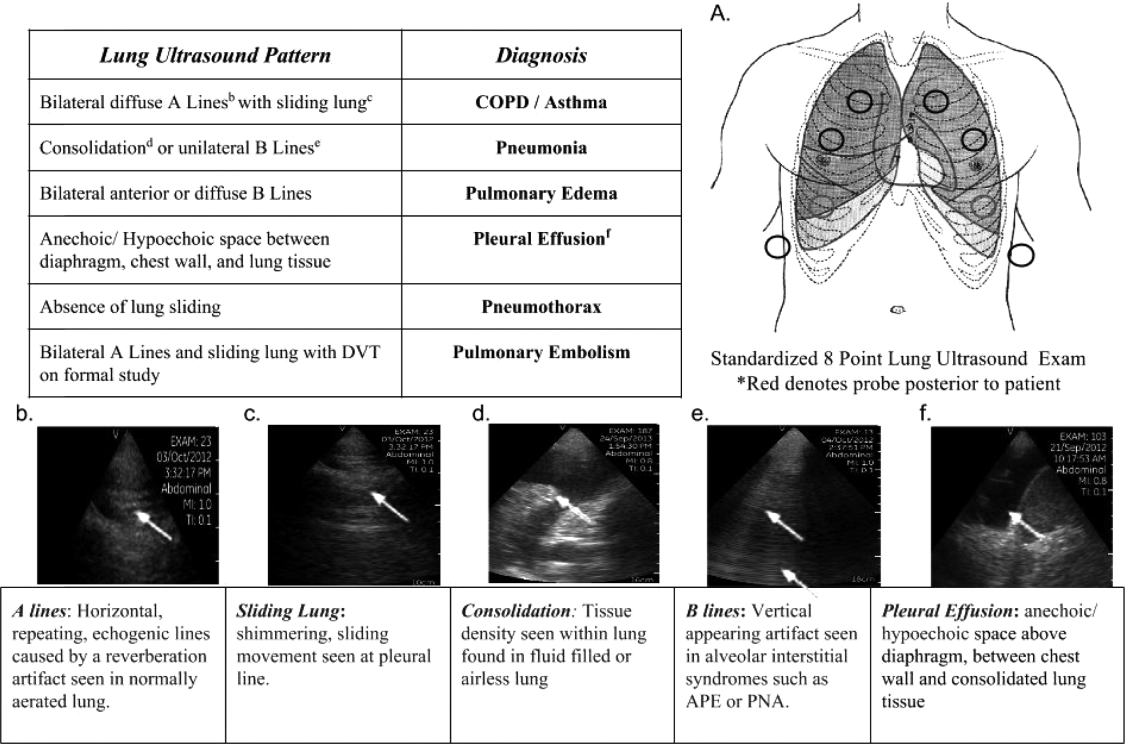
Data Collection
Patient demographics, comorbidities, lung ultrasound findings, and both clinical and ultrasound diagnosis were recorded on a standardized form. A final diagnosis based on the attending physicians' diagnosis of dyspnea was determined through chart review by 3 investigators blinded to the clinical and ultrasound diagnoses. Discordant findings were resolved by consensus. Attending physicians were blinded to the lung ultrasound exam results.
Statistical Analysis
Sensitivity and specificity of the clinical and ultrasound diagnoses for focused and extended training groups were calculated for each diagnosis using final attending diagnosis as the gold standard. Causes of dyspnea were often deemed multifactorial, leading to more than 1 diagnosis recorded per patient exam. Overall diagnostic accuracy was calculated for each group using the reported clinical, ultrasound, and final diagnoses. Receiver operating curve (ROC) analysis was performed with Stata 12.1 (StataCorp, College Station, TX).
RESULTS
Five residents performed lung ultrasound on a convenience sample of 69 newly admitted patients. Patient baseline characteristics are shown in Table 1. Three residents made up the focused training group and examined 21 patients, resulting in 27 clinical diagnoses, 27 ultrasound diagnoses, and 31 final attending diagnoses. Two residents made up the extended training group and examined 48 patients, resulting in 61 clinical diagnoses, 60 ultrasound diagnoses, and 60 final attending diagnoses. Improvements in sensitivity and specificity using lung ultrasound were more pronounced for the extended training group and are shown for each diagnosis in Table 2.
| Age, y, mean | 69 |
|---|---|
| |
| Sex, male, % | 52.2 |
| BMI, mean, kg/m2 | 25.7 |
| Comorbidities, % | |
| COPD | 43.3 |
| CHF | 23.9 |
| Hypertension | 59.4 |
| Diabetes mellitus | 29 |
| Atrial fibrillation | 18.9 |
| DVT/PE | 1.5 |
| Lung cancer | 5.9 |
| Finding on admission, % | |
| CXR available | 94 |
| Chest CT available | 22.4 |
| WBC >10.4 K/L | 36.2 |
| BNP >400 pg/mL | 27.5 |
| Temperature >100.9F | 6 |
| Heart rate >90 bpm | 47.8 |
| Desaturation* | 32 |
| Focused Training Group | Extended Training Group | |||||||
|---|---|---|---|---|---|---|---|---|
| CLINDIAG, N=27 | USDIAG, N=27 | CLINDIAG, N=61 | USDIAG, N=20 | |||||
| Diagnosis | Sens, % | Spec, % | Sens, % | Spec, % | Sens, % | Spec, % | Sens, % | Spec, % |
| ||||||||
| COPD/asthma | 60 | 96 | 60 | 96 | 55 | 96 | 91 | 96 |
| Pneumonia | 45 | 90 | 36 | 100 | 93 | 88 | 96 | 100 |
| Pulmonary edema | 100 | 85 | 100 | 86 | 89 | 96 | 89 | 100 |
| Pleural effusion | 57 | 100 | 86 | 96 | 57 | 96 | 100 | 96 |
| Other | 50 | 100 | 75 | 96 | 80 | 96 | 80 | 100 |
Overall diagnostic accuracy using lung ultrasound improved only for the extended training group (clinical 92% vs ultrasound 97%), whereas the focused training group's accuracy was unchanged (clinical 87% vs ultrasound 88%).
ROC analysis demonstrated a superior diagnostic performance of ultrasound when compared to clinical diagnosis (Table 3).
| Diagnosis | CLINDIAG AUC, N=69 | USDIAG AUC, N=69 | P Value |
|---|---|---|---|
| |||
| COPD/asthma | 0.73 | 0.85 | 0.06 |
| Pulmonary edema | 0.85 | 0.89 | 0.49 |
| Pneumonia | 0.77 | 0.88 | 0.01 |
| Pleural effusion | 0.76 | 0.96 | 0.002 |
| Other* | 0.78 | 0.69 | 0.01 |
| All causes, n=69 | 0.81 | 0.87 | 0.01 |
DISCUSSION
In this prospective, observational study of residents performing lung ultrasound of patients with dyspnea, the diagnostic accuracy incorporating ultrasound increased compared to a standard diagnostic approach relying on history, physical exam, blood tests, and radiography. To our knowledge, this is the first study of residents independently performing lung ultrasound with a pocket ultrasound to diagnose dyspnea. Receiver operating curve analysis shows improvements in diagnostic accuracy for causes such as PNA, pleural effusion and COPD/asthma and demonstrates the feasibility and clinical utility of residents using pocket ultrasounds. The finding that improvements in sensitivity and specificity were larger in the extended training group highlights the need for sufficient training to demonstrate increased utility. Although a 2‐week critical care ultrasound elective may not be possible for all residents, perhaps training of intensity somewhere in between these 2 levels would be most feasible.
Challenges in diagnosing dyspnea have been well described, attributed to a lack of accurate history combined with often insensitive and nonspecific physical exam findings, blood tests, and radiographs.[8, 9] Further, patients often present with multiple contributing causes as was evidenced in this study.[10] Lack of initial, accurate diagnoses often leads to the provision of multiple, incorrect treatment regimens that may increase mortality.[11] The high accuracy of lung ultrasound in defining causes of respiratory failure suggests potential as a low‐cost solution.[12]
This study design differed from prior work in several respects. First, it included patients presenting with dyspnea to a hospital ward rather than acute respiratory failure to an intensive care unit (ICU), suggesting its diagnostic potential in a broader population of patients and settings. Second, the lung ultrasound was integrated with traditional clinical information rather than relied upon alone, a situation mimicking real‐world application of POC‐US. Third, operators were residents with limited amounts of training rather than highly trained experts. Finally, the lung ultrasound exams were performed using a pocket ultrasound with inferior imaging capability than larger, more established ultrasound devices. Despite these constraints, the utility of lung ultrasound was still evident, particularly in the diagnosis or exclusion of pneumonia and PLEFF.
Limitations include reliance on a small cohort of highly motivated residents with an interest in pulmonary and critical care, 2 who are authors of this article, making reproducibility a concern. Although convenience sampling may more closely mimic real world practices of POC‐US, a bias toward less challenging patients is possible and may limit conclusions regarding utility. Over‐reading and feedback were not provided to residents to improve their performance of lung ultrasound exams. Also, because chest CT is considered the gold standard in most studies examining the diagnostic accuracy of lung ultrasound, all residents aware of these data may underestimate the potential impact of integrating lung ultrasound with all clinical findings. Finally, the high cost of pocket ultrasounds is a barrier to general use. Recent studies on the significant cost savings associated with POC‐US make a further analysis of cost‐benefit ratios mandatory before broad use can be recommended.[13]
CONCLUSIONS
Residents participating in lung ultrasound training with a pocket ultrasound device showed improved diagnostic accuracy in their evaluation of patients with dyspnea. Those who received extended training had greater improvements across all causes of dyspnea. Training residents to apply lung ultrasound in non‐ICU settings appears to be feasible. Further study with a larger cohort of internal medicine residents and perhaps training duration that lies in between the focused and extended training groups is warranted.
Acknowledgements
The authors thank Dr. David Lucido for guidance on statistical analysis and Stephane Gatesoupe and the Vscan team at General Electric.
Disclosure: Ten Vscan pocket ultrasounds (General Electric) were provided free of cost solely for the purpose of conducting the clinical research study. This represented their sole participation in any stage of the research. The authors have no conflicts of interest to disclose.
- , , , . Barriers to ultrasound training in critical care medicine fellowships: a survey of program directors. Crit Care Med. 2010;38(10):1978–1983.
- , , , et al. Comparison of effectiveness of hand‐carried ultrasound to bedside cardiovascular physical examination. Am J Cardiol. 2005;96(7):1002–1006.
- , , . Diagnosing pulmonary edema: lung ultrasound versus chest radiography. Eur J Emerg Med. 2013;20(5):356–360.
- , . Relevance of lung ultrasound in the diagnosis of acute respiratory failure: the BLUE protocol. Chest. 2008;134(1):117–125.
- , , , et al. Lung ultrasound in the diagnosis and follow‐up of community‐acquired pneumonia: a prospective, multicenter, diagnostic accuracy study. Chest. 2012;142(4):965–972.
- , , , , , . Evaluation of a new pocket echoscopic device for focused cardiac ultrasonography in an emergency setting. Crit Care. 2012;16(3):R82.
- , , , . Our new stethoscope in the emergency department: handheld ultrasound. Ulus Travma Acil Cerrahi Derg. 2011;17(6):488–492.
- , , . Discriminating causes of dyspnea through clinical examination. J Gen Intern Med. 1993;8(7):383–392.
- , , . Does this patient have community‐acquired pneumonia? Diagnosing pneumonia by history and physical examination. JAMA. 1997;278(17):1440–1445.
- , , , et al. Acute respiratory failure in the elderly: etiology, emergency diagnosis and prognosis. Crit Care. 2006;10(3):R82.
- , , , et al. Early interventions in severe sepsis and septic shock: a review of the evidence one decade later. Minerva Anestesiol. 2012;78(6):712–724.
- , , , . Ultrasound diagnosis of alveolar consolidation in the critically ill. Intensive Care Med. 2004;30(2):276–281.
- , , , , , . Ultrasound assessment of pulmonary embolism in patients receiving computerized tomography pulmonary angiography. Chest. 2014;145(4):818–823.
Applications of point‐of‐care ultrasonography (POC‐US) have grown rapidly over the past 20 years. POC‐US training is required by the Accreditation Council for Graduate Medical Education for several graduate medical education training programs, including emergency medicine residency and pulmonary/critical care fellowships.[1] Recent efforts have examined the utility of ultrasound in the education of medical students[2] and the diagnostic and procedural applications performed by residents.[3] One powerful application of POC‐US is the use of lung ultrasound to diagnose causes of respiratory failure at the bedside.[4] Although lung ultrasound has been shown to have superior diagnostic accuracy to chest x‐rays,[5] limited availability of expert physicians and ultrasound equipment have presented barriers to wider application. The advent of lower cost pocket ultrasounds may present a solution given the early reports of similar efficacy to traditional devices in the assessment of left ventricular dysfunction, acute decompensated heart failure,[6] and focused assessment with sonography for trauma.[7] We assessed the feasibility and diagnostic accuracy of residents trained in lung ultrasound with a pocket device for evaluating patients with dyspnea.
MATERIALS AND METHODS
Study Design
We performed a prospective, observational study of internal medicine residents performing lung ultrasound with a pocket ultrasound from September 2012 to August 2013 at Beth Israel Medical Center, an 856‐bed teaching hospital in New York City. This study was approved by the Committee of Scientific Affairs of Beth Israel Medical Center, which waived the requirement for informed consent (institutional review board #016‐10). Ten pocket ultrasounds (Vscan; GE Vingmed Ultrasound, Horten, Norway) were acquired through an educational grant from General Electric Company. Grant sponsors were not involved in any aspect of the study.
Recruitment and Training
One hundred nineteen internal medicine residents were offered training on lung ultrasound in return for participating in the study. Initially, 10 residents from 3 postgraduate years with no previous lung ultrasound experience volunteered for the study and received a pocket ultrasound along with either focused or extended training. Focused and extended training groups both received 2 sessions of 90 minutes that included didactics covering image creation of the 5 main diagnostic lung ultrasound patterns and their pathological correlates. Sessions also included training in the operation of a pocket ultrasound along with bedside instruction in image acquisition using an 8‐point exam protocol (Figure 1A). All residents were required to demonstrate competency in this 8‐point protocol with proper image acquisition and interpretation of 3 lung ultrasound exams under direct supervision by an expert practitioner (P.K.). Only 5 residents completed the training due mostly to other commitments. Two extended training residents, both authors of this article, who plan to continue training in pulmonary and critical care medicine, volunteered for an additional 2‐week general critical care ultrasound elective. This elective included daily bedside supervised performance and interpretation of lung ultrasound patterns on at least 15 patients admitted during intensive care unit rounds.
Patient Selection
Patients admitted to a resident's service were considered for inclusion at their convenience if the patient reported a chief complaint of dyspnea.
Diagnostic Protocol
Upon admission, residents recorded a clinical diagnosis of dyspnea based on a standard diagnostic evaluation including complete history, physical exam, and all relevant laboratory and imaging studies, including chest x‐ray and computed tomography (CT) scans. A diagnosis of dyspnea after lung ultrasound was then recorded based on the lung ultrasound findings and integrated with all other clinical information available. Standard lung ultrasound patterns and diagnostic correlates are shown in Figure 1. Diagnoses of dyspnea were recorded as one of 7 possibilities; 1) exacerbation of chronic obstructive pulmonary disease or asthma (COPD/asthma), 2) acute pulmonary edema (APE), 3) pneumonia (PNA), 4) pulmonary embolus (PE), 5) pneumothorax (PTX), 6) pleural effusion (PLEFF), and 7) other (OTH), namely anemia, ascites, and dehydration.
Data Collection
Patient demographics, comorbidities, lung ultrasound findings, and both clinical and ultrasound diagnosis were recorded on a standardized form. A final diagnosis based on the attending physicians' diagnosis of dyspnea was determined through chart review by 3 investigators blinded to the clinical and ultrasound diagnoses. Discordant findings were resolved by consensus. Attending physicians were blinded to the lung ultrasound exam results.
Statistical Analysis
Sensitivity and specificity of the clinical and ultrasound diagnoses for focused and extended training groups were calculated for each diagnosis using final attending diagnosis as the gold standard. Causes of dyspnea were often deemed multifactorial, leading to more than 1 diagnosis recorded per patient exam. Overall diagnostic accuracy was calculated for each group using the reported clinical, ultrasound, and final diagnoses. Receiver operating curve (ROC) analysis was performed with Stata 12.1 (StataCorp, College Station, TX).
RESULTS
Five residents performed lung ultrasound on a convenience sample of 69 newly admitted patients. Patient baseline characteristics are shown in Table 1. Three residents made up the focused training group and examined 21 patients, resulting in 27 clinical diagnoses, 27 ultrasound diagnoses, and 31 final attending diagnoses. Two residents made up the extended training group and examined 48 patients, resulting in 61 clinical diagnoses, 60 ultrasound diagnoses, and 60 final attending diagnoses. Improvements in sensitivity and specificity using lung ultrasound were more pronounced for the extended training group and are shown for each diagnosis in Table 2.
| Age, y, mean | 69 |
|---|---|
| |
| Sex, male, % | 52.2 |
| BMI, mean, kg/m2 | 25.7 |
| Comorbidities, % | |
| COPD | 43.3 |
| CHF | 23.9 |
| Hypertension | 59.4 |
| Diabetes mellitus | 29 |
| Atrial fibrillation | 18.9 |
| DVT/PE | 1.5 |
| Lung cancer | 5.9 |
| Finding on admission, % | |
| CXR available | 94 |
| Chest CT available | 22.4 |
| WBC >10.4 K/L | 36.2 |
| BNP >400 pg/mL | 27.5 |
| Temperature >100.9F | 6 |
| Heart rate >90 bpm | 47.8 |
| Desaturation* | 32 |
| Focused Training Group | Extended Training Group | |||||||
|---|---|---|---|---|---|---|---|---|
| CLINDIAG, N=27 | USDIAG, N=27 | CLINDIAG, N=61 | USDIAG, N=20 | |||||
| Diagnosis | Sens, % | Spec, % | Sens, % | Spec, % | Sens, % | Spec, % | Sens, % | Spec, % |
| ||||||||
| COPD/asthma | 60 | 96 | 60 | 96 | 55 | 96 | 91 | 96 |
| Pneumonia | 45 | 90 | 36 | 100 | 93 | 88 | 96 | 100 |
| Pulmonary edema | 100 | 85 | 100 | 86 | 89 | 96 | 89 | 100 |
| Pleural effusion | 57 | 100 | 86 | 96 | 57 | 96 | 100 | 96 |
| Other | 50 | 100 | 75 | 96 | 80 | 96 | 80 | 100 |
Overall diagnostic accuracy using lung ultrasound improved only for the extended training group (clinical 92% vs ultrasound 97%), whereas the focused training group's accuracy was unchanged (clinical 87% vs ultrasound 88%).
ROC analysis demonstrated a superior diagnostic performance of ultrasound when compared to clinical diagnosis (Table 3).
| Diagnosis | CLINDIAG AUC, N=69 | USDIAG AUC, N=69 | P Value |
|---|---|---|---|
| |||
| COPD/asthma | 0.73 | 0.85 | 0.06 |
| Pulmonary edema | 0.85 | 0.89 | 0.49 |
| Pneumonia | 0.77 | 0.88 | 0.01 |
| Pleural effusion | 0.76 | 0.96 | 0.002 |
| Other* | 0.78 | 0.69 | 0.01 |
| All causes, n=69 | 0.81 | 0.87 | 0.01 |
DISCUSSION
In this prospective, observational study of residents performing lung ultrasound of patients with dyspnea, the diagnostic accuracy incorporating ultrasound increased compared to a standard diagnostic approach relying on history, physical exam, blood tests, and radiography. To our knowledge, this is the first study of residents independently performing lung ultrasound with a pocket ultrasound to diagnose dyspnea. Receiver operating curve analysis shows improvements in diagnostic accuracy for causes such as PNA, pleural effusion and COPD/asthma and demonstrates the feasibility and clinical utility of residents using pocket ultrasounds. The finding that improvements in sensitivity and specificity were larger in the extended training group highlights the need for sufficient training to demonstrate increased utility. Although a 2‐week critical care ultrasound elective may not be possible for all residents, perhaps training of intensity somewhere in between these 2 levels would be most feasible.
Challenges in diagnosing dyspnea have been well described, attributed to a lack of accurate history combined with often insensitive and nonspecific physical exam findings, blood tests, and radiographs.[8, 9] Further, patients often present with multiple contributing causes as was evidenced in this study.[10] Lack of initial, accurate diagnoses often leads to the provision of multiple, incorrect treatment regimens that may increase mortality.[11] The high accuracy of lung ultrasound in defining causes of respiratory failure suggests potential as a low‐cost solution.[12]
This study design differed from prior work in several respects. First, it included patients presenting with dyspnea to a hospital ward rather than acute respiratory failure to an intensive care unit (ICU), suggesting its diagnostic potential in a broader population of patients and settings. Second, the lung ultrasound was integrated with traditional clinical information rather than relied upon alone, a situation mimicking real‐world application of POC‐US. Third, operators were residents with limited amounts of training rather than highly trained experts. Finally, the lung ultrasound exams were performed using a pocket ultrasound with inferior imaging capability than larger, more established ultrasound devices. Despite these constraints, the utility of lung ultrasound was still evident, particularly in the diagnosis or exclusion of pneumonia and PLEFF.
Limitations include reliance on a small cohort of highly motivated residents with an interest in pulmonary and critical care, 2 who are authors of this article, making reproducibility a concern. Although convenience sampling may more closely mimic real world practices of POC‐US, a bias toward less challenging patients is possible and may limit conclusions regarding utility. Over‐reading and feedback were not provided to residents to improve their performance of lung ultrasound exams. Also, because chest CT is considered the gold standard in most studies examining the diagnostic accuracy of lung ultrasound, all residents aware of these data may underestimate the potential impact of integrating lung ultrasound with all clinical findings. Finally, the high cost of pocket ultrasounds is a barrier to general use. Recent studies on the significant cost savings associated with POC‐US make a further analysis of cost‐benefit ratios mandatory before broad use can be recommended.[13]
CONCLUSIONS
Residents participating in lung ultrasound training with a pocket ultrasound device showed improved diagnostic accuracy in their evaluation of patients with dyspnea. Those who received extended training had greater improvements across all causes of dyspnea. Training residents to apply lung ultrasound in non‐ICU settings appears to be feasible. Further study with a larger cohort of internal medicine residents and perhaps training duration that lies in between the focused and extended training groups is warranted.
Acknowledgements
The authors thank Dr. David Lucido for guidance on statistical analysis and Stephane Gatesoupe and the Vscan team at General Electric.
Disclosure: Ten Vscan pocket ultrasounds (General Electric) were provided free of cost solely for the purpose of conducting the clinical research study. This represented their sole participation in any stage of the research. The authors have no conflicts of interest to disclose.
- , , , . Barriers to ultrasound training in critical care medicine fellowships: a survey of program directors. Crit Care Med. 2010;38(10):1978–1983.
- , , , et al. Comparison of effectiveness of hand‐carried ultrasound to bedside cardiovascular physical examination. Am J Cardiol. 2005;96(7):1002–1006.
- , , . Diagnosing pulmonary edema: lung ultrasound versus chest radiography. Eur J Emerg Med. 2013;20(5):356–360.
- , . Relevance of lung ultrasound in the diagnosis of acute respiratory failure: the BLUE protocol. Chest. 2008;134(1):117–125.
- , , , et al. Lung ultrasound in the diagnosis and follow‐up of community‐acquired pneumonia: a prospective, multicenter, diagnostic accuracy study. Chest. 2012;142(4):965–972.
- , , , , , . Evaluation of a new pocket echoscopic device for focused cardiac ultrasonography in an emergency setting. Crit Care. 2012;16(3):R82.
- , , , . Our new stethoscope in the emergency department: handheld ultrasound. Ulus Travma Acil Cerrahi Derg. 2011;17(6):488–492.
- , , . Discriminating causes of dyspnea through clinical examination. J Gen Intern Med. 1993;8(7):383–392.
- , , . Does this patient have community‐acquired pneumonia? Diagnosing pneumonia by history and physical examination. JAMA. 1997;278(17):1440–1445.
- , , , et al. Acute respiratory failure in the elderly: etiology, emergency diagnosis and prognosis. Crit Care. 2006;10(3):R82.
- , , , et al. Early interventions in severe sepsis and septic shock: a review of the evidence one decade later. Minerva Anestesiol. 2012;78(6):712–724.
- , , , . Ultrasound diagnosis of alveolar consolidation in the critically ill. Intensive Care Med. 2004;30(2):276–281.
- , , , , , . Ultrasound assessment of pulmonary embolism in patients receiving computerized tomography pulmonary angiography. Chest. 2014;145(4):818–823.

Bullying
Bullying affects approximately 20% of children, according to a 2012 survey of 20,000 students in grades 3-12 (Bullying in U.S. Schools 2012 Status Report, published by the Hazelden Foundation 2013).
As pediatricians, we have all faced the grieving parent distraught by the ill treatment of their child. Many of us have probably felt helpless because it’s not a medical issue – or is it? I think we can all agree that it doesn’t start as a medical issue, but for sure it can end as one.
Anxiety, depression, cutting, abdominal pain, headaches, and weight loss can all be the end result of the stress of bullying. Some children are able to be honest about how they are feeling, but many internalize it and parents are sometimes the last to know. Approximately 160,000 students stay home from school everyday because of bullying, according to the National Association of School Psychologists.
Many school systems have adopted antibullying programs in which children are educated on the effects of bullying, how to treat their peers, and what to do if they are bullied. But some recent research shows that these programs may not be successful, and bullying rates are actually higher at schools that have implemented these programs, according to the Canadian Journal of School Psychology (2011;26:283-300).
One of the main differences with bullying now is that social media may play a significant role in the extent of the bullying. Facebook, Instagram, and Snapchat are vehicles that are used by the bully and that can make the extent of the damage much worse. Twenty years ago, a rumor had to spread by word of mouth; now, with just a touch of a button, hundreds of students can see and know of the ill-intended work of a bully.
"Bullycide" is a newly coined term that suggests a child committed suicide because she was bullied. The rate of these occurrences is rising largely because of the attention placed on bullying, but the media also serves as an information trail, which allows us to connect the dots more clearly.
Intervention that we can do as professionals is to identify things that may put a student at risk and try to intervene early. Severe acne, obesity, and social anxiety are all things that can be treated to improve a child’s self-esteem and make them less of a target. Parents are not always in tune to this because their love is unconditional, and they may not recognize the role these play. Using the well-child visit to uncover these issues and offer treatment for things that may not have been brought up.
When approached by parents who are seeking help, directing them to the stopbullyingnow.gov provides a great source of information that can help parents navigate dealing with the school and helping the child deal with stress. The CyberBully Hotline is a program that schools can implement that allows parents and student to anonymously report cyberbullying. This has been shown to be extremely effective in reducing the number of fights that occur.
Parents should be educated that any threat of suicide should be taken seriously, and an immediate intervention should be taken. 800-273-TALK is the suicide hotline that parents can use if they are concerned that their child is at risk. Emergency departments are equipped with social workers who can assess if hospitalization is necessary or if a child should be followed as an outpatient.
Dr. Pearce is a pediatrician in Frankfort, Ill. E-mail her at [email protected].