User login
Surgery for Blastomycosis of the Spine
Blastomycosis is a rare fungal infection that primarily produces acute lung infections but may on occasion disseminate to multiple sites, including the skin, bone, central nervous system (CNS), and oropharynx.1-30 In the case of a primary infection of the lung, if there is a high index of suspicion and a thorough diagnostic workup, the diagnosis can be made from sputum or bronchoscopy.24 Patients present with acute pneumonia that either resolves spontaneously or proceeds to chronic pneumonia with extrapulmonary spread to multiple organs, including the spine. Once vertebral involvement occurs, an untreated infection may result in vertebral body destruction and paraspinal and epidural abscess formation followed by neurologic injury and loss of structural integrity of the spine.11,13,17,23,27,29
In this article, we present a case of blastomycosis of the vertebral body and provide a detailed review of the literature concerning this extremely rare infection of the spine. The patient provided written informed consent for print and electronic publication of this case report.
Case Report
A 30-year-old African American man with known pulmonary blastomycosis, for which he had been treated with oral itraconazole 200 mg twice daily for 6 months, was admitted to the hospital with a 2-month history of mild thoracolumbar back pain. He reported transient numbness and tingling in the lower extremities but no weakness. He denied weight loss, fatigue, appetite loss, and significant night pain. On physical examination, he was alert and oriented, well nourished, and in no acute distress. Percussion revealed limited range of motion and pain. Further examination of the spine demonstrated no spasm, swelling, erythema, or drainage. The lower extremities had intact sensation, motor strength, reflexes, and pulses, and clonus was absent. White blood cell count was 8100 cells/μL (normal), erythrocyte sedimentation rate was 77 mm/h (normal range, 0-20 mm/h), and C-reactive protein level was 57.2 mg/L (normal, ≤ 10 mg/L). The patient was HIV-negative. Chest radiographs were normal except for a small pleural effusion. Radiographs showed a destructive lesion of T11 with an extensive paravertebral and retropleural abscess tracking a spinal level above and below with extension into the spinal canal (Figure 1).
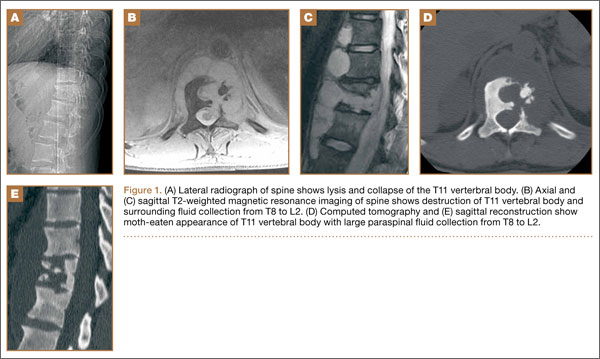
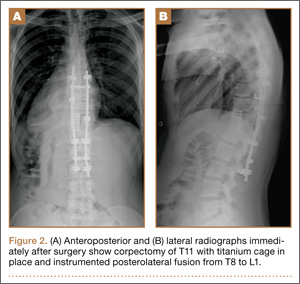
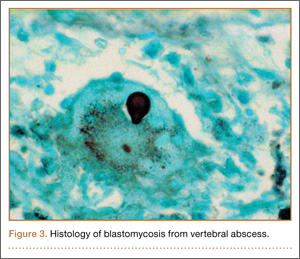
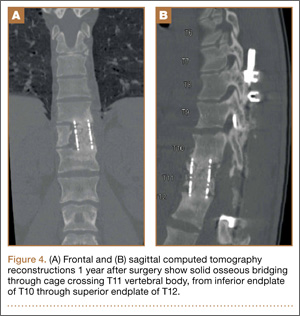
As the patient had signs of spinal cord compression, he was taken to surgery for incision and drainage and culture procurement and corpectomy of T11 with autogenous rib graft. One week later, he was stabilized with posterior fusion and instrumentation (Figure 2). Gram stain of the specimen demonstrated broad-based budding yeast forms 15 to 20 micrometers in size, consistent with blastomycosis. Cultures were positive for Blastomyces dermatitidis. Histopathologic slides (Figure 3) of the surgical pathology specimen showed granulomatous inflammation. Oral itraconazole 200 mg twice daily was continued, as it has been found to be efficacious in treating immunocompetent patients with blastomycosis17 and is considered the medication of choice for non–life-threatening, non-CNS blastomycosis. (Intravenous amphotericin B was ruled out because of its known serious side effects, such as bone marrow suppression and renal function impairment10; itraconazole was the better alternative.) The patient was placed in a thoracolumbar orthosis and discharged. As the effect of presence of instrumentation in the setting of a fungal infection is unknown, it was deemed prudent to maintain the patient on chronic antifungal suppression. One year after surgery, computed tomography (CT) showed solid osseous bridging through the cage crossing the T11 vertebral body, from the inferior endplate of T10 through the superior endplate of T12 (Figure 4). In addition, there had been no recurrence of the spinal infection, and the patient was neurologically intact and doing well.
Discussion
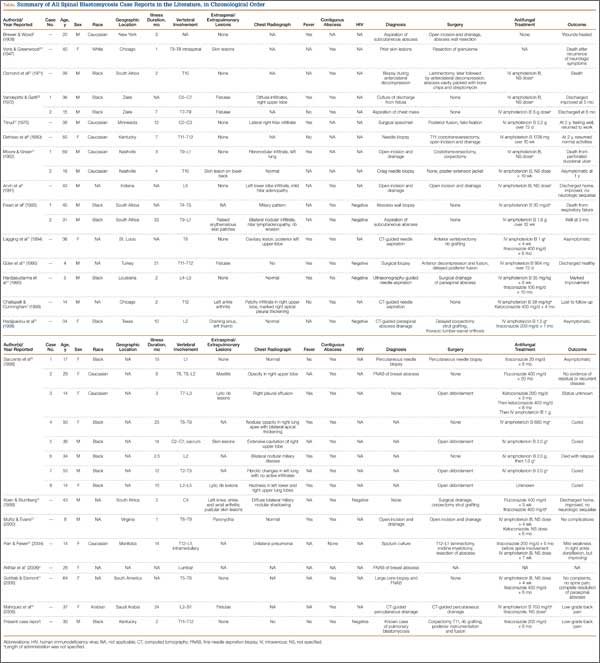
North American blastomycosis (B dermatitidis) is a ubiquitous dimorphic fungus that occurs worldwide and on occasion causes serious infections in humans.9,23,26,29 It was first characterized in 1894 by Gilchrist and Stokes (Gilchrist disease) when they recovered the fungus from the lung tissue of a patient.3 In North America, blastomycosis infections occur from central Canada to the Gulf Coast to east of the Mississippi River.2,5,7,8,13,14,17,21,22,24,27,29 Additional cases of the disease have been reported in Africa,9,16,23,28 Asia,12,19 and South America7,8 (Table [on pages E270-E271]). Recent epidemiologic studies have linked transmission of the disease to bodies of water and have questioned previous reports of male predominance and racial preference for African Americans (Table).
Blastomycosis is acquired when inhaled fungus (airborne conidia spores) causes a primary pulmonary infection or, rarely, when there is direct inoculation through the skin. The differential diagnosis includes neoplasm, tuberculosis, actinomycosis, bacterial infections, cryptococcosis, and coccidioidomycosis.3,9,12,20,25,31 Blastomycosis occurs in adults and children.1-30 The rate of mortality is much higher in immunocompromised patients. Initial symptoms include fever, chills, fatigue, malaise, myalgia, arthalgia, weight loss, and stigmata of chronic disease.1-30 Acute pulmonary infection with blastomycosis generally resolves spontaneously but may progress to acute respiratory distress syndrome, which has a mortality rate of 50% to 89%.19 With systemic dissemination, the infection may spread to other organs11—there is a particular predilection for the skin9,20,29—and to the long bones7,16 and the oropharynx.16,26,28
In 50% to 64% of cases, bone involvement may be the first disease manifestation.6,7,16,22 Osseous involvement with blastomycosis most commonly affects the long bones15 but may include the vertebrae,1-29 the ribs,26 and the carpal or tarsal bones.7,16 The most common vertebral involvement occurs in the thoracic or lumbar spine1,2,7-9,11-14,17,19,21-24,26 and typically results in destruction of the body, development of a paraspinal abscess, and potential extension into the spinal canal, causing an epidural abscess and development of chronic draining cutaneous sinuses.2,7,9,11-13,16,17,19,22,23,26,28,29 In the present case, we do not know whether the vertebral body was involved before the patient presented with mid-thoracolumbar back pain. There may have been bony involvement during initial presentation.
Diagnosis is often difficult because of a low index of suspicion, leading to a significant delay in treatment. Primary pulmonary infections are successfully diagnosed 86% of the time from sputum and 92% of the time from bronchoscopy.19 Once the infection involves the spine, plain radiographs, CT, and magnetic resonance imaging (MRI) can be used to identify not only the bony involvement but also any adjacent soft-tissue extension.13 The radiographic findings, typical of tuberculosis or a neoplasm, include disc space narrowing, vertebral body destruction and collapse, late segmental kyphotic deformity, and development of a psoas abscess or a retropleural abscess.7,26 Such abscesses lend themselves well to fine-needle aspiration,7,8,11,13,14,17,19,26 which, when combined with CT and MRI guidance, reliably assists in the diagnosis of blastomycosis.1,13,17 If fine-needle aspiration fails, then open biopsy and surgical débridement specimens may be effective in the diagnosis.2,9,12,21,22,27
The mortality rate for systemic blastomycosis exceeded 90% before the development of antifungal medications, and these medications remain the primary treatment for most initial infections.15 For severe infections in critically ill patients and for patients with CNS involvement, amphotericin B has been effective, with cure rates approaching 97%.17 Itraconazole, which is well tolerated, has replaced ketoconazole as the preferred long-term oral treatment for blastomycosis. Cure rates for itraconazole approach 90% when treatment is instituted over 2 years in a compliant patient.10,19,20 Nonsurgical (antifungal) treatment for blastomycosis of the spine has also proved successful in neurologically intact patients.7,9,11,26,28
A case involving the spine and requiring surgical drainage was first reported in 19085; since then, only a few more cases have been reported.1,2,5,7-9,11-14,16,17,19,21-24,26-29 Thus, the literature includes very little information that can be used to establish indications for surgery for a blastomycotic infection of the spine. However, there is enough evidence to establish that surgery is indicated for patients who have a known blastomycosis infection and are developing neurologic or structural loss of integrity of the spinal column or have an abscess that requires drainage and débridement.
Our patient had been on long-term antifungal treatment but nevertheless developed a destructive spinal lesion with a concurrent epidural and retropleural abscess. Given his risk of pathologic fracture, we performed anterior débridement and stabilization followed by posterior fusion and instrumentation. We are unaware of any other cases in which an anterior titanium cage was combined with rib autograft after anterior débridement and vertebrectomy combined with posterior instrumentation for blastomycosis. This technique proved very useful, as it allowed for immediate stabilization of the spine. Therefore, the treatment goal is similar to that for any destructive infection that fails medical treatment: preservation of neurologic function, stabilization of spinal vertebrae, débridement of abscess cavity, and definitive culture procurement.
Conclusion
Although there is little reported information regarding surgical indications for blastomycotic vertebral osteomyelitis that has failed medical management—in patients with a destructive lesion and compromise of both the spinal canal and the integrity of the vertebral column—anterior débridement and stabilization followed by posterior fusion and instrumentation are useful in preventing vertebral collapse, further canal compromise, and possible cord injury.
1. Akhtar I, Flowers R, Siddiqi A, Heard K, Baliga M. Fine needle aspiration biopsy of vertebral and paravertebral lesions: retrospective study of 124 cases [published correction appears in Acta Cytol. 2006;50(5):600]. Acta Cytol. 2006;50(4):364-371.
2. Arvin MC, Gehring RL, Crecelius JL, Curfman MF. Man with progressive lower back pain. Indiana Med. 1991;84(8):554-556.
3. Baylin GJ, Wear JM. Blastomycosis and actinomycosis of the spine. Am J Roentgenol Radium Ther Nucl Med. 1953;69(3):395-398.
4. Bradsher RW, Chapman SW, Pappas PG. Blastomycosis. Infect Dis Clin North Am. 2003;17(1):21-40.
5. Brewer GE, Wood FC. XII. Blastomycosis of the spine: double lesion: two operations: recovery. Ann Surg. 1908;48(6):889-896.
6. Carman WF, Frean JA, Crewe-Brown HH, Culligan GA, Young CN. Blastomycosis in Africa. A review of known cases diagnosed between 1951 and 1987. Mycopathologica. 1989;107(1):25-32.
7. Challapalli M, Cunningham DG. North American blastomycosis of the vertebrae in an adolescent. Clin Infect Dis. 1996;23(4):853-854.
8. Detrisac DA, Harding WG, Greiner AL, Dunn CR, Mayfield FH. Vertebral North American blastomycosis. Surg Neurol. 1980;13(4):311-312.
9. Frean J, Blumberg L, Woolf M. Disseminated blastomycosis masquerading as tuberculosis. J Infect. 1993;26(2):203-206.
10. Goodman LS, Brunton LL, Chabner B, Knollman BC, eds. Goodman and Gilman’s The Pharmacological Basis of Therapeutics. New York, NY: McGraw-Hill Medical; 2011.
11. Gottlieb JR, Eismont FJ. Nonoperative treatment of vertebral blastomycosis osteomyelitis associated with paraspinal abscess and cord compression. A case report. J Bone Joint Surg Am. 2006;88(4):854-856.
12. Güler N, Palanduz A, Ones U, et al. Progressive vertebral blastomycosis mimicking tuberculosis. Pediatr Infect Dis J. 1995;14(9):816-818.
13. Hadjipavlou AG, Mader JT, Nauta HJ, Necessary JT, Chaljub G, Adesokan A. Blastomycosis of the lumbar spine: case report and review of the literature, with emphasis on diagnostic laboratory tools and management. Eur Spine J. 1998;7(5):416-421.
14. Hardjasudarma M, Willis B, Black-Payne C, Edwards R. Pediatric spinal blastomycosis: case report. Neurosurgery. 1995;37(3):534-536.
15. Jahangir AA, Heck RK. Blastomycosis: case report of an isolated lesion in the distal fibula. Am J Orthop. 2010;39(3):E22-E24.
16. Koen AF, Blumberg LH. North American blastomycosis in South Africa simulating tuberculosis. Clin Radiol. 1999;54(4):260-262.
17. Lagging LM, Breland CM, Kennedy DJ, Milligan TW, Sokol-Anderson ML, Westblom TU. Delayed treatment of pulmonary blastomycosis causing vertebral osteomyelitis, paraspinal abscess, and spinal cord compression. Scand J Infect Dis. 1994;26(1):111-115.
18. MacDonald PB, Black GB, MacKenzie R. Orthopaedic manifestations of blastomycosis. J Bone Joint Surg Am. 1990;72(6):860-864.
19. Mahiquez M, Bunton KL, Carney G, Weinstein MA, Small JM. Nonsurgical treatment of lumbosacral blastomycosis involving L2–S1: a case report. Spine. 2008;33(13):E442-E446.
20. McKinnell JA, Pappas PG. Blastomycosis: new insights into diagnosis, prevention, and treatment. Clin Chest Med. 2009;30(2):227-239.
21. Moore RM, Green NE. Blastomycosis of bone. A report of six cases. J Bone Joint Surg Am. 1982;64(7):1097-1101.
22. Muñiz AE, Evans T. Chronic paronychia, osteomyelitis, and paravertebral abscess in a child with blastomycosis. J Emerg Med. 2000;19(3):245-248.
23. Osmond JD, Schweitzer G, Dunbar JM, Villet W. Blastomycosis of the spine with paraplegia. S Afr Med J. 1971;45(16):431-434.
24. Parr AM, Fewer D. Intramedullary blastomycosis in a child: case report. Can J Neurol Sci. 2004;31(2):282-285.
25. Rein MF, Fischetti JL, Sande MA. Osteomyelitis caused by concurrent infection with Mycobacterium tuberculosis and Blastomyces dermatitidis. Am Rev Respir Dis. 1974;109(2):286-289.
26. Saccente M, Abernathy RS, Pappas PG, Shah HR, Bradsher RW. Vertebral blastomycosis with paravertebral abscess: report of eight cases and review of the literature. Clin Infect Dis. 1998;26(2):413-418.
27. Titrud LA. Blastomycosis of the cervical spine. Minn Med. 1975;58(10):729-732.
28. Vandepitte J, Gatti F. A case of North American blastomycosis in Africa. Its existence in Republic of Zaire. Ann Soc Belg Med Trop. 1972;52(4):467-479.
29. Voris HC, Greenwood RC. Blastomycosis of the spine with invasion of the spinal canal. Proc Inst Med Chic. 1947;16(17):463.
30. Witorsch P, Utz JP. North American blastomycosis: a study of 40 patients. Medicine. 1968;47(3):169-200.
31. Lucio E, Adesokan A, Hadjipavlou AG, Crow WN, Adegboyega PA. Pyogenic spondylodiskitis: a radiologic/pathologic and culture correlation study. Arch Pathol Lab Med. 2000;124(5):712-716.
Blastomycosis is a rare fungal infection that primarily produces acute lung infections but may on occasion disseminate to multiple sites, including the skin, bone, central nervous system (CNS), and oropharynx.1-30 In the case of a primary infection of the lung, if there is a high index of suspicion and a thorough diagnostic workup, the diagnosis can be made from sputum or bronchoscopy.24 Patients present with acute pneumonia that either resolves spontaneously or proceeds to chronic pneumonia with extrapulmonary spread to multiple organs, including the spine. Once vertebral involvement occurs, an untreated infection may result in vertebral body destruction and paraspinal and epidural abscess formation followed by neurologic injury and loss of structural integrity of the spine.11,13,17,23,27,29
In this article, we present a case of blastomycosis of the vertebral body and provide a detailed review of the literature concerning this extremely rare infection of the spine. The patient provided written informed consent for print and electronic publication of this case report.
Case Report
A 30-year-old African American man with known pulmonary blastomycosis, for which he had been treated with oral itraconazole 200 mg twice daily for 6 months, was admitted to the hospital with a 2-month history of mild thoracolumbar back pain. He reported transient numbness and tingling in the lower extremities but no weakness. He denied weight loss, fatigue, appetite loss, and significant night pain. On physical examination, he was alert and oriented, well nourished, and in no acute distress. Percussion revealed limited range of motion and pain. Further examination of the spine demonstrated no spasm, swelling, erythema, or drainage. The lower extremities had intact sensation, motor strength, reflexes, and pulses, and clonus was absent. White blood cell count was 8100 cells/μL (normal), erythrocyte sedimentation rate was 77 mm/h (normal range, 0-20 mm/h), and C-reactive protein level was 57.2 mg/L (normal, ≤ 10 mg/L). The patient was HIV-negative. Chest radiographs were normal except for a small pleural effusion. Radiographs showed a destructive lesion of T11 with an extensive paravertebral and retropleural abscess tracking a spinal level above and below with extension into the spinal canal (Figure 1).
As the patient had signs of spinal cord compression, he was taken to surgery for incision and drainage and culture procurement and corpectomy of T11 with autogenous rib graft. One week later, he was stabilized with posterior fusion and instrumentation (Figure 2). Gram stain of the specimen demonstrated broad-based budding yeast forms 15 to 20 micrometers in size, consistent with blastomycosis. Cultures were positive for Blastomyces dermatitidis. Histopathologic slides (Figure 3) of the surgical pathology specimen showed granulomatous inflammation. Oral itraconazole 200 mg twice daily was continued, as it has been found to be efficacious in treating immunocompetent patients with blastomycosis17 and is considered the medication of choice for non–life-threatening, non-CNS blastomycosis. (Intravenous amphotericin B was ruled out because of its known serious side effects, such as bone marrow suppression and renal function impairment10; itraconazole was the better alternative.) The patient was placed in a thoracolumbar orthosis and discharged. As the effect of presence of instrumentation in the setting of a fungal infection is unknown, it was deemed prudent to maintain the patient on chronic antifungal suppression. One year after surgery, computed tomography (CT) showed solid osseous bridging through the cage crossing the T11 vertebral body, from the inferior endplate of T10 through the superior endplate of T12 (Figure 4). In addition, there had been no recurrence of the spinal infection, and the patient was neurologically intact and doing well.
Discussion
North American blastomycosis (B dermatitidis) is a ubiquitous dimorphic fungus that occurs worldwide and on occasion causes serious infections in humans.9,23,26,29 It was first characterized in 1894 by Gilchrist and Stokes (Gilchrist disease) when they recovered the fungus from the lung tissue of a patient.3 In North America, blastomycosis infections occur from central Canada to the Gulf Coast to east of the Mississippi River.2,5,7,8,13,14,17,21,22,24,27,29 Additional cases of the disease have been reported in Africa,9,16,23,28 Asia,12,19 and South America7,8 (Table [on pages E270-E271]). Recent epidemiologic studies have linked transmission of the disease to bodies of water and have questioned previous reports of male predominance and racial preference for African Americans (Table).
Blastomycosis is acquired when inhaled fungus (airborne conidia spores) causes a primary pulmonary infection or, rarely, when there is direct inoculation through the skin. The differential diagnosis includes neoplasm, tuberculosis, actinomycosis, bacterial infections, cryptococcosis, and coccidioidomycosis.3,9,12,20,25,31 Blastomycosis occurs in adults and children.1-30 The rate of mortality is much higher in immunocompromised patients. Initial symptoms include fever, chills, fatigue, malaise, myalgia, arthalgia, weight loss, and stigmata of chronic disease.1-30 Acute pulmonary infection with blastomycosis generally resolves spontaneously but may progress to acute respiratory distress syndrome, which has a mortality rate of 50% to 89%.19 With systemic dissemination, the infection may spread to other organs11—there is a particular predilection for the skin9,20,29—and to the long bones7,16 and the oropharynx.16,26,28
In 50% to 64% of cases, bone involvement may be the first disease manifestation.6,7,16,22 Osseous involvement with blastomycosis most commonly affects the long bones15 but may include the vertebrae,1-29 the ribs,26 and the carpal or tarsal bones.7,16 The most common vertebral involvement occurs in the thoracic or lumbar spine1,2,7-9,11-14,17,19,21-24,26 and typically results in destruction of the body, development of a paraspinal abscess, and potential extension into the spinal canal, causing an epidural abscess and development of chronic draining cutaneous sinuses.2,7,9,11-13,16,17,19,22,23,26,28,29 In the present case, we do not know whether the vertebral body was involved before the patient presented with mid-thoracolumbar back pain. There may have been bony involvement during initial presentation.
Diagnosis is often difficult because of a low index of suspicion, leading to a significant delay in treatment. Primary pulmonary infections are successfully diagnosed 86% of the time from sputum and 92% of the time from bronchoscopy.19 Once the infection involves the spine, plain radiographs, CT, and magnetic resonance imaging (MRI) can be used to identify not only the bony involvement but also any adjacent soft-tissue extension.13 The radiographic findings, typical of tuberculosis or a neoplasm, include disc space narrowing, vertebral body destruction and collapse, late segmental kyphotic deformity, and development of a psoas abscess or a retropleural abscess.7,26 Such abscesses lend themselves well to fine-needle aspiration,7,8,11,13,14,17,19,26 which, when combined with CT and MRI guidance, reliably assists in the diagnosis of blastomycosis.1,13,17 If fine-needle aspiration fails, then open biopsy and surgical débridement specimens may be effective in the diagnosis.2,9,12,21,22,27
The mortality rate for systemic blastomycosis exceeded 90% before the development of antifungal medications, and these medications remain the primary treatment for most initial infections.15 For severe infections in critically ill patients and for patients with CNS involvement, amphotericin B has been effective, with cure rates approaching 97%.17 Itraconazole, which is well tolerated, has replaced ketoconazole as the preferred long-term oral treatment for blastomycosis. Cure rates for itraconazole approach 90% when treatment is instituted over 2 years in a compliant patient.10,19,20 Nonsurgical (antifungal) treatment for blastomycosis of the spine has also proved successful in neurologically intact patients.7,9,11,26,28
A case involving the spine and requiring surgical drainage was first reported in 19085; since then, only a few more cases have been reported.1,2,5,7-9,11-14,16,17,19,21-24,26-29 Thus, the literature includes very little information that can be used to establish indications for surgery for a blastomycotic infection of the spine. However, there is enough evidence to establish that surgery is indicated for patients who have a known blastomycosis infection and are developing neurologic or structural loss of integrity of the spinal column or have an abscess that requires drainage and débridement.
Our patient had been on long-term antifungal treatment but nevertheless developed a destructive spinal lesion with a concurrent epidural and retropleural abscess. Given his risk of pathologic fracture, we performed anterior débridement and stabilization followed by posterior fusion and instrumentation. We are unaware of any other cases in which an anterior titanium cage was combined with rib autograft after anterior débridement and vertebrectomy combined with posterior instrumentation for blastomycosis. This technique proved very useful, as it allowed for immediate stabilization of the spine. Therefore, the treatment goal is similar to that for any destructive infection that fails medical treatment: preservation of neurologic function, stabilization of spinal vertebrae, débridement of abscess cavity, and definitive culture procurement.
Conclusion
Although there is little reported information regarding surgical indications for blastomycotic vertebral osteomyelitis that has failed medical management—in patients with a destructive lesion and compromise of both the spinal canal and the integrity of the vertebral column—anterior débridement and stabilization followed by posterior fusion and instrumentation are useful in preventing vertebral collapse, further canal compromise, and possible cord injury.
1. Akhtar I, Flowers R, Siddiqi A, Heard K, Baliga M. Fine needle aspiration biopsy of vertebral and paravertebral lesions: retrospective study of 124 cases [published correction appears in Acta Cytol. 2006;50(5):600]. Acta Cytol. 2006;50(4):364-371.
2. Arvin MC, Gehring RL, Crecelius JL, Curfman MF. Man with progressive lower back pain. Indiana Med. 1991;84(8):554-556.
3. Baylin GJ, Wear JM. Blastomycosis and actinomycosis of the spine. Am J Roentgenol Radium Ther Nucl Med. 1953;69(3):395-398.
4. Bradsher RW, Chapman SW, Pappas PG. Blastomycosis. Infect Dis Clin North Am. 2003;17(1):21-40.
5. Brewer GE, Wood FC. XII. Blastomycosis of the spine: double lesion: two operations: recovery. Ann Surg. 1908;48(6):889-896.
6. Carman WF, Frean JA, Crewe-Brown HH, Culligan GA, Young CN. Blastomycosis in Africa. A review of known cases diagnosed between 1951 and 1987. Mycopathologica. 1989;107(1):25-32.
7. Challapalli M, Cunningham DG. North American blastomycosis of the vertebrae in an adolescent. Clin Infect Dis. 1996;23(4):853-854.
8. Detrisac DA, Harding WG, Greiner AL, Dunn CR, Mayfield FH. Vertebral North American blastomycosis. Surg Neurol. 1980;13(4):311-312.
9. Frean J, Blumberg L, Woolf M. Disseminated blastomycosis masquerading as tuberculosis. J Infect. 1993;26(2):203-206.
10. Goodman LS, Brunton LL, Chabner B, Knollman BC, eds. Goodman and Gilman’s The Pharmacological Basis of Therapeutics. New York, NY: McGraw-Hill Medical; 2011.
11. Gottlieb JR, Eismont FJ. Nonoperative treatment of vertebral blastomycosis osteomyelitis associated with paraspinal abscess and cord compression. A case report. J Bone Joint Surg Am. 2006;88(4):854-856.
12. Güler N, Palanduz A, Ones U, et al. Progressive vertebral blastomycosis mimicking tuberculosis. Pediatr Infect Dis J. 1995;14(9):816-818.
13. Hadjipavlou AG, Mader JT, Nauta HJ, Necessary JT, Chaljub G, Adesokan A. Blastomycosis of the lumbar spine: case report and review of the literature, with emphasis on diagnostic laboratory tools and management. Eur Spine J. 1998;7(5):416-421.
14. Hardjasudarma M, Willis B, Black-Payne C, Edwards R. Pediatric spinal blastomycosis: case report. Neurosurgery. 1995;37(3):534-536.
15. Jahangir AA, Heck RK. Blastomycosis: case report of an isolated lesion in the distal fibula. Am J Orthop. 2010;39(3):E22-E24.
16. Koen AF, Blumberg LH. North American blastomycosis in South Africa simulating tuberculosis. Clin Radiol. 1999;54(4):260-262.
17. Lagging LM, Breland CM, Kennedy DJ, Milligan TW, Sokol-Anderson ML, Westblom TU. Delayed treatment of pulmonary blastomycosis causing vertebral osteomyelitis, paraspinal abscess, and spinal cord compression. Scand J Infect Dis. 1994;26(1):111-115.
18. MacDonald PB, Black GB, MacKenzie R. Orthopaedic manifestations of blastomycosis. J Bone Joint Surg Am. 1990;72(6):860-864.
19. Mahiquez M, Bunton KL, Carney G, Weinstein MA, Small JM. Nonsurgical treatment of lumbosacral blastomycosis involving L2–S1: a case report. Spine. 2008;33(13):E442-E446.
20. McKinnell JA, Pappas PG. Blastomycosis: new insights into diagnosis, prevention, and treatment. Clin Chest Med. 2009;30(2):227-239.
21. Moore RM, Green NE. Blastomycosis of bone. A report of six cases. J Bone Joint Surg Am. 1982;64(7):1097-1101.
22. Muñiz AE, Evans T. Chronic paronychia, osteomyelitis, and paravertebral abscess in a child with blastomycosis. J Emerg Med. 2000;19(3):245-248.
23. Osmond JD, Schweitzer G, Dunbar JM, Villet W. Blastomycosis of the spine with paraplegia. S Afr Med J. 1971;45(16):431-434.
24. Parr AM, Fewer D. Intramedullary blastomycosis in a child: case report. Can J Neurol Sci. 2004;31(2):282-285.
25. Rein MF, Fischetti JL, Sande MA. Osteomyelitis caused by concurrent infection with Mycobacterium tuberculosis and Blastomyces dermatitidis. Am Rev Respir Dis. 1974;109(2):286-289.
26. Saccente M, Abernathy RS, Pappas PG, Shah HR, Bradsher RW. Vertebral blastomycosis with paravertebral abscess: report of eight cases and review of the literature. Clin Infect Dis. 1998;26(2):413-418.
27. Titrud LA. Blastomycosis of the cervical spine. Minn Med. 1975;58(10):729-732.
28. Vandepitte J, Gatti F. A case of North American blastomycosis in Africa. Its existence in Republic of Zaire. Ann Soc Belg Med Trop. 1972;52(4):467-479.
29. Voris HC, Greenwood RC. Blastomycosis of the spine with invasion of the spinal canal. Proc Inst Med Chic. 1947;16(17):463.
30. Witorsch P, Utz JP. North American blastomycosis: a study of 40 patients. Medicine. 1968;47(3):169-200.
31. Lucio E, Adesokan A, Hadjipavlou AG, Crow WN, Adegboyega PA. Pyogenic spondylodiskitis: a radiologic/pathologic and culture correlation study. Arch Pathol Lab Med. 2000;124(5):712-716.
Improving Visual Estimates of Cervical Spine Range of Motion
Assessment of cervical spine range of motion (ROM) is an integral aspect of the physical examination for cervical conditions,1-3 surgical outcomes,4 and functional impairment.1 In fact, the emphasis being placed on such functional measures before and after treatments is increasing.4,5
Cervical spine range of motion is routinely used as an outcome measure in clinical studies.6-8 Underscoring the importance of defining cervical spine ROM, studies have found it to be a preoperative predictor of outcomes of anterior cervical surgery,9 and other studies have suggested it is a determinant of athletes’ return to play.10
Spinal ROM measurements can be used to determine the degree of disability experienced by a patient with a spinal condition as defined in the Guides to the Evaluation of Permanent Impairment by the American Medical Association (AMA).1 In the medicolegal realm, ROM measurements made by clinicians can influence the dollar amounts of awards in legal claims, and, according to the AMA guides, the difference in cervical spine ROM between normality and disability or impairment can be as little as 5°.
Although cervical spine ROM is routinely assessed and documented in clinical practice, no universal protocol exists for its evaluation.11,12 In fact, considerable inter-examiner variation in visual estimates of ROM has been found,13-16 and significant inaccuracies have been reported.17,18
Goniometers have been shown to be reliable and highly accurate, with low inter-examiner and intra-examiner variability.5,19-21 Nevertheless, logistics22 and costs21 generally limit their being accepted in routine clinical practice. Among many methods available for assessing ROM, visual estimation is the least reliable or accurate,23 but it is the quickest and least expensive and is recommended in textbooks that describe the spinal-specific physical examination.24 Despite the superiority of goniometers in measuring ROM, these significant barriers have limited their use in clinical practice. When assessing cervical spine ROM, most clinicians prefer visual estimates over goniometers.
We conducted a study to determine whether training could improve the accuracy of visual estimates. We compared the accuracy of visual estimates of cervical spine ROM with that of a radiographically validated electrogoniometer and then investigated whether accuracy and reliability of visual estimates could be improved with a session of instruction and demonstration. Assessments of accuracy were made immediately after and 1 month after this training session.
Materials and Methods
Assessments Made Before Training
This study was approved by our institution’s human investigation committee and was conducted in accordance with the ethical standards of that committee.
Cervical spine ROM was assessed by 8 examiners (2 attending spine surgeons, 4 orthopedic residents, 2 medical students). They were informed they would be participating in a study evaluating visual estimates of motion but were given no other information prior to the study.
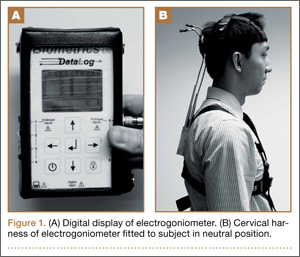
Four healthy volunteer subjects (examiners who rotated through the role) were assessed. No subject reported any ongoing neck or spine discomfort or had had any previous spinal surgery. One at a time, subjects were fitted with a cervical harness electrogoniometer capable of measuring angulation of the cervical spine to the nearest degree (modified electrogoniometer, torsiometer, and display from Biometrics, Gwent, UK; Figures 1A, 1B). This electrogoniometer has been shown to have a mean (SD) error of 2.3° (2.6°) relative to radiographic assessments.8
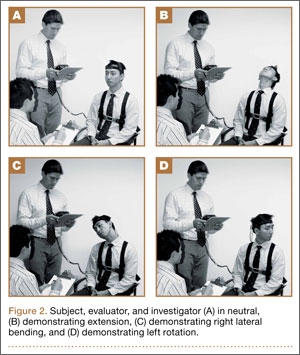
With the electrogoniometer fitted, each subject was instructed to sit upright in a chair with his back to the backrest and his head neutrally positioned. The electrogoniometer was then zeroed, and the subject proceeded with 5 series of flexion-extension, left and right lateral bending, and left and right rotation movements. The subject was instructed to make 1 movement in full motion in each direction and the other 4 movements in less than full motion to yield a variety of excursions for assessment. Each subject was instructed to pause at the apex of each motion. During these pauses, the examiners recorded their visual estimates of movement in each direction while the investigator recorded degrees of motion (displayed by the electrogoniometer) in flexion-extension, lateral bending, and rotation (Figures 2A–2D). The electrogoniometer display was not visible to subjects or examiners.
A total of 840 independent visual estimates of 120 distinct movements were recorded.
Training, and Assessments Made Immediately Thereafter
After the first round of visual estimates, the 8 examiners were verbally instructed in cervical spine ROM assessment and were asked to observe 1 subject, fitted with the electrogoniometer, demonstrating partial and full cervical motions while the investigator announced the electrogoniometric measurements. The motions demonstrated included 15°, 30°, and the extremes of cervical spine ROM in each of 6 directions from neutral.
After this training session, each of the 4 subjects from the first round of assessments was again fitted with the harness electrogoniometer and instructed to repeat the movements in turn while examiners visually estimated cervical spine ROM and independently recorded their estimates. Meanwhile, the investigator recorded the degree of motion during each movement (as measured by the electrogoniometer). Again, a total of 840 independent visual estimates of 120 distinct movements were recorded.
Assessments Made 1 Month After Training
One month after the training session, the examiners and the investigator reconvened to assess the same 4 subjects using a procedure for simultaneous visual estimation and electrogoniometric measurement identical to that used 1 month earlier. No additional training was given. Again, 840 independent visual estimates of 120 distinct movements were recorded.
Data Analysis
The reliabilities of visual estimates were analyzed by calculating the intraclass coefficients (ICCs) using random-effect 1-way analyses of variance. By convention, ICCs of < 0.2, 0.2 to 0.39, 0.4 to 0.59, 0.6 to 0.8, and > 0.8 correspond to poor, fair, moderate, substantial, and perfect reliability, respectively.25
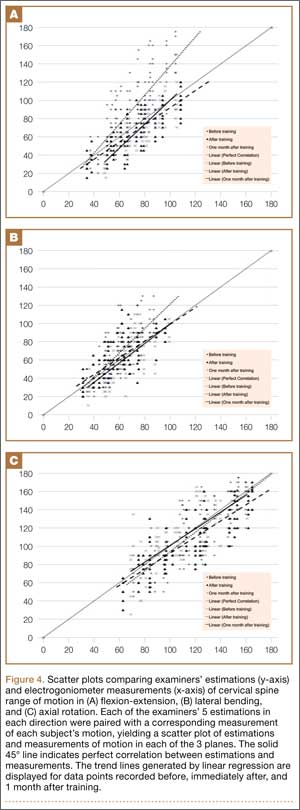
We compared the visual estimates and electrogoniometric measurements made for 3 planes of motion (flexion-extension, lateral bending, axial rotation) before, immediately after, and 1 month after training and drew trend lines generated by linear regression relative to a line of perfect correlation.
Mean errors in examiners’ visual estimates (relative to electrogoniometric measurements) made before, immediately after, and 1 month after training were calculated. Paired Student t tests were then used to compare the mean errors before training with the mean errors immediately after and 1 month after training.
All analyses were performed with SPSS for Windows 16.0 (SPSS, Chicago, Illinois).
Results
Inter-examiner reliability of the visual estimates in all planes of motion ranged from 0.51 to 0.79 (suggestive of moderate to substantial reliability). For reference, standard goniometers measuring knee ROM have inter-examiner ICCs of 0.89 to 0.9826 (suggestive of perfect reliability). The ICCs before, immediately after, and 1 month after training were not significantly different.
As expected, there were significant errors in visual estimates of cervical spine ROM in all planes. Initial errors in visual estimates (relative to electrogoniometric measurements) were 23.9° (flexion-extension), 15.5° (lateral bending), and 19.3° (axial rotation) (Table, Figure 3).
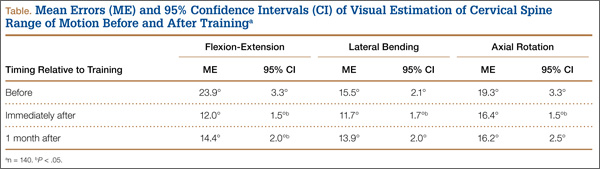
Immediately after training, mean errors in visual estimates decreased to 12.0° (flexion-extension), 11.7° (lateral bending), and 16.4° (axial rotation) (Table, Figure 3). In all 3 planes of cervical motion, these improvements were statistically significant.
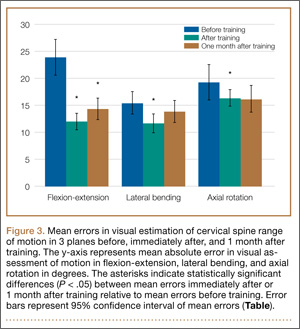
One month after training, mean errors in visual estimates were 14.4° (flexion-extension), 13.9° (lateral bending), and 16.2° (axial rotation) (Table, Figure 3). Only the improvement in the estimate of flexion-extension (the direction of the largest error initially) remained statistically significant—a 39.7% decrease in error.
We also considered how errors varied with degree of motion observed. In flexion-extension, the tendency to overestimate at larger degrees of motion was not apparent after training, and 1 month after training we found a tendency to underestimate at smaller degrees of motion (Figure 4A). The tendency to overestimate lateral bending before training did not persist immediately after or 1 month after training (Figure 4B). Estimates of axial rotation correlated well with goniometer measurements before training and were also well correlated immediately after and 1 month after training (Figure 4C).
Discussion
Visual estimation of spinal motion is unreliable and inaccurate, but its widespread use in clinical practice continues. Goniometers are far more accurate and reliable but are seldom used. We investigated whether a training session featuring verbal instruction and demonstration with an electrogoniometer could improve visual estimates and whether potential improvement in visual estimates would remain 1 month after training.
Widely variable ICCs (0.42-0.90) have been reported for visual estimates of cervical spine ROM.17,18,22 Our findings on the reliability of these estimates are consistent with the literature.
We recorded the greatest initial error in estimates of motion in flexion-extension. Previous studies have also found the greatest error and least reliability in visual estimates in this plane.14,15,18 Visual estimation may be more difficult in flexion-extension because the shoulders cannot be used as landmarks, whereas they serve as approximate 90° reference points during estimation of lateral bending and axial rotation. Demonstration of 15°, 30° and the extremes of ROM during the training session may have provided alternative reference points during visual estimation after training—decreasing the error to within the range found in other planes of motion.
Initial errors in visual estimates were 23.9° (flexion-extension), 15.5° (lateral bending), and 19.3° (axial rotation). Based on normative cervical spine ROM in a healthy population— 126° ± 12° for flexion-extension, 86° ± 5° for lateral bending, 151° ± 23° for axial rotation22—the errors we identified are 18.9% of the normal range of flexion-extension, 18.0% of lateral bending, and 12.8% of axial rotation.
Training clearly improved the accuracy of visual estimates of cervical spine ROM. Estimates were statistically improved for all planes immediately after training and remained significantly improved for flexion-extension (the plane of largest error initially) 1 month after training. Before training, mean errors varied across planes. Training normalized mean errors to about 15°, and this effect lasted in flexion-extension, lateral bending, and axial rotation (Figures 4A–4C). Of note, before training these percentage errors increased with increased motion from neutral in the flexion-extension and lateral bending planes. At full ROM, percentage errors in estimates were greater. After training, percentage errors did not increase appreciably with increasing motion.
Readers will naturally reflect on the clinical significance of the motion assessment improvements demonstrated after the training session described in this study. We must be aware that functional assessments are increasingly being emphasized in the clinical arena—with respect to clinical conditions, surgical outcomes, and functional impairments. We highlight a point made earlier: A difference of only 5° can affect impairment ratings in the medicolegal realm.1 In estimating flexion-extension motion, lasting improvements of almost 10° were demonstrated and maintained 1 month after the training session described in this study.
Nevertheless, mean errors in visual estimation remained at about 15° in all planes of motion, despite our modest improvements. This finding raises the question of whether visually estimated ROM should be pertinent to assessments of impairment and disability. Although visual estimates of ROM may have more utility as a screening test for impairment and disability, fine differences in ROM simply cannot be reliably assessed by visual estimation.
This study has limitations. First, it was conducted at a single institution where the evaluators received most of their training. Their skill in visually estimating cervical spine ROM may not be generalizable to a larger population of spine specialists who are practicing at other institutions and may have different training backgrounds.
Second, only healthy subjects were assessed. Some studies of cervical spine ROM have shown better reliability in symptomatic subjects relative to asymptomatic subjects.13,14 To attempt to overcome this limitation, we assessed many different excursions of motion that were often not to the extremes of motion.
Third, the “gold standard” we used for motion assessment was an electrogoniometer, which has some inherent error (previously validated mean [SD] error of 2.3° [2.6°] relative to radiographs8). Although obtaining radiographs of each movement would have more closely resembled the gold standard, the radiation dose associated with such a study is prohibitive.
Last, the assessors included medical students. The medical students’ estimates, however, tended to be more accurate than the residents’ or attending surgeons’ (though the difference was not statistically significant). This tendency may reflect the medical students’ closer attention to detail. Clearly, including medical students in the study did not negatively affect the accuracy of the estimates or the validity of our findings.
Conclusion
Despite its limitations, visual assessment of cervical spine motion remains the gold standard in clinical practice and is routinely recorded and reported. Mean errors ranged from 15.5° to 23.9°, depending on plane of motion being assessed, but these improved after a training session.
Visual estimates of motion in flexion-extension were most improved by training, as the initial errors in this plane were the largest. Statistically significant improvement of about 10° remained for flexion-extension motion estimates 1 month after training.
During a time when we are increasingly emphasizing functional outcomes, such a degree of improvement could be of clinical significance. Our study results support a call for more formalized training of ROM assessment, but clinicians should also be aware of the limitations of visual estimates of cervical spine ROM, and our study results support scrutiny of visual assessment of ROM as a criterion for diagnosing permanent impairment or disability.
1. Rondinelli RD, Genovese E, Brigham CR; American Medical Association. Guides to the Evaluation of Permanent Impairment. 6th ed. Chicago, IL: American Medical Association; 2008.
2. Hall TM, Briffa K, Hopper D, Robinson K. Comparative analysis and diagnostic accuracy of the cervical flexion-rotation test. J Headache Pain. 2010;11(5):391-397.
3. De Hertogh WJ, Vaes PH, Vijverman V, De Cordt A, Duquet W. The clinical examination of neck pain patients: the validity of a group of tests. Man Ther. 2007;12(1):50-55.
4. Koller H, Resch H, Acosta F, et al. Assessment of two measurement techniques of cervical spine and C1–C2 rotation in the outcome research of axis fractures: a morphometrical analysis using dynamic computed tomography scanning. Spine. 2010;35(3):286-290.
5. Garrett TR, Youdas JW, Madson TJ. Reliability of measuring forward head posture in a clinical setting. J Orthop Sports Phys Ther. 1993;17(3):155-160.
6. Pearcy MJ, Tibrewal SB. Axial rotation and lateral bending in the normal lumbar spine measured by three-dimensional radiography. Spine. 1984;9(6):582-587.
7. Hayes MA, Howard TC, Gruel CR, Kopta JA. Roentgenographic evaluation of lumbar spine flexion-extension in asymptomatic individuals. Spine. 1989;14(3):327-331.
8. Bible JE, Biswas D, Miller CP, Whang PG, Grauer JN. Normal functional range of motion of the cervical spine during 15 activities of daily living. J Spinal Disord Tech. 2010;23(1):15-21.
9. Penning L. Normal movements of the cervical spine. AJR Am J Roentgenol. 1978;130(2):317-326.
10. Mayer TG, Tencer AF, Kristoferson S, Mooney V. Use of noninvasive techniques for quantification of spinal range-of-motion in normal subjects and chronic low-back dysfunction patients. Spine. 1984;9(6):588-595.
11. Williams MA, McCarthy CJ, Chorti A, Cooke MW, Gates S. A systematic review of reliability and validity studies of methods for measuring active and passive cervical range of motion. J Manipulative Physiol Ther. 2010;33(2):138-155.
12. Schaufele MK, Boden SD. Physical function measurements in neck pain. Phys Med Rehabil Clin North Am. 2003;14(3):569-588.
13. Fjellner A, Bexander C, Faleij R, Strender LE. Interexaminer reliability in physical examination of the cervical spine. J Manipulative Physiol Ther. 1999;22(8):511-516.
14. Nilsson N, Christensen HW, Hartvigsen J. The interexaminer reliability of measuring passive cervical range of motion, revisited. J Manipulative Physiol Ther. 1996;19(5):302-305.
15. Pool JJ, Hoving JL, de Vet HC, van Mameren H, Bouter LM. The interexaminer reproducibility of physical examination of the cervical spine. J Manipulative Physiol Ther. 2004;27(2):84-90.
16. Strender LE, Lundin M, Nell K. Interexaminer reliability in physical examination of the neck. J Manipulative Physiol Ther. 1997;20(8):516-520.
17. Youdas JW, Carey JR, Garrett TR. Reliability of measurements of cervical spine range of motion—comparison of three methods. Phys Ther. 1991;71(2):98-104.
18. Whitcroft KL, Massouh L, Amirfeyz R, Bannister G. Comparison of methods of measuring active cervical range of motion. Spine. 2010;35(19):E976-E980.
19. de Koning CH, van den Heuvel SP, Staal JB, Smits-Engelsman BC, Hendriks EJ. Clinimetric evaluation of active range of motion measures in patients with non-specific neck pain: a systematic review. Eur Spine J. 2008;17(7):905-921.
20. Christensen HW, Nilsson N. The reliability of measuring active and passive cervical range of motion: an observer-blinded and randomized repeated-measures design. J Manipulative Physiol Ther. 1998;21(5):341-347.
21. Florêncio LL, Pereira PA, Silva ER, Pegoretti KS, Gonçalves MC, Bevilaqua-Grossi D. Agreement and reliability of two non-invasive methods for assessing cervical range of motion among young adults. Rev Bras Fisioter. 2010;14(2):175-181.
22. Lea RD, Gerhardt JJ. Range-of-motion measurements. J Bone Joint Surg Am. 1995;77(5):784-798.
23. Youdas JW, Carey JR, Garrett TR. Reliability of measurements of cervical spine range of motion—comparison of three methods. Phys Ther. 1991;71(2):98-104.
24. Greene WB, Netter FH. Netter’s Orthopaedics. Philadelphia, PA: Saunders Elsevier; 2006.
25. Shrout PE, Fleiss JL. Intraclass correlations: uses in assessing rater reliability. Psychol Bull. 1979;86(2):420-428.
26. Brosseau L, Balmer S, Tousignant M, et al. Intra- and intertester reliability and criterion validity of the parallelogram and universal goniometers for measuring maximum active knee flexion and extension of patients with knee restrictions. Arch Phys Med Rehabil. 2001;82(3):396-402.
Assessment of cervical spine range of motion (ROM) is an integral aspect of the physical examination for cervical conditions,1-3 surgical outcomes,4 and functional impairment.1 In fact, the emphasis being placed on such functional measures before and after treatments is increasing.4,5
Cervical spine range of motion is routinely used as an outcome measure in clinical studies.6-8 Underscoring the importance of defining cervical spine ROM, studies have found it to be a preoperative predictor of outcomes of anterior cervical surgery,9 and other studies have suggested it is a determinant of athletes’ return to play.10
Spinal ROM measurements can be used to determine the degree of disability experienced by a patient with a spinal condition as defined in the Guides to the Evaluation of Permanent Impairment by the American Medical Association (AMA).1 In the medicolegal realm, ROM measurements made by clinicians can influence the dollar amounts of awards in legal claims, and, according to the AMA guides, the difference in cervical spine ROM between normality and disability or impairment can be as little as 5°.
Although cervical spine ROM is routinely assessed and documented in clinical practice, no universal protocol exists for its evaluation.11,12 In fact, considerable inter-examiner variation in visual estimates of ROM has been found,13-16 and significant inaccuracies have been reported.17,18
Goniometers have been shown to be reliable and highly accurate, with low inter-examiner and intra-examiner variability.5,19-21 Nevertheless, logistics22 and costs21 generally limit their being accepted in routine clinical practice. Among many methods available for assessing ROM, visual estimation is the least reliable or accurate,23 but it is the quickest and least expensive and is recommended in textbooks that describe the spinal-specific physical examination.24 Despite the superiority of goniometers in measuring ROM, these significant barriers have limited their use in clinical practice. When assessing cervical spine ROM, most clinicians prefer visual estimates over goniometers.
We conducted a study to determine whether training could improve the accuracy of visual estimates. We compared the accuracy of visual estimates of cervical spine ROM with that of a radiographically validated electrogoniometer and then investigated whether accuracy and reliability of visual estimates could be improved with a session of instruction and demonstration. Assessments of accuracy were made immediately after and 1 month after this training session.
Materials and Methods
Assessments Made Before Training
This study was approved by our institution’s human investigation committee and was conducted in accordance with the ethical standards of that committee.
Cervical spine ROM was assessed by 8 examiners (2 attending spine surgeons, 4 orthopedic residents, 2 medical students). They were informed they would be participating in a study evaluating visual estimates of motion but were given no other information prior to the study.
Four healthy volunteer subjects (examiners who rotated through the role) were assessed. No subject reported any ongoing neck or spine discomfort or had had any previous spinal surgery. One at a time, subjects were fitted with a cervical harness electrogoniometer capable of measuring angulation of the cervical spine to the nearest degree (modified electrogoniometer, torsiometer, and display from Biometrics, Gwent, UK; Figures 1A, 1B). This electrogoniometer has been shown to have a mean (SD) error of 2.3° (2.6°) relative to radiographic assessments.8
With the electrogoniometer fitted, each subject was instructed to sit upright in a chair with his back to the backrest and his head neutrally positioned. The electrogoniometer was then zeroed, and the subject proceeded with 5 series of flexion-extension, left and right lateral bending, and left and right rotation movements. The subject was instructed to make 1 movement in full motion in each direction and the other 4 movements in less than full motion to yield a variety of excursions for assessment. Each subject was instructed to pause at the apex of each motion. During these pauses, the examiners recorded their visual estimates of movement in each direction while the investigator recorded degrees of motion (displayed by the electrogoniometer) in flexion-extension, lateral bending, and rotation (Figures 2A–2D). The electrogoniometer display was not visible to subjects or examiners.
A total of 840 independent visual estimates of 120 distinct movements were recorded.
Training, and Assessments Made Immediately Thereafter
After the first round of visual estimates, the 8 examiners were verbally instructed in cervical spine ROM assessment and were asked to observe 1 subject, fitted with the electrogoniometer, demonstrating partial and full cervical motions while the investigator announced the electrogoniometric measurements. The motions demonstrated included 15°, 30°, and the extremes of cervical spine ROM in each of 6 directions from neutral.
After this training session, each of the 4 subjects from the first round of assessments was again fitted with the harness electrogoniometer and instructed to repeat the movements in turn while examiners visually estimated cervical spine ROM and independently recorded their estimates. Meanwhile, the investigator recorded the degree of motion during each movement (as measured by the electrogoniometer). Again, a total of 840 independent visual estimates of 120 distinct movements were recorded.
Assessments Made 1 Month After Training
One month after the training session, the examiners and the investigator reconvened to assess the same 4 subjects using a procedure for simultaneous visual estimation and electrogoniometric measurement identical to that used 1 month earlier. No additional training was given. Again, 840 independent visual estimates of 120 distinct movements were recorded.
Data Analysis
The reliabilities of visual estimates were analyzed by calculating the intraclass coefficients (ICCs) using random-effect 1-way analyses of variance. By convention, ICCs of < 0.2, 0.2 to 0.39, 0.4 to 0.59, 0.6 to 0.8, and > 0.8 correspond to poor, fair, moderate, substantial, and perfect reliability, respectively.25
We compared the visual estimates and electrogoniometric measurements made for 3 planes of motion (flexion-extension, lateral bending, axial rotation) before, immediately after, and 1 month after training and drew trend lines generated by linear regression relative to a line of perfect correlation.
Mean errors in examiners’ visual estimates (relative to electrogoniometric measurements) made before, immediately after, and 1 month after training were calculated. Paired Student t tests were then used to compare the mean errors before training with the mean errors immediately after and 1 month after training.
All analyses were performed with SPSS for Windows 16.0 (SPSS, Chicago, Illinois).
Results
Inter-examiner reliability of the visual estimates in all planes of motion ranged from 0.51 to 0.79 (suggestive of moderate to substantial reliability). For reference, standard goniometers measuring knee ROM have inter-examiner ICCs of 0.89 to 0.9826 (suggestive of perfect reliability). The ICCs before, immediately after, and 1 month after training were not significantly different.
As expected, there were significant errors in visual estimates of cervical spine ROM in all planes. Initial errors in visual estimates (relative to electrogoniometric measurements) were 23.9° (flexion-extension), 15.5° (lateral bending), and 19.3° (axial rotation) (Table, Figure 3).
Immediately after training, mean errors in visual estimates decreased to 12.0° (flexion-extension), 11.7° (lateral bending), and 16.4° (axial rotation) (Table, Figure 3). In all 3 planes of cervical motion, these improvements were statistically significant.
One month after training, mean errors in visual estimates were 14.4° (flexion-extension), 13.9° (lateral bending), and 16.2° (axial rotation) (Table, Figure 3). Only the improvement in the estimate of flexion-extension (the direction of the largest error initially) remained statistically significant—a 39.7% decrease in error.
We also considered how errors varied with degree of motion observed. In flexion-extension, the tendency to overestimate at larger degrees of motion was not apparent after training, and 1 month after training we found a tendency to underestimate at smaller degrees of motion (Figure 4A). The tendency to overestimate lateral bending before training did not persist immediately after or 1 month after training (Figure 4B). Estimates of axial rotation correlated well with goniometer measurements before training and were also well correlated immediately after and 1 month after training (Figure 4C).
Discussion
Visual estimation of spinal motion is unreliable and inaccurate, but its widespread use in clinical practice continues. Goniometers are far more accurate and reliable but are seldom used. We investigated whether a training session featuring verbal instruction and demonstration with an electrogoniometer could improve visual estimates and whether potential improvement in visual estimates would remain 1 month after training.
Widely variable ICCs (0.42-0.90) have been reported for visual estimates of cervical spine ROM.17,18,22 Our findings on the reliability of these estimates are consistent with the literature.
We recorded the greatest initial error in estimates of motion in flexion-extension. Previous studies have also found the greatest error and least reliability in visual estimates in this plane.14,15,18 Visual estimation may be more difficult in flexion-extension because the shoulders cannot be used as landmarks, whereas they serve as approximate 90° reference points during estimation of lateral bending and axial rotation. Demonstration of 15°, 30° and the extremes of ROM during the training session may have provided alternative reference points during visual estimation after training—decreasing the error to within the range found in other planes of motion.
Initial errors in visual estimates were 23.9° (flexion-extension), 15.5° (lateral bending), and 19.3° (axial rotation). Based on normative cervical spine ROM in a healthy population— 126° ± 12° for flexion-extension, 86° ± 5° for lateral bending, 151° ± 23° for axial rotation22—the errors we identified are 18.9% of the normal range of flexion-extension, 18.0% of lateral bending, and 12.8% of axial rotation.
Training clearly improved the accuracy of visual estimates of cervical spine ROM. Estimates were statistically improved for all planes immediately after training and remained significantly improved for flexion-extension (the plane of largest error initially) 1 month after training. Before training, mean errors varied across planes. Training normalized mean errors to about 15°, and this effect lasted in flexion-extension, lateral bending, and axial rotation (Figures 4A–4C). Of note, before training these percentage errors increased with increased motion from neutral in the flexion-extension and lateral bending planes. At full ROM, percentage errors in estimates were greater. After training, percentage errors did not increase appreciably with increasing motion.
Readers will naturally reflect on the clinical significance of the motion assessment improvements demonstrated after the training session described in this study. We must be aware that functional assessments are increasingly being emphasized in the clinical arena—with respect to clinical conditions, surgical outcomes, and functional impairments. We highlight a point made earlier: A difference of only 5° can affect impairment ratings in the medicolegal realm.1 In estimating flexion-extension motion, lasting improvements of almost 10° were demonstrated and maintained 1 month after the training session described in this study.
Nevertheless, mean errors in visual estimation remained at about 15° in all planes of motion, despite our modest improvements. This finding raises the question of whether visually estimated ROM should be pertinent to assessments of impairment and disability. Although visual estimates of ROM may have more utility as a screening test for impairment and disability, fine differences in ROM simply cannot be reliably assessed by visual estimation.
This study has limitations. First, it was conducted at a single institution where the evaluators received most of their training. Their skill in visually estimating cervical spine ROM may not be generalizable to a larger population of spine specialists who are practicing at other institutions and may have different training backgrounds.
Second, only healthy subjects were assessed. Some studies of cervical spine ROM have shown better reliability in symptomatic subjects relative to asymptomatic subjects.13,14 To attempt to overcome this limitation, we assessed many different excursions of motion that were often not to the extremes of motion.
Third, the “gold standard” we used for motion assessment was an electrogoniometer, which has some inherent error (previously validated mean [SD] error of 2.3° [2.6°] relative to radiographs8). Although obtaining radiographs of each movement would have more closely resembled the gold standard, the radiation dose associated with such a study is prohibitive.
Last, the assessors included medical students. The medical students’ estimates, however, tended to be more accurate than the residents’ or attending surgeons’ (though the difference was not statistically significant). This tendency may reflect the medical students’ closer attention to detail. Clearly, including medical students in the study did not negatively affect the accuracy of the estimates or the validity of our findings.
Conclusion
Despite its limitations, visual assessment of cervical spine motion remains the gold standard in clinical practice and is routinely recorded and reported. Mean errors ranged from 15.5° to 23.9°, depending on plane of motion being assessed, but these improved after a training session.
Visual estimates of motion in flexion-extension were most improved by training, as the initial errors in this plane were the largest. Statistically significant improvement of about 10° remained for flexion-extension motion estimates 1 month after training.
During a time when we are increasingly emphasizing functional outcomes, such a degree of improvement could be of clinical significance. Our study results support a call for more formalized training of ROM assessment, but clinicians should also be aware of the limitations of visual estimates of cervical spine ROM, and our study results support scrutiny of visual assessment of ROM as a criterion for diagnosing permanent impairment or disability.
1. Rondinelli RD, Genovese E, Brigham CR; American Medical Association. Guides to the Evaluation of Permanent Impairment. 6th ed. Chicago, IL: American Medical Association; 2008.
2. Hall TM, Briffa K, Hopper D, Robinson K. Comparative analysis and diagnostic accuracy of the cervical flexion-rotation test. J Headache Pain. 2010;11(5):391-397.
3. De Hertogh WJ, Vaes PH, Vijverman V, De Cordt A, Duquet W. The clinical examination of neck pain patients: the validity of a group of tests. Man Ther. 2007;12(1):50-55.
4. Koller H, Resch H, Acosta F, et al. Assessment of two measurement techniques of cervical spine and C1–C2 rotation in the outcome research of axis fractures: a morphometrical analysis using dynamic computed tomography scanning. Spine. 2010;35(3):286-290.
5. Garrett TR, Youdas JW, Madson TJ. Reliability of measuring forward head posture in a clinical setting. J Orthop Sports Phys Ther. 1993;17(3):155-160.
6. Pearcy MJ, Tibrewal SB. Axial rotation and lateral bending in the normal lumbar spine measured by three-dimensional radiography. Spine. 1984;9(6):582-587.
7. Hayes MA, Howard TC, Gruel CR, Kopta JA. Roentgenographic evaluation of lumbar spine flexion-extension in asymptomatic individuals. Spine. 1989;14(3):327-331.
8. Bible JE, Biswas D, Miller CP, Whang PG, Grauer JN. Normal functional range of motion of the cervical spine during 15 activities of daily living. J Spinal Disord Tech. 2010;23(1):15-21.
9. Penning L. Normal movements of the cervical spine. AJR Am J Roentgenol. 1978;130(2):317-326.
10. Mayer TG, Tencer AF, Kristoferson S, Mooney V. Use of noninvasive techniques for quantification of spinal range-of-motion in normal subjects and chronic low-back dysfunction patients. Spine. 1984;9(6):588-595.
11. Williams MA, McCarthy CJ, Chorti A, Cooke MW, Gates S. A systematic review of reliability and validity studies of methods for measuring active and passive cervical range of motion. J Manipulative Physiol Ther. 2010;33(2):138-155.
12. Schaufele MK, Boden SD. Physical function measurements in neck pain. Phys Med Rehabil Clin North Am. 2003;14(3):569-588.
13. Fjellner A, Bexander C, Faleij R, Strender LE. Interexaminer reliability in physical examination of the cervical spine. J Manipulative Physiol Ther. 1999;22(8):511-516.
14. Nilsson N, Christensen HW, Hartvigsen J. The interexaminer reliability of measuring passive cervical range of motion, revisited. J Manipulative Physiol Ther. 1996;19(5):302-305.
15. Pool JJ, Hoving JL, de Vet HC, van Mameren H, Bouter LM. The interexaminer reproducibility of physical examination of the cervical spine. J Manipulative Physiol Ther. 2004;27(2):84-90.
16. Strender LE, Lundin M, Nell K. Interexaminer reliability in physical examination of the neck. J Manipulative Physiol Ther. 1997;20(8):516-520.
17. Youdas JW, Carey JR, Garrett TR. Reliability of measurements of cervical spine range of motion—comparison of three methods. Phys Ther. 1991;71(2):98-104.
18. Whitcroft KL, Massouh L, Amirfeyz R, Bannister G. Comparison of methods of measuring active cervical range of motion. Spine. 2010;35(19):E976-E980.
19. de Koning CH, van den Heuvel SP, Staal JB, Smits-Engelsman BC, Hendriks EJ. Clinimetric evaluation of active range of motion measures in patients with non-specific neck pain: a systematic review. Eur Spine J. 2008;17(7):905-921.
20. Christensen HW, Nilsson N. The reliability of measuring active and passive cervical range of motion: an observer-blinded and randomized repeated-measures design. J Manipulative Physiol Ther. 1998;21(5):341-347.
21. Florêncio LL, Pereira PA, Silva ER, Pegoretti KS, Gonçalves MC, Bevilaqua-Grossi D. Agreement and reliability of two non-invasive methods for assessing cervical range of motion among young adults. Rev Bras Fisioter. 2010;14(2):175-181.
22. Lea RD, Gerhardt JJ. Range-of-motion measurements. J Bone Joint Surg Am. 1995;77(5):784-798.
23. Youdas JW, Carey JR, Garrett TR. Reliability of measurements of cervical spine range of motion—comparison of three methods. Phys Ther. 1991;71(2):98-104.
24. Greene WB, Netter FH. Netter’s Orthopaedics. Philadelphia, PA: Saunders Elsevier; 2006.
25. Shrout PE, Fleiss JL. Intraclass correlations: uses in assessing rater reliability. Psychol Bull. 1979;86(2):420-428.
26. Brosseau L, Balmer S, Tousignant M, et al. Intra- and intertester reliability and criterion validity of the parallelogram and universal goniometers for measuring maximum active knee flexion and extension of patients with knee restrictions. Arch Phys Med Rehabil. 2001;82(3):396-402.

Does a Prior Hip Arthroscopy Affect Clinical Outcomes in Metal-on-Metal Hip Resurfacing Arthroplasty?
Metal-on-metal hip resurfacing arthroplasty (HRA) remains an alternative to total hip arthroplasty (THA) in appropriately selected, younger, active adults with degenerative hip disease.1-4 While concerns remain regarding the potential for adverse local tissue reactions from wear of the metal-on-metal bearing surface,5-8 10-year data from the Australian Orthopaedic Association National Joint Replacement Registry Annual Report9 showed a revision rate of only 6.3% when the Birmingham Hip Resurfacing (BHR) System was used (Smith & Nephew Inc, Memphis, Tennessee).In addition, in an independent review of 230 consecutive BHRs at a mean follow-up of 10.4 years, Coulter and colleagues10 showed encouraging clinical results, with a mean Oxford Hip Score of 45.0 and a mean University of California at Los Angeles (UCLA) activity score of 7.4.
Similar to the prior increase in popularity of HRA, hip arthroscopy has also become much more commonplace, and its indications continue to evolve.11 Hip arthroscopy has been used in the native hip joint to manage femoroacetabular impingement, labral tears, and iliopsoas tendinopathy, among other conditions.12 In addition, the use of hip arthroscopy has not been limited to the native hip but also has increased as a diagnostic and therapeutic procedure after hip arthroplasties. Bajwa and Villar12 found hip arthroscopy to be diagnostic in 23 of 24 patients who underwent the procedure after a hip arthroplasty, concluding that arthroscopy is a useful adjunct in the diagnosis of symptomatic arthroplasties.
Therefore, hip arthroscopy has been shown to be an effective modality to treat pathology in both the native hip and after hip arthroplasties. However, the effect of a prior hip arthroscopy on the outcome of a subsequent metal-on-metal HRA has not been determined. Piedade and colleagues13 showed a prior knee arthroscopy to increase the risk of postoperative complications and subsequent revision after total knee arthroplasty. Complications included reflex sympathetic dystrophy, undiagnosed pain, infection, stiffness, and component loosening. A prior osteochondroplasty at the femoral head-neck junction could increase the risk of femoral neck fracture after a subsequent HRA. Thus, the purpose of this study was to evaluate the clinical outcomes of a series of patients who received an HRA after a prior hip arthroscopy and to compare these results with a cohort of patients who received an HRA with no prior hip surgeries. Our hypothesis is that a prior hip arthroscopy will lead to inferior outcomes in patients undergoing HRA.
Materials and Methods
This study is a retrospective, case-control study using a 1:2 matching analysis. Dr. Su performed all HRAs, which were enrolled in an institutional review board–approved arthroplasty registry. All HRAs were performed using the BHR System.
The surgical technique for hip resurfacing arthroplasty has been described.1 All procedures were performed via a posterior approach with the patient in the lateral decubitus position. All patients received a hybrid metal-on-metal hip resurfacing, with an uncemented acetabular component and cemented femoral component. Intraoperative anesthesia for all patients was performed via a combined spinal-epidural anesthetic, and an epidural patient-controlled analgesic was used for the first day postoperatively, followed by a transition to oral analgesics. The sizes of the acetabular and femoral components were recorded for each hip resurfacing. Postoperatively, intermittent pneumatic compression devices were placed upon arrival in the recovery room, and active ankle flexion and extension exercises were initiated immediately after the patient’s neurologic function returned.14 Aspirin was used for chemical deep venous thrombosis prophylaxis in all patients postoperatively for a period of 6 weeks. Full weight-bearing, with the use of crutches for assistance with balance, was permitted immediately. Crutches were used for a period of 3 weeks prior to being discontinued.
From a database of 1357 HRAs (all BHR implants) performed between June 2006 and June 2012, 51 patients were identified who received an HRA after a prior hip arthroscopy. Eight patients were excluded because they did not possess adequate clinical documentation or were lost to follow-up. In the remaining 43 patients, there were 32 men and 11 women (21 right hips, 22 left hips), which formed the arthroscopy cohort. Two patients had a history of multiple hip arthroscopies (1 patient with 2 prior procedures, 1 patient with 3 prior procedures). The mean (SD) time from the most recent hip arthroscopy to the HRA was 2.5 (2.5) years. Table 1 presents a summary of the hip arthroscopy procedures (including only the most recent hip arthroscopy procedure in those with multiple arthroscopies).
Patient demographic variables (age, body mass index [BMI]) were recorded preoperatively, along with the Harris Hip Score (HHS),15 UCLA activity score,16 Western Ontario and McMaster Universities Osteoarthritis Index (WOMAC) score,17 and preoperative hip range of motion (flexion, extension, abduction, adduction, internal rotation, and external rotation). The same clinical indices were assessed postoperatively along with the Short Form-12 (SF-12) Health Survey Score,18 at the 6-week, 3-month, 6-month, 1-year, and most recent follow-up visits.
Radiographic assessment consisted of a low anteroposterior (AP) pelvic radiograph (with the radiographic beam centered on the pubic symphysis) and a cross-table lateral radiograph obtained at the most recent follow-up visit. Both the acetabular component abduction relative to the inter-teardrop line, and the angle between the femoral stem and the anatomic axis of the femoral shaft (stem-shaft angle) were measured on AP radiographs.19,20 Acetabular component anteversion was measured on the cross-table lateral radiographs as the angle between the projected long axis of the acetabular opening and a line drawn perpendicular to the long axis plane of the body (Figures A, B).21
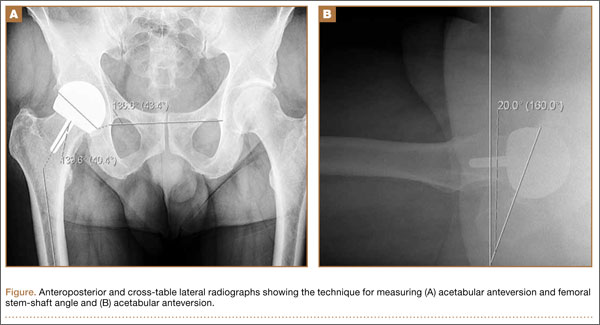
The same registry database was used to identify patients who received an HRA without a prior history of arthroscopy or hip surgery. A 1:2 matching analysis for those patients with a prior hip arthroscopy to those without a prior hip arthroscopy was performed to formulate a control group (control cohort) of 86 patients. Each patient in the arthroscopy cohort was matched with 2 patients in the control cohort based on the following parameters: age (± 6 years), sex (same), BMI (± 4 kg/m2), femoral head size (± 4 mm), and preoperative HHS and WOMAC scores (± 7 points). In the event an arthroscopy patient matched to 2 or more control patients, the patients who minimized the least squared error among the matching variables were selected.
Statistical Analysis
All data were collected and analyzed using Microsoft Excel software (Microsoft Corporation, Redmond, Washington). Statistical comparisons between the 2 cohorts regarding demographic variables, clinical outcomes, and radiographic alignment were performed using an unpaired, Student 2-tailed t test, with statistical significance set at P ≤ .05.
Results
A comparison of the results of the 1:2 matching analysis between the arthroscopy and control cohorts is presented in Table 2. There was no significant difference in the preoperative age, BMI, femoral head size, HHS, or WOMAC score between the 2 cohorts. However, the control cohort did show a more severe, preoperative flexion contracture (as expressed by a decreased amount of extension) and a decreased amount of preoperative abduction (Table 3). The preoperative UCLA activity score was also decreased in the control cohort, but this was not statistically significant.
The mean (SD) follow-up was 2.0 (1.0) years in the arthroscopy cohort and 2.1 (1.1) years in the control cohort. There was no significant difference in radiographic alignment between the 2 cohorts. The stem-shaft angle was 139.3° (SD, 5.4°) in the arthroscopy cohort (vs 138.3° [SD, 5.5°] in the control cohort; P = .3), the acetabular abduction was 43.9° (SD, 5.8°) in the arthroscopy cohort (vs 42.9° [SD, 6.1°] in the control cohort; P = .4), and the acetabular anteversion was 21.1° (SD, 7.5°) in the arthroscopy cohort (vs 20.8° [SD, 7.1°] in the control cohort; P = .8).
At 6-week follow-up, the arthroscopy cohort showed a significantly decreased WOMAC score compared with the control cohort (72.9 [SD, 15.5] vs 80.5 [SD, 11.8], respectively; P = .05). In addition, there was a trend towards a decreased SF-12 mental component score in the arthroscopy cohort (52.2 [SD, 9.3] vs 56.5 [SD, 7.8] in the control cohort; P = .06). However, none of the remaining clinical indices showed a significant difference between the 2 cohorts, and there was no difference in range of motion between the 2 cohorts at the 6-week follow-up visit (Table 4).
In addition, at 3-month follow-up, no statistically significant differences were seen between the 2 cohorts for any of the clinical indices or range of motion values. Both groups continued to improve rapidly, with HHS of 96.9 (SD, 3.5) in the arthroscopy cohort and 95.5 (SD, 6.6) in the control cohort, and WOMAC scores of 88.7 (SD, 10.2) and 89.5 (SD, 9.8), respectively (Table 5). Similarly, at the 6-month and 1-year follow-up intervals, the 2 cohorts showed continued improvement in their clinical measures, with no statistically significant differences between the 2 cohorts (Tables 6, 7).
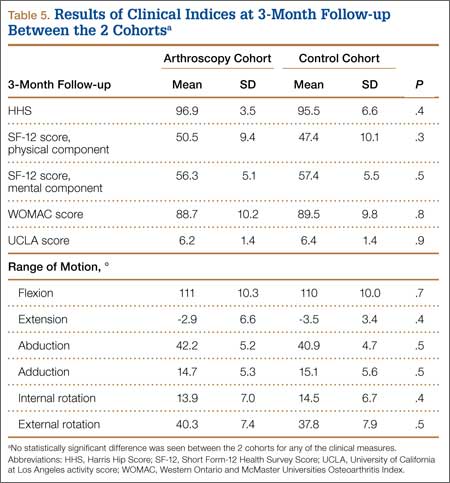
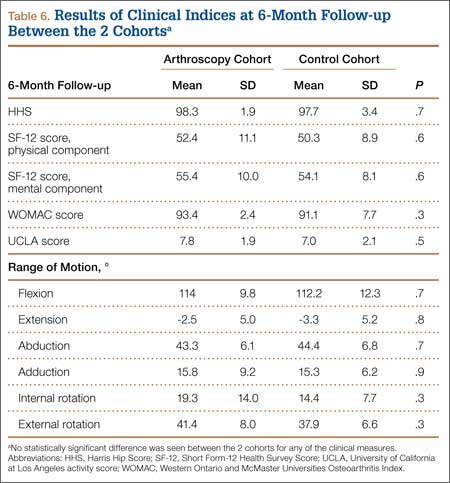
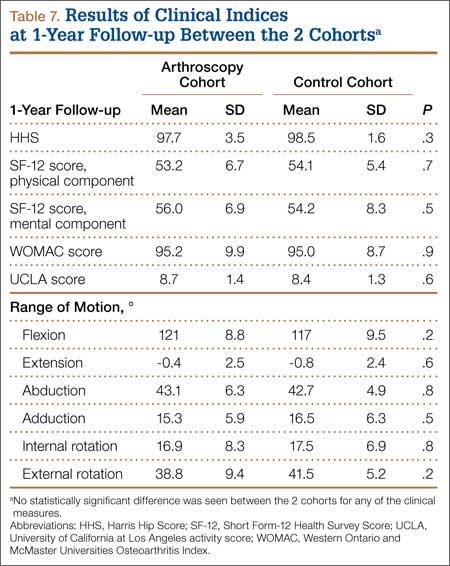
At the most recent follow-up visit, more than 1 year after surgery, the HHS was 99.5 (SD, 1.3) in the arthroscopy cohort and 99.2 (SD, 9.7) in the control cohort (P = .9), and the WOMAC score was 93.5 (SD, 11.3) and 92.4 (SD, 12.2), respectively (P = .8). No significant perioperative complications were seen in the arthroscopy cohort. In the arthroscopy cohort, 1 patient was diagnosed with a deep venous thrombosis 2 weeks after the procedure and was placed on low-molecular-weight heparin and coumadin for treatment. A second patient in the arthroscopy cohort had continued serosanguinous drainage for 4 days postoperatively, which resolved with continued compressive dressings. To date, no patients in the arthroscopy or control cohorts have required a second operation or revision of their components.
Discussion
Given the increasing prevalence of hip arthroscopies to treat multiple disorders of the native joint, it is important to assess the potential consequences of these procedures on future arthroplasties. Piedade and colleagues,13 in a retrospective review of 1474 primary total knee arthroplasties, showed a prior bony procedure (high tibial osteotomy, tibial plateau fracture, patellar realignment) to be predictive of decreased range of motion postoperatively. In addition, a prior knee arthroscopy was associated with a higher rate of postoperative complications, with 30% of the complications requiring a reoperation, and 8.3% of the complications requiring a revision total knee arthroplasty. Kaplan-Meier survival curves showed a survival rate of only 86.8% in those patients with a prior knee arthroscopy (vs 98.1% in those without a prior knee surgery).22 Therefore, the purpose of this study was to evaluate the clinical outcomes of a series of patients who received an HRA after a prior hip arthroscopy. After the initial 6-week follow-up visit, no significant difference was seen in the functional outcomes between those patients with or without a history of prior hip arthroscopy who received an HRA.
After analysis of patient outcomes using multiple clinical measurement tools, at 6-week, 3-month, 6-month, 1-year, and most recent follow-up intervals, the only significant difference between the 2 cohorts was the WOMAC score at 6-week follow-up. Interestingly, there was no significant difference seen in the other clinical assessments, including the SF-12 score, HHS, range of motion, or UCLA activity score (although this did trend towards significance). This can be explained by the difference in both the mode of administration and various metrics assessed by these instruments. In comparison to the HHS evaluation, the patient completes the WOMAC (rather than the clinician) and also provides a more detailed assessment of symptoms, pain, stiffness, and activities of daily living.17 Therefore, this study suggests that patients with a prior hip arthroscopy may require more time to return to their activities of daily living after an HRA. However, whether the statistically significant difference between the 2 scores translates into a clinically significant difference can be questioned.
The clinical outcomes of this series of patients were excellent at the short-term follow-up, and both groups achieved clinical results comparable to prior reported results of HRA.1,10,23,24 However, despite these results, there are several limitations to this study. First, longer-term follow-up is required to determine if any significant differences (such as aseptic loosening, infection, and prosthesis survival) are associated with a prior hip arthroscopy. In addition, this study included a relatively small cohort of patients who had a prior hip arthroscopy. However, a relatively large, single-surgeon database of 1357 HRAs was reviewed, with only 51 cases being reported (3.7%). With the increasing popularity of hip arthroscopy, the number of patients presenting for HRA will likely continue to increase. However, despite these limitations, this study shows that a prior hip arthroscopy does not appear to affect the short-term, clinical outcomes of a metal-on-metal HRA.
1. Amstutz HC, Beaulé PE, Dorey FJ, Le Duff MJ, Campbell PA, Gruen TA. Metal-on-metal hybrid surface arthroplasty. Surgical Technique. J Bone Joint Surg Am. 2006;88(suppl 1 Pt 2):234-249.
2. Daniel J, Pynsent PB, McMinn DJ. Metal-on-metal resurfacing of the hip in patients under the age of 55 years with osteoarthritis. J Bone Joint Surg Br. 2004;86(2):177-184.
3. Pollard TC, Baker RP, Eastaugh-Waring SJ, Bannister GC. Treatment of the young active patient with osteoarthritis of the hip. A five- to seven-year comparison of hybrid total hip arthroplasty and metal-on-metal resurfacing. J Bone Joint Surg Br. 2006;88(5):592-600.
4. Treacy RB, McBryde CW, Pynsent PB. Birmingham hip resurfacing arthroplasty. A minimum follow-up of five years. J Bone Joint Surg Br. 2005;87(2):167-170.
5. Amstutz HC, Le Duff MJ, Campbell PA, Gruen TA, Wisk LE. Clinical and radiographic results of metal-on-metal hip resurfacing with a minimum ten-year follow-up. J Bone Joint Surg Am. 2010;92(16):2663-2671.
6. Daniel J, Ziaee H, Pradhan C, Pynsent PB, McMinn DJ. Blood and urine metal ion levels in young and active patients after Birmingham hip resurfacing arthroplasty: four-year results of a prospective longitudinal study.
J Bone Joint Surg Br. 2007;89(2):169-173.
7. deSouza RM, Parsons NR, Oni T, Dalton P, Costa M, Krikler S. Metal ion levels following resurfacing arthroplasty of the hip: serial results over a ten-year period. J Bone Joint Surg Br. 2010;92(12):1642-1647.
8. Kwon YM, Thomas P, Summer B, et al. Lymphocyte proliferation responses in patients with pseudotumors following metal-on-metal hip resurfacing arthroplasty. J Orthop Res. 2010;28(4):444-450.
9. Australian Orthopaedic Association National Joint Replacement Registry. Annual Report 2011. Adelaide: Australian Orthopaedic Association; 2011. https://aoanjrr.dmac.adelaide.edu.au/annual-reports-2011. Accessed September 16, 2014.
10. Coulter G, Young DA, Dalziel RE, Shimmin AJ. Birmingham hip resurfacing at a mean of ten years: results from an independent centre. J Bone Joint Surg Br. 2012;94(3):315-321.
11. McCarthy JC, Jarrett BT, Ojeifo O, Lee JA, Bragdon CR. What factors influence long-term survivorship after hip arthroscopy? Clin Orthop. 2011;469(2):362-371.
12. Bajwa AS, Villar RN. Arthroscopy of the hip in patients following joint replacement. J Bone Joint Surg Br. 2011;93(7):890-896.
13. Piedade SR, Pinaroli A, Servien E, Neyret P. Is previous knee arthroscopy related to worse results in primary total knee arthroplasty? Knee Surg Sports Traumatol Arthrosc. 2009;17(4):328-333.
14. Gonzalez Della Valle A, Serota A, Go G, et al. Venous thromboembolism is rare with a multimodal prophylaxis protocol after total hip arthroplasty. Clin Orthop. 2006;(444):146-153.
15. Harris WH. Traumatic arthritis of the hip after dislocation and acetabular fractures: treatment by mold arthroplasty. An end-result study using a new method of result evaluation. J Bone Joint Surg Am. 1969;51(4):737-755.
16. Kershaw CJ, Atkins RM, Dodd CA, Bulstrode CJ. Revision total hip arthroplasty for aseptic failure. A review of 276 cases. J Bone Joint Surg Br. 1991;73(4):564-568.
17. Bellamy N. WOMAC: a 20-year experiential review of a patient-centered self-reported health status questionnaire. J Rheumatol. 2002;29(12):2473-2476.
18. Ware J Jr, Kosinski M, Keller SD. A 12-Item Short-Form Health Survey: construction of scales and preliminary tests of reliability and validity. Med Care. 1996;34(3):220-233.
19. Clark JM, Freeman MA, Witham D. The relationship of neck orientation to the shape of the proximal femur. J Arthroplasty. 1987;2(2):99-109.
20. Lewinnek GE, Lewis JL, Tarr R, Compere CL, Zimmerman JR. Dislocations after total hip-replacement arthroplasties. J Bone Joint Surg Am. 1978;60(2):217-220.
21. Yao L, Yao J, Gold RH. Measurement of acetabular version on the axiolateral radiograph. Clin Orthop. 1995;(316):106-111.
22. Piedade SR, Pinaroli A, Servien E, Neyret P. TKA outcomes after prior bone and soft tissue knee surgery. Knee Surg Sports Traumatol Arthrosc. 2013;21(12):2737-2743.
23. Amstutz HC, Beaulé PE, Dorey FJ, Le Duff MJ, Campbell PA, Gruen TA. Metal-on-metal hybrid surface arthroplasty: two to six-year follow-up study. J Bone Joint Surg Am. 2004;86(1):28-39.
24. Steffen RT, Pandit HP, Palan J, et al. The five-year results of the Birmingham Hip Resurfacing arthroplasty: an independent series. J Bone Joint Surg Br. 2008;90(4):436-441.
Metal-on-metal hip resurfacing arthroplasty (HRA) remains an alternative to total hip arthroplasty (THA) in appropriately selected, younger, active adults with degenerative hip disease.1-4 While concerns remain regarding the potential for adverse local tissue reactions from wear of the metal-on-metal bearing surface,5-8 10-year data from the Australian Orthopaedic Association National Joint Replacement Registry Annual Report9 showed a revision rate of only 6.3% when the Birmingham Hip Resurfacing (BHR) System was used (Smith & Nephew Inc, Memphis, Tennessee).In addition, in an independent review of 230 consecutive BHRs at a mean follow-up of 10.4 years, Coulter and colleagues10 showed encouraging clinical results, with a mean Oxford Hip Score of 45.0 and a mean University of California at Los Angeles (UCLA) activity score of 7.4.
Similar to the prior increase in popularity of HRA, hip arthroscopy has also become much more commonplace, and its indications continue to evolve.11 Hip arthroscopy has been used in the native hip joint to manage femoroacetabular impingement, labral tears, and iliopsoas tendinopathy, among other conditions.12 In addition, the use of hip arthroscopy has not been limited to the native hip but also has increased as a diagnostic and therapeutic procedure after hip arthroplasties. Bajwa and Villar12 found hip arthroscopy to be diagnostic in 23 of 24 patients who underwent the procedure after a hip arthroplasty, concluding that arthroscopy is a useful adjunct in the diagnosis of symptomatic arthroplasties.
Therefore, hip arthroscopy has been shown to be an effective modality to treat pathology in both the native hip and after hip arthroplasties. However, the effect of a prior hip arthroscopy on the outcome of a subsequent metal-on-metal HRA has not been determined. Piedade and colleagues13 showed a prior knee arthroscopy to increase the risk of postoperative complications and subsequent revision after total knee arthroplasty. Complications included reflex sympathetic dystrophy, undiagnosed pain, infection, stiffness, and component loosening. A prior osteochondroplasty at the femoral head-neck junction could increase the risk of femoral neck fracture after a subsequent HRA. Thus, the purpose of this study was to evaluate the clinical outcomes of a series of patients who received an HRA after a prior hip arthroscopy and to compare these results with a cohort of patients who received an HRA with no prior hip surgeries. Our hypothesis is that a prior hip arthroscopy will lead to inferior outcomes in patients undergoing HRA.
Materials and Methods
This study is a retrospective, case-control study using a 1:2 matching analysis. Dr. Su performed all HRAs, which were enrolled in an institutional review board–approved arthroplasty registry. All HRAs were performed using the BHR System.
The surgical technique for hip resurfacing arthroplasty has been described.1 All procedures were performed via a posterior approach with the patient in the lateral decubitus position. All patients received a hybrid metal-on-metal hip resurfacing, with an uncemented acetabular component and cemented femoral component. Intraoperative anesthesia for all patients was performed via a combined spinal-epidural anesthetic, and an epidural patient-controlled analgesic was used for the first day postoperatively, followed by a transition to oral analgesics. The sizes of the acetabular and femoral components were recorded for each hip resurfacing. Postoperatively, intermittent pneumatic compression devices were placed upon arrival in the recovery room, and active ankle flexion and extension exercises were initiated immediately after the patient’s neurologic function returned.14 Aspirin was used for chemical deep venous thrombosis prophylaxis in all patients postoperatively for a period of 6 weeks. Full weight-bearing, with the use of crutches for assistance with balance, was permitted immediately. Crutches were used for a period of 3 weeks prior to being discontinued.
From a database of 1357 HRAs (all BHR implants) performed between June 2006 and June 2012, 51 patients were identified who received an HRA after a prior hip arthroscopy. Eight patients were excluded because they did not possess adequate clinical documentation or were lost to follow-up. In the remaining 43 patients, there were 32 men and 11 women (21 right hips, 22 left hips), which formed the arthroscopy cohort. Two patients had a history of multiple hip arthroscopies (1 patient with 2 prior procedures, 1 patient with 3 prior procedures). The mean (SD) time from the most recent hip arthroscopy to the HRA was 2.5 (2.5) years. Table 1 presents a summary of the hip arthroscopy procedures (including only the most recent hip arthroscopy procedure in those with multiple arthroscopies).
Patient demographic variables (age, body mass index [BMI]) were recorded preoperatively, along with the Harris Hip Score (HHS),15 UCLA activity score,16 Western Ontario and McMaster Universities Osteoarthritis Index (WOMAC) score,17 and preoperative hip range of motion (flexion, extension, abduction, adduction, internal rotation, and external rotation). The same clinical indices were assessed postoperatively along with the Short Form-12 (SF-12) Health Survey Score,18 at the 6-week, 3-month, 6-month, 1-year, and most recent follow-up visits.
Radiographic assessment consisted of a low anteroposterior (AP) pelvic radiograph (with the radiographic beam centered on the pubic symphysis) and a cross-table lateral radiograph obtained at the most recent follow-up visit. Both the acetabular component abduction relative to the inter-teardrop line, and the angle between the femoral stem and the anatomic axis of the femoral shaft (stem-shaft angle) were measured on AP radiographs.19,20 Acetabular component anteversion was measured on the cross-table lateral radiographs as the angle between the projected long axis of the acetabular opening and a line drawn perpendicular to the long axis plane of the body (Figures A, B).21
The same registry database was used to identify patients who received an HRA without a prior history of arthroscopy or hip surgery. A 1:2 matching analysis for those patients with a prior hip arthroscopy to those without a prior hip arthroscopy was performed to formulate a control group (control cohort) of 86 patients. Each patient in the arthroscopy cohort was matched with 2 patients in the control cohort based on the following parameters: age (± 6 years), sex (same), BMI (± 4 kg/m2), femoral head size (± 4 mm), and preoperative HHS and WOMAC scores (± 7 points). In the event an arthroscopy patient matched to 2 or more control patients, the patients who minimized the least squared error among the matching variables were selected.
Statistical Analysis
All data were collected and analyzed using Microsoft Excel software (Microsoft Corporation, Redmond, Washington). Statistical comparisons between the 2 cohorts regarding demographic variables, clinical outcomes, and radiographic alignment were performed using an unpaired, Student 2-tailed t test, with statistical significance set at P ≤ .05.
Results
A comparison of the results of the 1:2 matching analysis between the arthroscopy and control cohorts is presented in Table 2. There was no significant difference in the preoperative age, BMI, femoral head size, HHS, or WOMAC score between the 2 cohorts. However, the control cohort did show a more severe, preoperative flexion contracture (as expressed by a decreased amount of extension) and a decreased amount of preoperative abduction (Table 3). The preoperative UCLA activity score was also decreased in the control cohort, but this was not statistically significant.
The mean (SD) follow-up was 2.0 (1.0) years in the arthroscopy cohort and 2.1 (1.1) years in the control cohort. There was no significant difference in radiographic alignment between the 2 cohorts. The stem-shaft angle was 139.3° (SD, 5.4°) in the arthroscopy cohort (vs 138.3° [SD, 5.5°] in the control cohort; P = .3), the acetabular abduction was 43.9° (SD, 5.8°) in the arthroscopy cohort (vs 42.9° [SD, 6.1°] in the control cohort; P = .4), and the acetabular anteversion was 21.1° (SD, 7.5°) in the arthroscopy cohort (vs 20.8° [SD, 7.1°] in the control cohort; P = .8).
At 6-week follow-up, the arthroscopy cohort showed a significantly decreased WOMAC score compared with the control cohort (72.9 [SD, 15.5] vs 80.5 [SD, 11.8], respectively; P = .05). In addition, there was a trend towards a decreased SF-12 mental component score in the arthroscopy cohort (52.2 [SD, 9.3] vs 56.5 [SD, 7.8] in the control cohort; P = .06). However, none of the remaining clinical indices showed a significant difference between the 2 cohorts, and there was no difference in range of motion between the 2 cohorts at the 6-week follow-up visit (Table 4).
In addition, at 3-month follow-up, no statistically significant differences were seen between the 2 cohorts for any of the clinical indices or range of motion values. Both groups continued to improve rapidly, with HHS of 96.9 (SD, 3.5) in the arthroscopy cohort and 95.5 (SD, 6.6) in the control cohort, and WOMAC scores of 88.7 (SD, 10.2) and 89.5 (SD, 9.8), respectively (Table 5). Similarly, at the 6-month and 1-year follow-up intervals, the 2 cohorts showed continued improvement in their clinical measures, with no statistically significant differences between the 2 cohorts (Tables 6, 7).
At the most recent follow-up visit, more than 1 year after surgery, the HHS was 99.5 (SD, 1.3) in the arthroscopy cohort and 99.2 (SD, 9.7) in the control cohort (P = .9), and the WOMAC score was 93.5 (SD, 11.3) and 92.4 (SD, 12.2), respectively (P = .8). No significant perioperative complications were seen in the arthroscopy cohort. In the arthroscopy cohort, 1 patient was diagnosed with a deep venous thrombosis 2 weeks after the procedure and was placed on low-molecular-weight heparin and coumadin for treatment. A second patient in the arthroscopy cohort had continued serosanguinous drainage for 4 days postoperatively, which resolved with continued compressive dressings. To date, no patients in the arthroscopy or control cohorts have required a second operation or revision of their components.
Discussion
Given the increasing prevalence of hip arthroscopies to treat multiple disorders of the native joint, it is important to assess the potential consequences of these procedures on future arthroplasties. Piedade and colleagues,13 in a retrospective review of 1474 primary total knee arthroplasties, showed a prior bony procedure (high tibial osteotomy, tibial plateau fracture, patellar realignment) to be predictive of decreased range of motion postoperatively. In addition, a prior knee arthroscopy was associated with a higher rate of postoperative complications, with 30% of the complications requiring a reoperation, and 8.3% of the complications requiring a revision total knee arthroplasty. Kaplan-Meier survival curves showed a survival rate of only 86.8% in those patients with a prior knee arthroscopy (vs 98.1% in those without a prior knee surgery).22 Therefore, the purpose of this study was to evaluate the clinical outcomes of a series of patients who received an HRA after a prior hip arthroscopy. After the initial 6-week follow-up visit, no significant difference was seen in the functional outcomes between those patients with or without a history of prior hip arthroscopy who received an HRA.
After analysis of patient outcomes using multiple clinical measurement tools, at 6-week, 3-month, 6-month, 1-year, and most recent follow-up intervals, the only significant difference between the 2 cohorts was the WOMAC score at 6-week follow-up. Interestingly, there was no significant difference seen in the other clinical assessments, including the SF-12 score, HHS, range of motion, or UCLA activity score (although this did trend towards significance). This can be explained by the difference in both the mode of administration and various metrics assessed by these instruments. In comparison to the HHS evaluation, the patient completes the WOMAC (rather than the clinician) and also provides a more detailed assessment of symptoms, pain, stiffness, and activities of daily living.17 Therefore, this study suggests that patients with a prior hip arthroscopy may require more time to return to their activities of daily living after an HRA. However, whether the statistically significant difference between the 2 scores translates into a clinically significant difference can be questioned.
The clinical outcomes of this series of patients were excellent at the short-term follow-up, and both groups achieved clinical results comparable to prior reported results of HRA.1,10,23,24 However, despite these results, there are several limitations to this study. First, longer-term follow-up is required to determine if any significant differences (such as aseptic loosening, infection, and prosthesis survival) are associated with a prior hip arthroscopy. In addition, this study included a relatively small cohort of patients who had a prior hip arthroscopy. However, a relatively large, single-surgeon database of 1357 HRAs was reviewed, with only 51 cases being reported (3.7%). With the increasing popularity of hip arthroscopy, the number of patients presenting for HRA will likely continue to increase. However, despite these limitations, this study shows that a prior hip arthroscopy does not appear to affect the short-term, clinical outcomes of a metal-on-metal HRA.
1. Amstutz HC, Beaulé PE, Dorey FJ, Le Duff MJ, Campbell PA, Gruen TA. Metal-on-metal hybrid surface arthroplasty. Surgical Technique. J Bone Joint Surg Am. 2006;88(suppl 1 Pt 2):234-249.
2. Daniel J, Pynsent PB, McMinn DJ. Metal-on-metal resurfacing of the hip in patients under the age of 55 years with osteoarthritis. J Bone Joint Surg Br. 2004;86(2):177-184.
3. Pollard TC, Baker RP, Eastaugh-Waring SJ, Bannister GC. Treatment of the young active patient with osteoarthritis of the hip. A five- to seven-year comparison of hybrid total hip arthroplasty and metal-on-metal resurfacing. J Bone Joint Surg Br. 2006;88(5):592-600.
4. Treacy RB, McBryde CW, Pynsent PB. Birmingham hip resurfacing arthroplasty. A minimum follow-up of five years. J Bone Joint Surg Br. 2005;87(2):167-170.
5. Amstutz HC, Le Duff MJ, Campbell PA, Gruen TA, Wisk LE. Clinical and radiographic results of metal-on-metal hip resurfacing with a minimum ten-year follow-up. J Bone Joint Surg Am. 2010;92(16):2663-2671.
6. Daniel J, Ziaee H, Pradhan C, Pynsent PB, McMinn DJ. Blood and urine metal ion levels in young and active patients after Birmingham hip resurfacing arthroplasty: four-year results of a prospective longitudinal study.
J Bone Joint Surg Br. 2007;89(2):169-173.
7. deSouza RM, Parsons NR, Oni T, Dalton P, Costa M, Krikler S. Metal ion levels following resurfacing arthroplasty of the hip: serial results over a ten-year period. J Bone Joint Surg Br. 2010;92(12):1642-1647.
8. Kwon YM, Thomas P, Summer B, et al. Lymphocyte proliferation responses in patients with pseudotumors following metal-on-metal hip resurfacing arthroplasty. J Orthop Res. 2010;28(4):444-450.
9. Australian Orthopaedic Association National Joint Replacement Registry. Annual Report 2011. Adelaide: Australian Orthopaedic Association; 2011. https://aoanjrr.dmac.adelaide.edu.au/annual-reports-2011. Accessed September 16, 2014.
10. Coulter G, Young DA, Dalziel RE, Shimmin AJ. Birmingham hip resurfacing at a mean of ten years: results from an independent centre. J Bone Joint Surg Br. 2012;94(3):315-321.
11. McCarthy JC, Jarrett BT, Ojeifo O, Lee JA, Bragdon CR. What factors influence long-term survivorship after hip arthroscopy? Clin Orthop. 2011;469(2):362-371.
12. Bajwa AS, Villar RN. Arthroscopy of the hip in patients following joint replacement. J Bone Joint Surg Br. 2011;93(7):890-896.
13. Piedade SR, Pinaroli A, Servien E, Neyret P. Is previous knee arthroscopy related to worse results in primary total knee arthroplasty? Knee Surg Sports Traumatol Arthrosc. 2009;17(4):328-333.
14. Gonzalez Della Valle A, Serota A, Go G, et al. Venous thromboembolism is rare with a multimodal prophylaxis protocol after total hip arthroplasty. Clin Orthop. 2006;(444):146-153.
15. Harris WH. Traumatic arthritis of the hip after dislocation and acetabular fractures: treatment by mold arthroplasty. An end-result study using a new method of result evaluation. J Bone Joint Surg Am. 1969;51(4):737-755.
16. Kershaw CJ, Atkins RM, Dodd CA, Bulstrode CJ. Revision total hip arthroplasty for aseptic failure. A review of 276 cases. J Bone Joint Surg Br. 1991;73(4):564-568.
17. Bellamy N. WOMAC: a 20-year experiential review of a patient-centered self-reported health status questionnaire. J Rheumatol. 2002;29(12):2473-2476.
18. Ware J Jr, Kosinski M, Keller SD. A 12-Item Short-Form Health Survey: construction of scales and preliminary tests of reliability and validity. Med Care. 1996;34(3):220-233.
19. Clark JM, Freeman MA, Witham D. The relationship of neck orientation to the shape of the proximal femur. J Arthroplasty. 1987;2(2):99-109.
20. Lewinnek GE, Lewis JL, Tarr R, Compere CL, Zimmerman JR. Dislocations after total hip-replacement arthroplasties. J Bone Joint Surg Am. 1978;60(2):217-220.
21. Yao L, Yao J, Gold RH. Measurement of acetabular version on the axiolateral radiograph. Clin Orthop. 1995;(316):106-111.
22. Piedade SR, Pinaroli A, Servien E, Neyret P. TKA outcomes after prior bone and soft tissue knee surgery. Knee Surg Sports Traumatol Arthrosc. 2013;21(12):2737-2743.
23. Amstutz HC, Beaulé PE, Dorey FJ, Le Duff MJ, Campbell PA, Gruen TA. Metal-on-metal hybrid surface arthroplasty: two to six-year follow-up study. J Bone Joint Surg Am. 2004;86(1):28-39.
24. Steffen RT, Pandit HP, Palan J, et al. The five-year results of the Birmingham Hip Resurfacing arthroplasty: an independent series. J Bone Joint Surg Br. 2008;90(4):436-441.
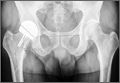
Confusion Follows Malaise and Pain
ANSWER
The radiograph demonstrates innumerable small lytic defects throughout the calvarium. The patient’s confusion is most likely secondary to profound metabolic abnormalities. However, in the setting of lytic bone lesions, metabolic abnormalities of renal insufficiency, severe hypercalcemia, and hypomagnesemia, one must be concerned about an occult myeloma, and appropriate work-up must be done.

A 70-year-old woman is brought to the emergency department by her family for evaluation of acute altered mental status. According to the family, the patient has been complaining of general malaise, back pain, and severe joint pain for the past few days. Her confusion has increased in the past 24 hours. Medical history is significant for hypertension. Physical exam reveals an elderly female who appears somewhat uncomfortable. Vital signs are normal. Overall, her exam is stable. She has tenderness throughout her back and several of her joints, but no abnormal effusion or swelling is noted. While the patient is in triage, baseline labwork is ordered. The results indicate a serum creatinine of 1.83 mg/dL; serum calcium, 16.7 mg/dL; and serum magnesium, 1.4 mEq/L. Radiograph of the skull is obtained. What is your impression?
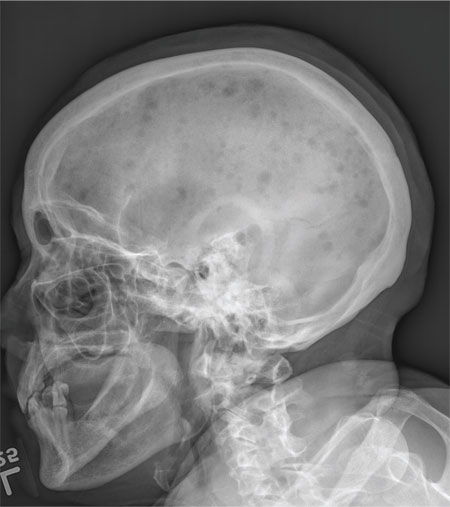
During Veggie Harvest, Chest Pain Hits
ANSWER
This ECG is representative of an acute anterior MI. This is evidenced by ST segment elevation in leads V2 through V4. Inferolateral injury is indicated by ST elevations in leads II, III, and aVF, as well as in leads V5 and V6.
Infarction was confirmed via laboratory data. Subsequent cardiac catheterization documented occlusion of the proximal left anterior descending artery.

A 48-year-old man arrives at your facility via emergency medical service (EMS). He is alert, oriented, and cooperative but reports substernal chest pain despite receiving two nitroglycerin tablets from the paramedics. The problem started while the patient was working in his garden, harvesting tomatoes and peppers but not doing anything particularly strenuous. The abrupt onset of chest pain caused him to stand up to catch his breath; he immediately became diaphoretic. The pain rated 10 out of 10 in severity and made him feel as if he’d been stabbed in the chest. After 10 minutes of persistent pain, he called to his neighbor, who contacted 911. The EMS arrived within six minutes. The paramedics found the patient conscious, profusely diaphoretic, and in severe pain; he was clutching his chest with his right fist. IV access was obtained, oxygen started, and sublingual nitroglycerin and aspirin given. The patient declined morphine due to a previous anaphylactic reaction to it. The pain subsided significantly, and the patient was loaded for transfer. During the 17-minute trip, his chest pain increased, and a second nitroglycerin tablet was given. It provided less relief than the previous one had. Medical history is remarkable for hypertension, smoking, adult-onset diabetes, and morbid obesity. The man has a primary care provider but hasn’t been seen in six years. He admits he is noncompliant with his medications because he just doesn’t like to take drugs—in fact, he hasn’t taken any of his prescribed medications for the past two years. He has never had chest pain prior to this event. Surgical history is remarkable for a cholecystectomy and a right knee replacement. His (unfilled) prescribed medications include a b-blocker, metformin, and a calcium channel blocker. He is allergic to morphine sulfate. He smokes marijuana on a daily basis because it calms his nerves. Review of systems is remarkable for multiple ulcers on the patient’s legs. He says he doesn’t require a cane for ambulation but prefers to walk with one. He also describes himself as a “nervous worrier,” hence his use of marijuana. Physical examination reveals an alert, anxious, and apprehensive man. His weight is 342 lb and his height, 70 in. He is afebrile and diaphoretic. Vital signs include a blood pressure of 164/98 mm Hg; pulse, 80 beats/min; respiratory rate, 20 breaths/min-1; and temperature, 97.4°F. Pertinent physical findings include no evidence of jugular venous distention or thyromegaly, clear lung sounds bilaterally, a regular rate and rhythm with distant muffled heart sounds, and no extra heart sounds or murmurs. The abdomen is obese, soft, and nontender. The peripheral pulses are equal bilaterally, and there is 2+ pitting edema present to the level of the knees. Multiple shallow ulcers are present on both lower legs, and a deep ulcer is present on the inferior surface of the left foot. After the patient is attached to telemetry monitoring and blood samples are drawn for analysis, an ECG is obtained. It reveals a ventricular rate of 80 beats/min; PR interval, 162 ms; QRS duration, 106 ms; QT/QTc interval, 370/426 ms; P axis, 51°; R axis, –20°; and T axis, 70°. What is your interpretation of this ECG?
The Role of Computed Tomography for Postoperative Evaluation of Percutaneous Sacroiliac Screw Fixation and Description of a “Safe Zone”
Pelvic injuries account for 3% of all skeletal fractures.1 Injury to the sacroiliac (SI) joint is frequently associated with unstable pelvic ring fractures, which are potentially life-threatening injuries. Surgical fixation of these injuries is preferred to nonoperative treatment given the potential for improved reduction and early mobilization and weight-bearing, thereby decreasing perioperative morbidity and improving functional outcome.2
The classic method of surgical fixation of the SI joint consisted of open reduction and internal fixation. This method carried a substantial risk for large dissection, iatrogenic nerve injury, and increased blood loss to the already traumatized patient.3 Percutaneous fixation allows for a shorter operating time, decreased soft-tissue stripping, and decreased blood loss compared with a traditional open procedure.4 However, posterior pelvic anatomy is complex and variable, and reports have found screw misplacements as high as 24%5 and neurologic complication rates up to 18%.6-9
Various imaging modalities, including fluoroscopy,5 computed tomography (CT),6-7 fluoroscopic CT, and computer-assisted techniques5,9 have been used to achieve proper screw placement. Conventional fluoroscopy is the standard for intraoperative screw placement. However, acceptable reduction of the SI joint and proper implantation of the screws without perforation of the neural foramina is challenging, especially when coupled with difficulties of fluoroscopic imaging and variations in pelvic anatomy.
Sacral dysplasia has been reported to occur in up to 20% to 40% of the population and has significant implications in patients indicated for iliosacral screw placement.10 Incorrect placement of iliosacral screws may result in iatrogenic neurovascular complications.11-13 Malpositioned screws using fluoroscopic guidance have been reported in 2% to 15% of patients with an incidence of neurologic compromise between 0.5% and 7.7%. As little as 4° of misdirection can result in damage to neurovascular structures.14
At our institution, we routinely obtained postoperative CT to evaluate the placement of SI screws. The objective of this retrospective study is to evaluate the rate of revision surgery of percutaneous SI screw fixation, to determine whether CT is an accurate tool for evaluation of the reduction and the need for revision surgery, and to decide if any violation of the neural foramina is safe.
Materials and Methods
After institutional review board approval, we retrospectively reviewed and evaluated medical records and radiographs of all patients who sustained unstable pelvic ring fractures between July 1, 2005, and June 30, 2010. We identified all patients who were treated with closed reductions and percutaneous iliosacral screw fixation, according to the method described by Routt in 1995.4 We excluded all pelvic fractures in patients who underwent open reduction for the posterior injury or did not have percutaneous SI screws placed, those with spinal injury, and those without follow-up. Of the 46 patients who met the inclusion criteria were 26 men and 20 women with a mean age of 42 years (range, 16 to 73 years). Motor vehicle accidents accounted for 13 cases; 19 were crush injuries and 14 were falls from height. Seventeen patients (37%) met the radiographic criteria for sacral dysmorphism. Forty-two of the 46 patients were polytrauma patients with associated musculoskeletal injuries and/or abdominal, chest, or head injuries.
Six patients presented with some neurologic deficit at the time of injury; all fractures were closed. The initial imaging study included plain anteroposterior (AP), inlet, and outlet radiographs of the pelvis and a pelvic CT scan. Using the classification of Young and Burgess,15 there were 3 vertical shear injuries, 13 lateral compression–type injuries, 17 anterior-posterior–type injuries, 7 sacral fractures, and 6 combination- or unclassifiable-type pelvic injuries. Of the sacral fractures, there were 3 Denis zone 1, 3 Denis zone 2, and 1 Denis zone 3.
The pelvic CT scan included the entire pelvis from the ilium to the ischial tuberosities. Each scan consisted of either a 5.0-mm or a 2.5-mm sequential axial image. A picture archiving and communication system (PACS) workstation using Centricity version 2.1 (GE Medical Systems, Waukesha, Wisconsin) was used to analyze each scan with a bone algorithm. On PACS, each initial displacement was characterized by the amount of SI joint widening at the level of the S1 and was measured using digital calipers.
Surgery
Mean time to surgery was 4 days (range, 2 to 15 days) after the injury. A total of 51 SI screws were implanted in 46 patients. We achieved closed reduction of the posterior pelvic ring by various techniques, including compression with percutaneous partially threaded screw fixation. In the cases in which the posterior ring lesion was associated with a pure pubic symphysis disruption, the anterior pelvis was initially reduced and stabilized with small-fragment plate fixation (Synthes, Inc, Paoli, Pennsylvania). The posterior complex was stabilized with 1 screw in 41 patients, 2 cases required a transiliac screw, and 2 screws (S1 and S2) were placed in each of the remaining 3 cases. Definitive stabilization of the posterior pelvis was achieved with percutaneous, partially threaded 7.3- or 7.5-mm–diameter cannulated screws (Synthes, Inc, and Zimmer Inc, Warsaw, Indiana, respectively) in 42 fractures and 6.5-mm screws (Synthes, Inc) in 4 fractures. In 11 cases where the fracture was through the sacrum, fully threaded cannulated screws were used to avoid compression. Screw insertion was performed under fluoroscopic guidance with inlet, outlet, and lateral sacral views. One of 2 fellowship-trained trauma surgeons performed the surgeries. Rehabilitation plans were customized to each patient based on concomitant injuries.
Postoperative Assessment
AP, lateral sacral, and inlet and outlet postoperative radiographs were taken in all cases within 24 hours after surgery. Pelvic CT was also obtained within 24 hours of surgery to review reduction and screw placement.
Using the measurement tool on the PACS system, we measured the penetration of the screw into the foramen. Screws were graded as intraosseous (completely contained within the sacral bone), skived (less than 2 mm of partial penetration into the S1 foramen), or extruded (the screw not contained by the bone). Screw penetration of the S1 was evaluated on the radiographic images as well as the axial images of the CT scans.
After surgery, the senior orthopedic resident and attending surgeon performed and documented detailed neurologic evaluations. They reviewed the medical record for neurologic deficit following surgical fixation.
Results
The mean follow-up time was 12 months (range, 8 months to 2 years). Two patients expired secondary to associated injuries. There were no early deaths related to the pelvic surgery. Stable fixation, including bone or ligamentous healing, as well as full weight-bearing status, was noted in every case. No case exhibited loss of reduction or implant failure or infection.
According to Matta’s criteria of anatomic reduction within 1 cm, all patients were found to have satisfactory reductions.7 Six of 46 patients had documented preoperative neurologic deficits. After percutaneous screw fixation, 10 of 46 patients had postoperative neurologic deficit, 2 of which were unchanged from preoperative evaluation. Of the 8 patients with new/altered postoperative neurologic deficit, CT showed neural foramen penetration greater than 2.1 mm in only 2 patients. Both patients underwent screw revision, resulting in improved neurologic deficit. The remaining 4 patients did not have foramen penetration and improved their neurologic function over the course of 2 weeks with return to presurgical status by 6 weeks without necessitating screw removal.
Twenty-three of the 51 screws (45%) had some violation of the S1 foramen on the CT. There were 17 patients with dysmorphic sacrums in which 21 S1 screws were placed. Eleven of 21 (52%) screws showed some penetration of the S1 foramen on CT. There were 29 patients with normal sacral morphology in which 30 S1 screws were placed. Twelve of 30 (40%) screws penetrated the S1 foramen. All violations were in the superior one-third position of the foramen. Two of 46 (4%; 1 with dysmorphism, 1 without) had a new neurologic deficit associated with the surgery (Table). CT showed sacral foramen penetration, and both screws were revised with a better neurologic examination.
High-resolution CTs were obtained in 32 patients, while 14 patients underwent the standard 5.0-mm–cut CTs. Of the 32 patients in which a 2.5-mm high-resolution CT was obtained, 20 (62.5%) had evidence of screw penetration (Figures 1, 2). All violations of the S1 neural foramen were in the superior portion of the foramen.
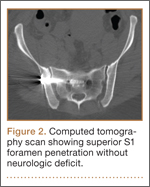
When compared with patients who had a 5.0-mm CT, the patients who underwent a high-resolution CT were more likely to show neural foramen penetration (P = .3). The average screw penetration into the S1 neural foramen measured 3.3 mm (range, 1.6-5.7 mm) in dysmorphic sacrum and 2.7 mm (range, 1.4-7 mm) in normal sacrum. However, in our study, any foramen penetration of less than 2.1 mm on CT did not result in neurologic deficit.
Discussion
Pelvic fractures are fairly common and represent approximately 5% of all trauma admissions and 3% of all skeletal fractures nationwide.1 The current treatment for SI disruption is either nonoperative or operative. Surgical fixation is technically demanding and surgeons often need a long learning curve to acquire the demanding technique because of the limitations of radiographic visualization of the relevant landmarks.16
Letournel17 developed the technique for iliosacral screw fixation for the treatment of posterior pelvic ring injuries, where 1 or 2 large screws (6.5-7.3 mm in diameter) are inserted under fluoroscopic guidance through the ilium, across the SI articulation, and into the superior sacral vertebral bodies using percutaneous techniques. Currently, the standard procedure to accomplish the percutaneous placement of iliosacral screws derives mainly from the technique described by Matta with the C-arm fluoroscopy visualizing the pelvis in 3 views: strict AP, inlet, and outlet views.7
Routt and colleagues4 recommend a strict lateral view of the sacrum, particularly when crossing the narrow zone of the sacral alar. They reported high union rates and accurate placement of the screws.4 There are limitations to the use of biplanar fluoroscopy because the intraoperative images are not orthogonal, with the average arc (67º) between the ideal inlet and outlet. However, because of the variability in sacral anatomy, CT guidance was recommended by others.2,6,8,18 Operating in a CT suite had other complications. Misinterpretation of CT led to “in-out-in” screws, which resulted in neurapraxia.
In our study, we used the technique described by Matta and colleagues for placement of the screws and performed a postoperative CT to evaluate screw placement and to assess pelvic reduction.7 We had a high penetration rate using CT, which increased with better resolution, even though none of the radiographs showed any obvious evidence of misplacement of the screws. Ebraheim and colleagues6 described the relationship of the S1 nerve root in its neural foramen and found it to be approximately 8.7 mm inferior and 7.8 mm medial to the starting point for a pedicle screw. Given these numbers, it is possible that a large amount of skiving can be tolerated contingent on an adequate reduction of the SI joint.
Because of our high rates of skiving and low rates of neurologic deficit, a new “safe zone” for screw insertion can be expanded to include skiving of the S1 neural foramen up to 3 mm without fear of nerve root injury. However, drilling and screw insertion at higher speeds can also cause neurologic injury secondary to thermal injury or soft tissue being caught up in a rotating drill/screw.
Evaluation of placement of percutaneous SI screw placement in our study resulted in neural foramen penetration in 43% of SI screws, which is higher than other studies.14,19,20 Our study showed that screw penetration up to 2 mm does not correlate with neurologic deficit. Iatrogenic neurologic deficit secondary to perforation of the foramina occurred in only 1 patient. Penetration of the foramina in all cases was in the superior portion of the foramen. We propose that there is a safe zone within the S1 neural foramen, and small amounts of penetration in the superior one-third of the foramen on axial CT images do not correlate with neurologic deficit. This potential safe zone is predicated on adequate reduction of the SI joint.
Neural foramen penetration shown on postoperative CT does not necessarily correlate with neurologic deficit. A postoperative CT is not indicated unless there are findings of a postoperative nerve injury. Our ideal screw placement skives the superior S1 foramen allowing for a larger screw diameter in a safe zone.
CT-guided placement has been proposed; however, concerns about radiation exposure, cost, and feasibility with similar outcomes compared with fluoroscopic-guided screw placement has resulted in its falling out of favor.
Iatrogenic nerve injuries are reported to occur in 0% to 6% of all percutaneous SI screw placement.14,21 Risk factors for iatrogenic nerve injury while using fluoroscopic guidance include sacral morphologic abnormalities, presence of intestinal gas, or contrast.22 Although these may be minimized with proper use of fluoroscopy, obtaining anatomic reduction as well as a thorough understanding of the pelvic morphology, the surgeon must be prepared to obtain further studies, such as a CT scan, if there is postoperative neurologic deficit.
Based on our findings, we do not routinely obtain a postoperative CT for SI screw placement, unless there is concern for malreduction or there is neurologic deficit. We also believe that up to 2 mm of foramen penetration is safe and does not result in neurologic deficit.
1. Failinger MS, McGanity PL. Unstable fractures of the pelvic ring. J Bone and Joint Surg Am. 1992;74(5):781-791.
2. Smith HE, Yuan PS, Sasso R, Papadopolous S, Vaccaro AR. An evaluation of image-guided technologies in the placement of percutaneous iliosacral screws. Spine (Phila Pa 1976). 2006;31(2):234-238.
3. Judet R, Judet J, Letournel E. Fractures of the acetabulum: classification and surgical approaches for open reduction. Preliminary report. J Bone Joint Surg Am. 1964;46(16):1615-1646.
4. Routt ML Jr, Kregor PJ, Simonian PT, Mayo KA. Early results of percutaneous iliosacral screws placed with the patient in the supine position. J Orthop Trauma. 1995;9(3):207-214.
5. Tonetti J, Carrat L, Blendea S, et al. Clinical results of percutaneous pelvic surgery. Computer assisted surgery using ultrasound compared to standard fluoroscopy. Comput Aided Surg. 2001;6(4):204-211.
6. Ebraheim NA, Coombs R, Jackson WT, Rusin JJ. Percutaneous computed tomography-guided stabilization of posterior pelvic fractures. Clin Orthop. 1994;(307):222-228.
7. Keating JF, Werier J, Blachut P, et al. Early fixation of the vertically unstable pelvis: the role of iliosacral screw fixation of the posterior lesion. J Orthop Trauma. 1999;13(2):107-113.
8. Webb LX, de Araujo W, Donofrio P, et al. Electromyography monitoring for percutaneous placement of iliosacral screws. J Orthop Trauma. 2000;14(4):245-254.
9. Barrick EF, O’Mara JW, Lane HE 3rd. Iliosacral screw insertion using computer-assisted CT image guidance: a laboratory study. Comput Aided Surg. 1998;3(6):289-296.
10. Routt ML Jr, Simonian PT, Agnew SG, Mann FA. Radiographic recognition of the sacral alar slope for optimal placement of iliosacral screws: a cadaveric and clinical study. J Orthop Trauma. 1996;10(3):171-177.
11. Altman DT, Jones CB, Routt ML Jr. Superior gluteal artery injury during iliosacral screw placement. J Orthop Trauma. 1999;13(3):220-227.
12. Stephen DJ. Pseudoaneurysm of the superior gluteal arterial system: an unusual cause of pain after a pelvic fracture. J Trauma. 1997;43(1):146-149.
13. Stöckle U, König B, Hofstetter R, Nolte LP, Haas NP. [Navigation assisted by image conversion. An experimental study on pelvic screw fixation]
[in German]. Unfallchirurg. 2001;104(3):215-220.
14. Templeman D, Schmidt A, Freese J, Weisman I, et al. Proximity of iliosacral screws to neurovascular structures after internal fixation. Clin Orthop. 1996;(329):194-198.
15. Young JW, Burgess AR, Brumback RJ, Poka A. Pelvic fractures: value of plain radiography in early assessment and management. Radiology. 1986;160(2):445-451.
16. Graves ML, Routt ML Jr. Iliosacral screw placement: are uniplanar changes realistic based on standard fluoroscopic imaging? J Trauma. 2011;7(1):204-208.
17. Letournel E. Pelvic fractures. Injury. 1978;10(2):145-148.
18. Blake-Toker AM, Hawkins L, Nadalo L, et al. CT guided percutaneous fixation of sacroiliac fractures in trauma patients. J Trauma. 2001;51(6):1117-1121.
19. Hinsche AF, Giannoudis PV, Smith RM. Fluoroscopy-based multiplanar image guidance for insertion of sacroiliac screws. Clin Orthop. 2002;(395):135-144.
20. van den Bosch EW, van Zwienen CM, van Vugt AB. Fluoroscopic positioning of sacroiliac screws in 88 patients. J Trauma. 2002;53(1):44-48.
21. Cole JD, Blum DA, Ansel LJ. Outcome after fixation of unstable posterior pelvic ring injuries. Clin Orthop. 1996;(329):160-179.
22. Routt ML Jr, Simonian PT. Closed reduction and percutaneous skeletal fixation of sacral fractures. Clin Orthop. 1996;(329):121-128.
Pelvic injuries account for 3% of all skeletal fractures.1 Injury to the sacroiliac (SI) joint is frequently associated with unstable pelvic ring fractures, which are potentially life-threatening injuries. Surgical fixation of these injuries is preferred to nonoperative treatment given the potential for improved reduction and early mobilization and weight-bearing, thereby decreasing perioperative morbidity and improving functional outcome.2
The classic method of surgical fixation of the SI joint consisted of open reduction and internal fixation. This method carried a substantial risk for large dissection, iatrogenic nerve injury, and increased blood loss to the already traumatized patient.3 Percutaneous fixation allows for a shorter operating time, decreased soft-tissue stripping, and decreased blood loss compared with a traditional open procedure.4 However, posterior pelvic anatomy is complex and variable, and reports have found screw misplacements as high as 24%5 and neurologic complication rates up to 18%.6-9
Various imaging modalities, including fluoroscopy,5 computed tomography (CT),6-7 fluoroscopic CT, and computer-assisted techniques5,9 have been used to achieve proper screw placement. Conventional fluoroscopy is the standard for intraoperative screw placement. However, acceptable reduction of the SI joint and proper implantation of the screws without perforation of the neural foramina is challenging, especially when coupled with difficulties of fluoroscopic imaging and variations in pelvic anatomy.
Sacral dysplasia has been reported to occur in up to 20% to 40% of the population and has significant implications in patients indicated for iliosacral screw placement.10 Incorrect placement of iliosacral screws may result in iatrogenic neurovascular complications.11-13 Malpositioned screws using fluoroscopic guidance have been reported in 2% to 15% of patients with an incidence of neurologic compromise between 0.5% and 7.7%. As little as 4° of misdirection can result in damage to neurovascular structures.14
At our institution, we routinely obtained postoperative CT to evaluate the placement of SI screws. The objective of this retrospective study is to evaluate the rate of revision surgery of percutaneous SI screw fixation, to determine whether CT is an accurate tool for evaluation of the reduction and the need for revision surgery, and to decide if any violation of the neural foramina is safe.
Materials and Methods
After institutional review board approval, we retrospectively reviewed and evaluated medical records and radiographs of all patients who sustained unstable pelvic ring fractures between July 1, 2005, and June 30, 2010. We identified all patients who were treated with closed reductions and percutaneous iliosacral screw fixation, according to the method described by Routt in 1995.4 We excluded all pelvic fractures in patients who underwent open reduction for the posterior injury or did not have percutaneous SI screws placed, those with spinal injury, and those without follow-up. Of the 46 patients who met the inclusion criteria were 26 men and 20 women with a mean age of 42 years (range, 16 to 73 years). Motor vehicle accidents accounted for 13 cases; 19 were crush injuries and 14 were falls from height. Seventeen patients (37%) met the radiographic criteria for sacral dysmorphism. Forty-two of the 46 patients were polytrauma patients with associated musculoskeletal injuries and/or abdominal, chest, or head injuries.
Six patients presented with some neurologic deficit at the time of injury; all fractures were closed. The initial imaging study included plain anteroposterior (AP), inlet, and outlet radiographs of the pelvis and a pelvic CT scan. Using the classification of Young and Burgess,15 there were 3 vertical shear injuries, 13 lateral compression–type injuries, 17 anterior-posterior–type injuries, 7 sacral fractures, and 6 combination- or unclassifiable-type pelvic injuries. Of the sacral fractures, there were 3 Denis zone 1, 3 Denis zone 2, and 1 Denis zone 3.
The pelvic CT scan included the entire pelvis from the ilium to the ischial tuberosities. Each scan consisted of either a 5.0-mm or a 2.5-mm sequential axial image. A picture archiving and communication system (PACS) workstation using Centricity version 2.1 (GE Medical Systems, Waukesha, Wisconsin) was used to analyze each scan with a bone algorithm. On PACS, each initial displacement was characterized by the amount of SI joint widening at the level of the S1 and was measured using digital calipers.
Surgery
Mean time to surgery was 4 days (range, 2 to 15 days) after the injury. A total of 51 SI screws were implanted in 46 patients. We achieved closed reduction of the posterior pelvic ring by various techniques, including compression with percutaneous partially threaded screw fixation. In the cases in which the posterior ring lesion was associated with a pure pubic symphysis disruption, the anterior pelvis was initially reduced and stabilized with small-fragment plate fixation (Synthes, Inc, Paoli, Pennsylvania). The posterior complex was stabilized with 1 screw in 41 patients, 2 cases required a transiliac screw, and 2 screws (S1 and S2) were placed in each of the remaining 3 cases. Definitive stabilization of the posterior pelvis was achieved with percutaneous, partially threaded 7.3- or 7.5-mm–diameter cannulated screws (Synthes, Inc, and Zimmer Inc, Warsaw, Indiana, respectively) in 42 fractures and 6.5-mm screws (Synthes, Inc) in 4 fractures. In 11 cases where the fracture was through the sacrum, fully threaded cannulated screws were used to avoid compression. Screw insertion was performed under fluoroscopic guidance with inlet, outlet, and lateral sacral views. One of 2 fellowship-trained trauma surgeons performed the surgeries. Rehabilitation plans were customized to each patient based on concomitant injuries.
Postoperative Assessment
AP, lateral sacral, and inlet and outlet postoperative radiographs were taken in all cases within 24 hours after surgery. Pelvic CT was also obtained within 24 hours of surgery to review reduction and screw placement.
Using the measurement tool on the PACS system, we measured the penetration of the screw into the foramen. Screws were graded as intraosseous (completely contained within the sacral bone), skived (less than 2 mm of partial penetration into the S1 foramen), or extruded (the screw not contained by the bone). Screw penetration of the S1 was evaluated on the radiographic images as well as the axial images of the CT scans.
After surgery, the senior orthopedic resident and attending surgeon performed and documented detailed neurologic evaluations. They reviewed the medical record for neurologic deficit following surgical fixation.
Results
The mean follow-up time was 12 months (range, 8 months to 2 years). Two patients expired secondary to associated injuries. There were no early deaths related to the pelvic surgery. Stable fixation, including bone or ligamentous healing, as well as full weight-bearing status, was noted in every case. No case exhibited loss of reduction or implant failure or infection.
According to Matta’s criteria of anatomic reduction within 1 cm, all patients were found to have satisfactory reductions.7 Six of 46 patients had documented preoperative neurologic deficits. After percutaneous screw fixation, 10 of 46 patients had postoperative neurologic deficit, 2 of which were unchanged from preoperative evaluation. Of the 8 patients with new/altered postoperative neurologic deficit, CT showed neural foramen penetration greater than 2.1 mm in only 2 patients. Both patients underwent screw revision, resulting in improved neurologic deficit. The remaining 4 patients did not have foramen penetration and improved their neurologic function over the course of 2 weeks with return to presurgical status by 6 weeks without necessitating screw removal.
Twenty-three of the 51 screws (45%) had some violation of the S1 foramen on the CT. There were 17 patients with dysmorphic sacrums in which 21 S1 screws were placed. Eleven of 21 (52%) screws showed some penetration of the S1 foramen on CT. There were 29 patients with normal sacral morphology in which 30 S1 screws were placed. Twelve of 30 (40%) screws penetrated the S1 foramen. All violations were in the superior one-third position of the foramen. Two of 46 (4%; 1 with dysmorphism, 1 without) had a new neurologic deficit associated with the surgery (Table). CT showed sacral foramen penetration, and both screws were revised with a better neurologic examination.
High-resolution CTs were obtained in 32 patients, while 14 patients underwent the standard 5.0-mm–cut CTs. Of the 32 patients in which a 2.5-mm high-resolution CT was obtained, 20 (62.5%) had evidence of screw penetration (Figures 1, 2). All violations of the S1 neural foramen were in the superior portion of the foramen.
When compared with patients who had a 5.0-mm CT, the patients who underwent a high-resolution CT were more likely to show neural foramen penetration (P = .3). The average screw penetration into the S1 neural foramen measured 3.3 mm (range, 1.6-5.7 mm) in dysmorphic sacrum and 2.7 mm (range, 1.4-7 mm) in normal sacrum. However, in our study, any foramen penetration of less than 2.1 mm on CT did not result in neurologic deficit.
Discussion
Pelvic fractures are fairly common and represent approximately 5% of all trauma admissions and 3% of all skeletal fractures nationwide.1 The current treatment for SI disruption is either nonoperative or operative. Surgical fixation is technically demanding and surgeons often need a long learning curve to acquire the demanding technique because of the limitations of radiographic visualization of the relevant landmarks.16
Letournel17 developed the technique for iliosacral screw fixation for the treatment of posterior pelvic ring injuries, where 1 or 2 large screws (6.5-7.3 mm in diameter) are inserted under fluoroscopic guidance through the ilium, across the SI articulation, and into the superior sacral vertebral bodies using percutaneous techniques. Currently, the standard procedure to accomplish the percutaneous placement of iliosacral screws derives mainly from the technique described by Matta with the C-arm fluoroscopy visualizing the pelvis in 3 views: strict AP, inlet, and outlet views.7
Routt and colleagues4 recommend a strict lateral view of the sacrum, particularly when crossing the narrow zone of the sacral alar. They reported high union rates and accurate placement of the screws.4 There are limitations to the use of biplanar fluoroscopy because the intraoperative images are not orthogonal, with the average arc (67º) between the ideal inlet and outlet. However, because of the variability in sacral anatomy, CT guidance was recommended by others.2,6,8,18 Operating in a CT suite had other complications. Misinterpretation of CT led to “in-out-in” screws, which resulted in neurapraxia.
In our study, we used the technique described by Matta and colleagues for placement of the screws and performed a postoperative CT to evaluate screw placement and to assess pelvic reduction.7 We had a high penetration rate using CT, which increased with better resolution, even though none of the radiographs showed any obvious evidence of misplacement of the screws. Ebraheim and colleagues6 described the relationship of the S1 nerve root in its neural foramen and found it to be approximately 8.7 mm inferior and 7.8 mm medial to the starting point for a pedicle screw. Given these numbers, it is possible that a large amount of skiving can be tolerated contingent on an adequate reduction of the SI joint.
Because of our high rates of skiving and low rates of neurologic deficit, a new “safe zone” for screw insertion can be expanded to include skiving of the S1 neural foramen up to 3 mm without fear of nerve root injury. However, drilling and screw insertion at higher speeds can also cause neurologic injury secondary to thermal injury or soft tissue being caught up in a rotating drill/screw.
Evaluation of placement of percutaneous SI screw placement in our study resulted in neural foramen penetration in 43% of SI screws, which is higher than other studies.14,19,20 Our study showed that screw penetration up to 2 mm does not correlate with neurologic deficit. Iatrogenic neurologic deficit secondary to perforation of the foramina occurred in only 1 patient. Penetration of the foramina in all cases was in the superior portion of the foramen. We propose that there is a safe zone within the S1 neural foramen, and small amounts of penetration in the superior one-third of the foramen on axial CT images do not correlate with neurologic deficit. This potential safe zone is predicated on adequate reduction of the SI joint.
Neural foramen penetration shown on postoperative CT does not necessarily correlate with neurologic deficit. A postoperative CT is not indicated unless there are findings of a postoperative nerve injury. Our ideal screw placement skives the superior S1 foramen allowing for a larger screw diameter in a safe zone.
CT-guided placement has been proposed; however, concerns about radiation exposure, cost, and feasibility with similar outcomes compared with fluoroscopic-guided screw placement has resulted in its falling out of favor.
Iatrogenic nerve injuries are reported to occur in 0% to 6% of all percutaneous SI screw placement.14,21 Risk factors for iatrogenic nerve injury while using fluoroscopic guidance include sacral morphologic abnormalities, presence of intestinal gas, or contrast.22 Although these may be minimized with proper use of fluoroscopy, obtaining anatomic reduction as well as a thorough understanding of the pelvic morphology, the surgeon must be prepared to obtain further studies, such as a CT scan, if there is postoperative neurologic deficit.
Based on our findings, we do not routinely obtain a postoperative CT for SI screw placement, unless there is concern for malreduction or there is neurologic deficit. We also believe that up to 2 mm of foramen penetration is safe and does not result in neurologic deficit.
1. Failinger MS, McGanity PL. Unstable fractures of the pelvic ring. J Bone and Joint Surg Am. 1992;74(5):781-791.
2. Smith HE, Yuan PS, Sasso R, Papadopolous S, Vaccaro AR. An evaluation of image-guided technologies in the placement of percutaneous iliosacral screws. Spine (Phila Pa 1976). 2006;31(2):234-238.
3. Judet R, Judet J, Letournel E. Fractures of the acetabulum: classification and surgical approaches for open reduction. Preliminary report. J Bone Joint Surg Am. 1964;46(16):1615-1646.
4. Routt ML Jr, Kregor PJ, Simonian PT, Mayo KA. Early results of percutaneous iliosacral screws placed with the patient in the supine position. J Orthop Trauma. 1995;9(3):207-214.
5. Tonetti J, Carrat L, Blendea S, et al. Clinical results of percutaneous pelvic surgery. Computer assisted surgery using ultrasound compared to standard fluoroscopy. Comput Aided Surg. 2001;6(4):204-211.
6. Ebraheim NA, Coombs R, Jackson WT, Rusin JJ. Percutaneous computed tomography-guided stabilization of posterior pelvic fractures. Clin Orthop. 1994;(307):222-228.
7. Keating JF, Werier J, Blachut P, et al. Early fixation of the vertically unstable pelvis: the role of iliosacral screw fixation of the posterior lesion. J Orthop Trauma. 1999;13(2):107-113.
8. Webb LX, de Araujo W, Donofrio P, et al. Electromyography monitoring for percutaneous placement of iliosacral screws. J Orthop Trauma. 2000;14(4):245-254.
9. Barrick EF, O’Mara JW, Lane HE 3rd. Iliosacral screw insertion using computer-assisted CT image guidance: a laboratory study. Comput Aided Surg. 1998;3(6):289-296.
10. Routt ML Jr, Simonian PT, Agnew SG, Mann FA. Radiographic recognition of the sacral alar slope for optimal placement of iliosacral screws: a cadaveric and clinical study. J Orthop Trauma. 1996;10(3):171-177.
11. Altman DT, Jones CB, Routt ML Jr. Superior gluteal artery injury during iliosacral screw placement. J Orthop Trauma. 1999;13(3):220-227.
12. Stephen DJ. Pseudoaneurysm of the superior gluteal arterial system: an unusual cause of pain after a pelvic fracture. J Trauma. 1997;43(1):146-149.
13. Stöckle U, König B, Hofstetter R, Nolte LP, Haas NP. [Navigation assisted by image conversion. An experimental study on pelvic screw fixation]
[in German]. Unfallchirurg. 2001;104(3):215-220.
14. Templeman D, Schmidt A, Freese J, Weisman I, et al. Proximity of iliosacral screws to neurovascular structures after internal fixation. Clin Orthop. 1996;(329):194-198.
15. Young JW, Burgess AR, Brumback RJ, Poka A. Pelvic fractures: value of plain radiography in early assessment and management. Radiology. 1986;160(2):445-451.
16. Graves ML, Routt ML Jr. Iliosacral screw placement: are uniplanar changes realistic based on standard fluoroscopic imaging? J Trauma. 2011;7(1):204-208.
17. Letournel E. Pelvic fractures. Injury. 1978;10(2):145-148.
18. Blake-Toker AM, Hawkins L, Nadalo L, et al. CT guided percutaneous fixation of sacroiliac fractures in trauma patients. J Trauma. 2001;51(6):1117-1121.
19. Hinsche AF, Giannoudis PV, Smith RM. Fluoroscopy-based multiplanar image guidance for insertion of sacroiliac screws. Clin Orthop. 2002;(395):135-144.
20. van den Bosch EW, van Zwienen CM, van Vugt AB. Fluoroscopic positioning of sacroiliac screws in 88 patients. J Trauma. 2002;53(1):44-48.
21. Cole JD, Blum DA, Ansel LJ. Outcome after fixation of unstable posterior pelvic ring injuries. Clin Orthop. 1996;(329):160-179.
22. Routt ML Jr, Simonian PT. Closed reduction and percutaneous skeletal fixation of sacral fractures. Clin Orthop. 1996;(329):121-128.
Patients Overwhelmingly Prefer Inpatient Boarding to ED Boarding
Clinical question: When hallway boarding is required, do patients prefer inpatient units over the ED?
Background: ED crowding is associated with patient dissatisfaction, ambulance diversion, delays in care, medical errors, and higher mortality rates. Strategies to alleviate the problem of boarding admitted patients in the ED can include relocation to inpatient hallways while awaiting a regular hospital bed. Traditional objections to inpatient hallway boarding include concerns regarding patient satisfaction and safety.
Study design: Structured telephone survey.
Setting: Suburban, university-based, teaching hospital.
Synopsis: Patients who required boarding in the ED hallway after hospital admission were eligible for inpatient hallway boarding according to the institutional protocol, which screens for those with only mild to moderate comorbidities. Of 110 consecutive patients contacted who experienced both ED and inpatient hallway boarding, 105 consented to participate in a tested telephone survey instrument.
The overall preferred location was inpatient hallways for 85% (95% CI 75-90) of respondents. Comparing ED boarding to inpatient hallway boarding, respondents preferred inpatient boarding with regard to staff availability (84%), safety (83%), confidentiality (82%), and comfort (79%).
Study results were subject to non-response bias, because working telephone numbers were required for study inclusion, as well as recall bias, because the survey was conducted within several months after discharge. This study’s results are based on actual patient experiences, whereas prior literature relied on patients to hypothesize the preferred environment after experiencing only ED hallway boarding to predict satisfaction.
Bottom line: Boarding in inpatient hallways was associated with higher patient satisfaction compared with ED hallway boarding.
Citation: Viccellio P, Zito JA, Sayage V, et al. Patients overwhelmingly prefer inpatient boarding to emergency department boarding [published online ahead of print September 21, 2013].
Surgical Readmission Rate Variation Dependent on Surgical Volume, Surgical Mortality Rates
Clinical question: What factors determine rates of readmission after major surgery?
Background: Reducing hospital readmission rates has become a national priority. The U.S. patterns for surgical readmissions are unknown, as are the specific structural and quality characteristics of hospitals associated with lower surgical readmission rates.
Study design: Retrospective study of national Medicare data was used to calculate 30-day readmission rates for six major surgical procedures.
Setting: U.S. Hospitals, 2009-2010.
Synopsis: Six major surgical procedures were tracked by Medicare data, with 479,471 discharges from 3,004 hospitals. Structural characteristics included hospital size, teaching status, region, ownership, and proportion of patients living below the federal poverty line. Three well-established measures of surgical quality were used: the HQA surgical score, procedure volume, and 30-day mortality.
Hospitals in the highest quartile for surgical volume had a significantly lower readmission rate. Additionally, hospitals with the lowest surgical mortality rates had significantly lower readmission rates. Interestingly, high adherence to reported surgical process measures was only marginally associated with reduced admission rates. Prior studies have also shown inconsistent relationship between HQA surgical score and mortality.
Limitations to this study include inability to account for factors not captured by billing codes and the focus on a Medicare population.
Bottom line: Surgical readmission rates are associated with measures of surgical quality, specifically procedural volume and mortality.
Citation: Tsai TC, Joynt KE, Orav EJ, Gawande AA, Jha AK. Variation in surgical-readmission rates and quality of hospital care. 2013;369(12):1134-1142.
Higher Continuity of Care Results in Lower Rate of Preventable Hospitalizations
Clinical question: Is continuity of care related to preventable hospitalizations among older adults?
Background: Preventable hospitalizations cost approximately $25 billion annually in the U.S. The relationship between continuity of care and the risk of preventable hospitalization is unknown.
Study design: Retrospective cohort study.
Setting: Random sample of fee-for-service Medicare beneficiaries, for ambulatory visits and hospital admissions.
Synopsis: This study examined 3.2 million Medicare beneficiaries using 2008-2010 claims data to measure continuity and the first preventable hospitalization. The Prevention Quality Indicators definitions and technical specifications from the Agency for Healthcare Research and Quality were used to identify preventable hospitalizations. Both the continuity of care score and usual provider continuity score were used to calculate continuity metrics. Baseline risk of preventable hospitalization included age, sex, race, Medicaid dual-eligible status, and residential zip code.
During a two-year period, 12.6% of patients had a preventable hospitalization. After adjusting for variables, a 0.1 increase in continuity of care was associated with about a 2% lower rate of preventable hospitalization. Interestingly, continuity of care was not related to mortality rates.
This study extends prior research associating continuity of care with reduced rate of hospitalization; however, the associations found cannot assert a causal relationship. This study used coding practices that vary throughout the country, included only older fee-for-service Medicare beneficiaries, and could not verify why some patients had higher continuity of care. The authors suggest that efforts to strengthen physician-patient relationships through high-quality primary care will deter some hospital admissions.
Bottom line: Higher continuity of ambulatory care is associated with lower preventable hospitalizations in Medicare beneficiaries.
Citation: Nyweide DJ, Anthony DL, Bynum JP, et al. Continuity of care and the risk of preventable hospitalization in older adults. 2013;173(20):1879-1885.
Characteristics and Impact of Hospitalist-Staffed, Post-Discharge Clinic
Clinical question: What effect does a hospitalist-staffed, post-discharge clinic have on time to first post-hospitalization visit?
Background: Hospital discharge is a well-recognized care transition that can leave patients vulnerable to morbidity and re-hospitalization. Limited primary care access can hamper complex post-hospital follow-up. Discharge clinic models staffed by hospitalists have been developed to mitigate access issues, but research is lacking to describe their characteristics and benefits.
Study design: Single-center, prospective, observational database review.
Setting: Large, academic primary care practice affiliated with an academic medical center.
Synopsis: Between 2009 and 2011, this hospitalist-staffed, post-discharge clinic saw 596 patients, while the affiliated, large primary care practice saw 10,839 patients. Patients utilizing the hospitalist discharge clinic were more likely to be black (39% vs. 29%, <0.001) and to receive primary care from resident clinics (40% vs. 21%, <0.001). The median duration from hospital discharge to the first clinic visit was shorter for the post-discharge clinic (8.45 ± 0.43 days, <0.001).
The number of radiology and laboratory tests performed at the first post-discharge clinic visit showed similar patterns between the hospitalist discharge clinic and the primary care practice. Study design and size did not permit comparisons of readmission rates or mortality from time of discharge and also precluded evaluation of interventions on discharge-related medication errors or response time to outstanding test results.
Bottom line: A hospitalist-staffed, post-discharge clinic was associated with shorter time to first post-discharge visit, especially for patients who are black and receive primary care from resident clinics.
Citation: Doctoroff L, Nijhawan A, McNally D, Vanka A, Yu R, Mukamal KJ. The characteristics and impact of a hospitalist-staffed post-discharge clinic. 2013;126(11):1016.e9-1016.e15.