User login
Team links telomere degeneration and MDS

telomeres in green
Image by Claus Azzalin
New research has revealed a direct link between telomere degeneration and myelodysplastic syndromes (MDS).
“MDS risk correlates with advancing age, therapy-induced DNA damage, and/or shorter telomeres, but whether telomere erosion directly causes MDS is unknown,” said Simona Colla, PhD, of the MD Anderson Cancer Center in Houston, Texas.
“Our study provided genetic evidence that DNA damage caused by telomere loss is linked to this disorder.”
Dr Colla and her colleagues described this study in Cancer Cell.
The team’s in vitro and in vivo work showed that DNA damage caused by dysfunctional telomeres resulted in repressed expression of the gene SRSF2.
SRSF2 is an RNA splicing gene that plays a role in cellular processes. This change impacted common myeloid progenitors (CMPs), affecting their ability to differentiate or fully mature.
“This study established an intimate link across telomere biology, aberrant RNA splicing, and CMP differentiation,” said Ron DiPinho, MD, also of the MD Anderson Cancer Center.
“This may suggest that strategies to mitigate this DNA damage may be useful for preventing and/or treating MDS.”
Dr Colla added that the researchers’ findings “were consistent with long-standing observations that poor prognosis in MDS correlates strongly with short telomeres and elevated DNA damage in CMP cells.”
“This improved understanding should provide highly specific risk biomarkers for preventing and treating this incurable disease,” she said. ![]()
BMI may affect bleeding risk with warfarin

SAN FRANCISCO—Obese patients have a higher risk of bleeding while taking warfarin than patients of normal weight, according to research presented at the ATVB/PVD 2015 Scientific Sessions.
In a study of more than 800 patients taking the anticoagulant, obese individuals were almost twice as likely as normal-weight individuals to experience a major bleed.
And patients in the highest obesity class had the greatest risk of bleeding.
Adedotun A. Ogunsua, MD, of the University of Massachusetts Medical School in Worcester, presented these findings at the meeting as abstract 388.
He and his colleagues analyzed 863 patients taking warfarin. The researchers divided patients according to their body mass index (BMI) and looked at the rate of abnormal bleeding, including major gastrointestinal and brain bleeds and minor bleeds.
According to BMI, 21% of the patients were of normal weight, 38% were overweight, and 41.3% were obese, including class I (21%), class II (9%), and class III (11.3%).
Overall, 8.2% of patients (n=71) had abnormal bleeding during the study. Among the reported bleeds, about a third (35.2%) were major and two-thirds (64.8%) were minor.
Multivariable analyses showed that obesity (having a BMI higher than 30) significantly increased the risk of having a major bleed. The hazard ratio was 1.84 (P<0.001).
In univariate analyses, the risk of major bleeding increased with higher obesity categories. The hazard ratios were 1.30 for class I, 1.85 for class II, and 1.93 for class III.
The researchers said these results do not suggest patients should stop taking warfarin because of their weight. However, future studies are needed to understand why obesity increases the bleeding risk for patients receiving warfarin and whether similar risks exist for other anticoagulants. ![]()
New method to treat EPO-resistant anemias

Researchers believe they have found a new way to treat anemias that are resistant to erythropoietin (EPO).
The team identified a pair of drugs, one that is already approved for use in the US, that can activate the cell receptor PPAR-α and synergize with low amounts of
glucocorticoids to increase red blood cell (RBC) production.
Their research is serving as the foundation for an upcoming clinical trial in patients with Diamond-Blackfan anemia (DBA).
Harvey Lodish, PhD, of the Whitehead Institute for Biomedical Research in Cambridge, Massachusetts, and his colleagues described the research in a letter to Nature.
The team noted that certain anemias, such as DBA, cannot be treated with EPO. EPO controls RBC production by causing colony-forming-unit erythroids (CFU-Es) to divide and differentiate into RBCs. In DBA, the CFU-Es die before they can make RBCs, and patients have too few CFU-Es to make EPO treatment effective.
In 2010, Dr Lodish and his colleagues determined that glucocorticoids increase RBCs in EPO-resistant anemias by acting on burst-forming-unit erythroids (BFU-Es).
Glucocorticoids increase the likelihood that, when BFU-Es divide, one or both of the resulting cells remains a BFU-E instead of differentiating into CFU-Es. Patients treated with glucocorticoids have more BFU-Es, which, in turn, produce more CFU-Es and, ultimately, more RBCs.
With this in mind, the researchers screened for drugs that could interact with and boost glucocorticoids’ activity.
Glucocorticoids act by binding to a receptor in the cytoplasm that migrates into the nucleus and affects the expression of multiple genes. So the team screened for drugs that inhibit or activate other nuclear receptors.
They found that two drugs used to treat lipid disorders worked with glucocorticoids to increase RBC production in vitro. Both of these drugs, GW7647 and fenofibrate, activate PPARα. Fenofibrate was approved by the US Food and Drug Administration in 2001 and has been used to treat high cholesterol in adults and children.
When the researchers studied the mechanism of action of glucocorticoids and GW7647/fenofibrate, they found the glucocorticoid receptor binds to approximately 1000 sites in the DNA and turns on a large number of genes.
Fenofibrate and GW7647 activate the PPARα receptor, which subsequently binds adjacent to the glucocorticoid receptor on the DNA. The receptors modulate genes that are critical for BFU-E cell self-renewal and ultimately produce more RBCs.
When combined with dexamethasone, treatment with either GW7647 or fenofibrate led to a 150-fold increase in erythroblast production, which is 3- to 5-fold greater than the increase observed with dexamethasone alone.
These results have led the researchers to begin a clinical trial to test the effectiveness of a glucocorticoid/fenofibrate treatment in children with DBA.
Beyond the treatment of DBA, the researchers are optimistic about the impact that glucocorticoid/fenofibrate treatment might have on seemingly unrelated conditions.
“Glucocorticoids represent one of the most prescribed classes of drugs,” said Xiaofei Gao, PhD, a researcher in the Lodish lab.
“Basically, if PPARα is important in a disease that is currently treated by glucocorticoids, we may have a new way to treat those diseases that reduces the harmful side effects of glucocorticoids. That could affect a lot of patients.” ![]()
Early Recognition: The Rate-Limiting Step to Quality Care for Severe Sepsis Patients in the Emergency Department
From the Department of Medicine, University of Pennsylvania, and the Department of Emergency Medicine, Thomas Jefferson University Hospital, Philadelphia, PA.
Abstract
- Objective: To detail strategies to improve sepsis recognition and the quality of care provided to the septic patient.
- Methods: Review of the literature.
- Results: Severe sepsis affects nearly 3 million individuals each year in the United States, and cost estimates for these hospitalizations exceed $24 billion. Effective management is predicated on timely recognition. In this review, we detail strategies to improve early identification of potentially septic patients as well as the quality of care provided to the septic patient in the emergency department (ED). The strategies discussed are based upon an understanding of the signs and symptoms of sepsis and the clinical risk factors associated with sepsis, which can be used to design novel strategies to screen patients for sepsis and risk stratify patients at risk for clinical deterioration.
- Conclusion: ED structures and processes can be used to increase adherence with sepsis management guidelines to improve patient outcomes.
Severe sepsis affects nearly 3 million individuals each year in the United States and cost estimates for these hospitalizations exceed $24 billion [1–3]. Sepsis is a life-threatening condition characterized by a suspected or identified infection accompanied by a vigorous host inflammatory response. In severe sepsis, end-organ dysfunction manifests in myriad forms, including altered mental status, acute kidney injury, liver dysfunction, pulmonary dysfunction, and hemodynamic compromise [4,5]. This protean presentation of a deadly condition makes identification and risk stratification both challenging and essential to improving patient outcomes. The majority of patients with severe sepsis will receive their initial care within an emergency department (ED) [6,7]. It is essential that emergency medicine providers have the means to appropriately identify patients presenting with severe sepsis in a timely manner—thus facilitating life-saving measures such as early intravenous fluid resuscitation and administration of timely and appropriate antimicrobials.
In this review, we detail strategies to improve sepsis recognition and the quality of care provided to the septic patient in the ED. The strategies discussed are based upon an understanding of the signs and symptoms of sepsis and the clinical risk factors associated with sepsis, which can be used to design novel strategies to screen patients for sepsis and risk stratify patients for clinical deterioration. Then, we review suggested ED structures and processes to increase adherence with sepsis-based guidelines to improve patient outcomes. Successful implementation is predicated on hospital administrative support towards the efforts given the time and resources required and strong and committed leadership across the health care system.
Epidemiology of Severe Sepsis
Estimates of annual cases of severe sepsis vary, ranging from 1 million to 3 million cases in the United States [1–3]. In-hospital mortality for this condition ranges from 14% to 30% [5]. The incidence of severe sepsis in the United States has been increasing at a rate of 13% annually, with an estimated cost of greater than $24 billion per year [1,2]. In 2 large cohorts of hospitalized patients, it was found that sepsis contributed to 1 in every 2 to 3 deaths following inpatient admission [8]. Coincident with these increased estimates, advances in the early identification and treatment of sepsis have led to decreasing mortality rates over the past decade [1,9].
Of importance to the ED clinician, an episode of sepsis has long-term effects on cognitive and physical function, quality-of-life, and survival [10,11]. Post-discharge, approximately one-quarter of sepsis survivors will be readmitted within 30 days [12–14]. In as many as half of these instances, another life-threatening infection is the cause for readmission, making the past medical history, including a detailed accounting of recent episodes of sepsis, an important part of the initial ED evaluation [12]. Furthermore, severe sepsis survivors spend a large proportion of their time following discharge within a health care facility, and will frequently present to the ED with an acute condition from such an environment. Important factors for predicting readmission after a sepsis hospitalization include patient age, severity of illness, hospital length of stay, and the need for intensive care during the initial hospitalization [12–14].
Principles of Effective Sepsis Management
The principles of effective sepsis management begin with early identification in the pre-hospital setting, at triage, or when a patient begins to decompensate in the hospital. After the point of initial recognition, core principles include risk stratification, timely and appropriate antimicrobial administration, initial intravenous fluid boluses and ongoing resuscitation guided by physical examination and objective resuscitation end-points [4,5]. These practices have been operationalized in the care bundles of the Surviving Sepsis Campaign Guidelines [4]. Within 3 hours, the resuscitation bundle includes measuring serum lactate to risk stratify patients, obtaining blood cultures, administering broad-spectrum antibiotics, and administering 30 mL/kg crystalloid in patients with hypotension or hyperlactatemia [4]. The 6-hour bundle expands upon these initial measures and includes additional management recommendations based on resuscitation end-points.
As effective management is predicated on timely recognition, an understanding of the impact of delayed recognition is essential to provide optimal care for the severe sepsis patient in the ED. Decades of research has revealed that certain markers predict adverse outcomes, including transition to septic shock and death, as do delayed processes of care. Importantly, while early quantitative resuscitation was demonstrated to improve outcomes in a meta-analysis, there was no demonstrable benefit when resuscitation was initiated late (> 24 hours) in the course in the ICU (odds ratio of death, 1.16 [95% confidence interval, 0.60–2.22]) [15].
Strategies To Improve Recognition
Pre-Hospital Environment
From EMS to ED Triage
Borrowing the principle “time equals tissue” from a variety of time sensitive conditions (eg, myocardial infarction management [“time equals muscle”] and stroke care [“time equals brain”]), clinicians and researchers have realized that expedited recognition of severe sepsis patients begins at the time of initial contact with the health care system. For severe sepsis patients, clinicians need to think “time equals organ function.” Given the frequency with which sepsis patients arrive to the ED via EMS, effective communication between EMS and ED providers could be leveraged to prepare the ED team to provide timely care for the sepsis patient via a “sepsis alert.” While confirmation of its applicability to sepsis care is required in the absence of a regionalized network of sepsis centers, the rationale is based on the experience of the effectiveness of trauma and stroke alert systems [20–22]. For patients not recognized as potentially being infected by EMS providers during transport, repeat vital signs during ED triage can be screened to identify patients exhibiting signs of the systemic inflammatory response syndrome (SIRS) [4,23]. The same principles of effective communication apply for patients being sent from medical clinics to the ED for evaluation and treatment of potential severe sepsis. For patients arriving independent of EMS, focused triage and initial vital signs are the starting point for identifying severe sepsis at the most proximal phase of entry into the health care system.
Vital Signs and SIRS Criteria in the ED
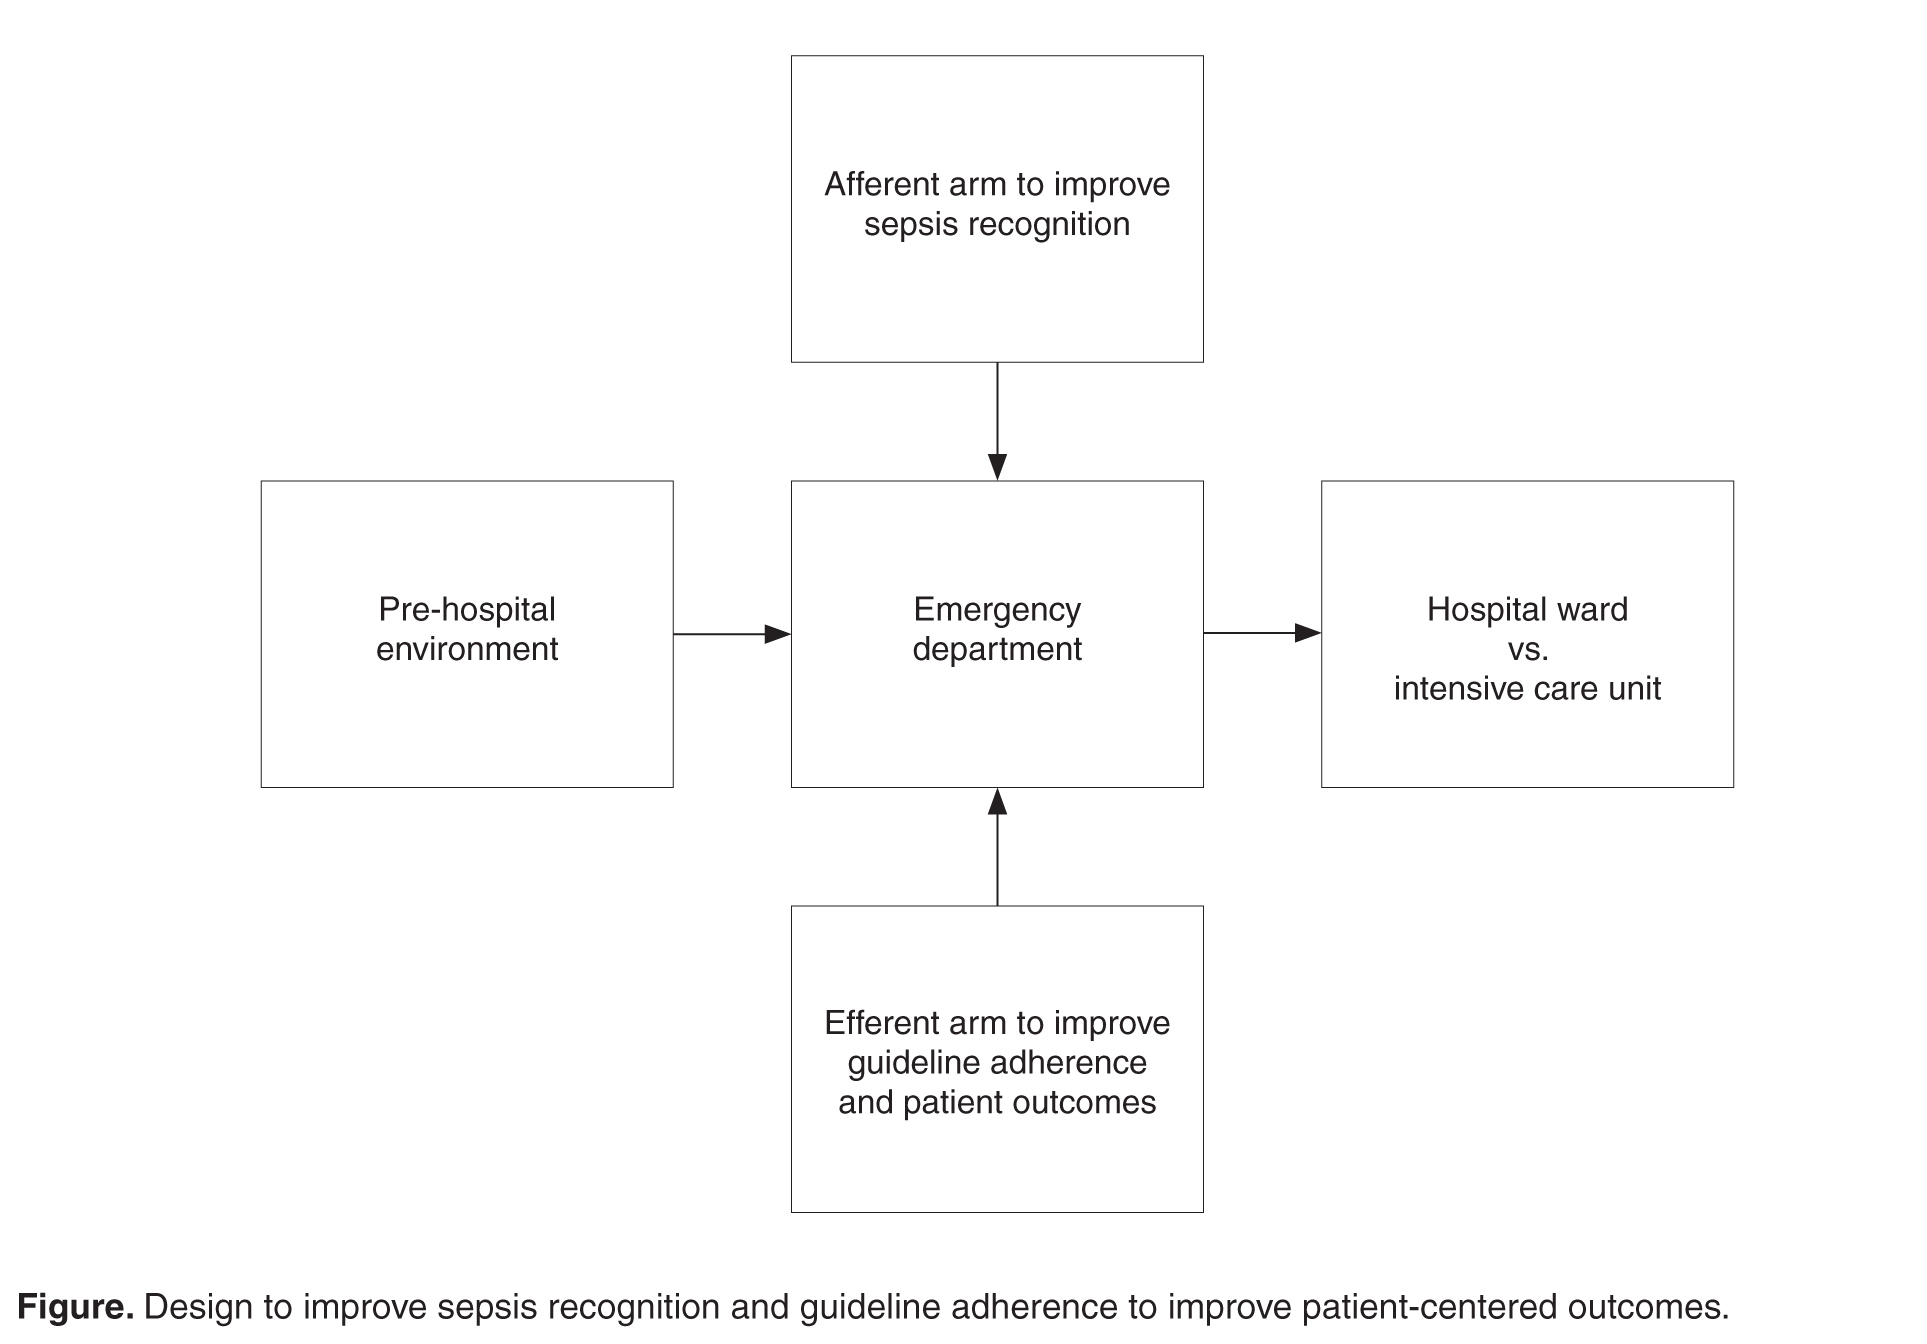
The Afferent Arm: Multimodal Screening Strategies
While institutional practice improvement initiatives to facilitate sepsis recognition and care should incorporate educational strategies, led by champions with expertise in sepsis, the complex presentation of sepsis requires multimodal approaches [29]. These multimodal approaches, beginning at the time of ED triage, should be designed to harness information technology to screen patients to improve severe sepsis recognition (the afferent arm) and to utilize structures and processes of care efficiently and effectively (the efferent arm) to guide severe sepsis management according to sepsis-care bundles espoused by guidelines (Figure) [4].
Operational processes to screen for sepsis in the ED will need to account for ED organizational flow (eg, average time from registration to triage, average time from triage to being seen by a physician, average length of stay in the ED, number of hospital beds) and hand-off practices (eg, care transition from ED team to floor or ICU team, or within ED at shift change). For ED organizations with shorter ED lengths of stay (eg, < 2 hours), screening practices at ED triage will serve as the focal point to identify cases of sepsis. Boarding, defined as caring for a patient in the ED pending transfer, is common, increasing as a result of ED closures [30,31], and associated with prolonged hospital length of stay and increased in-hospital mortality when ICU transfer is delayed [32]. Sepsis patients in particular appear to be a vulnerable group of patients. While many explanations exist to account for the relationship between delayed transfer and adverse outcomes, timely recognition and management of the septic patient could be compromised with prolonged boarding. To combat this potential effect, continual assessment during the entire ED stay may unmask an initially unclear presentation of sepsis.
One strategy to identify sepsis in ED organizations with prolonged ED lengths of stay is through the use of a track-and-trigger system, or early warning system. Traditionally, track-and-trigger systems were implemented on the hospital wards, as means to identify physiological deterioration in a timely manner to prevent clinical deterioration [33]. More recently, early warning systems have been used to identify patients with sepsis on the hospital wards and within EDs, as these systems rely on physiological parameters such as SIRS that are cardinal features of sepsis [34]. However, given the potential for alert fatigue, designing a system that operates with high accuracy is imperative.
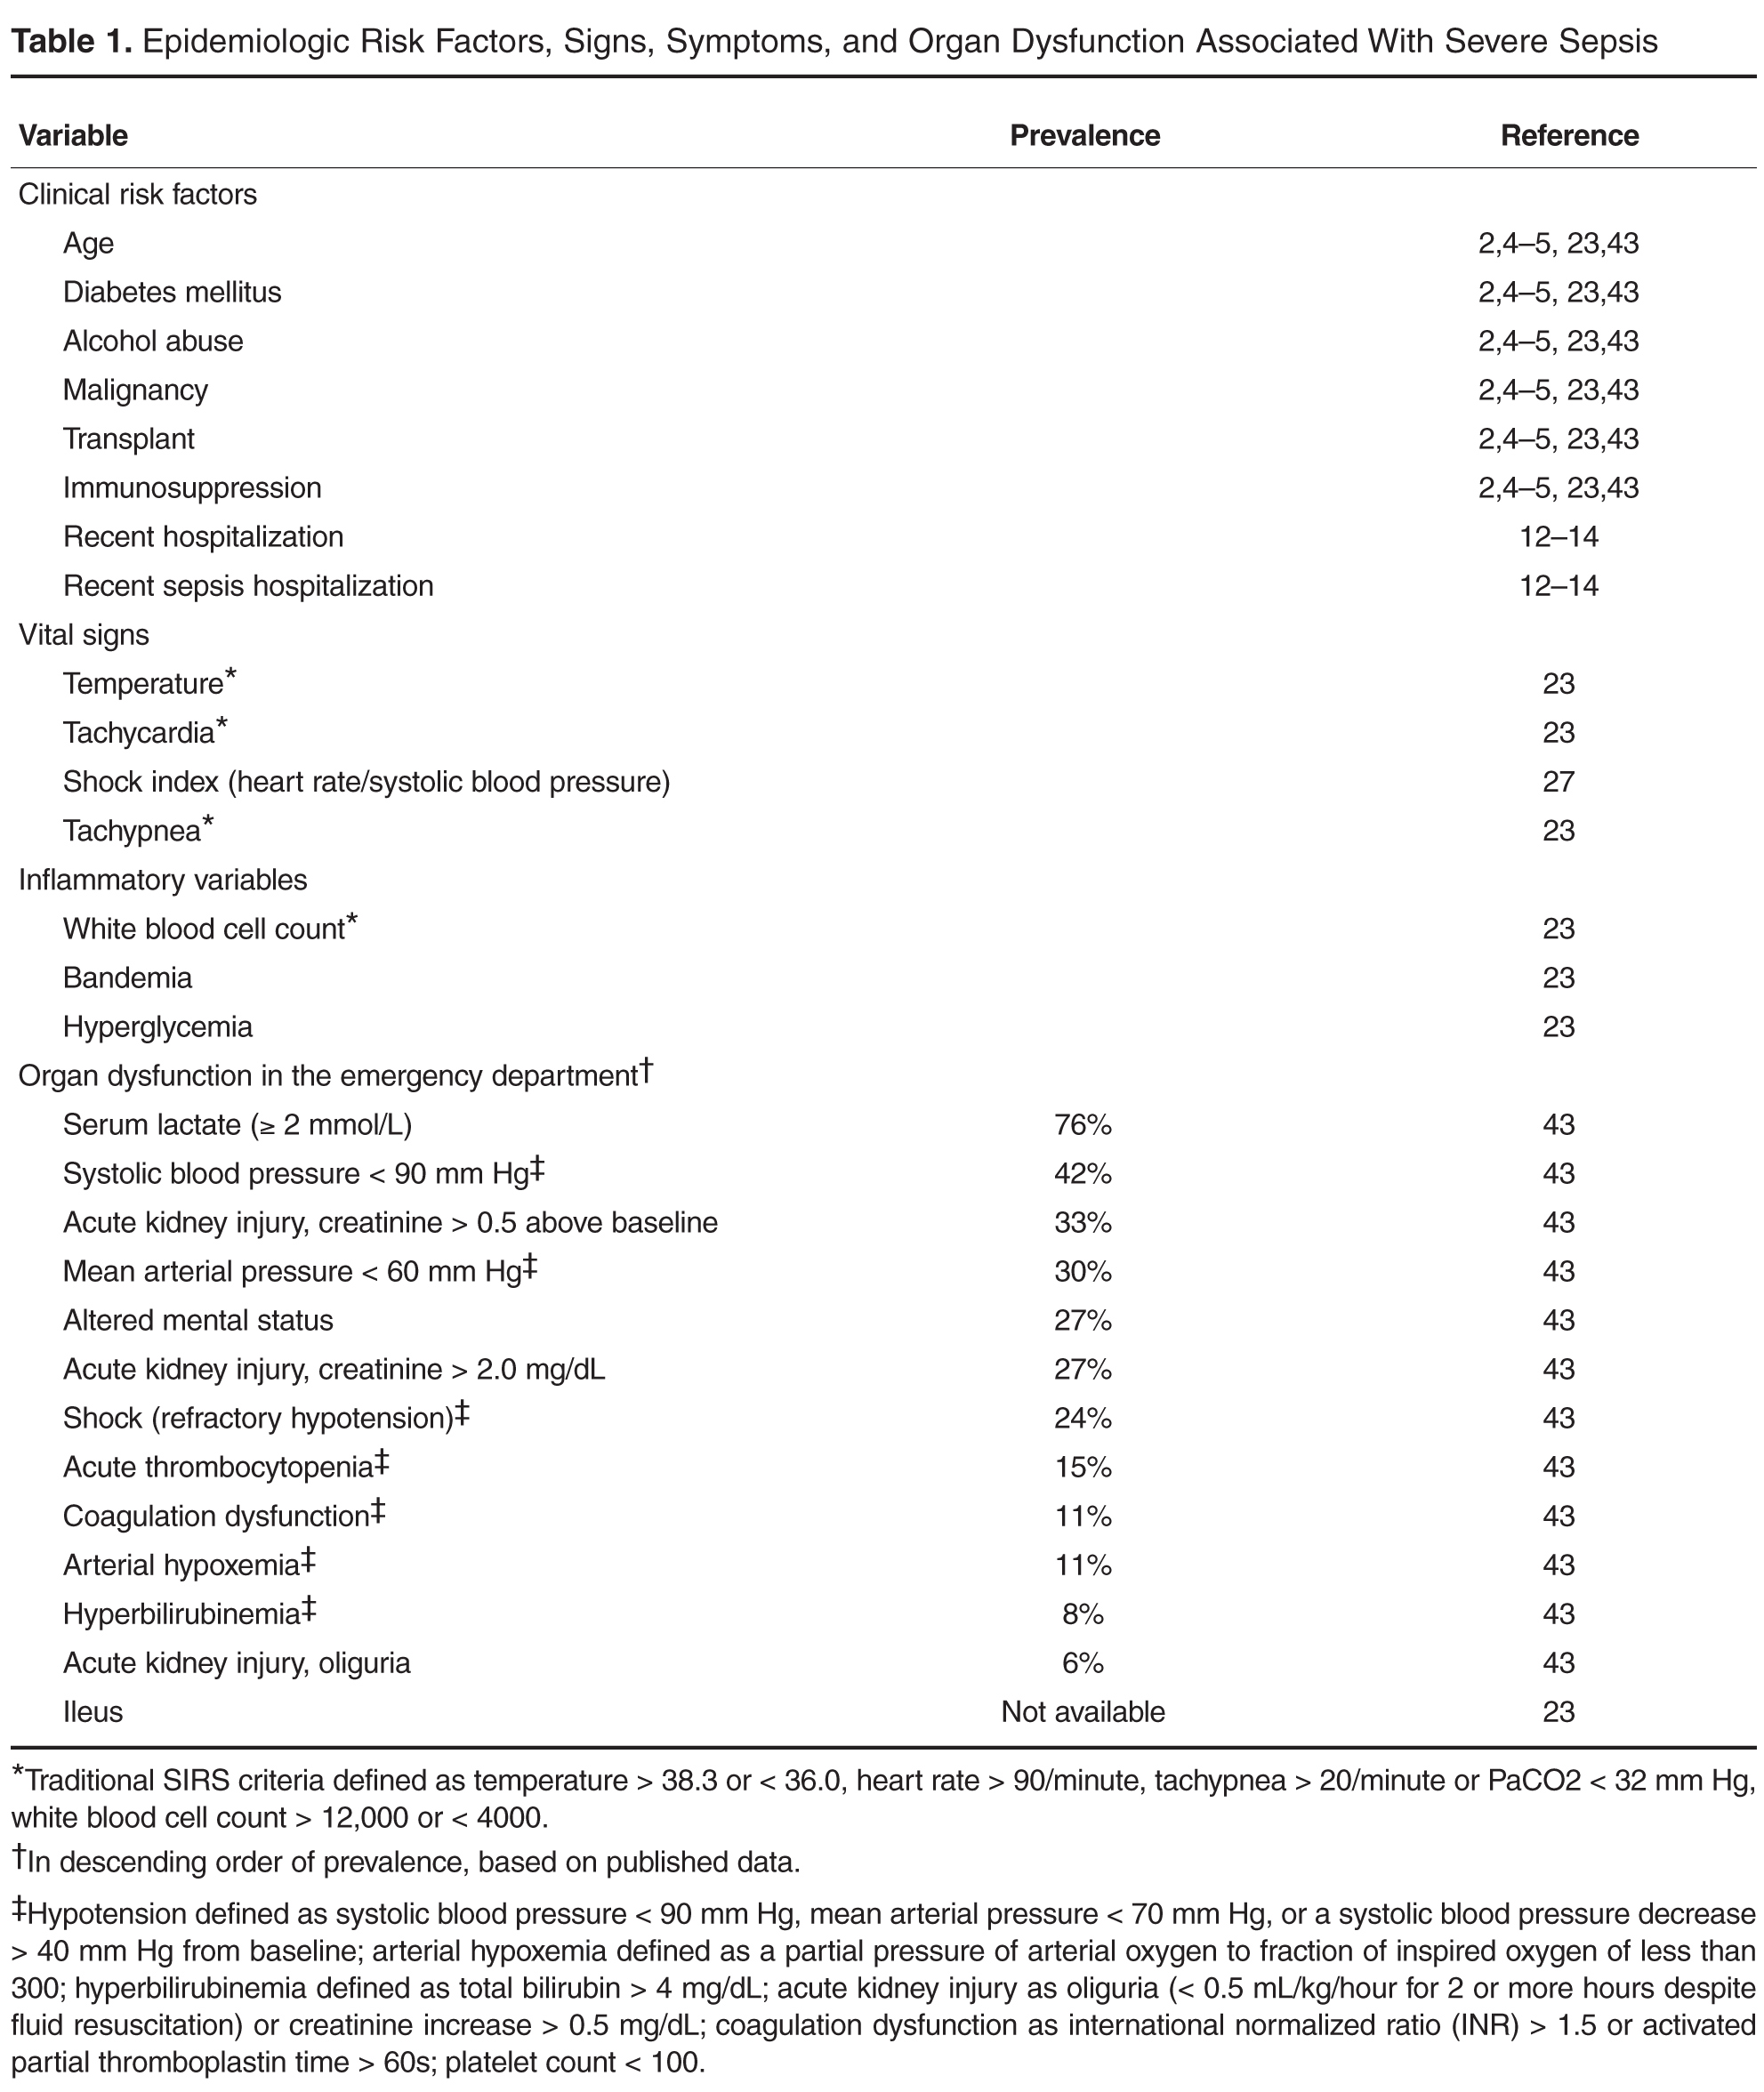
Efforts are underway to redefine sepsis, using a simplified approach and readily available physiological variables, with the main goal of targeting those most at-risk of an adverse outcome during the hospitalization. Simultaneously, an understanding of the overt and more occult manifestations are essential to incorporate into the clinical decision-making and pattern recognition required to identify sepsis in a timely and accurate manner. In Table 2, the signs and symptoms that may serve as flags for severe sepsis are presented.
Mature early warning systems, designed to leverage the electronic medical record (EMR) by capturing vital signs, laboratory measures, (eg, elevated serum creatinine compared to a recent hospitalization) and symptoms (eg, altered mental status), are well-positioned to herald clinical deterioration (eg, cardiac arrest) with improved accuracy [35] and to be applied to sepsis specifically [34]. While sophisticated analytical strategies, such as machine learning, are being used to improve the test characteristics of these early warning systems, iterative, prospective chart review is an essential and complementary performance improvement step to refine the process. Further, chart review affords the opportunity to ensure compliance with sepsis care bundles.
Knowledge of the risk factors associated with development of sepsis is critical for the front-line emergency physician and nurse. Additionally, as many of these risk factors are associated with adverse outcomes, including unplanned ICU transfer and in-hospital mortality, which occur in as many as one out of 8 patients admitted directly to the ward, they have utility for early risk-stratification and triaging purposes in the ED. Advanced age and pre-existing comorbid conditions, particularly an oncologic diagnosis and/or chronic organ dysfunction, are major risk factors for sepsis and worse outcomes result in those who develop sepsis [2]. Further, illness severity, including an elevated serum lactate level, is associated with adverse outcomes. These factors can be incorporated into triage decisions and/or close monitoring for patients admitted to the general ward [36]. Conversely, because patients admitted to the ICU setting and subsequently stepped down through their hospitalization may experience better outcomes compared to patients admitted to the general ward who then require step-up to an ICU setting (37,38), attention to triage practices is critical.
These complementary strategies, which serve as the afferent arm of the system, summon health care providers to the bedside of a vulnerable patient. However, clinical effectiveness in the management of severe sepsis requires a robust, sophisticated, and mature efferent arm capable of delivering expert care to the now recognized septic patient.
Principles of Effective Management Post-Recognition
Risk Stratification
An elevated serum lactate level was initially described in pathological states in the mid 19th century by Johann Joseph Scherer [39] and has long been associated with increased mortality in hospitalized patients [40]. Lactate is a useful biomarker for risk stratification in a variety of patients arriving to the ED, particularly those who have been identified at high risk for sepsis. Jansen and colleagues examined the measurement of pre-hospital serum lactate at the time of paramedic on-scene assessment in a group of acutely ill patients [41]. Patients with point-of-care lactate levels of 3.5 mmol/L or greater were found to have an in-hospital mortality of 41% versus 12% for those with lactate levels less than 3.5 mmol/L. Within the population with an elevated lactate, patients with a systolic blood pressure greater than 100 mgHg experienced a mortality of nearly 30%, while it was greater than 50% in hypotensive patients with an elevated lactate, highlighting the value of both hemodynamic and serum lactate measures. Upon arrival to the ED, lactate measurements have a strong correlation with mortality. In one retrospective cohort, lactate level was linearly associated with mortality in a broad array of patients older than age 65 years [42]. An initial serum lactate level in the ED in the intermediate (2.0 – 3.9 mmol/L) or high range (≥ 4 mmol/L) has been associated with increased odds of death 2 to 5 times higher independent of organ dysfunction in severe sepsis specifically [43].
As the association between serum lactate levels and death is independent of organ dysfunction, serum lactate is a simple and reliable tool to both enhance detection and risk-stratify patients presenting to the ED with severe sepsis. Given the frequency with which hyperlactatemia is present in patients with suspected infection [43], operationalizing serum lactate measures with the initial phlebotomy draw is an important step to risk-stratify patients. This step can be coupled later with intravenous fluid resuscitation for those with marked elevations (≥ 4 mmol/L), in accord with guideline recommendations [4]. Screening of initial lactate values can be further expedited by utilizing fingerstick point-of-care lactate devices [44]. Last, while serial lactate measures can be incorporated into triage decisions, there is no clear threshold that warrants ICU admission. Rather, persistent elevations in serum lactate can be used to identify patients who require close observation regardless of their admission location.
Several scoring systems have been developed to augment sepsis risk stratification within the ED. The most prominent of these are the Predisposition Insult Response and Organ failure (PIRO), Sequential Organ Failure Assessment (SOFA), and Mortality in the Emergency Department Sepsis (MEDS) scores, and the National early warning score (NEWS) [45-48]. The MEDS score incorporates host factors including age and co-morbid illness, as well as physiologic and laboratory tests which can be obtained rapidly in an ED setting. Multiple prospective and retrospective examinations of the MEDS scoring systems have demonstrated that it performs optimally in ED patients with sepsis but not those with severe sepsis, in terms of predicting 30-day mortality [46,47]. The PIRO score more extensively incorporates predisposing co-morbidities, physiologic and laboratory parameters, and has been modified to consider presumed source of infection, leading to a stronger predictive ability for mortality in more severely ill patients. In patients presenting to the ED with severe sepsis and septic shock, a prospective observational study found the PIRO to be the best predictor of mortality, compared to SOFA and MEDS scores [45]. In a recent study by Corfield et al, sepsis patients with a higher NEWS, according to initial ED vital signs (temperature, pulse, respiratory rate, systolic blood pressure, oxyhemoglobin saturation) and consciousness level, were significantly more likely to be admitted to an ICU within 48 hours or to experience in-hospital mortality [48].
Timely and Appropriate Antibiotics
In a landmark study published by Kumar and colleagues in 2006, the relationship between timing of antibiotics and mortality was established [49]. In 2731 adult septic shock patients, mortality increased 7.6% for every hour delay in effective antimicrobial administration. A striking finding, given that the study population was limited to patients cared for in the ICU, was the fact that only 50% of patients received appropriate antibiotics within 6 hours of onset of shock and nearly one-quarter of patients did not receive antibiotics until the 15th hour. As a direct result, in-hospital mortality was observed to be 58% in this study.
Over the ensuing decade, a series of studies have demonstrated a narrowing of the quality gap in this regard, and the result has coincided with a significant improvement in survival. In 2010, Gaieski and colleagues demonstrated a significant improvement in the prompt administration of antibiotic delivery in patients presenting to an ED with severe sepsis, with the median time from shock onset (sustained hypotension or lactate ≥ 4 mmol/L) to antibiotics down to 42 minutes [50]. Importantly, consistent with the Kumar study, time to appropriate antibiotics, rather than simply initial antibiotics, remained associated with in-hospital mortality independent of initiating early goal-directed therapy. In 2011, Puskarich and colleagues revealed that time to antibiotics continued to improve and, as a result, the investigators did not identify a relationship between time from triage to antibiotics and in-hospital mortality [51]. However, when antibiotics were delayed until after shock recognition, consistent with the study by Kumar and colleagues, survival decreased. Until recently, this important observation was challenging to operationalize clinically as little was known about how to facilitate risk-stratification of those at risk to develop shock. However, Capp and colleagues recently found that deterioration to septic shock 48 hours after ED presentation occurs in approximately one out of eight patients and identified gender (female), transient hypotension, and/or hyperlactatemia upon presentation as risk factors associated with such a deterioration [52].
As an essential element of sepsis care bundles, a focus on timely use of antibiotics in patients with suspected infection, has the potential to increase the use of antibiotics in the ED in patients determined subsequently to not be infected. To combat this acknowledged downstream effect, reconsideration of the utility of empiric antibiotics 48 to 72 hours after admission is required. This step can be accomplished through the use of a sepsis care pathway and/or a formal antibiotic stewardship program.
Quantitative Resuscitation
Rivers and colleagues, in a landmark 2001 trial, examined the effectiveness of a protocolized resuscitation strategy in the most proximal phase of severe sepsis and septic shock [53]. A distinguishing characteristic between the usual care arm and the intervention in this ED-based study, in addition to whether mixed central venous oxygen saturation was measured as a resuscitation end-point, was the inclusion of an ED provider at the bedside to attend to clinical management. The intervention, aimed at achieving physiologic targets, resulted in significantly more fluid resuscitation (3.5 L vs. 5.0 L within the first 6 hours) and a significant decrease in in-hospital mortality compared to the usual care arm (46.5 vs. 30.5%). The study revolutionized the culture and practice of sepsis care, in part by shining a light on the importance of timely resuscitation at the most proximal point of contact between the patient and the healthcare system. It also highlighted the importance of integrating serum lactate measurement into the early screening and risk stratification processes for sepsis care delivery.
The 2014 randomized trial of Protocol-Based Care for Early Septic Shock (ProCESS) revisited this concept, comparing the Rivers 2001 protocol to both a current guideline-based non-invasive algorithmic protocol and what had become usual ED care in the interim [54]. The ProCESS trial, which operationalized a team of bedside providers to direct care for each of the 3 distinct arms, found no significant difference between the arms in terms of 90-day and 1-year mortality, but mortality was approximately 10% less in all arms compared with the intervention arm of the Rivers trial. Further, subjects in each of the 3 arms received in excess of 2 L intravenous fluid resuscitation pre-randomization and 4.4–5.5 L when resuscitation spanned from pre-randomization to 6 hours post-randomization. The conclusion drawn is that the commonalities between the arms—early fluid resuscitation, early antibiotics, and the option to use physiologic measures as markers of the adequacy of treatment, all guided by bedside ED providers—are the most important factors for surviving sepsis. And the result is that practitioners have refined these tools over a decade, leading to steady improvements in survival.
Consistent with the ProCESS trial, a recent Australia and New Zealand trial confirmed no significant difference in 90-day mortality between protocolized EGDT and current usual care for septic shock within an ED [55]. Consistent with ProCESS and ProMISe [56], subjects enrolled in ARISE received in excess of 2.5 L in resuscitation pre-randomization, which when paired with fluid resuscitation in the 0-6 hour post-randomization period (1.96 L in the EGDT arm and 1.71 in the usual-care arm) resulted in resuscitation in the 4.5 to 5L range during the initial resuscitation. The ARISE trial was unique in that appropriate antibiotic administration was a requirement prior to randomization, ensuring that this important driver of mortality reduction was standardized between the two arms of the trial. In summary, while the ideal fluid resuscitation amount is unknown, requires a personalized approach, and further investigation is required to effectively incorporate non-invasive measures to guide fluid responsiveness, early and aggressive resuscitation paired with early antibiotic administration are essential aspects of effective sepsis management.
The Efferent Arm: Structure And Processes To Improve Outcomes
Personnel and Staffing
Quality care for the septic patient requires immediate availability of a multidisciplinary care team, including physicians and nurses with critical care experience who can be rapidly deployed to the bedside. The location of care provision may include on-going care in the initial ED room assignment or transfer to a dedicated area for the care of the critically ill patient within the ED.
To provide optimal care in the era of overcrowding and delayed transfer to an ICU, a movement towards ED intensive care units (ED-ICUs) has emerged [57]. The models of practice range from a model based upon ED intensivists, with expertise in critical care medicine, providing care within the traditional structure of an ED, to a model wherein a portion of the ED is assigned for the care of the critically ill for extended periods of time beyond the initial resuscitation. As these models mature from resuscitation bays capable of scaling up based on need to dedicated ED-ICUs, investments in shared Unit leadership (physician and nursing), staffing (physician, critical care nursing, respiratory therapy, critical care pharmacist) and processes of care (eg, multidisciplinary rounds) in line with established ICUs will be necessary.
While attractive conceptually, large-scale implementation of this movement is unlikely to occur outside of tertiary care academic medical centers. In the many EDs across the US without ED intensivists, and confronted with limited clinician resources, flexible physician and nursing staffing models will be necessary to ensure that care provisions are in accord with established guidelines. Potential solutions to provide the resources to meet the needs of these high-intensity patients include critical care consultation and a strategy traditionally applied to the ICU, telemedicine [58]. Last, given the relationship between hospital volume and mortality in severe sepsis [59,60], timely transfer to a high-volume center for specific cases may be appropriate, although the optimal timing, case selection, and impact of transfer on outcomes warrant further examination.
Clinical Decision Support Strategies
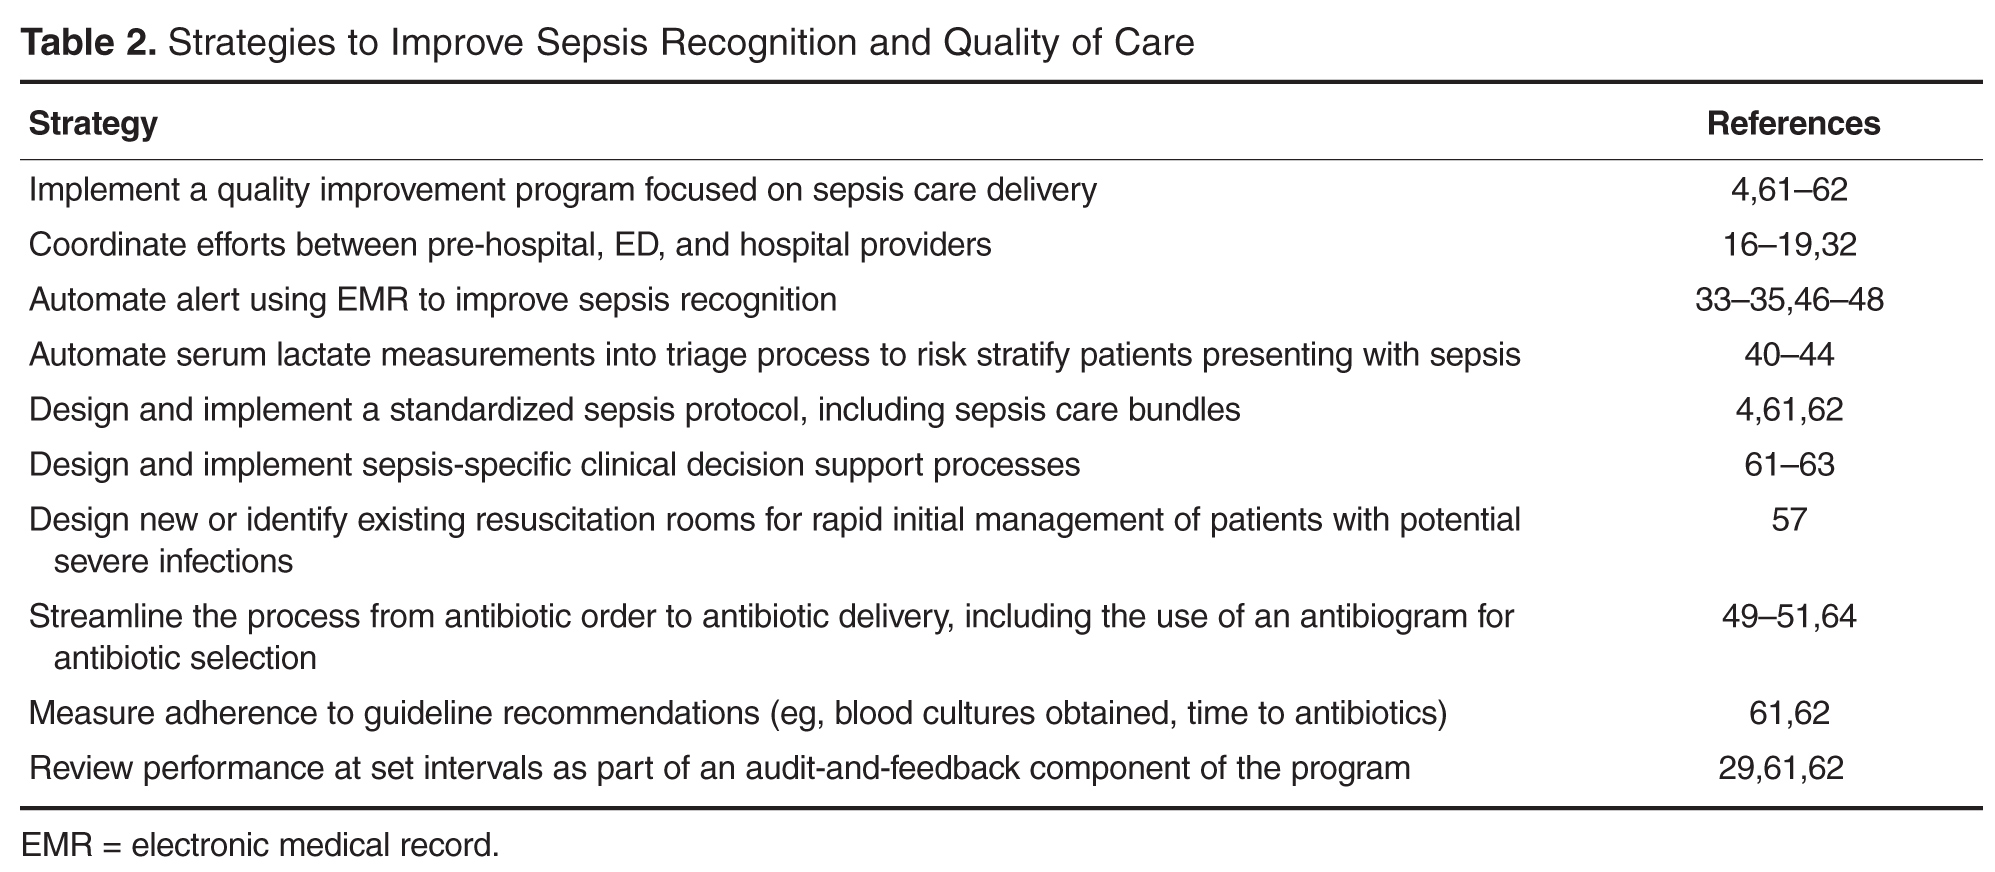
To complement the identification and risk-stratification available by screening and scoring systems, clinical decision support systems are novel tools to improve outcomes in the era of electronic medical records (EMR). Specific to sepsis care delivery, performance improvement initiatives including audit-and-feedback practice can increase severe sepsis guideline adherence, and even modest improvements in adherence appear to lead to sustained improvements that contributed to a 25% relative risk reduction in the observed mortality rate [61,62]. Clinical decision support tools can be used to link early recognition to optimal care processes, such as the Surviving Sepsis Campaign resuscitation and management bundles. The use of prompts as strategies to ensure that bundles of care are ordered and carried out is an important aspect to operationalize during the design phase [63].
Significant preparation is required to effectively carry out the clinical decision support design strategy. For example, to ensure timely antibiotic dispensing, a number of process steps will be required, including prompt notification to a central pharmacist or preferably, an ED pharmacist with access to a local pharmacy pre-stocked with commonly used antibiotics [64]. In addition, the use of an institution-specific antibiogram within the physician computer-order entry sepsis order set, that includes site-specific recommendations (eg, pulmonary, gastrointestinal source) and susceptibility patterns, is an essential aspect of optimal sepsis processes of care. Last, the antibiogram will need to be frequently updated to include season-specific (eg, oseltamivir administration for high-risk cases during influenza season) recommendations to ensure that providers are prompted with the most up-to-date clinical information.
Audit and Feedback and Continuous Performance Improvement
The multimodal approach required to translate knowledge (eg, guidelines) into sepsis care implemented at the bedside is an iterative process. An ED armed with a robust track-and-trigger system and an effective efferent arm, including sophisticated clinical decision support strategies, will require frequent auditing in the plan-do-study-act model of quality improvement to yield clinical effectiveness [61,62,65]. Auditing, paired with feedback to frontline providers, is essential to refine and improve the complex process required to provide expert care to the septic patient [29,65]. Sustained success in optimizing sepsis care delivery is the goal, yet significant work is required to determine the best strategies to achieve this endpoint.
Conclusion
Severe sepsis affects millions of individuals each year in the United States. Delays in recognition result in increased morbidity and mortality, at a tremendous cost to the patient and society. By designing strategies to identify sepsis in a timely, efficient, and effective manner, and by implementing ED structures and processes to increase adherence with sepsis-based guidelines, improved patient-centered outcomes can be realized.
Corresponding author: Mark E. Mikkelsen, MD, MSCE, Gates 05.042, 3400 Spruce St., Philadelphia, PA 19104, [email protected].
Financial disclosures: None.
Author contributions: conception and design, JHM, MEM; analysis and interpretation of data, DFG; drafting of article, JHM, DFG, MEM; critical revision of the article, JHM, MEM.
1. Gaieski DF, Edwards JM, Kallan MJ, Carr BG. Benchmarking the incidence and mortality of severe sepsis in the United States. Crit Care Med 2013;41:1167–74.
2. Angus DC, Linde-Zwirble WT, Lidicker J, et al. Epidemiology of severe sepsis in the United States: analysis of incidence, outcome, and associated costs of care. Crit Care Med 2001;29:1303–10.
3. Lagu T, Rothberg MB, Shieh MS, et al. Hospitalizations, costs, and outcomes of severe sepsis in the United States 2003 to 2007. Crit Care Med 2012;40:754–61.
4. Dellinger RP, Levy MM, Rhodes A, et al. Surviving Sepsis Campaign: international guidelines for management of severe sepsis and septic shock, 2012. Intensive Care Med 2013;39:165–228.
5. Angus DC, van der Poll T. Severe sepsis and septic shock. N Engl J Med 2013;369:840–51.
6. Wang HE, Shapiro NI, Angus DC, Yealy DM. National estimates of severe sepsis in United States emergency departments. Crit Care Med 2007;35:1928–36.
7. Dombrovskiy VY, Martin AA, Sunderram J, et al. Rapid increase in hospitalization and mortality rates for severe sepsis in the United States: a trend analysis from 1993 to 2003. Crit Care Med 2007;35:1244–50.
8. Liu V, Escobar GJ, Greene JD, et al. Hospital deaths in patients with sepsis from 2 independent cohorts. JAMA 2014;312:90–2.
9. Kaukonen KM, Bailey M, Suzuki S, et al. Mortality related to severe sepsis and septic shock among critically ill patients in Australia and New Zealand, 2000-2012. JAMA 2014;311:1308–16.
10. Yende S, Angus DC. Long-term outcomes from sepsis. Curr Infect Dis Rep 2007;9:382–6.
11. Iwashyna TJ, Ely EW, Smith DM, et al. Long-term cognitive impairment and functional disability among survivors of severe sepsis. JAMA 2010; 304:1787–94.
12. Ortego A, Gaieski DF, Fuchs BD, et al. Hospital-based acute care use in survivors of septic shock. Crit Care Med 2015;43:729–37.
13. Prescott HC, Langa KM, Liu V, et al. Increased 1-year healthcare use in survivors of severe sepsis. Am J Respir Crit Care Med 2014;190:62–9.
14. Liu V, Lei X, Prescott HC, et al. Hospital readmission and healthcare utilization following sepsis in community settings. J Hosp Med 2014;9:502–7.
15. Jones AE, Brown MD, Trzeciak S, et al. The effect of a quantitative resuscitation strategy on mortality in patients with sepsis: a meta-analysis. Crit Care Med 2008;36:2734–9.
16. Seymour CW, Rea TD, Kahn JM, et al. Severe sepsis in pre-hospital emergency care: analysis of incidence, care, and outcome. Am J Respir Crit Care Med 2012;186:1264–71.
17. Seymour CW, Cooke CR, Mikkelsen ME, et al. Out-of-hospital fluid in severe sepsis: effect on early resuscitation in the emergency department. Prehosp Emerg Care 2010;14:145–52.
18. Seymour CW, Cooke CR, Heckbert SR, et al. Prehospital intravenous access and fluid resuscitation in severe sepsis: an observational cohort study. Crit Care 2014;18:533
19. Studnek JR, Artho MR, Garner CL, Jones AE. The impact of emergency medical services on the ED care of severe sepsis. Am J Emerg Med 2012;30:51–6.
20. Guss DA, Meyer FT, Neuman TS, et al. The impact of a regionalized trauma system on trauma care in San Diego County. Ann Emerg Med 1989;18:1141–5.
21. Liberman M, Mulder DS, Jurkovich GJ, Sampalis JS. The association between trauma system and trauma center components and outcome in a mature regionalized trauma system. Surgery 2005;137:647–58.
22. Hachinski V, Donnan GA, Gorelick PB, et al. Stroke: working toward a prioritized world agenda. Stroke 2010;41:1084–99.
23. Levy MM, Fink MP, Marshall JC, et al. 2001 SCCM/ESICM/ACCP/ATS/SIS International Sepsis Definitions Conference. Crit Care Med 2003;31:1250–6.
24. Sibbald W, Doig G, Inman K. Sepsis, SIRS, and infection. Intensive Care Med 1995;21:299–301.
25. Kaukonen KM, Bailey M, Pilcher D, et al. Systemic inflammatory response syndrome criteria in defining severe sepsis. N Engl J Med 2015; online March 17, 2015.
26. Shapiro NI, Howell MD, Bates D, et al. The association of sepsis syndrome and organ dysfunction with mortality in emergency department patients with suspected infection. Ann Emerg Med 2006;48:583–90.
27. Berger T, Green J, Horeczko T, et al. Shock index and early recognition of sepsis in the emergency department: pilot study. West J Emerg Med 2013;14:168–74.
28. Farley H, Zubrow MT, Gies J, et al. Emergency department tachypnea predicts transfer to a higher level of care in the first 24 hours after ED admission. Acad Emerg Med 2010;17:718–22.
29. Sinuff T, Muscadere J, Adhikari NK, et al. Knowledge translation interventions for critically ill patients: a systematic review. Crit Care Med 2013;41:2627–40.
30. Hoot NR, Aronsky D. Systematic review of emergency department crowding: causes, effects, and solutions. Ann Emerg Med 2008;52:126–36.
31. Hsia RY, Kellermann AL, Shen YC. Factors associated with closures of emergency departments in the United States. JAMA 2011;305:1978–85.
32. Chalfin DB, Trzeciak S, Likourezos A, et al. Impact of delayed transfer of critically ill patients from the emergency department to the intensive care unit. Crit Care Med 2007;35:1477–83.
33. Subbe CP, Kruger M, Rutherford P, et al. Validation of a modified early warning score in medical admissions. Q J Med 2001;94:521–6.
34. Umscheid CA, Betesh J, VanZandbergen C, et al. Development, implementation, and impact of an automated early warning and response system for sepsis. J Hosp Med 2015;10:26–31.
35. Churpek MM, Yuen TC, Winslow C, et al. Multicenter development and validation of a risk stratification tool for ward patients. Am J Respir Crit Care Med 2014;190:649–55.
36. Whittaker SA, Fuchs BD, Gaieski DF, et al. Epidemiology and outcomes in patients with severe sepsis admitted to the hospital wards. J Crit Care 2015;30:78–84.
37. Delgado MK, Liu V, Pines JM, et al. Risk factors for unplanned transfer to intensive care within 24 hours of admission from the emergency department in an integrated healthcare system. J Hosp Med 2013;8:13–9.
38. Valentini I, Pacilli AM, Carbonara P, et al. Influence of the admission pattern on the outcome of patients admitted to a respiratory intensive care unit: does a step-down admission differ from a step-up one? Respir Care 2013;58:2053–60.
39. Kompanje EJO, Jansen TC, van der Hoven B, Bakker J. The first demonstration of lactic acid in human blood in shock by Johann Joseph Scherer (1814-1869) in January 1843. Intensive Care Med 2007;33:1967–71.
40. Kraut JA, Madias NE. Lactic acidosis. N Engl J Med 2014;371:2309–19.
41. Jansen TC, van Bommel J, Mulder PG, et al. The prognostic value of blood lactate levels relative to that of vital signs in the pre-hospital setting: a pilot study. Crit Care 2008;12:R160.
42. del Portal DA, Shofer F, Mikkelsen ME, et al. Emergency department lactate is associated with mortality in older adults admitted with and without infections. Acad Emerg Med 2010;17:260–8.
43. Mikkelsen ME, Miltiades AN, Gaieski DF, et al. Serum lactate is associated with mortality in severe sepsis independent of organ failure and shock. Crit Care Med 2009;37:1670–7.
44. Gaieski DF, Drumheller BC, Goyal M, et al. Accuracy of handheld point-of-care fingertip lactate measurement in the emergency department. West J Emerg Med 2013;14:58–62.
45. Macdonald SP, Arendts G, Fatovich DM, Brown SG. Comparison of PIRO, SOFA, and MEDS scores for predicting mortality in emergency department patients with severe sepsis and septic shock. Acad Emerg Med 2014;21:1257–63.
46. Carpenter CR, Keim SM, Upadhye S, Nguyen HB, Group BEiEMI. Risk stratification of the potentially septic patient in the emergency department: the Mortality in the Emergency Department Sepsis (MEDS) score. J Emerg Med 2009;37:319–27.
47. Sankoff JD, Goyal M, Gaieski DF, et al. Validation of the Mortality in Emergency Department Sepsis (MEDS) score in patients with the systemic inflammatory response syndrome (SIRS). Crit Care Med 2008;36:421–6.
48. Corfield AR, Lees F, Zealley I, et al. Utility of a single early warning score in patients with sepsis in the emergency department. Emerg Med J 2014;31:482–7.
49. Kumar A, Roberts D, Wood KE, et al. Duration of hypotension before initiation of effective antimicrobial therapy is the critical determinant of survival in human septic shock. Crit Care Med 2006;34:1589–96.
50. Gaieski DF, Mikkelsen ME, Band RA, et al. Impact of time to antibiotics on survival in patients with severe sepsis or septic shock in whom early goal-directed therapy was initiated in the emergency department. Crit Care Med 2010;38:1045–53.
51. Puskarich MA, Trzeciak S, Shapiro NI, et al. Association between timing of antibiotic administration and mortality from septic shock in patients treated with a quantitative resuscitation protocol. Crit Care Med 2011;39:2066–71.
52. Capp R, Horton CL, Takhar SS, et al. Predictors of patients who present to the emergency department with sepsis and progress to septic shock between 4 and 48 hours of emergency department arrival. Crit Care Med 2015 Jan 30.
53. Rivers E, Nguyen B, Havstad S, et al. Early goal-directed therapy in the treatment of severe sepsis and septic shock. N Engl J Med. 2001;345:1368–77.
54. The ProCESS Investigators. A ranodmized trial of protocol-based care for early septic shock. N Engl J Med 2014;370:1683–93.
55. The ARISE Investigators and the ANZICS Clinical Trials Group. Goal-directed resuscitation for patients with early septic shock. N Engl J Med 2014;371:1496–506.
56. Mouncey PR, Osborn TM, Power GS, et al. Trial of early, goal-directed resuscitation for septic shock. N Engl J Med 2015; online March 17, 2015.
57. Weingart SD, Sherwin RL, Emlet LL, et al. ED intensivists and ED intensive care units. Amer J Emerg Med 2013;31:617–20.
58. Lilly CM, Cody S, Zhao H, et al. Hospital mortality, length of stay, and preventable complications among critically ill patients before and after tele-ICU reengineering of critical care processes. JAMA 2011;305:2175–85.
59. Walkey AJ, Wiener RS. Hospital case volume and outcomes among patients hospitalized with severe sepsis. Am J Respir Crit Care Med 2014;189:548–55.
60. Gaieski DF, Edwards JM, Kallan MJ, et al. The relationship between hospital volume and mortality in severe sepsis. Am J Respir Crit Care Med 2014;190:665–74.
61. Levy MM, Dellinger RP, Townsend SR, et al. The surviving sepsis campaign: results of an international guideline-based performance improvement program targeting severe sepsis. Intensive Care Med 2010;36:222–31.
62. Levy MM, Rhodes A, Phillips GS, et al. Surviving sepsis campaign: association between performance metrics and outcomes in a 7.5-year study. Crit Care Med 2015;43:3–12.
63. Weiss CH, Moazed F, McEvoy CA, et al. Prompting physicians to address a daily checklist and process of care and clinical outcomes: a single-site study. Am J Respir Crit Care Med 2011;184:680–6.
64. Weant KA, Baker SN. Emergency medicine pharmacists and sepsis management. J Pharm Pract 2013;26:401–5.
65. Marwick CA, Guthrie B, Pringle JE, et al. A multifaceted intervention to improve sepsis management in general hospital wards with evaluation using segmented regression of interrupted time series. BMJ Qual Saf 2014;23:e2.
From the Department of Medicine, University of Pennsylvania, and the Department of Emergency Medicine, Thomas Jefferson University Hospital, Philadelphia, PA.
Abstract
- Objective: To detail strategies to improve sepsis recognition and the quality of care provided to the septic patient.
- Methods: Review of the literature.
- Results: Severe sepsis affects nearly 3 million individuals each year in the United States, and cost estimates for these hospitalizations exceed $24 billion. Effective management is predicated on timely recognition. In this review, we detail strategies to improve early identification of potentially septic patients as well as the quality of care provided to the septic patient in the emergency department (ED). The strategies discussed are based upon an understanding of the signs and symptoms of sepsis and the clinical risk factors associated with sepsis, which can be used to design novel strategies to screen patients for sepsis and risk stratify patients at risk for clinical deterioration.
- Conclusion: ED structures and processes can be used to increase adherence with sepsis management guidelines to improve patient outcomes.
Severe sepsis affects nearly 3 million individuals each year in the United States and cost estimates for these hospitalizations exceed $24 billion [1–3]. Sepsis is a life-threatening condition characterized by a suspected or identified infection accompanied by a vigorous host inflammatory response. In severe sepsis, end-organ dysfunction manifests in myriad forms, including altered mental status, acute kidney injury, liver dysfunction, pulmonary dysfunction, and hemodynamic compromise [4,5]. This protean presentation of a deadly condition makes identification and risk stratification both challenging and essential to improving patient outcomes. The majority of patients with severe sepsis will receive their initial care within an emergency department (ED) [6,7]. It is essential that emergency medicine providers have the means to appropriately identify patients presenting with severe sepsis in a timely manner—thus facilitating life-saving measures such as early intravenous fluid resuscitation and administration of timely and appropriate antimicrobials.
In this review, we detail strategies to improve sepsis recognition and the quality of care provided to the septic patient in the ED. The strategies discussed are based upon an understanding of the signs and symptoms of sepsis and the clinical risk factors associated with sepsis, which can be used to design novel strategies to screen patients for sepsis and risk stratify patients for clinical deterioration. Then, we review suggested ED structures and processes to increase adherence with sepsis-based guidelines to improve patient outcomes. Successful implementation is predicated on hospital administrative support towards the efforts given the time and resources required and strong and committed leadership across the health care system.
Epidemiology of Severe Sepsis
Estimates of annual cases of severe sepsis vary, ranging from 1 million to 3 million cases in the United States [1–3]. In-hospital mortality for this condition ranges from 14% to 30% [5]. The incidence of severe sepsis in the United States has been increasing at a rate of 13% annually, with an estimated cost of greater than $24 billion per year [1,2]. In 2 large cohorts of hospitalized patients, it was found that sepsis contributed to 1 in every 2 to 3 deaths following inpatient admission [8]. Coincident with these increased estimates, advances in the early identification and treatment of sepsis have led to decreasing mortality rates over the past decade [1,9].
Of importance to the ED clinician, an episode of sepsis has long-term effects on cognitive and physical function, quality-of-life, and survival [10,11]. Post-discharge, approximately one-quarter of sepsis survivors will be readmitted within 30 days [12–14]. In as many as half of these instances, another life-threatening infection is the cause for readmission, making the past medical history, including a detailed accounting of recent episodes of sepsis, an important part of the initial ED evaluation [12]. Furthermore, severe sepsis survivors spend a large proportion of their time following discharge within a health care facility, and will frequently present to the ED with an acute condition from such an environment. Important factors for predicting readmission after a sepsis hospitalization include patient age, severity of illness, hospital length of stay, and the need for intensive care during the initial hospitalization [12–14].
Principles of Effective Sepsis Management
The principles of effective sepsis management begin with early identification in the pre-hospital setting, at triage, or when a patient begins to decompensate in the hospital. After the point of initial recognition, core principles include risk stratification, timely and appropriate antimicrobial administration, initial intravenous fluid boluses and ongoing resuscitation guided by physical examination and objective resuscitation end-points [4,5]. These practices have been operationalized in the care bundles of the Surviving Sepsis Campaign Guidelines [4]. Within 3 hours, the resuscitation bundle includes measuring serum lactate to risk stratify patients, obtaining blood cultures, administering broad-spectrum antibiotics, and administering 30 mL/kg crystalloid in patients with hypotension or hyperlactatemia [4]. The 6-hour bundle expands upon these initial measures and includes additional management recommendations based on resuscitation end-points.
As effective management is predicated on timely recognition, an understanding of the impact of delayed recognition is essential to provide optimal care for the severe sepsis patient in the ED. Decades of research has revealed that certain markers predict adverse outcomes, including transition to septic shock and death, as do delayed processes of care. Importantly, while early quantitative resuscitation was demonstrated to improve outcomes in a meta-analysis, there was no demonstrable benefit when resuscitation was initiated late (> 24 hours) in the course in the ICU (odds ratio of death, 1.16 [95% confidence interval, 0.60–2.22]) [15].
Strategies To Improve Recognition
Pre-Hospital Environment
From EMS to ED Triage
Borrowing the principle “time equals tissue” from a variety of time sensitive conditions (eg, myocardial infarction management [“time equals muscle”] and stroke care [“time equals brain”]), clinicians and researchers have realized that expedited recognition of severe sepsis patients begins at the time of initial contact with the health care system. For severe sepsis patients, clinicians need to think “time equals organ function.” Given the frequency with which sepsis patients arrive to the ED via EMS, effective communication between EMS and ED providers could be leveraged to prepare the ED team to provide timely care for the sepsis patient via a “sepsis alert.” While confirmation of its applicability to sepsis care is required in the absence of a regionalized network of sepsis centers, the rationale is based on the experience of the effectiveness of trauma and stroke alert systems [20–22]. For patients not recognized as potentially being infected by EMS providers during transport, repeat vital signs during ED triage can be screened to identify patients exhibiting signs of the systemic inflammatory response syndrome (SIRS) [4,23]. The same principles of effective communication apply for patients being sent from medical clinics to the ED for evaluation and treatment of potential severe sepsis. For patients arriving independent of EMS, focused triage and initial vital signs are the starting point for identifying severe sepsis at the most proximal phase of entry into the health care system.
Vital Signs and SIRS Criteria in the ED
The Afferent Arm: Multimodal Screening Strategies
While institutional practice improvement initiatives to facilitate sepsis recognition and care should incorporate educational strategies, led by champions with expertise in sepsis, the complex presentation of sepsis requires multimodal approaches [29]. These multimodal approaches, beginning at the time of ED triage, should be designed to harness information technology to screen patients to improve severe sepsis recognition (the afferent arm) and to utilize structures and processes of care efficiently and effectively (the efferent arm) to guide severe sepsis management according to sepsis-care bundles espoused by guidelines (Figure) [4].
Operational processes to screen for sepsis in the ED will need to account for ED organizational flow (eg, average time from registration to triage, average time from triage to being seen by a physician, average length of stay in the ED, number of hospital beds) and hand-off practices (eg, care transition from ED team to floor or ICU team, or within ED at shift change). For ED organizations with shorter ED lengths of stay (eg, < 2 hours), screening practices at ED triage will serve as the focal point to identify cases of sepsis. Boarding, defined as caring for a patient in the ED pending transfer, is common, increasing as a result of ED closures [30,31], and associated with prolonged hospital length of stay and increased in-hospital mortality when ICU transfer is delayed [32]. Sepsis patients in particular appear to be a vulnerable group of patients. While many explanations exist to account for the relationship between delayed transfer and adverse outcomes, timely recognition and management of the septic patient could be compromised with prolonged boarding. To combat this potential effect, continual assessment during the entire ED stay may unmask an initially unclear presentation of sepsis.
One strategy to identify sepsis in ED organizations with prolonged ED lengths of stay is through the use of a track-and-trigger system, or early warning system. Traditionally, track-and-trigger systems were implemented on the hospital wards, as means to identify physiological deterioration in a timely manner to prevent clinical deterioration [33]. More recently, early warning systems have been used to identify patients with sepsis on the hospital wards and within EDs, as these systems rely on physiological parameters such as SIRS that are cardinal features of sepsis [34]. However, given the potential for alert fatigue, designing a system that operates with high accuracy is imperative.
Efforts are underway to redefine sepsis, using a simplified approach and readily available physiological variables, with the main goal of targeting those most at-risk of an adverse outcome during the hospitalization. Simultaneously, an understanding of the overt and more occult manifestations are essential to incorporate into the clinical decision-making and pattern recognition required to identify sepsis in a timely and accurate manner. In Table 2, the signs and symptoms that may serve as flags for severe sepsis are presented.
Mature early warning systems, designed to leverage the electronic medical record (EMR) by capturing vital signs, laboratory measures, (eg, elevated serum creatinine compared to a recent hospitalization) and symptoms (eg, altered mental status), are well-positioned to herald clinical deterioration (eg, cardiac arrest) with improved accuracy [35] and to be applied to sepsis specifically [34]. While sophisticated analytical strategies, such as machine learning, are being used to improve the test characteristics of these early warning systems, iterative, prospective chart review is an essential and complementary performance improvement step to refine the process. Further, chart review affords the opportunity to ensure compliance with sepsis care bundles.
Knowledge of the risk factors associated with development of sepsis is critical for the front-line emergency physician and nurse. Additionally, as many of these risk factors are associated with adverse outcomes, including unplanned ICU transfer and in-hospital mortality, which occur in as many as one out of 8 patients admitted directly to the ward, they have utility for early risk-stratification and triaging purposes in the ED. Advanced age and pre-existing comorbid conditions, particularly an oncologic diagnosis and/or chronic organ dysfunction, are major risk factors for sepsis and worse outcomes result in those who develop sepsis [2]. Further, illness severity, including an elevated serum lactate level, is associated with adverse outcomes. These factors can be incorporated into triage decisions and/or close monitoring for patients admitted to the general ward [36]. Conversely, because patients admitted to the ICU setting and subsequently stepped down through their hospitalization may experience better outcomes compared to patients admitted to the general ward who then require step-up to an ICU setting (37,38), attention to triage practices is critical.
These complementary strategies, which serve as the afferent arm of the system, summon health care providers to the bedside of a vulnerable patient. However, clinical effectiveness in the management of severe sepsis requires a robust, sophisticated, and mature efferent arm capable of delivering expert care to the now recognized septic patient.
Principles of Effective Management Post-Recognition
Risk Stratification
An elevated serum lactate level was initially described in pathological states in the mid 19th century by Johann Joseph Scherer [39] and has long been associated with increased mortality in hospitalized patients [40]. Lactate is a useful biomarker for risk stratification in a variety of patients arriving to the ED, particularly those who have been identified at high risk for sepsis. Jansen and colleagues examined the measurement of pre-hospital serum lactate at the time of paramedic on-scene assessment in a group of acutely ill patients [41]. Patients with point-of-care lactate levels of 3.5 mmol/L or greater were found to have an in-hospital mortality of 41% versus 12% for those with lactate levels less than 3.5 mmol/L. Within the population with an elevated lactate, patients with a systolic blood pressure greater than 100 mgHg experienced a mortality of nearly 30%, while it was greater than 50% in hypotensive patients with an elevated lactate, highlighting the value of both hemodynamic and serum lactate measures. Upon arrival to the ED, lactate measurements have a strong correlation with mortality. In one retrospective cohort, lactate level was linearly associated with mortality in a broad array of patients older than age 65 years [42]. An initial serum lactate level in the ED in the intermediate (2.0 – 3.9 mmol/L) or high range (≥ 4 mmol/L) has been associated with increased odds of death 2 to 5 times higher independent of organ dysfunction in severe sepsis specifically [43].
As the association between serum lactate levels and death is independent of organ dysfunction, serum lactate is a simple and reliable tool to both enhance detection and risk-stratify patients presenting to the ED with severe sepsis. Given the frequency with which hyperlactatemia is present in patients with suspected infection [43], operationalizing serum lactate measures with the initial phlebotomy draw is an important step to risk-stratify patients. This step can be coupled later with intravenous fluid resuscitation for those with marked elevations (≥ 4 mmol/L), in accord with guideline recommendations [4]. Screening of initial lactate values can be further expedited by utilizing fingerstick point-of-care lactate devices [44]. Last, while serial lactate measures can be incorporated into triage decisions, there is no clear threshold that warrants ICU admission. Rather, persistent elevations in serum lactate can be used to identify patients who require close observation regardless of their admission location.
Several scoring systems have been developed to augment sepsis risk stratification within the ED. The most prominent of these are the Predisposition Insult Response and Organ failure (PIRO), Sequential Organ Failure Assessment (SOFA), and Mortality in the Emergency Department Sepsis (MEDS) scores, and the National early warning score (NEWS) [45-48]. The MEDS score incorporates host factors including age and co-morbid illness, as well as physiologic and laboratory tests which can be obtained rapidly in an ED setting. Multiple prospective and retrospective examinations of the MEDS scoring systems have demonstrated that it performs optimally in ED patients with sepsis but not those with severe sepsis, in terms of predicting 30-day mortality [46,47]. The PIRO score more extensively incorporates predisposing co-morbidities, physiologic and laboratory parameters, and has been modified to consider presumed source of infection, leading to a stronger predictive ability for mortality in more severely ill patients. In patients presenting to the ED with severe sepsis and septic shock, a prospective observational study found the PIRO to be the best predictor of mortality, compared to SOFA and MEDS scores [45]. In a recent study by Corfield et al, sepsis patients with a higher NEWS, according to initial ED vital signs (temperature, pulse, respiratory rate, systolic blood pressure, oxyhemoglobin saturation) and consciousness level, were significantly more likely to be admitted to an ICU within 48 hours or to experience in-hospital mortality [48].
Timely and Appropriate Antibiotics
In a landmark study published by Kumar and colleagues in 2006, the relationship between timing of antibiotics and mortality was established [49]. In 2731 adult septic shock patients, mortality increased 7.6% for every hour delay in effective antimicrobial administration. A striking finding, given that the study population was limited to patients cared for in the ICU, was the fact that only 50% of patients received appropriate antibiotics within 6 hours of onset of shock and nearly one-quarter of patients did not receive antibiotics until the 15th hour. As a direct result, in-hospital mortality was observed to be 58% in this study.
Over the ensuing decade, a series of studies have demonstrated a narrowing of the quality gap in this regard, and the result has coincided with a significant improvement in survival. In 2010, Gaieski and colleagues demonstrated a significant improvement in the prompt administration of antibiotic delivery in patients presenting to an ED with severe sepsis, with the median time from shock onset (sustained hypotension or lactate ≥ 4 mmol/L) to antibiotics down to 42 minutes [50]. Importantly, consistent with the Kumar study, time to appropriate antibiotics, rather than simply initial antibiotics, remained associated with in-hospital mortality independent of initiating early goal-directed therapy. In 2011, Puskarich and colleagues revealed that time to antibiotics continued to improve and, as a result, the investigators did not identify a relationship between time from triage to antibiotics and in-hospital mortality [51]. However, when antibiotics were delayed until after shock recognition, consistent with the study by Kumar and colleagues, survival decreased. Until recently, this important observation was challenging to operationalize clinically as little was known about how to facilitate risk-stratification of those at risk to develop shock. However, Capp and colleagues recently found that deterioration to septic shock 48 hours after ED presentation occurs in approximately one out of eight patients and identified gender (female), transient hypotension, and/or hyperlactatemia upon presentation as risk factors associated with such a deterioration [52].
As an essential element of sepsis care bundles, a focus on timely use of antibiotics in patients with suspected infection, has the potential to increase the use of antibiotics in the ED in patients determined subsequently to not be infected. To combat this acknowledged downstream effect, reconsideration of the utility of empiric antibiotics 48 to 72 hours after admission is required. This step can be accomplished through the use of a sepsis care pathway and/or a formal antibiotic stewardship program.
Quantitative Resuscitation
Rivers and colleagues, in a landmark 2001 trial, examined the effectiveness of a protocolized resuscitation strategy in the most proximal phase of severe sepsis and septic shock [53]. A distinguishing characteristic between the usual care arm and the intervention in this ED-based study, in addition to whether mixed central venous oxygen saturation was measured as a resuscitation end-point, was the inclusion of an ED provider at the bedside to attend to clinical management. The intervention, aimed at achieving physiologic targets, resulted in significantly more fluid resuscitation (3.5 L vs. 5.0 L within the first 6 hours) and a significant decrease in in-hospital mortality compared to the usual care arm (46.5 vs. 30.5%). The study revolutionized the culture and practice of sepsis care, in part by shining a light on the importance of timely resuscitation at the most proximal point of contact between the patient and the healthcare system. It also highlighted the importance of integrating serum lactate measurement into the early screening and risk stratification processes for sepsis care delivery.
The 2014 randomized trial of Protocol-Based Care for Early Septic Shock (ProCESS) revisited this concept, comparing the Rivers 2001 protocol to both a current guideline-based non-invasive algorithmic protocol and what had become usual ED care in the interim [54]. The ProCESS trial, which operationalized a team of bedside providers to direct care for each of the 3 distinct arms, found no significant difference between the arms in terms of 90-day and 1-year mortality, but mortality was approximately 10% less in all arms compared with the intervention arm of the Rivers trial. Further, subjects in each of the 3 arms received in excess of 2 L intravenous fluid resuscitation pre-randomization and 4.4–5.5 L when resuscitation spanned from pre-randomization to 6 hours post-randomization. The conclusion drawn is that the commonalities between the arms—early fluid resuscitation, early antibiotics, and the option to use physiologic measures as markers of the adequacy of treatment, all guided by bedside ED providers—are the most important factors for surviving sepsis. And the result is that practitioners have refined these tools over a decade, leading to steady improvements in survival.
Consistent with the ProCESS trial, a recent Australia and New Zealand trial confirmed no significant difference in 90-day mortality between protocolized EGDT and current usual care for septic shock within an ED [55]. Consistent with ProCESS and ProMISe [56], subjects enrolled in ARISE received in excess of 2.5 L in resuscitation pre-randomization, which when paired with fluid resuscitation in the 0-6 hour post-randomization period (1.96 L in the EGDT arm and 1.71 in the usual-care arm) resulted in resuscitation in the 4.5 to 5L range during the initial resuscitation. The ARISE trial was unique in that appropriate antibiotic administration was a requirement prior to randomization, ensuring that this important driver of mortality reduction was standardized between the two arms of the trial. In summary, while the ideal fluid resuscitation amount is unknown, requires a personalized approach, and further investigation is required to effectively incorporate non-invasive measures to guide fluid responsiveness, early and aggressive resuscitation paired with early antibiotic administration are essential aspects of effective sepsis management.
The Efferent Arm: Structure And Processes To Improve Outcomes
Personnel and Staffing
Quality care for the septic patient requires immediate availability of a multidisciplinary care team, including physicians and nurses with critical care experience who can be rapidly deployed to the bedside. The location of care provision may include on-going care in the initial ED room assignment or transfer to a dedicated area for the care of the critically ill patient within the ED.
To provide optimal care in the era of overcrowding and delayed transfer to an ICU, a movement towards ED intensive care units (ED-ICUs) has emerged [57]. The models of practice range from a model based upon ED intensivists, with expertise in critical care medicine, providing care within the traditional structure of an ED, to a model wherein a portion of the ED is assigned for the care of the critically ill for extended periods of time beyond the initial resuscitation. As these models mature from resuscitation bays capable of scaling up based on need to dedicated ED-ICUs, investments in shared Unit leadership (physician and nursing), staffing (physician, critical care nursing, respiratory therapy, critical care pharmacist) and processes of care (eg, multidisciplinary rounds) in line with established ICUs will be necessary.
While attractive conceptually, large-scale implementation of this movement is unlikely to occur outside of tertiary care academic medical centers. In the many EDs across the US without ED intensivists, and confronted with limited clinician resources, flexible physician and nursing staffing models will be necessary to ensure that care provisions are in accord with established guidelines. Potential solutions to provide the resources to meet the needs of these high-intensity patients include critical care consultation and a strategy traditionally applied to the ICU, telemedicine [58]. Last, given the relationship between hospital volume and mortality in severe sepsis [59,60], timely transfer to a high-volume center for specific cases may be appropriate, although the optimal timing, case selection, and impact of transfer on outcomes warrant further examination.
Clinical Decision Support Strategies
To complement the identification and risk-stratification available by screening and scoring systems, clinical decision support systems are novel tools to improve outcomes in the era of electronic medical records (EMR). Specific to sepsis care delivery, performance improvement initiatives including audit-and-feedback practice can increase severe sepsis guideline adherence, and even modest improvements in adherence appear to lead to sustained improvements that contributed to a 25% relative risk reduction in the observed mortality rate [61,62]. Clinical decision support tools can be used to link early recognition to optimal care processes, such as the Surviving Sepsis Campaign resuscitation and management bundles. The use of prompts as strategies to ensure that bundles of care are ordered and carried out is an important aspect to operationalize during the design phase [63].
Significant preparation is required to effectively carry out the clinical decision support design strategy. For example, to ensure timely antibiotic dispensing, a number of process steps will be required, including prompt notification to a central pharmacist or preferably, an ED pharmacist with access to a local pharmacy pre-stocked with commonly used antibiotics [64]. In addition, the use of an institution-specific antibiogram within the physician computer-order entry sepsis order set, that includes site-specific recommendations (eg, pulmonary, gastrointestinal source) and susceptibility patterns, is an essential aspect of optimal sepsis processes of care. Last, the antibiogram will need to be frequently updated to include season-specific (eg, oseltamivir administration for high-risk cases during influenza season) recommendations to ensure that providers are prompted with the most up-to-date clinical information.
Audit and Feedback and Continuous Performance Improvement
The multimodal approach required to translate knowledge (eg, guidelines) into sepsis care implemented at the bedside is an iterative process. An ED armed with a robust track-and-trigger system and an effective efferent arm, including sophisticated clinical decision support strategies, will require frequent auditing in the plan-do-study-act model of quality improvement to yield clinical effectiveness [61,62,65]. Auditing, paired with feedback to frontline providers, is essential to refine and improve the complex process required to provide expert care to the septic patient [29,65]. Sustained success in optimizing sepsis care delivery is the goal, yet significant work is required to determine the best strategies to achieve this endpoint.
Conclusion
Severe sepsis affects millions of individuals each year in the United States. Delays in recognition result in increased morbidity and mortality, at a tremendous cost to the patient and society. By designing strategies to identify sepsis in a timely, efficient, and effective manner, and by implementing ED structures and processes to increase adherence with sepsis-based guidelines, improved patient-centered outcomes can be realized.
Corresponding author: Mark E. Mikkelsen, MD, MSCE, Gates 05.042, 3400 Spruce St., Philadelphia, PA 19104, [email protected].
Financial disclosures: None.
Author contributions: conception and design, JHM, MEM; analysis and interpretation of data, DFG; drafting of article, JHM, DFG, MEM; critical revision of the article, JHM, MEM.
1. Gaieski DF, Edwards JM, Kallan MJ, Carr BG. Benchmarking the incidence and mortality of severe sepsis in the United States. Crit Care Med 2013;41:1167–74.
2. Angus DC, Linde-Zwirble WT, Lidicker J, et al. Epidemiology of severe sepsis in the United States: analysis of incidence, outcome, and associated costs of care. Crit Care Med 2001;29:1303–10.
3. Lagu T, Rothberg MB, Shieh MS, et al. Hospitalizations, costs, and outcomes of severe sepsis in the United States 2003 to 2007. Crit Care Med 2012;40:754–61.
4. Dellinger RP, Levy MM, Rhodes A, et al. Surviving Sepsis Campaign: international guidelines for management of severe sepsis and septic shock, 2012. Intensive Care Med 2013;39:165–228.
5. Angus DC, van der Poll T. Severe sepsis and septic shock. N Engl J Med 2013;369:840–51.
6. Wang HE, Shapiro NI, Angus DC, Yealy DM. National estimates of severe sepsis in United States emergency departments. Crit Care Med 2007;35:1928–36.
7. Dombrovskiy VY, Martin AA, Sunderram J, et al. Rapid increase in hospitalization and mortality rates for severe sepsis in the United States: a trend analysis from 1993 to 2003. Crit Care Med 2007;35:1244–50.
8. Liu V, Escobar GJ, Greene JD, et al. Hospital deaths in patients with sepsis from 2 independent cohorts. JAMA 2014;312:90–2.
9. Kaukonen KM, Bailey M, Suzuki S, et al. Mortality related to severe sepsis and septic shock among critically ill patients in Australia and New Zealand, 2000-2012. JAMA 2014;311:1308–16.
10. Yende S, Angus DC. Long-term outcomes from sepsis. Curr Infect Dis Rep 2007;9:382–6.
11. Iwashyna TJ, Ely EW, Smith DM, et al. Long-term cognitive impairment and functional disability among survivors of severe sepsis. JAMA 2010; 304:1787–94.
12. Ortego A, Gaieski DF, Fuchs BD, et al. Hospital-based acute care use in survivors of septic shock. Crit Care Med 2015;43:729–37.
13. Prescott HC, Langa KM, Liu V, et al. Increased 1-year healthcare use in survivors of severe sepsis. Am J Respir Crit Care Med 2014;190:62–9.
14. Liu V, Lei X, Prescott HC, et al. Hospital readmission and healthcare utilization following sepsis in community settings. J Hosp Med 2014;9:502–7.
15. Jones AE, Brown MD, Trzeciak S, et al. The effect of a quantitative resuscitation strategy on mortality in patients with sepsis: a meta-analysis. Crit Care Med 2008;36:2734–9.
16. Seymour CW, Rea TD, Kahn JM, et al. Severe sepsis in pre-hospital emergency care: analysis of incidence, care, and outcome. Am J Respir Crit Care Med 2012;186:1264–71.
17. Seymour CW, Cooke CR, Mikkelsen ME, et al. Out-of-hospital fluid in severe sepsis: effect on early resuscitation in the emergency department. Prehosp Emerg Care 2010;14:145–52.
18. Seymour CW, Cooke CR, Heckbert SR, et al. Prehospital intravenous access and fluid resuscitation in severe sepsis: an observational cohort study. Crit Care 2014;18:533
19. Studnek JR, Artho MR, Garner CL, Jones AE. The impact of emergency medical services on the ED care of severe sepsis. Am J Emerg Med 2012;30:51–6.
20. Guss DA, Meyer FT, Neuman TS, et al. The impact of a regionalized trauma system on trauma care in San Diego County. Ann Emerg Med 1989;18:1141–5.
21. Liberman M, Mulder DS, Jurkovich GJ, Sampalis JS. The association between trauma system and trauma center components and outcome in a mature regionalized trauma system. Surgery 2005;137:647–58.
22. Hachinski V, Donnan GA, Gorelick PB, et al. Stroke: working toward a prioritized world agenda. Stroke 2010;41:1084–99.
23. Levy MM, Fink MP, Marshall JC, et al. 2001 SCCM/ESICM/ACCP/ATS/SIS International Sepsis Definitions Conference. Crit Care Med 2003;31:1250–6.
24. Sibbald W, Doig G, Inman K. Sepsis, SIRS, and infection. Intensive Care Med 1995;21:299–301.
25. Kaukonen KM, Bailey M, Pilcher D, et al. Systemic inflammatory response syndrome criteria in defining severe sepsis. N Engl J Med 2015; online March 17, 2015.
26. Shapiro NI, Howell MD, Bates D, et al. The association of sepsis syndrome and organ dysfunction with mortality in emergency department patients with suspected infection. Ann Emerg Med 2006;48:583–90.
27. Berger T, Green J, Horeczko T, et al. Shock index and early recognition of sepsis in the emergency department: pilot study. West J Emerg Med 2013;14:168–74.
28. Farley H, Zubrow MT, Gies J, et al. Emergency department tachypnea predicts transfer to a higher level of care in the first 24 hours after ED admission. Acad Emerg Med 2010;17:718–22.
29. Sinuff T, Muscadere J, Adhikari NK, et al. Knowledge translation interventions for critically ill patients: a systematic review. Crit Care Med 2013;41:2627–40.
30. Hoot NR, Aronsky D. Systematic review of emergency department crowding: causes, effects, and solutions. Ann Emerg Med 2008;52:126–36.
31. Hsia RY, Kellermann AL, Shen YC. Factors associated with closures of emergency departments in the United States. JAMA 2011;305:1978–85.
32. Chalfin DB, Trzeciak S, Likourezos A, et al. Impact of delayed transfer of critically ill patients from the emergency department to the intensive care unit. Crit Care Med 2007;35:1477–83.
33. Subbe CP, Kruger M, Rutherford P, et al. Validation of a modified early warning score in medical admissions. Q J Med 2001;94:521–6.
34. Umscheid CA, Betesh J, VanZandbergen C, et al. Development, implementation, and impact of an automated early warning and response system for sepsis. J Hosp Med 2015;10:26–31.
35. Churpek MM, Yuen TC, Winslow C, et al. Multicenter development and validation of a risk stratification tool for ward patients. Am J Respir Crit Care Med 2014;190:649–55.
36. Whittaker SA, Fuchs BD, Gaieski DF, et al. Epidemiology and outcomes in patients with severe sepsis admitted to the hospital wards. J Crit Care 2015;30:78–84.
37. Delgado MK, Liu V, Pines JM, et al. Risk factors for unplanned transfer to intensive care within 24 hours of admission from the emergency department in an integrated healthcare system. J Hosp Med 2013;8:13–9.
38. Valentini I, Pacilli AM, Carbonara P, et al. Influence of the admission pattern on the outcome of patients admitted to a respiratory intensive care unit: does a step-down admission differ from a step-up one? Respir Care 2013;58:2053–60.
39. Kompanje EJO, Jansen TC, van der Hoven B, Bakker J. The first demonstration of lactic acid in human blood in shock by Johann Joseph Scherer (1814-1869) in January 1843. Intensive Care Med 2007;33:1967–71.
40. Kraut JA, Madias NE. Lactic acidosis. N Engl J Med 2014;371:2309–19.
41. Jansen TC, van Bommel J, Mulder PG, et al. The prognostic value of blood lactate levels relative to that of vital signs in the pre-hospital setting: a pilot study. Crit Care 2008;12:R160.
42. del Portal DA, Shofer F, Mikkelsen ME, et al. Emergency department lactate is associated with mortality in older adults admitted with and without infections. Acad Emerg Med 2010;17:260–8.
43. Mikkelsen ME, Miltiades AN, Gaieski DF, et al. Serum lactate is associated with mortality in severe sepsis independent of organ failure and shock. Crit Care Med 2009;37:1670–7.
44. Gaieski DF, Drumheller BC, Goyal M, et al. Accuracy of handheld point-of-care fingertip lactate measurement in the emergency department. West J Emerg Med 2013;14:58–62.
45. Macdonald SP, Arendts G, Fatovich DM, Brown SG. Comparison of PIRO, SOFA, and MEDS scores for predicting mortality in emergency department patients with severe sepsis and septic shock. Acad Emerg Med 2014;21:1257–63.
46. Carpenter CR, Keim SM, Upadhye S, Nguyen HB, Group BEiEMI. Risk stratification of the potentially septic patient in the emergency department: the Mortality in the Emergency Department Sepsis (MEDS) score. J Emerg Med 2009;37:319–27.
47. Sankoff JD, Goyal M, Gaieski DF, et al. Validation of the Mortality in Emergency Department Sepsis (MEDS) score in patients with the systemic inflammatory response syndrome (SIRS). Crit Care Med 2008;36:421–6.
48. Corfield AR, Lees F, Zealley I, et al. Utility of a single early warning score in patients with sepsis in the emergency department. Emerg Med J 2014;31:482–7.
49. Kumar A, Roberts D, Wood KE, et al. Duration of hypotension before initiation of effective antimicrobial therapy is the critical determinant of survival in human septic shock. Crit Care Med 2006;34:1589–96.
50. Gaieski DF, Mikkelsen ME, Band RA, et al. Impact of time to antibiotics on survival in patients with severe sepsis or septic shock in whom early goal-directed therapy was initiated in the emergency department. Crit Care Med 2010;38:1045–53.
51. Puskarich MA, Trzeciak S, Shapiro NI, et al. Association between timing of antibiotic administration and mortality from septic shock in patients treated with a quantitative resuscitation protocol. Crit Care Med 2011;39:2066–71.
52. Capp R, Horton CL, Takhar SS, et al. Predictors of patients who present to the emergency department with sepsis and progress to septic shock between 4 and 48 hours of emergency department arrival. Crit Care Med 2015 Jan 30.
53. Rivers E, Nguyen B, Havstad S, et al. Early goal-directed therapy in the treatment of severe sepsis and septic shock. N Engl J Med. 2001;345:1368–77.
54. The ProCESS Investigators. A ranodmized trial of protocol-based care for early septic shock. N Engl J Med 2014;370:1683–93.
55. The ARISE Investigators and the ANZICS Clinical Trials Group. Goal-directed resuscitation for patients with early septic shock. N Engl J Med 2014;371:1496–506.
56. Mouncey PR, Osborn TM, Power GS, et al. Trial of early, goal-directed resuscitation for septic shock. N Engl J Med 2015; online March 17, 2015.
57. Weingart SD, Sherwin RL, Emlet LL, et al. ED intensivists and ED intensive care units. Amer J Emerg Med 2013;31:617–20.
58. Lilly CM, Cody S, Zhao H, et al. Hospital mortality, length of stay, and preventable complications among critically ill patients before and after tele-ICU reengineering of critical care processes. JAMA 2011;305:2175–85.
59. Walkey AJ, Wiener RS. Hospital case volume and outcomes among patients hospitalized with severe sepsis. Am J Respir Crit Care Med 2014;189:548–55.
60. Gaieski DF, Edwards JM, Kallan MJ, et al. The relationship between hospital volume and mortality in severe sepsis. Am J Respir Crit Care Med 2014;190:665–74.
61. Levy MM, Dellinger RP, Townsend SR, et al. The surviving sepsis campaign: results of an international guideline-based performance improvement program targeting severe sepsis. Intensive Care Med 2010;36:222–31.
62. Levy MM, Rhodes A, Phillips GS, et al. Surviving sepsis campaign: association between performance metrics and outcomes in a 7.5-year study. Crit Care Med 2015;43:3–12.
63. Weiss CH, Moazed F, McEvoy CA, et al. Prompting physicians to address a daily checklist and process of care and clinical outcomes: a single-site study. Am J Respir Crit Care Med 2011;184:680–6.
64. Weant KA, Baker SN. Emergency medicine pharmacists and sepsis management. J Pharm Pract 2013;26:401–5.
65. Marwick CA, Guthrie B, Pringle JE, et al. A multifaceted intervention to improve sepsis management in general hospital wards with evaluation using segmented regression of interrupted time series. BMJ Qual Saf 2014;23:e2.
The facts don’t speak for themselves
Whenever I meet families who oppose vaccination, my first response is to flood them with more evidence, reciting the pro-vaccine fact sheet that every doctor knows by heart. I can’t help myself. The evidence is so self-explanatory that it should put any question to rest.
But this approach may just exacerbate the problem. In fact, studies suggest that attacking parents’ beliefs can backfire, and that “attempts to increase concerns about communicable diseases or correct false claims about vaccines may be … counterproductive.” We can inform parents that vaccines prevent thousands of deaths and millions of cases of disease while saving billions in health care costs, but this will not change the mind of someone who does not trust the data.

One major problem is that doctors and parents sometimes speak different languages. As trainees, we are raised on nomograms, algorithms, and clinical trials. When a problem presents itself, we instinctively seek out a rational, data-driven response. This is how doctors are built, but studies suggest that vaccine-hesitant parents may be built differently, driven more by fears and negative emotions than by data. Their decisions seem to be based not on a misunderstanding of the facts, but rather a mistrust of the facts.
As pediatric trainees, this is the world we are inheriting. The more successful vaccines become at preventing disease, the harder it will become to convince parents of the serious risks of nonvaccination. It is a perpetual uphill battle.
To make the future better for our patients (and to contribute to our future sanity), we need to work past frustrations and focus on developing pragmatic solutions. There is surely no easy or perfect answer, and different parents may require different approaches, but the status quo is not working. To find the solutions, we need to develop a robust evidence base to guide our good intentions. Perhaps the answer will come from tailoring communication strategies, refocusing public outreach efforts, creating legal mandates, or maybe something completely different.
And if we are successful, maybe we can close the communications gap between vaccine-resisting parents and doctors.
Dr. Sisk is a pediatrics resident at St. Louis Children’s Hospital. E-mail him at [email protected].
Whenever I meet families who oppose vaccination, my first response is to flood them with more evidence, reciting the pro-vaccine fact sheet that every doctor knows by heart. I can’t help myself. The evidence is so self-explanatory that it should put any question to rest.
But this approach may just exacerbate the problem. In fact, studies suggest that attacking parents’ beliefs can backfire, and that “attempts to increase concerns about communicable diseases or correct false claims about vaccines may be … counterproductive.” We can inform parents that vaccines prevent thousands of deaths and millions of cases of disease while saving billions in health care costs, but this will not change the mind of someone who does not trust the data.
One major problem is that doctors and parents sometimes speak different languages. As trainees, we are raised on nomograms, algorithms, and clinical trials. When a problem presents itself, we instinctively seek out a rational, data-driven response. This is how doctors are built, but studies suggest that vaccine-hesitant parents may be built differently, driven more by fears and negative emotions than by data. Their decisions seem to be based not on a misunderstanding of the facts, but rather a mistrust of the facts.
As pediatric trainees, this is the world we are inheriting. The more successful vaccines become at preventing disease, the harder it will become to convince parents of the serious risks of nonvaccination. It is a perpetual uphill battle.
To make the future better for our patients (and to contribute to our future sanity), we need to work past frustrations and focus on developing pragmatic solutions. There is surely no easy or perfect answer, and different parents may require different approaches, but the status quo is not working. To find the solutions, we need to develop a robust evidence base to guide our good intentions. Perhaps the answer will come from tailoring communication strategies, refocusing public outreach efforts, creating legal mandates, or maybe something completely different.
And if we are successful, maybe we can close the communications gap between vaccine-resisting parents and doctors.
Dr. Sisk is a pediatrics resident at St. Louis Children’s Hospital. E-mail him at [email protected].

Duped
While folks my age are sometimes referred to as “elderly” victims in newspaper stories about phone and Internet scams, I resist and object to the implication that I am less than sharp and worrisomely vulnerable to being duped.
I hang up when a stranger calls to warn me that I am about to be audited by the Internal Revenue Service and asks for my Social Security number. I double-delete e-mails purported to come from my Internet provider that ask for my e-mail address and password. I’m no pushover.
However, I fear that over the last 20 years of my practice career, I was duped by several of my adolescent patients on more than one occasion. I hope that I had a reputation in town as one of the physicians least likely to leap to the diagnosis of attention-deficit/hyperactivity disorder (ADHD) and even less likely to pull out my pad and prescribe stimulants.
I was particularly hesitant to make the diagnosis of ADHD in an adolescent whose academic career and behavior in grade school had been unremarkable. But from time to time I was presented with a case that included a combination of apparently reliable teachers’ reports, parental pleas, and patient complaints that was hard to ignore. Having ruled out anxiety, depression, learning disabilities, and severe sleep deprivation (all my teenage patients were sleep deprived to some degree) I would reluctantly agree to a trial of stimulant medication.
As you can imagine, assessing success or failure took time because we were usually looking for improvement in academic performance. For adolescents, this often means waiting to the end of the semester or grading period. If the academic improvement was less than dramatic as it was in the usual scenario, I was left relying on the patient’s report of his subjective observations and waiting another 6 months for more information from the school. Occasionally, the patient would report that the medication made him feel weird and that he wanted to stop it. More often, the patient would report that he was able to pay attention in class more easily, even though he had difficulty pointing to a documented improvement in his performance.
So what does one do? Sometimes I could convince the patient and his family that the trial had failed and that we should stop the medication and work harder to find a better match between his learning style, study habits, and the demands of the school. In other cases, I would adjust dosages and switch medications. The results were seldom dramatic. However, if the patient continued to claim a benefit, I would continue to prescribe the stimulant. I would make phone assessments with every refill, and face-to-face visits at least once a year.
While it may be that a few of those adolescents without clearly demonstrable benefit were indeed being helped by the stimulants, I am now convinced that I was being duped more often than I cared to admit then. I know there were stimulants available on the streets and in the school hallways and parking lots because some of my patients told me that they were easy to find and had tried them. I have to believe that some of those pills on the street were ones I had prescribed. I worry when I consider how many.
The national statistics are staggering and embarrassing. In 2013, the federal Substance Abuse and Mental Health Services Administration reported that ED visits associated with the nonmedical use of prescribed stimulants among adults aged 18-34 years had tripled from 2005 to 2011. (“Workers Seeking Productivity in a Pill Are Abusing ADHD Drugs,” by Alan Schwarz, New York Times, April 18, 2015). How many of the pills associated with those visits were originally prescribed for adolescent who didn’t have ADHD?
How many of my patients were just trying to be good friends by sharing their pills and how many were selling them? How many of the pills I prescribed were fueling all-night parties, and how many were being used as performance-enhancing drugs by students who needed to finish a term paper on time?
I don’t know. But I do know that although I miss practicing pediatrics, I am glad I no longer have to face the dilemma of the adolescent with ADHD-like complaints, because I hate being duped.

Celiac disease more than doubles neuropathy risk
Individuals with biopsy-confirmed celiac disease have more than double the risk of receiving a diagnosis of neuropathy when compared with the general population, and the risk persists even when other potentially contributing conditions and lifestyle factors are considered.
The use of Swedish population registries enabled first author Dr. Sujata P. Thawani of Columbia University, New York, and her colleagues to find that the risk of neuropathy was increased both before and after a diagnosis of celiac disease (CD).
“We found an increased risk of neuropathy in patients with CD that persists after CD diagnosis. Although absolute risks for neuropathy are low, CD is a potentially treatable condition with a young age of onset. Our findings suggest that screening could be beneficial in patients with neuropathy,” they wrote (JAMA Neurol. 2015 May 11 [doi:10.1001/jamaneurol.2015.0475]).Neuropathy has a known association with CD, an immune-mediated disorder characterized by sensitivity to gluten with an incidence of about 1% in Western Europe. Previous studies had reported that up to one-third of celiac disease patients also experienced neuropathy, but the literature had not completely characterized the prevalence of neuropathy in the CD population.

Dr. Thawani and her associates used Swedish pathology registers to identify individuals whose small intestine biopsies showed villous atrophy between 1969 and 2008 (Marsh stage 3, n = 28,232). These individuals were categorized as having CD. Neuropathy diagnoses were drawn from national patient and pharmacy registers. Each CD patient was matched with up to five age- and sex-matched controls (n = 139,473) from the Swedish Total Population Registry, all of whom were diagnosed in the same year and were from the same county as the matched CD patient.
Although 41.7% of CD patients were diagnosed in childhood, the median age at diagnosis was 29 years. About 62% of patients in both groups were female. For CD patients, the absolute risk of neuropathy was 64 per 100,000 patient-years, compared with 15 per 100,000 patients-years in the control group (hazard ratio, 2.5; 95% confidence interval, 2.0-2.9; P < .001).
The risk of neuropathy for patients with CD was not affected by gender, absolute age, or age at diagnosis. The risk of neuropathy for those with CD remained about 2.5 times higher than the matched controls, even after accounting for diabetes status, the presence of other autoimmune disorders, vitamin deficiencies, and alcohol use. Although vitamin B12 deficiency has been associated with CD and may contribute to neuropathy, the investigators noted that, “in our analysis, the influence of vitamin deficiencies did not significantly affect our risk estimate.”
Nonspecified neuropathy was the most commonly reported type of neuropathy. Other subtypes of neuropathy were tracked, but limitations of coding and reporting prevented tracking sensory ganglionopathy, the second most commonly reported neuropathy in CD.
The strengths of the study included the large sample size and the study’s statistical strengths. The retrospective nature of the study was an overall limitation, and the homogeneous study population (over 90% of patients in both arms were of Nordic heritage) limited the study’s generalizability.
Surveillance bias may account for some of the increased risk for neuropathy, noted Dr. Thawani and her colleagues. This was hinted at by the fact that a diagnosis of neuropathy tended to follow closely on the CD diagnosis; physicians may have been more attuned to detecting potential sequelae of the CD diagnosis during this time period. Notably, though, patients with a prior neuropathy diagnosis also were more likely to be diagnosed with CD, showing a bidirectional relationship.
“These data may also suggest that the two diseases may share risk factors or a common underlying etiology for the development of neuropathy, such as a potential role of immunologic mechanisms,” they wrote.
The authors reported no conflicts of interest. The investigators received support from the Swedish Society of Medicine, the Swedish Research Council, and the National Center for Advancing Translational Sciences.
Individuals with biopsy-confirmed celiac disease have more than double the risk of receiving a diagnosis of neuropathy when compared with the general population, and the risk persists even when other potentially contributing conditions and lifestyle factors are considered.
The use of Swedish population registries enabled first author Dr. Sujata P. Thawani of Columbia University, New York, and her colleagues to find that the risk of neuropathy was increased both before and after a diagnosis of celiac disease (CD).
“We found an increased risk of neuropathy in patients with CD that persists after CD diagnosis. Although absolute risks for neuropathy are low, CD is a potentially treatable condition with a young age of onset. Our findings suggest that screening could be beneficial in patients with neuropathy,” they wrote (JAMA Neurol. 2015 May 11 [doi:10.1001/jamaneurol.2015.0475]).Neuropathy has a known association with CD, an immune-mediated disorder characterized by sensitivity to gluten with an incidence of about 1% in Western Europe. Previous studies had reported that up to one-third of celiac disease patients also experienced neuropathy, but the literature had not completely characterized the prevalence of neuropathy in the CD population.
Dr. Thawani and her associates used Swedish pathology registers to identify individuals whose small intestine biopsies showed villous atrophy between 1969 and 2008 (Marsh stage 3, n = 28,232). These individuals were categorized as having CD. Neuropathy diagnoses were drawn from national patient and pharmacy registers. Each CD patient was matched with up to five age- and sex-matched controls (n = 139,473) from the Swedish Total Population Registry, all of whom were diagnosed in the same year and were from the same county as the matched CD patient.
Although 41.7% of CD patients were diagnosed in childhood, the median age at diagnosis was 29 years. About 62% of patients in both groups were female. For CD patients, the absolute risk of neuropathy was 64 per 100,000 patient-years, compared with 15 per 100,000 patients-years in the control group (hazard ratio, 2.5; 95% confidence interval, 2.0-2.9; P < .001).
The risk of neuropathy for patients with CD was not affected by gender, absolute age, or age at diagnosis. The risk of neuropathy for those with CD remained about 2.5 times higher than the matched controls, even after accounting for diabetes status, the presence of other autoimmune disorders, vitamin deficiencies, and alcohol use. Although vitamin B12 deficiency has been associated with CD and may contribute to neuropathy, the investigators noted that, “in our analysis, the influence of vitamin deficiencies did not significantly affect our risk estimate.”
Nonspecified neuropathy was the most commonly reported type of neuropathy. Other subtypes of neuropathy were tracked, but limitations of coding and reporting prevented tracking sensory ganglionopathy, the second most commonly reported neuropathy in CD.
The strengths of the study included the large sample size and the study’s statistical strengths. The retrospective nature of the study was an overall limitation, and the homogeneous study population (over 90% of patients in both arms were of Nordic heritage) limited the study’s generalizability.
Surveillance bias may account for some of the increased risk for neuropathy, noted Dr. Thawani and her colleagues. This was hinted at by the fact that a diagnosis of neuropathy tended to follow closely on the CD diagnosis; physicians may have been more attuned to detecting potential sequelae of the CD diagnosis during this time period. Notably, though, patients with a prior neuropathy diagnosis also were more likely to be diagnosed with CD, showing a bidirectional relationship.
“These data may also suggest that the two diseases may share risk factors or a common underlying etiology for the development of neuropathy, such as a potential role of immunologic mechanisms,” they wrote.
The authors reported no conflicts of interest. The investigators received support from the Swedish Society of Medicine, the Swedish Research Council, and the National Center for Advancing Translational Sciences.
FROM JAMA NEUROLOGY
Key clinical point: Screening for celiac disease could be beneficial in patients with neuropathy.
Major findings: The risk of neuropathy for individuals with celiac disease was 2.5 times that of controls, even after adjusting for comorbidities and patient characteristics.
Data source: Review of 28,232 patients with biopsy-confirmed celiac disease and 139,473 matched controls from 1969 to 2008, drawn from Swedish patient registries.
Disclosures: The authors reported no conflicts of interest. The investigators received support from the Swedish Society of Medicine, the Swedish Research Council, and the National Center for Advancing Translational Sciences.

Sunshine Act – another reminder
I’ve written about the Physician Payment Sunshine Act several times since it became law in 2013. My basic opinion – that it is a tempest in a teapot – has not changed. Nonetheless, now is the time to review the 2014 data reported under your name – and if necessary, initiate a dispute – before the information is posted publicly on June 30.
A quick review: The Sunshine Act, known officially as the “Open Payments Program,” requires all manufacturers of drugs, devices, and medical supplies covered by federal health care programs to report to the Centers for Medicare & Medicaid Services any financial interactions with physicians and teaching hospitals.
Reportable interactions include consulting, food, ownership or investment interest, direct compensation for speakers at education programs, and research. Compensation for clinical trials must be reported but is not made public until the product receives FDA approval, or until 4 years after the payment, whichever is earlier. Payments for trials involving a new indication for an approved drug are posted the following year.
Exemptions include CME activities funded by manufacturers and product samples for patient use. Medical students and residents are exempted entirely.
You are allowed to review your data and request corrections before information is posted publicly. You will have an additional 2 years to pursue corrections after the content goes live at the end of June, but any erroneous information will remain online until the next scheduled update, so you should find and fix errors as promptly as possible.
If you don’t see drug reps, accept sponsored lunches, or give sponsored talks, don’t assume that you won’t be on the website. Check anyway: You might be indirectly involved in a compensation that you were not aware of, or you might have been reported in error.
To review your data, register at the CMS Enterprise Portal (https://portal.cms.gov/wps/portal/unauthportal/home/) and request access to the Open Payments system.
The question remains as to what effect the law might be having on research, continuing education, or physicians’ relationships with the pharmaceutical industry. The short answer is that no one knows. The first data posting this past September came and went with little fanfare, and no repercussions directly attributable to the program have been reported as of this writing.
Sunshine laws have been in effect for several years in six states: California, Colorado, Massachusetts, Minnesota, Vermont, and West Virginia, plus the District of Columbia. (Maine repealed its law in 2011.) Observers disagree on their impact. Studies in Maine and West Virginia showed no significant public reaction or changes in prescribing patterns, according to a 2012 article in the Archives of Internal Medicine (now JAMA Internal Medicine).
Reactions from the public are equally inscrutable. Do citizens think less of doctors who accept the occasional industry-sponsored lunch for their employees? Do they think more of doctors who speak at meetings, or conduct industry-sponsored clinical research? There are no objective data. Anecdotally, I haven’t heard a peep – positive, negative, or indifferent – from any of my patients, nor have any other physicians that I’ve asked.
As of now, I stand by my initial prediction that attorneys, activists, and the occasional reporter will data-mine the information for various purposes, but few patients will bother to visit. Of course, that doesn’t mean you should ignore it as well. As always, I suggest you review the accuracy of anything posted about you, in any form or context, on any venue. This year’s data (reflecting all 2014 reports) have been available for review since April 6. You can initiate a dispute at any time over the next 2 years, before or after public release on June 30, but the sooner the better. Corrections are made each time CMS updates the system.
Maintaining accurate financial records has always been important, but it will be even more important now to support your disputes. CMS won’t simply take your word for it. A free app is available to help you track payments and other reportable industry interactions; search for “Open Payments” at your favorite app store.
Dr. Eastern practices dermatology and dermatologic surgery in Belleville, N.J. He is the author of numerous articles and textbook chapters, and is a longtime monthly columnist for Dermatology News.

Explaining obesity in cancer survivors

Researchers have identified several factors that may influence the risk of obesity in childhood cancer survivors.
Previous research showed that obesity rates are elevated in childhood cancer survivors who were exposed to cranial radiation.
But the new study has shown that other types of treatment, a patient’s age, and certain genetic variants are associated with obesity in this population.
Carmen Wilson, PhD, of St. Jude Children’s Research Hospital in Memphis, Tennessee, and her colleagues reported these findings in Cancer.
The researchers evaluated 1,996 childhood cancer survivors treated at St. Jude. The patients’ median age at diagnosis was 7.2 years (range, 0.1-24.8), and their median age at follow-up was 32.4 years (range, 18.9-63.8).
At the time of evaluation, 645 patients (32.3%) were of normal weight, 71 (3.6%) were underweight, 556 (27.9%) were overweight, and 723 (36.2%) were obese.
The prevalence of obesity was highest in male leukemia survivors (42.5%) and females who survived neuroblastoma (43.6%), followed closely by those who survived leukemia (43.1%).
Multivariable analyses showed that 3 factors were independently associated with an increased risk of obesity: older age at the time of evaluation (≥30 years vs <30 years; P<0.001), undergoing cranial radiation (P<0.001), and receiving glucocorticoids (P=0.004).
On the other hand, receiving chest, abdominal, or pelvic radiation was associated with a decreased risk of obesity (P<0.001).
The researchers also identified 166 single nucleotide polymorphisms that were associated with obesity among cancer survivors who had received cranial radiation. The strongest association was in variants of genes involved in neuron growth, repair, and connectivity.
Among survivors who did not receive cranial radiation, only 1 single nucleotide polymorphism—rs12073359, located on chromosome 1—was associated with an increased risk of obesity.
Dr Wilson said these findings might help us identify the childhood cancer survivors who are most likely to become obese. The results may also provide a foundation for future research efforts aimed at characterizing molecular pathways involved in the link between childhood cancer treatment and obesity. ![]()
Antimalarial drug unavailable, CDC says

Photo courtesy of the FDA
The antimalarial drug chloroquine is not currently available from US suppliers, according to the Centers for Disease Control and Prevention (CDC).
The agency said it will provide updates as more information becomes available from the Food and Drug Administration.
Chloroquine is used as malaria treatment and prophylaxis, but hydroxychloroquine sulfate can be prescribed in place of chloroquine when indicated.
Healthcare providers who need assistance diagnosing or managing suspected or confirmed cases of malaria can call the CDC Malaria Hotline at 1-855-856-4713 (Monday through Friday, 9 am to 5pm, Eastern time).
For emergency consultation after hours, providers can call 1-770-488-7100 and ask to speak with a CDC Malaria Branch clinician. ![]()