User login
Management of IBD in older patients
MAUI, HAWAII – Misconceptions abound regarding inflammatory bowel disease (IBD) in the elderly, Uma Mahadevan, MD, said at the Gastroenterology, IBD, Liver Disease meeting.
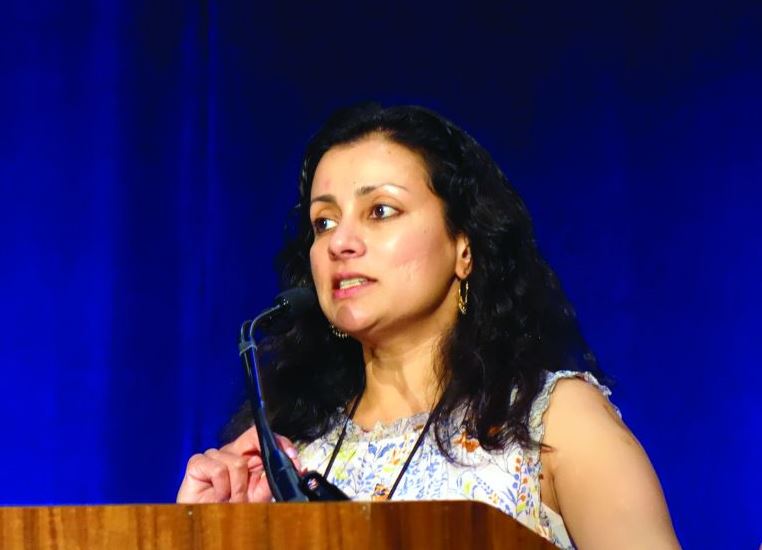
In addition to dispelling these notions, she outlined her favored treatment strategies in older IBD patients.
IBD in older individuals is actually very common
A Swedish national registry study of all 27,834 patients diagnosed with IBD in that country during 2006-2013 showed that 23% were first diagnosed at age 60 or older, with an incidence rate of 35 per 100,000 person-years for Crohn’s disease and 19 per 100,000 person-years for ulcerative colitis (Gastroenterology. 2018 Feb;154[3]:518-528e15.
“One in four to one in five of your new IBD patients are going to be over the age of 60. That’s pretty impressive,” Dr. Mahadevan said.
Genetics is less important in the pathophysiology of older-onset IBD. In one study, a positive family history of Crohn’s disease was present in 16% of affected patients under age 17 but in only 7% of those with disease onset after age 60. Similarly, a positive family history was present in 13% of ulcerative colitis patients under age 17 but in just 3% of those with onset after 60.
If genetics plays a minimal role in elderly-onset IBD, then what are the drivers? Two contributors are immunosenescence and age-related changes in the gut microbiota. Aging is accompanied by diminished T-cell responses marked by impaired memory T cells and a reduction in naive T-cell precursors.
“As the rest of you starts to age and sag, so do your T cells,” the gastroenterologist quipped.
Aging also brings physiologic alterations in gastrointestinal motility and transit. Together with changes in diet and an increase in comorbid conditions, with consequent need for a raft of medications, the end result is reduced abundance and diversity of anaerobes in the microbiota. This has immunologic implications.
Elderly IBD isn’t less severe
During a median of 4.2 years of follow-up in the Swedish national study, patients diagnosed with IBD after age 60 had more IBD-related hospitalizations and overall health care utilization than those diagnosed at ages 18-59. The incidence of extraintestinal disease manifestations was similar in the elderly and younger-adult patients; however, bowel surgery was significantly more common in the elderly patients, with a 13% rate after 5 years versus 10% in patients diagnosed as younger adults.
Moreover, elderly patients were less likely to use biologic agents and received much more systemic corticosteroid therapy than younger adults. These findings suggest that the reason elderly patients aren’t using biologics isn’t because their disease is milder, but rather because their physicians are afraid of using biologics. Due to their overconcern about risks of malignancy and serious infections, many physicians opt instead for repeated courses of corticosteroids, which is an inappropriate treatment strategy, Dr. Mahadevan said.
A cross-sectional U.S. study utilizing data from the National Inpatient Sample demonstrated that 25% of all patients hospitalized for IBD were above age 65. The study by investigators at the Medical College of Wisconsin, Milwaukee, found that age greater than 65 was an independent risk factor for in-hospital mortality. Indeed, even after adjustment for comorbidity in a multivariate logistic regression analysis, IBD patients above age 65 had a sobering 3.9-fold greater risk of in-hospital mortality (Inflamm Bowel Dis. 2009 Feb;15[2]182-9).
Another piece of evidence that elderly-onset IBD isn’t less severe comes from a Canadian cohort study of all newly diagnosed cases of IBD in Ontario during 1999-2008. The elderly-onset ulcerative colitis patients were one-third more likely to undergo IBD-related surgery than those diagnosed at ages 18-40. Older-onset Crohn’s disease patients weren’t more likely to have IBD-related operations than younger-onset patients; however, IBD-specific mortality was significantly greater in elderly-onset Crohn’s disease patients than in those diagnosed in middle age or as young adults, by a margin of 33.1 cases to 5.6 cases to 1.0 case per 10,000 person-years (Inflamm Bowel Dis. 2017 Feb;23[2]:218-23).
Treatment of IBD in the elderly
Dr. Mahadevan emphasized that, if elderly patients need biologic therapy because their disease isn’t being adequately controlled with more conservative management strategies, then they should get it. The higher rates of IBD-related surgery and in-hospital mortality in elderly IBD patients argue in favor of that strategy in order to keep them out of the hospital and optimize quality of life.
Her go-to biologics in elderly IBD patients are vedolizumab (Entyvio) and ustekinumab (Stelara): “In my older patients I reach for these two first.”
This is because of the well-documented, excellent safety profiles of those two biologics, which are particularly relevant in an elderly population at increased background risk for lymphoma and serious infections. A pooled analysis of three clinical trials of ustekinumab in induction therapy for Crohn’s disease showed an adverse event risk no different from placebo (J Comp Eff Res. 2017 Oct;6[7]:601-12). Vedolizumab, like ustekinumab, doesn’t carry a black box warning for lymphoma, and the biologic had no increase in any infections in an analysis of six clinical trials entailing more than 4,800 person-years of vedolizumab exposure (Gut. 2017 May;66[5]:839-51).
She provided three illustrative clinical scenarios, each involving a 62-year-old fit and active patient. If that patient had newly diagnosed moderate to severe ulcerative colitis, had failed on 5-aminosalicylic acid, and had good symptomatic control on prednisone, that’s someone who needs a steroid-sparing drug, and she would choose vedolizumab based upon its track record. If that active 62-year-old had moderate to severe ileal and perianal Crohn’s disease, she would opt for ustekinumab or a tumor necrosis factor inhibitor. But if that older patient was hospitalized with newly diagnosed severe ulcerative colitis that was only partially responsive to intravenous steroids, she would eschew vedolizumab and ustekinumab and turn to infliximab (Remicade).
“That patient should get infliximab just like a 32-year-old would. You need to give this patient the best shot [at avoiding colectomy], and to this day the data still supports infliximab in that population,” Dr. Mahadevan said.
Complicating management in the elderly are the commonly encountered challenges posed by polypharmacy, frailty, history of skin cancer or solid organ tumors, and heart failure. In one study, older patients with Crohn’s disease were on an average of 10 medications, ulcerative colitis patients on nine. Forty percent of the patients had potential drug-drug interactions involving their IBD medications (Inflamm Bowel Dis. 2015 Jun;21[6]:1392-400). These are situations that require individually tailored immunosuppressive decision-making.
Dr. Mahadevan reported receiving research support from the Crohn’s and Colitis Foundation, Celgene, and Pfizer and serving as a consultant to those pharmaceutical companies as well as AbbVie, Janssen, and Takeda.
MAUI, HAWAII – Misconceptions abound regarding inflammatory bowel disease (IBD) in the elderly, Uma Mahadevan, MD, said at the Gastroenterology, IBD, Liver Disease meeting.
In addition to dispelling these notions, she outlined her favored treatment strategies in older IBD patients.
IBD in older individuals is actually very common
A Swedish national registry study of all 27,834 patients diagnosed with IBD in that country during 2006-2013 showed that 23% were first diagnosed at age 60 or older, with an incidence rate of 35 per 100,000 person-years for Crohn’s disease and 19 per 100,000 person-years for ulcerative colitis (Gastroenterology. 2018 Feb;154[3]:518-528e15.
“One in four to one in five of your new IBD patients are going to be over the age of 60. That’s pretty impressive,” Dr. Mahadevan said.
Genetics is less important in the pathophysiology of older-onset IBD. In one study, a positive family history of Crohn’s disease was present in 16% of affected patients under age 17 but in only 7% of those with disease onset after age 60. Similarly, a positive family history was present in 13% of ulcerative colitis patients under age 17 but in just 3% of those with onset after 60.
If genetics plays a minimal role in elderly-onset IBD, then what are the drivers? Two contributors are immunosenescence and age-related changes in the gut microbiota. Aging is accompanied by diminished T-cell responses marked by impaired memory T cells and a reduction in naive T-cell precursors.
“As the rest of you starts to age and sag, so do your T cells,” the gastroenterologist quipped.
Aging also brings physiologic alterations in gastrointestinal motility and transit. Together with changes in diet and an increase in comorbid conditions, with consequent need for a raft of medications, the end result is reduced abundance and diversity of anaerobes in the microbiota. This has immunologic implications.
Elderly IBD isn’t less severe
During a median of 4.2 years of follow-up in the Swedish national study, patients diagnosed with IBD after age 60 had more IBD-related hospitalizations and overall health care utilization than those diagnosed at ages 18-59. The incidence of extraintestinal disease manifestations was similar in the elderly and younger-adult patients; however, bowel surgery was significantly more common in the elderly patients, with a 13% rate after 5 years versus 10% in patients diagnosed as younger adults.
Moreover, elderly patients were less likely to use biologic agents and received much more systemic corticosteroid therapy than younger adults. These findings suggest that the reason elderly patients aren’t using biologics isn’t because their disease is milder, but rather because their physicians are afraid of using biologics. Due to their overconcern about risks of malignancy and serious infections, many physicians opt instead for repeated courses of corticosteroids, which is an inappropriate treatment strategy, Dr. Mahadevan said.
A cross-sectional U.S. study utilizing data from the National Inpatient Sample demonstrated that 25% of all patients hospitalized for IBD were above age 65. The study by investigators at the Medical College of Wisconsin, Milwaukee, found that age greater than 65 was an independent risk factor for in-hospital mortality. Indeed, even after adjustment for comorbidity in a multivariate logistic regression analysis, IBD patients above age 65 had a sobering 3.9-fold greater risk of in-hospital mortality (Inflamm Bowel Dis. 2009 Feb;15[2]182-9).
Another piece of evidence that elderly-onset IBD isn’t less severe comes from a Canadian cohort study of all newly diagnosed cases of IBD in Ontario during 1999-2008. The elderly-onset ulcerative colitis patients were one-third more likely to undergo IBD-related surgery than those diagnosed at ages 18-40. Older-onset Crohn’s disease patients weren’t more likely to have IBD-related operations than younger-onset patients; however, IBD-specific mortality was significantly greater in elderly-onset Crohn’s disease patients than in those diagnosed in middle age or as young adults, by a margin of 33.1 cases to 5.6 cases to 1.0 case per 10,000 person-years (Inflamm Bowel Dis. 2017 Feb;23[2]:218-23).
Treatment of IBD in the elderly
Dr. Mahadevan emphasized that, if elderly patients need biologic therapy because their disease isn’t being adequately controlled with more conservative management strategies, then they should get it. The higher rates of IBD-related surgery and in-hospital mortality in elderly IBD patients argue in favor of that strategy in order to keep them out of the hospital and optimize quality of life.
Her go-to biologics in elderly IBD patients are vedolizumab (Entyvio) and ustekinumab (Stelara): “In my older patients I reach for these two first.”
This is because of the well-documented, excellent safety profiles of those two biologics, which are particularly relevant in an elderly population at increased background risk for lymphoma and serious infections. A pooled analysis of three clinical trials of ustekinumab in induction therapy for Crohn’s disease showed an adverse event risk no different from placebo (J Comp Eff Res. 2017 Oct;6[7]:601-12). Vedolizumab, like ustekinumab, doesn’t carry a black box warning for lymphoma, and the biologic had no increase in any infections in an analysis of six clinical trials entailing more than 4,800 person-years of vedolizumab exposure (Gut. 2017 May;66[5]:839-51).
She provided three illustrative clinical scenarios, each involving a 62-year-old fit and active patient. If that patient had newly diagnosed moderate to severe ulcerative colitis, had failed on 5-aminosalicylic acid, and had good symptomatic control on prednisone, that’s someone who needs a steroid-sparing drug, and she would choose vedolizumab based upon its track record. If that active 62-year-old had moderate to severe ileal and perianal Crohn’s disease, she would opt for ustekinumab or a tumor necrosis factor inhibitor. But if that older patient was hospitalized with newly diagnosed severe ulcerative colitis that was only partially responsive to intravenous steroids, she would eschew vedolizumab and ustekinumab and turn to infliximab (Remicade).
“That patient should get infliximab just like a 32-year-old would. You need to give this patient the best shot [at avoiding colectomy], and to this day the data still supports infliximab in that population,” Dr. Mahadevan said.
Complicating management in the elderly are the commonly encountered challenges posed by polypharmacy, frailty, history of skin cancer or solid organ tumors, and heart failure. In one study, older patients with Crohn’s disease were on an average of 10 medications, ulcerative colitis patients on nine. Forty percent of the patients had potential drug-drug interactions involving their IBD medications (Inflamm Bowel Dis. 2015 Jun;21[6]:1392-400). These are situations that require individually tailored immunosuppressive decision-making.
Dr. Mahadevan reported receiving research support from the Crohn’s and Colitis Foundation, Celgene, and Pfizer and serving as a consultant to those pharmaceutical companies as well as AbbVie, Janssen, and Takeda.
EXPERT ANALYSIS FROM GUILD 2018
Novel oral immunotherapy increased peanut tolerance in children, adults
ORLANDO – compared with those receiving placebo, according to research results.
Stacie M. Jones, MD, of the University of Arkansas and Arkansas Children’s Hospital, Little Rock, presented the late-breaking results from the pivotal PALISADE trial at the joint congress of the American Academy of Allergy, Asthma, and Immunology and the World Asthma Organization, in which Dr. Jones and her colleagues sought to examine the safety and efficacy of the novel oral immunotherapy AR101 for patients with peanut allergy.
At 12 months, 67% of patients who received AR101 tolerated 600 mg or more of peanut protein, compared with 4% of control patients (P less than .00001). The tolerance benefit for AR101 appeared to continue when the researchers evaluated 1,000 mg of peanut protein. A dose of 1,000 mg or more was tolerated by 50% of patients in the AR101 group, compared with 2.4% of patients in the control group (P less than .00001).
“Tolerance at 600 mg should indicate, not prove, but indicate that this therapy should be able to provide protection for the vast majority of individuals treated,” Dr. Jones said in an interview.
The majority of patients in the study experienced an adverse event; however, those who received AR101 experienced more events, and more events that were considered serious, she said. Patients in the treatment arm also experienced more treatment-related hypersensitivity, compared with patients in the placebo arm (14.5% vs. 3.2%), nearly all of which were mild to moderate.
It is important to note two key safety outcomes regarding AR101, Dr. Jones said. First, that one patient was diagnosed with eosinophilic esophagitis (EoE) during the study. “EoE has been a recurring theme with oral immunotherapy. Previous data showed EoE diagnoses in as many as 2%-5% of patients, and although one is certainly less than that, it is still important.”
Secondly, she pointed out that 6.7% of patients in the treatment group withdrew as a result of gastrointestinal adverse events. “This is a lower percentage than previously published data, but I don’t think you can understate this safety concern,” Dr. Jones said.
The efficacy of AR101 has prompted energy and hope for children with a peanut allergy. In the weeks following her presentation at AAAAI/WAO, Dr. Jones said she has been inundated with emails and calls from allergists asking for these data. However, she called for caution and patience, saying that it is important for the therapy to clear the appropriate steps in the process.
“This should not change clinical care that much in the next 12-18 months,” Dr. Jones said. “But it is very hopeful that this will be a new therapy on the market.”
The PALISADE trial was funded by Aimmune Therapeutics, and Dr. Jones reported holding an advisory board position for Aimmune Therapeutics, as well as having received other forms of support from biotech, pharmaceutical, and governmental organizations.
SOURCE: Jones SM et al. AAAAI/WAO Joint Congress, Abstract L6.
FROM AAAAI/WAO JOINT CONGRESS 2018
Key clinical point: A novel oral immunotherapy significantly improved peanut tolerance in children and adults with peanut allergy.
Major finding: Two-thirds of patients who received AR101 tolerated 600 mg or more of peanut protein, compared with 4% of patients who did not receive the novel oral immunotherapy.
Data source: The randomized, phase 3, double-blind, placebo-controlled PALISADE trial.
Disclosures: The study was funded by Aimmune Therapeutics. Dr. Jones reported holding an advisory board position with Aimmune Therapeutics.
Source: Jones SM et al. AAAAI/WAO Joint Congress, Abstract L6.
Omalizumab may help with chemotherapy hypersensitivity
ORLANDO – Omalizumab increased reaction-free rapid drug desensitization for patients with hypersensitivity to chemotherapy, according to research presented at the joint congress of the American Academy of Allergy, Asthma, and Immunology and the World Asthma Organization.

“In about 99% of patients, a desensitization protocol will be effective enough to allow patients to receive the relevant chemotherapy treatment,” Dr. Hong said in an interview. “However, in a small minority of patents, no matter what we try, we simply cannot desensitize them – those are the patients we looked at in this study.”
Patients received 300 mg of omalizumab every 4 weeks for three treatment sessions. During the 12-week treatment period, patients continued their normal chemotherapy regimens via rapid drug desensitization following protocols previously published by Castelles et al.
The primary outcome was the number of rapid drug desensitizations that were free from hypersensitivity reactions. In a secondary analysis, the researchers compared results of chemotherapy skin tests taken before and after the trial.
Of the five patients included in the study, four were female, received carboplatin, and had a skin tests, while the fifth patient was male, received rituximab, and did not receive a skin test.
In an intention-to-treat approach, Dr. Hong and his colleagues reported that 33% of all rapid drug desensitizations for omalizumab had no reaction.
In the poster, the researchers noted that these data could be significant because the 95% confidence interval for nonreactivity on omalizumab ranged from 11% to 98%.
“This is a unique situation,” Dr. Hong said in an interview. Because ovarian cancer diagnoses tend to come later in the disease course, patients often can receive extended chemotherapy regimens to treat disease metastases.
He speculated that there could be more uses for omalizumab. “In this study, we looked at the most sensitive patients, but perhaps this drug could have a significant impact on patients with a more mild form of sensitivity,” Dr. Hong said. “Maybe [omalizumab] could take the place of desensitization for patients with a milder sensitivity – we don’t know.”
Dr. Hong reports no relevant financial disclosures. Novartis Pharmaceuticals funded this research and provided omalizumab.
SOURCE: Hong DI et al. AAAAI/WAO Joint Congress, Poster L33.
ORLANDO – Omalizumab increased reaction-free rapid drug desensitization for patients with hypersensitivity to chemotherapy, according to research presented at the joint congress of the American Academy of Allergy, Asthma, and Immunology and the World Asthma Organization.
“In about 99% of patients, a desensitization protocol will be effective enough to allow patients to receive the relevant chemotherapy treatment,” Dr. Hong said in an interview. “However, in a small minority of patents, no matter what we try, we simply cannot desensitize them – those are the patients we looked at in this study.”
Patients received 300 mg of omalizumab every 4 weeks for three treatment sessions. During the 12-week treatment period, patients continued their normal chemotherapy regimens via rapid drug desensitization following protocols previously published by Castelles et al.
The primary outcome was the number of rapid drug desensitizations that were free from hypersensitivity reactions. In a secondary analysis, the researchers compared results of chemotherapy skin tests taken before and after the trial.
Of the five patients included in the study, four were female, received carboplatin, and had a skin tests, while the fifth patient was male, received rituximab, and did not receive a skin test.
In an intention-to-treat approach, Dr. Hong and his colleagues reported that 33% of all rapid drug desensitizations for omalizumab had no reaction.
In the poster, the researchers noted that these data could be significant because the 95% confidence interval for nonreactivity on omalizumab ranged from 11% to 98%.
“This is a unique situation,” Dr. Hong said in an interview. Because ovarian cancer diagnoses tend to come later in the disease course, patients often can receive extended chemotherapy regimens to treat disease metastases.
He speculated that there could be more uses for omalizumab. “In this study, we looked at the most sensitive patients, but perhaps this drug could have a significant impact on patients with a more mild form of sensitivity,” Dr. Hong said. “Maybe [omalizumab] could take the place of desensitization for patients with a milder sensitivity – we don’t know.”
Dr. Hong reports no relevant financial disclosures. Novartis Pharmaceuticals funded this research and provided omalizumab.
SOURCE: Hong DI et al. AAAAI/WAO Joint Congress, Poster L33.
REPORTING FROM AAAAI/WAO JOINT CONGRESS
Key clinical point: Omalizumab increased reaction-free rapid drug desensitization for patients with hypersensitivity to chemotherapy.
Major finding: Despite low enrollment, omalizumab appeared to significantly increase the number of reaction-free rapid drug desensitizations.
Data source: A 12-week, open-label, non-randomized trial of omalizumab.
Disclosures: Dr. Hong reports no relevant financial disclosures. Novartis Pharmaceuticals funded the research and provided omalizumab.
Source: Hong DI et al. AAAAI/WAO Joint Congress, Poster L33.
Early family intervention tied to reduced AUDs in Mexican American youth
A family-focused middle school intervention can help reduce alcohol abuse and alcohol use disorders (AUD) in Mexican American adolescents who are at heightened risk for problem drinking, according to Nancy A. Gonzales, PhD, and her associates.
The report was published March 21 in JAMA Psychiatry.
The investigators examined 5-year follow-up results of a randomized controlled trial, Bridges/Puentes, a 9-week, evidence-based intervention aimed at helping urban, low-income Mexican American teens succeed at school. Among other features, the Bridges/Puentes intervention promoted cultural strengths that had been identified in previous interventions aimed at Latino youth.
“This blend of evidence-based practices and good recruitment rates, retention, and fidelity provided a strong foundation for testing the sustained results of middle school prevention for Latinos,” wrote Dr. Gonzales of the department of psychology and the REACH Institute at Arizona State University, Tempe, and her associates.
The study’s focus on Mexican American youth, which makes it difficult to generalize the results to other populations, was a limitation, the authors noted. Nevertheless, the intervention “is a viable method to not only reduce substance use initiation in the short-term ... but also to reduce later rates of AUDs and alcohol misuse among Mexican American adolescents at heightened risk for problem drinking,” they wrote.
The study was funded by the National Institute of Mental Health. No conflicts of interest were reported.
SOURCE: Gonzales NA et al. doi: 10.1001/jamapsychiatry.2018.0058.
FROM JAMA PSYCHIATRY
TACE plus radiotherapy improves outcomes in poor-prognosis hepatocellular carcinoma
Use of transarterial chemoembolization (TACE) plus external beam radiotherapy may improve outcomes in patients with hepatocellular carcinoma (HCC) showing macroscopic vascular invasion, according to results of a recent randomized study.
The TACE plus radiotherapy approach was well tolerated and improved progression-free survival compared with sorafenib treatment, investigators wrote. The report was published in JAMA Oncology.
“The results of this study represent a significant advance in addressing an urgent unmet need in treating patients with advanced HCC,” noted Sang Min Yoon, MD, PhD, of the department of radiation oncology, University of Ulsan College of Medicine, Seoul, Republic of Korea, and coauthors.
Patients with HCC that shows macroscopic vascular invasion are a particularly poor prognosis subset, according to Dr. Yoon and coauthors.
“Sorafenib is the sole treatment option for these patients, with unsatisfactory response and survival benefit,” they wrote.
Building on observational studies suggesting TACE plus external beam therapy may be a promising approach, Dr. Yoon and colleagues initiated a randomized, open-label clinical trial including 90 patients with liver-confined HCC and macroscopic vascular invasion.
Patients were randomized to sorafenib either 400 mg twice daily or TACE every 6 weeks plus radiotherapy starting within 3 weeks of the first TACE, according to the study description.
The primary endpoint, 12-week progression-free survival, was 86.7% for patients receiving TACE plus radiotherapy, versus 34.3% for patients receiving sorafenib (P less than .001).
The TACE plus radiotherapy group also had a significantly longer overall survival (55.0 vs. 43.0 weeks; P = .04), as well as a significantly higher radiologic response rate and significantly longer median time to progression, the authors reported.
Five patients (11.1%) in the TACE plus radiotherapy group were able to undergo curative surgical resection due to downstaging.
The risk of TACE-induced liver failure is a concern based on results of previous studies in patients with HCC and macroscopic vascular invasion, but in this study, there were no discontinuations due to adverse events in the TACE-radiation group, the authors noted.
“Our study may not be large enough to accurately establish the incidence of adverse events,” they wrote. “However, considering the dismal prognosis, the superior efficacy of TACE plus RT vs. sorafenib may justify its use for these patients.”
Dr. Yoon reported no disclosures related to the study. One coauthor reported research funding and advisory board membership with Bayer Healthcare and Gilead Sciences.
SOURCE: Yoon SM et al. 2018 Mar 15 JAMA Oncol. doi: 10.1001/jamaoncol.2017.5847.
Despite some limitations, the research by Yoon and colleagues provides “much-needed prospective data” suggesting that multimodality therapy may improve the dismal prognosis of patients with hepatocellular carcinoma (HCC) with portal venous invasion, according to authors of an editorial on the study.
“Existing treatments demonstrate poor efficacy for HCC with portal venous invasion, with subgroup analyses in early major prospective trials showing modest, if any, benefits of therapy beyond the natural history of the disease,” wrote editorial authors Khashayar Farsad, MD, PhD, Charlotte E. Costentin, MD, and Andrew X. Zhu, MD, PhD.
The data from Yoon et al. not only support a role for locoregional therapy in this challenging patient subgroup, but also suggest external beam radiotherapy is an “asset in the locoregional therapy toolbox,” they wrote.
In the study, use of transarterial chemoembolization (TACE) plus external beam radiotherapy improved the primary endpoint of 12-week progression-free survival versus sorafenib (86.7% versus 34.3%, respectively; P less than .001), among other improved outcomes, they noted.
That is “impressive” but certain caveats must be considered if extrapolating the data from this small study to clinical practice, they added. For example, most of the patients had liver disease related to hepatitis B virus; compared with patients with liver disease related to hepatitis C virus, that subset of patients may have worse outcomes on sorafenib, the authors wrote.
The TACE protocol used in the study included cisplatin, which is not universally used because of availability or practice patterns, they added. Moreover, a median of four treatments were delivered, while many centers use repeat TACE only when needed (e.g., due to residual disease).
Limitations aside, the study results provide prospective evidence that more effective treatment strategies for HCC with portal venous invasion may be established, according to the authors.
“For those of us managing these patients daily in our clinics and procedure suites, it is encouraging to know there is hope ahead,” they said. “Work in this realm is just beginning, highlighting the need for additional prospective studies to validate and optimize these findings in other patient populations.”
Dr. Farsad is with the Charles T. Dotter Department of Interventional Radiology, Oregon Health & Science University, Portland. Dr. Costentin and Dr. Zhu are with Massachusetts General Hospital Cancer Center, Harvard Medical School, Boston. These comments are derived from their editorial (JAMA Oncol. 2018 Mar 15. doi: 10.1001/jamaoncol.2018.0007). The authors reported no conflict of interest disclosures related to their editorial.
Use of transarterial chemoembolization (TACE) plus external beam radiotherapy may improve outcomes in patients with hepatocellular carcinoma (HCC) showing macroscopic vascular invasion, according to results of a recent randomized study.
The TACE plus radiotherapy approach was well tolerated and improved progression-free survival compared with sorafenib treatment, investigators wrote. The report was published in JAMA Oncology.
“The results of this study represent a significant advance in addressing an urgent unmet need in treating patients with advanced HCC,” noted Sang Min Yoon, MD, PhD, of the department of radiation oncology, University of Ulsan College of Medicine, Seoul, Republic of Korea, and coauthors.
Patients with HCC that shows macroscopic vascular invasion are a particularly poor prognosis subset, according to Dr. Yoon and coauthors.
“Sorafenib is the sole treatment option for these patients, with unsatisfactory response and survival benefit,” they wrote.
Building on observational studies suggesting TACE plus external beam therapy may be a promising approach, Dr. Yoon and colleagues initiated a randomized, open-label clinical trial including 90 patients with liver-confined HCC and macroscopic vascular invasion.
Patients were randomized to sorafenib either 400 mg twice daily or TACE every 6 weeks plus radiotherapy starting within 3 weeks of the first TACE, according to the study description.
The primary endpoint, 12-week progression-free survival, was 86.7% for patients receiving TACE plus radiotherapy, versus 34.3% for patients receiving sorafenib (P less than .001).
The TACE plus radiotherapy group also had a significantly longer overall survival (55.0 vs. 43.0 weeks; P = .04), as well as a significantly higher radiologic response rate and significantly longer median time to progression, the authors reported.
Five patients (11.1%) in the TACE plus radiotherapy group were able to undergo curative surgical resection due to downstaging.
The risk of TACE-induced liver failure is a concern based on results of previous studies in patients with HCC and macroscopic vascular invasion, but in this study, there were no discontinuations due to adverse events in the TACE-radiation group, the authors noted.
“Our study may not be large enough to accurately establish the incidence of adverse events,” they wrote. “However, considering the dismal prognosis, the superior efficacy of TACE plus RT vs. sorafenib may justify its use for these patients.”
Dr. Yoon reported no disclosures related to the study. One coauthor reported research funding and advisory board membership with Bayer Healthcare and Gilead Sciences.
SOURCE: Yoon SM et al. 2018 Mar 15 JAMA Oncol. doi: 10.1001/jamaoncol.2017.5847.
FROM JAMA ONCOLOGY
Key clinical point: Use of transarterial chemoembolization (TACE) plus external beam radiotherapy may improve outcomes in patients with hepatocellular carcinoma (HCC) showing macroscopic vascular invasion.
Major finding: Progression-free survival at 12 weeks was 86.7% for patients receiving TACE plus radiotherapy group, versus 34.3% for patients receiving sorafenib (P less than .001).
Study details: A randomized, open-label clinical trial of 90 patients with liver-confined HCC and macroscopic vascular invasion.
Disclosures: One author reported research funding and advisory board membership with Bayer Healthcare and Gilead Sciences.
Source: Yoon SM et al. JAMA Oncol. 2018 Mar 15. doi: 10.1001/jamaoncol.2017.5847.
2018 ACTRIMS Post Meeting Highlights
HIV+ dialysis patients: Differential survival by race compared with HIV/HCV coinfection
who have end-stage renal disease, according to a study published in Kidney International.
Nonwhites fared significantly worse in survival than did the white cohort when both groups were infected with HIV alone, but the two groups fared similarly badly when coinfected with HIV and HCV, according to Deirdre L. Sawinski, MD, assistant professor at the University of Pennsylvania, Philadelphia, and assistant medical director, Penn Kidney Pancreas Transplant Program, and her colleagues.
They found that HIV infection was not associated with a higher risk of death in white patients (hazard ratio, 1.03), in contrast to HIV/HCV coinfection, which was significantly associated with a higher mortality (HR, 1.48). However, in the nonwhite patients, HIV infection (HR, 1.44) and HIV/HCV coinfection (HR, 1.71) were both significantly associated with increased mortality.
“HIV infection remains associated with inferior dialysis survival for [nonwhites], even in the contemporary era and with widespread ART use,” Dr. Sawinski and her colleagues summarized. “Although the underlying mechanisms of these racial disparities require further elucidation, bias within the health care system could contribute to worse outcomes for [nonwhite] individuals who have HIV, and dialysis providers should work to eliminate disparities in care wherever they are identified.”
They recommended early nephrology referral for transition to renal replacement therapy and care coordination with infectious disease and hepatology specialists, including evaluation for home dialysis, to improve the chances of survival in these patients. Given the added risk of death in coinfected individuals, they also suggested that therapy for HCV may be beneficial.
One author consulted on a project related to hyperkalemia and hyperphosphatemia in dialysis patients and has grant funding from Merck on treating hepatitis C infection after kidney transplantation. The other authors had no disclosures.
FROM KIDNEY INTERNATIONAL
Key clinical point: Race is significantly associated with mortality in HIV-infected dialysis patients.
Major finding: HIV infection is associated with a significant reduction in dialysis survival for nonwhites; HIV/HCV coinfection is associated with impaired survival regardless of race/ethnicity.
Study details: Survival on dialysis of 5,348 HIV-infected individuals and 1,863 HIV/HCV coinfected individuals was retrospectively compared with an HIV/HCV reference cohort.
Disclosures: One author consulted on a project related to hyperkalemia and hyperphosphatemia in dialysis patients, and has grant funding from Merck in support of treating hepatitis C after kidney transplantation. The other authors had no disclosures.
Source: Sawinski et al. Kidney Int. 2018;93(3):706-15.
Justices appear skeptical of California’s abortion speech law
A California law that requires anti-abortion crisis pregnancy centers to provide women with information on abortion services was met with skepticism by U.S. Supreme Court justices during March 20 oral arguments.
The case revolves around California’s 2016 Reproductive Freedom, Accountability, Comprehensive Care, and Transparency (FACT) Act, which requires that pregnancy centers – many of which are anti-abortion – post notices about where patients can find free or low-cost abortion services. Another part of the law requires unlicensed pregnancy centers to disclose to women that they are not a licensed medical facility and have no medical professionals on staff.
The plaintiffs, led by the nonprofit National Institute of Family and Life Advocates (NIFLA), argue that the law violates the First Amendment by requiring speech and because the measure unfairly targets centers that discourage abortions. California officials contend that the law was needed to address concerns that nonprofit organizations, often religious, were misrepresenting themselves as full-service reproductive health clinics and misleading women about their options.
During oral arguments, justices peppered Joshua Klein, California deputy solicitor general, with questions about the law’s intent and why it appeared to single out certain pregnancy centers. Associate Justice Samuel Alito Jr., who is considered to be among the high court’s conservative members, asked why the law did not apply to for-profit centers.
“If you have a law that’s neutral on its face, but then it has a lot of crazy exemptions, and when you apply all the exemptions, what you’re left with is a very strange pattern and, gee, it turns out that just about the only clinics that are covered by this are pro-life clinics,” Justice Alito said during arguments. “Do you think it’s possible to infer intentional discrimination in that situation? Why does [the law] apply only for nonprofits and not for-profits? If the purpose is to get this information out to poor women, don’t you think there are examples of poor women who stumble into a for-profit facility?”
Mr. Klein responded that the law was designed to address scenarios in the state in which more transparency was needed.
“Your Honor, as a category, for-profit clinics do not seem to treat primarily women who need free and sliding-cost scale care in the same way,” Mr. Klein said. “Now I will say it’s always possible to imagine a new boundary for the law. But under intermediate scrutiny, a law does not need to be perfect and a legislature can concentrate its efforts at where the need for the law is most apparent.”
Associate Justice Elena Kagan, considered to be among the more liberal justices, raised a similar point when she expressed concern that the law had been “gerrymandered” to address some centers, but not others.
“There is a sense when you read this statute, Mr. Klein, there’s at least a question that arises as to whether this statute has been gerrymandered,” Justice Kagan said during arguments. “Because if it has been gerrymandered, that’s a serious issue. In other words, if, you know, it’s like, look, we have these general disclosure requirements, but we don’t really want to apply them generally, we just want to apply them to some speakers whose speech we don’t much like.”
Meanwhile, Associate Justice Sonia Sotomayor appeared to give credence to the California law, expressing doubt that the plaintiff’s activities were ethical and legitimate. She noted that she visited a website of one of the plaintiffs – Fallbrook Pregnancy Resource Center – and found photos of people in nurse uniforms standing next to an ultrasound machine as well as text that stated that staff will “educate clients about different abortion methods available and describe in medical terms different abortion procedures.”
“The website also says clients will be evaluated by nurses and that they follow all HIPAA regulations, which if they’re not a medical provider, they don’t have to follow,” Justice Sotomayor said. “If a reasonable person could look at this website and think that you’re giving medical advice, would the unlicensed notice be wrong?”
NIFLA attorney Michael Farris did not have a chance to respond to Justice Sotomayor’s question, but he argued throughout the session that California’s law takes an unjust aim at “pro-life pregnancy centers” by compelling licensed centers to point the way to an abortion and imposing onerous advertising rules on unlicensed centers.
In the end, both sides faced difficult questions from the justices about complex constitutional issues, said Heather Shumaker, an attorney for the National Women’s Law Center in Washington, who attended the oral arguments. The law center joined an amicus brief in the case in support of California.

However, Ms. Shumaker said her overall impression was that the arguments made clear the strong reasoning behind California’s law and its importance.
“I am confident that at least some members of the Supreme Court understood what was at stake here and understand that there is a layer of deception behind the actions of the anti-abortion centers,” she said in an interview.
Paul Sherman, a senior attorney for the Institute for Justice in Arlington, Va., said that based on the oral arguments, it appears likely California’s law will be struck down. Mr. Sherman coauthored the Institute for Justice’s amicus brief in support of NIFLA.

A number of physician associations have weighed in on NIFLA v. Becerra. The American Medical Association issued a court brief in support of California and the American College of Obstetricians and Gynecologists and the American Academy of Pediatrics joined several other medical associations in a similar brief. The American Association of Pro-Life Obstetrician and Gynecologists joined the Christian Medical Association and others to submit a brief in support of NIFLA.
The Supreme Court is expected to rule on the case by this summer.
A California law that requires anti-abortion crisis pregnancy centers to provide women with information on abortion services was met with skepticism by U.S. Supreme Court justices during March 20 oral arguments.
The case revolves around California’s 2016 Reproductive Freedom, Accountability, Comprehensive Care, and Transparency (FACT) Act, which requires that pregnancy centers – many of which are anti-abortion – post notices about where patients can find free or low-cost abortion services. Another part of the law requires unlicensed pregnancy centers to disclose to women that they are not a licensed medical facility and have no medical professionals on staff.
The plaintiffs, led by the nonprofit National Institute of Family and Life Advocates (NIFLA), argue that the law violates the First Amendment by requiring speech and because the measure unfairly targets centers that discourage abortions. California officials contend that the law was needed to address concerns that nonprofit organizations, often religious, were misrepresenting themselves as full-service reproductive health clinics and misleading women about their options.
During oral arguments, justices peppered Joshua Klein, California deputy solicitor general, with questions about the law’s intent and why it appeared to single out certain pregnancy centers. Associate Justice Samuel Alito Jr., who is considered to be among the high court’s conservative members, asked why the law did not apply to for-profit centers.
“If you have a law that’s neutral on its face, but then it has a lot of crazy exemptions, and when you apply all the exemptions, what you’re left with is a very strange pattern and, gee, it turns out that just about the only clinics that are covered by this are pro-life clinics,” Justice Alito said during arguments. “Do you think it’s possible to infer intentional discrimination in that situation? Why does [the law] apply only for nonprofits and not for-profits? If the purpose is to get this information out to poor women, don’t you think there are examples of poor women who stumble into a for-profit facility?”
Mr. Klein responded that the law was designed to address scenarios in the state in which more transparency was needed.
“Your Honor, as a category, for-profit clinics do not seem to treat primarily women who need free and sliding-cost scale care in the same way,” Mr. Klein said. “Now I will say it’s always possible to imagine a new boundary for the law. But under intermediate scrutiny, a law does not need to be perfect and a legislature can concentrate its efforts at where the need for the law is most apparent.”
Associate Justice Elena Kagan, considered to be among the more liberal justices, raised a similar point when she expressed concern that the law had been “gerrymandered” to address some centers, but not others.
“There is a sense when you read this statute, Mr. Klein, there’s at least a question that arises as to whether this statute has been gerrymandered,” Justice Kagan said during arguments. “Because if it has been gerrymandered, that’s a serious issue. In other words, if, you know, it’s like, look, we have these general disclosure requirements, but we don’t really want to apply them generally, we just want to apply them to some speakers whose speech we don’t much like.”
Meanwhile, Associate Justice Sonia Sotomayor appeared to give credence to the California law, expressing doubt that the plaintiff’s activities were ethical and legitimate. She noted that she visited a website of one of the plaintiffs – Fallbrook Pregnancy Resource Center – and found photos of people in nurse uniforms standing next to an ultrasound machine as well as text that stated that staff will “educate clients about different abortion methods available and describe in medical terms different abortion procedures.”
“The website also says clients will be evaluated by nurses and that they follow all HIPAA regulations, which if they’re not a medical provider, they don’t have to follow,” Justice Sotomayor said. “If a reasonable person could look at this website and think that you’re giving medical advice, would the unlicensed notice be wrong?”
NIFLA attorney Michael Farris did not have a chance to respond to Justice Sotomayor’s question, but he argued throughout the session that California’s law takes an unjust aim at “pro-life pregnancy centers” by compelling licensed centers to point the way to an abortion and imposing onerous advertising rules on unlicensed centers.
In the end, both sides faced difficult questions from the justices about complex constitutional issues, said Heather Shumaker, an attorney for the National Women’s Law Center in Washington, who attended the oral arguments. The law center joined an amicus brief in the case in support of California.
However, Ms. Shumaker said her overall impression was that the arguments made clear the strong reasoning behind California’s law and its importance.
“I am confident that at least some members of the Supreme Court understood what was at stake here and understand that there is a layer of deception behind the actions of the anti-abortion centers,” she said in an interview.
Paul Sherman, a senior attorney for the Institute for Justice in Arlington, Va., said that based on the oral arguments, it appears likely California’s law will be struck down. Mr. Sherman coauthored the Institute for Justice’s amicus brief in support of NIFLA.
A number of physician associations have weighed in on NIFLA v. Becerra. The American Medical Association issued a court brief in support of California and the American College of Obstetricians and Gynecologists and the American Academy of Pediatrics joined several other medical associations in a similar brief. The American Association of Pro-Life Obstetrician and Gynecologists joined the Christian Medical Association and others to submit a brief in support of NIFLA.
The Supreme Court is expected to rule on the case by this summer.
Increasing Diversity in the Dermatology Workforce

Allopurinol dose not escalated enough to reduce mortality
An allopurinol dose escalation strategy for patients with gout was associated with a small increase in all-cause mortality when compared against a static dosing strategy, results of a recent observational study show.
Allopurinol dose escalation was also associated with small, but not statistically significant, increases in cardiovascular- and cancer-related mortality, investigators said in a report published in Arthritis & Rheumatology.

Dr. Coburn and his colleagues had hypothesized that dose escalation would instead be associated with lower cause-specific cardiovascular and cancer mortality, compared with static dosing, according to the report.
However, a minority of dose-escalated patients achieved serum urate goal. Thus, inadequate escalation may have obscured any potential mortality benefit associated with the treatment strategy, the investigators suggested.
Current guidelines recommend starting gout patients on a low dose of allopurinol (100 mg/day or less) and then titrating up the dose slowly.
“While randomized, controlled trials of urate-lowering therapies have used static dosing strategies, such strategies are suboptimal and should now be considered unethical,” they wrote.
The researchers’ 10-year, observational, active-comparator study included 6,428 U.S. veterans with gout receiving allopurinol according to a dose escalation strategy, and 6,428 matched individuals not treated with an escalation approach.
Dose escalators had significantly increased all-cause mortality (hazard ratio, 1.08; 95% confidence interval, 1.01-1.17). Similar, but not statistically significant, effect sizes were seen for cardiovascular mortality (HR, 1.08; 95% CI, 0.97-1.21) and cancer mortality (HR, 1.06; 95% CI, 0.88-1.27), the investigators reported.
However, only 10% of dose-escalation patients received allopurinol in doses exceeding 300 mg daily, and only about one-third achieved a serum urate goal of less than 6.0 mg/dL after 2 years, they found.
“Patients receiving urate-lowering therapy dose escalation were only rarely escalated to levels typically required for proper gout control,” the investigators said.
Inadequate dose escalation amounts to “clinical inertia” that limited the ability of the study to show how optimal dose escalation may affect mortality, the investigators said.
“This appears to be particularly relevant since gout patients receiving dose escalation and achieving serum urate goal appeared to have lower cardiovascular mortality in sensitivity analyses,” they noted.
There was a 7% reduction in cardiovascular mortality in a sensitivity analysis limited to dose escalators who achieved goal, though that finding did not reach statistical significance, Dr. Coburn and his coinvestigators reported (HR, 0.93; 95% CI, 0.76-1.14).
“Taken together, these results add to the persistent uncertainty regarding the role of urate-lowering therapy in reducing mortality risk,” the investigators concluded.
The study was supported by a Rheumatology Research Foundation Health Professional Research Preceptorship, a University of Nebraska Medical Center Graduate Fellowship Grant, and the Nebraska Arthritis Outcomes Research Center. No information was provided on author disclosures.
SOURCE: Coburn B et al. Arthritis Rheumatol. 2018 Mar 7. doi: 10.1002/art.40486.
An allopurinol dose escalation strategy for patients with gout was associated with a small increase in all-cause mortality when compared against a static dosing strategy, results of a recent observational study show.
Allopurinol dose escalation was also associated with small, but not statistically significant, increases in cardiovascular- and cancer-related mortality, investigators said in a report published in Arthritis & Rheumatology.
Dr. Coburn and his colleagues had hypothesized that dose escalation would instead be associated with lower cause-specific cardiovascular and cancer mortality, compared with static dosing, according to the report.
However, a minority of dose-escalated patients achieved serum urate goal. Thus, inadequate escalation may have obscured any potential mortality benefit associated with the treatment strategy, the investigators suggested.
Current guidelines recommend starting gout patients on a low dose of allopurinol (100 mg/day or less) and then titrating up the dose slowly.
“While randomized, controlled trials of urate-lowering therapies have used static dosing strategies, such strategies are suboptimal and should now be considered unethical,” they wrote.
The researchers’ 10-year, observational, active-comparator study included 6,428 U.S. veterans with gout receiving allopurinol according to a dose escalation strategy, and 6,428 matched individuals not treated with an escalation approach.
Dose escalators had significantly increased all-cause mortality (hazard ratio, 1.08; 95% confidence interval, 1.01-1.17). Similar, but not statistically significant, effect sizes were seen for cardiovascular mortality (HR, 1.08; 95% CI, 0.97-1.21) and cancer mortality (HR, 1.06; 95% CI, 0.88-1.27), the investigators reported.
However, only 10% of dose-escalation patients received allopurinol in doses exceeding 300 mg daily, and only about one-third achieved a serum urate goal of less than 6.0 mg/dL after 2 years, they found.
“Patients receiving urate-lowering therapy dose escalation were only rarely escalated to levels typically required for proper gout control,” the investigators said.
Inadequate dose escalation amounts to “clinical inertia” that limited the ability of the study to show how optimal dose escalation may affect mortality, the investigators said.
“This appears to be particularly relevant since gout patients receiving dose escalation and achieving serum urate goal appeared to have lower cardiovascular mortality in sensitivity analyses,” they noted.
There was a 7% reduction in cardiovascular mortality in a sensitivity analysis limited to dose escalators who achieved goal, though that finding did not reach statistical significance, Dr. Coburn and his coinvestigators reported (HR, 0.93; 95% CI, 0.76-1.14).
“Taken together, these results add to the persistent uncertainty regarding the role of urate-lowering therapy in reducing mortality risk,” the investigators concluded.
The study was supported by a Rheumatology Research Foundation Health Professional Research Preceptorship, a University of Nebraska Medical Center Graduate Fellowship Grant, and the Nebraska Arthritis Outcomes Research Center. No information was provided on author disclosures.
SOURCE: Coburn B et al. Arthritis Rheumatol. 2018 Mar 7. doi: 10.1002/art.40486.
FROM ARTHRITIS & RHEUMATOLOGY
Key clinical point:
Major finding: Patients treated with a dose escalation strategy had a small but statistically significant increase in all-cause mortality, compared with non-escalators (HR, 1.08; 95% CI, 1.01-1.17).
Study details: A 10-year observational, active-comparator study of U.S. veterans with gout who initiated allopurinol, including 6,428 dose escalators and 6,428 non-escalators.
Disclosures: The study was supported by a Rheumatology Research Foundation Health Professional Research Preceptorship, a University of Nebraska Medical Center Graduate Fellowship Grant, and the Nebraska Arthritis Outcomes Research Center. No information was provided on author disclosures.
Source: Coburn B et al. Arthritis Rheumatol. 2018 Mar 7. doi: 10.1002/art.40486.