User login
Single-item scale effective for assessing sleep quality
The single-item sleep quality scale (SQS) produced favorable results comparable to other complex, time-intensive assessment tools, according to findings published in the Journal of Clinical Sleep Medicine.

In a study of 70 insomnia patients and 651 depression patients, concurrent criterion validity analysis yielded strong correlations between the SQS and the morning-questionnaire insomnia (MQI) and Pittsburgh Sleep Quality Index (PSQI) in patients with insomnia and depression, respectively. The investigators wrote, “The single-item format enables a patient-reported rating of sleep quality over a 7-day recall period without greatly increasing the patient’s burden. The use of a discretizing visual analog scale (VAS) increases the potential for a more sensitive measurement.” The SQS is a quick but accurate self-reported assessment of sleep quality.
The SQS was validated based on two studies. Eligible patients in the 4-week, randomized, multicenter insomnia study were aged 30-75 years and were receiving a Food and Drug Administration–approved hypnotic agent as usual treatment for insomnia based on criteria from the Diagnostic and Statistical Manual of Mental Disorders, Fourth Edition (DSM-IV). The MQI was used daily for the duration of the study, wrote Ellen Snyder, PhD, of Merck & Co., in Kenilworth, N.J., and her coauthors.
The depression study was a randomized, double-blind, parallel-group, 12-month international trial evaluating the safety of the substance P antagonist aprepitant, compared with paroxetine hydrochloride. Patients were aged 18 years or older, with a DSM-IV diagnosis of major depressive disorder. Patients completed the SQS and PSQI at baseline, week 1, and week 8.
In insomnia patients, a Pearson correlation of –.76 was found at week 1 for the SQS in relation to the MQI.
In patients with depression, Goodman-Kruskal correlation coefficients for the SQS in relation to the Pittsburgh Sleep Quality Index (PSQI) were –.87, –.88, and –.92 at baseline, week 1, and week 8, respectively.
Correlations were negative because “better sleep quality is associated with a lower score on the MQI and PSQI, but a higher score on the SQS,” the authors noted.
The results support the use of the SQS as a “practical sleep measure that can effectively gauge sleep quality without significantly increasing the burden of clinical trial participants,” compared with lengthier assessments such as the MQI and PSQI, they added.
Funding for the study was provided by Merck Sharp & Dohme.
SOURCE: Snyder E et al. J Clin Sleep Med. 2018;14(11):1849-57.
The single-item sleep quality scale (SQS) produced favorable results comparable to other complex, time-intensive assessment tools, according to findings published in the Journal of Clinical Sleep Medicine.
In a study of 70 insomnia patients and 651 depression patients, concurrent criterion validity analysis yielded strong correlations between the SQS and the morning-questionnaire insomnia (MQI) and Pittsburgh Sleep Quality Index (PSQI) in patients with insomnia and depression, respectively. The investigators wrote, “The single-item format enables a patient-reported rating of sleep quality over a 7-day recall period without greatly increasing the patient’s burden. The use of a discretizing visual analog scale (VAS) increases the potential for a more sensitive measurement.” The SQS is a quick but accurate self-reported assessment of sleep quality.
The SQS was validated based on two studies. Eligible patients in the 4-week, randomized, multicenter insomnia study were aged 30-75 years and were receiving a Food and Drug Administration–approved hypnotic agent as usual treatment for insomnia based on criteria from the Diagnostic and Statistical Manual of Mental Disorders, Fourth Edition (DSM-IV). The MQI was used daily for the duration of the study, wrote Ellen Snyder, PhD, of Merck & Co., in Kenilworth, N.J., and her coauthors.
The depression study was a randomized, double-blind, parallel-group, 12-month international trial evaluating the safety of the substance P antagonist aprepitant, compared with paroxetine hydrochloride. Patients were aged 18 years or older, with a DSM-IV diagnosis of major depressive disorder. Patients completed the SQS and PSQI at baseline, week 1, and week 8.
In insomnia patients, a Pearson correlation of –.76 was found at week 1 for the SQS in relation to the MQI.
In patients with depression, Goodman-Kruskal correlation coefficients for the SQS in relation to the Pittsburgh Sleep Quality Index (PSQI) were –.87, –.88, and –.92 at baseline, week 1, and week 8, respectively.
Correlations were negative because “better sleep quality is associated with a lower score on the MQI and PSQI, but a higher score on the SQS,” the authors noted.
The results support the use of the SQS as a “practical sleep measure that can effectively gauge sleep quality without significantly increasing the burden of clinical trial participants,” compared with lengthier assessments such as the MQI and PSQI, they added.
Funding for the study was provided by Merck Sharp & Dohme.
SOURCE: Snyder E et al. J Clin Sleep Med. 2018;14(11):1849-57.
FROM THE JOURNAL OF CLINICAL SLEEP MEDICINE
Key clinical point: The
Major finding: Week 1 Pearson correlation was –0.76 between the SQS and the morning-questionnaire insomnia (MQI); week 8 Goodman-Kruskal correlation between SQS and the Pittsburgh Sleep Quality Index (PSQI) was –0.92.
Study details: An analysis of SQS versus other measures in 70 insomnia patients and 651 depression patients.
Disclosures: Funding for the study was provided by Merck Sharp & Dohme.
Source: Snyder E et al. J Clin Sleep Med. 2018;14(11):1849-57
CDC: Acute flaccid myelitis on the decline for 2018
, according to the Centers for Disease Control and Prevention.
![]()
Through Nov. 30, 134 cases of AFM in 33 states have been confirmed out of the 299 reported to the CDC. That represents “an increase of 18 confirmed cases from the previous week, but most of the latest confirmed AFM cases occurred in September and October,” the CDC reported Dec. 3.
There has been a pattern of increased AFM cases every other year for the previous 4 years: 120 cases in 2014, 22 cases in 2015, 149 cases in 2016, and 33 cases in 2017. “Most cases are reported between August and October, and a marked reduction in cases is seen in November. That pattern appears to be repeating in 2018 because states have reported fewer [persons under investigation] over the past couple of weeks. CDC expects this decline to continue,” the statement said.
The 16 confirmed cases in Texas are the most for any state this year, followed by Colorado with 15; Ohio with 10; and Illinois, New Jersey, and Washington with 9 each. California and Florida have not had any confirmed cases as of Nov. 30. Since 2014, over 90% of all confirmed AFM cases have occurred in children, the CDC noted.
More information on AFM is available at a CDC website for health care professionals.
Cold packs help reduce pain after laparoscopic hysterectomy
LAS VEGAS – Patients like cold packs for pain control after laparoscopic hysterectomy, according to a small trial from Cleveland Clinic Florida (Weston).
Cold packs have been shown to reduce pain in other types of surgery, so investigators at the clinic wanted to try them out for the procedure, said study lead Pamela Frazzini Padilla, MD, an ob.gyn. at the clinic.
Twenty-eight women were randomized to get packs right after surgery, and told to use them – before turning to oxycodone tabs – every 6 hours for 72 hours – and then as needed. Twenty-eight other women were randomized to the control group. Surgery was for benign indications, most often uterine bleeding secondary to fibroids. Besides the cold packs, there were no differences between the groups in analgesia protocols.
The differences in pain control, assessed on a 10-point scale over the phone, weren’t statistically significant, but they di move in the right direction. At 24 hours, women who were cold pack users reported a median pain score of 4, versus 4.5 among controls. At 72 hours, they reported a median score of 2, versus 2.5 in the control group.
At 2 weeks postoperatively, women who were cold pack users had used a mean of 4 oxycodone pills, versus 7 among the controls, which translated into a mean of 13 IV morphine equivalents versus 24 in favor of cold packs (P = .143).
While not significantly different, overall numbers of opioid tabs consumed and morphine equivalents “demonstrated lower use in the study group,” Dr. Frazzini Padilla noted at the meeting sponsored by AAGL.
Also, 89% of women said that cold packs helped reduce their pain, and 92% said they’d use them again after an operation. “In a day when everything is driven by patient satisfaction, patients’ perception of their recovery” is important. Because cold packs are cheap, harmless, and seemed to help with patient perceptions, “we do recommend that people use” them. “It’s just another added measure that we give” at Cleveland Clinic Florida, she said.
The study team also found that 86% of the women in the trial used 10 or fewer oxycodone tabs after surgery. Across the country, women are prescribed about 25 tabs after a laparoscopic hysterectomy; the study suggests it’s overkill, as an audience member noted, especially given the current climate.
The two arms of the study were well balanced. The mean age was 46 years, and mean body mass index 30.4 kg/m2.
There was no outside funding, and the investigators didn’t have any disclosures.
SOURCE: Frazzini Padilla P et al. 2018 AAGL Global Congress, Abstract 21.
REPORTING FROM AAGL GLOBAL CONGRESS
Key clinical point:
Major finding: Cold pack women at 2 weeks used a mean of 4 oxycodone pills, versus 7 among the controls, which translated into a mean of 13 IV morphine equivalents versus 24 in favor of cold packs (P = 0.143)
Study details: A study of 28 women using cold packs and 28 controls.
Disclosures: There was no outside funding, and the investigators didn’t have any disclosures.
Source: Frazzini Padilla P et al. 2018 AAGL Global Congress, Abstract 21.
Methotrexate fails to cut CVD events in a large RCT
CHICAGO – Both methotrexate and canakinumab are anti-inflammatory drugs, but only canakinumab cut the incidence of cardiovascular disease events in a major clinical trial, CANTOS. A second big trial designed to parallel CANTOS tested methotrexate in roughly the same way and found it produced no cardiovascular disease benefit among high-risk patients.
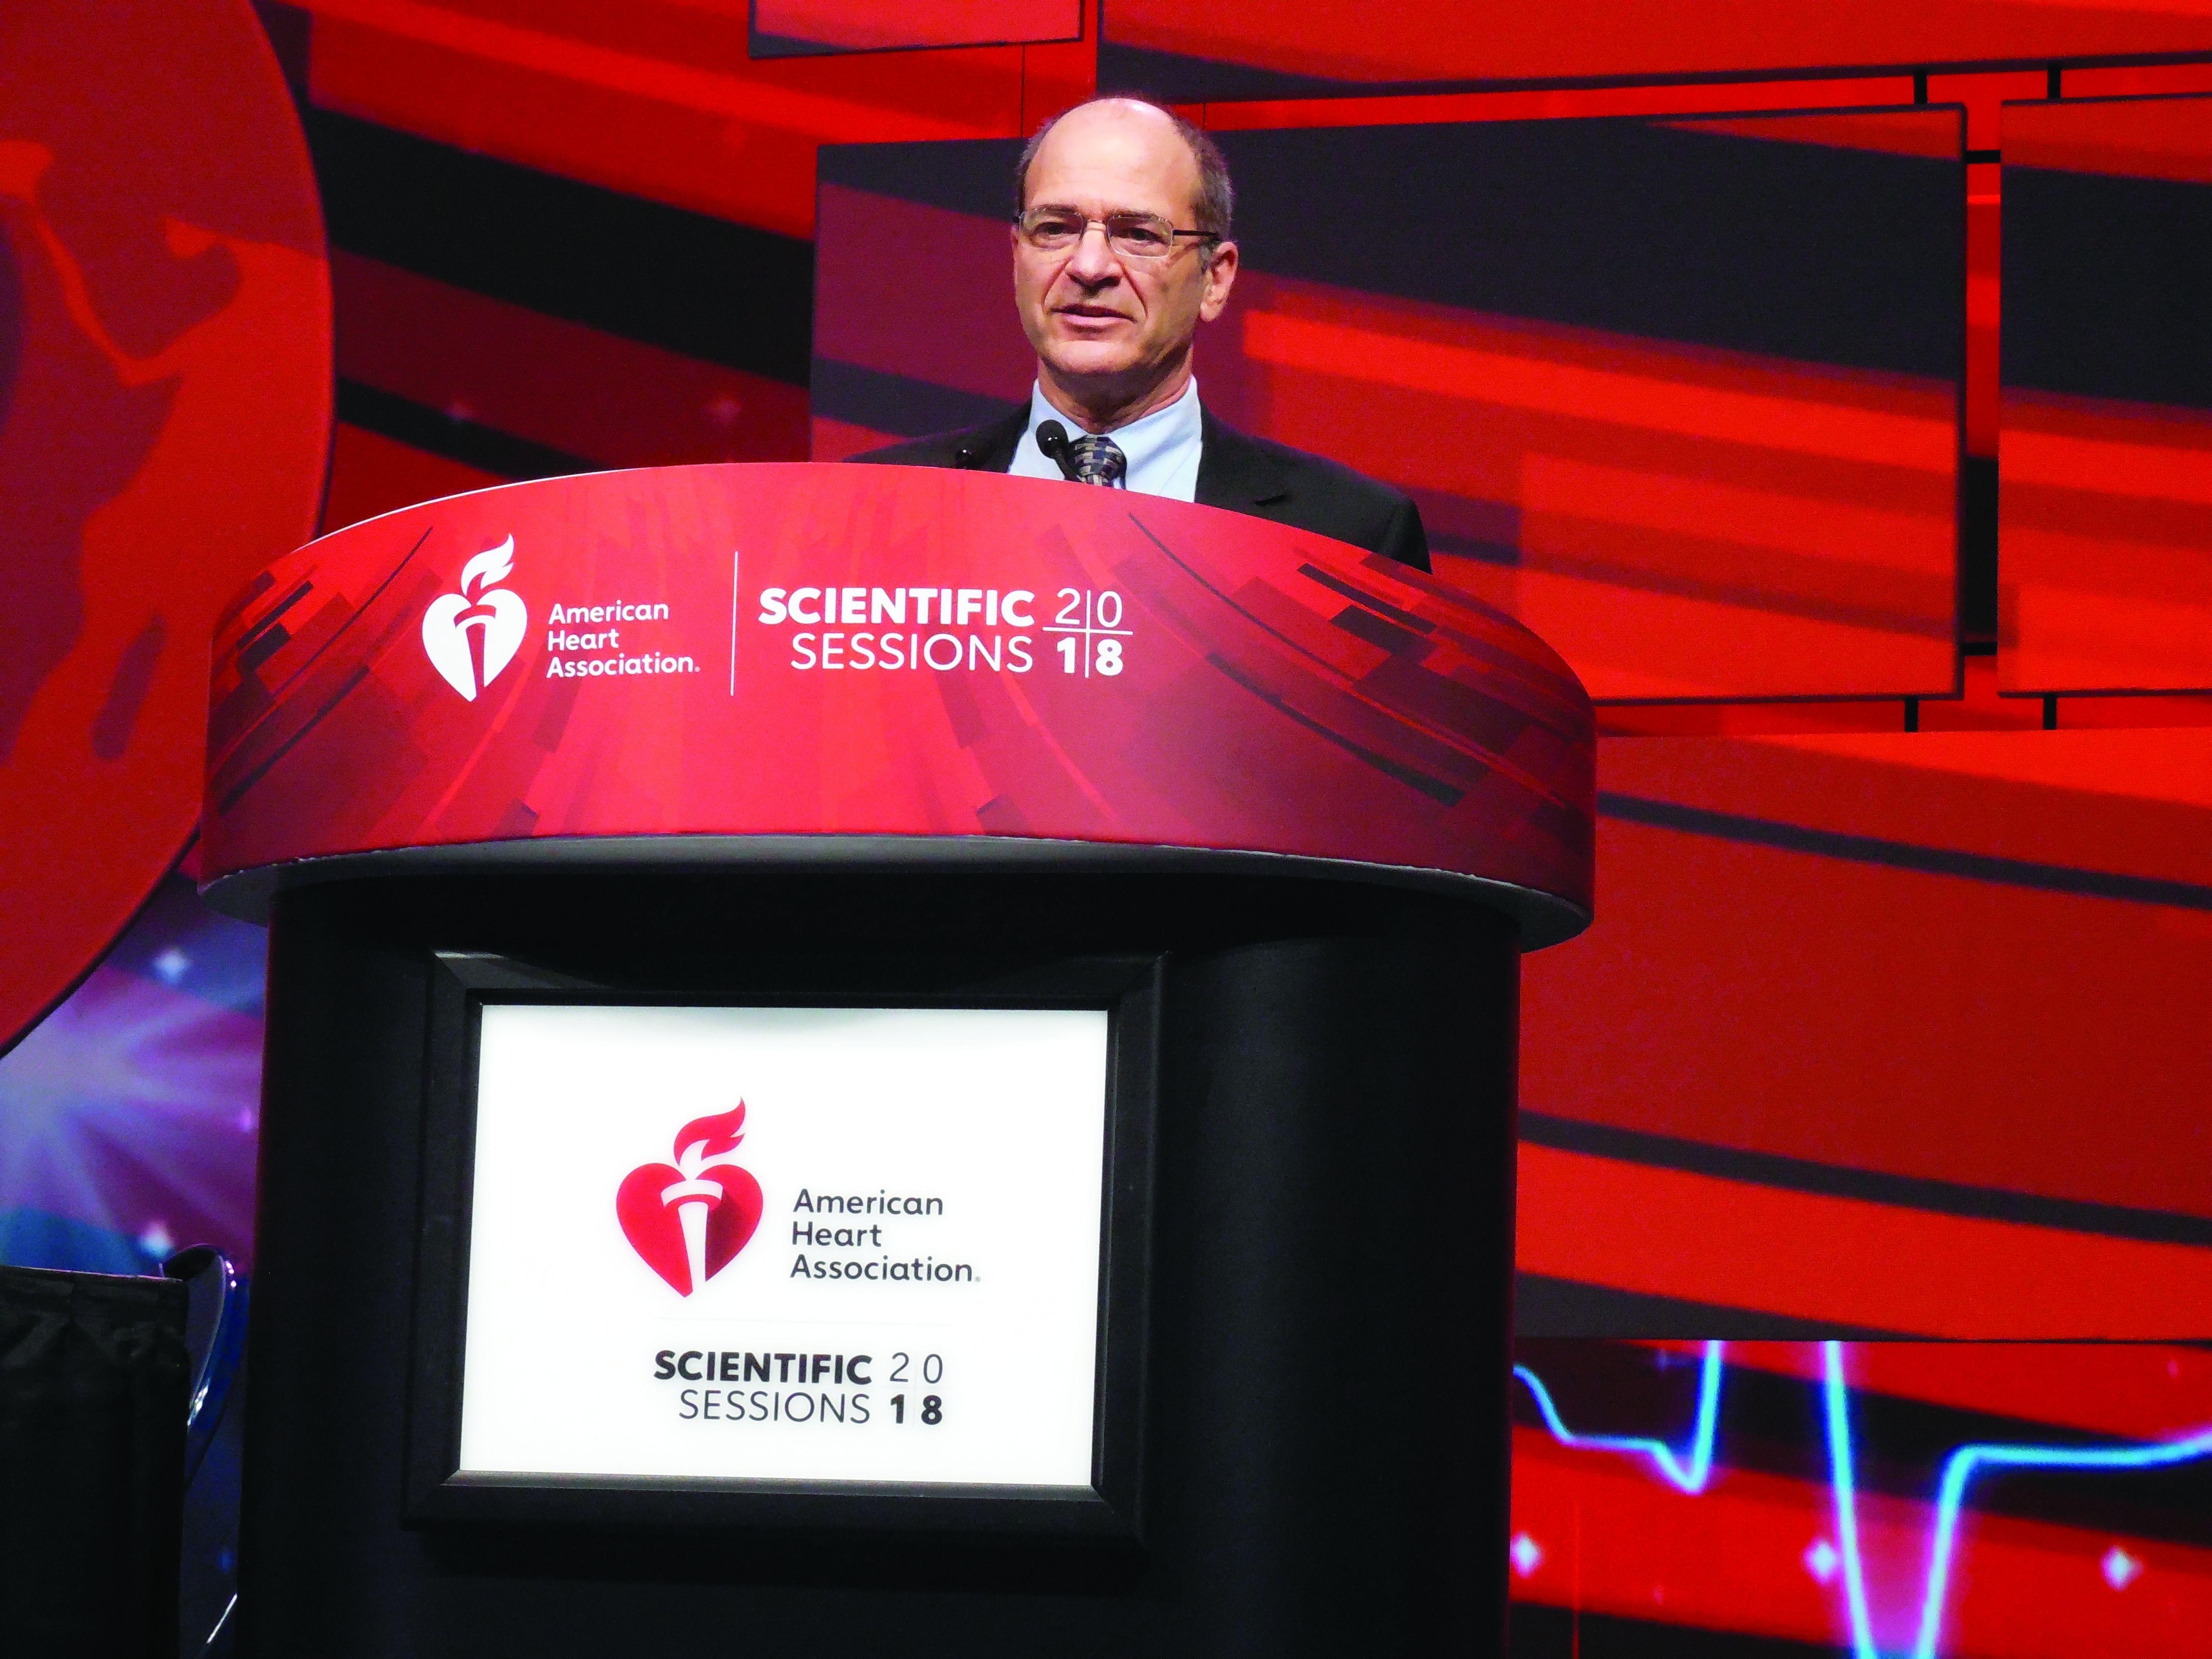
The CANTOS (Canakinumab Anti-inflammatory Thrombosis Outcome Study) results with canakinumab and the new results with methotrexate “demonstrate that inflammation inhibition [with canakinumab] can significantly reduce cardiovascular event rates independent of lipid lowering and blood pressure reduction,” Paul M. Ridker, MD, said at the American Heart Association scientific sessions. But, “inhibition of the IL [interleukin]–1 beta to IL-6 to CRP [C-reactive protein] pathway of innate immunity appears to be important for atheroprotection,” and was something methotrexate couldn’t deliver, concluded Dr. Ridker, a professor of medicine at Harvard Medical School and director of the Center for Cardiovascular Disease Prevention at Brigham and Women’s Hospital in Boston.
The new results he reported showed that weekly treatment with a single, oral, 15- to 20-mg dose of methotrexate not only had no effect on cardiovascular events but also had no discernible impact on serum levels of IL-1beta (IL-1B), IL-6, or high sensitivity (hs) CRP, in contrast to canakinumab, which Dr. Ridker took as evidence that this inflammatory pathway links to the pathophysiology of atherosclerotic cardiovascular disease.
CIRT (Cardiovascular Inflammation Reduction Trial) randomized 4,786 patients at 417 centers in the United States or Canada. Enrolled patients had to have a history of an MI or documented multivessel coronary disease, and also had to have type 2 diabetes, metabolic syndrome, or both. All patients were maintained on optimized dosages of a statin, aspirin, a beta-blocker, and an angiotensin-converting enzyme inhibitor or angiotensin-receptor blocker. All patients also received 1 mg folate daily. Randomization assigned patients to either receive 15-20 mg methotrexate orally once a week or placebo.
CIRT stopped prematurely because of futility after a median follow-up of 2.3 years. At that time, the incidence of one of two primary endpoints, the combination of cardiovascular death, nonfatal MI, and nonfatal stroke was 3.46/100 person-years with methotrexate treatment and 3.43/100 person-years with placebo, a difference that was not statistically significant. The incidence of the second primary endpoint, which combined the first three types of events plus hospitalization for unstable angina that led to urgent coronary revascularization, occurred in 4.13/100 person-years with methotrexate and 4.31/100 person years with placebo, also a difference that was not statistically significant. Concurrently with this report, the results were published online (N Engl J Med. 2018 Nov 10. doi: 10.1056/NEJMoa1809798).
Analysis of inflammatory markers in the blood after 8 months on treatment showed that methotrexate had no effect on levels of IL-1B, IL-6, and hsCRP. Methotrexate’s lack of an effect on these markers as well as the absence of an effect on cardiovascular disease events contrasted sharply with results that Dr. Ridker and his associates reported a little more than a year earlier in CANTOS. The study’s investigators randomized 10,061 patients with a history of an MI and an elevated serum level of hsCRP, at least 2.0 mg/L. After a median follow-up of 3.7 years, treatment with 150 mg of canakinumab injected subcutaneously once every 3 months produced a 15% relative risk reduction in the combined rate of cardiovascular death, nonfatal MI, and nonfatal stroke, compared with patients treated with placebo, a statistically significant between-group difference (N Engl J Med. 2017 Sep 21;377[12]:1119-31). Canakinumab had no impact on LDL cholesterol levels, but lowered hsCRP levels by more than a third. Dr. Ridker and his associates designed the CIRT and CANTOS trials “in parallel,” he said, and the CIRT results using methotrexate provided a “neutral control” to complement the positive results from canakinumab in CANTOS,
Given its high cost, canakinumab (Ilaris) is not an obviously practical option for treating patients similar to those enrolled in CANTOS, so other candidate agents that inhibit the IL-1B, IL-6, CRP inflammatory pathway are now under study, Dr. Ridker said in an interview. The mechanism of methotrexate’s inhibition of inflammation is unknown, but clearly does not involve this pathway; it may be mediated by adenosine, Dr. Ridker suggested. Canakinumab has Food and Drug Administration approval for treating systemic juvenile idiopathic arthritis and a handful of additional, low-prevalence diseases. Novartis, the company that markets canakinumab, made a submission to the Food and Drug Administration seeking an indication for prevention of cardiovascular disease based on the CANTOS results, and the company said in October 2018 that the FDA denied this request.
The CIRT results also showed a previously unseen signal of a possible safety issue with the tested methotrexate regimen. The incidence of non–basal cell skin cancer was 0.65/100 person-years with methotrexate, compared with 0.24/100 person-years with placebo, a statistically significant difference. Until now, no one had reported a link like this and it requires further analysis, Dr. Ridker said.
CIRT received no commercial funding. Dr. Ridker has been a consultant to Corvidia, Inflazome, and Novartis; he has received research funding from Kowa and Novartis; and his work led to a patent held by Brigham and Women’s Hospital for inflammatory biomarkers licensed to Siemens and AstraZeneca.
SOURCE: Ridker P et al. AHA scientific sessions, Abstract 17778.
CIRT is an important study. Considering the results from CIRT, which used methotrexate, along with the results from CANTOS, which used canakinumab, provides helpful mechanistic observations about selective drug effects when targeting inflammation. Two additional trials that are now in progress using colchicine in a clinical setting similar to CIRT and CANTOS should give us even more insight into the relationships between inflammation and atherosclerotic cardiovascular disease and possible new approaches to treatment.

Despite these differences between the two trials, the results from CIRT clearly showed that, in the enrolled patients, the dosage of methotrexate used had no apparent impact on levels of hsCRP, IL-1B, and IL-6.
Sidney C. Smith Jr., MD, is a cardiologist and professor of medicine at the University of North Carolina at Chapel Hill. He made these comments as the designated discussant for the CIRT trial. He had no disclosures.
CIRT is an important study. Considering the results from CIRT, which used methotrexate, along with the results from CANTOS, which used canakinumab, provides helpful mechanistic observations about selective drug effects when targeting inflammation. Two additional trials that are now in progress using colchicine in a clinical setting similar to CIRT and CANTOS should give us even more insight into the relationships between inflammation and atherosclerotic cardiovascular disease and possible new approaches to treatment.
Despite these differences between the two trials, the results from CIRT clearly showed that, in the enrolled patients, the dosage of methotrexate used had no apparent impact on levels of hsCRP, IL-1B, and IL-6.
Sidney C. Smith Jr., MD, is a cardiologist and professor of medicine at the University of North Carolina at Chapel Hill. He made these comments as the designated discussant for the CIRT trial. He had no disclosures.
CHICAGO – Both methotrexate and canakinumab are anti-inflammatory drugs, but only canakinumab cut the incidence of cardiovascular disease events in a major clinical trial, CANTOS. A second big trial designed to parallel CANTOS tested methotrexate in roughly the same way and found it produced no cardiovascular disease benefit among high-risk patients.
The CANTOS (Canakinumab Anti-inflammatory Thrombosis Outcome Study) results with canakinumab and the new results with methotrexate “demonstrate that inflammation inhibition [with canakinumab] can significantly reduce cardiovascular event rates independent of lipid lowering and blood pressure reduction,” Paul M. Ridker, MD, said at the American Heart Association scientific sessions. But, “inhibition of the IL [interleukin]–1 beta to IL-6 to CRP [C-reactive protein] pathway of innate immunity appears to be important for atheroprotection,” and was something methotrexate couldn’t deliver, concluded Dr. Ridker, a professor of medicine at Harvard Medical School and director of the Center for Cardiovascular Disease Prevention at Brigham and Women’s Hospital in Boston.
The new results he reported showed that weekly treatment with a single, oral, 15- to 20-mg dose of methotrexate not only had no effect on cardiovascular events but also had no discernible impact on serum levels of IL-1beta (IL-1B), IL-6, or high sensitivity (hs) CRP, in contrast to canakinumab, which Dr. Ridker took as evidence that this inflammatory pathway links to the pathophysiology of atherosclerotic cardiovascular disease.
CIRT (Cardiovascular Inflammation Reduction Trial) randomized 4,786 patients at 417 centers in the United States or Canada. Enrolled patients had to have a history of an MI or documented multivessel coronary disease, and also had to have type 2 diabetes, metabolic syndrome, or both. All patients were maintained on optimized dosages of a statin, aspirin, a beta-blocker, and an angiotensin-converting enzyme inhibitor or angiotensin-receptor blocker. All patients also received 1 mg folate daily. Randomization assigned patients to either receive 15-20 mg methotrexate orally once a week or placebo.
CIRT stopped prematurely because of futility after a median follow-up of 2.3 years. At that time, the incidence of one of two primary endpoints, the combination of cardiovascular death, nonfatal MI, and nonfatal stroke was 3.46/100 person-years with methotrexate treatment and 3.43/100 person-years with placebo, a difference that was not statistically significant. The incidence of the second primary endpoint, which combined the first three types of events plus hospitalization for unstable angina that led to urgent coronary revascularization, occurred in 4.13/100 person-years with methotrexate and 4.31/100 person years with placebo, also a difference that was not statistically significant. Concurrently with this report, the results were published online (N Engl J Med. 2018 Nov 10. doi: 10.1056/NEJMoa1809798).
Analysis of inflammatory markers in the blood after 8 months on treatment showed that methotrexate had no effect on levels of IL-1B, IL-6, and hsCRP. Methotrexate’s lack of an effect on these markers as well as the absence of an effect on cardiovascular disease events contrasted sharply with results that Dr. Ridker and his associates reported a little more than a year earlier in CANTOS. The study’s investigators randomized 10,061 patients with a history of an MI and an elevated serum level of hsCRP, at least 2.0 mg/L. After a median follow-up of 3.7 years, treatment with 150 mg of canakinumab injected subcutaneously once every 3 months produced a 15% relative risk reduction in the combined rate of cardiovascular death, nonfatal MI, and nonfatal stroke, compared with patients treated with placebo, a statistically significant between-group difference (N Engl J Med. 2017 Sep 21;377[12]:1119-31). Canakinumab had no impact on LDL cholesterol levels, but lowered hsCRP levels by more than a third. Dr. Ridker and his associates designed the CIRT and CANTOS trials “in parallel,” he said, and the CIRT results using methotrexate provided a “neutral control” to complement the positive results from canakinumab in CANTOS,
Given its high cost, canakinumab (Ilaris) is not an obviously practical option for treating patients similar to those enrolled in CANTOS, so other candidate agents that inhibit the IL-1B, IL-6, CRP inflammatory pathway are now under study, Dr. Ridker said in an interview. The mechanism of methotrexate’s inhibition of inflammation is unknown, but clearly does not involve this pathway; it may be mediated by adenosine, Dr. Ridker suggested. Canakinumab has Food and Drug Administration approval for treating systemic juvenile idiopathic arthritis and a handful of additional, low-prevalence diseases. Novartis, the company that markets canakinumab, made a submission to the Food and Drug Administration seeking an indication for prevention of cardiovascular disease based on the CANTOS results, and the company said in October 2018 that the FDA denied this request.
The CIRT results also showed a previously unseen signal of a possible safety issue with the tested methotrexate regimen. The incidence of non–basal cell skin cancer was 0.65/100 person-years with methotrexate, compared with 0.24/100 person-years with placebo, a statistically significant difference. Until now, no one had reported a link like this and it requires further analysis, Dr. Ridker said.
CIRT received no commercial funding. Dr. Ridker has been a consultant to Corvidia, Inflazome, and Novartis; he has received research funding from Kowa and Novartis; and his work led to a patent held by Brigham and Women’s Hospital for inflammatory biomarkers licensed to Siemens and AstraZeneca.
SOURCE: Ridker P et al. AHA scientific sessions, Abstract 17778.
REPORTING FROM THE AHA SCIENTIFIC SESSIONS
Key clinical point:
Major finding: The combined rate of CVD events was 3.46/100 person-years on methotrexate and 3.43/100 on placebo.
Study details: CIRT, a multicenter, randomized trial with 4,786 high-risk patients.
Disclosures: CIRT received no commercial funding. Dr. Ridker has been a consultant to Corvidia, Inflazome, and Novartis; he has received research funding from Kowa and Novartis; and his work led to a patent held by Brigham and Women’s Hospital for inflammatory biomarkers licensed to Seimens and AstraZeneca.
Source: Ridker P et al. AHA scientific sessions, Abstract 17778.
Filgotinib shows efficacy, safety in RA phase 3 and PsA phase 2 trials
CHICAGO – The selective Janus kinase 1 inhibitor filgotinib showed efficacy and safety for patients with rheumatoid arthritis in a phase 3 trial, and efficacy and safety for treating patients with psoriatic arthritis in results from a phase 2 study in two separate reports at the annual meeting of the American College of Rheumatology.
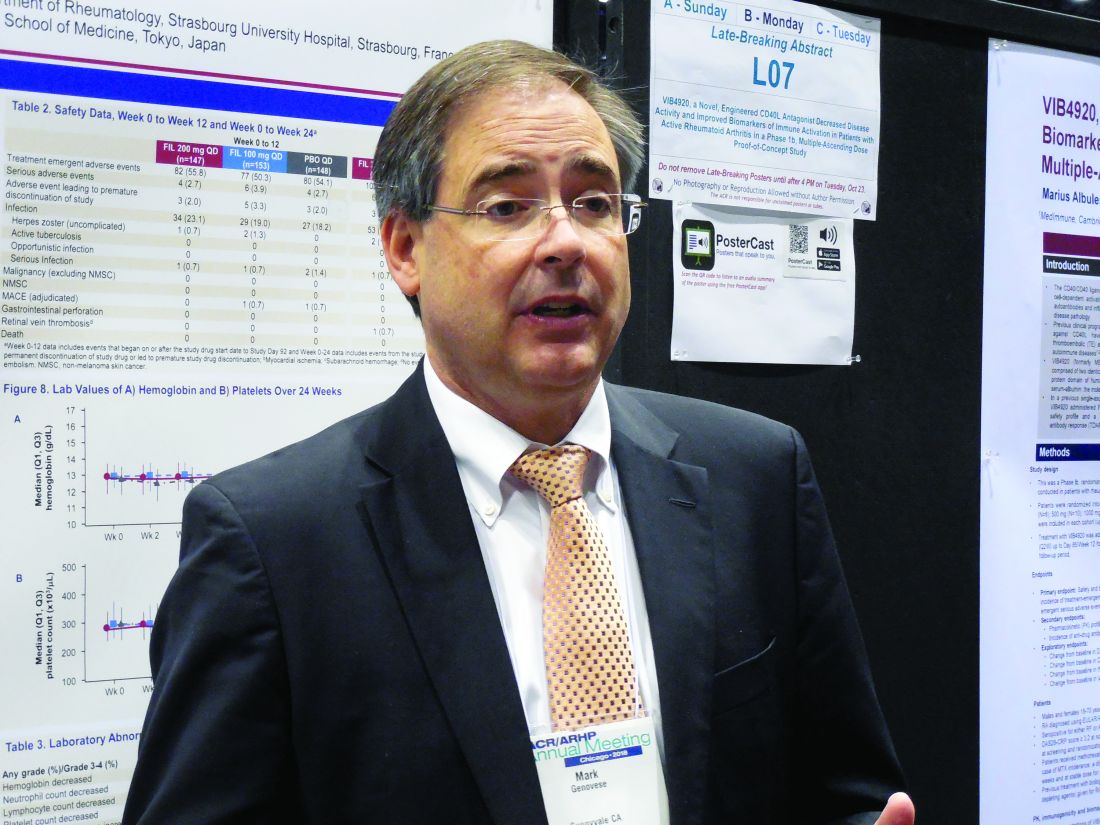
In the phase 3 study, treatment with filgotinib at an oral dosage of 200 mg once daily led to a 66% incidence of American College of Rheumatology 20 (ACR20) responses after 16 weeks of treatment in 147 patients with moderately to severely active rheumatoid arthritis (RA), compared with a 31% rate among 148 patients randomized to receive placebo, a statistically significant improvement for the study’s primary efficacy endpoint, Mark C. Genovese, MD, reported in a poster at the meeting. The rate of ACR20 responses among the 153 RA patients who received 100 mg/day filgotinib was 58%, reported Dr. Genovese, professor of medicine and director of the rheumatology clinic at Stanford (Calif.) University.
After 24 weeks of daily treatment, the longest duration studied in the trial, ACR20 rates were 69%, 55%, and 35% in the 200-mg, 100-mg, and placebo patients, respectively. Dr. Genovese also reported that after 24 weeks on treatment, the rates of patients achieving low disease activity measured by their disease activity score based on 28 joints and C-reactive protein level (DAS28-CRP) were 48%, 38%, and 21%, respectively, and the percentages of patients achieving complete remission at 24 weeks based on their DAS28-CRP scores were 31%, 26%, and 12%, respectively.
“We were incredibly fortunate to see such positive results. The drug worked very well in very-challenging-to-treat patients,” Dr. Genovese said in an interview. All of the RA patients enrolled in the study had not previously responded to or were intolerant of prior treatment with at least one biologic disease-modifying antirheumatic drug (DMARD), and almost a quarter of enrolled patients had failed prior treatment with at least three different biologic DMARDs. The number of biologic DMARDs a patient had previously received showed no relationship to how well patients responded to filgotinib, he noted.
Dr. Genovese also highlighted the relatively high percentage of patients who achieved low disease activity and remission. The 48% and 31% rates, respectively, of low disease activity and remission among patients treated with the higher filgotinib dosage for 24 weeks “is fairly impressive in patients who did not previously respond to a biologic DMARD,” the researcher said. These findings are similar to data previously reported for upadacitinib, another Janus kinase (JAK) inhibitor that, like filgotinib, is selective for the JAK1 receptor, noted Dr. Genovese, who also was the lead investigator for a phase 3 study of upadacitinib in RA patients (Lancet. 2018 June 23;391[10139]:2513-24).
The filgotinib data he presented came from the FINCH 2 (Filgotinib Versus Placebo in Adults With Active Rheumatoid Arthritis Who Have an Inadequate Response to Biologic Disease-Modifying Anti-Rheumatic Drug[s] Treatment) trial, which was run at 104 sites in 15 countries, including the United States. The results also showed a “favorable safety profile and stable laboratory parameters,” Dr. Genovese reported. Results from two additional phase 3 trials in RA patients are expected in 2019, he said.
Filgotinib studied in psoriatic arthritis
The separate, phase 2 study of filgotinib in patients with psoriatic arthritis (PsA) reported during the meeting showed safety “in line with previous reports without new safety signals” in a multicenter trial with 131 patients randomized to receive oral filgotinib 200 mg daily for 16 weeks or placebo, Philip J. Mease, MD, reported in a talk at the meeting. For the primary endpoint of achievement of ACR20 response after 16 weeks, the rate was 80% of the filgotinib-treated patients and 33% of patients in the placebo group, a statistically significant difference, said Dr. Mease, a rheumatologist at Swedish Medical Center in Seattle.

EQUATOR (A Study to Assess Efficacy and Safety of Filgotinib in Active Psoriatic Arthritis) enrolled patients at sites in seven European countries who had “very active” PsA and either a history of or current plaque psoriasis. All patients had to have a history of either insufficient response to or intolerance of at least one conventional synthetic DMARD. The enrollment criteria had no specifications for prior use of an anti–tumor necrosis factor drug, and about 15% of patients had used least one of these drugs. At entry, about three-quarters of patients were on treatment with a conventional synthetic DMARD and about a quarter received treatment with a glucocorticoid.
The results showed statistically significant benefits from filgotinib, compared with placebo, for several other measures of arthritis activity, as well as measures of psoriasis, enthesitis, and pain, Dr. Mease reported. He also highlighted a “lack of meaningful changes in hemoglobin” or other laboratory measures that, along with the efficacy findings, make filgotinib “a promising first step” for patients with PsA. Dr. Mease also noted that roughly concurrently with his report, a separate group of researchers published results from a phase 2 study of filgotinib in patients with ankylosing spondylitis that also found evidence for efficacy and safety during 12 weeks of treating 116 randomized patients (Lancet. 2018 Oct 22. doi: 10.1016/S0140-6736[18]32463-2).
FINCH 2 was sponsored by Galapagos and Gilead, the two companies developing filgotinib. Dr. Genovese has had financial relationships with Galapagos and Gilead and also with AbbVie, Lilly, and Pfizer. Dr. Mease has had financial relationships with Galapagos and Gilead and a dozen other companies.
SOURCES: Genovese M et al. Arthritis Rheumatol. 2018;70(Suppl 10), Abstract L06; Mease P et al. Arthritis Rheumatol. 2018;70(Suppl 10), Abstract 1821.
CHICAGO – The selective Janus kinase 1 inhibitor filgotinib showed efficacy and safety for patients with rheumatoid arthritis in a phase 3 trial, and efficacy and safety for treating patients with psoriatic arthritis in results from a phase 2 study in two separate reports at the annual meeting of the American College of Rheumatology.
In the phase 3 study, treatment with filgotinib at an oral dosage of 200 mg once daily led to a 66% incidence of American College of Rheumatology 20 (ACR20) responses after 16 weeks of treatment in 147 patients with moderately to severely active rheumatoid arthritis (RA), compared with a 31% rate among 148 patients randomized to receive placebo, a statistically significant improvement for the study’s primary efficacy endpoint, Mark C. Genovese, MD, reported in a poster at the meeting. The rate of ACR20 responses among the 153 RA patients who received 100 mg/day filgotinib was 58%, reported Dr. Genovese, professor of medicine and director of the rheumatology clinic at Stanford (Calif.) University.
After 24 weeks of daily treatment, the longest duration studied in the trial, ACR20 rates were 69%, 55%, and 35% in the 200-mg, 100-mg, and placebo patients, respectively. Dr. Genovese also reported that after 24 weeks on treatment, the rates of patients achieving low disease activity measured by their disease activity score based on 28 joints and C-reactive protein level (DAS28-CRP) were 48%, 38%, and 21%, respectively, and the percentages of patients achieving complete remission at 24 weeks based on their DAS28-CRP scores were 31%, 26%, and 12%, respectively.
“We were incredibly fortunate to see such positive results. The drug worked very well in very-challenging-to-treat patients,” Dr. Genovese said in an interview. All of the RA patients enrolled in the study had not previously responded to or were intolerant of prior treatment with at least one biologic disease-modifying antirheumatic drug (DMARD), and almost a quarter of enrolled patients had failed prior treatment with at least three different biologic DMARDs. The number of biologic DMARDs a patient had previously received showed no relationship to how well patients responded to filgotinib, he noted.
Dr. Genovese also highlighted the relatively high percentage of patients who achieved low disease activity and remission. The 48% and 31% rates, respectively, of low disease activity and remission among patients treated with the higher filgotinib dosage for 24 weeks “is fairly impressive in patients who did not previously respond to a biologic DMARD,” the researcher said. These findings are similar to data previously reported for upadacitinib, another Janus kinase (JAK) inhibitor that, like filgotinib, is selective for the JAK1 receptor, noted Dr. Genovese, who also was the lead investigator for a phase 3 study of upadacitinib in RA patients (Lancet. 2018 June 23;391[10139]:2513-24).
The filgotinib data he presented came from the FINCH 2 (Filgotinib Versus Placebo in Adults With Active Rheumatoid Arthritis Who Have an Inadequate Response to Biologic Disease-Modifying Anti-Rheumatic Drug[s] Treatment) trial, which was run at 104 sites in 15 countries, including the United States. The results also showed a “favorable safety profile and stable laboratory parameters,” Dr. Genovese reported. Results from two additional phase 3 trials in RA patients are expected in 2019, he said.
Filgotinib studied in psoriatic arthritis
The separate, phase 2 study of filgotinib in patients with psoriatic arthritis (PsA) reported during the meeting showed safety “in line with previous reports without new safety signals” in a multicenter trial with 131 patients randomized to receive oral filgotinib 200 mg daily for 16 weeks or placebo, Philip J. Mease, MD, reported in a talk at the meeting. For the primary endpoint of achievement of ACR20 response after 16 weeks, the rate was 80% of the filgotinib-treated patients and 33% of patients in the placebo group, a statistically significant difference, said Dr. Mease, a rheumatologist at Swedish Medical Center in Seattle.
EQUATOR (A Study to Assess Efficacy and Safety of Filgotinib in Active Psoriatic Arthritis) enrolled patients at sites in seven European countries who had “very active” PsA and either a history of or current plaque psoriasis. All patients had to have a history of either insufficient response to or intolerance of at least one conventional synthetic DMARD. The enrollment criteria had no specifications for prior use of an anti–tumor necrosis factor drug, and about 15% of patients had used least one of these drugs. At entry, about three-quarters of patients were on treatment with a conventional synthetic DMARD and about a quarter received treatment with a glucocorticoid.
The results showed statistically significant benefits from filgotinib, compared with placebo, for several other measures of arthritis activity, as well as measures of psoriasis, enthesitis, and pain, Dr. Mease reported. He also highlighted a “lack of meaningful changes in hemoglobin” or other laboratory measures that, along with the efficacy findings, make filgotinib “a promising first step” for patients with PsA. Dr. Mease also noted that roughly concurrently with his report, a separate group of researchers published results from a phase 2 study of filgotinib in patients with ankylosing spondylitis that also found evidence for efficacy and safety during 12 weeks of treating 116 randomized patients (Lancet. 2018 Oct 22. doi: 10.1016/S0140-6736[18]32463-2).
FINCH 2 was sponsored by Galapagos and Gilead, the two companies developing filgotinib. Dr. Genovese has had financial relationships with Galapagos and Gilead and also with AbbVie, Lilly, and Pfizer. Dr. Mease has had financial relationships with Galapagos and Gilead and a dozen other companies.
SOURCES: Genovese M et al. Arthritis Rheumatol. 2018;70(Suppl 10), Abstract L06; Mease P et al. Arthritis Rheumatol. 2018;70(Suppl 10), Abstract 1821.
REPORTING FROM THE ACR ANNUAL MEETING
Clinical trial: Assessment of Ventilatory Management During General Anesthesia for Robotic Surgery

The trial will assess the incidence of postoperative pulmonary complications in patients who receive mechanical ventilation while under general anesthesia during robotic surgery to characterize current ventilation practices and evaluate any association between ventilator parameters and postoperative pulmonary complications.
Patients will be included if they are at least 18 years old and had their robotic surgical procedure done under general anesthesia. Exclusion criteria include being pregnant during surgery and having their procedure done outside an operating room.
The primary outcome measure is incidence of postoperative pulmonary complications within 5 days of the procedure or hospital discharge. Secondary outcomes include intraoperative mechanical ventilation practice, mechanical ventilation practice, and postoperative pulmonary complications within 5 days of the procedure or hospital discharge, intraoperative surgical positioning and ventilation, preoperative risk for postoperative pulmonary complications, and intraoperative mechanical ventilation practice and complications.
The estimated primary completion date is March 1, 2019, and the estimated study completion date is May 1, 2019. About 500 patients are estimated to be enrolled.
Find more information on the study at Clinicaltrials.gov.
Clinical trial: Treating Sleep Apnea in Female Veterans
The Treating Sleep Apnea in Women Veterans study is an interventional, randomized, controlled trial for woman veterans recently diagnosed with sleep apnea and prescribed positive airway pressure (PAP) treatment with at least one risk factor for sleep-disordered breathing (SDB).
The trial will compare the efficacy of two different programs combining patient education with behavioral techniques to improve adherence to PAP therapy in women veterans. The recommended first-line treatment for SDB is PAP therapy, but women have been shown to have lower adherence to men, especially in woman veterans, who experience significant sleep disturbance and other consequences of sleep disorders. No study has tested possible interventions to increase PAP adherence in this population.
Among inclusion criteria are being a woman veteran aged at least 18 years, having received care from a Veterans Affairs facility, and having been diagnosed with sleep apnea with an apnea-hypopnea index of 5 or greater. Patients will be excluded if they are currently using a sleep apnea treatment, are pregnant, are an active substance user or started recovery in the past 90 days, are too ill to participate, do not have transportation, cannot self-consent, have unstable housing, have another sleep disorder that accounts for sleep disturbance, or have no sleep complaints or symptoms.
The primary outcome measures are PAP adherence 3 months post PAP initiation and sleep quality by patient-reported sleep questionnaire 3 months after randomizations. In addition, remote PAP usage data will be collected for 12 months post PAP initiation.
The estimated primary completion date is Dec. 21, 2021, and the estimated study completion date is Jan. 31, 2022. About 300 patients are estimated to be recruited.
Find more information on the study page at Clinicaltrials.gov.
Clinical trial: Magnetic Resonance Imaging in Obstructive Sleep Apnea
The Magnetic Resonance Imaging in Obstructive Sleep Apnea trial is an observational cohort study recruiting adults with obstructive sleep apnea undergoing surgery.
The trial will compare drug-induced sleep endoscopy and upper airway MRI in order to determine which is the better predictor of success in patients who cannot tolerate nonsurgical solutions. Upper airway MRI is a more complete evaluation during wakefulness and is cheaper than drug-induced sleep endoscopy, but no studies have thus far utilized MRI as a surgical evaluation tool.
Patients will be included if they are at least 21 years old, have moderate to severe obstructive sleep apnea, and have a body mass index less than 40 kg/m2. Exclusion criteria include prior surgery for obstructive sleep apnea; known neurologic, cardiac, pulmonary, renal, or hepatic disorders; psychiatric problems except for treated depression or mild anxiety; a coexisting sleep disorder; or another contraindication to drug-induced sleep endoscopy or MRI, such as propofol allergy.
The primary outcome measure is surgical results after 6 months, which will be measured using sleep studies. Secondary outcomes include sleep-related quality of life after 6 months and daytime sleepiness after 6 months.
The estimated primary completion date is June 2020, and the estimated study completion date is July 2020. About 40 patients are expected to be recruited.
Find more information on the study page at Clinicaltrials.gov.
Building on diversity
Maryland SHM chapter follows expansive vision
Nidhi Goel, MD, MHS, is a Med-Peds hospitalist and assistant professor of internal medicine and pediatrics at the University of Maryland, Baltimore. Since August 2017, she has been the president of the Maryland chapter of SHM.

The Hospitalist recently sat down with her to discuss some of the initiatives that the large and active Maryland chapter is focused on.
Can you talk about your background and how you became interested in hospital medicine?
I grew up in the Baltimore area, and I went to medical school at the University of Maryland in Baltimore. I trained in internal medicine and pediatrics, also at the University of Maryland. Then I joined the faculty after I finished residency in 2014. I practiced as a hospitalist in internal medicine and pediatrics and was also a teaching hospitalist.
Early in my residency, I worked with teaching hospitalists. I rotated on the hospitalist teams, and I was inspired by their perspective on taking care of patients through a lens of quality and safety. I gained a greater appreciation for the risks associated with taking care of a patient in the hospital setting, and the opportunities to mitigate those risks and provide really high quality patient care. It made me realize that was what I wanted to do – and also to teach residents and students how to do the same.
So it was a philosophical attraction to the hospitalist approach?
Yes, and intellectually I’d say that I liked taking care of really complicated, very sick patients. I found that to be interesting – and rewarding when they got better.
Tell us more about what kind of research you do.
I work primarily on projects centered on quality and safety; they involve both adult internal medicine and pediatric patients. Currently on the adult medicine side, we have a project looking at improving outcomes for sepsis in the hospital setting. On the pediatric side, I’ve done a lot of work related to throughput – trying to increase the efficiency of our admissions – and especially our discharge process. Moving patients through the system efficiently has become a significant quality issue, especially during the winter months when our volumes pick up.
How long have you been involved in the Maryland SHM chapter, and what are the rewards of participation?
Early in my residency, I got involved in the chapter because some of the hospitalist faculty I worked with were chapter officers. They believed that the chapter was a good place for residents to be exposed to research and to other hospitalists for networking and camaraderie. So they began inviting us to Maryland chapter meetings, and I found those meetings to be very enlightening – from the practical and research content related to hospital medicine, and to networking with other hospitalists.
I was invited to be part of the Maryland chapter advisory board when I was still a resident, so that I might present trainee perspectives on how the chapter could continue to grow and target some of their activities for the benefit of residents. I stayed involved with the chapter after I finished residency, and when the opportunity presented itself to become an officer, and I decided to take it. I thought serving as a chapter officer would be a really interesting chance to meet more people in the field and to continue to innovate within the chapter setting.
Tell us more about the Maryland chapter.
We are a large chapter and we’re very, very active. Around 7 or 8 years ago, the Maryland chapter reached a significant turning point because the officers that were in place at that time had a vision for building the chapter. That was a major inflexion point in how active the chapter became, leading to the kinds of activities that we do now, and the variety of memberships.
One thing that I’m super proud of our chapter for is that we’ve really tried to continue building on the diversity that is represented in our membership. We have members stretching geographically all through the Baltimore and the Washington corridor, as well as out to western Maryland and the Eastern shore. The Maryland chapter has been able to attract members from different organizations throughout the state and from a diversity of practice settings. We have active members who are not just physicians, but also a nurse practitioners, physician assistants, and clinical pharmacists. We have members from throughout the health care delivery process, which really enriches the discussion and the value of the chapter as a whole.
What kind of initiatives and programs is the chapter working on?
Every year we have an abstracts competition at our fall meeting. Whoever wins that competition is allowed to present at the national SHM conference, which is a great opportunity. We’re really pushing that competition to make it an even more robust experience.
One thing that we had heard from some of our members, and that we recognized as a need as well, was to make our career guidance a little bit more robust. To that end, we’re creating a separate job fair that is almost like an employment workshop – to help people to buff up their CVs, to talk about interviewing skills, contracts, salary negotiations, as well as exposing job candidates to various hospital groups from throughout the area. That’s something that we’re really excited about. It’s going to take a lot of work, but I think it could be a really high-yield event for our members.
We’re also encouraging our nonphysician members to take more active leadership roles in the chapter; several of our nonphysician members on our chapter advisory board, including pharmacists and physician assistants, and we are trying to make sure that we’re also liaising with some of the professional organizations that represent our nonphysician members. So, for example, the clinical pharmacist who’s on our advisory board also is president of the Maryland chapter of the Society for Hospital Pharmacists. She brings a lot of really great ideas and interesting perspectives, and she’s brought a lot of exposure of our SHM chapter to the clinical pharmacy community as well.
What about more long-term goals for your chapter? What’s on the horizon?
We’re targeting early-career hospitalists and helping them to develop their career goals in whatever fashion they see as appropriate.
So, as someone who’s in academics, obviously research and publications are very important for me, but they’re not necessarily as important for other hospitalists. I think our early-career hospitalists are increasingly looking to incorporate things into their practice aside from direct patient care. Our members have interests in various elements of hospital medicine, including patient safety and quality improvement initiatives, clinical informatics, advocacy (especially related to the myriad aspects of health care reform), and strategies surrounding billing and denials. I think having our chapter help our members to realize some of those opportunities and develop their skills in a way that’s personally meaningful to them, as well as good for their marketability as they build their careers, would be a really positive step.
The ultimate goal of the chapter is to service members, so whatever long-term goals we have right now could definitely be fluid as time goes on.
What are some concerns of the chapter?
One area of significant discussion among hospitalists in Maryland has been global budgets. Our system of reimbursement is unique in the nation. It’s a system that aims to emphasize high-value care: the idea is to prioritize quality over quantity.
This system requires that hospitals rethink how we provide care in the inpatient setting, and how we create a continuum of care to the post-acute setting. It poses a lot of challenges, but also a lot of opportunities. Hospitalists are positioned perfectly to play a substantial role in implementing solutions.
Why might readers want to consider getting involved in their local SHM chapters?
I think it’s really beneficial to have the exposure that being involved with an SHM chapter brings – to people, to perspectives, to knowledge. There’s not really a downside to being involved with a chapter. You can take as little or as much as you want out of it, but I think most of our members find it to be a very enriching experience. Being involved in a chapter means you can have a voice, so that the chapter ends up serving you and your needs as well.
Maryland SHM chapter follows expansive vision
Maryland SHM chapter follows expansive vision
Nidhi Goel, MD, MHS, is a Med-Peds hospitalist and assistant professor of internal medicine and pediatrics at the University of Maryland, Baltimore. Since August 2017, she has been the president of the Maryland chapter of SHM.
The Hospitalist recently sat down with her to discuss some of the initiatives that the large and active Maryland chapter is focused on.
Can you talk about your background and how you became interested in hospital medicine?
I grew up in the Baltimore area, and I went to medical school at the University of Maryland in Baltimore. I trained in internal medicine and pediatrics, also at the University of Maryland. Then I joined the faculty after I finished residency in 2014. I practiced as a hospitalist in internal medicine and pediatrics and was also a teaching hospitalist.
Early in my residency, I worked with teaching hospitalists. I rotated on the hospitalist teams, and I was inspired by their perspective on taking care of patients through a lens of quality and safety. I gained a greater appreciation for the risks associated with taking care of a patient in the hospital setting, and the opportunities to mitigate those risks and provide really high quality patient care. It made me realize that was what I wanted to do – and also to teach residents and students how to do the same.
So it was a philosophical attraction to the hospitalist approach?
Yes, and intellectually I’d say that I liked taking care of really complicated, very sick patients. I found that to be interesting – and rewarding when they got better.
Tell us more about what kind of research you do.
I work primarily on projects centered on quality and safety; they involve both adult internal medicine and pediatric patients. Currently on the adult medicine side, we have a project looking at improving outcomes for sepsis in the hospital setting. On the pediatric side, I’ve done a lot of work related to throughput – trying to increase the efficiency of our admissions – and especially our discharge process. Moving patients through the system efficiently has become a significant quality issue, especially during the winter months when our volumes pick up.
How long have you been involved in the Maryland SHM chapter, and what are the rewards of participation?
Early in my residency, I got involved in the chapter because some of the hospitalist faculty I worked with were chapter officers. They believed that the chapter was a good place for residents to be exposed to research and to other hospitalists for networking and camaraderie. So they began inviting us to Maryland chapter meetings, and I found those meetings to be very enlightening – from the practical and research content related to hospital medicine, and to networking with other hospitalists.
I was invited to be part of the Maryland chapter advisory board when I was still a resident, so that I might present trainee perspectives on how the chapter could continue to grow and target some of their activities for the benefit of residents. I stayed involved with the chapter after I finished residency, and when the opportunity presented itself to become an officer, and I decided to take it. I thought serving as a chapter officer would be a really interesting chance to meet more people in the field and to continue to innovate within the chapter setting.
Tell us more about the Maryland chapter.
We are a large chapter and we’re very, very active. Around 7 or 8 years ago, the Maryland chapter reached a significant turning point because the officers that were in place at that time had a vision for building the chapter. That was a major inflexion point in how active the chapter became, leading to the kinds of activities that we do now, and the variety of memberships.
One thing that I’m super proud of our chapter for is that we’ve really tried to continue building on the diversity that is represented in our membership. We have members stretching geographically all through the Baltimore and the Washington corridor, as well as out to western Maryland and the Eastern shore. The Maryland chapter has been able to attract members from different organizations throughout the state and from a diversity of practice settings. We have active members who are not just physicians, but also a nurse practitioners, physician assistants, and clinical pharmacists. We have members from throughout the health care delivery process, which really enriches the discussion and the value of the chapter as a whole.
What kind of initiatives and programs is the chapter working on?
Every year we have an abstracts competition at our fall meeting. Whoever wins that competition is allowed to present at the national SHM conference, which is a great opportunity. We’re really pushing that competition to make it an even more robust experience.
One thing that we had heard from some of our members, and that we recognized as a need as well, was to make our career guidance a little bit more robust. To that end, we’re creating a separate job fair that is almost like an employment workshop – to help people to buff up their CVs, to talk about interviewing skills, contracts, salary negotiations, as well as exposing job candidates to various hospital groups from throughout the area. That’s something that we’re really excited about. It’s going to take a lot of work, but I think it could be a really high-yield event for our members.
We’re also encouraging our nonphysician members to take more active leadership roles in the chapter; several of our nonphysician members on our chapter advisory board, including pharmacists and physician assistants, and we are trying to make sure that we’re also liaising with some of the professional organizations that represent our nonphysician members. So, for example, the clinical pharmacist who’s on our advisory board also is president of the Maryland chapter of the Society for Hospital Pharmacists. She brings a lot of really great ideas and interesting perspectives, and she’s brought a lot of exposure of our SHM chapter to the clinical pharmacy community as well.
What about more long-term goals for your chapter? What’s on the horizon?
We’re targeting early-career hospitalists and helping them to develop their career goals in whatever fashion they see as appropriate.
So, as someone who’s in academics, obviously research and publications are very important for me, but they’re not necessarily as important for other hospitalists. I think our early-career hospitalists are increasingly looking to incorporate things into their practice aside from direct patient care. Our members have interests in various elements of hospital medicine, including patient safety and quality improvement initiatives, clinical informatics, advocacy (especially related to the myriad aspects of health care reform), and strategies surrounding billing and denials. I think having our chapter help our members to realize some of those opportunities and develop their skills in a way that’s personally meaningful to them, as well as good for their marketability as they build their careers, would be a really positive step.
The ultimate goal of the chapter is to service members, so whatever long-term goals we have right now could definitely be fluid as time goes on.
What are some concerns of the chapter?
One area of significant discussion among hospitalists in Maryland has been global budgets. Our system of reimbursement is unique in the nation. It’s a system that aims to emphasize high-value care: the idea is to prioritize quality over quantity.
This system requires that hospitals rethink how we provide care in the inpatient setting, and how we create a continuum of care to the post-acute setting. It poses a lot of challenges, but also a lot of opportunities. Hospitalists are positioned perfectly to play a substantial role in implementing solutions.
Why might readers want to consider getting involved in their local SHM chapters?
I think it’s really beneficial to have the exposure that being involved with an SHM chapter brings – to people, to perspectives, to knowledge. There’s not really a downside to being involved with a chapter. You can take as little or as much as you want out of it, but I think most of our members find it to be a very enriching experience. Being involved in a chapter means you can have a voice, so that the chapter ends up serving you and your needs as well.
Laparoscope doubles as cystoscope in robotic hysterectomy
LAS VEGAS – to check for injuries, according to a review from St. Joseph’s University Medical Center, in Paterson, N.J.

Postoperative urinary tract infections (UTIs) are the big worry with using the same scope, but they really weren’t a problem at St. Joe’s; in a study of 45 women, there was just one UTI, confirmed by culture, at the 2-week postoperative visit, yielding a rate (2.2%) that is actually better the 5%-10% reported for stand-alone cystoscopy, said lead investigator and ob.gyn. resident Nikki Amirlatifi, MD.
“This is a safe alternative to traditional cystoscopy. We had no problems with visualization, and it doesn’t increase the rate of UTIs. Of course, it’s not only cost saving but time saving, as well,” she said.
The cases all were routine, however. For tougher ones, “where we need a more in-depth look at the bladder, we would [still] do cystoscopy,” she said at the meeting sponsored by AAGL.
There’s some debate about routine cystoscopy during laparoscopic hysterectomy, but Dr. Amirlatifi noted that it’s been reported to detect up to 89% of ureter injuries and up to 95% of bladder injuries. Using the same scope for both procedures makes it easier.
After the uterus was taken out, the bladder was backfilled with 180 mL of sterile water, then the Foley catheter was pulled. The previously used 5 mm laparoscope, which had been used for abdominal entry at 0 degrees, was introduced into the bladder. Efflux from both ureteral orifices was visualized, then the catheter reinserted until the end of surgery.
The women were an average of 44 years old, with an average body mass index of 32 kg/m2. Abnormal uterine bleeding, pelvic pain, and fibroids were the main indications for surgery. No ureteral or bladder injuries were detected.
Everyone was questioned about UTI symptoms and gave a clean-catch urine sample at the first postoperative visit. Cultures were performed on the seven women who reported symptoms or had white cells in their sample, and they were treated empirically with antibiotics. Only one culture grew out despite a high prevalence of UTI risk factors, including diabetes (13%), obesity (42%), and smoking (11%).
All the women had preoperative antibiotics and phenazopyridine. Most went home on the day of surgery.
There was no outside funding for the work, and the investigators didn’t have any relevant financial disclosures.
SOURCE: J Minim. Invasive Gynecol. 2018 Nov-Dec;25[7]:S46-47.
LAS VEGAS – to check for injuries, according to a review from St. Joseph’s University Medical Center, in Paterson, N.J.
Postoperative urinary tract infections (UTIs) are the big worry with using the same scope, but they really weren’t a problem at St. Joe’s; in a study of 45 women, there was just one UTI, confirmed by culture, at the 2-week postoperative visit, yielding a rate (2.2%) that is actually better the 5%-10% reported for stand-alone cystoscopy, said lead investigator and ob.gyn. resident Nikki Amirlatifi, MD.
“This is a safe alternative to traditional cystoscopy. We had no problems with visualization, and it doesn’t increase the rate of UTIs. Of course, it’s not only cost saving but time saving, as well,” she said.
The cases all were routine, however. For tougher ones, “where we need a more in-depth look at the bladder, we would [still] do cystoscopy,” she said at the meeting sponsored by AAGL.
There’s some debate about routine cystoscopy during laparoscopic hysterectomy, but Dr. Amirlatifi noted that it’s been reported to detect up to 89% of ureter injuries and up to 95% of bladder injuries. Using the same scope for both procedures makes it easier.
After the uterus was taken out, the bladder was backfilled with 180 mL of sterile water, then the Foley catheter was pulled. The previously used 5 mm laparoscope, which had been used for abdominal entry at 0 degrees, was introduced into the bladder. Efflux from both ureteral orifices was visualized, then the catheter reinserted until the end of surgery.
The women were an average of 44 years old, with an average body mass index of 32 kg/m2. Abnormal uterine bleeding, pelvic pain, and fibroids were the main indications for surgery. No ureteral or bladder injuries were detected.
Everyone was questioned about UTI symptoms and gave a clean-catch urine sample at the first postoperative visit. Cultures were performed on the seven women who reported symptoms or had white cells in their sample, and they were treated empirically with antibiotics. Only one culture grew out despite a high prevalence of UTI risk factors, including diabetes (13%), obesity (42%), and smoking (11%).
All the women had preoperative antibiotics and phenazopyridine. Most went home on the day of surgery.
There was no outside funding for the work, and the investigators didn’t have any relevant financial disclosures.
SOURCE: J Minim. Invasive Gynecol. 2018 Nov-Dec;25[7]:S46-47.
REPORTING FROM AAGL GLOBAL CONGRESS
Key clinical point: It is just as safe to look inside the bladder with the laparoscope after robotic hysterectomy in routine cases as to use a separate cystoscopy setup.
Major finding: Only 2.2% of women had a UTI, and there were no ureteral or bladder injuries detected using the laparoscope.
Study details: This was a prospective study of 45 women who underwent robotic hysterectomy whose bladder was inspected with the laparoscope at the end of surgery.
Disclosures: There was no outside funding for the work, and the investigators didn’t have any relevant financial disclosures.