User login
Menopause, not aging, may influence brain volume
Postmenopausal women not only have larger brain volume than women who are premenopausal, but they also experience larger reductions in brain volume over time, reported Ananthan Ambikairajah of the Centre for Research on Ageing, Health and Wellbeing, Australian National University, Canberra, and associates. Their report was published in Menopause.
In this large population-based cohort of 5,072 women aged 37-73 years, the goal of the study was to look at links between brain volume and measures of menstruation history, such as menopausal status, age at menopause, age at menarche, and the duration of a woman’s reproductive stage, but to do so within the context of how it relates to dementia prevalence. Citing a study in The Lancet Neurology, the authors noted that the age-standardized prevalence for dementia is 17% higher in women than in men, and they speculated that it may be important to look beyond age for answers.
What about menstrual history and Alzheimer’s disease?
According to the Framingham Study in Neurology, the remaining lifetime risk of Alzheimer’s disease (AD) is nearly double for a 65-year-old woman (12%) compared with a 65-year-old man (6.3%), leading Mr. Ambikairajah and associates to conclude that “menstruation history may also be particularly relevant, given that it is unique to female aging.” They further speculated, citing several related studies, that because AD pathology is initiated decades prior to the onset of clinical signs, menstruation history and its effects on brain health may, in fact, be reflected in brain volume.
Postmenopausal women had 0.82% and 1.33% larger total brain and hippocampal volume, respectively, compared with premenopausal women. Postmenopausal women had a 23% greater decrease in total brain volume but not in hippocampal volume over time, compared with premenopausal women.
As Braak and Braak illustrated in Acta Neuropathologica, chronic inflammation has been linked to brain shrinkage “consistent with the pattern of results in the present study,” Mr. Ambikairajah and colleagues noted, adding that longitudinal neuroimaging/biomarker studies are needed to explore this further.
What made this study unique was its ability to match pre- and postmenopausal women for age, a critically important attribute “given that aging and menopause both progress concurrently, which can make it difficult to determine the individual contribution of each for measures of brain health,” the authors explained.
In an interview, Constance Bohon, MD, an ob.gyn. in private practice and assistant clinical professor, George Washington University, Washington, observed: “The conclusion [in this study] is that an early age of menarche, delayed age of menopause and increased duration of the reproductive stage is negatively associated with brain volume.”
What of the neuroprotective effects of endogenous estrogen?
“Their findings are not consistent with a neuroprotective effect of endogenous estrogen exposure on brain volume,” she noted, adding that the study “did not assess the effect of exogenous estrogen on brain volume. Neither was the effect of exogenous or endogenous estrogen on cerebral blood flow assessed. In a study published in Obstetrics & Gynecology, the conclusion was that oophorectomy before the age of natural menopause is associated with a decrease in cognitive impairment and dementia. There was no assessment of brain volume or cerebral blood flow. Likewise in a report published in Neurobiology of Aging, Maki P and Resnick S M. concluded that estrogen helps maintain hippocampal and prefrontal function as women age,” observed Dr. Bohon, noting that the study did not assess brain volume.
“It is unclear whether the most predictive assessment for worsening cognition and dementia is the finding of decreased total brain volume, decreased hippocampal volume, or decreased cerebral blood flow. The effect of both endogenous and exogenous estrogen on the risk for dementia needs further evaluation,” she cautioned.
Mr. Ambikairajah cited one financial disclosure; the remaining contributors had no relevant disclosures.
FROM MENOPAUSE
New COPD mortality risk model includes imaging-derived variables
All-cause mortality in patients with COPD over 10 years of follow-up was accurately predicted by a newly developed model based on a point system incorporating imaging-derived variables.
Identifying risk factors is important to develop treatments and preventive strategies, but the role of imaging variables in COPD mortality among smokers has not been well studied, wrote investigator Matthew Strand, PhD, of National Jewish Health in Denver, and colleagues.
An established risk model is the body mass index–airflow Obstruction-Dyspnea-Exercise capacity (BODE) index, developed to predict mortality in COPD patients over a 4-year period. The investigators noted that while models such as BODE provide useful information about predictors of mortality in COPD, they were developed using participants in the Global initiative for obstructive Lung Disease (GOLD) spirometry grades 1-4, and have been largely constructed without quantitative computed tomography (CT) imaging variables until recently.
“The BODE index was created as a simple point scoring system to predict risk of all-cause mortality within 4 years, and is based on FEV1 [forced expiratory volume at 1 second], [6-minute walk test], dyspnea and BMI, a subset of predictors we considered in our model,” the investigators noted. The new model includes data from pulmonary function tests and volumetric CT scans.
In a study published in Chronic Obstructive Pulmonary Diseases, the researchers identified 9,074 current and past smokers in the COPD Genetic Epidemiology study (COPDGene) for whom complete data were available. They developed a point system to determine mortality risk in current and former smokers after controlling for multiple risk factors. The average age of the study population was 60 years. All participants were current or former smokers with a smoking history of at least 10 pack-years.
Assessments of the study participants included a medical history, pre- and post-bronchodilator spirometry, a 6-minute walk distance test, and inspiratory and expiratory CT scans. The researchers analyzed mortality risk in the context of Global Initiative for Obstructive Lung Disease (GOLD) classifications of patients in the sample.
Overall, the average 10-year mortality risk was 18% for women and 25% for men. Performance on the 6-minute walk test (distances less than 500 feet), FEV1 (less than 20), and older age (80 years and older) were the strongest predictors of mortality.
The model showed strong predictive accuracy, with an area under the receiver operating characteristic curve averaging 0.797 that was validated in an external cohort, the researchers said.
The study findings were limited by the observational design that does not allow for estimating the causal effects of such modifiable factors as smoking cessation, that might impact the walking test and FEV1 values, the researchers noted. In addition, the model did not allow for testing the effects of smoking vs. not smoking.
However, the model developed in the study “will allow physicians and patients to better understand factors affecting risk of an adverse event, some of which may be modifiable,” the researchers said. “The risk estimates can be used to target groups of individuals for future clinical trials, including those not currently classified as having COPD based on GOLD criteria,” they said.
The study was supported by the National Heart, Lung, and Blood Institute and by the COPD Foundation through contributions to an industry advisory committee including AstraZeneca, Boehringer-Ingelheim, Genentech, GlaxoSmithKline, Novartis, Pfizer, Siemens, and Sunovion.
FROM CHRONIC OBSTRUCTIVE PULMONARY DISEASES
CDC: 20% of people in the U.S. are infected with an STD
Among the more than 320 million people in the United States, there was a prevalence estimate of 67.6 million sexually transmitted infections at the time of assessment in 2018, according to the results of an epidemiologic study using multiple data sources, including the National Health and Nutrition Examination Survey (NHANES).
In addition, almost half of the incident STIs occurred in the 15- to 24-year age bracket, according to a report published online in Sexually Transmitted Diseases. Researchers estimated the combined number of prevalent and incident infections of eight STIs in the United States in 2018: chlamydia, gonorrhea, trichomoniasis, syphilis, genital herpes (caused by herpes simplex virus type 2 [HSV-2]), human papillomavirus (HPV), sexually transmitted hepatitis B virus (HBV), and sexually transmitted HIV.
The estimated incidences of these STIs in this update, the first since 2008, were made using more recent data and improved estimation methods to provide updated STI prevalence and incidence estimates for 2018, both overall and by disease. “Having a combined estimate is crucial for policy purposes to illustrate the importance of STIs in the United States,” according to Kristen M. Kreisel, PhD, an epidemiologist at the Centers for Disease Control and Prevention, division of STD prevention, and colleagues.
The number of prevalent and incident infections were obtained by multiplying each STI’s updated per capita estimates by the 2018 full resident population estimates from the American Community Survey.
Detailed results
Chlamydia. The prevalence of chlamydia was estimated using 2015-2018 NHANES data, which was then used to create a modeled prevalence in 2018, according to the authors. There were an estimated 2.4 million prevalent urogenital chlamydial infections among persons aged 15-39 years in 2018; 1.1 and 1.3 million infections among men and women, respectively. Individuals aged 15-24 years comprised 56.7% and 75.8% of all infections in men and women respectively.
Gonorrhea. The prevalence of gonorrhea was estimated using ordinary differential equation based modeling. The number of prevalent urogenital gonococcal infections in 2018 among 15- to 39-year-olds was 209,000 overall; 50,000 in men and 155,000 in women. Of these, 113,000 (54.1%) occurred in 15- to 24-year-olds.
Trichomoniasis. The prevalence of trichomoniasis was estimated using 2015-2018 NHANES data, which was then used to create a modeled prevalence in 2018, according to the authors. The number of prevalent Trichomonas infections among 15- to 59-year-olds was 2.6 million, with 470,000 in men and 2.1 million in women. Persons aged 15-24 years comprised 15.6% of all prevalent infections, according to the authors.
Syphilis. The number of estimated prevalent syphilitic infections (all stages) among 14- to 49-year-old persons in 2018 was 156,000, with infections in men comprising 71.8% of all infections. Infections in both men and women aged 14-24 years accounted for about 25% of all infections, with 36,000 total prevalent syphilitic infections among 14- to 24-year-olds in 2018.
Genital herpes. The prevalence of genital herpes (caused by HSV-2) was estimated using 2015-2018 NHANES data, according to the authors. In persons aged 15-49 years in 2018, there were 18.6 million prevalent HSV-2 infections; 6.4 million among men and 12.2 million among women. Infections in 15- to 24-year-olds comprised 7.1% of all prevalent HSV-2 infections.
HPV. The prevalence of HPV was estimated using 2013-2016 NHANES data, which was assumed to reflect stable prevalence in 2018, according to the authors. Among 15- to 59-year-olds, the estimated number of persons, men, and women infected with one or more disease-associated HPV types in 2018 was 42.5, 23.4, and 19.2 million, respectively, with an estimated 9.0 million (21%) 15- to 24-year-olds infected,
HBV. NHANES 2013-2018 data were used to estimate the prevalence of sexually transmitted chronic HBV infections in 2018, according to the authors. The estimated number of infections among persons aged 15 years and older in 2018 was 103,000 (51,000 men and 52,000 women). There small sample size of individuals aged 15-24 years in the NHANES database made it impossible to obtain an accurate estimate for this group, according to the authors.
HIV. Data from the National HIV Surveillance System were used to estimate the prevalence and incidence of sexually transmitted HIV infections for persons aged 13 years and older in 2018. A total of 984,000 individuals aged 13 years and older were estimated to be living with sexually transmitted HIV at the end of 2018, according to the authors. Nearly 80% were men. In the 13- to 24-year-old age bracket, there were an estimated 45,400 living with sexually transmitted HIV.
Billions in costs
Commenting on the study by the CDC researchers, Raul Romaguera, acting director for CDC’s division of STD prevention, stated in a press release: “There are significant human and financial costs associated with these infections, and we know from other studies that cuts in STI prevention efforts result in higher costs down the road. Preventing STIs could save billions in medical costs, but more importantly, prevention would improve the health and lives of millions of people.”
“About 20% of the total U.S. population had an STI at a given point in 2018, while nearly half of all incident infections occurred in people aged 15-24 years. Focusing STI prevention efforts on the 15- to 24-year-old population may be key to lowering the STI burden in the U.S.,” the researchers concluded.
The authors reported that they had no disclosures.
FROM SEXUALLY TRANSMITTED DISEASES
AI can identify biomarkers and potentially guide therapy in NSCLC

Researchers developed deep learning models that could accurately predict a patient’s PD-L1 and EGFR mutation status without the need for a biopsy. If these models are validated in prospective trials, they could guide treatment decisions in patients with NSCLC, according to the researchers.
Wei Mu, PhD, of Moffitt Cancer Center and Research Institute in Tampa, Fla., described this research at the AACR Virtual Special Conference: Artificial Intelligence, Diagnosis, and Imaging (abstract PR-03).
Rationale
Guidelines from the National Comprehensive Cancer Network (NCCN) endorse tailored treatment for patients with NSCLC; namely, immune checkpoint inhibitors for those with PD-L1-positive tumors and EGFR tyrosine kinase inhibitors for patients with tumors harboring a mutation in EGFR.
However, the conventional approach to ascertaining tumor status for these biomarkers has disadvantages, Dr. Mu noted.
“Both require biopsy, which may fail due to insufficient quality of the tissue and, particularly for NSCLC, may increase the chance of morbidity,” Dr. Mu said.
In addition, there is room for improvement in the rigor of the biomarker assays, and there can be substantial wait times for results.
To address these issues, Dr. Mu and colleagues explored an AI radiomics approach using PET/CT scans.
“We know that EGFR mutation and positive PD-L1 expression may change the metabolism of the peritumor and intratumor microenvironment,” Dr. Mu explained. “Therefore, we had the hypothesis that they can be captured by the FDG-PET/CT images.”
Results
The investigators used FDG-PET/CT images from 837 patients with advanced NSCLC treated at four institutions. The team developed AI deep learning models that generated one score for PD-L1 positivity and another score for presence of an EGFR mutation, as well as an associated algorithm that would direct patients to the appropriate treatments depending on the scores.
Results for the PD-L1 deep learning score showed good accuracy in predicting positivity for this ligand, with an area under the curve of 0.89 in the training cohort, 0.84 in the validation cohort, and 0.82 in an external test cohort, Dr. Mu reported. All exceeded the corresponding areas under the curve for maximal standardized uptake values.
Moreover, the score was prognostic and statistically indistinguishable from PD-L1 status determined by immunohistochemistry in predicting progression-free survival.
Similarly, the EGFR deep learning score showed good accuracy in predicting mutational status, with an area under the curve of 0.86 in the training cohort, 0.83 in the validation cohort, and 0.81 in an external test cohort. It outperformed a clinical score based on sex, smoking status, tumor histology, and maximal standardized uptake value in each cohort.
The EGFR deep learning score was prognostic and statistically indistinguishable from EGFR mutational status determined by polymerase chain reaction in predicting progression-free survival.
The models showed good stability when size of the input region of interest was varied, and when different radiologists delineated the region of interest, with an intraclass correlation coefficient of 0.91.
“We developed deep learning models to predict PD-L1 status and EGFR mutation with high accuracy. Using the generated deep learning scores, we obtained a noninvasive treatment decision support tool, which may be useful as a clinical decision support tool pending validation of its clinical utility in a large prospective trial,” Dr. Mu summarized. “Using our tool, NSCLC patients could be directly offered a treatment decision without the need of biopsy.”
“In the future, we will perform a prospective observational trial to compare the results of our noninvasive treatment decision tool with molecular biomarker–based NCCN guidelines,” she said.
The investigators plan to add ALK rearrangement status and prediction of serious adverse events and cachexia to the decision support tool.
Dr. Mu disclosed no conflicts of interest. The study did not have specific funding.
FROM AACR: AI, DIAGNOSIS, AND IMAGING 2021
Myocarditis by CMR may be rare after COVID-19 in elite athletes
Two recent observational studies suggest that myocarditis, at least on cardiac magnetic resonance (CMR) imaging, might be far less common in elite-level athletes recovering from COVID-19 than suggested in influential earlier reports.

Both new studies documented a rate less than one-quarter as high as those previously reported from smaller cohorts, raising questions about the diagnostic yield of CMR in highly conditioned athletes with recent COVID-19 absent other evidence, such as from biomarker assays or electrocardiography (ECG).
That could have implications for some top-tier university athletics programs that mandate CMR imaging, biomarker assays, and other evaluations for myocarditis on all their players who test positive for SARS-CoV-2 before they can return to play.
The findings collectively point to CMR imaging features that might be a hallmark of an athlete’s heart, characterized by normal myocardial remodeling brought on by elite-level exercise training, which in athletes with recent COVID-19 could be misinterpreted as evidence of myocarditis. That may have thrown off prevalence estimates in the literature, the studies’ investigators speculated.
The two studies were retrospective takes on university athletes who underwent CMR imaging while recovering from COVID-19, who were either asymptomatic or with only mild to moderate symptoms and were generally without ECG or troponin evidence of myocarditis.
One of them showed a less than 2% incidence of myocarditis by CMR among 145 such cases, a low yield for imaging that is “raising doubt regarding its utility to evaluate athletes without a clinical presentation or abnormal ancillary tests to support the diagnosis of myocarditis,” argues a report published Jan. 14 in JAMA Cardiology, with lead author Jitka Starekova, MD, University of Wisconsin – Madison.
“Part of the problem is that occult myocarditis is, at least with other viruses, a risk factor for sudden death in competitive athletes. So you don’t want to let one slip through the cracks,” senior author Scott B. Reeder, MD, PhD, from the same institution, said in an interview.
Whether a policy of routine CMR imaging in elite athletes who test positive for the new coronavirus is better than more selective use driven by symptoms or other screening tests is unknown. But the more pressing issue, Dr. Reeder said, “is if they have a normal electrocardiogram and troponins, do they still need cardiac magnetic resonance imaging?”
The current study, he said, “certainly provides helpful evidence that maybe we don’t need as many.”
The other study, which featured two control groups, saw a similarly low incidence of myocarditis by CMR in athletes with recent COVID-19. One of the control groups included university athletes imaged prior to the advent of SARS-CoV-2 in the university’s region of the country. The other consisted of apparently healthy adult nonathletes.
Armed with two non-COVID-19 cohorts and two athlete cohorts, the researchers found comparable rates of myocarditis by CMR in both the COVID-19 athletes and the healthy athletes. And only 3% of the COVID-19 athletes had the tell-tale CMR signs, notes the report, published Dec. 17 in Circulation, with lead author Daniel E. Clark, MD, MPH, Vanderbilt University Medical Center, Nashville, Tenn.
Reassurance and concern
“The incidence is much lower than we feared, and so that’s reassuring,” Clark said in an interview. Still, the athletes with myocarditis by CMR “would have been completely missed by a protocol that did not include cardiac MR, and that’s concerning,” he said. “Both had active myocarditis.”
The study’s two non-COVID-19 control groups – elite athletes in one and nonathletes in the other – allowed them to tease out the potential contribution of athletic myocardial remodeling to CMR features that could be interpreted as scar tissue, which are characterized by late gadolinium enhancement (LGE).
As it turned out, focal regions of LGE located in the right ventricular (RV) septum on the scans were often seen in both athlete cohorts. “This kind of trivial nonischemic fibrosis in the mid RV septal insertion site was common among athletic control subjects. It was seen in 24% of them, which is almost identical to the percentage that we saw in the COVID-19 athletes, 22%,” Dr. Clark said.
The LGE finding, wrote Dr. Clark and coauthors, “may represent remodeling from athletic training, and should not be conflated with myocarditis.”
Of note, the other study saw a comparable incidence of the same or a very similar CMR feature in its athletes; 26% of the Wisconsin COVID-19 athlete cohort showed limited focal LGE in the inferior RV insertion site.
“And you get a little bit in the mid-septum, as well,” Dr. Reeder said. But the sign, in the absence of any corresponding T2 abnormalities, was not judged to represent myocarditis. “We interpreted all of these studies with this potential confounder in mind.”
Conceivably, Dr. Reeder proposed, the earlier studies may have “over-called” the prevalence of myocarditis in their cohorts. “I haven’t seen their images, but it’s possible there could be false-positives.”
It’s noteworthy that the Vanderbilt and Wisconsin reports saw closely similar incidences of the tell-tale CMR sign in all the athlete cohorts whether or not COVID-19 was involved, Aaron L. Baggish, MD, Massachusetts General Hospital, Boston, said in an interview.
“It looks very much like just an unrecognized part of athletic remodeling and isn’t in any way, shape, or form implicated as being a COVID-related issue,” said Dr. Baggish, who directs the cardiovascular performance program at his center and is unaffiliated with either study.
Still, that connection remains unproven given how little is yet known about the prevalence of clinically important myocarditis in milder cases of COVID-19, according to an accompanying editorial from Jonathan H. Kim, MD, MSc.
Although isolated LGE at the interventricular RV insertion site is “more commonly described among masters-level endurance athletes, the clinical significance and prevalence of this finding in youthful athletes is uncertain and should not be assumed to be a normal consequence of intense athletic training in young competitive athletes,” argued Dr. Kim, of Emory University, Atlanta.
There’s probably little about being a young competitive athlete that would render a person any more or less prone to COVID-19 cardiac involvement, Dr. Baggish said. Rather, “I think what we’re seeing, as the studies continue to come out, is that prevalence estimates are getting into the low single digits.”
The estimates are similar to those associated with influenza before the COVID-19 age; about 2% of patients showed cardiac involvement, Dr. Baggish said. “So the degree to which COVID is a special virus from this perspective, I think, is still a topic of some debate.”
The two current studies have limitations and neither is positioned to change practice, he said. “I would say that they are both kind of important, reassuring pieces of an unfinished jigsaw puzzle. But we still don’t know what the picture on the puzzle is.”
Routine CMR for positive cases
The University of Wisconsin group looked at all of the institution’s competitive athletes who underwent gadolinium-enhanced CMR imaging and other tests during recovery from COVID-19 from the beginning of the pandemic to the end of November 2020.
The imaging was performed on average about 2 weeks after a first positive SARS-CoV-2 assay result. About one-half and one-fourth of the cohort had experienced mild and moderate symptoms, respectively, and about 17% were asymptomatic; none had been hospitalized.
All CMR scans were reviewed by two experienced radiologists for, among other things, evidence of myocarditis according to modified Lake Louise criteria, the group wrote. Those criteria are based on CMR markers of fibrosis and other characteristics of scarring from myocarditis.
Such evidence was seen in only two members of the cohort, or 1.4%, one with elevated troponins but normal with respect to other biomarkers, and the other negative for all assays. Both were asymptomatic at the time of imaging, the report noted.
The Vanderbilt analysis from Dr. Clark and associates centered on 59 university athletes recently with COVID-19 who underwent CMR imaging along with other tests about 3 weeks after confirmation of SARS-CoV-2 infection. Symptoms had been mild in 78% of the group, and the remainder were asymptomatic.
They were compared with 60 retrospectively identified college athletes and elite-conditioned military personnel who had undergone CMR imaging prior to the advent of COVID-19, and to 27 apparently healthy nonathlete adults in whom CMR had been previously performed to define normal CMR imaging criteria at that center.
The only two post-COVID-19 athletes who met modified Lake Louise criteria for myocarditis showed no abnormalities on ECG or myocardial strain echocardiography, and had normal troponins, the group reported.
The COVID-19 athletes showed increased cardiac chamber volumes and myocardial mass “consistent with athletic remodeling,” compared with the healthy control subjects, the group wrote. But “most standard CMR parameters were similar” between the COVID-19 athletes and the control athletes, consistent with the 22% and 24% rates, respectively, for the finding of focal late LGE isolated to the inferoseptal RV insertion site.
At the end of the day, all published experiences on athletes with recent COVID-19 “are descriptive studies, without any hint of follow-up,” Dr. Baggish noted, so their clinical implications are unknown.
“We need time to sit and watch to see what happens to these individuals,” he said. “And if the answer is nothing, then that’s a very reassuring story. If the answer is that we start to see events, then that’s really important for us to take stock of.”
Dr. Starekova had no disclosures. Dr. Reeder reports that the University of Wisconsin receives research support from GE Healthcare and Bracco Diagnostics; and that he has ownership interests in Calimetrix, Reveal Pharmaceuticals, Cellectar Biosciences, Elucent Medical, and HeartVista; and has received grant support from Bayer Healthcare. Disclosures for the other coauthors are in the report. Dr. Clark and coauthors had no disclosures. Dr. Baggish reported no conflicts. Kim discloses receiving funding from the National Heart, Lung, and Blood Institute; compensation as team cardiologist for the Atlanta Falcons; and research stipends from the Atlanta Track Club.
A version of this article first appeared on Medscape.com.
Two recent observational studies suggest that myocarditis, at least on cardiac magnetic resonance (CMR) imaging, might be far less common in elite-level athletes recovering from COVID-19 than suggested in influential earlier reports.
Both new studies documented a rate less than one-quarter as high as those previously reported from smaller cohorts, raising questions about the diagnostic yield of CMR in highly conditioned athletes with recent COVID-19 absent other evidence, such as from biomarker assays or electrocardiography (ECG).
That could have implications for some top-tier university athletics programs that mandate CMR imaging, biomarker assays, and other evaluations for myocarditis on all their players who test positive for SARS-CoV-2 before they can return to play.
The findings collectively point to CMR imaging features that might be a hallmark of an athlete’s heart, characterized by normal myocardial remodeling brought on by elite-level exercise training, which in athletes with recent COVID-19 could be misinterpreted as evidence of myocarditis. That may have thrown off prevalence estimates in the literature, the studies’ investigators speculated.
The two studies were retrospective takes on university athletes who underwent CMR imaging while recovering from COVID-19, who were either asymptomatic or with only mild to moderate symptoms and were generally without ECG or troponin evidence of myocarditis.
One of them showed a less than 2% incidence of myocarditis by CMR among 145 such cases, a low yield for imaging that is “raising doubt regarding its utility to evaluate athletes without a clinical presentation or abnormal ancillary tests to support the diagnosis of myocarditis,” argues a report published Jan. 14 in JAMA Cardiology, with lead author Jitka Starekova, MD, University of Wisconsin – Madison.
“Part of the problem is that occult myocarditis is, at least with other viruses, a risk factor for sudden death in competitive athletes. So you don’t want to let one slip through the cracks,” senior author Scott B. Reeder, MD, PhD, from the same institution, said in an interview.
Whether a policy of routine CMR imaging in elite athletes who test positive for the new coronavirus is better than more selective use driven by symptoms or other screening tests is unknown. But the more pressing issue, Dr. Reeder said, “is if they have a normal electrocardiogram and troponins, do they still need cardiac magnetic resonance imaging?”
The current study, he said, “certainly provides helpful evidence that maybe we don’t need as many.”
The other study, which featured two control groups, saw a similarly low incidence of myocarditis by CMR in athletes with recent COVID-19. One of the control groups included university athletes imaged prior to the advent of SARS-CoV-2 in the university’s region of the country. The other consisted of apparently healthy adult nonathletes.
Armed with two non-COVID-19 cohorts and two athlete cohorts, the researchers found comparable rates of myocarditis by CMR in both the COVID-19 athletes and the healthy athletes. And only 3% of the COVID-19 athletes had the tell-tale CMR signs, notes the report, published Dec. 17 in Circulation, with lead author Daniel E. Clark, MD, MPH, Vanderbilt University Medical Center, Nashville, Tenn.
Reassurance and concern
“The incidence is much lower than we feared, and so that’s reassuring,” Clark said in an interview. Still, the athletes with myocarditis by CMR “would have been completely missed by a protocol that did not include cardiac MR, and that’s concerning,” he said. “Both had active myocarditis.”
The study’s two non-COVID-19 control groups – elite athletes in one and nonathletes in the other – allowed them to tease out the potential contribution of athletic myocardial remodeling to CMR features that could be interpreted as scar tissue, which are characterized by late gadolinium enhancement (LGE).
As it turned out, focal regions of LGE located in the right ventricular (RV) septum on the scans were often seen in both athlete cohorts. “This kind of trivial nonischemic fibrosis in the mid RV septal insertion site was common among athletic control subjects. It was seen in 24% of them, which is almost identical to the percentage that we saw in the COVID-19 athletes, 22%,” Dr. Clark said.
The LGE finding, wrote Dr. Clark and coauthors, “may represent remodeling from athletic training, and should not be conflated with myocarditis.”
Of note, the other study saw a comparable incidence of the same or a very similar CMR feature in its athletes; 26% of the Wisconsin COVID-19 athlete cohort showed limited focal LGE in the inferior RV insertion site.
“And you get a little bit in the mid-septum, as well,” Dr. Reeder said. But the sign, in the absence of any corresponding T2 abnormalities, was not judged to represent myocarditis. “We interpreted all of these studies with this potential confounder in mind.”
Conceivably, Dr. Reeder proposed, the earlier studies may have “over-called” the prevalence of myocarditis in their cohorts. “I haven’t seen their images, but it’s possible there could be false-positives.”
It’s noteworthy that the Vanderbilt and Wisconsin reports saw closely similar incidences of the tell-tale CMR sign in all the athlete cohorts whether or not COVID-19 was involved, Aaron L. Baggish, MD, Massachusetts General Hospital, Boston, said in an interview.
“It looks very much like just an unrecognized part of athletic remodeling and isn’t in any way, shape, or form implicated as being a COVID-related issue,” said Dr. Baggish, who directs the cardiovascular performance program at his center and is unaffiliated with either study.
Still, that connection remains unproven given how little is yet known about the prevalence of clinically important myocarditis in milder cases of COVID-19, according to an accompanying editorial from Jonathan H. Kim, MD, MSc.
Although isolated LGE at the interventricular RV insertion site is “more commonly described among masters-level endurance athletes, the clinical significance and prevalence of this finding in youthful athletes is uncertain and should not be assumed to be a normal consequence of intense athletic training in young competitive athletes,” argued Dr. Kim, of Emory University, Atlanta.
There’s probably little about being a young competitive athlete that would render a person any more or less prone to COVID-19 cardiac involvement, Dr. Baggish said. Rather, “I think what we’re seeing, as the studies continue to come out, is that prevalence estimates are getting into the low single digits.”
The estimates are similar to those associated with influenza before the COVID-19 age; about 2% of patients showed cardiac involvement, Dr. Baggish said. “So the degree to which COVID is a special virus from this perspective, I think, is still a topic of some debate.”
The two current studies have limitations and neither is positioned to change practice, he said. “I would say that they are both kind of important, reassuring pieces of an unfinished jigsaw puzzle. But we still don’t know what the picture on the puzzle is.”
Routine CMR for positive cases
The University of Wisconsin group looked at all of the institution’s competitive athletes who underwent gadolinium-enhanced CMR imaging and other tests during recovery from COVID-19 from the beginning of the pandemic to the end of November 2020.
The imaging was performed on average about 2 weeks after a first positive SARS-CoV-2 assay result. About one-half and one-fourth of the cohort had experienced mild and moderate symptoms, respectively, and about 17% were asymptomatic; none had been hospitalized.
All CMR scans were reviewed by two experienced radiologists for, among other things, evidence of myocarditis according to modified Lake Louise criteria, the group wrote. Those criteria are based on CMR markers of fibrosis and other characteristics of scarring from myocarditis.
Such evidence was seen in only two members of the cohort, or 1.4%, one with elevated troponins but normal with respect to other biomarkers, and the other negative for all assays. Both were asymptomatic at the time of imaging, the report noted.
The Vanderbilt analysis from Dr. Clark and associates centered on 59 university athletes recently with COVID-19 who underwent CMR imaging along with other tests about 3 weeks after confirmation of SARS-CoV-2 infection. Symptoms had been mild in 78% of the group, and the remainder were asymptomatic.
They were compared with 60 retrospectively identified college athletes and elite-conditioned military personnel who had undergone CMR imaging prior to the advent of COVID-19, and to 27 apparently healthy nonathlete adults in whom CMR had been previously performed to define normal CMR imaging criteria at that center.
The only two post-COVID-19 athletes who met modified Lake Louise criteria for myocarditis showed no abnormalities on ECG or myocardial strain echocardiography, and had normal troponins, the group reported.
The COVID-19 athletes showed increased cardiac chamber volumes and myocardial mass “consistent with athletic remodeling,” compared with the healthy control subjects, the group wrote. But “most standard CMR parameters were similar” between the COVID-19 athletes and the control athletes, consistent with the 22% and 24% rates, respectively, for the finding of focal late LGE isolated to the inferoseptal RV insertion site.
At the end of the day, all published experiences on athletes with recent COVID-19 “are descriptive studies, without any hint of follow-up,” Dr. Baggish noted, so their clinical implications are unknown.
“We need time to sit and watch to see what happens to these individuals,” he said. “And if the answer is nothing, then that’s a very reassuring story. If the answer is that we start to see events, then that’s really important for us to take stock of.”
Dr. Starekova had no disclosures. Dr. Reeder reports that the University of Wisconsin receives research support from GE Healthcare and Bracco Diagnostics; and that he has ownership interests in Calimetrix, Reveal Pharmaceuticals, Cellectar Biosciences, Elucent Medical, and HeartVista; and has received grant support from Bayer Healthcare. Disclosures for the other coauthors are in the report. Dr. Clark and coauthors had no disclosures. Dr. Baggish reported no conflicts. Kim discloses receiving funding from the National Heart, Lung, and Blood Institute; compensation as team cardiologist for the Atlanta Falcons; and research stipends from the Atlanta Track Club.
A version of this article first appeared on Medscape.com.
Intraoperative rupture of ovarian cancer: Does it worsen outcomes?
Intact removal of an ovarian cyst is a well-established gynecologic surgical principle because ovarian cancer is definitively diagnosed only in retrospect (after ovarian extraction) and intraoperative cyst rupture upstages an otherwise nonmetastatic cancer to stage IC. This lumps cancers that are ruptured during surgical extraction together with those that have spontaneously ruptured or have surface excrescences. The theoretical rationale for this “lumping” is that contact between malignant cells from the ruptured cyst may take hold on peritoneal surfaces resulting in development of metastases. To offset this theoretical risk, it has been recommended that all stage IC ovarian cancer is treated with chemotherapy, whereas low-grade stage IA and IB cancers generally are not. No conscientious surgeon wants their surgical intervention to be the cause of a patient needing toxic chemotherapy. But is the contact between malignant cyst fluid and the peritoneum truly as bad as a spontaneous breach of the surface of the tumor? Or is cyst rupture a confounder for other adverse prognostic features, such as histologic cell type and dense pelvic attachments? If ovarian cyst rupture is an independent risk factor for patients with stage I ovarian cancer, strategies should be employed to avoid this occurrence, and we should understand how to counsel and treat patients in whom this has occurred.
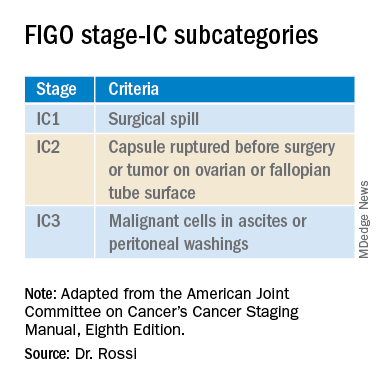
In 2017 the International Federation of Gynecology and Obstetrics (FIGO) staging of epithelial ovarian cancer subcategorized stage IC. This group encompasses women with contact between malignant cells and the peritoneum in the absence of other extraovarian disease. The table includes these distinct groupings. Stage IC1 includes patients in whom intraoperative spill occurred. Stage IC2 includes women with preoperative cyst rupture, and or microscopic or macroscopic surface involvement because the data support that these cases carry a poorer prognosis, compared with those with intraoperative rupture (IC1).1 The final subcategory, IC3, includes women who have washings (obtained at the onset of surgery, prior to manipulation of the tumor) that were positive for malignant cells, denoting preexisting contact between the tumor and peritoneum and a phenotypically more aggressive tumor.
The clinical significance of ovarian cancer capsule rupture has been evaluated in multiple studies with some mixed results.1 Consistently, it is reported that preoperative rupture, surface or capsular involvement, and preexisting peritoneal circulation of metastatic cells all portend a poorer prognosis; however, it is less clear that iatrogenic surgical rupture has the same deleterious association. In a large retrospective series from Japan, the authors evaluated 15,163 cases of stage I ovarian cancer and identified 7,227 cases of iatrogenic (intraoperative) cyst rupture.2 These cases were significantly more likely to occur among clear cell cancers, and were more likely to occur in younger patients. Worse prognosis was associated with cell type (clear cell cancers), but non–clear cell cancers (such as serous, mucinous, and endometrioid) did not have a higher hazard ratio for death when intraoperative rupture occurred. But why would intraoperative cyst rupture result in worse prognosis for only one histologic cell type? The authors hypothesized that perhaps rupture was more likely to occur during extraction of these clear cell tumors because they were associated with dense adhesions from associated endometriosis, and perhaps an adverse biologic phenomenon associated with infiltrative endometriosis is driving the behavior of this cancer.
The Japanese study also looked at the effect of chemotherapy on these same patients’ outcomes. Interestingly, the addition of chemotherapy did not improve survival for the patients with stage IC1 cancers, which was in contrast to the improved survival seen when chemotherapy was given to those with spontaneous rupture or ovarian surface involvement (IC2, IC3). These data support differentiating the subgroups of stage IC cancer in treatment decision-making, and suggest that adjuvant chemotherapy might be avoided for patients with nonclear cell stage IC1 ovarian cancer. While the outcomes are worse for patients with ruptured clear cell cancers, current therapeutic options for clear cell cancers are limited because of their known resistance to traditional agents, and outcomes for women with clear cell cancer can be worse across all stages.
While cyst rupture may not always negatively affect prognosis, the goal of surgery remains an intact removal, which influences decisions regarding surgical approach. Most adnexal masses are removed via minimally invasive surgery (MIS). MIS is associated with benefits of morbidity and cost, and therefore should be considered wherever feasible. However, MIS is associated with an increased risk of ovarian cyst rupture, likely because of the rigid instrumentation used when approaching a curved structure, in addition to the disparity in size of the pathology, compared with the extraction site incision.3 When weighing the benefits and risks of different surgical approaches, it is important to gauge the probability of malignancy. Not all complex ovarian masses associated with elevations in tumor markers are malignant, and certainly most that are associated with normal tumor markers are not. If the preoperative clinical data suggest that the mass is more likely to be malignant (e.g., mostly solid, vascular tumors with very elevated tumor markers), consideration might be made to abandoning a purely minimally invasive approach to a hand-assisted MIS or laparotomy approach. However, it would seem that abandoning an MIS approach to remove every ovarian cyst is unwise given that there is clear patient benefit with MIS and, as discussed above, most cases of iatrogenic malignant cyst rupture are unavoidable even with laparotomy, and do not necessarily independently portend poorer survival or mandate chemotherapy.
Surgeons should be both nuanced and flexible and apply some basic rules of thumb when approaching the diagnostically uncertain adnexal mass. Peritoneal washings should be obtained at the commencement of the case to discriminate those cases of true stage IC3. The peritoneum parallel to the ovarian vessel should be extensively opened to a level above the pelvic brim. In order to do this, the physiological attachments between the sigmoid colon or cecum and the suspensory ligament of the ovary may need to be carefully mobilized. This allows for retroperitoneal identification of the ureter and skeletonization of the ovarian vessels at least 2 cm proximal to their insertion into the ovary and avoidance of contact with the ovary itself (which may have a fragile capsule) or incomplete ovarian resection. If the ovary remains invested close to the sidewall or colonic structures and the appropriate peritoneal and retroperitoneal mobilization has not occurred, the surgeon may unavoidably rupture the ovarian cyst as they try to “hug” the ovary with their bites of tissue in an attempt to avoid visceral injury. There is little role for an ovarian cystectomy in a postmenopausal woman undergoing surgery for a complex adnexal mass, particularly if she has elevated tumor markers, because the process of performing ovarian cystectomy commonly invokes cyst rupture or fragmentation. Ovarian cystectomy should be reserved for premenopausal women with adnexal masses at low suspicion for malignancy. If the adnexa appears densely adherent to adjacent structures – for example, associated with infiltrative endometriosis – consideration for laparotomy or a hand-assisted approach may be necessary; in such cases, even open surgery can result in cyst rupture, and the morbidity of conversion to laparotomy should be weighed for individual cases.

Finally, retrieval of the ovarian specimen should occur intact without morcellation. There should be no uncontained morcellation of adnexal structures during retrieval of even normal-appearing ovaries. The preferred retrieval method is to place the adnexa in an appropriately sized retrieval bag, after which contained morcellation or drainage can occur to facilitate removal through a laparoscopic incision. Contained morcellation is very difficult for large solid masses through a laparoscopic port site; in these cases, extension of the incision may be necessary.
While operative spill of an ovarian cancer does upstage nonmetastatic ovarian cancer, it is unclear that, in most cases, this is independently associated with worse prognosis, and chemotherapy may not always be of added value. However, best surgical practice should always include strategies to minimize the chance of rupture when approaching adnexal masses, particularly those at highest likelihood of malignancy.
References
1. Kim HS et al. Eur J Surg Oncol. 2013 Mar 39(3):279-89.
2. Matsuo K et al. Obstet Gynecol. 2019 Nov;134(5):1017-26.
3. Matsuo K et al. JAMA Oncol. 2020 Jul 1;6(7):1110-3.
Dr. Rossi is assistant professor in the division of gynecologic oncology at the University of North Carolina at Chapel Hill.
Intact removal of an ovarian cyst is a well-established gynecologic surgical principle because ovarian cancer is definitively diagnosed only in retrospect (after ovarian extraction) and intraoperative cyst rupture upstages an otherwise nonmetastatic cancer to stage IC. This lumps cancers that are ruptured during surgical extraction together with those that have spontaneously ruptured or have surface excrescences. The theoretical rationale for this “lumping” is that contact between malignant cells from the ruptured cyst may take hold on peritoneal surfaces resulting in development of metastases. To offset this theoretical risk, it has been recommended that all stage IC ovarian cancer is treated with chemotherapy, whereas low-grade stage IA and IB cancers generally are not. No conscientious surgeon wants their surgical intervention to be the cause of a patient needing toxic chemotherapy. But is the contact between malignant cyst fluid and the peritoneum truly as bad as a spontaneous breach of the surface of the tumor? Or is cyst rupture a confounder for other adverse prognostic features, such as histologic cell type and dense pelvic attachments? If ovarian cyst rupture is an independent risk factor for patients with stage I ovarian cancer, strategies should be employed to avoid this occurrence, and we should understand how to counsel and treat patients in whom this has occurred.
In 2017 the International Federation of Gynecology and Obstetrics (FIGO) staging of epithelial ovarian cancer subcategorized stage IC. This group encompasses women with contact between malignant cells and the peritoneum in the absence of other extraovarian disease. The table includes these distinct groupings. Stage IC1 includes patients in whom intraoperative spill occurred. Stage IC2 includes women with preoperative cyst rupture, and or microscopic or macroscopic surface involvement because the data support that these cases carry a poorer prognosis, compared with those with intraoperative rupture (IC1).1 The final subcategory, IC3, includes women who have washings (obtained at the onset of surgery, prior to manipulation of the tumor) that were positive for malignant cells, denoting preexisting contact between the tumor and peritoneum and a phenotypically more aggressive tumor.
The clinical significance of ovarian cancer capsule rupture has been evaluated in multiple studies with some mixed results.1 Consistently, it is reported that preoperative rupture, surface or capsular involvement, and preexisting peritoneal circulation of metastatic cells all portend a poorer prognosis; however, it is less clear that iatrogenic surgical rupture has the same deleterious association. In a large retrospective series from Japan, the authors evaluated 15,163 cases of stage I ovarian cancer and identified 7,227 cases of iatrogenic (intraoperative) cyst rupture.2 These cases were significantly more likely to occur among clear cell cancers, and were more likely to occur in younger patients. Worse prognosis was associated with cell type (clear cell cancers), but non–clear cell cancers (such as serous, mucinous, and endometrioid) did not have a higher hazard ratio for death when intraoperative rupture occurred. But why would intraoperative cyst rupture result in worse prognosis for only one histologic cell type? The authors hypothesized that perhaps rupture was more likely to occur during extraction of these clear cell tumors because they were associated with dense adhesions from associated endometriosis, and perhaps an adverse biologic phenomenon associated with infiltrative endometriosis is driving the behavior of this cancer.
The Japanese study also looked at the effect of chemotherapy on these same patients’ outcomes. Interestingly, the addition of chemotherapy did not improve survival for the patients with stage IC1 cancers, which was in contrast to the improved survival seen when chemotherapy was given to those with spontaneous rupture or ovarian surface involvement (IC2, IC3). These data support differentiating the subgroups of stage IC cancer in treatment decision-making, and suggest that adjuvant chemotherapy might be avoided for patients with nonclear cell stage IC1 ovarian cancer. While the outcomes are worse for patients with ruptured clear cell cancers, current therapeutic options for clear cell cancers are limited because of their known resistance to traditional agents, and outcomes for women with clear cell cancer can be worse across all stages.
While cyst rupture may not always negatively affect prognosis, the goal of surgery remains an intact removal, which influences decisions regarding surgical approach. Most adnexal masses are removed via minimally invasive surgery (MIS). MIS is associated with benefits of morbidity and cost, and therefore should be considered wherever feasible. However, MIS is associated with an increased risk of ovarian cyst rupture, likely because of the rigid instrumentation used when approaching a curved structure, in addition to the disparity in size of the pathology, compared with the extraction site incision.3 When weighing the benefits and risks of different surgical approaches, it is important to gauge the probability of malignancy. Not all complex ovarian masses associated with elevations in tumor markers are malignant, and certainly most that are associated with normal tumor markers are not. If the preoperative clinical data suggest that the mass is more likely to be malignant (e.g., mostly solid, vascular tumors with very elevated tumor markers), consideration might be made to abandoning a purely minimally invasive approach to a hand-assisted MIS or laparotomy approach. However, it would seem that abandoning an MIS approach to remove every ovarian cyst is unwise given that there is clear patient benefit with MIS and, as discussed above, most cases of iatrogenic malignant cyst rupture are unavoidable even with laparotomy, and do not necessarily independently portend poorer survival or mandate chemotherapy.
Surgeons should be both nuanced and flexible and apply some basic rules of thumb when approaching the diagnostically uncertain adnexal mass. Peritoneal washings should be obtained at the commencement of the case to discriminate those cases of true stage IC3. The peritoneum parallel to the ovarian vessel should be extensively opened to a level above the pelvic brim. In order to do this, the physiological attachments between the sigmoid colon or cecum and the suspensory ligament of the ovary may need to be carefully mobilized. This allows for retroperitoneal identification of the ureter and skeletonization of the ovarian vessels at least 2 cm proximal to their insertion into the ovary and avoidance of contact with the ovary itself (which may have a fragile capsule) or incomplete ovarian resection. If the ovary remains invested close to the sidewall or colonic structures and the appropriate peritoneal and retroperitoneal mobilization has not occurred, the surgeon may unavoidably rupture the ovarian cyst as they try to “hug” the ovary with their bites of tissue in an attempt to avoid visceral injury. There is little role for an ovarian cystectomy in a postmenopausal woman undergoing surgery for a complex adnexal mass, particularly if she has elevated tumor markers, because the process of performing ovarian cystectomy commonly invokes cyst rupture or fragmentation. Ovarian cystectomy should be reserved for premenopausal women with adnexal masses at low suspicion for malignancy. If the adnexa appears densely adherent to adjacent structures – for example, associated with infiltrative endometriosis – consideration for laparotomy or a hand-assisted approach may be necessary; in such cases, even open surgery can result in cyst rupture, and the morbidity of conversion to laparotomy should be weighed for individual cases.
Finally, retrieval of the ovarian specimen should occur intact without morcellation. There should be no uncontained morcellation of adnexal structures during retrieval of even normal-appearing ovaries. The preferred retrieval method is to place the adnexa in an appropriately sized retrieval bag, after which contained morcellation or drainage can occur to facilitate removal through a laparoscopic incision. Contained morcellation is very difficult for large solid masses through a laparoscopic port site; in these cases, extension of the incision may be necessary.
While operative spill of an ovarian cancer does upstage nonmetastatic ovarian cancer, it is unclear that, in most cases, this is independently associated with worse prognosis, and chemotherapy may not always be of added value. However, best surgical practice should always include strategies to minimize the chance of rupture when approaching adnexal masses, particularly those at highest likelihood of malignancy.
References
1. Kim HS et al. Eur J Surg Oncol. 2013 Mar 39(3):279-89.
2. Matsuo K et al. Obstet Gynecol. 2019 Nov;134(5):1017-26.
3. Matsuo K et al. JAMA Oncol. 2020 Jul 1;6(7):1110-3.
Dr. Rossi is assistant professor in the division of gynecologic oncology at the University of North Carolina at Chapel Hill.
Advice for Applying to Dermatology as an Applicant of Color: Keep Going
As the dermatology admissions cycle restarts, I reflect back on my journey as a Black woman applying to dermatology. Before deciding, I internally questioned, “Is dermatology right for me?” There were not many faces that looked like mine within the field. After committing to dermatology, I asked dermatologists—almost any who would spare a few minutes to talk to me—how to get into this specialty and be successful when applying. I spoke to advisors and friends at my home department, emailed dermatologists far and wide, approached conference lecturers after their presentations, sought out advice from current residents, and asked prior applicants what they thought was important to match into dermatology. There had been too many unmatched students before me who had achieved good grades and aced US Medical Licensing Examination Step 1. The equation for success was missing a variable.
Mentorship
One weekend, I attended a conference for patients with skin of color. I talked to a student who had taken a year off (retroactively after not matching in prior years). She told me that the biggest key to matching was mentorship; forming a strong relationship with a clinician or investigator who had seen how well you perform in clinic or during research was paramount. Having a collaborator or instructor write you a letter of recommendation and make calls on your behalf could be the difference between matching or taking another year off. More often than any other aspect of the application, it is a lack of mentorship that many students of color do not have access to when pursuing a highly competitive specialty such as dermatology.1,2 In such a small field, applicants need someone to vouch for them—to speak on their behalf compassionately, invite them to collaborate on research projects, and inform them of conference opportunities to present their work.
Representation in Dermatology
We are told that you can accomplish anything with hard work and grit; however, without the platform to show how effectively you have worked, your efforts may never be seen. The diversity statistics for dermatology are clear and disheartening. Although 13% of Americans are Black, only 3% of all dermatologists are Black.2,3 Just over 4% of dermatologists are Hispanic compared with 16% of the general population. The Association of American Medical Colleges reported that the overall 2015 medical school acceptance rate was 41%.4 White (44%), Asian (42%), and Hispanic or Latino (42%) applicants all had similar acceptance rates; however, only one-third of Black applicants were accepted. At graduation in 2015, White individuals were 51% of matriculants. Medical graduates were only 6% Black.4 What percentage of these 6% Black graduates thought about applying into dermatology? How many had someone to encourage them to pursue the specialty or a mentor who they could ask about the nuances and strategy to be a competitive applicant?
In addition to discrimination, social psychologists have described stereotype threat, a risk for minorities that occurs when negative stereotypes associated with an individual’s group status become relevant after perceived cues.5 Therefore, some students of color might avoid competitive specialties such as dermatology because of this internalized lack of confidence in their own abilities and performance thinking, “I’ll never be good enough to match into dermatology.” I have seen this discouraging perception when classmates doubt their own talent and achievements, which is a variation of imposter syndrome—when an individual doubts their abilities and may have an internal fear of eventually being exposed as a fraud.
After several publications received press coverage on the lack of diversity in dermatology applicant selection,3,6,7 I looked around at my interview group composed of 25 to 40 interviewees and on average saw 2 to 3 Black applicants around the room. We always found a way during the packed interview day to find time to introduce ourselves. I almost always left with a new friend who shared feelings of anxiety, uncertainty, hope, and gratefulness from being the few Black people in the room. Bootstrapping might have helped us to make it into medical school, pass shelf examinations, and even get a great Step 1 score. However, the addition of mentorship—or better yet, sponsorship—helped to get us an interview in this competitive field. The impact of mentorship has been especially true for research, which has shown that students often gravitate toward mentors who look like them.8 However, the reality is that many Black and Hispanic students may be at a disadvantage for finding mentors in this way given that there are less than 10% of dermatologists who identify as individuals with skin of color. During the process of applying to dermatology, my greatest advocates were ethnically and racially diverse. The proverb is that it takes a village to raise a child; this reality extends to the medical student’s ability to thrive, not only in residency but also in the residency application process. My sponsors have been as different as their advice and perspectives, which helped me to think about the varied ways I viewed myself as an applicant and shaped what I looked for in residency.
Final Thoughts
Now that I have been a resident in the Department of Dermatology at the Warren Alpert Medical School of Brown University, I excitedly look for opportunities to mentor medical students and help create equity in the application process. Dermatology needs to increase the representation of minority applicants. Efforts to encourage minority medical students include joining the National Medical Association dermatology section through the Student National Medical Association, membership in the Skin of Color Society, getting involved with the Dermatology Interest Group at more medical schools, and awareness of medical student–friendly dermatology conferences. In addition, I was able to establish lifelong mentorship through the American Academy of Dermatology’s Minority Diversity Mentorship Program. One important component is an enhanced effort to increase the number of financial scholarships for away rotations (post–coronavirus disease 2019 pandemic) or application expenses geared to help underrepresented minorities. To truly increase diversity in dermatology, perhaps we need more physicians and residents willing to encourage students of color that dermatology is achievable.
- Brunsma DL, Embrick DG, Shin JH. Graduate students of color: race, racism, and mentoring in the white waters of academia. Sociology of Race and Ethnicity. 2017;3:1-13.
- Oyesanya T, Grossberg AL, Okoye GA. Increasing minority representation in the dermatology department: the Johns Hopkins experience. JAMA Dermatol. 2018;154:1133-1134.
- Pandya AG, Alexis AF, Berger TG, et al. Increasing racial and ethnic diversity in dermatology: a call to action. J Am Acad Dermatol. 2016;74:584-587.
- Current trends in medical education. American Association of Medical Colleges. Accessed January 20, 2021. http://www.aamcdiversityfactsandfigures2016.org/report-section/section-3/
- Spencer SJ, Logel C, Davies PG. Stereotype threat [published online September 10, 2015]. Annu Rev Psychol. 2016;67:415-437.
- Granstein RD, Cornelius L, Shinkai K. Diversity in dermatology—a call for action. JAMA Dermatol. 2017;153:499-500.
- Pritchett EN, Pandya AG, Ferguson NN, et al. Diversity in dermatology: roadmap for improvement. J Am Acad Dermatol. 2018;79:337-341.
- Blake-Beard S, Bayne ML, Crosby FJ, et al. Matching by race and gender in mentoring relationships: keeping our eyes on the prize. J Social Issues. 2011;67:622-643.
As the dermatology admissions cycle restarts, I reflect back on my journey as a Black woman applying to dermatology. Before deciding, I internally questioned, “Is dermatology right for me?” There were not many faces that looked like mine within the field. After committing to dermatology, I asked dermatologists—almost any who would spare a few minutes to talk to me—how to get into this specialty and be successful when applying. I spoke to advisors and friends at my home department, emailed dermatologists far and wide, approached conference lecturers after their presentations, sought out advice from current residents, and asked prior applicants what they thought was important to match into dermatology. There had been too many unmatched students before me who had achieved good grades and aced US Medical Licensing Examination Step 1. The equation for success was missing a variable.
Mentorship
One weekend, I attended a conference for patients with skin of color. I talked to a student who had taken a year off (retroactively after not matching in prior years). She told me that the biggest key to matching was mentorship; forming a strong relationship with a clinician or investigator who had seen how well you perform in clinic or during research was paramount. Having a collaborator or instructor write you a letter of recommendation and make calls on your behalf could be the difference between matching or taking another year off. More often than any other aspect of the application, it is a lack of mentorship that many students of color do not have access to when pursuing a highly competitive specialty such as dermatology.1,2 In such a small field, applicants need someone to vouch for them—to speak on their behalf compassionately, invite them to collaborate on research projects, and inform them of conference opportunities to present their work.
Representation in Dermatology
We are told that you can accomplish anything with hard work and grit; however, without the platform to show how effectively you have worked, your efforts may never be seen. The diversity statistics for dermatology are clear and disheartening. Although 13% of Americans are Black, only 3% of all dermatologists are Black.2,3 Just over 4% of dermatologists are Hispanic compared with 16% of the general population. The Association of American Medical Colleges reported that the overall 2015 medical school acceptance rate was 41%.4 White (44%), Asian (42%), and Hispanic or Latino (42%) applicants all had similar acceptance rates; however, only one-third of Black applicants were accepted. At graduation in 2015, White individuals were 51% of matriculants. Medical graduates were only 6% Black.4 What percentage of these 6% Black graduates thought about applying into dermatology? How many had someone to encourage them to pursue the specialty or a mentor who they could ask about the nuances and strategy to be a competitive applicant?
In addition to discrimination, social psychologists have described stereotype threat, a risk for minorities that occurs when negative stereotypes associated with an individual’s group status become relevant after perceived cues.5 Therefore, some students of color might avoid competitive specialties such as dermatology because of this internalized lack of confidence in their own abilities and performance thinking, “I’ll never be good enough to match into dermatology.” I have seen this discouraging perception when classmates doubt their own talent and achievements, which is a variation of imposter syndrome—when an individual doubts their abilities and may have an internal fear of eventually being exposed as a fraud.
After several publications received press coverage on the lack of diversity in dermatology applicant selection,3,6,7 I looked around at my interview group composed of 25 to 40 interviewees and on average saw 2 to 3 Black applicants around the room. We always found a way during the packed interview day to find time to introduce ourselves. I almost always left with a new friend who shared feelings of anxiety, uncertainty, hope, and gratefulness from being the few Black people in the room. Bootstrapping might have helped us to make it into medical school, pass shelf examinations, and even get a great Step 1 score. However, the addition of mentorship—or better yet, sponsorship—helped to get us an interview in this competitive field. The impact of mentorship has been especially true for research, which has shown that students often gravitate toward mentors who look like them.8 However, the reality is that many Black and Hispanic students may be at a disadvantage for finding mentors in this way given that there are less than 10% of dermatologists who identify as individuals with skin of color. During the process of applying to dermatology, my greatest advocates were ethnically and racially diverse. The proverb is that it takes a village to raise a child; this reality extends to the medical student’s ability to thrive, not only in residency but also in the residency application process. My sponsors have been as different as their advice and perspectives, which helped me to think about the varied ways I viewed myself as an applicant and shaped what I looked for in residency.
Final Thoughts
Now that I have been a resident in the Department of Dermatology at the Warren Alpert Medical School of Brown University, I excitedly look for opportunities to mentor medical students and help create equity in the application process. Dermatology needs to increase the representation of minority applicants. Efforts to encourage minority medical students include joining the National Medical Association dermatology section through the Student National Medical Association, membership in the Skin of Color Society, getting involved with the Dermatology Interest Group at more medical schools, and awareness of medical student–friendly dermatology conferences. In addition, I was able to establish lifelong mentorship through the American Academy of Dermatology’s Minority Diversity Mentorship Program. One important component is an enhanced effort to increase the number of financial scholarships for away rotations (post–coronavirus disease 2019 pandemic) or application expenses geared to help underrepresented minorities. To truly increase diversity in dermatology, perhaps we need more physicians and residents willing to encourage students of color that dermatology is achievable.
- Brunsma DL, Embrick DG, Shin JH. Graduate students of color: race, racism, and mentoring in the white waters of academia. Sociology of Race and Ethnicity. 2017;3:1-13.
- Oyesanya T, Grossberg AL, Okoye GA. Increasing minority representation in the dermatology department: the Johns Hopkins experience. JAMA Dermatol. 2018;154:1133-1134.
- Pandya AG, Alexis AF, Berger TG, et al. Increasing racial and ethnic diversity in dermatology: a call to action. J Am Acad Dermatol. 2016;74:584-587.
- Current trends in medical education. American Association of Medical Colleges. Accessed January 20, 2021. http://www.aamcdiversityfactsandfigures2016.org/report-section/section-3/
- Spencer SJ, Logel C, Davies PG. Stereotype threat [published online September 10, 2015]. Annu Rev Psychol. 2016;67:415-437.
- Granstein RD, Cornelius L, Shinkai K. Diversity in dermatology—a call for action. JAMA Dermatol. 2017;153:499-500.
- Pritchett EN, Pandya AG, Ferguson NN, et al. Diversity in dermatology: roadmap for improvement. J Am Acad Dermatol. 2018;79:337-341.
- Blake-Beard S, Bayne ML, Crosby FJ, et al. Matching by race and gender in mentoring relationships: keeping our eyes on the prize. J Social Issues. 2011;67:622-643.
Resident Pearl
- Finding a strong mentor who can both advocate for and help guide a student of color through the admissions process is integral to matching into dermatology

USMLE stuns again: Clinical skills test permanently ended
The Step 2 Clinical Skills (CS) test for medical school students and graduates has been permanently canceled, cosponsors of the U.S. Medical Licensing Examination (USMLE) announced in a press release this afternoon.
As previously reported by this news organization, the USMLE cosponsors, the Federation of State Medical Boards and the National Board of Medical Examiners, had announced in May that they would take the following 12-18 months to revamp the required test.
COVID-19 had forced a suspension of the all-day test, which requires test takers to have physical contact with standardized patients. It’s designed to gauge how soon-to-be doctors gather information from patients, perform physical exams, and communicate their findings to patients and colleagues.
However, the cosponsors said today, “we have no plans to bring back Step 2 CS, but we intend to take this opportunity to focus on working with our colleagues in medical education and at the state medical boards to determine innovative ways to assess clinical skills.”
David Johnson, FSMB’s chief assessment officer, said in an interview that, after months of study, “it became clear that the relaunch of a modified Step 2 CS exam would not meet our expectations to be appreciably better than the prior exam.”
Only weeks ago, NBME was hiring for the revamp
The news came as a huge surprise. Just weeks earlier, NBME was advertising for a position key to modifying the exam. The description for the position read: “This role will focus on operational planning and coordination both within the NBME and with ECFMG [Educational Commission for Foreign Medical Graduates] to effectively deliver a modified Step 2 Clinical Skills exam.”
Bryan Carmody, MD, MPH, an assistant professor at Eastern Virginia Medical School, Norfolk, noted in a Jan. 15 tweet that the position requires extensive information technology experience, “suggesting plans for a virtual test remain intact.”
Dr. Johnson said that, although the opportunities for helping lead the revamp of the test were posted until the announcement, no one had been hired for the position.
Today’s announcement stated that the USMLE still believes independent standardized tests for medical knowledge and clinical skills are important; however, it now feels clinical reasoning and communication skills will be able to be assessed in other steps.
“Computer-based case simulations in Step 3 and communication content recently bolstered in Step 1 are examples of these efforts that will continue,” the press release stated. “While not a replacement for Step 2 CS, these formats continue to contribute positively, e.g., measuring critical knowledge of medical communication.”
Critics ‘thrilled’ by test termination
Lydia Flier, MD, from the department of internal medicine at Harvard Medical School, Boston – who wrote an editorial for this news organization in August 2020 advocating that Step 2 CS be changed completely or ended entirely – said in an interview that she was “surprised and thrilled” by the announcement.
She said the cosponsors hadn’t initially appeared to agree with the growing sentiment that disruption from the pandemic had “proven the test was unnecessary and it looked like they really were going to try and keep it.”
“I’m thrilled for future generations,” she said. “It is proof of what many people have known all along, which is that the test is a no-value-add proposition that did not actually help determine people’s clinical skills.”
The test “met a breaking point” during the pandemic, she said, “from which CS could not recover.”
She noted in her editorial that the test costs $1,300 plus travel fees, as the test had been offered at only five sites. She agreed that the skills assessed by the Step 2 CS are already covered in medical school and through other Steps.
“It seems as though they could not justify it anymore. It’s the obvious right answer,” said Dr. Flier, who in 2016 cofounded #EndStep2CS, a nationwide movement demanding an end to the exam.
Another cofounder in that movement, Christopher Henderson, MD, a staff physician with Kaiser Permanente in Seattle, said in an interview that “this decision represents tremendous progress in the fight to reduce unnecessary costs in medical education, and is a win for future students. Credit goes to the many women and men who organized and voiced their desire for change.” He added that his views are his own and “do not reflect or imply the views of my organization.”
For the FSMB’s part, Dr. Johnson acknowledged that “the consideration of cost and value were two of many important factors for the Step 2 CS revitalization work.”
Dr. Johnson, Dr. Flier, and Dr. Henderson have declared no relevant financial relationships.
A version of this article first appeared on Medscape.com.
COVID-19 Wellbeing
Resources for hospitalists
SHM is committed to supporting hospitalists and the health care team to safely deliver patient care while maintaining the health and wellbeing of the families and the community they serve. SHM has developed resources for hospitalists as well as compiled a listing of existing resources which you can find on our website. The resources include:
Hospital Medicine COVID-19 Check-in Guide for Self & Peers
This is the first resource produced by SHM’s Wellbeing Taskforce to address the issues of hospitalist burnout and mental health during COVID-19. It is designed to help hospitalists to break the culture of silence around wellbeing, burnout, and mental health during COVID-19 by encouraging open conversation around how they are handling and processing the pandemic. Download the guide at https://bit.ly/3nxikzl.

SHM’s Strategies for Hospitalist Wellbeing Initiatives during COVID-19
This resource was developed based on information shared during an April 2020 webinar on Provider Wellbeing. Included are examples of initiatives currently being implemented by various hospital medicine groups. You can find this resource at https://bit.ly/3seNBKQ.
Webinars
Hear experiences and examples of how hospitalists and hospital medicine grouups are managing their response to the clinical and practice implications of COVID-19. Webinars have included topics related to hospitalist wellbeing. For instance, a recent webinar featured Gail Gazelle, MD, MCC, a physician coach, author, and mentor focused on burnout and resilience. This was a virtual, confidential session created for hospitalists to have a space for honest reflection, support, and the exploration of strategies for navigating the stress and challenges of being on the front lines of the COVID-19 response and in caring for themselves and their families during a pandemic. See upcoming and recorded SHM webinars on the website: www.hospitalmedicine.org/clinical-topics/coronavirus-disease-2019-covid-19-resources-for-hospitalists/webinars.
Other resources not provided directly by SHM include:
Physician Support Line: volunteer psychiatrist-staffed helpline for free and confidential peer support to discuss immediate life stressors. Available 7 days a week, 8:00am-12:00am EST. Contact number: 888-409-0141
Talkspace: virtual therapy tool offering a free month of Unlimited Messaging Plus for health care providers by registering using their NPI. Download app in App Store or Google Play.
National Suicide Prevention Lifeline: free and confidential crisis hotline for anyone available 24/7 across the United States. Contact number: 800-273-8255.
Headspace Meditation App: app-based meditation tool. Premium version (Headspace Plus) available free for health care providers through 2020 by registering using their National Provider Identifier (NPI). Download app in App Store or Google Play.
Tide: A free app that uses natural sounds to help you sleep, relax, focus, and meditate. Tide also listens to your breathing to play an alarm during your lightest sleep phase, waking you up as gently as possible. Their premium service is available to all health care workers. Download app in App Store or Google Play.
Resources for hospitalists
Resources for hospitalists
SHM is committed to supporting hospitalists and the health care team to safely deliver patient care while maintaining the health and wellbeing of the families and the community they serve. SHM has developed resources for hospitalists as well as compiled a listing of existing resources which you can find on our website. The resources include:
Hospital Medicine COVID-19 Check-in Guide for Self & Peers
This is the first resource produced by SHM’s Wellbeing Taskforce to address the issues of hospitalist burnout and mental health during COVID-19. It is designed to help hospitalists to break the culture of silence around wellbeing, burnout, and mental health during COVID-19 by encouraging open conversation around how they are handling and processing the pandemic. Download the guide at https://bit.ly/3nxikzl.
SHM’s Strategies for Hospitalist Wellbeing Initiatives during COVID-19
This resource was developed based on information shared during an April 2020 webinar on Provider Wellbeing. Included are examples of initiatives currently being implemented by various hospital medicine groups. You can find this resource at https://bit.ly/3seNBKQ.
Webinars
Hear experiences and examples of how hospitalists and hospital medicine grouups are managing their response to the clinical and practice implications of COVID-19. Webinars have included topics related to hospitalist wellbeing. For instance, a recent webinar featured Gail Gazelle, MD, MCC, a physician coach, author, and mentor focused on burnout and resilience. This was a virtual, confidential session created for hospitalists to have a space for honest reflection, support, and the exploration of strategies for navigating the stress and challenges of being on the front lines of the COVID-19 response and in caring for themselves and their families during a pandemic. See upcoming and recorded SHM webinars on the website: www.hospitalmedicine.org/clinical-topics/coronavirus-disease-2019-covid-19-resources-for-hospitalists/webinars.
Other resources not provided directly by SHM include:
Physician Support Line: volunteer psychiatrist-staffed helpline for free and confidential peer support to discuss immediate life stressors. Available 7 days a week, 8:00am-12:00am EST. Contact number: 888-409-0141
Talkspace: virtual therapy tool offering a free month of Unlimited Messaging Plus for health care providers by registering using their NPI. Download app in App Store or Google Play.
National Suicide Prevention Lifeline: free and confidential crisis hotline for anyone available 24/7 across the United States. Contact number: 800-273-8255.
Headspace Meditation App: app-based meditation tool. Premium version (Headspace Plus) available free for health care providers through 2020 by registering using their National Provider Identifier (NPI). Download app in App Store or Google Play.
Tide: A free app that uses natural sounds to help you sleep, relax, focus, and meditate. Tide also listens to your breathing to play an alarm during your lightest sleep phase, waking you up as gently as possible. Their premium service is available to all health care workers. Download app in App Store or Google Play.
Monoclonal antibody drops fat, ups muscle in obesity, diabetes
In a phase 2 randomized clinical trial of adults with type 2 diabetes and obesity, investigational drug bimagrumab (BYM338, Novartis) – a monoclonal antibody that blocks activin type II receptors and stimulates skeletal muscle growth – led to big reductions in total body fat mass and A1c and significant increases in lean mass compared with placebo.
The efficacy and safety findings “suggest that blockade of the activin receptor with bimagrumab could provide a novel pharmacologic approach for managing patients with type 2 diabetes with excess adiposity,” Steven B. Heymsfield, MD, Pennington Biomedical Research Center, Louisiana State University System, Baton Rouge, and colleagues reported in their study, published online Jan. 13 in JAMA Network Open.
Preliminary findings from the study of 75 patients treated for 48 weeks – in which neither group ate less despite intensive nutrition advice – were presented at Obesity Week in 2019.
As reported then, Lee M. Kaplan, MD, PhD, noted that the 6.5% weight loss in the bimagrumab group was similar to that seen with antiobesity medications that suppress appetite.
“What it suggests,” he said in an interview, “is that there may be a completely new mechanism at play here,” because patients receiving bimagrumab weren’t eating less but were losing the same amount of weight as reported for weight-loss drugs that work by decreasing appetite.
“Is this going to be the kind of complementary drug with a different mechanism that’s going to augment the effects of other drugs?” wondered Dr. Kaplan, director of the Obesity, Metabolism & Nutrition Institute at Massachusetts General Hospital, Boston, who has previously served as a scientific consultant to Novartis.
Asked about future plans for bimagrumab, a Novartis spokesperson said in an interview, “We are currently reviewing the program strategy and considering next steps.”
Four FDA-approved weight-loss drugs now approved
The Food and Drug Administration approval for lorcaserin (Belviq, Belviq XR, Eisai) for weight loss was rescinded on Feb. 13, 2020, when a postmarketing trial revealed an increased occurrence of cancer, leaving four drugs approved for weight loss in the United States, plus several drugs in development, Dr. Heymsfield and colleagues wrote.
The current phase 2 trial was designed to determine the safety and efficacy of bimagrumab – which had originally been studied to see if it would increase lean muscle mass in people with sarcopenia – on total body fat mass and glycemic control in patients with type 2 diabetes and overweight or obesity.
Researchers enrolled 75 adults at eight sites in the United States and one in Wales, United Kingdom, from 2017 to 2019.
On average, patients were 60 years old with an A1c of 7.8% and a body mass index of 32.9 kg/m2; they weighed 93.6 kg and had a fat mass of 35 kg.
Patients received an intravenous infusion of bimagrumab (10 mg/kg up to 1,200 mg in 5% dextrose solution) or placebo (5% dextrose solution) every 4 weeks for 48 weeks. They met with a registered dietitian at each monthly study visit and had a virtual check-in between visits.
Participants were advised to follow a diet that would cut 500 calories a day and encouraged to follow the American Diabetes Association walking program.
Body fat mass was measured by dual-energy x-ray absorptiometry (DEXA).
There were more women in the bimagrumab group than in the placebo group (62% vs. 32%), but baseline BMI, total body fat mass, and A1c were similar in both groups.
Same caloric intake, less fat tissue, more muscle, smaller waist
At 48 weeks in the bimagrumab vs. placebo group, there was on average (all P < .001):
- A loss of 20.5% vs. 0.5% (−7.5 vs. −0.2 kg) of total body fat mass.
- A loss of 6.5% vs. 0.8% (−5.9 vs. −0.8 kg) of body weight.
- A gain of 3.6% vs. a loss of 0.8% (1.7 vs. −0.4 kg) of lean mass.
Similarly, the relatively large between-group differences in total body fat mass and body weight at 48 weeks with bimagrumab were accompanied by favorable differences in BMI (−2.19 vs. −0.28 kg/m2; P < .001) and waist circumference (−9.0 vs. 0.5 cm; P < .001), the investigators pointed out.
Moreover, the reduction of abdominal visceral adipose tissue and waist circumference with bimagrumab “was nearly twice that observed in a recently published study of patients with type 2 diabetes treated with an intensive lifestyle program and the glucagon-like peptide 1 (GLP-1) agonist liraglutide,” they noted.
This highlights “the importance of moving away from body weight as a primary efficacy marker of drugs to more metabolically relevant endpoints.”
Also, A1c decreased by 0.76% in the bimagrumab group and increased by 0.04% in the placebo group (P = .005).
Serious adverse events occurred in three patients (8%) in the bimagrumab group (elevated lipase, epigastric pain, pancreatitis, pneumonia) and three patients (8%) in the placebo group (cellulitis, acute coronary syndrome, acute myocardial infarction, worsening gastroparesis, thermal burn).
Adverse events were reported by 31 of 37 patients in the bimagrumab group, most often mild diarrhea (41%) and muscle spasms (41%), and 31 of 38 patients in the placebo group, most often headache (13%) and upper respiratory tract infection (13%).
The study was funded by Novartis. Dr. Heymsfield has reported receiving personal fees from Tanita and Medifast outside the submitted work. Disclosures for the other authors are listed in the article. Dr. Kaplan has reported previously serving as a scientific consultant to Novartis.
A version of this article first appeared on Medscape.com.