User login
Polygenic breast cancer risk scores strive to overcome racial bias
The potential of polygenic risk scores (PRSs) to become key components in the assessment of individual risk for disease in the clinical setting is inching closer to fruition; however, the technology is plagued by one glaring omission of most existing PRSs – the lack of applicability to those of non-European ancestry.
Polygenic risk scores predict an individual’s risk of disease based on common genetic variants identified in large genomewide association studies (GWASs). They have gained ground in research, as well as in the unregulated realm of the direct-to-consumer market where they are sold as add-ons to DNA ancestry kits such as 23andMe and MyHeritage.com.
While the risk scores show strong validation in estimating risk among people of European descent, their striking caveat is the lack of applicability to other ancestries, particularly African, and their use in practice outside of clinical trials is discouraged in National Comprehensive Cancer Network guidelines.
Study underscores need for ethnically diverse datasets
In a recent study published in JAMA Network Open, researchers evaluated the use of polygenic risk scores’ models in a clinical setting. Researchers tested 7 PRSs models for breast cancer risk against the medical records data of 39,591 women of European, African, and Latinx ancestry.
The PRSs models – all used only for research purposes – included three models involving European ancestry cohorts, two from Latinx cohorts, and two from women African descent.
After adjusting for factors including age, breast cancer family history, and ancestry, the PRSs from women with European ancestry highly corresponded to breast cancer risk, with a mean odds ratio of 1.46 per standard deviation increase in the score.
PRSs were also generalized relatively well among women of Latinx ancestry with a mean OR of 1.31. The authors noted that association is likely caused by Latinx individuals in the United States having a greater proportion of European ancestry than individuals with African ancestry. Importantly, however, the effect size was lower for women of African ancestry with a highest OR of 1.19 per standard deviation.
In the highest percentiles of breast cancer risk, women of European descent had odds ratio as high as 2.19-2.48, suggesting a statistically significant association with overall breast cancer risk. No statistically significant associations were found among women of Latinx and African-ancestry.
The PRSs models were smaller for women of non-European ancestry and included fewer genetic variants for women of non-European ancestry were notably smaller and hence reflected fewer genetic variants. Of the two risk scores involving African ancestry, the Women’s Health Initiative for Women with African ancestry risk score had just 75 variants, while the African diaspora study (ROOT) had 34 variants, compared with 3,820 and 5,218 in the two largest European ancestry PRSs, the Breast Cancer Association Consortium and the UK Biobank, respectively.
“These results highlight the need to improve representation of diverse population groups, particularly women with African ancestry, in genomic research cohorts,” the authors wrote.
First author, Cong Liu, PhD, of Columbia University Irving Medical Center, New York, said that efforts are underway to improve the inclusivity in the Electronic Medical Records and Genomics network data set used in this study.
“Until well-developed and validated PRSs for women with non-European ancestry become available, the current PRSs based on cohorts with European ancestry could be adapted for Latinx women, but not women with African ancestry until additional data sets become available in this important and high-risk group,” Dr. Liu and colleagues wrote.
In a commentary published with the study, Payal D. Shah, MD, of the Basser Center for BRCA at the University of Pennsylvania, Philadelphia, said that PRSs are “disproportionately applicable to patients with European ancestry and are insufficiently vetted and developed in other populations. If an instrument exists that has clinical utility in informing effective cancer risk mitigation strategies, then we must strive to ensure that it is available and applicable to all.”
Higher morality among African American women
While American Cancer Society data shows women with African ancestry generally have incidence rates of breast cancer similar to White women, they have significantly higher mortality from the disease in part because of later-stage diagnosis and health care barriers.
Anne Marie McCarthy, PhD, of the University of Pennsylvania, and Katrina Armstrong, MD, of Harvard Medical School, Boston, wrote in the Journal of the National Cancer Institute that African American women “have 42% higher breast cancer mortality than white women, despite having lower disease incidence, and are more likely to be diagnosed with triple-negative breast cancer, which has poorer prognosis than other molecular subtypes.”
Dr. McCarthy and Dr. Armstrong wrote that African American women are chronically underrepresented in breast cancer studies. And as such, it is impossible to know the extent of the prevalence of mutations and risk.
Failing to address the lack of diversity in genomic studies may worsen health disparities for women with African ancestry, Dr. Liu and colleagues wrote. The higher mortality “underscores the urgent need to increase diversity in genomic studies so that future clinical applications of the PRS do not exacerbate existing health disparities. These results highlight the need to improve representation of diverse population groups, particularly women with African ancestry, in genomic research cohorts.”
Potential PRS benefits underscore need to eliminate bias
The potentially important benefits of PRSs as risk prediction tools used in combination with family history, reproductive history and other factors, should provide strong incentive to push for improvement, Dr. Shah wrote.
For instance, if an individual is estrogen receptor positive and shows elevations in breast cancer risk on a reliable PRS, “this may inform antiestrogen chemoprevention strategies,” she wrote.
A risk score could furthermore influence the age at which breast cancer screening should begin or factor into whether a patient should also receive surveillance breast MRI.
Importantly, PRSs could also add to other risk factors to provide more precise risk estimates and inform management of women with a pathogenic variant in a breast cancer risk predisposition gene, Dr. Shah wrote.
Confluence project
Among the most promising developments in research is the National Cancer Institute’s Confluence Project, a large research resource aiming to include approximately 300,000 breast cancer cases and 300,000 controls of different races/ethnicities, utilizing the confluence of existing GWAS and new genomewide genotyping data.

Having started enrollment in 2018, the project is approaching implementation, said Montserrat García-Closas, MD, MPH, DrPH, deputy director of cancer epidemiology and genetics with the National Cancer Institute.
“We expect genotyping to be completed by the end of 2022 and for the data to be made available to the research community soon after that,” she said.
Among the project’s key objectives are the development of PRSs to be integrated with known risk factors to provide a personalized risk assessment for breast cancer, overall and by ancestral subtype.
“We plan to apply novel methods to derive multiancestry PRS that will account for differences and similarities in genetic architecture across ethnic/racial groups to develop breast cancer PRSs that can be applied in multiethnic/racial populations,” she said.
NCI is working with investigators in Africa, Central and South America, and Asia, and reaching out to non-European organizations such as AORTIC for studies of African populations.
Direct-to-consumer global PRS
In the commercial PRS market, efforts to address diversity shortcomings are also gaining momentum, with Myriad Genetics touting a first-of-its kind “global PRS.”
The PRS, a recalibrated version the company’s riskScore PRS, sold as part of its Myriad myRisk Hereditary Cancer test, will reportedly apply to all ethnicities in estimating an individual’s 5-year and lifetime risk of breast cancer.
A study presented in June at the American Society of Clinical Oncology meeting, describes the development of the model with the use of three large ancestry-specific PRSs based on African American, Asian, and European cohorts, with the system including a total of 149 single-nucleotide polymorphisms, including 93 well established for breast cancer and 56 that are ancestry specific.
In validation of the data in an independent cohort of 62,707 individuals, the global PRS was strongly associated with breast cancer in the full combined validation cohort as well as in all three of the ancestry subcohorts.
However, the effect size among women with African ancestry was still the lowest of all of the groups, with a mean OR of 1.24 per standard deviation, versus the highest rate of mixed ancestry (OR, 1.59).

According to senior author Holly Pederson, MD, director of medical breast services at the Cleveland Clinic, the applicability of the PRS to women with African ancestry is expected to further improve as additional data become available.
“The discriminatory power in women of African descent was significantly improved but still suboptimal,” she said. “The need for more data, particularly in Black women, is challenging not only because there is likely more diversity in the genomic landscape of women of African descent, but also because the barriers created by historical, cultural, institutional and interpersonal dynamics result in the paucity of this data.”
“We must be committed to ending bias resulting in health care disparities,” Dr. Pederson said. She noted that the global PRS is nevertheless “still clinically useful in Black women,” and recommended that clinicians be up front with patients on the status of the research challenges.
“As with any clinical shared decision-making conversation between a patient and her provider, it is important for Black women to know that data is limited in the African American population, particularly given the vast genomic diversity of the African continent,” she said. “This model, as models that have gone before it, will improve with additional data, particularly in this population.”
Commercial PRSs may benefit research
While the commercial marketing of PRSs in a direct-to-consumer fashion have raised some concerns, such as how individuals respond to their risk scores, there could be important benefits as well, commented Megan C. Roberts, PhD.

“There may be an opportunity to learn from these companies about how to engage diverse communities in genomic testing,” said Dr. Roberts, an assistant professor and director of implementation science in precision health and society at the University of North Carolina at Chapel Hill. “Moreover, the data they collect from their customers often can be used for research purposes as well.”
In a recent perspective, Dr. Roberts and colleagues addressed the role of health disparities in PRSs. She’ll be joining international precision public health researchers in October in hosting a free virtual conference at UNC on the topic.
“There is a huge need to improve racial and ethnic diversity in our genomic datasets,” Dr. Roberts said. “Without this, we will not be able to return on the promise of precision medicine and prevention for improving the health of our whole population.”
Dr. Pederson disclosed that she is a consultant for Myriad Genetics.
The potential of polygenic risk scores (PRSs) to become key components in the assessment of individual risk for disease in the clinical setting is inching closer to fruition; however, the technology is plagued by one glaring omission of most existing PRSs – the lack of applicability to those of non-European ancestry.
Polygenic risk scores predict an individual’s risk of disease based on common genetic variants identified in large genomewide association studies (GWASs). They have gained ground in research, as well as in the unregulated realm of the direct-to-consumer market where they are sold as add-ons to DNA ancestry kits such as 23andMe and MyHeritage.com.
While the risk scores show strong validation in estimating risk among people of European descent, their striking caveat is the lack of applicability to other ancestries, particularly African, and their use in practice outside of clinical trials is discouraged in National Comprehensive Cancer Network guidelines.
Study underscores need for ethnically diverse datasets
In a recent study published in JAMA Network Open, researchers evaluated the use of polygenic risk scores’ models in a clinical setting. Researchers tested 7 PRSs models for breast cancer risk against the medical records data of 39,591 women of European, African, and Latinx ancestry.
The PRSs models – all used only for research purposes – included three models involving European ancestry cohorts, two from Latinx cohorts, and two from women African descent.
After adjusting for factors including age, breast cancer family history, and ancestry, the PRSs from women with European ancestry highly corresponded to breast cancer risk, with a mean odds ratio of 1.46 per standard deviation increase in the score.
PRSs were also generalized relatively well among women of Latinx ancestry with a mean OR of 1.31. The authors noted that association is likely caused by Latinx individuals in the United States having a greater proportion of European ancestry than individuals with African ancestry. Importantly, however, the effect size was lower for women of African ancestry with a highest OR of 1.19 per standard deviation.
In the highest percentiles of breast cancer risk, women of European descent had odds ratio as high as 2.19-2.48, suggesting a statistically significant association with overall breast cancer risk. No statistically significant associations were found among women of Latinx and African-ancestry.
The PRSs models were smaller for women of non-European ancestry and included fewer genetic variants for women of non-European ancestry were notably smaller and hence reflected fewer genetic variants. Of the two risk scores involving African ancestry, the Women’s Health Initiative for Women with African ancestry risk score had just 75 variants, while the African diaspora study (ROOT) had 34 variants, compared with 3,820 and 5,218 in the two largest European ancestry PRSs, the Breast Cancer Association Consortium and the UK Biobank, respectively.
“These results highlight the need to improve representation of diverse population groups, particularly women with African ancestry, in genomic research cohorts,” the authors wrote.
First author, Cong Liu, PhD, of Columbia University Irving Medical Center, New York, said that efforts are underway to improve the inclusivity in the Electronic Medical Records and Genomics network data set used in this study.
“Until well-developed and validated PRSs for women with non-European ancestry become available, the current PRSs based on cohorts with European ancestry could be adapted for Latinx women, but not women with African ancestry until additional data sets become available in this important and high-risk group,” Dr. Liu and colleagues wrote.
In a commentary published with the study, Payal D. Shah, MD, of the Basser Center for BRCA at the University of Pennsylvania, Philadelphia, said that PRSs are “disproportionately applicable to patients with European ancestry and are insufficiently vetted and developed in other populations. If an instrument exists that has clinical utility in informing effective cancer risk mitigation strategies, then we must strive to ensure that it is available and applicable to all.”
Higher morality among African American women
While American Cancer Society data shows women with African ancestry generally have incidence rates of breast cancer similar to White women, they have significantly higher mortality from the disease in part because of later-stage diagnosis and health care barriers.
Anne Marie McCarthy, PhD, of the University of Pennsylvania, and Katrina Armstrong, MD, of Harvard Medical School, Boston, wrote in the Journal of the National Cancer Institute that African American women “have 42% higher breast cancer mortality than white women, despite having lower disease incidence, and are more likely to be diagnosed with triple-negative breast cancer, which has poorer prognosis than other molecular subtypes.”
Dr. McCarthy and Dr. Armstrong wrote that African American women are chronically underrepresented in breast cancer studies. And as such, it is impossible to know the extent of the prevalence of mutations and risk.
Failing to address the lack of diversity in genomic studies may worsen health disparities for women with African ancestry, Dr. Liu and colleagues wrote. The higher mortality “underscores the urgent need to increase diversity in genomic studies so that future clinical applications of the PRS do not exacerbate existing health disparities. These results highlight the need to improve representation of diverse population groups, particularly women with African ancestry, in genomic research cohorts.”
Potential PRS benefits underscore need to eliminate bias
The potentially important benefits of PRSs as risk prediction tools used in combination with family history, reproductive history and other factors, should provide strong incentive to push for improvement, Dr. Shah wrote.
For instance, if an individual is estrogen receptor positive and shows elevations in breast cancer risk on a reliable PRS, “this may inform antiestrogen chemoprevention strategies,” she wrote.
A risk score could furthermore influence the age at which breast cancer screening should begin or factor into whether a patient should also receive surveillance breast MRI.
Importantly, PRSs could also add to other risk factors to provide more precise risk estimates and inform management of women with a pathogenic variant in a breast cancer risk predisposition gene, Dr. Shah wrote.
Confluence project
Among the most promising developments in research is the National Cancer Institute’s Confluence Project, a large research resource aiming to include approximately 300,000 breast cancer cases and 300,000 controls of different races/ethnicities, utilizing the confluence of existing GWAS and new genomewide genotyping data.
Having started enrollment in 2018, the project is approaching implementation, said Montserrat García-Closas, MD, MPH, DrPH, deputy director of cancer epidemiology and genetics with the National Cancer Institute.
“We expect genotyping to be completed by the end of 2022 and for the data to be made available to the research community soon after that,” she said.
Among the project’s key objectives are the development of PRSs to be integrated with known risk factors to provide a personalized risk assessment for breast cancer, overall and by ancestral subtype.
“We plan to apply novel methods to derive multiancestry PRS that will account for differences and similarities in genetic architecture across ethnic/racial groups to develop breast cancer PRSs that can be applied in multiethnic/racial populations,” she said.
NCI is working with investigators in Africa, Central and South America, and Asia, and reaching out to non-European organizations such as AORTIC for studies of African populations.
Direct-to-consumer global PRS
In the commercial PRS market, efforts to address diversity shortcomings are also gaining momentum, with Myriad Genetics touting a first-of-its kind “global PRS.”
The PRS, a recalibrated version the company’s riskScore PRS, sold as part of its Myriad myRisk Hereditary Cancer test, will reportedly apply to all ethnicities in estimating an individual’s 5-year and lifetime risk of breast cancer.
A study presented in June at the American Society of Clinical Oncology meeting, describes the development of the model with the use of three large ancestry-specific PRSs based on African American, Asian, and European cohorts, with the system including a total of 149 single-nucleotide polymorphisms, including 93 well established for breast cancer and 56 that are ancestry specific.
In validation of the data in an independent cohort of 62,707 individuals, the global PRS was strongly associated with breast cancer in the full combined validation cohort as well as in all three of the ancestry subcohorts.
However, the effect size among women with African ancestry was still the lowest of all of the groups, with a mean OR of 1.24 per standard deviation, versus the highest rate of mixed ancestry (OR, 1.59).
According to senior author Holly Pederson, MD, director of medical breast services at the Cleveland Clinic, the applicability of the PRS to women with African ancestry is expected to further improve as additional data become available.
“The discriminatory power in women of African descent was significantly improved but still suboptimal,” she said. “The need for more data, particularly in Black women, is challenging not only because there is likely more diversity in the genomic landscape of women of African descent, but also because the barriers created by historical, cultural, institutional and interpersonal dynamics result in the paucity of this data.”
“We must be committed to ending bias resulting in health care disparities,” Dr. Pederson said. She noted that the global PRS is nevertheless “still clinically useful in Black women,” and recommended that clinicians be up front with patients on the status of the research challenges.
“As with any clinical shared decision-making conversation between a patient and her provider, it is important for Black women to know that data is limited in the African American population, particularly given the vast genomic diversity of the African continent,” she said. “This model, as models that have gone before it, will improve with additional data, particularly in this population.”
Commercial PRSs may benefit research
While the commercial marketing of PRSs in a direct-to-consumer fashion have raised some concerns, such as how individuals respond to their risk scores, there could be important benefits as well, commented Megan C. Roberts, PhD.
“There may be an opportunity to learn from these companies about how to engage diverse communities in genomic testing,” said Dr. Roberts, an assistant professor and director of implementation science in precision health and society at the University of North Carolina at Chapel Hill. “Moreover, the data they collect from their customers often can be used for research purposes as well.”
In a recent perspective, Dr. Roberts and colleagues addressed the role of health disparities in PRSs. She’ll be joining international precision public health researchers in October in hosting a free virtual conference at UNC on the topic.
“There is a huge need to improve racial and ethnic diversity in our genomic datasets,” Dr. Roberts said. “Without this, we will not be able to return on the promise of precision medicine and prevention for improving the health of our whole population.”
Dr. Pederson disclosed that she is a consultant for Myriad Genetics.
FROM JAMA NETWORK OPEN
Devices for the treatment of migraine
Remote upper arm neuromodulation and combined occipital and trigeminal neuromodulation lead the way as the newest entries to the field, followed by 8 other devices that are now available or are expected to be soon.

The increasing array of prescription medications for the treatment of migraine are welcome additions for patients who suffer from this life-altering condition and the clinicians who treat it; but not all individuals tolerate oral and injectable therapies, and others face the risk of adverse events and medication overuse headache.1 Fortunately, there are a number of devices available to consider, and still others are awaiting approval from the US Food and Drug Administration (FDA).
Two of the most promising devices are remote upper arm neuromodulation (REN) and combined occipital and trigeminal neuromodulation. Here we highlight data from pivotal trials evaluating these 2 treatment options and provide information about other devices worth consideration.
Remote Upper Arm Neuromodulation (REN)
Nerivio was initially authorized by the FDA for the acute treatment of episodic migraine. Available by prescription, the device is administered by the patient at home.2 It stimulates upper arm peripheral nerves, which induces conditioned pain modulation (CPM) that inhibits pain in remote parts of the body. In other words, a descending, endogenous analgesic “pain inhibits pain” mechanism is used.
The initial authorization was based on the results of a randomized, double-blind, sham-controlled, multicenter study involving 252 individuals who were experiencing 2 to 8 migraine headaches per month. Participants were assigned to either a treatment group (n=126), where the device was applied for 30 to 45 minutes within an hour of a migraine attack, or to a sham treatment group (n=126). Investigators looked at migraine pain levels at baseline and at 2 and 48 hours post-treatment, as well as patient-reported most bothersome symptoms. They found that REN provided superior, clinically meaningful relief from migraine pain and the most bothersome symptoms, as follows3:
- 67% of patients in the active treatment group achieved a response at 2 hours vs 39% of individuals in the sham-treatment group
- Pain-free rates at 2 hours in each group were 37% and 18%, respectively
- Most bothersome symptom relief rates at 2 hours were 46% and 22%, respectively
Additionally, pain relief and pain-free responses were sustained at 48 hours. Nearly 40% of active treatment participants still reported pain relief at 48 hours, with pain-free rates at 48 hours in each group of 21% and 8%, respectively. The adverse event rate was low. The most commonly reported adverse event in the active-treatment group was a sensation of warmth (2.4%). Arm pain (1.6%), redness (1.6%), and numbness (0.8%) were also reported in those receiving active treatment.3
In 2020, REN received authorization for the acute treatment of chronic migraine in adults, and the following year authorization was expanded to include adolescent migraine. This development offered a nonpharmacologic treatment approach for migraine sufferers who experience 15 or more headache days per month, which is significant because it reduces the likelihood of medication overuse headache.
Approval for chronic migraine was based on results of an open-label, single-arm, dual-center study involving 38 individuals with chronic migraine. Participants used the device over 4 weeks within 1 hour of a migraine attack. Investigators assessed pain levels at 2 and 24 hours after use; they defined consistency of response as response to at least half of the treatments. The study demonstrated the following4:
- 74% of patients attained pain relief at 2 hours
- 26% were pain free at 2 hours
- 84% achieved sustained pain relief at 24 hours
- 45% achieved sustained pain relief at 24 hours in at least half of their treated attacks
- <2% of participants experienced device-related adverse events
The authors concluded that REN could be used for a series of migraine attacks and is a safe and effective nonpharmacologic approach for individuals who suffer from chronic migraine.4
The findings from these trials are supported by a subsequent trial published earlier this year. This open-label, single-arm study evaluated 91 individuals with chronic migraine who were treated with REN for 4 weeks. Investigators assessed pain levels, associated pain symptoms, and functional disability at baseline as well as at 2 and 24 hours post-treatment. Of the patients in this study5:
- At 2 hours, 59% achieved pain relief, and 21% reported that their pain disappeared
- 73% noted sustained pain relief at 24 hours
- REN was shown to impact nausea, photophobia, and phonophobia favorably, and patients’ functional ability also improved after use
Results from 2 additional trials were also recently released. One study involving 35 adolescents treated with either REN or standard-of-care medications showed REN to be superior with regard to pain freedom (37% vs 9%), consistency of pain freedom (40% vs 9%), pain relief (71% vs 57%), and consistency of pain relief (80% vs 57%).6 The other study included 91 women with a history of menstrual migraine and at least 4 REN treatments. Nearly 75% of patients reported Nerivio to be at least moderately effective, 45% said they were satisfied with the treatment, and all participants noted that it was at least moderately tolerable.7
Combined Occipital and Trigeminal Neuromodulation
In March 2021, the FDA authorized combined occipital and trigeminal neuromodulation (Relivion) for self-treatment of acute migraine.8 It is not yet commercially available, but it will require a prescription. The headset-like device stimulates the occipital and trigeminal nerves by delivering precise modulated pulses simultaneously to 6 branches of the occipital and trigeminal nerves via 3 adaptive output channels. The occipital and trigeminal nerves conduct the signals directly to the brainstem, which maximizes the synergistic effect.9
The results of 2 clinical trials led to FDA approval. These studies have not yet been published in a peer-reviewed journal. The first study, presented at the 61st Annual Scientific Meeting of the American Headache Society in 2019, was a prospective, randomized, double-blind, parallel-group, sham-controlled clinical study involving 55 individuals with chronic or episodic migraine. Participants administered the device for 1 hour soon after migraine onset or administered a sham treatment. Researchers looked at pain score change from baseline to 1 hour post-treatment, as well as pain intensity at baseline and at 1, 2, and 24 hours post-treatment. The study showed that 76% of participants in the active-treatment group experienced headache relief at 2 hours vs 32% in the sham-treatment contingent. No serious adverse events were reported.10 The investigators hypothesized that the positive results observed were a result of the synergistic neuromodulatory effect elicited by concurrent activation of the occipital and trigeminal neural pathways.
Following this study, there was a multi-center, prospective, randomized, double-blind, placebo-controlled clinical trial involving 131 individuals with migraine with or without aura. Participants were assigned to either active treatment or placebo. Investigators assessed reported migraine pain reduction at 2 hours, as well as improvement in most bothersome symptoms after 2 hours, reported pain reduction at 1 hour, and being pain-free at 2 hours. At 2 hours post-treatment11:
- 46% of individuals who were actively treated reached complete freedom from pain vs 12% in the control group
- 75% of active-treatment participants reported being completely free of their most bothersome symptom vs 47% of control patients
- The rates of complete freedom from migraine symptoms were 47% and 11%, respectively
- The rates of pain relief after 2 hours were 60% and 37%, respectively
- No serious adverse events were noted
A systematic review and meta-analysis of 13 studies involving 221 individuals published earlier this year looked at changes in pain scores and response rates to implantable peripheral nerve stimulation for trigeminal neuropathic pain. The response rate to neuromodulation therapy was 61%, the reduction in overall pain scores (2.363) was significant, and a subgroup assessment revealed that the stimulation target (peripheral branch, trigeminal ganglion, or trigeminal nerve root) was responsible for heterogeneity across the studies analyzed. Furthermore, stimulating the trigeminal peripheral branch resulted in better clinical outcomes. The authors noted that their findings reinforce the promise of implantable therapy, particularly for individuals who do not tolerate traditional therapies.12
Looking forward, new data are scheduled to be presented at the International Headache Virtual Congress in September 2021 showing that neuromodulation therapy is highly effective in reducing monthly headache days in individuals who suffer from difficult-to-treat migraine. A larger-scale, double-blind, sham-controlled study is planned to further establish these findings.
Other FDA-Approved Therapies
A number of other devices are available for treatment of migraine headache, including:
- Transcranial magnetic stimulation (TMS). In a randomized trial involving 164 individuals with migraine, 39% of the individuals receiving treatment were pain-free at 2 hours vs 22% of those given sham treatment13
- Noninvasive vagal nerve stimulation (nVNS). This is performed using a handheld device that is controlled by the patient, which preferentially activates afferent A and large B fibers. In a randomized trial involving 243 individuals, pain-free rates at 30, 60, and 120 minutes for patients receiving active treatment were 13%, 21%, and 30%, respectively. Rates for those receiving sham treatment were 4%, 10%, and 20%, respectively.14
- Sumatriptan nasal spray (10 mg) with a permeation enhancer. A randomized phase 2 trial involving 107 individuals found that 44% of participants in the treatment group achieved pain freedom at 2 hours vs 23% who received placebo. The spray appears to work quickly and with fewer adverse events than generic sumatriptan 20 mg nasal spray.15
- Transcutaneous supraorbital nerve stimulation (tSNS). Available without a prescription, there are 3 devices that can treat acute migraine; prevent acute migraine; or both.
Therapies Awaiting FDA Approval
There are several therapeutic options in the pipeline that have not yet been authorized by the FDA.
- Zavegepant (formerly known as vazegepant) nasal spray.16 This third-generation small molecule calcitonin gene-related peptide (CGRP) receptor antagonist has been demonstrated to work as a nasal spray in individuals with migraine. In a phase 1 study, the spray was shown to reach maximal concentration earlier than with other CGRP receptor antagonists.17 A phase 2/3 placebo-controlled trial demonstrated sustained pain freedom from 2 to 48 hours with 5-mg, 10-mg, and 20-mg dosages. The 10-mg and 20-mg doses were statistically superior to placebo on the co-primary endpoints of pain freedom and freedom from most bothersome symptom at 2 hours using a single dose. Sustained pain relief from 2 to 48 hours was seen with the 5-mg and 10-mg dosages18
- Sphenopalatine ganglion (SPG) stimulation. This is a microstimulator that is inserted orally, designed to fit the face, and directly targets SPG. Stimulation is active and controlled by the patient. A randomized, sham-controlled trial evaluated acute pain relief as well as pain freedom and found that those receiving treatment were more than twice as likely to experience pain relief and pain freedom19
- Adhesive dermally applied microneedle system (ADAM). This is a transdermal patch containing microprojections, which can be coated with both large and small molecules. In a randomized trial, 42% of treated participants reported being pain free at 2 hours vs 14% of placebo-treated patients. Rates of freedom from most bothersome symptom were 68% and 43%, respectively20
- Dihydroergotamine (DHE) nasal powder spray and intranasal liquid. Both therapies are awaiting FDA approval. The mucoadhesive powder formulation facilitates rapid drug absorption and is offered in a single-use nasal delivery device. In clinical trials, the spray demonstrated the device’s simplicity, reliability, and ease of use.21 The intranasal liquid is designed to deliver the drug into the vascular-rich upper nasal space. In the phase 3 trial that included 354 patients, 66.3% of patients reported pain relief, 38% of patients reported pain freedom, and 52% had freedom from their most bothersome migraine symptom at 2 hours following their first dose.22
References
1. Rapoport AM. Medication overuse headache: preventive treatment with or without detoxification? Published May 24, 2021. Accessed August 13, 2021. https://www.mdedge.com/migraine-icymi/article/240472/headache-migraine/medication-overuse-headache-preventive-treatment-or
2. How to prescribe Nerivio. Theranica. Accessed August 13, 2021. https://nerivio.co/prescribe/
3. Yarnitsky D, Dodick DW, Grosberg BM, et al. Remote electrical neuromodulation (REN) relieves acute migraine: a randomized, double-blind, placebo-controlled, multicenter trial. Headache. 2019;59(8):1240-1252.
4. Nierenburg H, Vieira JR, Lev N, et al. Remote electrical neuromodulation for the acute treatment of migraine in patients with chronic migraine: an open-label pilot study. Pain Ther. 2020;9(2):531-543.
5. Grosberg B, Lin T, Vizel M, Schim J. Remote electrical neuromodulation for the acute treatment of chronic migraine (2007). Neurology. 2021;96(15 Suppl) 2007.
6. Hershey AD, Irwin S, Rabany L, et al. Comparison of remote electrical neuromodulation (REN) and standard-care medications for acute treatment of migraine in adolescents: a post-hoc analysis. Pain Med. 2021 June 29;pnab197. doi: 10.1093/pm/pnab197. [Epub ahead of print].
7. Nierenburg H, Rabany L, Lin T, et al. Remote electrical neuromodulation (REN) for the acute treatment of menstrual migraine: a retrospective survey study of effectiveness and tolerability. Pain Ther. 2021 Jun 17. doi: 10.1007/s40122-021-00276-7. [Epub ahead of print].
8. Brooks M. FDA clears neuromodulation device for acute migraine pain. Published March 2, 2021. Accessed August 13, 2021. https://www.medscape.com/viewarticle/946700
9. A new ecosystem for brain neuromodulation. Neurolief. Accessed August 13, 2021. https://www.neurolief.com/technology/
10. Daniel O, Tepper SJ. First non-invasive combined occipital & trigeminal nerve stimulation digital therapeutics system for treatment of migraine: a randomized, sham-controlled, double-blind clinical trial. Published 2019. Accessed August 13, 2021. https://www.neurolief.com/wp-content/uploads/2019/07/American-Headache-Society2019-Abstract-Oved-Daniel-Stewart-Tepper.pdf
11. Neurolief announces positive results from RIME clinical study of its brain neuromodulation system for treating acute migraine. BusinessWire. Published January 6, 2021. Accessed August 13, 2021. https://www.businesswire.com/news/home/20210106005510/en/Neurolief-Announces-Positive-Results-From-RIME-Clinical-Study-of-Its-Brain-Neuromodulation-System-for-Treating-Acute-Migraine
12. Ni Y, Yang L, Han R, et al. Implantable peripheral nerve stimulation for trigeminal neuropathic pain: a systematic review and meta-analysis. Neuromodulation. 2021 May 18. doi: 10.1111/ner.13421. [Epub ahead of print].
13. Lipton RB, Dodick DW, Silberstein SD, et al. Single-pulse transcranial magnetic stimulation for acute treatment of migraine with aura: a randomized, double-blind, parallel-group, sham-controlled trial. Lancet Neurol. 2010;9(4):373-380.
14. PRESTO clinical trial overview. electroCore. Published 2018. Accessed August 13, 2021. https://www.electrocore.com/wp-content/themes/wp-starter/includes/images/PRESTO_Clinical_Trial_Fact_Sheet_3.29.18.pdf
15. Lipton RB, Munjal S, Brand-Schieber E, Rapoport AM. DFN-02 (sumatriptan 10 mg with a permeation enhancer) nasal spray vs placebo in the acute treatment of migraine: a double-blind, placebo-controlled study. Headache. 2018;58(5):676-687.
16. Clinical trials. Biohaven Pharmaceuticals. Accessed August 14, 2021. https://www.biohavenpharma.com/science-pipeline/resources/clinical-trials
17. Biohaven achieves targeted therapeutic exposures of BHV-3500, a third-generation small molecule CGRP receptor antagonist. Biohaven Pharmaceuticals. Published February 4, 2019. Accessed August 14, 2021. https://www.biohavenpharma.com/investors/news-events/press-releases/02-04-2019
18. Biohaven achieves positive topline results in pivotal phase 2/3 study of vazegepant, the first and only intranasal CGRP receptor antagonist in clinical development for the acute treatment of migraine. Biospace. Published December 17, 2019. Accessed August 14, 2021. https://www.biospace.com/article/releases/biohaven-achieves-positive-topline-results-in-pivotal-phase-2-3-study-of-vazegepant-the-first-and-only-intranasal-cgrp-receptor-antagonist-in-clinical-development-for-the-acute-treatment-of-migraine/
19. Schoenen J, Jensen RH, Lantéri-Minet M, et al. Stimulation of the sphenopalatine ganglion (SPG) for cluster headache treatment. Pathway CH-1: a randomized, sham-controlled study. Cephalalgia. 2013;33(10):816-830.
20. Spierings EL, Brandes JL, Kudrow DB, et al. Randomized, double-blind, placebo-controlled, parallel-group, multi-center study of the safety and efficacy of ADAM zolmitriptan for the acute treatment of migraine. Cephalalgia. 2018;38(2):215-224.
21. STS101 (DHE Nasal Powder). Satsuma Pharmaceuticals. Accessed August 14, 2021. https://www.satsumarx.com/our-research/sts101/
22. Impel NeuroPharma announces U.S. Food & Drug Administration acceptance of new drug application for INP104 for the acute treatment of migraine. PRNewswire. Published January 20, 2021. Accessed August 14, 2021. https://www.prnewswire.com/news-releases/impel-neuropharma-announces-us-food--drug-administration-acceptance-of-new-drug-application-for-inp104-for-the-acute-treatment-of-migraine-301211380.html
Remote upper arm neuromodulation and combined occipital and trigeminal neuromodulation lead the way as the newest entries to the field, followed by 8 other devices that are now available or are expected to be soon.
The increasing array of prescription medications for the treatment of migraine are welcome additions for patients who suffer from this life-altering condition and the clinicians who treat it; but not all individuals tolerate oral and injectable therapies, and others face the risk of adverse events and medication overuse headache.1 Fortunately, there are a number of devices available to consider, and still others are awaiting approval from the US Food and Drug Administration (FDA).
Two of the most promising devices are remote upper arm neuromodulation (REN) and combined occipital and trigeminal neuromodulation. Here we highlight data from pivotal trials evaluating these 2 treatment options and provide information about other devices worth consideration.
Remote Upper Arm Neuromodulation (REN)
Nerivio was initially authorized by the FDA for the acute treatment of episodic migraine. Available by prescription, the device is administered by the patient at home.2 It stimulates upper arm peripheral nerves, which induces conditioned pain modulation (CPM) that inhibits pain in remote parts of the body. In other words, a descending, endogenous analgesic “pain inhibits pain” mechanism is used.
The initial authorization was based on the results of a randomized, double-blind, sham-controlled, multicenter study involving 252 individuals who were experiencing 2 to 8 migraine headaches per month. Participants were assigned to either a treatment group (n=126), where the device was applied for 30 to 45 minutes within an hour of a migraine attack, or to a sham treatment group (n=126). Investigators looked at migraine pain levels at baseline and at 2 and 48 hours post-treatment, as well as patient-reported most bothersome symptoms. They found that REN provided superior, clinically meaningful relief from migraine pain and the most bothersome symptoms, as follows3:
- 67% of patients in the active treatment group achieved a response at 2 hours vs 39% of individuals in the sham-treatment group
- Pain-free rates at 2 hours in each group were 37% and 18%, respectively
- Most bothersome symptom relief rates at 2 hours were 46% and 22%, respectively
Additionally, pain relief and pain-free responses were sustained at 48 hours. Nearly 40% of active treatment participants still reported pain relief at 48 hours, with pain-free rates at 48 hours in each group of 21% and 8%, respectively. The adverse event rate was low. The most commonly reported adverse event in the active-treatment group was a sensation of warmth (2.4%). Arm pain (1.6%), redness (1.6%), and numbness (0.8%) were also reported in those receiving active treatment.3
In 2020, REN received authorization for the acute treatment of chronic migraine in adults, and the following year authorization was expanded to include adolescent migraine. This development offered a nonpharmacologic treatment approach for migraine sufferers who experience 15 or more headache days per month, which is significant because it reduces the likelihood of medication overuse headache.
Approval for chronic migraine was based on results of an open-label, single-arm, dual-center study involving 38 individuals with chronic migraine. Participants used the device over 4 weeks within 1 hour of a migraine attack. Investigators assessed pain levels at 2 and 24 hours after use; they defined consistency of response as response to at least half of the treatments. The study demonstrated the following4:
- 74% of patients attained pain relief at 2 hours
- 26% were pain free at 2 hours
- 84% achieved sustained pain relief at 24 hours
- 45% achieved sustained pain relief at 24 hours in at least half of their treated attacks
- <2% of participants experienced device-related adverse events
The authors concluded that REN could be used for a series of migraine attacks and is a safe and effective nonpharmacologic approach for individuals who suffer from chronic migraine.4
The findings from these trials are supported by a subsequent trial published earlier this year. This open-label, single-arm study evaluated 91 individuals with chronic migraine who were treated with REN for 4 weeks. Investigators assessed pain levels, associated pain symptoms, and functional disability at baseline as well as at 2 and 24 hours post-treatment. Of the patients in this study5:
- At 2 hours, 59% achieved pain relief, and 21% reported that their pain disappeared
- 73% noted sustained pain relief at 24 hours
- REN was shown to impact nausea, photophobia, and phonophobia favorably, and patients’ functional ability also improved after use
Results from 2 additional trials were also recently released. One study involving 35 adolescents treated with either REN or standard-of-care medications showed REN to be superior with regard to pain freedom (37% vs 9%), consistency of pain freedom (40% vs 9%), pain relief (71% vs 57%), and consistency of pain relief (80% vs 57%).6 The other study included 91 women with a history of menstrual migraine and at least 4 REN treatments. Nearly 75% of patients reported Nerivio to be at least moderately effective, 45% said they were satisfied with the treatment, and all participants noted that it was at least moderately tolerable.7
Combined Occipital and Trigeminal Neuromodulation
In March 2021, the FDA authorized combined occipital and trigeminal neuromodulation (Relivion) for self-treatment of acute migraine.8 It is not yet commercially available, but it will require a prescription. The headset-like device stimulates the occipital and trigeminal nerves by delivering precise modulated pulses simultaneously to 6 branches of the occipital and trigeminal nerves via 3 adaptive output channels. The occipital and trigeminal nerves conduct the signals directly to the brainstem, which maximizes the synergistic effect.9
The results of 2 clinical trials led to FDA approval. These studies have not yet been published in a peer-reviewed journal. The first study, presented at the 61st Annual Scientific Meeting of the American Headache Society in 2019, was a prospective, randomized, double-blind, parallel-group, sham-controlled clinical study involving 55 individuals with chronic or episodic migraine. Participants administered the device for 1 hour soon after migraine onset or administered a sham treatment. Researchers looked at pain score change from baseline to 1 hour post-treatment, as well as pain intensity at baseline and at 1, 2, and 24 hours post-treatment. The study showed that 76% of participants in the active-treatment group experienced headache relief at 2 hours vs 32% in the sham-treatment contingent. No serious adverse events were reported.10 The investigators hypothesized that the positive results observed were a result of the synergistic neuromodulatory effect elicited by concurrent activation of the occipital and trigeminal neural pathways.
Following this study, there was a multi-center, prospective, randomized, double-blind, placebo-controlled clinical trial involving 131 individuals with migraine with or without aura. Participants were assigned to either active treatment or placebo. Investigators assessed reported migraine pain reduction at 2 hours, as well as improvement in most bothersome symptoms after 2 hours, reported pain reduction at 1 hour, and being pain-free at 2 hours. At 2 hours post-treatment11:
- 46% of individuals who were actively treated reached complete freedom from pain vs 12% in the control group
- 75% of active-treatment participants reported being completely free of their most bothersome symptom vs 47% of control patients
- The rates of complete freedom from migraine symptoms were 47% and 11%, respectively
- The rates of pain relief after 2 hours were 60% and 37%, respectively
- No serious adverse events were noted
A systematic review and meta-analysis of 13 studies involving 221 individuals published earlier this year looked at changes in pain scores and response rates to implantable peripheral nerve stimulation for trigeminal neuropathic pain. The response rate to neuromodulation therapy was 61%, the reduction in overall pain scores (2.363) was significant, and a subgroup assessment revealed that the stimulation target (peripheral branch, trigeminal ganglion, or trigeminal nerve root) was responsible for heterogeneity across the studies analyzed. Furthermore, stimulating the trigeminal peripheral branch resulted in better clinical outcomes. The authors noted that their findings reinforce the promise of implantable therapy, particularly for individuals who do not tolerate traditional therapies.12
Looking forward, new data are scheduled to be presented at the International Headache Virtual Congress in September 2021 showing that neuromodulation therapy is highly effective in reducing monthly headache days in individuals who suffer from difficult-to-treat migraine. A larger-scale, double-blind, sham-controlled study is planned to further establish these findings.
Other FDA-Approved Therapies
A number of other devices are available for treatment of migraine headache, including:
- Transcranial magnetic stimulation (TMS). In a randomized trial involving 164 individuals with migraine, 39% of the individuals receiving treatment were pain-free at 2 hours vs 22% of those given sham treatment13
- Noninvasive vagal nerve stimulation (nVNS). This is performed using a handheld device that is controlled by the patient, which preferentially activates afferent A and large B fibers. In a randomized trial involving 243 individuals, pain-free rates at 30, 60, and 120 minutes for patients receiving active treatment were 13%, 21%, and 30%, respectively. Rates for those receiving sham treatment were 4%, 10%, and 20%, respectively.14
- Sumatriptan nasal spray (10 mg) with a permeation enhancer. A randomized phase 2 trial involving 107 individuals found that 44% of participants in the treatment group achieved pain freedom at 2 hours vs 23% who received placebo. The spray appears to work quickly and with fewer adverse events than generic sumatriptan 20 mg nasal spray.15
- Transcutaneous supraorbital nerve stimulation (tSNS). Available without a prescription, there are 3 devices that can treat acute migraine; prevent acute migraine; or both.
Therapies Awaiting FDA Approval
There are several therapeutic options in the pipeline that have not yet been authorized by the FDA.
- Zavegepant (formerly known as vazegepant) nasal spray.16 This third-generation small molecule calcitonin gene-related peptide (CGRP) receptor antagonist has been demonstrated to work as a nasal spray in individuals with migraine. In a phase 1 study, the spray was shown to reach maximal concentration earlier than with other CGRP receptor antagonists.17 A phase 2/3 placebo-controlled trial demonstrated sustained pain freedom from 2 to 48 hours with 5-mg, 10-mg, and 20-mg dosages. The 10-mg and 20-mg doses were statistically superior to placebo on the co-primary endpoints of pain freedom and freedom from most bothersome symptom at 2 hours using a single dose. Sustained pain relief from 2 to 48 hours was seen with the 5-mg and 10-mg dosages18
- Sphenopalatine ganglion (SPG) stimulation. This is a microstimulator that is inserted orally, designed to fit the face, and directly targets SPG. Stimulation is active and controlled by the patient. A randomized, sham-controlled trial evaluated acute pain relief as well as pain freedom and found that those receiving treatment were more than twice as likely to experience pain relief and pain freedom19
- Adhesive dermally applied microneedle system (ADAM). This is a transdermal patch containing microprojections, which can be coated with both large and small molecules. In a randomized trial, 42% of treated participants reported being pain free at 2 hours vs 14% of placebo-treated patients. Rates of freedom from most bothersome symptom were 68% and 43%, respectively20
- Dihydroergotamine (DHE) nasal powder spray and intranasal liquid. Both therapies are awaiting FDA approval. The mucoadhesive powder formulation facilitates rapid drug absorption and is offered in a single-use nasal delivery device. In clinical trials, the spray demonstrated the device’s simplicity, reliability, and ease of use.21 The intranasal liquid is designed to deliver the drug into the vascular-rich upper nasal space. In the phase 3 trial that included 354 patients, 66.3% of patients reported pain relief, 38% of patients reported pain freedom, and 52% had freedom from their most bothersome migraine symptom at 2 hours following their first dose.22
References
1. Rapoport AM. Medication overuse headache: preventive treatment with or without detoxification? Published May 24, 2021. Accessed August 13, 2021. https://www.mdedge.com/migraine-icymi/article/240472/headache-migraine/medication-overuse-headache-preventive-treatment-or
2. How to prescribe Nerivio. Theranica. Accessed August 13, 2021. https://nerivio.co/prescribe/
3. Yarnitsky D, Dodick DW, Grosberg BM, et al. Remote electrical neuromodulation (REN) relieves acute migraine: a randomized, double-blind, placebo-controlled, multicenter trial. Headache. 2019;59(8):1240-1252.
4. Nierenburg H, Vieira JR, Lev N, et al. Remote electrical neuromodulation for the acute treatment of migraine in patients with chronic migraine: an open-label pilot study. Pain Ther. 2020;9(2):531-543.
5. Grosberg B, Lin T, Vizel M, Schim J. Remote electrical neuromodulation for the acute treatment of chronic migraine (2007). Neurology. 2021;96(15 Suppl) 2007.
6. Hershey AD, Irwin S, Rabany L, et al. Comparison of remote electrical neuromodulation (REN) and standard-care medications for acute treatment of migraine in adolescents: a post-hoc analysis. Pain Med. 2021 June 29;pnab197. doi: 10.1093/pm/pnab197. [Epub ahead of print].
7. Nierenburg H, Rabany L, Lin T, et al. Remote electrical neuromodulation (REN) for the acute treatment of menstrual migraine: a retrospective survey study of effectiveness and tolerability. Pain Ther. 2021 Jun 17. doi: 10.1007/s40122-021-00276-7. [Epub ahead of print].
8. Brooks M. FDA clears neuromodulation device for acute migraine pain. Published March 2, 2021. Accessed August 13, 2021. https://www.medscape.com/viewarticle/946700
9. A new ecosystem for brain neuromodulation. Neurolief. Accessed August 13, 2021. https://www.neurolief.com/technology/
10. Daniel O, Tepper SJ. First non-invasive combined occipital & trigeminal nerve stimulation digital therapeutics system for treatment of migraine: a randomized, sham-controlled, double-blind clinical trial. Published 2019. Accessed August 13, 2021. https://www.neurolief.com/wp-content/uploads/2019/07/American-Headache-Society2019-Abstract-Oved-Daniel-Stewart-Tepper.pdf
11. Neurolief announces positive results from RIME clinical study of its brain neuromodulation system for treating acute migraine. BusinessWire. Published January 6, 2021. Accessed August 13, 2021. https://www.businesswire.com/news/home/20210106005510/en/Neurolief-Announces-Positive-Results-From-RIME-Clinical-Study-of-Its-Brain-Neuromodulation-System-for-Treating-Acute-Migraine
12. Ni Y, Yang L, Han R, et al. Implantable peripheral nerve stimulation for trigeminal neuropathic pain: a systematic review and meta-analysis. Neuromodulation. 2021 May 18. doi: 10.1111/ner.13421. [Epub ahead of print].
13. Lipton RB, Dodick DW, Silberstein SD, et al. Single-pulse transcranial magnetic stimulation for acute treatment of migraine with aura: a randomized, double-blind, parallel-group, sham-controlled trial. Lancet Neurol. 2010;9(4):373-380.
14. PRESTO clinical trial overview. electroCore. Published 2018. Accessed August 13, 2021. https://www.electrocore.com/wp-content/themes/wp-starter/includes/images/PRESTO_Clinical_Trial_Fact_Sheet_3.29.18.pdf
15. Lipton RB, Munjal S, Brand-Schieber E, Rapoport AM. DFN-02 (sumatriptan 10 mg with a permeation enhancer) nasal spray vs placebo in the acute treatment of migraine: a double-blind, placebo-controlled study. Headache. 2018;58(5):676-687.
16. Clinical trials. Biohaven Pharmaceuticals. Accessed August 14, 2021. https://www.biohavenpharma.com/science-pipeline/resources/clinical-trials
17. Biohaven achieves targeted therapeutic exposures of BHV-3500, a third-generation small molecule CGRP receptor antagonist. Biohaven Pharmaceuticals. Published February 4, 2019. Accessed August 14, 2021. https://www.biohavenpharma.com/investors/news-events/press-releases/02-04-2019
18. Biohaven achieves positive topline results in pivotal phase 2/3 study of vazegepant, the first and only intranasal CGRP receptor antagonist in clinical development for the acute treatment of migraine. Biospace. Published December 17, 2019. Accessed August 14, 2021. https://www.biospace.com/article/releases/biohaven-achieves-positive-topline-results-in-pivotal-phase-2-3-study-of-vazegepant-the-first-and-only-intranasal-cgrp-receptor-antagonist-in-clinical-development-for-the-acute-treatment-of-migraine/
19. Schoenen J, Jensen RH, Lantéri-Minet M, et al. Stimulation of the sphenopalatine ganglion (SPG) for cluster headache treatment. Pathway CH-1: a randomized, sham-controlled study. Cephalalgia. 2013;33(10):816-830.
20. Spierings EL, Brandes JL, Kudrow DB, et al. Randomized, double-blind, placebo-controlled, parallel-group, multi-center study of the safety and efficacy of ADAM zolmitriptan for the acute treatment of migraine. Cephalalgia. 2018;38(2):215-224.
21. STS101 (DHE Nasal Powder). Satsuma Pharmaceuticals. Accessed August 14, 2021. https://www.satsumarx.com/our-research/sts101/
22. Impel NeuroPharma announces U.S. Food & Drug Administration acceptance of new drug application for INP104 for the acute treatment of migraine. PRNewswire. Published January 20, 2021. Accessed August 14, 2021. https://www.prnewswire.com/news-releases/impel-neuropharma-announces-us-food--drug-administration-acceptance-of-new-drug-application-for-inp104-for-the-acute-treatment-of-migraine-301211380.html
Multidisciplinary, Specialized Care for Spinal Muscular Atrophy
Spinal muscular atrophy (SMA) is a progressive, autosomal recessive neuromuscular disease caused by survival motor neuron protein deficiency. SMA has four phenotypes, characterized by varying levels of severity and age of onset. Types 1 and 2 are the most common and the most deadly, affecting children from birth to age 2 years. SMA is the leading genetic cause of infant death.
In this ReCAP, neurologist Emma Ciafaloni, MD, explains how novel gene therapies for SMA disrupt the pathophysiology of the disease. Use of these agents should be left to a specialist who has expertise in monitoring progression of SMA. Dr Ciafaloni is director of the Muscular Dystrophy Association Clinic at Strong Memorial Hospital in Rochester, New York, where she leads a multidisciplinary SMA care team that includes a pulmonologist, pediatrician, physical therapist, orthopedist, and dietitian.
She recommends that pediatricians stay abreast of their state's position on newborn screening for SMA because research shows that early diagnosis and treatment can improve outcomes, including life expectancy and quality of life.
Professor of Neurology, Pediatrics, and Obstetrics and Gynecology, Department of Neurology, University of Rochester; Director, The Muscular Dystrophy Association Clinic; Program Director, Neuromuscular Medicine Fellowship, Strong Memorial Hospital, Rochester, New York
-- Emma Ciafaloni, MD, has disclosed the following relevant financial relationships:
Serve(d) as a director, officer, partner, employee, advisor, consultant, or trustee for: Biogen; AveXis; Ra Pharmaceuticals, Inc.; Wave Pharma; Sarepta Therapeutics; Viela Bio; PTC Therapeutics; Strongbridge Biopharma
Serve(d) as a speaker or a member of a speakers bureau for: Biogen
Received research grant from: Santhera Pharmaceuticals; Sarepta Therapeutics; Orphazyme; PTC Therapeutics; US Food and Drug Administration; Parent Project Muscular Dystrophy; Cure SMA; Centers for Disease Control and Prevention

Explosive aggression may be neurologic
Aggression is an underappreciated mental health issue, and biological mechanisms might help explain more extreme forms like intermittent explosive disorder (IED), which is characterized by episodes of sudden impulses and inappropriate aggression, violence, or even verbal outbursts. IED can lead to road rage, domestic abuse, in addition to throwing objects and engaging in other destructive behaviors.

Despite those consequences, aggression hasn’t gained the same level of attention as other psychiatric conditions, according to Emil F. Coccaro, MD, who spoke about the topic at a virtual meeting presented by Current Psychiatry and the American Academy of Clinical Psychiatrists.
“People seem to think that aggressive behavior is bad behavior, and therefore people just need an attitude adjustment. So there’s this sort of stigma, and there are no advocacy groups for it. There are no poster children for it. But there’s a whole lot of biology and neuroscience behind it,” said Dr. Coccaro, in an interview. He is a professor and vice chair of research in psychiatry and behavioral health at Ohio State University, Columbus.
, who spoke at the meeting presented by MedscapeLive. MedscapeLive and this news organization are owned by the same parent company.
There is a general view that psychiatric conditions may lead to increased aggression, but there is little evidence of that. “As a general statement, having a psychological [illness] in and of itself does not really increase the risk of being aggressive. What does is being aggressive in general, and substance use disorder. And the thing with [people who have] substance use disorders is that they only get aggressive when they are aggressive to begin with,” said Dr. Coccaro, noting that the strongest case for the relationship surrounds alcohol abuse.
The DSM-5 criteria for IED include: verbal or physical aggression without destruction, at least twice per week, or three or more episodes of assault or physical destruction within a year. The behavior must be out of proportion to the provocation, cause distress or impairment, and not be accountable by other diagnoses. “If they’re blowing up twice a week, for a few months, and usually they’re doing it for a long time, then that’s different than just blowing up very occasionally. Healthy people, nonaggressive people, maybe they blow up once a year, or even less frequently than that,” Dr. Coccaro said.
Functional magnetic resonance imaging and other imaging studies consistently show differences associated with aggression.
“The IEDs really do distinguish themselves from the psychiatric controls. They also have other stuff going on with them; they have a hostile attribution. And they’re kind of irritable at baseline. They’re not walking around irritable all the time, but the people around them may be walking on eggshells,” Dr. Coccaro said.
The results from these sorts of studies aren’t fully conclusive and can’t be used for diagnosis, in part because of a lack of power. “It’s hard to do these MRI studies and lots and lots of subjects, because they’re kind of expensive,” Dr. Coccaro said. “We’re just not there yet.”
Other, less expensive imaging techniques like near-infrared spectroscopy may improve matters. “That might be something down the road that could lead to something (diagnostic). Right now, most imaging studies are being done to really understand mechanisms,” said Dr. Coccaro.
Those mechanistic studies suggest that the culprit for IED may be a combination of too much drive from subcortical structures like the amygdala and insufficient inhibitor function in the frontal part of the brain. The frontal cortex may suffer a loss of gray matter, according to Dr. Coccaro, and there may be insufficient connectivity, which could weaken signals coming from the frontal areas that might otherwise inhibit lower centers of the brain.
Treatment for IED could be aimed at improving that connectivity and signaling. Ketamine and other anesthetic agents like nitrous oxide may increase connectivity to nerve cells by increasing branching at synaptic dendrites.
Selective serotonin reuptake inhibitors have the potential to treat IED, but their utility is limited because they bind to the presynaptic transporter for serotonin, and more aggressive people have fewer of those transporters. “You only get so much bang for your buck,” Dr. Coccaro said.
Cognitive-behavioral therapy that focuses on anger management and relaxation shows promise. “CBT does help people deal with what’s coming at them. So it’s like, ‘oh, I’m getting angry, I better start doing those relaxation (techniques).’ It teaches them to rethink things.”
During the Q&A session following the presentation, Henry A. Nasrallah, MD, who moderated the session, pointed out that misattribution can occur, leading an affected individual to misread someone’s facial expression and react aggressively, which is a problem also seen in psychosis.
“There are studies showing [that if] you show them a series of faces with different affects, many times paranoid patients read a normal facial expression as threatening. So it may be that it’s the same thing with aggression,” said Dr. Nasrallah, who is a professor of psychiatry, neurology, and neuroscience at the University of Cincinnati.
In the midst of the ongoing COVID-19 pandemic, it’s also possible that mask-wearing could improve or worsen such misunderstandings. “There is expression in the eyes that you can see, but you miss a lot,” Dr. Coccaro said.
For now, the effects of masks remain largely unknown. But that will change. “Sooner or later we will have a bunch of papers coming out about how masks have changed a lot of behaviors,” Dr. Nasrallah said.
Dr. Coccaro has consulted for Avanir, Azevan, and Brackett. Dr. Nasrallah has consulted for Acadia, Alkermes, Allergan Janssen, Otsuka, Indivior, IntraCellular, Neurocrine, Sunovion, Teva, and Boehringer-Ingelheim. Dr. Nasrallah has been on a speaker’s bureau for Acadia, Alkermes, Allergan, Janssen, Otsuka, Indivior, Intracellular, Neurocrine, Noven, Sunovion, and Teva.
Aggression is an underappreciated mental health issue, and biological mechanisms might help explain more extreme forms like intermittent explosive disorder (IED), which is characterized by episodes of sudden impulses and inappropriate aggression, violence, or even verbal outbursts. IED can lead to road rage, domestic abuse, in addition to throwing objects and engaging in other destructive behaviors.
Despite those consequences, aggression hasn’t gained the same level of attention as other psychiatric conditions, according to Emil F. Coccaro, MD, who spoke about the topic at a virtual meeting presented by Current Psychiatry and the American Academy of Clinical Psychiatrists.
“People seem to think that aggressive behavior is bad behavior, and therefore people just need an attitude adjustment. So there’s this sort of stigma, and there are no advocacy groups for it. There are no poster children for it. But there’s a whole lot of biology and neuroscience behind it,” said Dr. Coccaro, in an interview. He is a professor and vice chair of research in psychiatry and behavioral health at Ohio State University, Columbus.
, who spoke at the meeting presented by MedscapeLive. MedscapeLive and this news organization are owned by the same parent company.
There is a general view that psychiatric conditions may lead to increased aggression, but there is little evidence of that. “As a general statement, having a psychological [illness] in and of itself does not really increase the risk of being aggressive. What does is being aggressive in general, and substance use disorder. And the thing with [people who have] substance use disorders is that they only get aggressive when they are aggressive to begin with,” said Dr. Coccaro, noting that the strongest case for the relationship surrounds alcohol abuse.
The DSM-5 criteria for IED include: verbal or physical aggression without destruction, at least twice per week, or three or more episodes of assault or physical destruction within a year. The behavior must be out of proportion to the provocation, cause distress or impairment, and not be accountable by other diagnoses. “If they’re blowing up twice a week, for a few months, and usually they’re doing it for a long time, then that’s different than just blowing up very occasionally. Healthy people, nonaggressive people, maybe they blow up once a year, or even less frequently than that,” Dr. Coccaro said.
Functional magnetic resonance imaging and other imaging studies consistently show differences associated with aggression.
“The IEDs really do distinguish themselves from the psychiatric controls. They also have other stuff going on with them; they have a hostile attribution. And they’re kind of irritable at baseline. They’re not walking around irritable all the time, but the people around them may be walking on eggshells,” Dr. Coccaro said.
The results from these sorts of studies aren’t fully conclusive and can’t be used for diagnosis, in part because of a lack of power. “It’s hard to do these MRI studies and lots and lots of subjects, because they’re kind of expensive,” Dr. Coccaro said. “We’re just not there yet.”
Other, less expensive imaging techniques like near-infrared spectroscopy may improve matters. “That might be something down the road that could lead to something (diagnostic). Right now, most imaging studies are being done to really understand mechanisms,” said Dr. Coccaro.
Those mechanistic studies suggest that the culprit for IED may be a combination of too much drive from subcortical structures like the amygdala and insufficient inhibitor function in the frontal part of the brain. The frontal cortex may suffer a loss of gray matter, according to Dr. Coccaro, and there may be insufficient connectivity, which could weaken signals coming from the frontal areas that might otherwise inhibit lower centers of the brain.
Treatment for IED could be aimed at improving that connectivity and signaling. Ketamine and other anesthetic agents like nitrous oxide may increase connectivity to nerve cells by increasing branching at synaptic dendrites.
Selective serotonin reuptake inhibitors have the potential to treat IED, but their utility is limited because they bind to the presynaptic transporter for serotonin, and more aggressive people have fewer of those transporters. “You only get so much bang for your buck,” Dr. Coccaro said.
Cognitive-behavioral therapy that focuses on anger management and relaxation shows promise. “CBT does help people deal with what’s coming at them. So it’s like, ‘oh, I’m getting angry, I better start doing those relaxation (techniques).’ It teaches them to rethink things.”
During the Q&A session following the presentation, Henry A. Nasrallah, MD, who moderated the session, pointed out that misattribution can occur, leading an affected individual to misread someone’s facial expression and react aggressively, which is a problem also seen in psychosis.
“There are studies showing [that if] you show them a series of faces with different affects, many times paranoid patients read a normal facial expression as threatening. So it may be that it’s the same thing with aggression,” said Dr. Nasrallah, who is a professor of psychiatry, neurology, and neuroscience at the University of Cincinnati.
In the midst of the ongoing COVID-19 pandemic, it’s also possible that mask-wearing could improve or worsen such misunderstandings. “There is expression in the eyes that you can see, but you miss a lot,” Dr. Coccaro said.
For now, the effects of masks remain largely unknown. But that will change. “Sooner or later we will have a bunch of papers coming out about how masks have changed a lot of behaviors,” Dr. Nasrallah said.
Dr. Coccaro has consulted for Avanir, Azevan, and Brackett. Dr. Nasrallah has consulted for Acadia, Alkermes, Allergan Janssen, Otsuka, Indivior, IntraCellular, Neurocrine, Sunovion, Teva, and Boehringer-Ingelheim. Dr. Nasrallah has been on a speaker’s bureau for Acadia, Alkermes, Allergan, Janssen, Otsuka, Indivior, Intracellular, Neurocrine, Noven, Sunovion, and Teva.
REPORTING FROM FOCUS ON NEUROPSYCHIATRY 2021
Nearly 1 in 5 parents put off care for their kids in pandemic
Many families delayed much-needed health care for their children out of fears that they may be exposed to SARS-CoV-2, according to data from the Urban Institute April 2021 Health Reform Monitoring Survey.
Data from 9,067 adults aged 18 to 64 years indicate that nearly 1 in 5 parents delayed or did not get care for their children in the past 12 months because of fear of exposure to the virus.
“It’s not surprising given the timing of the survey – April 2021 – when many people couldn’t get a vaccine yet and were reporting delayed care because of concerns about exposure during the past 30 days,” study author Dulce Gonzalez, BA, a research associate in the Health Policy Center at the Urban Institute, said in an interview.
In a previous survey that the Urban Institute conducted in September 2020, 28.8% of parents reported delaying or forgoing one or more types of health care for their children because of virus concerns or health care practitioner service limits.
These concerns still affect parents’ decision making when it comes to their child’s health. Nearly 1 in 10 parents reported that they had skipped doctor’s appointments for their children in the past 30 days. More than 1 in 10 adults forwent their own health care in the past month for the same reason.
“I think it’s important for parents to understand that health care workers and health care facilities are equipped to prevent infections from spreading,” Mundeep Kainth, DO, MPH, who was not involved in the study, told this news organization. “COVID-19 is not the first infection that we’ve seen in the medical setting, and we definitely are well aware of how it can spread and have been taking many precautions.”
The most common type of delayed or forgone care was dental care (5.3%), followed by well-child visits (4.0%) and general or specialist visits (3.2%). About 3% of parents said their child had missed out on immunizations. Nearly 6% of parents said their child had missed out on multiple types of care.
One reason dental care is the most commonly skipped type of care is because people might not consider dental care to be as urgent as other types of care, Ms. Gonzalez said. However, oral health can affect a person’s overall wellness.
Dr. Kainth, an infection disease specialist at Cohen Children’s Medical Center, New Hyde Park, New York, said the lack of immunization because of COVID-19 can have adverse health effects on children and could possibly lead to outbreaks in schools and day care settings. In the Urban Institute’s 2020 survey, 18.5% of parents said putting off their child’s health care worsened their child’s health, and 15.6% said it limited their children’s ability to go to school or day care.
“We are already concerned that we will have pockets of [vaccine-preventable] infections that we normally did not see before in communities where they are not vaccinating their children at high enough numbers,” Dr. Kainth said. “It is a little concerning that there’s probably a lot of catch up to be done for particular vaccines that are specifically for those entering day care and school.”
The current survey also found that parents with incomes below 250% of the federal poverty level were more likely than those with higher incomes to have put off care for their children in the past 30 days. More than 12% of families living in poverty put off care for their children, compared with 6.5% of those with higher incomes. They were also more likely to delay or forgo multiple types of care, at 8.1% versus 3.3%. Parents with lower family incomes were also more likely to report that their children had unmet needs for dental care, checkups, or other preventive care.
“We know that lower-income parents could be more exposed to costs they might not be able to afford if they were to get sick,” Ms. Gonzalez said. “Low-income adults have been disproportionately affected by job loss during the pandemic. They are also more likely to live in communities that have faced the largest health impacts of COVID-19.”
“There’s also advantages to the pediatrician visit that are not just about providing care but also providing guidance and advice to families and parents who are maybe struggling with certain issues that are above and beyond just the medical advice,” Dr. Kainth explained.
“That is probably the most tragic part of hearing that parents and kids are not going to the well visits, because that’s where families get a lot of support. And I think at this time, we probably need that more than ever,” she continued.
The authors said the findings highlight the importance of increasing rates of COVID-19 vaccinations among eligible adolescents and encouraging vaccinations for children younger than 12 when they become eligible, not only to protect them from COVID-19 but also to help families feel comfortable obtaining care.
The study was funded by the Robert Wood Johnson Foundation. The authors and Dr. Kainth have disclosed no relevant financial relationships.
A version of this article first appeared on Medscape.com.
Early data for experimental THC drug ‘promising’ for Tourette’s
Oral delta-9-tetrahydracannabinol (delta-9-THC) and palmitoylethanolamide (PEA), in a proprietary combination known as THX-110, is promising for reducing tic symptoms in adults with Tourette syndrome (TS), new research suggests.
In a small phase 2 trial, investigators administered THX-110 to 16 adults with treatment-resistant TS for 12 weeks. Results showed a reduction of more than 20% in tic symptoms after the first week of treatment compared with baseline.
“We conducted an uncontrolled study in adults with severe TS and found that their tics improved over time while they took THX-110,” lead author Michael Bloch, MD, associate professor and co-director of the Tic and OCD Program at the Child Study Center, Yale University, New Haven, Conn., told this news organization.
Dr. Bloch added that the next step in this line of research will be to conduct a placebo-controlled trial of the compound in order to assess whether tic improvement observed over time in this study “was due to the effects of the medication and not related to the natural waxing-and-waning course of tic symptoms or treatment expectancy.”
The findings were published online August 2 in the Journal of Neuropsychiatry and Clinical Neurosciences.
‘Entourage effect’
“Several lines of evidence from clinical observation and even randomized controlled trials” suggest that cannabis (cannabis sativa) and delta-9-THC may be effective in treatment of tic disorders, Dr. Bloch said.
“Cannabinoid receptors are present in the motor regions important for tics, and thus, there is a potential mechanism of action to lead to improvement of tics,” he added.
However, “the major limitations of both cannabis and dronabinol [a synthetic form of delta-9-THC] use are the adverse psychoactive effects they induce in higher doses,” he said.
Dr. Bloch noted that PEA is a lipid messenger “known to mimic several endocannabinoid-driven activities.”
For this reason, combining delta-9-THC with PEA is hypothesized to reduce the dose of delta-9-THC needed to improve tics and also potentially lessen its side effects.
This initial open-label trial examined safety and tolerability of THX-110, as well as its effect on tic symptoms in adults with TS. The researchers hoped to “use the entourage effect to deliver the therapeutic benefits of delta-9-THC in reducing tics with decrease psychoactive effects by combining with PEA.”
The “entourage effect” refers to “endocannabinoid regulation by which multiple endogenous cannabinoid chemical species display a cooperative effect in eliciting a cellular response,” they write.
The investigators conducted a 12-week uncontrolled trial of THX-110, used at its maximum daily dose of delta-9-THC (10 mg) and a constant 800-mg dose of PEA in 16 adults with TS (mean age, 35 years; mean TS illness duration, 26.6 years).
Participants had a mean baseline Yale Global Tic Severity Scale (YGTSS) score of 38.1 and a mean worst-ever total tic score of 45.4.
All participants were experiencing persistent tics, despite having tried an array of previous evidence-based treatments for TS, including antipsychotics, alpha-2 agonists, VMAT2 inhibitors, benzodiazepines, and topiramate (Topamax).
Significant improvement
Results showed significant improvement in tic symptoms with TXH-110 treatment over time (general linear model time factor: F = 3.06, df = 7.91, P = .006).
At first assessment point, mean YGTSS improvement was 3.5 (95% confidence interval, 0.1-6.9; P = .047). The improvement not only remained significant but continued to increase throughout the 12-week trial period.
At 12 weeks, the maximal improvement in tic symptoms was observed, with a mean YGTSS improvement at endpoint of 7.6 (95% CI, 2.5-12.8; P = .007).
Four patients experienced a greater than 35% improvement in tic symptoms during the trial, whereas 6 experienced a 25% or greater improvement. The mean improvement in tic symptoms over the course of the trial was 20.6%.
There was also a significant improvement between baseline and endpoint on other measures of tic symptoms – but not on premonitory urges.
The patients experienced “modest” but not significant improvement in comorbid symptoms, including attentional, anxiety, depressive, and obsessive-compulsive symptoms.
Adverse events
All participants experienced some mild side effects for “a couple hours” after taking the medication, particularly during the course of dose escalation and maintenance. However, these were not serious enough to warrant stopping the medication.
These effects typically included fatigue/drowsiness, feeling “high,” dry mouth, dizziness/lightheadedness, and difficulty concentrating.
Side effects of moderate or greater severity necessitating changes in medication dosing were “less common,” the investigators report. No participants experienced significant laboratory abnormalities.
One patient discontinued the trial early because he felt that the study medication was not helpful, and a second discontinued because of drowsiness and fatigue related to the study medication.
Twelve participants elected to continue treatment with THX-110 during an open extension phase and 7 of these completed the additional 24 weeks.
“THX-110 treatment led to an average improvement in tic symptoms of roughly 20%, or a 7-point decrease in the YGTSS total tic score. This improvement translates to a large effect size (d = 0.92) of improvement over time,” the investigators write.
More data needed
Commenting on the findings, Yolanda Holler-Managan, MD, assistant professor of pediatrics (neurology), Northwestern University, Chicago, cautioned that this was not a randomized, double-blind, parallel-group placebo-controlled study.
Instead, it was a clinical study to prove safety, tolerability, and dosing of the combination medication in adult patients with TS and “does not provide as much weight, since we do not have many studies on the efficacy of cannabinoids,” said Dr. Holler-Managan, who was not involved with the research.
She noted that the American Academy of Neurology’s 2019 practice guideline recommendations for treatment of tics in individuals with TS and tic disorders reported “limited evidence” that delta-9-THC is “possibly more likely than placebo to reduce tic severity in adults with TS, therefore we need more data.”
The current investigators agree. “Although these initial data are promising, future randomized double-blind placebo-controlled trials are necessary to demonstrate efficacy of TXH-110 treatment,” they write.
They add that the psychoactive properties of cannabis-derived compounds make it challenging to design a properly blinded trial.
“Incorporation of physiologic biomarkers and objective measures of symptoms (e.g., videotaped tic counts by blinded raters) may be particularly important when examining these medications with psychoactive properties that may be prone to reporting bias,” the authors write.
The study was supported by an investigator-initiated grant to Dr. Bloch from Therapix Biosciences. The state of Connecticut also provided resource support via the Abraham Ribicoff Research Facilities at the Connecticut Mental Health Center. Dr. Bloch serves on the scientific advisory boards of Therapix Biosciences, and he receives research support from Biohaven Pharmaceuticals, Janssen Pharmaceuticals, NARSAD, Neurocrine Biosciences, NIH, and the Patterson Foundation. The other investigators and Dr. Holler-Managan have disclosed no relevant financial relationships.
A version of this article first appeared on Medscape.com.
Health care workers eager for COVID booster shots
As COVID vaccine boosters move closer to reality, most physicians and nurses are ready and willing to get another shot in the arm, according to a new Medscape survey.
Altogether, 93% of physicians and 87% of nurses/advanced practice nurses (APNs) said they wanted to get a booster, although the timing of when they wanted the shots differed somewhat between the two groups surveyed Aug. 4-15.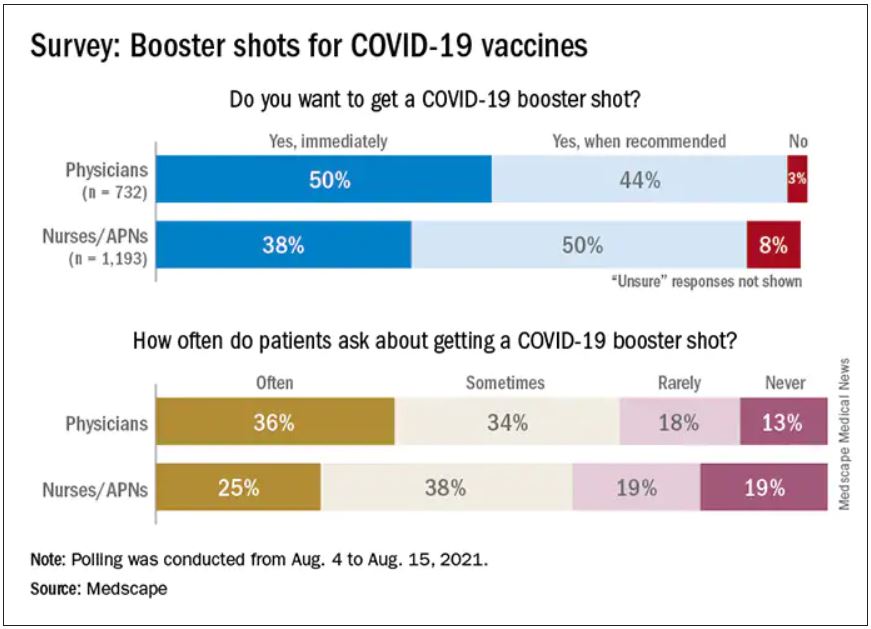
Among the 732 physicians polled, 50% wanted to get their shot immediately, compared with 38% of the 1,193 nurses/APNs who responded, while 44% of physicians and 50% of nurses/APNs said that they would wait until the vaccine booster was authorized and recommended.
At this point in time, almost all of the health care workers surveyed – 98% of physicians and 94% of nurses/APNs – have been fully vaccinated against COVID-19. A small proportion of each group, however, received the Johnson & Johnson vaccine (1% of physicians and 3% of nurses) and are not included in the current plan for booster shots.
The Medscape survey sample did include one group that is already eligible for a third dose: About 20% of physicians and 26% of nurses/ANPs said they have a condition or take a medication that compromises their immune system.
Respondents’ experiences with patient requests for boosters suggest a somewhat lower level of interest. About two-thirds of the health care workers (69% of physicians and 63% of nurses) said that patients frequently or sometimes asked about COVID boosters, compared with 13% (physicians) and 19% (nurses) who said their patients had never asked.
Interest lower among general population
In a separate survey conducted by WebMD, 82% of those who have been at least partially vaccinated said they want to get a COVID vaccine booster (14% immediately and 68% after authorization and recommendation). Of the remaining vaccinees, 7% said they do not want to get a booster and 11% were unsure.
The full sample of 592 respondents surveyed Aug. 5-10, however, included 19% who do not plan to get vaccinated and 6% who are planning to be vaccinated but have not yet done so.
The proportion of immunocompromised individuals in the two survey groups was similar, with about 25% of those in the WebMD survey reporting they have a condition or take a medication that compromises their immune system. Those respondents were more than twice as likely to want to get a booster immediately, compared to those with an uncompromised immune system (24% vs. 11%).
The distribution of vaccines received by brand was also comparable between the two groups surveyed. Of health care workers and readers, over half of each group received the Pfizer/BioNTech vaccine (59% vs. 54%), followed by Moderna (38% vs. 40%) and Johnson & Johnson (3% vs. 5%).
A version of this article first appeared on Medscape.com.
Guidance on additional COVID-19 vaccine dose for MS patients
Patients aged 12 years and older with multiple sclerosis (MS) who are fully immunized against COVID-19 with either the Pfizer-BioNTech or Moderna mRNA vaccine may be eligible to receive an additional dose now, the National Multiple Sclerosis Society has announced.
New guidance, which is “based on available data from studies and expert consensus opinion” by a panel of MS neurologists and experts, was published Aug. 19 on the organization’s website.
The Food and Drug Administration has authorized an additional dose of the coronavirus vaccine for patients who are expected to not have a normal or adequate immune response to the first two doses. Patients with MS who use certain treatments have a reduced or absent antibody response to the vaccine, according to recent data.
“We want people living with MS to be aware of this additional dose and discuss when they need an additional dose or booster dose with their health care provider,” Julie Fiol, RN, MSW, associate vice president of health care access, National MS Society, said in an interview.
Those who may benefit from an additional dose include patients with MS who use sphingosine 1-phosphate receptor modulators, anti-CD20 monoclonal antibodies, or alemtuzumab (Lemtrada), the National MS Society noted. These particular disease modifying therapies (DMTs) have a stronger effect on the immune system than do other treatments.
Protecting ‘the most vulnerable’
Sphingosine 1-phosphate receptor modulators include fingolimod (Gilenya), siponimod (Mayzent), ozanimod (Zeposia), and ponesimod (Ponvory).
Anti-CD20 monoclonal antibodies include ocrelizumab (Ocrevus), ofatumumab (Kesimpta), rituximab (Rituxan), and corresponding biosimilars.
Current data do not support an additional dose for immunocompromised patients who received the Johnson & Johnson vaccine. The FDA and the Centers for Disease Control and Prevention are developing recommendations for these patients, and the National MS Society will update its guidance as needed, the organization noted in its statement.
“Like other medical decisions, the decision to get an additional dose is best made in partnership with your health care provider,” said Ms. Fiol. “Talk to your MS health care provider to determine what is best for you.”
MS itself does not compromise the immune system, but some MS therapies alter the immune system and reduce the body’s response to vaccination. Patients with MS who use B cell-depleting therapies have a better antibody response when they receive the vaccine 3 months or more after the last dose of MS therapy, according to the National MS Society.
Data suggest that patients with MS are not more susceptible to COVID-19 infection, severe illness, or death than are patients without MS. However, certain groups of patients with MS, such as those who receive B cell-depleting treatments, are more susceptible to having a severe case of COVID-19.
That said, “everyone will need a booster at some point. Those who take DMTs that have greater impact on the immune system are the most urgent need now,” the organization noted.
“Vaccination against COVID-19 is critical for public safety and, especially, the safety of the most vulnerable among us,” said Ms. Fiol. “We encourage everyone with MS get vaccinated.”
A version of this article first appeared on Medscape.com.
Q&A: Get flu shot early this year? Same time as COVID vaccine?
With first-time COVID-19 immunizations continuing and the plan to offer booster vaccines to most Americans starting next month, what are the considerations for getting COVID-19 and flu shots at the same time?
This news organization asked Andrew T. Pavia, MD, for his advice. He is the George and Esther Gross Presidential Professor and chief of the division of pediatric infectious diseases at the University of Utah, Salt Lake City, and a fellow of the Infectious Diseases Society of America.
Q: With COVID-19 cases surging, is it a good idea to get the flu shot early this season?
Dr. Pavia: I don’t think there is a rush to do it in August, but it is a good idea to get a flu shot this season. The consequences of getting the flu while COVID is circulating are serious.
Q: What are the implications?
There are some we know and some we don’t know. If you develop flu-like symptoms, you’re going to have to get tested. You’re going to have to stay home quite a bit longer if you get a definitive (positive COVID-19) test than you would simply with flu symptoms. Also, you’re probably going to miss work when your workplace is very stressed or your children are stressed by having COVID circulating in schools.
The part we know less about are the implications of getting the flu and COVID together. There is some reason to believe if you get them together, the illness will be more severe. We are seeing that with RSV (respiratory syncytial virus) and parainfluenza and COVID coinfections in children. They appear to be quite severe.
But for flu, we just don’t have the data yet. That’s because there really was no cocirculation of COVID and influenza with the exception of parts of China for a brief part of February and March.
Q: Will the planned administration of booster COVID-19 shots this fall affect the number of people who get the flu vaccine or how it’s distributed?
It creates a lot of logistical challenges, particularly for hospitals and other places that need to vaccinate a large number of their employees for flu and that will need to give COVID boosters at about the same time period. It also creates logistical challenges for doctors’ offices.
But we don’t know of any reason why you can’t give the two shots together.
Q: Is it possible flu season will be more severe because we isolated and wore masks, etc., last winter? Any science behind that?
The more you study flu, the less you can predict, and I’ve been studying flu for a long time. There are reasons that might suggest a severe flu season – there has been limited immunity, and some people are not wearing masks effectively and they are gathering again. Those are things we believe protected us from influenza last season.
But we have not seen flu emerge yet. Normally we look to Australia, New Zealand, and South Africa during their winter – which is our summer – to get some idea of what is over the horizon for the Northern Hemisphere. Flu activity in Australia has been very modest this year.
That might mean flu may not show up for a while, but I would be loathe to make a prediction.
Q: What are the chances we’ll see a flu outbreak like we’re seeing with RSV, which is normally a winter illness?
The fact that we had a summer RSV surge just gives you an idea of how the normal epidemiology of viral infections has been disrupted. It means anything could happen with influenza. It could show up late summer or fall or wait until next spring.
We really don’t understand how those interactions work. When a new flu strain emerges, it often ignores the traditional behavior and shows up in the spring or fall. It happened in the 2009 pandemic, it happened in 1918.
The one thing I would safely predict about the next flu wave is that it will surprise us.
Q: Are you hopeful that combination vaccines in development from a number of companies, such as Moderna, Novavax, and Vivaldi, will be effective?
It is beginning to look like COVID will be with us for the foreseeable future – maybe as a seasonal virus or maybe as an ongoing pandemic. We are going to need to protect (ourselves) simultaneously against the flu and COVID. A single shot is a great way to do that – nobody wants two needles; nobody wants two trips to get vaccinated.
An effective combination vaccine would be a really great tool.
We have to wait to see what the science shows us, because they are quite different viruses. We won’t know if a combination vaccine works well and has acceptable side effects until we do those studies.
Q. Do you know at this point whether the side effects from two vaccines would be additive? Is there any way to predict that?
There is no way to predict. There are so many things that go into whether someone has side effects that we don’t understand. With fairly reactogenic vaccines like the mRNA vaccines, lots of people have no side effects whatsoever and others are really uncomfortable for 24 hours.
Flu is generally a better tolerated vaccine. There are still people who get muscle aches and very sore arms. I don’t think we can predict if getting two will be additive or just the same as getting one vaccine.
Q: Other than convenience and the benefit for people who are needle-phobic, are there any other advantages of combining them into one shot?
The logistics alone are enough to justify having one effective product if we can make one. It should reduce the overall cost of administration and reduce time off from work.
The combination vaccines given by pediatricians have been very successful. They reduce the number of needles for kids and make it much easier for parents and the pediatricians administering them. The same principle should apply to adults, who sometimes are less brave about needles than kids are.
Historically, combined vaccines in general have worked as well as vaccines given alone, but there have been exceptions. We just have to see what the products look like.
Q: For now, the flu vaccine and COVID-19 vaccine are single products. If you get them separately, is it better to put some time between the two?
We don’t know. There are studies that probably won’t be out in time to decide in September. They are looking at whether you get an equivalent immune response if you give them together or apart.
For now, I would say the advantage of getting them together is if you do get side effects, you’ll only get them once – one day to suffer through them. Also, it’s one trip to the doctor.
The potential advantage of separating them is that is how we developed and tested the vaccines. If you do react to them, side effects could be milder, but it will be on two separate days.
I would recommend doing whatever works so that you get both vaccines in a timely manner.
I’m going to get my flu shot as soon as it’s available. If I’m due for a COVID booster at that time, I would probably do them together.
Q: Do you foresee a point in the future when the predominant strain of SARS-CoV-2 will be one of the components of a flu vaccine, like we did in the past with H1N1, etc?
It really remains to be seen, but it is very conceivable it could happen. The same companies that developed COVID-19 vaccines are working on flu vaccines.
Q: Any other advice for people concerned about getting immunized against both COVID-19 and influenza in the coming months?
There is no side effect of the vaccine that begins to approach the risk you face from either disease. It’s really one of the best things you can do to protect yourself is to get vaccinated.
In the case of flu, the vaccine is only modestly effective, but it still saves tens of thousands of lives each year. The SARS-CoV-2 vaccine is a much better vaccine and a deadlier disease.
Dr. Pavia consulted for GlaxoSmithKline on influenza testing.
A version of this article first appeared on Medscape.com.
Plastic barriers may not stop COVID-19 spread, experts say
Plastic barriers that separate people in stores, restaurants, and classrooms may not be as effective at stopping the spread of COVID-19 as originally thought, according to The New York Times.
Scientists who study air flow, ventilation, and aerosol droplets say the barriers may not help, and in fact, could make the situation worse by blocking normal air flow, the newspaper reported.
Typically, as people interact and breathe in a room, currents and ventilation systems recirculate the air and disperse the exhaled particles. With plastic barriers, however, particles could get trapped in “dead zones” and build up.
“If you have a forest of barriers in a classroom, it’s going to interfere with proper ventilation of that room,” Linsey Marr, professor of civil and environmental engineering at Virginia Tech, told the newspaper.
“Everybody’s aerosols are going to be trapped and stuck there and building up, and they will end up spreading beyond your own desk,” she said.
Several variables factor into the efficacy of plastic barriers, The New York Times reported. Shields may stop big respiratory droplets from coughs and sneezes, for instance, but they may not do much to prevent small aerosol particles from viruses such as COVID-19 from spreading.
“We have shown this effect of blocking larger particles, but also that the smaller aerosols travel over the screen and become mixed in the room air within about 5 minutes,” Catherine Noakes, professor of environment engineering at the University of Leeds, told the newspaper.
“This means if people are interacting for more than a few minutes, they would likely be exposed to the virus regardless of the screen,” she said.
The effectiveness of plastic barriers likely also depends on the location and setup, the newspaper reported. A bus driver with a large barrier, for instance, may be able to avoid inhaling the particles that passengers are exhaling. A bank cashier or store clerk behind a large barrier may also be partly protected.
Even still, scientists say more research is needed. For instance, taller barriers are more likely to be effective. However, a large number of barriers in one room could likely block air flow.
Researchers have recommended that schools and offices focus on ventilation, masks, and vaccines to slow the spread of the coronavirus.
“Air flow in rooms is pretty complicated,” Richard Corsi, dean of engineering at the University of California at Davis, told the newspaper.
“Every room is different in terms of the arrangement of furniture, the height of the walls and ceilings, the vents, where the bookshelves are,” he said. “All of these things have a huge impact on the actual flow and air distribution in a room.”
A version of this article first appeared on WebMD.com.