User login
The Journal of Clinical Outcomes Management® is an independent, peer-reviewed journal offering evidence-based, practical information for improving the quality, safety, and value of health care.
div[contains(@class, 'header__large-screen')]
div[contains(@class, 'read-next-article')]
div[contains(@class, 'nav-primary')]
nav[contains(@class, 'nav-primary')]
section[contains(@class, 'footer-nav-section-wrapper')]
footer[@id='footer']
div[contains(@class, 'main-prefix')]
section[contains(@class, 'nav-hidden')]
div[contains(@class, 'ce-card-content')]
nav[contains(@class, 'nav-ce-stack')]
How old is too old to work as a doctor?
Air traffic controllers face mandatory retirement at age 56, with exceptions up to 61. Commercial airline pilots must bow out at 65; same for foreign service employees. Physicians, however, have no age limit, regardless of specialty.
As the profession rapidly ages – some 30% of the physician workforce is currently a senior, according to the American Medical Association – the topic of whether or not there should be a standard measure or age for retirement is front and center. The AMA’s Council on Medical Education formed a workgroup to look into the issue in 2015 and 2018, and in 2021, delegates adopted a set of guidelines for screening and assessing physicians, but stopped short of a mandate.
Mark Katlic, MD, chair of surgery at Lifebridge Health System, Baltimore, has devoted a decade to studying this topic. “I’m a bit of an outlier looking into this,” he says. “The public is unaware and seemingly unconcerned about the issue. Even among the medical profession, there’s been a series of fits and starts to develop a cohesive approach.”
One of the reasons guidelines – mandatory or otherwise – have been tough to come by is that aging brings with it a huge degree of variability. “If you look at a group of 80-year-olds, there will be much more variability than within a group of 40-year-olds,” Dr. Katlic pointed out.
Indeed, some 80-year-olds can easily continue to teach college courses, keep up in 10K running races, or perform delicate surgeries. Yet others in their peer group might struggle to properly button a shirt, walk a flight of stairs, or remember yesterday’s meals. Functional age is not the same as chronological age.
Frank Stockdale, MD, PhD, an 86-year-old practicing oncologist at Stanford (Calif.) University Health, counts himself in the camp opposed to age-based assessments. “It’s age discrimination,” he says. “Physicians receive assessments throughout their careers as part of the accreditation process – there’s no need to change that as doctors reach a certain age.”
Dr. Stockdale suggests that in many cases, malpractice suits are filed against mid-career doctors, not those of advanced age. “If you’re using the argument that there is an accumulation of deficits with age, the fact is that those deficits begin well before your 70s,” he said. “It’s better to have a uniform screening policy and begin at a much younger age.”
At Stanford, in fact, there was a former assessment policy that included cognitive testing, but physicians were successful in seeing that portion of testing eliminated. “It is a physical examination, by a physician of choice, certifying that for the privileges requested there is no physical or mental reason the candidate cannot safely perform them,” Dr. Stockdale explained.
In some cases, medical staffs have filed lawsuits to fight age-related testing. In New Haven, Conn., for instance, the U.S. Equal Employment Opportunity Commission (EEOC) filed a suit in 2020 on behalf of the Yale New Haven Hospital staff, alleging a discriminatory “late career practitioner policy.”
A similar case in Minnesota reached a settlement in 2021, providing monetary relief to staff impacted by out-of-pocket costs for the assessment, in addition to requiring that the hospital in question report to the EEOC any complaints related to age discrimination.
James Ellison, MD, MPH, chair in Memory Care and Geriatrics with ChristianaCare in Wilmington, Del., points out that aging can bring benefits for practicing physicians. “Age is very individualized and there are good and bad consequences,” he said. “Experience can build knowledge and confidence and expertise, and it does improve diagnostic accuracy.”
On the flip side, however, age-related brain changes include loss of volume and lower levels of some neurotransmitters, resulting in cognitive changes. “Functional changes occur too,” Dr. Ellison said.
“Just as some aging athletes may lose a degree of speed, strength, and flexibility, and some aging scientists may lose a part of their former cognitive speed, flexibility, and mental strength, aging health care providers can lose some of the physical coordination, strength, and visual acuity necessary to perform demanding surgical operations. They can also lose some of the processing speed, working memory, and executive function that allows them to excel in cognitive professional tasks.”
An estimated 5.8 million Americans age 65 and older have Alzheimer’s dementia, according to the Alzheimer’s Association.
Picking an arbitrary age for mandatory retirement isn’t the right approach for physicians, said Dr. Katlic. Rather, he said, the answer is to establish late-practitioner screening programs. “Very few hospitals have them, however,” he pointed out. “We do [at Lifebridge Health], and so do a few dozen others, but that’s out of hundreds.”
Instead, what typically plays out is that hospital staff might begin to notice a decline in a colleague. Things like a disheveled appearance or lack of hygiene, or trouble with memory, such as getting lost en route back to his or her office. Even dangerous behaviors such as nodding off during a procedure are not unheard of.
There are many examples of physician decline that fly under the radar. “Unfortunately, it’s unusual for cognitively impaired health care providers to recognize and report their own difficulties,” said Dr. Ellison. “Although peers are expected to report cognitively impaired colleagues, they often fail to do so. In some other countries, age-based assessment is an accepted policy. In the U.S., this is not a uniform policy.”
Sometimes physicians can remain on the job in spite of decline thanks to certain “props,” according to Dr. Ellison. “Good procedures, efficient supports, and various workarounds compensate,” he said, “but often are not sufficient to maintain high-quality practice.”
Most often, these situations play out slowly, until the problem becomes glaringly obvious and potentially dangerous, and someone in a position of power must step in.
“Often, it’s hearsay from a nurse or another staff member, and then a hospital president or chief of staff must make a career-affecting decision for the doctor in question,” said Dr. Katlic.
Because there is little self- or colleague policing – and barring official or binding guidelines on the aging physician issue – both Dr. Katlic and Dr. Ellison are proponents of late-career screening.
How screening can help
As it stands, Dr. Katlic maintains that the profession isn’t doing enough to ensure public safety. “We have peer review and recertification processes, but when you get down to it, we don’t police ourselves well,” he said. “All physicians are assessed throughout their careers as part of the hospital accreditation process, which is fair and adequate.”
Dr. Katlic said that there are three main benchmarks that physicians should be able to meet at an agreed upon age: a physical exam, a neurocognitive screening, and an eye exam. “At some reasonable age, I personally believe these exams should take place,” he said. “We can allow doctors to pick their own practitioners for the eye and physical exams, but the neurocognitive exam should be completed by a PhD neuropsychologist.”
At Lifebridge, for instance, these screenings begin at age 75 and take place every 2 years, during the recredentialing process. It applies to all specialties, not just surgeons. “Surgery is a little different in that it requires fine motor skills in addition to the others we test, but you want any physician to be cognitively intact,” Dr. Katlic pointed out. “All doctors need the ability to make decisions quickly, often under noisy, distracting conditions.”
Dr. Ellison supports applying the screenings to all specialties. “Let’s not forget that all physicians must be alert to the many ways in which their patients reveal what needs attention, evaluation, and treatment,” he said. “Some health care tasks could be performed without visual input; for example, perhaps psychotherapy could be provided competently by a clinician who lacks visual acuity. Auditory input might not be necessary for reading x-rays – but the information a health care provider gets from their eyes and ears is important, not just for surgeons.”
University of California San Diego has established what it calls its Physician Assessment and Clinical Education (PACE) program. One of the nation’s oldest and largest such programs, the hospital founded PACE in 1996. Most physicians taking part arrive as a requirement of disciplinary action from the state medical board, but a small percentage self-refers.
PACE involves two phases. The first is a 2-day set of tests and measures core competency knowledge. Phase 2 is more comprehensive and lasts 5 days. Here, within their specialty, physicians participate in the activities of the corresponding residency program. Faculty evaluates the physician, and a multidisciplinary team meets to review all the findings of the combined phases.
Depending on the results, doctors may face remediation steps that range from programs to address performance deficiencies to residency-level clinical experiences. According to a paper on the program published by the institution, “most physicians referred to the PACE program are found to have mild to moderate performance dyscompetence.”
In the case of the 2021 guidelines adopted by AMA delegates, there are nine principles for assessment. They should be evidence-based, ethical, relevant, accountable, fair and equitable, transparent, supportive, and nonburdensome, and should afford physicians due process protections.
Looking ahead
Even Dr. Katlic worries about the possibility of Congress intervening to establish federal-level, mandatory retirement age. “This just doesn’t make sense for our profession given the great variability we see,” he said. “My biggest hope is that more individual hospitals will institute these screenings.”
As the physician population ages – and the influx of new doctors shrinks – the slope becomes even more slippery. The AMA is predicting a physician shortage of nearly 40,000 by the year 2034. This strengthens arguments to keep existing physicians practicing for as long as possible and might make institutions less likely to screen.
It’s all a delicate balancing act and a continuing work in progress, said Dr. Ellison. “Ultimately, I believe we need to find a way to understand and address the possible implications for public safety, while at the same time protecting the privacy and dignity of our valued older physicians and other health care providers.”
A version of this article first appeared on Medscape.com.
Will you have cardiac arrest? New tech may predict if and when
Deaths from COVID-19 may have caught more attention lately, but heart disease remains the leading cause of death in the United States.
More than 300,000 Americans will die this year of sudden cardiac arrest (also called sudden cardiac death, or SCD), when the heart abruptly stops working.
These events happen suddenly and often without warning, making them nearly impossible to predict. But that may be changing, thanks to 3D imaging and artificial intelligence (AI) technology under study at Johns Hopkins University, Baltimore.
There, researchers are working to create more accurate and personalized models of the heart – and not just any heart, your heart, if you have heart disease.
“Right now, a clinician can only say whether a patient is at risk or not at risk for sudden death,” says Dan Popescu, PhD, a Johns Hopkins research scientist and first author of a new study on AI’s ability to predict sudden cardiac arrest. “With this new technology, you can have much more nuanced predictions of probability of an event over time.”
Put another way: With AI, clinicians may be able not only to predict if someone is at risk for sudden cardiac arrest, but also when it is most likely to happen. They can do this using a much clearer and more personalized look at the electrical “wiring” of your heart.
Your heart, the conductor
Your heart isn’t just a metronome responsible for keeping a steady stream of blood pumping to tissues with every beat. It’s also a conductor through which vital energy flows.
To make the heart beat, electrical impulses flow from the top to the bottom of the organ. Healthy heart cells relay this electricity seamlessly. But in a heart damaged by inflammation or a past heart attack, scar tissue will block the energy flow.
When an electrical impulse encounters a scarred area, the signal can become erratic, disrupting the set top-to-bottom path and causing irregular heartbeats (arrhythmias), which increase someone’s danger of sudden cardiac death.
Seeing the heart in 3D
Today’s tests offer some insights into the heart’s makeup. For example, MRI scans can reveal damaged areas. PET scans can show inflammation. And EKGs can record the heart’s electrical signals from beat to beat.
But all these technologies offer only a snapshot, showing heart health at a moment in time. They can’t predict the future. That’s why scientists at Johns Hopkins are going further to develop 3D digital replicas of a person’s heart, known as computational heart models.
Computational models are computer-simulated replicas that combine mathematics, physics, and computer science. These models have been around for a long time and are used in many fields, ranging from manufacturing to economics.
In heart medicine, these models are populated with digital “cells,” which imitate living cells and can be programmed with different electrical properties, depending on whether they are healthy or diseased.
“Currently available imaging and testing (MRIs, PETs, EKGs) give some representation of the scarring, but you cannot translate that to what is going to happen over time,” says Natalia Trayanova, PhD, of the Johns Hopkins department of biomedical engineering.
“With computational heart models, we create a dynamic digital image of the heart. We can then give the digital image an electrical stimulus and assess how the heart is able to respond. Then you can better predict what is going to happen.”
The computerized 3D models also mean better, more accurate treatment for heart conditions.
For example, a common treatment for a type of arrhythmia known as atrial fibrillation is ablation, or burning some heart tissue. Ablation stops the erratic electrical impulses causing the arrhythmia, but it can also damage otherwise healthy heart cells.
A personalized computational heart model could allow doctors to see more accurately what areas should and shouldn’t be treated for a specific patient.
Using deep learning AI to predict health outcomes
Dr. Trayanova’s colleague Dr. Popescu is applying deep learning and AI to do more with computerized heart models to predict the future.
In a recent paper in Nature Cardiovascular Research, the research team showed their algorithm assessed the health of 269 patients and was able to predict the chance of sudden cardiac arrest up to 10 years in advance.
“This is really the first time ever, as far as we know, where deep learning technology has been proven to analyze scarring of the heart in a successful way,” Dr. Popescu says.
Dr. Popescu and Dr. Trayanova say the AI algorithm gathers information from the 3D computational heart models with patient data like MRIs, ethnicity, age, lifestyle, and other clinical information. Analyzing all these data can produce accurate and consistent estimates about how long patients might live if they are at risk for sudden death.
“You can’t afford to be wrong. If you are wrong, you can actually impact a patient’s quality of life dramatically,” Dr. Popescu says. “Having clinicians use this technology in the decision-making process will provide confidence in a better diagnosis and prognosis.”
While the current study was specifically about patients with a particular type of heart disease, Dr. Popescu says his algorithm can also be trained to assess other health conditions.
So when might you see this being used outside of a research study? Dr. Trayanova predicts 3D imaging of heart models could be available in 2 years, but first the technique must be tested in more clinical trials – some of which are happening right now.
Adding AI to the heart models will require more studies and Food and Drug Administration approval, so the timeline is less clear. But perhaps the biggest hurdle is that after approval the technologies would need to be adopted and used by clinicians and caregivers.
“The much harder question to answer is, ‘When will doctors be perfectly comfortable with AI tools?’ And I don’t know the answer,” Dr. Popescu says. “How to use AI as an aid in the decision-making process is something that’s not currently taught.”
A version of this article first appeared on WebMD.com.
More evidence links asthma severity to age of onset
A recently published multinational cohort study may be the largest to date that’s found the age of asthma onset is an integral factor in defining the severity of disease and the frequency of comorbidities.
“It’s very simple to ask your patient: ‘Did you have asthma as a child? When did your asthma start?’ ” coauthor Guy Brusselle, MD, a professor at the University of Ghent (Belgium), said in an interview. “You do not need expensive investigations, CT scans or proteomics or genomics; just two simple questions.”
The retrospective cohort study, published in the Journal of Allergy and Clinical Immunology: In Practice, combined national electronic health records databases from five different countries – the United Kingdom, Spain, Italy, the Netherlands, and Denmark – that included 586,436 adult asthma patients. The study divided the patients into three subtypes: childhood-onset asthma, meaning a diagnosis before age 18 (n = 81,691); adult-onset disease, defined as a diagnosis between ages 18 and 40 (n = 218,184); and late onset, defined as a diagnosis made after age 40 (n = 286,561).
Dr. Brusselle said the study found stark differences in characteristics between the three subtypes, including an increasing risk for women with later age of onset. Across the five databases, females comprised approximately 45% of those with childhood-onset asthma, but about 60% of those with later-onset disease, Dr. Brusselle said.
As for characteristics of asthma, 7.2% of the cohort (n = 42,611) had severe asthma, but the proportion was highest in late-onset asthma, 10% versus 5% in adult onset and 3% in childhood onset. The percentage of uncontrolled asthma followed a similar trend: 8%, 6%, and 0.4% in the respective treatment groups.
The most common comorbidities were atopic disorders (31%) and overweight/obesity (50%). The prevalence of atopic disorders was highest in the childhood-onset group, 45% versus 35%, and 25% in the adult-onset and late-onset patients. However, the trend for overweight/obesity was reversed: 30%, 43%, and 61%, respectively.
“The larger differences were when late-onset asthma was compared to adult-onset asthma with respect to comorbidities,” Dr. Brusselle said. “The late-onset asthma patients more frequently had nasal polyposis.” These patients typically lose their sense of smell, as in COVID-19. However, in nasal polyposis the loss is chronic rather than transient.
Pulmonologists should be attuned to the prevalence of overweight/obesity in the late-onset group, Dr. Brusselle said. “We know that obesity is an important risk factor for diabetes, and then obesity is also associated with gastroesophageal reflux – and we know that gastroesophageal reflux is a risk factor for asthma exacerbations.”
Smaller studies have arrived at the same conclusions regarding the relationships between asthma severity and age of onset, Dr. Brusselle said. What’s notable about this study is its size and the consistency of findings across different national databases.
“In childhood onset you need to watch for different allergies – atopic dermatitis and allergic rhinitis – but in late-onset asthma look for obesity, diabetes and reflux disease, and nasal polyposis,” he said.
Sally E. Wenzel, MD, professor at the University of Pittsburgh and director of the Asthma and Environmental Lung Health Institute at the University of Pittsburgh Medical Center, concurred that the size of this study makes it noteworthy.
“It’s certainly far and away the largest study of its kind that’s ever been done, and it’s multinational,” she said in an interview. “Just doing a study like this with thousands and thousands of patients is a step in the right direction. That’s probably what’s very unique about it, to bring all of these clinical cohorts as it were together and to look at what is the relationship of the age of onset.”
She also said the study is unique in how it delineates the groups by age of onset.
“In addition to this concept that there’s a difference in asthma by the age that you got diagnosed with it, I think it’s also important to just remember that when any physician, be they a specialist or nonspecialist, sees a patient with asthma, they should ask them when did their symptoms develop,” she said. “These are really simple questions that don’t take any sophisticated training and don’t take any sophisticated instruments to measure, but they can be really helpful.”
GlaxoSmithKline supplied a grant for the study. Dr. Brusselle disclosed relationships with AstraZeneca, Boehringer Ingelheim, Chiesi, GSK, Novartis, Sanofi, and Teva. A study coauthor is an employee of GSK. Dr. Wenzel reported no disclosures.
A version of this article first appeared on Medscape.com.
FROM THE JOURNAL OF ALLERGY AND CLINICAL IMMUNOLOGY: IN PRACTICE
Almost 60% of U.S. population has been infected by COVID-19: CDC
The percentage of Americans who have been infected with COVID-19 jumped from 34% in December 2021 to 58% in February 2022, a new study from the Centers for Disease Control and Prevention reveals.
This is the first time the seroprevalence of prior infection is more than 50% in the American population.
“I definitely expected that we were going to see an increase continue ... but I didn’t expect it to increase quite this much. But we follow the data ... and this is what the evidence is showing us,” lead study researcher Kristie E. N. Clarke, MD, said during a CDC media briefing April 26.
Researchers found that presence of antinucleocapsid (anti-N) antibodies from prior infection varied by age. The rate varied from as high as 75% in children and teenagers 17 years and younger to 33% in those 65 and older, for example.
The study showed that the anti-N antibodies were more common in age groups with the lowest vaccination numbers.
Combined with up-to-date CDC data on deaths, hospitalizations, and cases, the study provides a clearer picture of where we are now and where we might be headed in terms of the pandemic.
Vaccination still valuable
The fact that nearly 60% of Americans have antibodies from prior infection is not a reason to think people with a history of COVID-19 should skip vaccination, said CDC director Rochelle P. Walensky, MD.
“I can’t underscore enough that those with detectable antibodies from previous infection, we encourage them to still get vaccinated,” Dr. Walensky said.
“We do know that reinfections happen,” she said, “so that’s important in terms of thinking forward.”
The CDC continues to encourage all Americans to stay up to date with their COVID-19 vaccinations, said Dr. Clarke, colead for the CDC’s COVID-19 Epidemiology and Surveillance Taskforce Seroprevalence Team. “Having infection-induced antibodies does not necessarily mean you are protected against future infections.”
The study, published in the CDC’s Morbidity and Mortality Weekly Report (MMWR), did not evaluate antibody protection from COVID-19 vaccination.
It should also be noted that the study looked at presence or absence of anti-N antibodies, and not whether certain levels were linked to less or more protection.
Where are we now?
Dr. Walensky used the media briefing as an opportunity to share current COVID-19 numbers.
“Overall, we can continue to have some mixed trends. Deaths, fortunately, are continuing to trend downward with a 7-day average of about 300 per day, which represents an estimated 18% decline from the prior week,” she said.
Hospital admissions also remain low, at about 1,500 per day. “But we should note that for the second week in a row, they are slowly trending upwards,” Dr. Walensky said. There was an increase of about 9% at press time compared with the prior week.
Cases remain “comparatively low” to even where we were a month ago, at 44,000 per day,” Dr. Walensky said. “Although this too represents an increase of about 25% in the past week.”
Dr. Walensky noted that positive test numbers are not as reliable a metric as they were before the growth in use of rapid home tests. But it’s not the only measure. “We continue to believe that our PCR testing data, especially when we corroborate it with information from our other surveillance systems – like wastewater surveillance and emergency department surveillance – provide us a reliable picture of the trajectory of COVID-19 across our country.”
She recommended that people continue to consult the CDC’s COVID-19 county tracker to monitor local levels of COVID-19.
Dr. Walensky also shared recent findings from genomic sequencing that continue to show the predominance of the Omicron variant. “Essentially a hundred percent of what we’re finding now is Omicron,” she said. In terms of individual variants, the Omicron BA.1 variant is about 3% of circulating virus, the BA.2 variant is about 68%, and BA.2.12.1 makes up about 35%.
“We’re just starting to learn about the impact of BA2.121,” Dr. Walensky said. “It appears it might have a transmission advantage of about 25% over the BA2 subvariant.”
A version of this article first appeared on Medscape.com.
FROM MMWR
Pfizer recalls more quinapril because of potential carcinogen
, the company announced.
The Accupril recall comes one month after Pfizer recalled six lots of Accuretic (Quinapril HCI/hydrochlorathiazide) tablets for the same problem.
Accupril is indicated for the treatment of hypertension and management of heart failure when added to conventional therapy, including diuretics and/or digitalis.
To date, Pfizer is not aware of any reports of adverse events related to the Accupril recall, and the company believes the benefit/risk profile remains positive based on currently available data.
“Although long-term ingestion of N-nitroso-quinapril may be associated with a potential increased cancer risk in humans, there is no immediate risk to patients taking this medication,” the company said April 22 in a news release.
Patients currently taking the recalled products are asked to consult with their doctor about alternative treatment options.
The recalled Accupril tablets were sold in 90-count bottles distributed nationwide to wholesalers and distributors in the United States and Puerto Rico from December 2019 to April 2022.
National drug codes (NDC), lot numbers, and expiration dates are listed in the company announcement posted on the Food and Drug Administration’s website.
Patients who are taking this product should consult with their health care provider or pharmacy to determine if they have the affected product. Those with the affected tablets should contact claims management firm Sedgwick by phone at 888-345-0481 Monday through Friday from 8 AM to 5 PM ET for instructions on how to return the product and obtain reimbursement.
Healthcare providers with questions regarding the recall can contact Pfizer by telephone at 800-438-1985, option 3, Monday through Friday from 8 AM to 9 PM ET.
Adverse reactions or quality problems related to this recall should be reported to the FDA’s MedWatch program.
A version of this article first appeared on Medscape.com.
Lowering BP according to newest guidance would cut CV events
Using the 2021 Kidney Disease: Improving Global Outcomes (KDIGO) guideline target of systolic blood pressure (BP) < 120 mm Hg, 66% of adults with chronic kidney disease (CKD) would be eligible for BP lowering, according to a study from Korea.
This represents an added > 10% of patients compared with two earlier guidelines, and these patients have a high risk of cardiovascular disease (CVD), Hyeok-Hee Lee, MD, Yonsei University College of Medicine, Seoul, South Korea, and colleagues reported.
The study was published online in the Journal of the American College of Cardiology.
“New candidates for BP-lowering treatment per the 2021 KDIGO guideline account for a substantial proportion of the total CKD population and bear significantly high CVD risk,” the researchers concluded.
“Undoubtedly, a multipronged approach will be required to address the swelling number of people needing more intense treatment, especially against a background of falling rates of BP control in the general community,” Alexander G. Logan, MD, of Mount Sinai Hospital, Toronto, and the University of Toronto, wrote in an accompanying editorial.
“Let’s not forget hypertension is the number one killer today,” Valentin Fuster, MD, of Icahn School of Medicine at Mount Sinai, New York, who is editor-in-chief of the Journal of the American College of Cardiology, stressed in a podcast that accompanied the article.
“Only 50% of individuals know of their blood pressure, and from this, less than half are properly treated,” he said.
“Today the details of knowing blood pressure levels appear to dominate over the huge ignorance of not knowing about blood pressure at all. Let’s think more and more about this reality,” he urged.
Three guidelines, two study objectives
The researchers compared three guidelines:
- The 2021 KDIGO guidelines, with a target systolic BP of < 120 mm Hg (largely based on the SPRINT trial).
- The 2012 KDIGO guidelines, with a target BP of ≤ 130/80 mm Hg for patients with albuminuria and ≤ 140/90 mm Hg for patients without albuminuria.
- The 2017 American College of Cardiology/American Heart Association (ACC/AHA) BP guideline target of < 130/80 mm Hg.
The study had two objectives:
- To examine the proportions of concordance and discordance between the three guidelines among adults with CKD based on cross-sectional data from the Korea National Health and Nutrition Examination Survey (KNHANES).
- To evaluate the association of each concordance/discordance group with cardiovascular outcomes of patients in the Korean National Health Insurance Service (NHIS) database.
For the first objective, the researchers identified 1,939 adults with CKD from the 2011-2014 survey cycles of KNHANES. Patients were a median age of 59 and 51% were men.
Comparison of the KDIGO 2021 versus 2012 BP targets showed that 50% of patients had BP above both targets; 16% had BP above the KDIGO 2021 target only; 4% had BP above the KDIGO 2012 target only; and 30% had BP control within both targets.
Comparison of the KDIGO 2021 versus 2017 ACC/AHA BP targets showed that 55% of patients had BP above both targets; 11% had BP above the KDIGO 2021 target only; 5% had BP above the 2017 ACC/AHA target only; and 29% had BP control within both targets.
For the second objective, using the NHIS database, researchers identified 412,167 adults with CKD who had routine health examinations during 2009 and 2010. The patients were a median age of 65 and 44% were men.
During a median follow-up of 10 years, the patients had 37,912 incident CVD events, defined as the first hospitalization for myocardial infarction, stroke, or heart failure, or death from CVD.
The adjusted risk of a composite CVD event was higher in patients with BP above the 2021 KDIGO target only (HR, 1.28) or above both the 2012 and 2021 KDIGO targets (HR, 1.52), compared to patients who had BP within both targets.
The adjusted risk of a composite CVD event was also higher in patients with BP above the 2021 KDIGO target only (HR, 1.18) or above both the 2021 KDIGO target and the 2017 ACC/AHA target (HR, 1.41), compared with patients who had BP within both targets.
Editorialist highlights three study aspects
Dr. Fuster noted three main points made by Dr. Logan.
First, the KDIGO 2021 guideline is based on office blood pressure, measured according to the procedure used in the 2017 ACC/AHA guideline. However, the SPRINT ambulatory BP ancillary study found that daytime ambulatory systolic BP was 6.8 mm Hg higher in the < 120 mm Hg group than clinic systolic BP that was measured with an automated BP device, mostly without study personnel.
Second, Dr. Logan noted that “not surprisingly, the investigators showed that the weighted proportion of adults with CKD eligible for BP lowering was highest (66.1%) according to 2021 KDIGO guideline,” compared with the two earlier guidelines.
The findings by Dr. Lee and colleagues align with those of a study that used data from the 2015-2018 U.S. NHANES to estimate the proportion of U.S. adults with CKD eligible for BP lowering according to the 2021 KDIGO guidelines, Dr. Logan added. The study found that 69% of U.S. adults (roughly 24.5 million) should correct their BP.
Third, the study in Korea showed a small percentage of patients (3%-5% of the total) had elevated diastolic BP but controlled systolic BP (< 120 mm Hg) with no increased risk of CVD compared to a reference group of patients with well-controlled BP.
“There is a paucity of evidence examining the relationship between diastolic hypertension and outcomes independently from systolic BP level in CKD patients,” Dr. Logan wrote. Similarly, Dr. Lee and colleagues identified this as an area for further research.
This work was supported by the Korea Health Technology R&D Project through the Korea Health Industry Development Institute funded by the Ministry of Health and Welfare, Republic of Korea. The authors and editorialist have reported no relevant financial relationships.
A version of this article first appeared on Medscape.com.
FROM THE JOURNAL OF THE AMERICAN COLLEGE OF CARDIOLOGY
How do we distinguish between viral and bacterial meningitis?
Bacteria and viruses are the leading causes of community-acquired meningitis. Bacterial meningitis is associated with high morbidity and mortality, and prompt treatment with appropriate antibiotics is essential to optimize outcomes. Early diagnosis is therefore crucial for selecting patients who need antibiotics. On the other hand, the course of viral meningitis is generally benign, and there is usually no specific antimicrobial treatment required. Distinguishing between viral and bacterial causes of meningitis can be challenging; therefore, many patients receive empiric antibiotic treatment.
Etiology
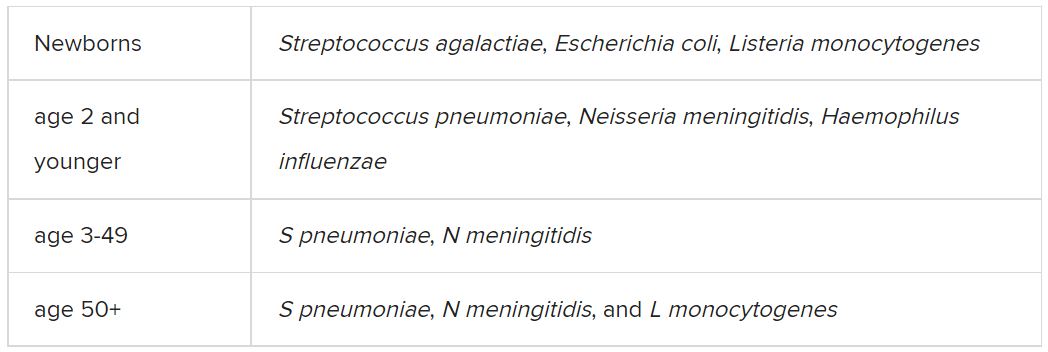
Among the etiologic agents of viral meningitis, the nonpolio enteroviruses (Echovirus 30, 11, 9, 6, 7, 18, 16, 71, 25; Coxsackie B2, A9, B1, B3, B4) are the most common, responsible for more than 85% of cases. Other viruses potentially responsible for meningitis include the herpes simplex virus (HSV), primarily type 2, and flavivirus (such as the Dengue virus).
Clinical presentation
The clinical presentation of bacterial meningitis is more severe than that of viral meningitis. The classic clinical triad of bacterial meningitis consists of fever, neck stiffness, and altered mental status. Only 41% of cases present with these three symptoms, however. Other clinical characteristics include severe headaches, decreased level of consciousness, nausea, vomiting, seizures, focal neurologic signs, and skin rash.
Viral meningitis is usually not associated with a decreased level of consciousness or significant decline in overall health status. The most frequently reported symptoms are unusual headaches, fever, nausea, vomiting, sensitivity to light, and neck stiffness. Patients may also present with skin changes and lymphadenopathy, and, depending on etiology, genital ulcers.
Diagnosis
The diagnosis of bacterial meningitis is based on clinical symptoms, blood panels (blood count, inflammation markers, cultures), and cerebrospinal fluid (CSF) cultures. Gram staining and latex agglutination may lead to false-negative results, and cultures may take a few days to provide a definitive result. Therefore, empiric antibiotic treatment is often started until the etiology can be determined.
A spinal tap must always be performed, preferably after a scan is taken, to rule out the risk of herniation. After CSF samples have been collected, they must undergo complete analysis, including cytological, biochemical, and microbiological evaluation, using conventional and molecular testing methods, when available.
Cytological and biochemical analyses of CSF may be helpful, as findings may indicate a higher probability of either bacterial or viral etiology.
CSF samples collected from patients with acute bacterial meningitis present characteristic neutrophilic pleocytosis (cell count usually ranging from hundreds to a few thousand, with >80% polymorphonuclear cells). In some cases of L. monocytogenes meningitis (from 25% to 30%), a lymphocytic predominance may occur. Normally, glucose is low (CSF glucose-to-blood-glucose ratio of ≤0.4 or <40 mg/dL), protein is very high (>200 mg/dL), and the CSF lactate level is high (≥31.53 mg/dL).
In viral meningitis, the white blood cell count is generally 10-300 cells/mm3. Although glucose levels are normal in most cases, they may be below normal limits in lymphocytic choriomeningitis virus (LCMV), HSV, mumps virus, and poliovirus meningitis. Protein levels tend to be slightly elevated, but they may still be within the reference range.
A recent study investigated which of the cytological or biochemical markers best correlate with the definite etiologic diagnosis. This study, in which CSF samples were collected and analyzed from 2013 to 2017, considered cases of bacterial or viral meningitis confirmed via microbiological evaluation or polymerase chain reaction (PCR). CSF lactate was the best single CSF parameter, and CSF lactate above 30 mg/dL virtually excludes the possibility of a viral etiology.
Etiologic determination
Despite the major contribution of globally analyzing CSF and secondary parameters, particularly CSF lactate, the precise etiologic definition is of great importance in cases of acute meningitis. Such precise definition is not simple, as identification of the causative microorganism is often difficult. Moreover, there are limits to conventional microbiological methods. Bacterioscopy is poorly sensitive, and although bacterial cultures are more sensitive, they can delay diagnosis because of the time it takes for the bacteria to grow in culture media.
Targeted molecular detection methods are usually more sensitive than conventional microbiological methods. Panel-based molecular tests identify multiple pathogens in a single test. In 2015, the U.S. Food and Drug Administration authorized the first commercial multiplex detection system for infectious causes of community-acquired meningitis and encephalitis. This test, the BioFire FilmArray system, detects 14 bacterial, viral, and fungal pathogens in a turnaround time of about 1 hour, including S. pneumoniae, N. meningitidis, H. influenzae, S. agalactiae (i.e., group B Streptococcus), E. coli (serotype K1), L. monocytogenes, HSV-1, HSV-2, varicella-zoster virus (VZV), cytomegalovirus (CMV), human herpesvirus 6 (HHV-6), human parechovirus (HPeV), and Cryptococcus neoformans/gattii.
A meta-analysis of eight precise diagnostic studies evaluating the BioFire FilmArray system showed a high sensitivity of 90% (95% confidence interval, 86%-93%) and specificity of 97% (95% CI, 94%-99%). The FilmArray ME panel can halve the time to microbiological result, allowing for earlier discontinuation of antimicrobial agents and hospital discharge in cases of viral meningitis.
Conclusion
Acute community-acquired meningitis is usually the result of viral or bacterial infections. Given the low specificity of clinical symptoms and, very often, of the general laboratory panel findings, many patients are empirically treated with antibiotics. High-sensitivity and -specificity molecular techniques allow for rapid identification of the bacterial etiology (which requires antibiotic therapy) or the viral etiology of meningitis. The latter can be managed only with symptom-specific medications and does not usually require extended hospitalization. Therefore, these new techniques can improve the quality of care for these patients with viral meningitis.
A version of this article first appeared on Medscape.com.
Bacteria and viruses are the leading causes of community-acquired meningitis. Bacterial meningitis is associated with high morbidity and mortality, and prompt treatment with appropriate antibiotics is essential to optimize outcomes. Early diagnosis is therefore crucial for selecting patients who need antibiotics. On the other hand, the course of viral meningitis is generally benign, and there is usually no specific antimicrobial treatment required. Distinguishing between viral and bacterial causes of meningitis can be challenging; therefore, many patients receive empiric antibiotic treatment.
Etiology
Among the etiologic agents of viral meningitis, the nonpolio enteroviruses (Echovirus 30, 11, 9, 6, 7, 18, 16, 71, 25; Coxsackie B2, A9, B1, B3, B4) are the most common, responsible for more than 85% of cases. Other viruses potentially responsible for meningitis include the herpes simplex virus (HSV), primarily type 2, and flavivirus (such as the Dengue virus).
Clinical presentation
The clinical presentation of bacterial meningitis is more severe than that of viral meningitis. The classic clinical triad of bacterial meningitis consists of fever, neck stiffness, and altered mental status. Only 41% of cases present with these three symptoms, however. Other clinical characteristics include severe headaches, decreased level of consciousness, nausea, vomiting, seizures, focal neurologic signs, and skin rash.
Viral meningitis is usually not associated with a decreased level of consciousness or significant decline in overall health status. The most frequently reported symptoms are unusual headaches, fever, nausea, vomiting, sensitivity to light, and neck stiffness. Patients may also present with skin changes and lymphadenopathy, and, depending on etiology, genital ulcers.
Diagnosis
The diagnosis of bacterial meningitis is based on clinical symptoms, blood panels (blood count, inflammation markers, cultures), and cerebrospinal fluid (CSF) cultures. Gram staining and latex agglutination may lead to false-negative results, and cultures may take a few days to provide a definitive result. Therefore, empiric antibiotic treatment is often started until the etiology can be determined.
A spinal tap must always be performed, preferably after a scan is taken, to rule out the risk of herniation. After CSF samples have been collected, they must undergo complete analysis, including cytological, biochemical, and microbiological evaluation, using conventional and molecular testing methods, when available.
Cytological and biochemical analyses of CSF may be helpful, as findings may indicate a higher probability of either bacterial or viral etiology.
CSF samples collected from patients with acute bacterial meningitis present characteristic neutrophilic pleocytosis (cell count usually ranging from hundreds to a few thousand, with >80% polymorphonuclear cells). In some cases of L. monocytogenes meningitis (from 25% to 30%), a lymphocytic predominance may occur. Normally, glucose is low (CSF glucose-to-blood-glucose ratio of ≤0.4 or <40 mg/dL), protein is very high (>200 mg/dL), and the CSF lactate level is high (≥31.53 mg/dL).
In viral meningitis, the white blood cell count is generally 10-300 cells/mm3. Although glucose levels are normal in most cases, they may be below normal limits in lymphocytic choriomeningitis virus (LCMV), HSV, mumps virus, and poliovirus meningitis. Protein levels tend to be slightly elevated, but they may still be within the reference range.
A recent study investigated which of the cytological or biochemical markers best correlate with the definite etiologic diagnosis. This study, in which CSF samples were collected and analyzed from 2013 to 2017, considered cases of bacterial or viral meningitis confirmed via microbiological evaluation or polymerase chain reaction (PCR). CSF lactate was the best single CSF parameter, and CSF lactate above 30 mg/dL virtually excludes the possibility of a viral etiology.
Etiologic determination
Despite the major contribution of globally analyzing CSF and secondary parameters, particularly CSF lactate, the precise etiologic definition is of great importance in cases of acute meningitis. Such precise definition is not simple, as identification of the causative microorganism is often difficult. Moreover, there are limits to conventional microbiological methods. Bacterioscopy is poorly sensitive, and although bacterial cultures are more sensitive, they can delay diagnosis because of the time it takes for the bacteria to grow in culture media.
Targeted molecular detection methods are usually more sensitive than conventional microbiological methods. Panel-based molecular tests identify multiple pathogens in a single test. In 2015, the U.S. Food and Drug Administration authorized the first commercial multiplex detection system for infectious causes of community-acquired meningitis and encephalitis. This test, the BioFire FilmArray system, detects 14 bacterial, viral, and fungal pathogens in a turnaround time of about 1 hour, including S. pneumoniae, N. meningitidis, H. influenzae, S. agalactiae (i.e., group B Streptococcus), E. coli (serotype K1), L. monocytogenes, HSV-1, HSV-2, varicella-zoster virus (VZV), cytomegalovirus (CMV), human herpesvirus 6 (HHV-6), human parechovirus (HPeV), and Cryptococcus neoformans/gattii.
A meta-analysis of eight precise diagnostic studies evaluating the BioFire FilmArray system showed a high sensitivity of 90% (95% confidence interval, 86%-93%) and specificity of 97% (95% CI, 94%-99%). The FilmArray ME panel can halve the time to microbiological result, allowing for earlier discontinuation of antimicrobial agents and hospital discharge in cases of viral meningitis.
Conclusion
Acute community-acquired meningitis is usually the result of viral or bacterial infections. Given the low specificity of clinical symptoms and, very often, of the general laboratory panel findings, many patients are empirically treated with antibiotics. High-sensitivity and -specificity molecular techniques allow for rapid identification of the bacterial etiology (which requires antibiotic therapy) or the viral etiology of meningitis. The latter can be managed only with symptom-specific medications and does not usually require extended hospitalization. Therefore, these new techniques can improve the quality of care for these patients with viral meningitis.
A version of this article first appeared on Medscape.com.
USPSTF final recommendation on aspirin for primary CV prevention
The U.S. Preventive Services Task Force has published a final recommendation statement on aspirin use to prevent cardiovascular disease.
For people aged 40-59 years, the USPSTF suggests that aspirin could be considered in those at increased risk of cardiovascular disease (10-year risk of 10% or greater) but that the decision should be individualized.
It notes that in the 40-59 age group, evidence indicates that the net benefit of aspirin use is small, and that persons who are not at increased risk for bleeding are more likely to benefit.
It adds that these recommendations apply only to people who do not have a history of cardiovascular disease and are not already taking daily aspirin.
The USPSTF statement was published online in the Journal of the American Medical Association. It is accompanied by an evidence review, a modeling study, a patient page, and an editorial.
A draft version of the recommendation statement, evidence review, and modeling report were previously available for public comment. The final recommendation statement is consistent with the draft version.
The task force concludes that there is adequate evidence that low-dose aspirin has a small benefit to reduce risk for cardiovascular events (nonfatal myocardial infarction and stroke) in adults 40 years or older who have no history of cardiovascular disease but are at increased cardiovascular risk.
Evidence shows that the absolute magnitude of benefit increases with increasing 10-year cardiovascular risk and that the magnitude of the lifetime benefits is greater when aspirin is initiated at a younger age.
But it adds that there is also adequate evidence that aspirin use in adults increases the risk for gastrointestinal bleeding, intracranial bleeding, and hemorrhagic stroke. The USPSTF determined that the magnitude of the harms is small overall but increases in older age groups, particularly in adults older than 60 years.
For patients who are eligible and choose to start taking aspirin, the benefits become smaller with advancing age, and data suggest that clinicians and patients should consider stopping aspirin use around age 75 years, the statement advises.
It also says that evidence is unclear whether aspirin use reduces the risk of colorectal cancer incidence or mortality.
USPSTF vice chair Michael Barry, MD, director of the Informed Medical Decisions Program in the Health Decision Sciences Center at Massachusetts General Hospital, Boston, told this news organization that these recommendations apply only to patients not taking aspirin already and who have no evidence of existing cardiovascular disease.
“In adults aged 60 or over we do not recommend starting aspirin for primary prevention. That is because in this age group the risk of bleeding outweighs the cardiovascular benefit,” he said.
“For adults aged 40-59 years with a greater than 10% predicted risk of cardiovascular disease, there appears to be a net benefit from taking aspirin, but this net benefit is relatively small and will vary with other factors such as magnitude of cardiovascular and bleeding risk. People should talk to their physician about these factors and whether to take aspirin or not,” he added.
Dr. Barry noted that these recommendations do not apply to people who are already taking aspirin for primary prevention. “These people need to talk to their physicians about whether they should continue. They need to review the reasons why they started aspirin in the first place, and they need to have their bleeding risk evaluated. Someone who has taken aspirin long term without any bleeding complications has a lower risk of future bleeding complications,” he said.
The task force recommends an aspirin dose of 81 mg daily for those people deciding to take aspirin for primary prevention.
“There is an abundance of evidence that less than 100 mg a day is enough. The lower the dose the lower the bleeding risk. So, the most convenient dose is the widely available 81-mg baby aspirin tablet,” Dr. Barry noted. “While enteric coated products are meant to reduce gastric irritation, the data do not show any difference in bleeding risk between various aspirin formulations,” he added.
Dr. Barry pointed out that aspirin is just one tool for reducing cardiovascular risk.
“People can reduce their risk significantly in many other ways including taking regular exercise, eating a healthy diet, controlling blood pressure and diabetes, and taking statins if they are at increased cardiovascular risk.”
He noted that recent trials have suggested that aspirin has only a marginal value over and above all these other factors. And the risk reduction with aspirin is smaller than with some other interventions.
“For example, aspirin is associated with a 12% reduction in MI whereas statins are associated with a 25%-30% reduction. Statins are a more powerful tool in reducing cardiovascular risk than aspirin, so perhaps people should consider taking statins first. The benefit of aspirin may be smaller in individuals already taking a statin, and clinicians need to think about the big picture,” Dr. Barry said.
He explained that physicians need to evaluate the cardiovascular and bleeding risk in each individual patient. “While there are widely available tools to estimate cardiovascular risk, there are no easy tools yet available to evaluate bleeding risk, so physicians need to consider clinical factors such as history of peptic ulcers.”
He suggests for the many people who have an average bleeding risk, then personal preference may come into play. “In the 40-59 age group, the benefits and harms of aspirin are pretty well-balanced. For the average person we think there may be a small net benefit, but this is small enough for personal preference to be considered as well.”
Pendulum swinging away from aspirin use
In an editorial accompanying publication of the task force statement in JAMA, Allan S. Brett, MD, clinical professor of internal medicine at the University of Colorado at Denver, Aurora, explains that the USPSTF recommendations on aspirin use for primary prevention of cardiovascular disease have changed numerous times over the past 30 years, with the last update in 2016 narrowing the eligible population.
In the new recommendation statement, “the pendulum has swung further away from aspirin prophylaxis for primary prevention: The guideline does not recommend routine preventive aspirin for anyone,” Dr. Brett notes.
He points out that an important development between the 2016 and current version was the publication in 2018 of three large placebo-controlled randomized clinical trials of primary prevention with aspirin – ARRIVE, ASPREE and ASCEND – which taken together “cast doubt about net benefit for aspirin prophylaxis in current practice.”
Asked how physicians should go about “individualizing” the decision on the use of aspirin in the 40-59 age group at increased cardiovascular risk, Dr. Brett suggests that some patents will have a general philosophy of medical care of “don’t prescribe medication for me unless there is strong evidence to support it,” while others may favor preventive interventions even in borderline cases.
But he notes that many patients have no strong general preferences and often ask a trusted clinician to decide for them. “For such patients, the best approach is for clinicians to be knowledgeable about the data on primary prevention with aspirin. Close reading of the new USPSTF guideline and its companion evidence review, and becoming familiar with the three more recent aspirin trials, is a good way to prepare for these clinical encounters,” he concludes.
A cardiologist’s view
Commenting on the task force statement for this news organization, Andrew Freeman, MD, a cardiologist at National Jewish Health, Denver, noted that cardiology societies are already making similar recommendations on aspirin use in primary prevention. “The American College of Cardiology prevention guidelines have been giving similar advice for a couple of years now. It takes a few years for professional societies to catch up with each other,” he said.
“Over the last few years, it has become obvious that the benefit of aspirin is not really very positive until a patient has had a cardiovascular event. In primary prevention, it doesn’t become beneficial unless they are at quite a high risk of having an event,” Dr. Freeman noted.
“In general, most cardiologists are now telling people that, despite what they may have been told in the past, they don’t need to be on aspirin unless they have had a cardiovascular event,” he added. “Our understanding has changed over the years and the weight of evidence has now become clear that the risk of bleeding is not insignificant.”
Dr. Freeman agreed with the shared decision-making advocated for patients in the 40-59 age group. “If a patient is particularly worried about a family history of heart disease, taking aspirin may make some sense, but for most people who have not had a cardiovascular event, the net benefit is very low and gets lower with age as the bleeding risk increases,” he said.
The USPSTF is an independent, voluntary body. The U.S. Congress mandates that the Agency for Healthcare Research and Quality support the operations of the USPSTF.
A version of this article first appeared on Medscape.com.
FROM JAMA
Shortage of ICU beds did not drive COVID-19 deaths
Contrary to popular belief, no association appeared between the number of intensive care unit beds and COVID-19 deaths, based on a review of data from all 50 states between March 1, 2020, and June 30, 2021.
One of the reasons for poor patient outcomes in the early months of the COVID-19 pandemic was the presumed scarcity of ICU beds, Omar Haider, MD, of Houston Methodist Hospital, and colleagues said. “We hypothesized that the states having a lower number of ICU beds had more COVID-related deaths when compared to the states that had a higher number of ICU beds,” they wrote in an abstract presented at the Critical Care Congress sponsored by the Society of Critical Care Medicine.
According to the researchers, the total number of ICU beds in the United States is approximately 85,000. Hawaii has the highest number of beds per 10,000 persons, and the District of Columbia has the lowest (6.0 vs. 1.6).
The researchers collected data on ICU bed totals from the Kaiser Family Foundation. Statistics on COVID-19 deaths were obtained from The New York Times database, which provided real-time information collected from the Department of Health & Human Services, the Centers for Disease Control and Prevention, and the Census Bureau.
The researchers used the Pearson Correlation Coefficient to compare ICU beds and COVID deaths per 10,000 persons in each state. The R value was 0.29, which indicates no inverse correlation. “Our value of R2, the coefficient of determination, was 0.0858,” they added. They confirmed the results using the Spearman’s Rho, which yielded an rs of 0.3, also a sign of no inverse correlation. No correlation was found between low numbers of ICU beds and high numbers of COVID-19 deaths for any states.
The study findings were limited by several factors, including the lack of standardized reporting timelines across states, differences in state-based vaccination rates, the emergence of the Delta variant during the study period, and time-lag in contemporaneous database updates, the researchers noted.
However, the results suggest that physical ICU beds do not play a role in determining the number of COVID-related deaths. Instead, “other constraints such as less staffing, lack of medical supplies (ventilators and [personal protective equipment]) should be evaluated for potential implications on poor patients’ outcomes,” they concluded.
Pandemic challenges can inform future plans
“As the health care system emerges from the effects of the pandemic, it is important to understand the factors that contributed to adverse outcomes to better prepare for future challenges and improve the delivery of care,” Suman Pal, MBBS, of the University of New Mexico, Albuquerque, said in an interview.
“The findings are not surprising considering what is known about the multitude of factors that determine outcomes for our patients from medical comorbidities, and social determinants of health to upstream structural factors such as systemic inequities and generational trauma,” said Dr. Pal, who was not involved with the study. “Thus, a simple correlation of the number of ICU beds to COVID-19 outcomes is not likely to capture the interplay of all these factors.”
The challenges of the pandemic offer insights to inform future planning, said Dr. Pal.
“In my opinion, a key factor to understand and address would be employee wellness for health care workers,” he said. “The problem of burnout leading to health care workers leaving the workforce has exacerbated the already acute shortages in personnel in recent years.
“In the long term, it may be prudent to reconsider the approach to health by increasing support for preventative and primary care, addressing social factors such as education, nutrition, and housing, to mitigate preventable aspects of diseases.”
Further research is needed to examine the multitude of factors associated with the pandemic, and their interplay, said Dr. Pal. The goals of such research “would be needed to develop a deeper understanding of the factors that contributed to mortality in COVID-19 and the disparities with this across different subpopulations.”
The study received no outside funding. The researchers and Dr. Pal disclosed no relevant financial relationships.
A version of this article first appeared on Medscape.com.
Children and COVID: Weekly cases rise again, but more slowly
New cases of COVID-19 in U.S. children went up for a second consecutive week, but the pace of increase slowed considerably, based on a report from the American Academy of Pediatrics and the Children’s Hospital Association.
The previous week’s count – about 33,000 new COVID cases for April 8-14 – was almost 30% higher than the week before and marked the first rise in incidence after 11 straight weeks of declines, the AAP and CHA said in their weekly COVID-19 report, which is based on data from state and territorial health departments.
The cumulative number of child COVID-19 cases since the start of the pandemic is now over 12.9 million, with children representing 19.0% of cases among all ages. The Centers for Disease Control and Prevention, which uses a different age range for children (0-17 years) than many states, reports corresponding figures of 12.4 million and 17.6%, along with 1,501 deaths.
ED visits show a similar rising trend over recent weeks, as the 7-day average of ED visits with confirmed COVID has crept up from 0.5% in late March/early April to 0.8% on April 22 for children aged 0-11 years, from 0.3% for 0.5% for those aged 12-15, and from 0.3% to 0.6% for 16- and 17-year-olds, based on CDC data.
The daily rate for new admissions for children with confirmed COVID has also moved up slightly, rising from 0.13 per 100,000 population as late as April 13 to 0.15 per 100,000 on April 23. For the number of actual admissions, the latest 7-day (April 17-23) average was 107 in children aged 0-17, compared with 102 for the week of April 10-16, the CDC reported.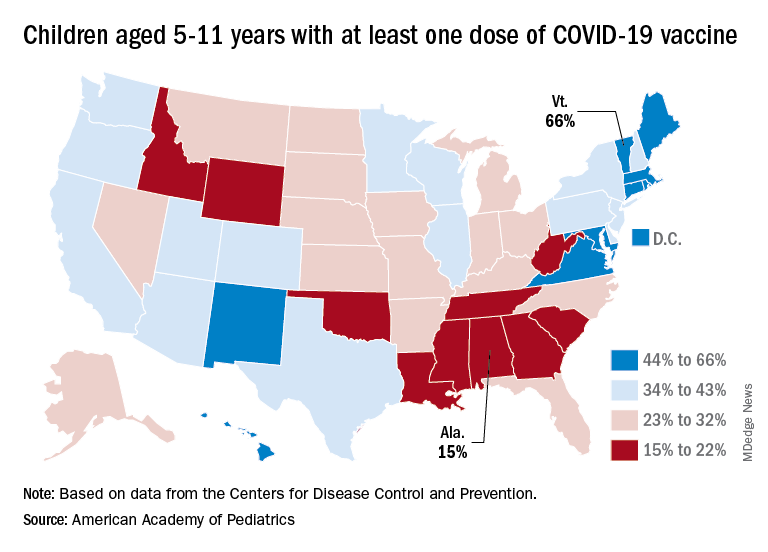
Uptake of the COVID vaccine, however, continued to slide since spiking in January. Initial vaccinations for the latest available week (April 14-20) were down to 48,000 from 59,000 the week before in children aged 5-11 years and 35,000 (vs. 47,000) for those aged 12-17. The weekly highs hit 500,000 and 331,000, respectively, during the Omicron surge, the AAP reported based on CDC data.
Among children aged 5-11, the CDC said that 35.0% had received at least one dose of COVID vaccine as of April 25 and that 28.3% are fully vaccinated, with corresponding figures of 68.8% and 58.8% for 12- to 17-year-olds on April 25.
Among the states, the highest vaccination rates generally are found in New England and the lowest in the Southeast. In Alabama, just 15% of children aged 5-11 have received an initial dose of the vaccine, compared with 66% in Vermont, while Wyoming is the lowest (41%) for children aged 12-17 and Massachusetts is the highest (96%), the AAP said in a separate report.